questionnaires - disi, university of...
TRANSCRIPT
Questionnaires
Unit 7
2
Learning outcomes • Understand when/how to use questionnaires in interaction design
– Surveys – Satisfaction questionnaires (post use)
• Learn how to prepare them – Different types of scales – Questions wording
• Learn about the most common types of questionnaire used in user research
– Usabilty – User research
Questionnaires
• Predefined set of questions in a predetermined order
• Provide data that can be analysed to identify patterns and relationships within the answers
• Questionnaires may be: – Self-Administrated (the respondent answer on their
own) – Administrated by the researcher
3
Questionnaire
• Qualitative vs. quantitative data; self-report – opinions, beliefs, attitudes, behaviour – bias -> social desirability often there is an
expectation that one answer is preferred
questionnaire_score = true_score + error
• only as good as the questions asked
4
Source of Errors
• Systematic (bad design of the questionnaire)
• Random (this is not a problem in large sample)
• Use different items and techniques to address the same concept (average)
• Triangulation
5
Psychometric characteristics • Reliability (reproducibility factor):
– test-retest reliability: stability over time – internal reliability: stability over items
• Effective range in the scale (sensibility): – scale must be chosen according to variable
peculiarities. • Validity:
– measures must reflect what it is investigated.
6
Surveys
– Systematic extraction of data from and about a population of people (or events) in a standardised & systematic manner
– The extraction of patterns from the responses from a sample enables statements and inferences about the whole population
– Sampling issues (random sample is often the best choice, but at times unfeasible)
– Requirements elicitation / adoption studies
7
Sampling • Random Sampling
– People selected at random from a population: All NHS patients, NHS Patient within a Primary Care Trust
• Systematic Sampling – People/events at regular intervals from random sample: NHS
hypertensive patients remotely tele-monitored at regular intervals when presenting themselves at hospital
• Stratified Sampling – Choosing People/events that map stratifications in the whole population – Matching patients from various socioeconomic classes with diabetes
remotely monitored on line, via phone. • Snow-ball sampling
– Self-selected sample: Patients with hypertension forwarding the survey to acquaintances with similar characteristics
8
Snow-ball sample • Self-selected sample • Shopping Web Sites • Chat Sites • Personal Sites • Fan Sites • Such sites are selected on the basis of
convenience rather than for any in depth investigation
9
10
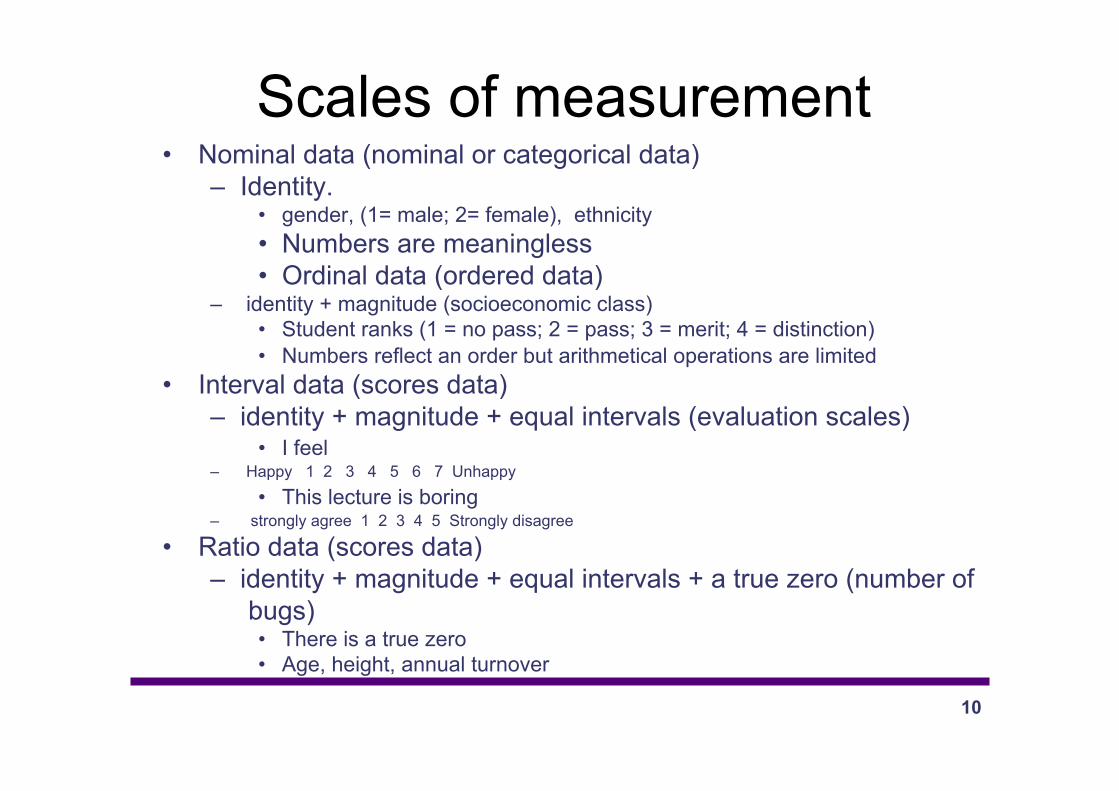
Scales of measurement • Nominal data (nominal or categorical data)
– Identity. • gender, (1= male; 2= female), ethnicity • Numbers are meaningless • Ordinal data (ordered data)
– identity + magnitude (socioeconomic class) • Student ranks (1 = no pass; 2 = pass; 3 = merit; 4 = distinction) • Numbers reflect an order but arithmetical operations are limited
• Interval data (scores data) – identity + magnitude + equal intervals (evaluation scales)
• I feel – Happy 1 2 3 4 5 6 7 Unhappy
• This lecture is boring – strongly agree 1 2 3 4 5 Strongly disagree
• Ratio data (scores data) – identity + magnitude + equal intervals + a true zero (number of
bugs) • There is a true zero • Age, height, annual turnover
Questionnaire design • Questionnaires must be properly designed
to elicit the answers you want from the respondent
• Answers should be valid and meet the researchers’ need
• Each question has to effectively elicit an answer that contributes to addressing the overall research question
11
12
Questionnaire design • Iterative approach
– Establish the purpose of the questionnaire • what information is sought? how would you analyze the results?
what would you do with your analysis? • determine the audience you want to reach • determine how would you will deliver the questionnaire
– Define thematic areas • IT experience, attitudes toward technology, user satisfaction
– Compose and pilot the items • wording issues, response biases • select scales (precision; effort needed to decide on a response) • do not ask questions whose answers you will not use!
– Write instructions – Pilot
Pilot
• How long did it take to complete? • Were the instructions clear? • Were any questions ambiguous? • Were any questions objectionable? • Was the layout clear and easy to follow? • Were any topics omitted?
13
Questions
• Brief: ideally 20 words or less, providing the question is still understandable
• Relevant: – each question should be relevant to the
overall questionnaire and its purpose – each word within the question must be
relevant to the overall (research) question you want to ask
14
Questions (2)
• Avoid ‘and’ questions – The web-site is interesting and appealing – The web site is interesting – The web site is appealing
• Avoid ‘negative’ questions – The web site design is not appealing – The web site design is ugly
15
Practical guidelines • Don’t use jargon or abbreviations • Keep questions simple and as short as possible • Don’t use vague terms: be precise. • Avoid ‘loaded’ or ‘leading’ questions that hint at the
answer you want to hear • Avoid “AND” questions: asking more than one question • Avoid ‘double-negative’ questions • Use common concepts • Take care over questions that involve memory/recall
16
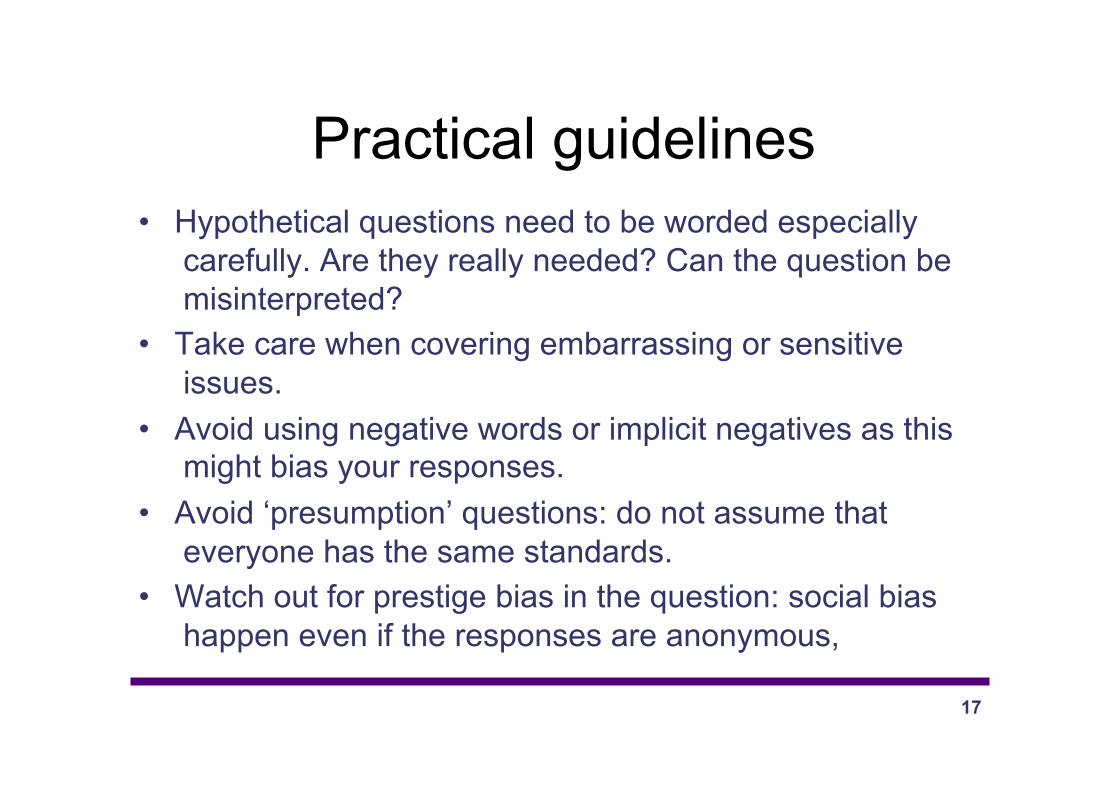
Practical guidelines • Hypothetical questions need to be worded especially
carefully. Are they really needed? Can the question be misinterpreted?
• Take care when covering embarrassing or sensitive issues.
• Avoid using negative words or implicit negatives as this might bias your responses.
• Avoid ‘presumption’ questions: do not assume that everyone has the same standards.
• Watch out for prestige bias in the question: social bias happen even if the responses are anonymous,
17
Styles of Questions
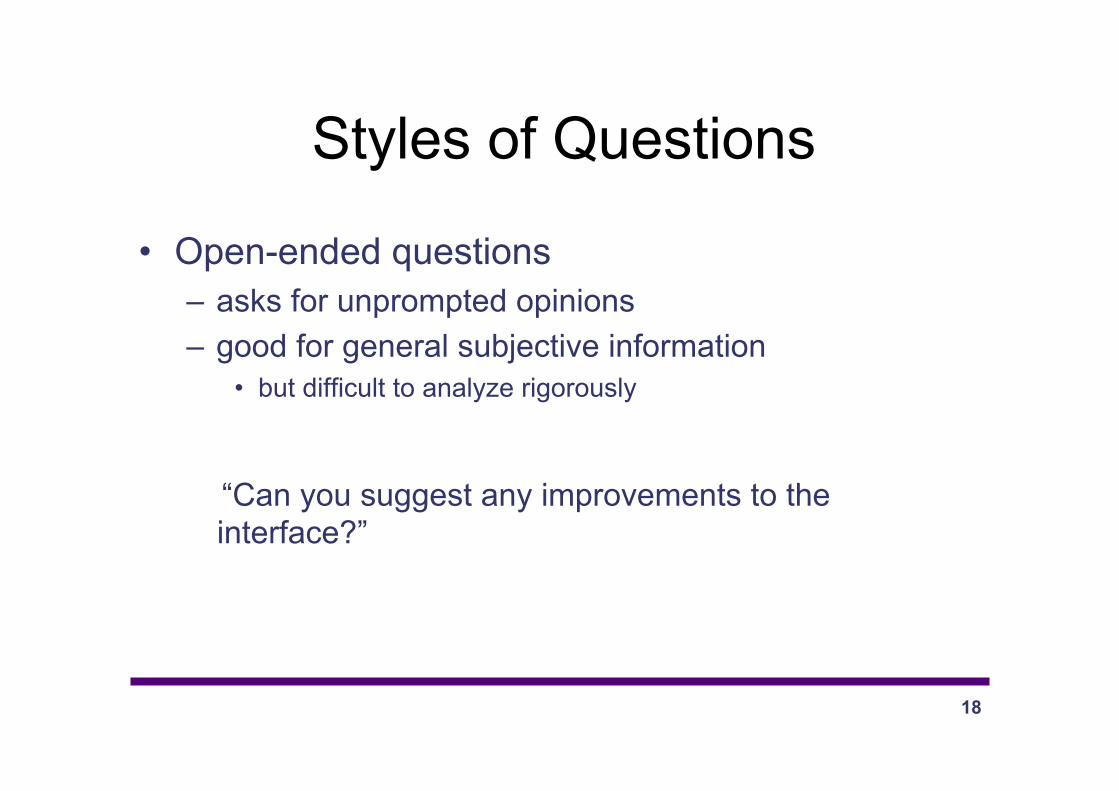
• Open-ended questions – asks for unprompted opinions – good for general subjective information
• but difficult to analyze rigorously
“Can you suggest any improvements to the interface?”
18
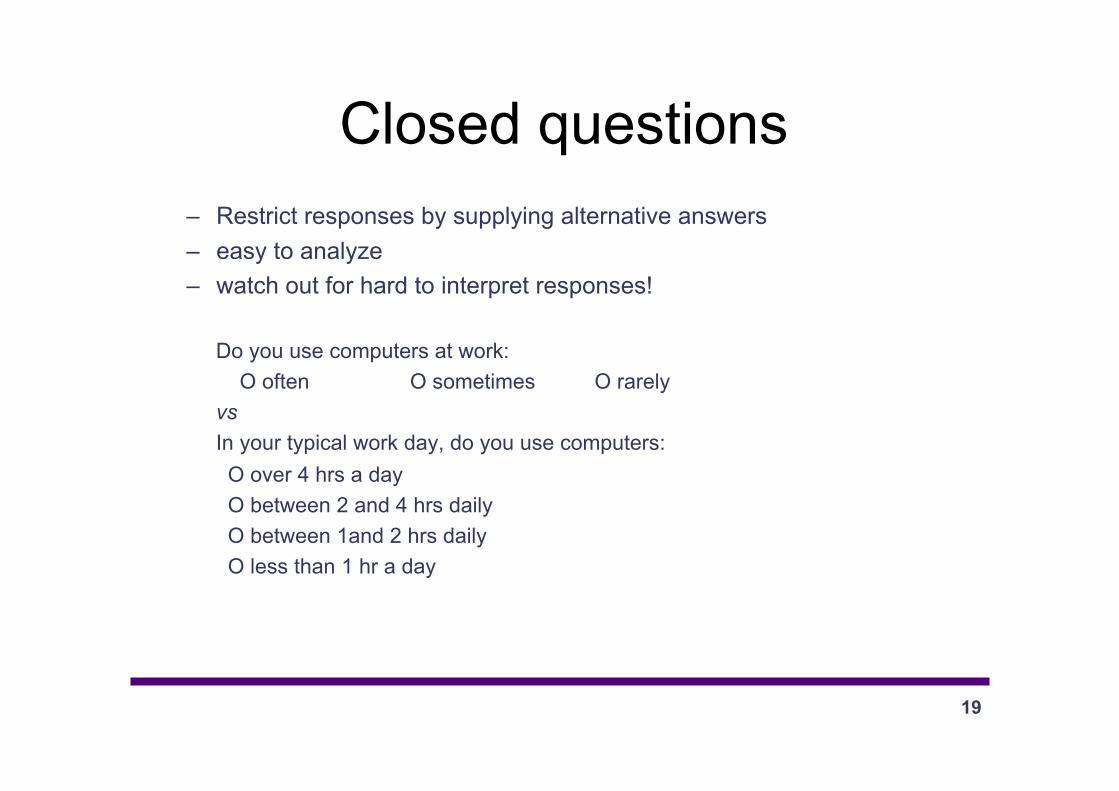
Closed questions – Restrict responses by supplying alternative answers – easy to analyze – watch out for hard to interpret responses!
Do you use computers at work: O often O sometimes O rarely vs In your typical work day, do you use computers: O over 4 hrs a day O between 2 and 4 hrs daily O between 1and 2 hrs daily O less than 1 hr a day
19
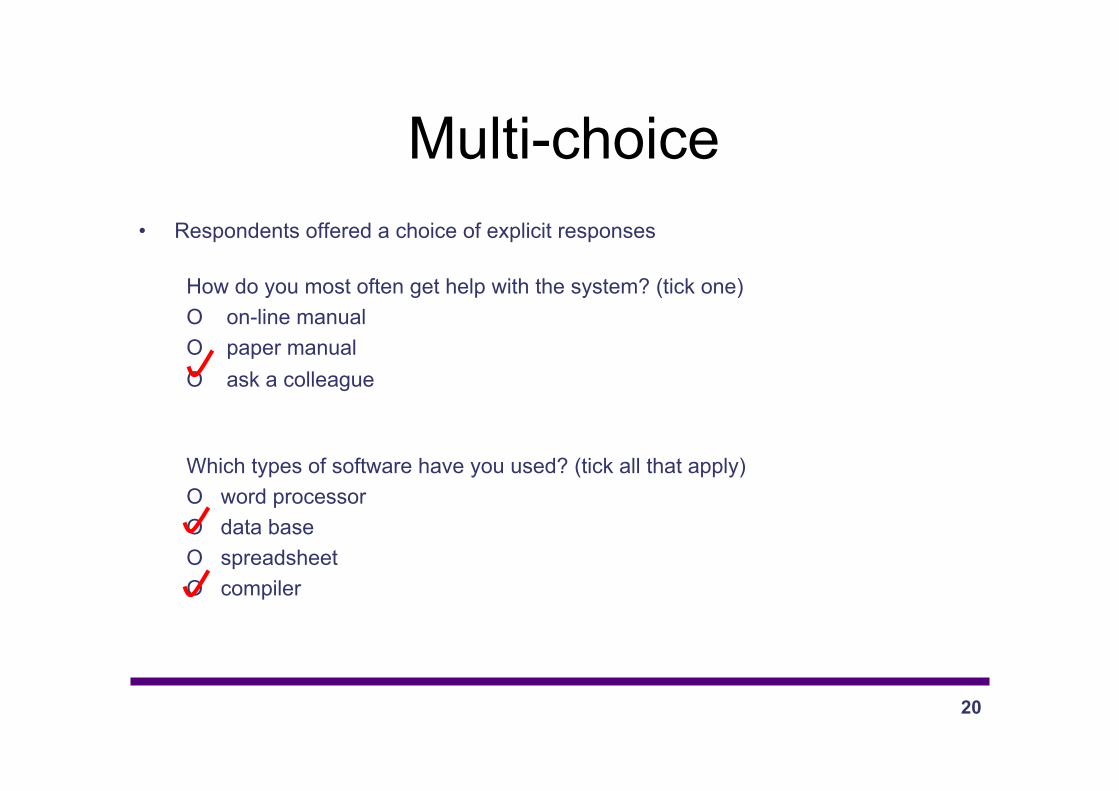
Multi-choice • Respondents offered a choice of explicit responses
How do you most often get help with the system? (tick one) O on-line manual O paper manual O ask a colleague
Which types of software have you used? (tick all that apply) O word processor O data base O spreadsheet O compiler
20
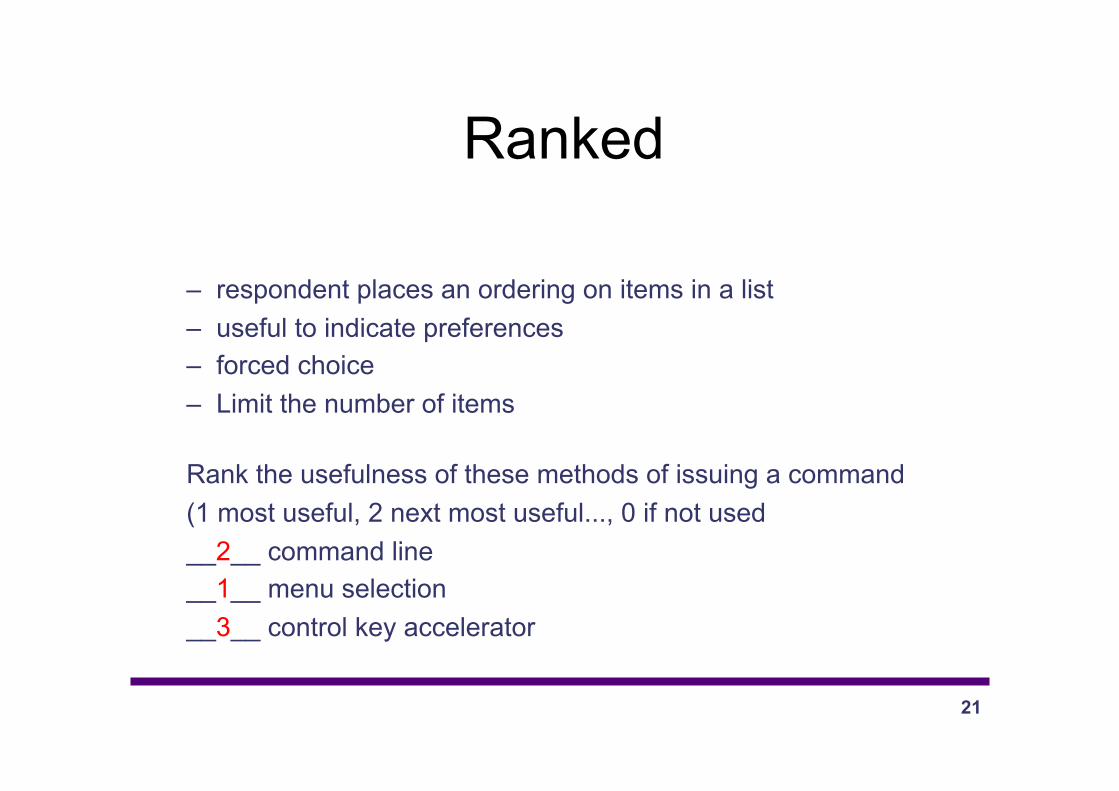
Ranked
– respondent places an ordering on items in a list – useful to indicate preferences – forced choice – Limit the number of items
Rank the usefulness of these methods of issuing a command (1 most useful, 2 next most useful..., 0 if not used __2__ command line __1__ menu selection __3__ control key accelerator
21
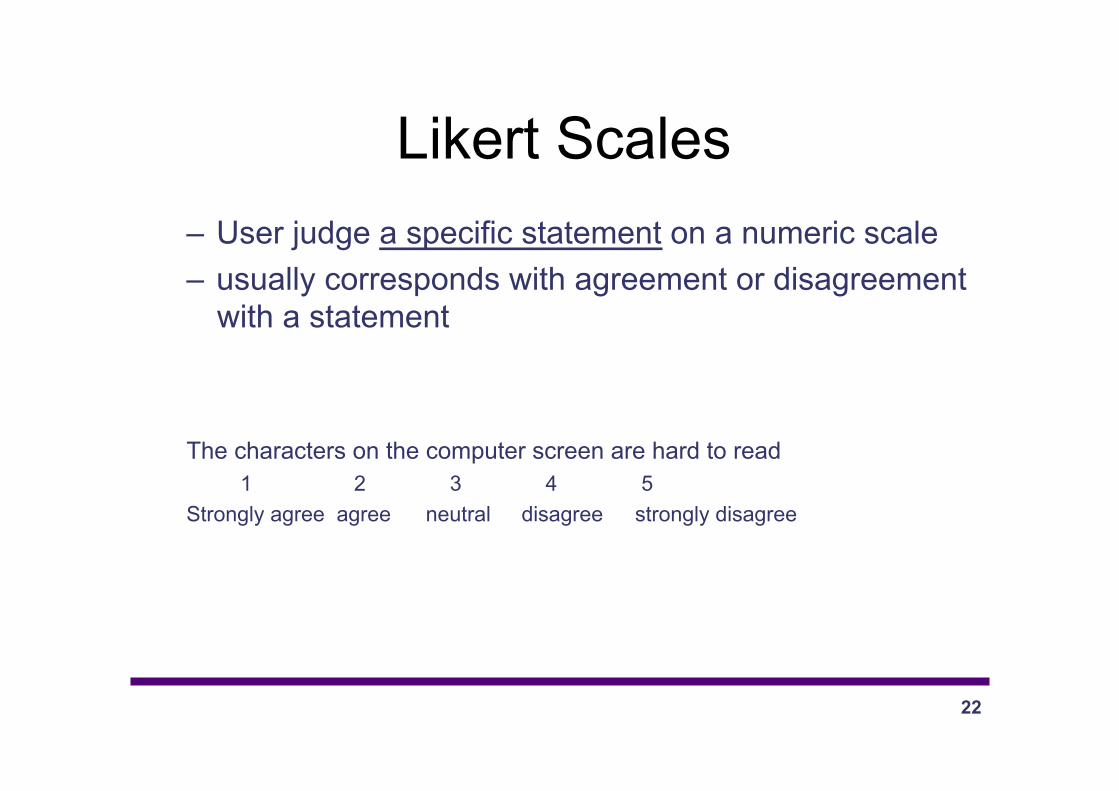
Likert Scales – User judge a specific statement on a numeric scale – usually corresponds with agreement or disagreement
with a statement
The characters on the computer screen are hard to read 1 2 3 4 5
Strongly agree agree neutral disagree strongly disagree
22
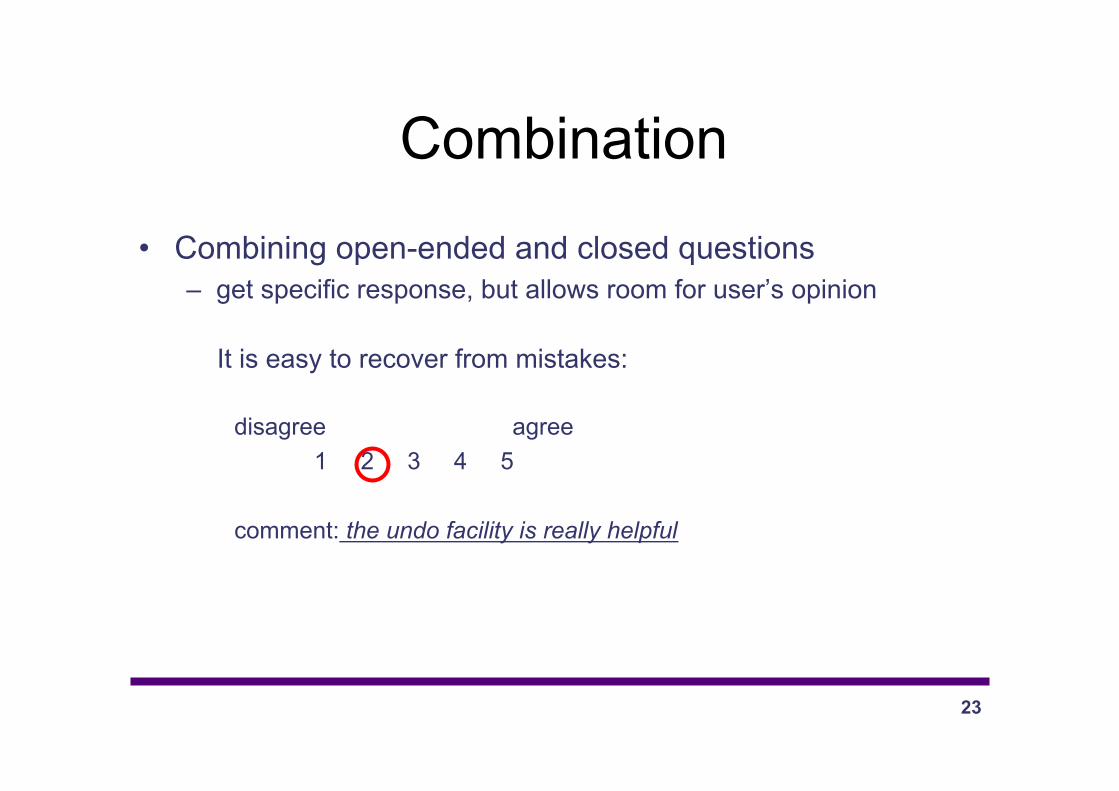
Combination
• Combining open-ended and closed questions – get specific response, but allows room for user’s opinion
It is easy to recover from mistakes:
disagree agree 1 2 3 4 5
comment: the undo facility is really helpful
23
24
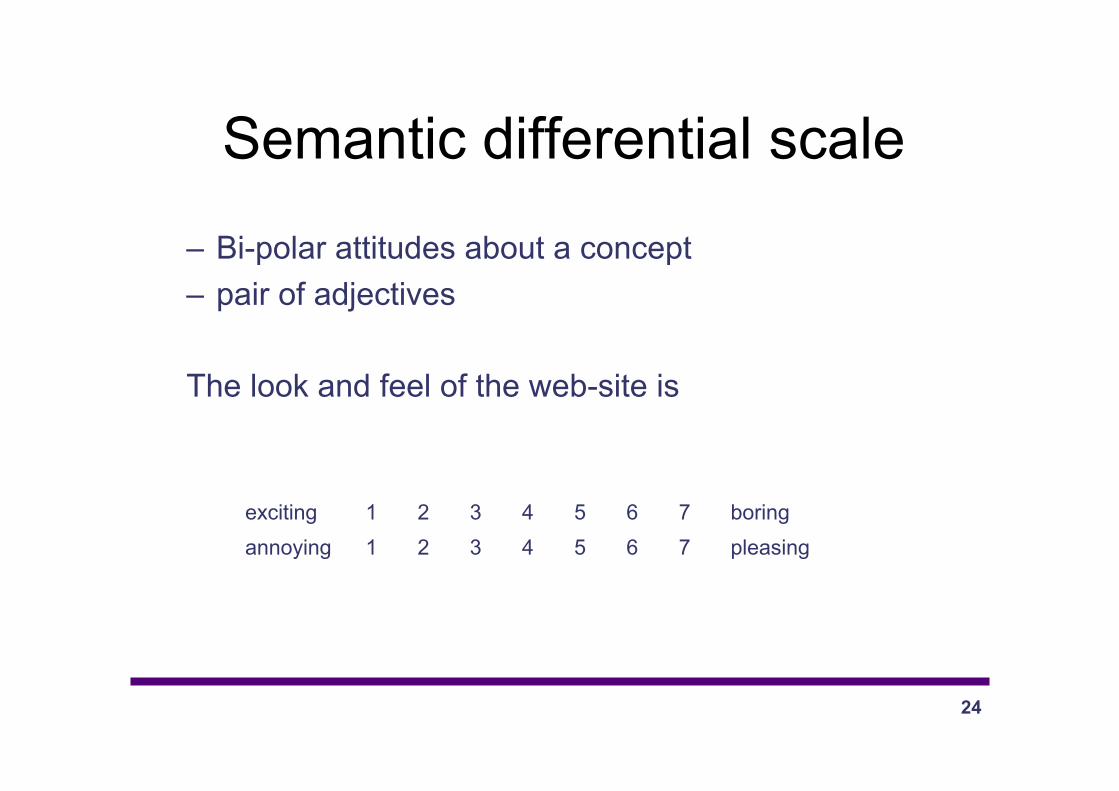
Semantic differential scale
– Bi-polar attitudes about a concept – pair of adjectives
The look and feel of the web-site is
exciting 1 2 3 4 5 6 7 boring annoying 1 2 3 4 5 6 7 pleasing
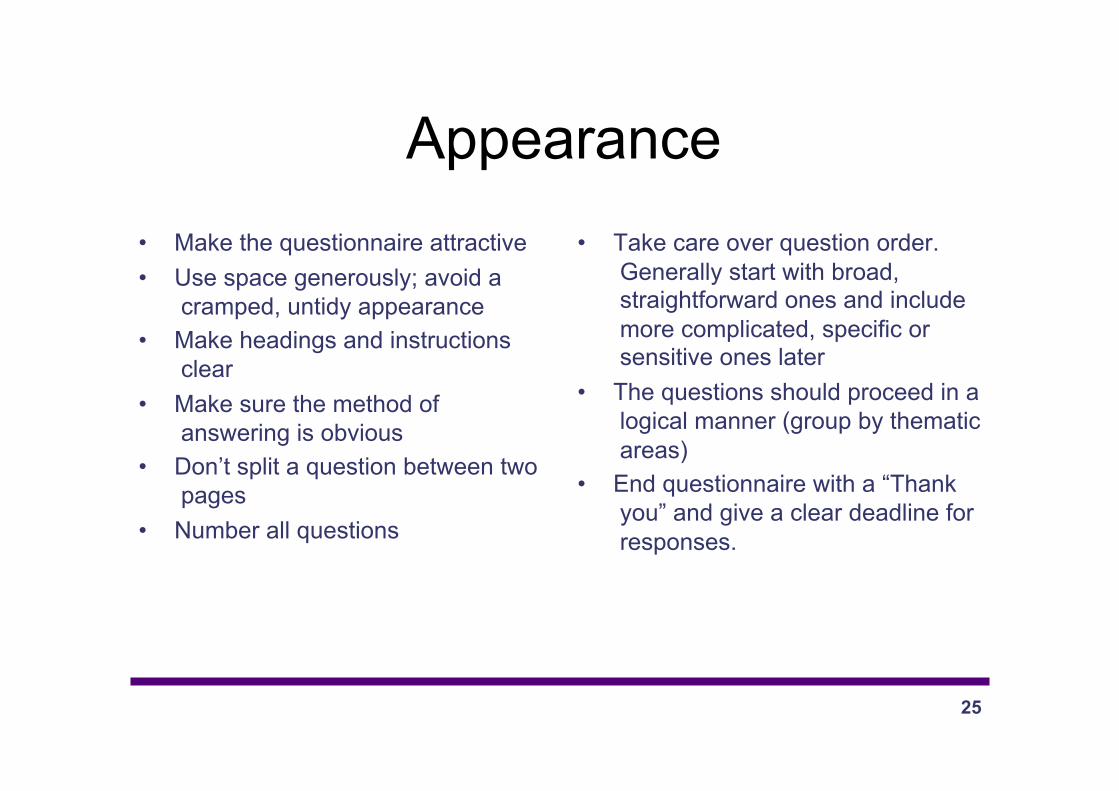
Appearance • Make the questionnaire attractive • Use space generously; avoid a
cramped, untidy appearance • Make headings and instructions
clear • Make sure the method of
answering is obvious • Don’t split a question between two
pages • Number all questions
• Take care over question order. Generally start with broad, straightforward ones and include more complicated, specific or sensitive ones later
• The questions should proceed in a logical manner (group by thematic areas)
• End questionnaire with a “Thank you” and give a clear deadline for responses.
25
Usability Questionnaire
SUS – System Usability Scale
• 10-item Likert-scale: overview of satisfaction with software
• Developed by John Brooke • Freely available for use providing
acknowledgement is made of the source.
26
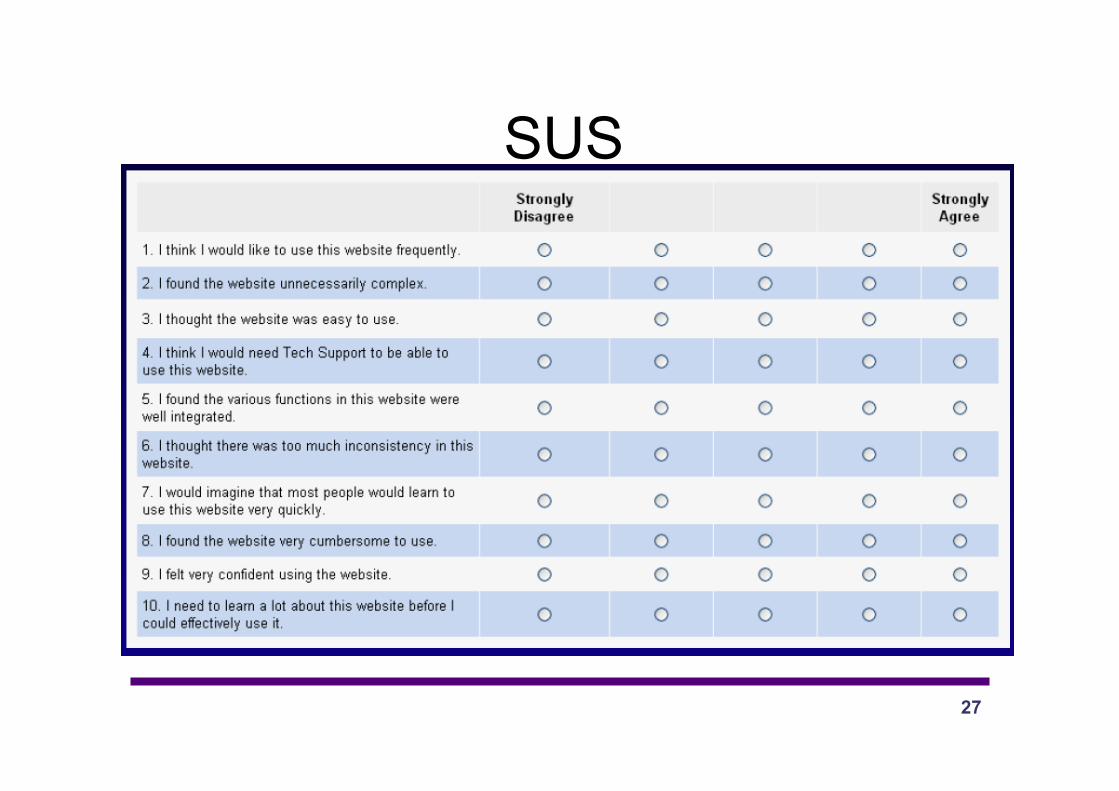
SUS
27
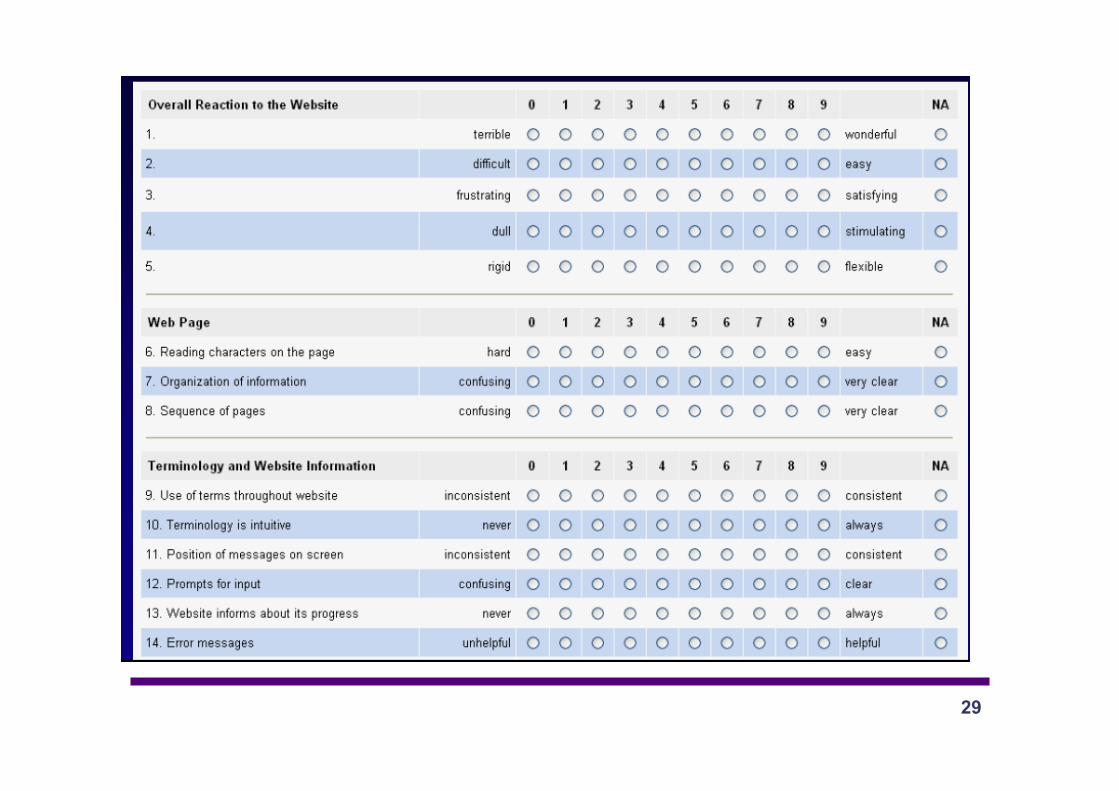
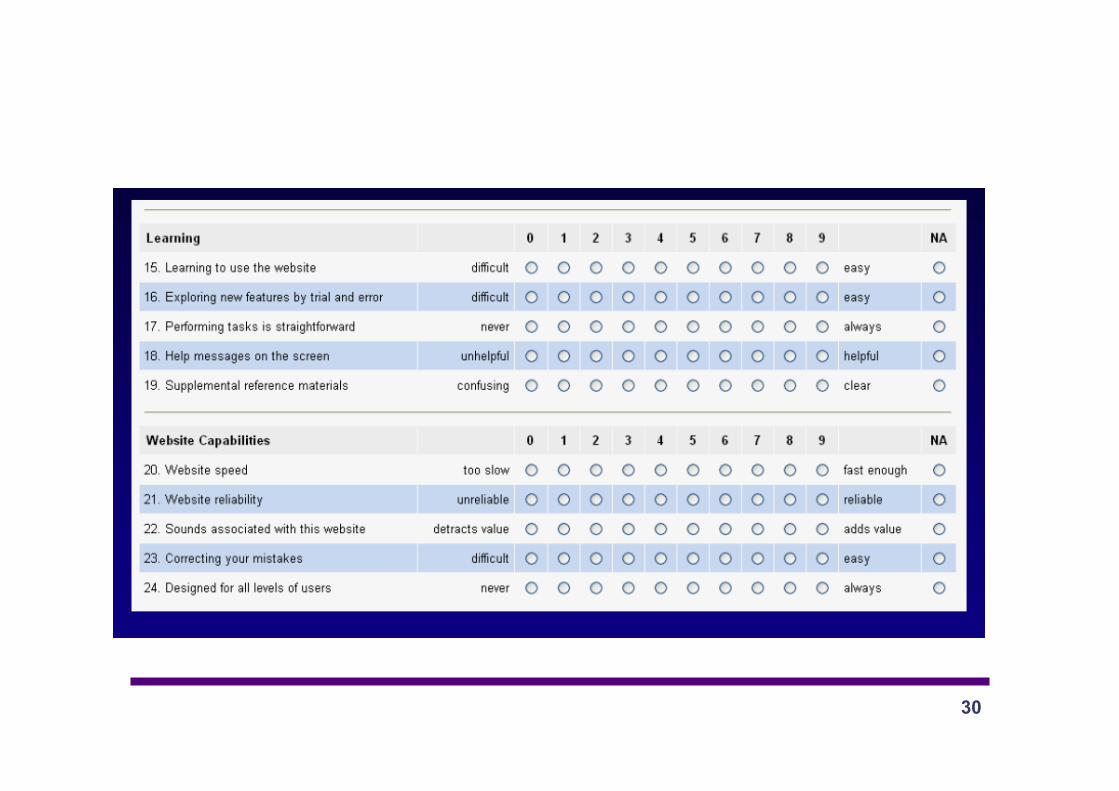
QUIS • Questionnaire for User Interaction
Satisfaction – Measures attitude towards different interface
factors (screen factors, terminology and system feedback, learning factors, system capabilities, technical manuals, on-line tutorials, multimedia, voice recognition, virtual environments, internet access, and software installation)
– http://www.cs.umd.edu/hcil/quis/ 28
29
30
Italian version
Stefano FEDERICI, Simone BORSCI, Fabio MELONI
Le misure dell’usabilità: Studio sulle caratteristiche psicometriche del QUIS e del SUMI nella versione italiana
Giornale di Psicologia (2009), Volume 3, Numero 2 (Giugno)
31
PVA
• Perceived Visual Aesthetic scale Lavie and Trackitnsky
• Two dimension of aesthetics – Classical Aesthetics – Expressive Aesthetics
32
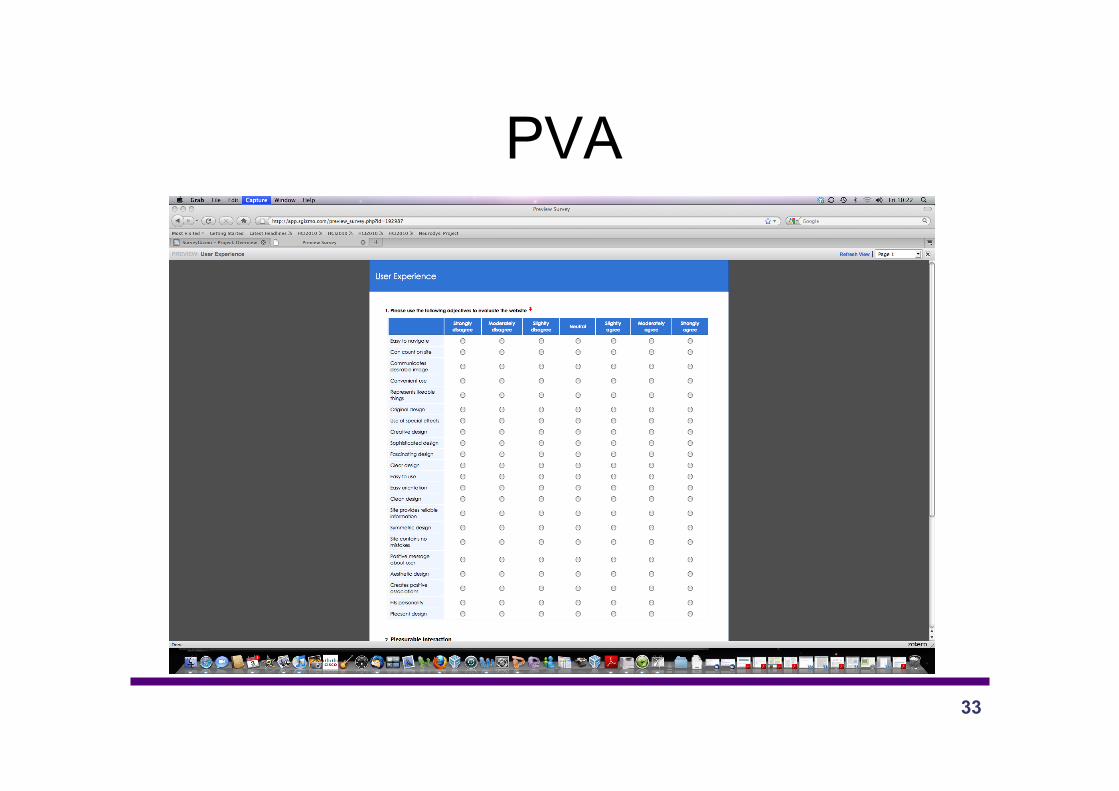
PVA
33
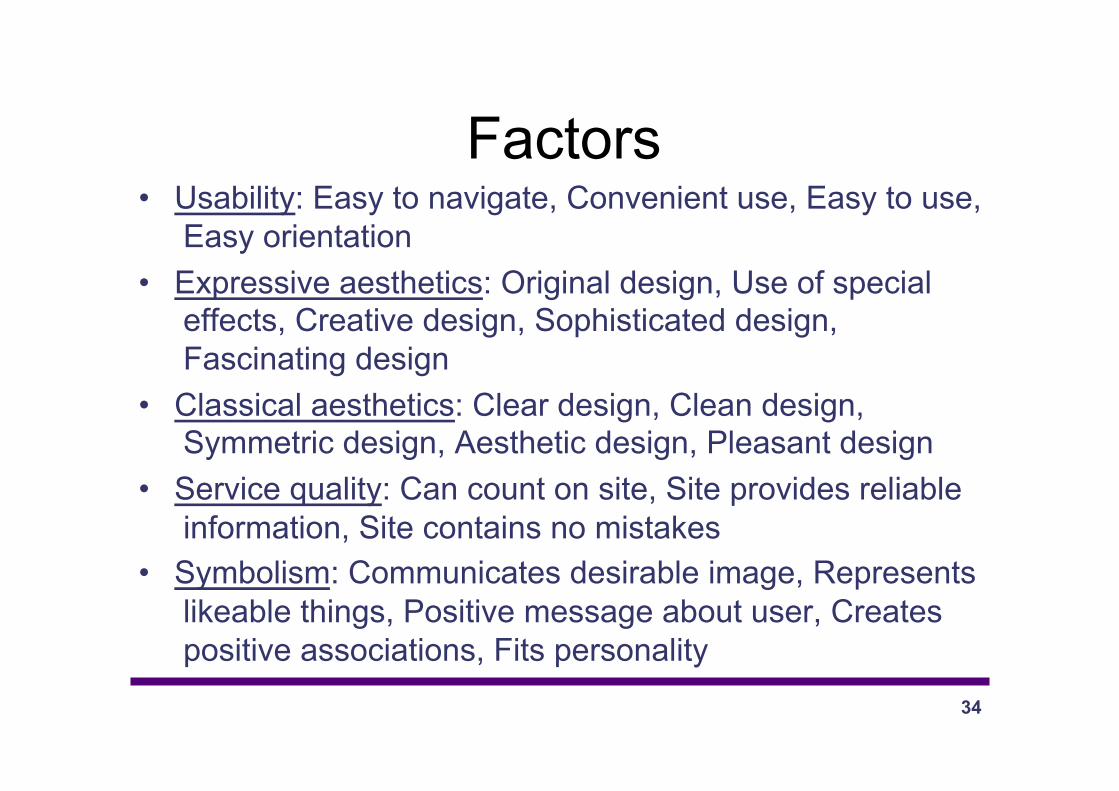
Factors • Usability: Easy to navigate, Convenient use, Easy to use,
Easy orientation • Expressive aesthetics: Original design, Use of special
effects, Creative design, Sophisticated design, Fascinating design
• Classical aesthetics: Clear design, Clean design, Symmetric design, Aesthetic design, Pleasant design
• Service quality: Can count on site, Site provides reliable information, Site contains no mistakes
• Symbolism: Communicates desirable image, Represents likeable things, Positive message about user, Creates positive associations, Fits personality
34
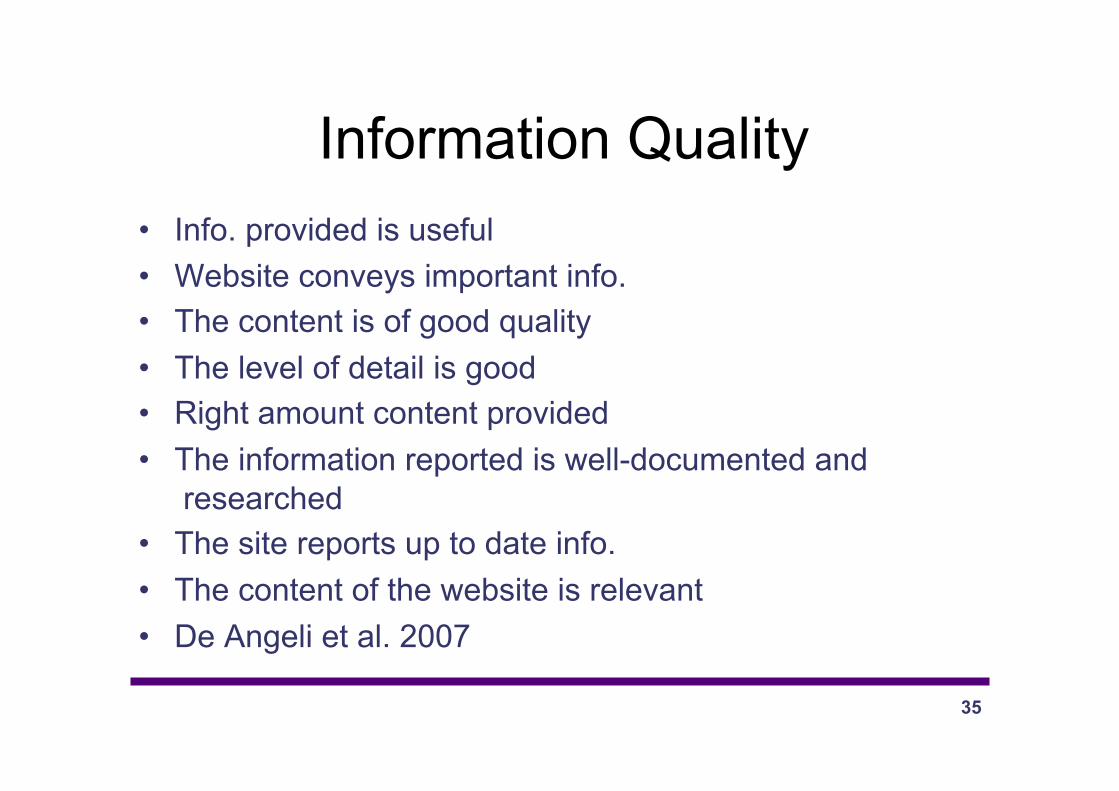
Information Quality • Info. provided is useful • Website conveys important info. • The content is of good quality • The level of detail is good • Right amount content provided • The information reported is well-documented and
researched • The site reports up to date info. • The content of the website is relevant • De Angeli et al. 2007
35
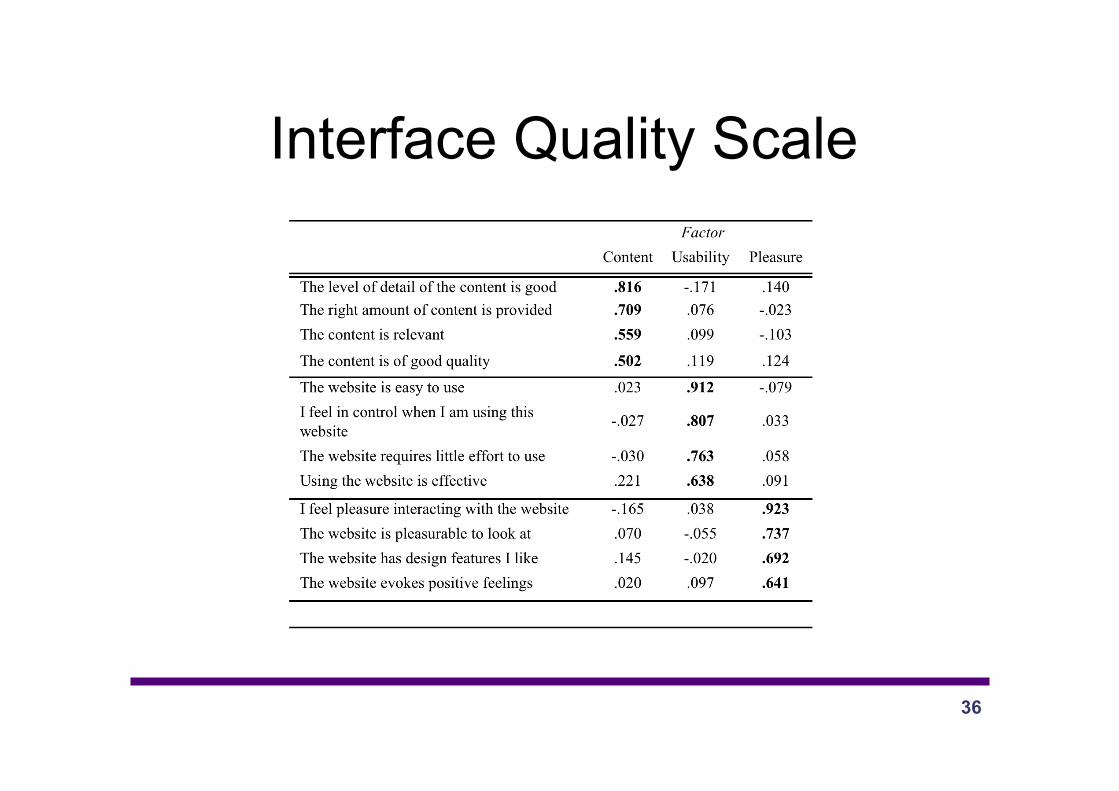
Interface Quality Scale
36
Desirability Tool Kit
• Developed by Microsoft • Example of use and tools • http://www.userfocus.co.uk/articles
/satisfaction.html
37
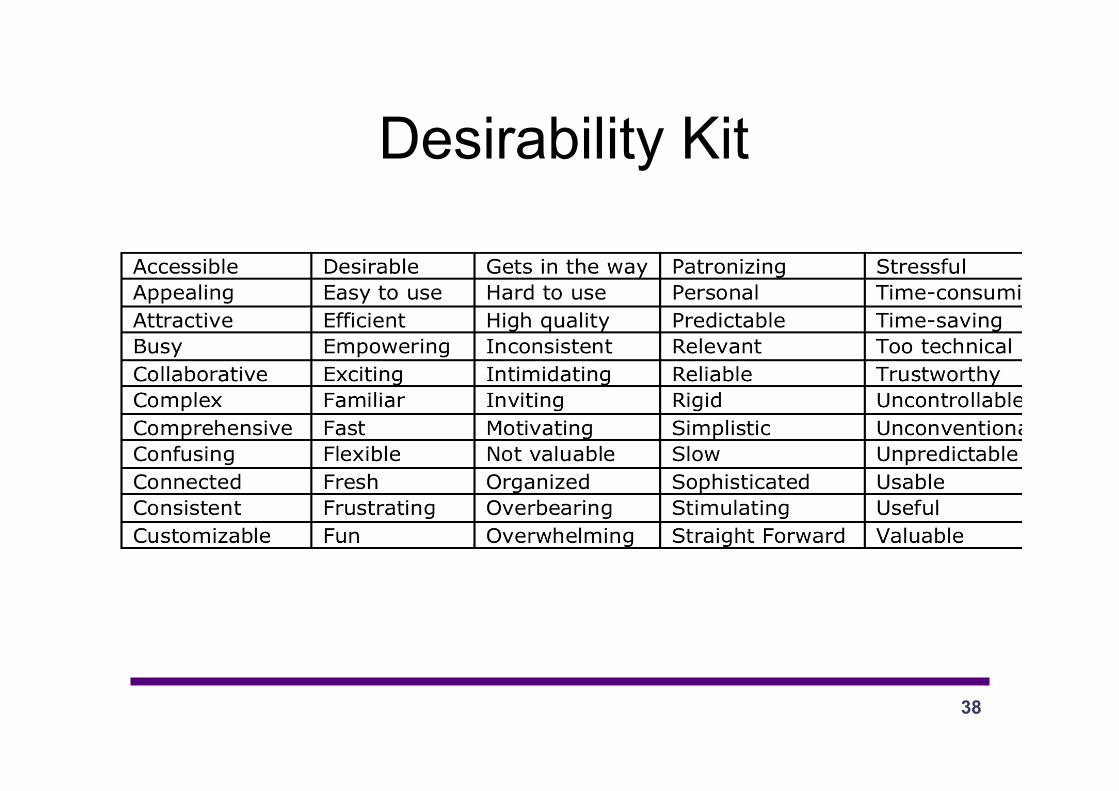
Desirability Kit
38
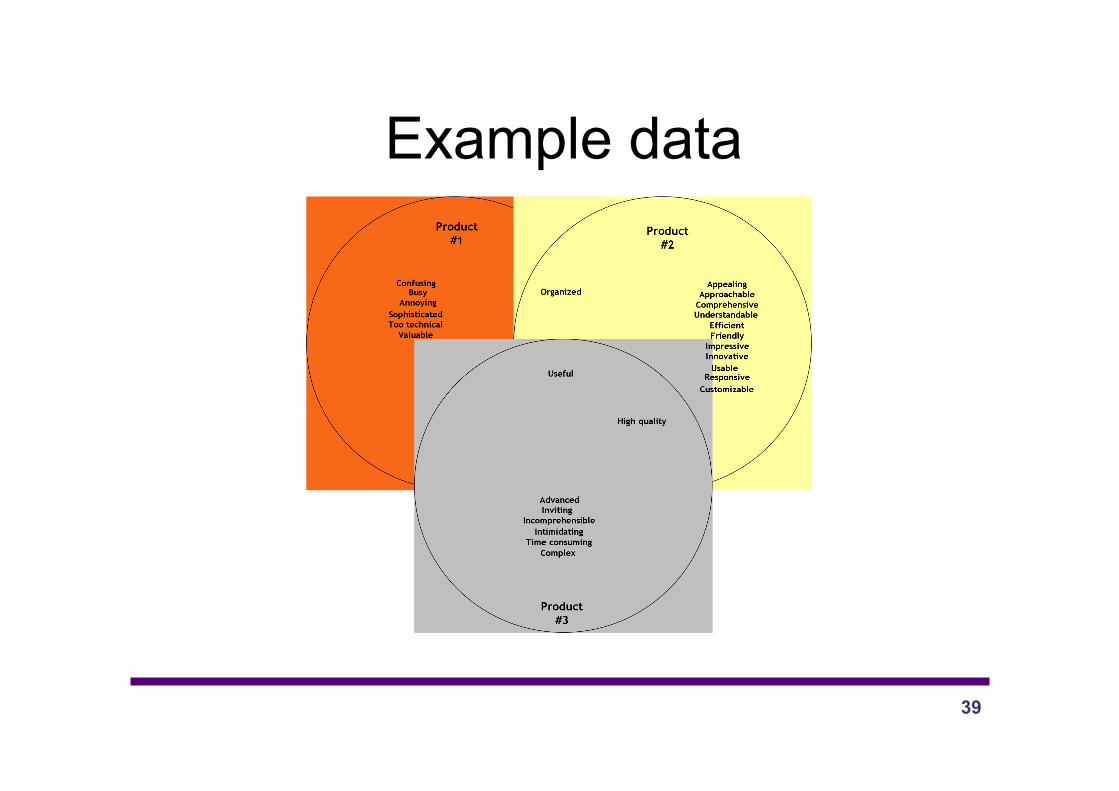
Example data
39
PrEmo • Emotional responses elicited are difficult
to measure because – their nature is subtle (low intensity) – they are often mixed (more than one
emotional response at the same time) • Instead of words, use animated cartoon
characters • Evaluation does not become a rational
process •
40
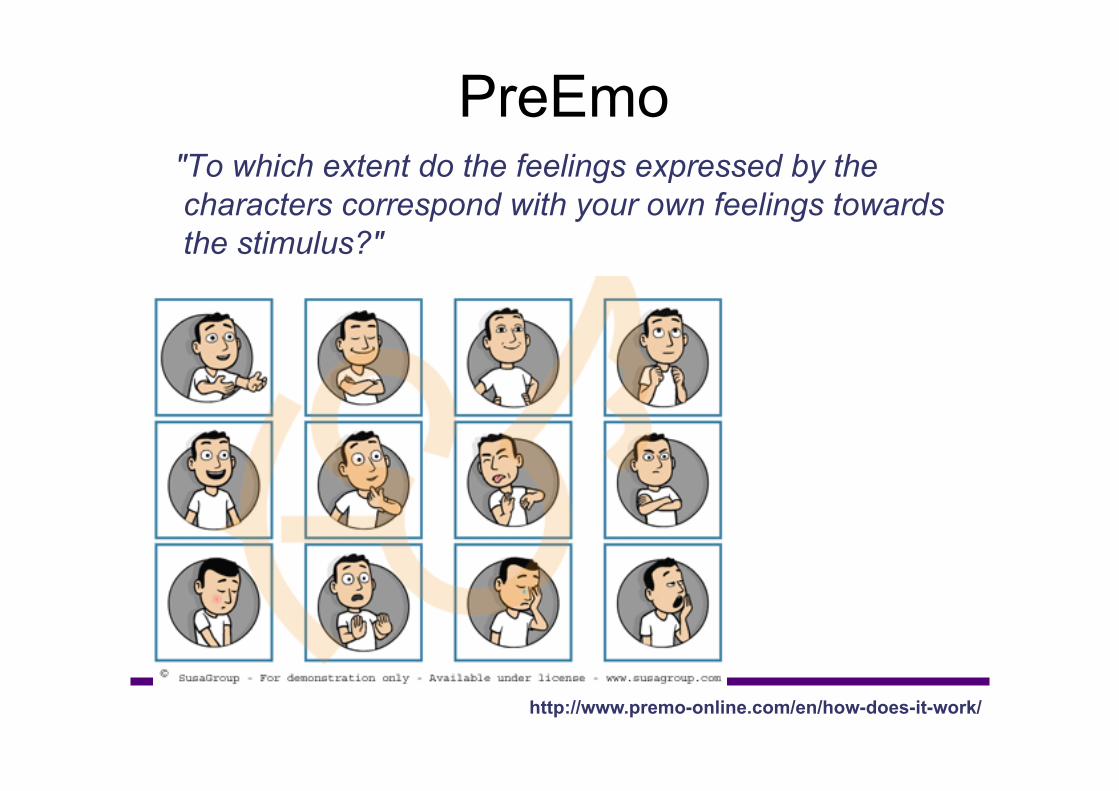
PreEmo "To which extent do the feelings expressed by the characters correspond with your own feelings towards the stimulus?"
http://www.premo-online.com/en/how-does-it-work/
42 42
Data coding • Direct measurements
– Data are already in numeric form • Indirect measurement
– Need to be coded into a number • Code each predefined answer of a questionnaire • Code each time which something happens • open questions
– Codes need to be • mutually exclusive • Exhaustive • Consistently applied
– Code book • Enter data into computing tools
– Check them
43 43
Data exploration • Values that are unlikely
– E.g. age 170 • Codes that do not exist
– E.g., gender neutral • Illogical relationships
– E.g., age 3 and education Msc • Filtering rules not applied
– If yes jump to answer 8 (answer 7 = yes)
44 44
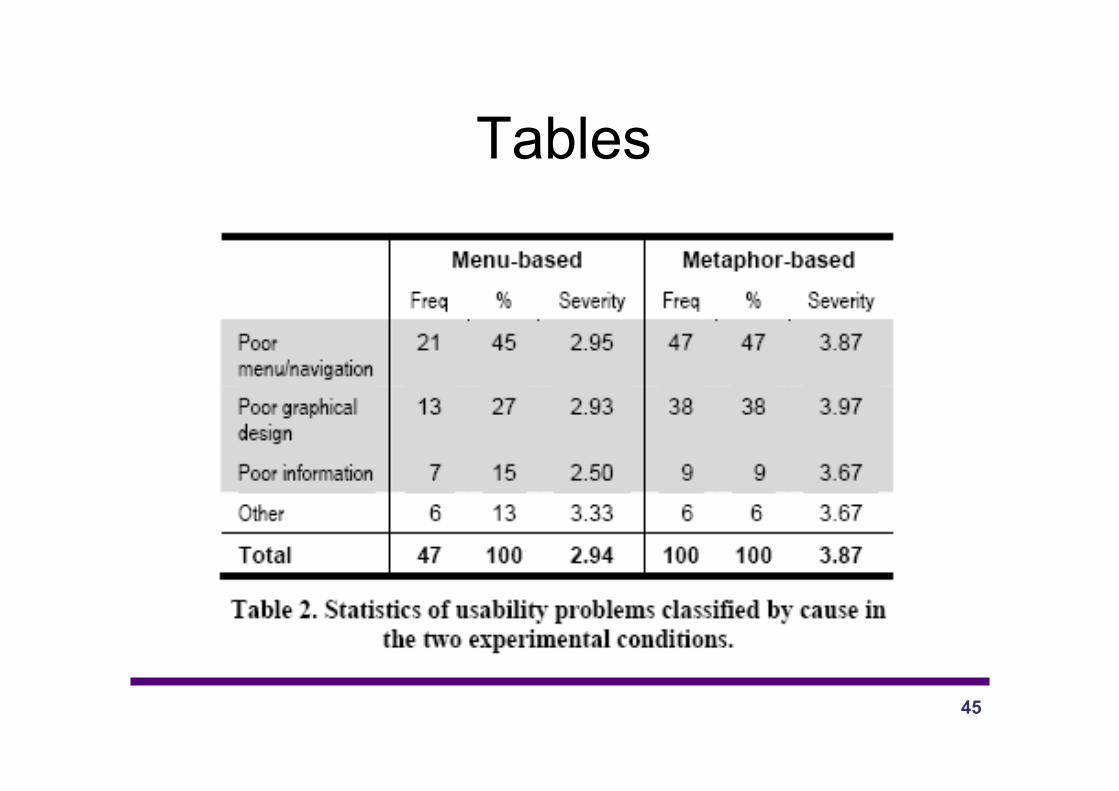
Visual aids • Tables
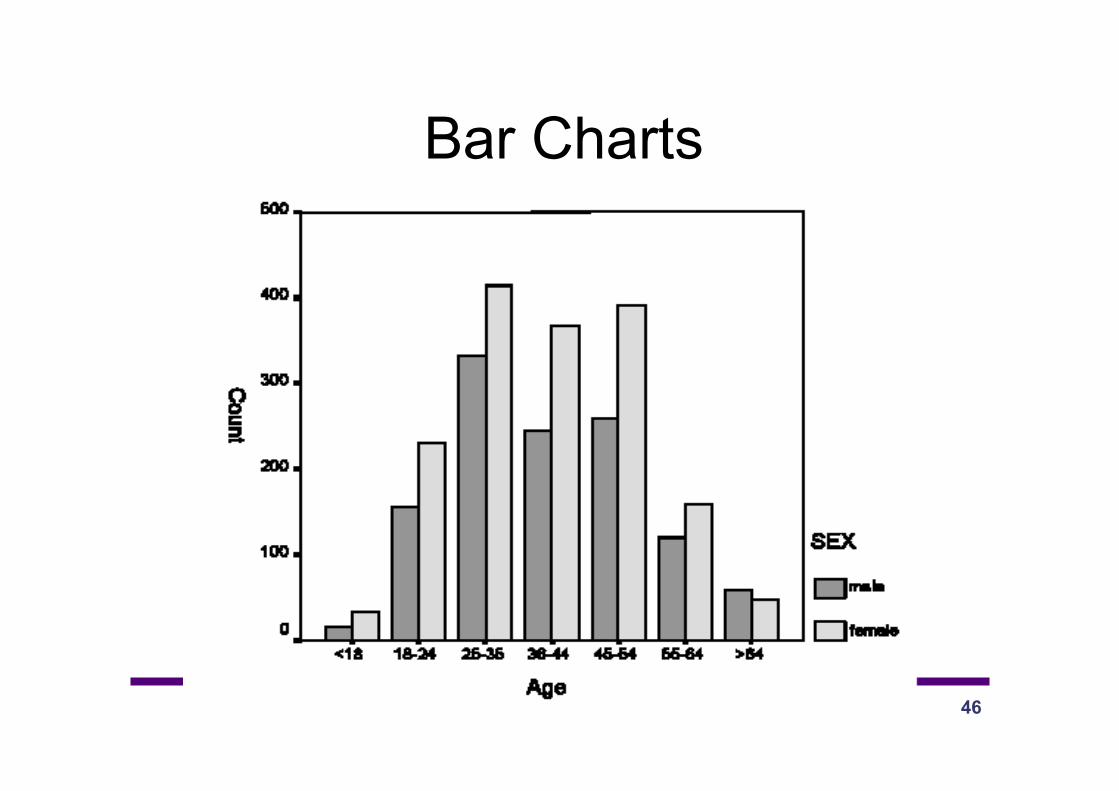
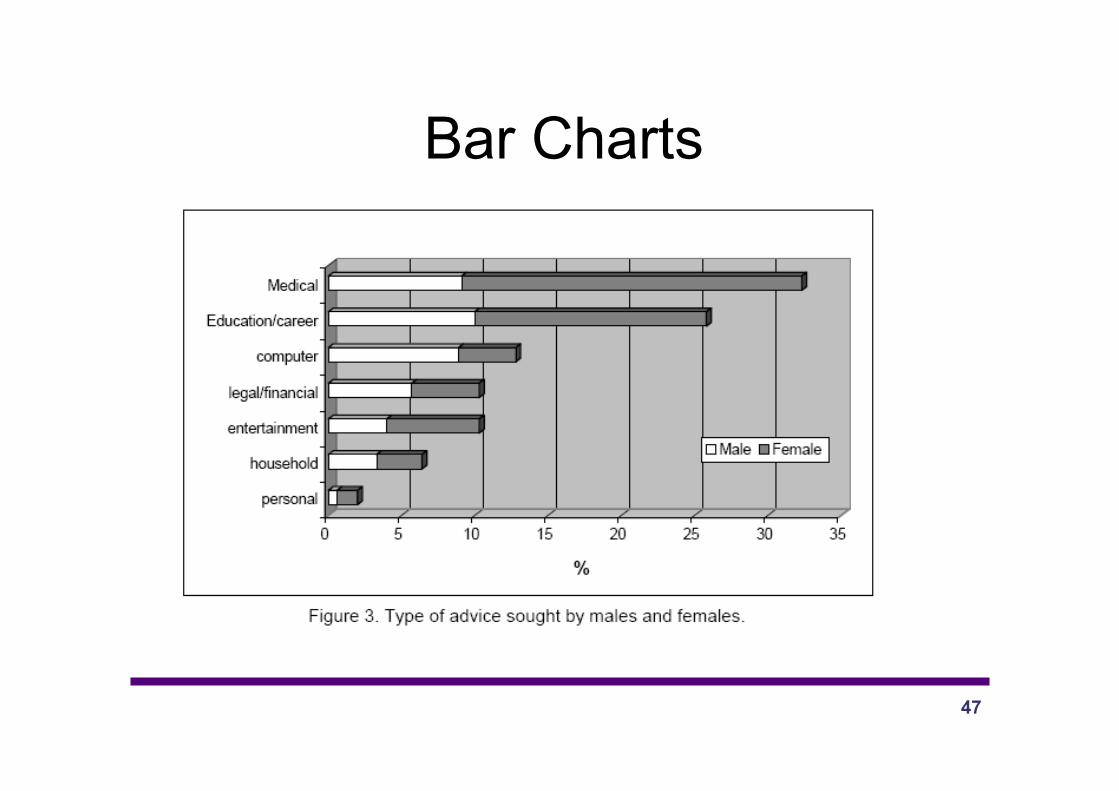
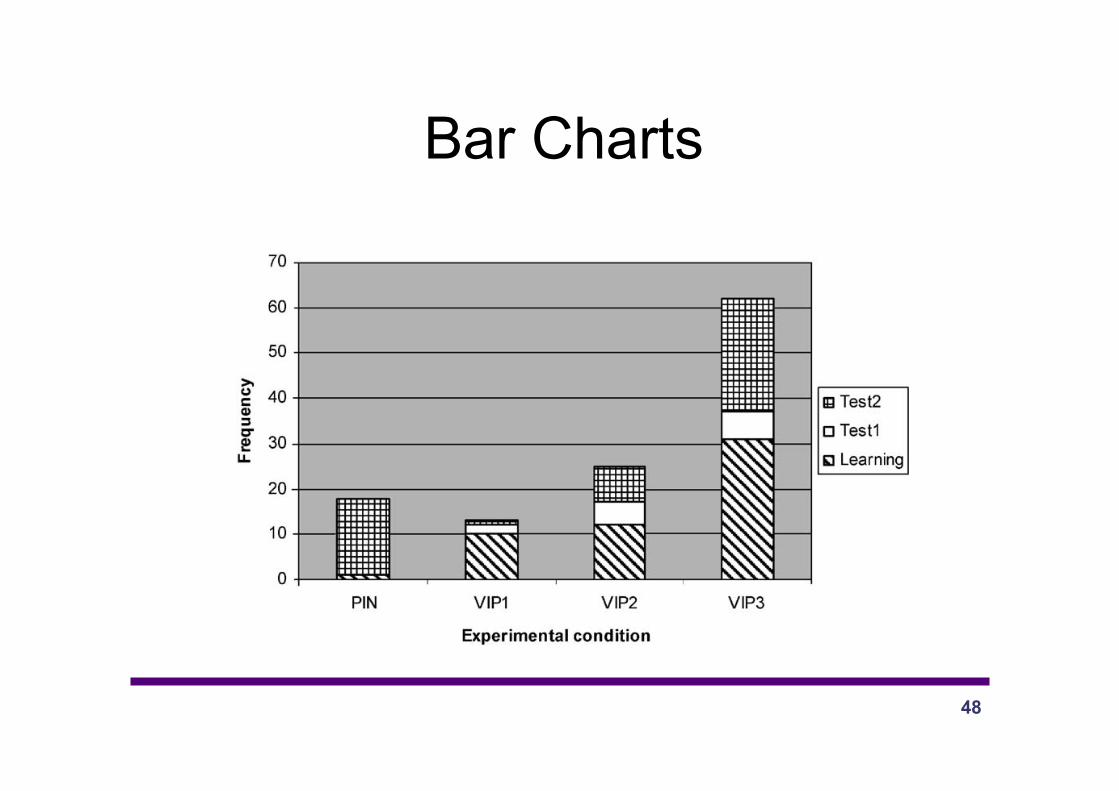
– General summaries • Bar charts
– Frequencies - means
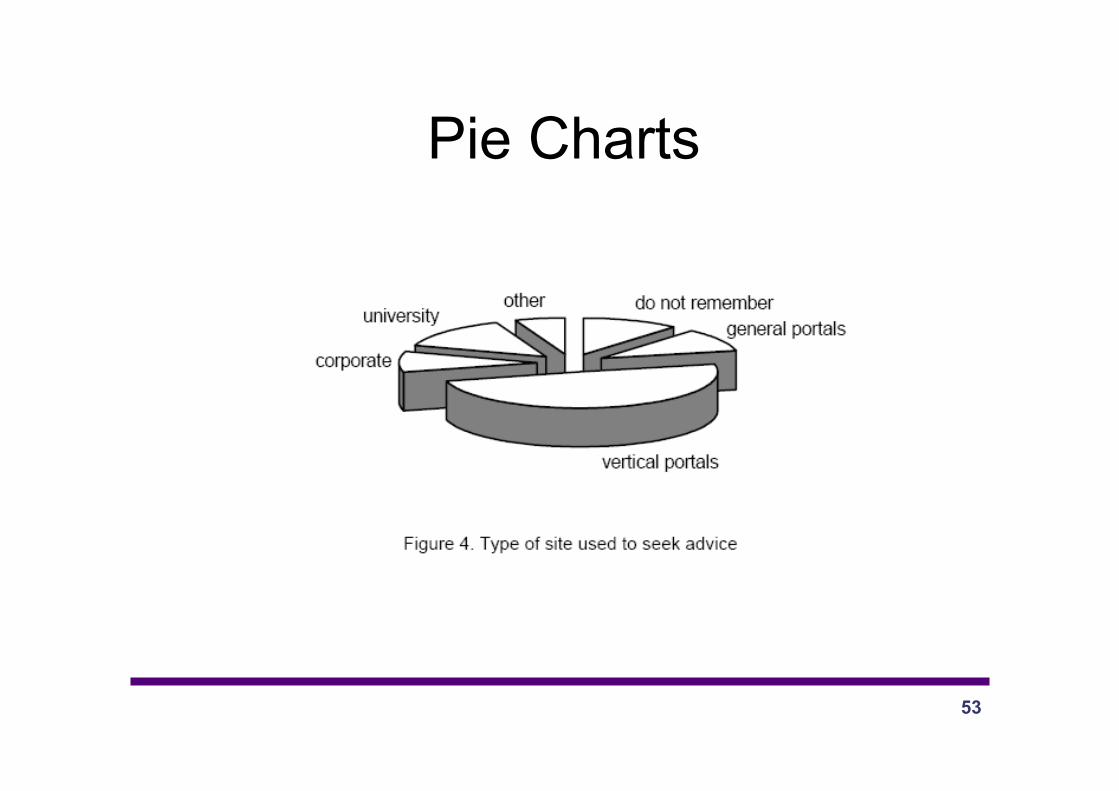
• Pie charts – Good for showing proportion
• Scatter graph – Relationship
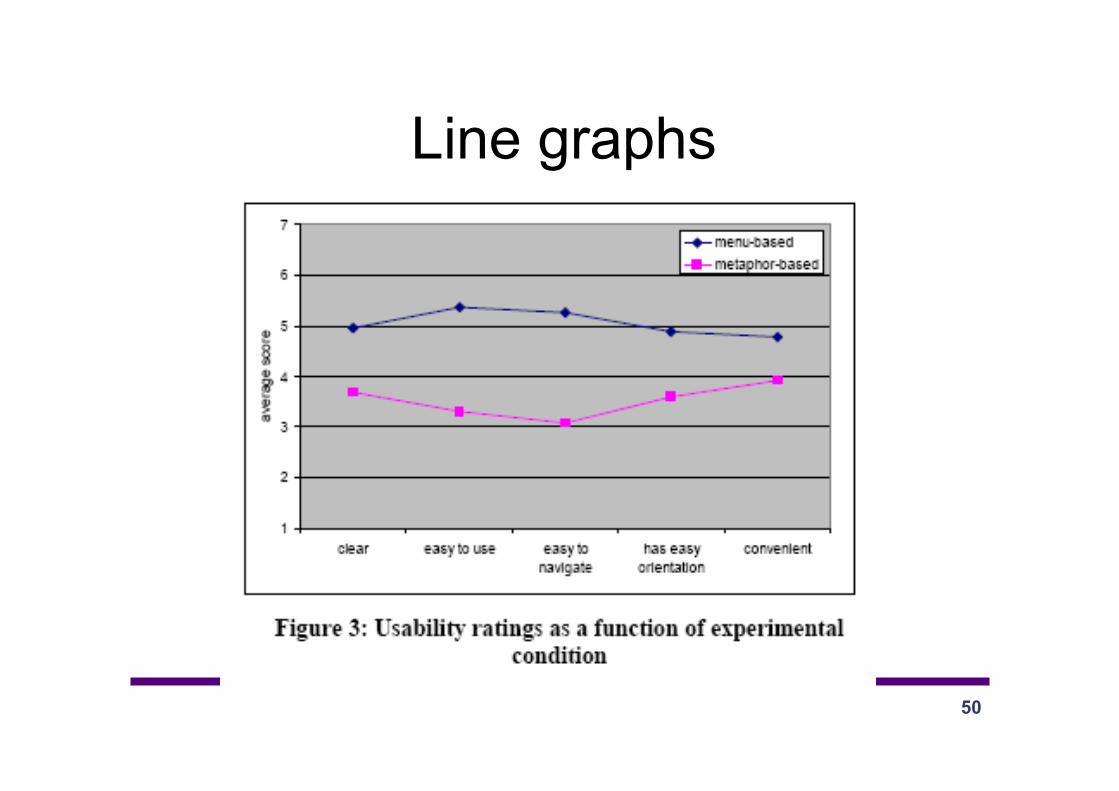
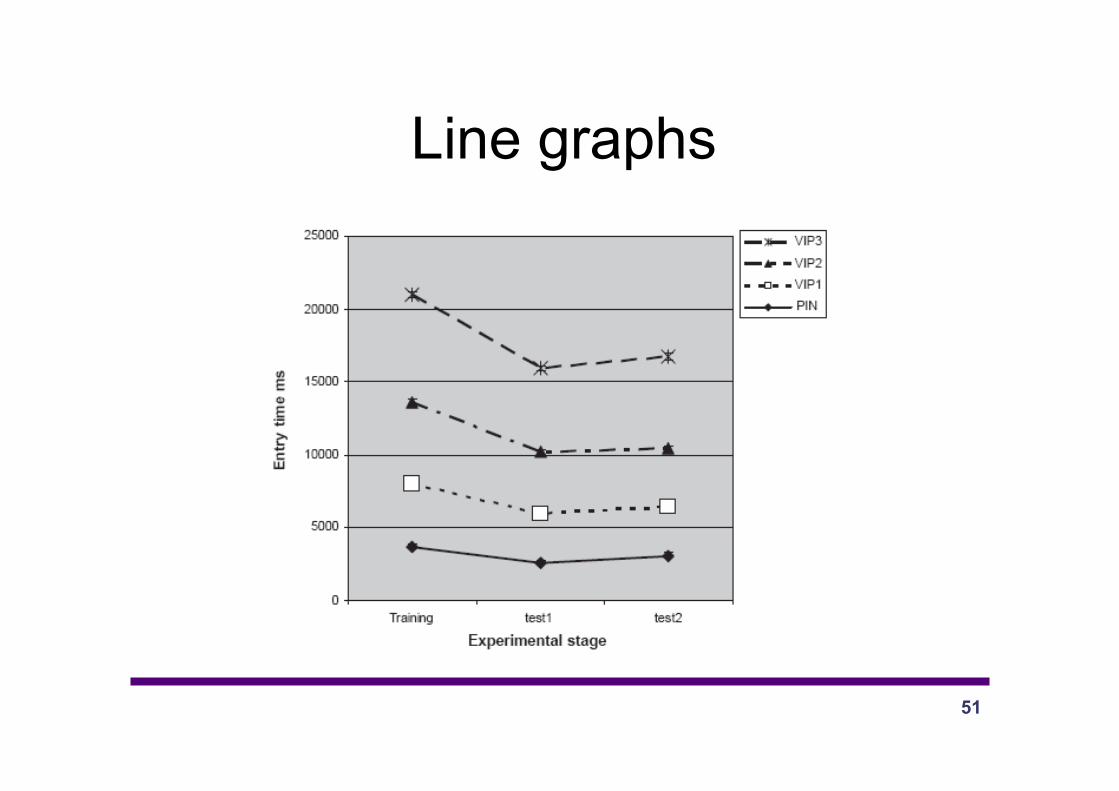
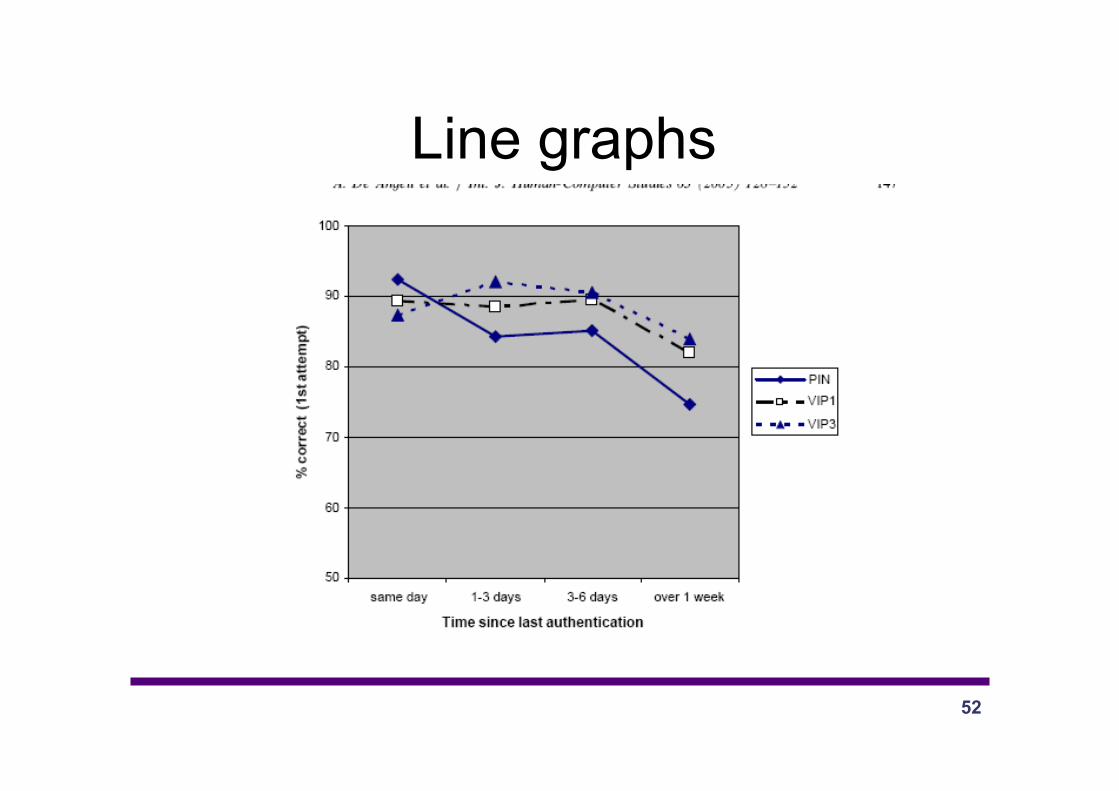
• Line graph – trends
45
Tables
46
Bar Charts
47
Bar Charts
48
Bar Charts
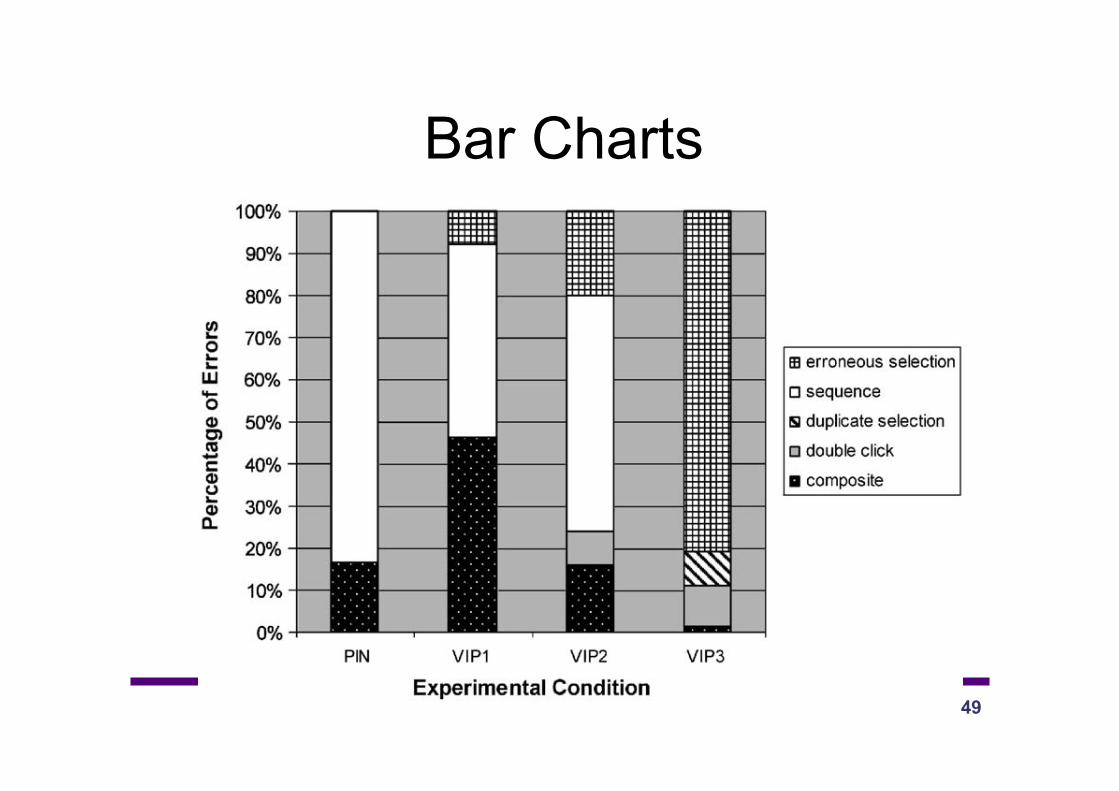
49
Bar Charts
50
Line graphs
51
Line graphs
52
Line graphs
53
Pie Charts
54 54
Visual Aids must
• Be easy to read • Have a title / labels/ • Be referenced in the paper • Give information about the units
represented in it • Displays enough information but not too
much
55 55
Statistics
• Central tendency – Means
• Average • Interval scales on • Need enough data • Outliers
– Median • Mead point in a distribution • Ordinal scale on • No effect of outliers
– Mode • Most common value • Nominal on • No effect of outliers
56 56
Distribution
• Range – Distance between highest and lowest value
• Fractiles – Quartiles – deciles – percentiles
• Standard deviation – Average amount of variability in a set of scores – Average distance of each value from the mean
57
Presenting the findings • Only make claims that your data can support
• The best way to present your findings depends on the audience, the purpose, and the data gathering and analysis undertaken
• Graphical representations may be appropriate for presentation
• Other techniques are: – Rigorous notations, e.g. UML
– Using stories, e.g. to create scenarios – Summarizing the findings