question paper 2008 section a 3 mark questions. loaded questions ? questions phrased in an...
TRANSCRIPT

QUESTION PAPER
2008
SECTION A
3 MARK QUESTIONS

Loaded questions ?
• Questions phrased in an emotionally charged manner
• Asking such questions would elicit strongly emotional and highly biased responses
• Eg: “To what extend do you think management is likely to be vindictive if the Union decides to go strike?”
• “strike”, “vindictive” – emotionally charged words
• Such questions need to be reframed in order to get specific answers
• The above question can be reframed in the following manner: to what extend do you favour a strike What do you think would be the management’s reaction to a strike

Systematic sampling ?• It is a form of probability sampling
• It involves drawing every nth element in the population starting with a randomly chosen element between 1 and n.
• Eg: let the population N be 1,00,000
And the desired sample size be 1,000
So, n = 1,000
Sampling interval, i = N/n = 100
Now, pick a random number between 1 and 100, say 30.
The elements of the sample would be 30th element (30+i)th element (30+2i)th element (30+3i)th element………and so on, till 1000 elements are chosen.

Cross tabulation ?
• Simple tabulation such as frequency counts, percentage distribution and averages may not yield the full value of the research.
• Most data need to be further organised in a variety of ways.• Analysing results by groups, categories or classes is called “cross
tabulation”.• The purpose is to allow the inspection of the differences among groups and
to make comparisons.• It also helps to analyse the relationship between two variables.• It is very effective where control and experimental groups are chosen for
the study.• Eg: “Do you shop at Wall mart?”
Gender Yes NoMale 20 60Female 70 10

Bibliography ?• A bibliography is a full reference list to all the sources which you have used in preparing a particular
piece of work. A reference list just consists of the things that you have cited for quotations, paraphrasing etc.
• The bibliography is usually arranged alphabetically by author.
• Any references to journal articles should be integrated in your bibliography.
• The formats vary, but an entry for a book in a bibliography usually contains the following information: author(s) title publisher date of publication
• An entry for a journal or periodical article usually contains: author(s) article title journal title volume pages date of publication

Likert scale ?
• It is an attitude measurement scale
• It contains a set of attitude statements of which all are considered or approximated as having equal attitudes value and to each of which respondents respond with a degree of agreement or disagreement, carrying different scores.
• These scores summed or averaged to get the individual’s attitude score.
• Usually it is a 5 point or 7 point scale
• Eg: Strongly agree-agree-neither agree nor disagree-disagree-strongly disagree (5 point).

6 a) What do you understand by the term scientific method? What steps are used while applying scientific method to market problems?
Scientific research focuses on solving problems and pursues a step-by-step logical, organized and rigorous method to identify the problems. Scientific research helps researchers to state their findings with accuracy and confidence. Applies to both basic and applied research.
Characteristics of Scientific research
1.Purposiveness2.Rigor3.Testability4.Replicability5.Precision and Confidence6.Objectivity7.Generalizability8.Parsimony

Different steps in scientific research• Observation• Preliminary data collection• Problem definition• Theoretical framework• Generation of hypothesis• Scientific research design• Data collection, analysis and interpretation.• Deduction• Report writing• Report presentation• Managerial decision making

6 b) Define hypotheses? What are its main features? Discuss.
• Hypotheses can defined as a logically conjectured relationship between two or more variables expressed in the form of a testable statement.
• Example: “the automobile A is performing as well as automobile B”

Types of hypothesesDirectional hypothesesHypotheses gives direction of relationship between
variables. It includes terms like positive, negative more than, less than.
Example: the greater the stress experienced in the job, lower the job satisfaction of employees.
Nondirectional hypothesesdo postulate a relationship or difference, but offer
no direction of these relationship or difference.Example: there is a relationship between age and
job satisfaction.

Null hypothesesThe Null statement is expressed as no (significant)
relationship between two variables or no (significant) difference between two groups.
Example: there is no relationship between the stress experienced in the job and the job satisfaction of employees.
Alternative hypothesesThe alternative hypotheses is expressed as there is
significant relationship between two variables.

Features• Hypothesis should be clear and precise.• Hypothesis should be capable of being tested.• Hypothesis should state relationship between
variables.• Hypothesis should be limited in scope and must
be specific.• Hypothesis should be stated as far as possible in
most simple term.• Hypothesis should be amenable to testing with in
a reasonable time

Q 7(b)What do you mean by research design ? What are the types of research designs?
After the identification of the variables and developing the theoretical framework the next step is to design the research.
Research design is a framework or blueprint for conducting the research project.
It details the procedures necessary for obtaining the info needed to structure or solve your research problems. It lays the foundation for conducting the project.

The various components are:
1.Design the exploratory, descriptive and/or causal phases of the research2.Define the information needed3.Specify the measurement and scaling procedures4.Conduct and pretest a questionnaire or an appropriate form for data collection5.Specify the sampling process and sample size6.Develop a plan of data analysis

Types of research design
Diagram
A.Exploratory Research DesignUndertaken when not much is known about the situation at hand
Extensive preliminary work needs to be done to provide insights into, and an understanding of the problem confronting the researcher
Research process adopted is flexible and unstructured
The sample selected is small and nonrepresentative
The findings of this research are regarded as input to further research
Popular tools:Secondary data analysis, pilot studies, experience surveys, case studies

B. Conclusive research
Objective is to test specific hypotheses and examine specific relationships
Typically more formal and structured Based on large representative samples
The data obtained are subjected to quantitative analysis
1. DescriptiveTo ascertain the characteristics of variables of interest in a situation
To determine the customer perceptions To determine the degree of association To make specific predictions
i. Cross sectional Single Multipleii. Longitudinal

2. Causal Research
Used to obtain evidence of cause-and-effect (causal) relationships.
To understand which variables are the cause (IV) and which variables are the effect (DV) of a phenomenon
To determine the nature of the relationship between the causal variable and the effect to be predicted
Three Conditions of causality1.Concomitant variation- the extent to which a cause X and an effect Y occur together or vary together in the way predicted by the hypothesis under consideration2.Time order of occurrence of variables: the causing event must occur either before or simultaneously with the effect, it cannot occur afterwards.3.Elimination of other possible causal factors: The factor or variable being investigated should be the only possible causal explanation

7. (a) What are the instruments of data collection?
Collection of Primary data
•Whether sample surveys or census surveys we obtain primary data through observation or through direct communication with respondents.Observation methodInterview methodThrough questionnairesThrough schedulesOther methods Warranty cards Distributor audits Pantry audits Using mechanical devices

Collection of secondary data
• It may either be published data or unpublished data
• Usually published data are available in Various publications of Central, state or local
government Technical and trade journals Books, magazines and newspapers Reports and publications of various
associations
• Usually unpublished data may be found in diaries, letters, unpublished biographies and also may be available with scholars or researchers.

Q.8 (a) What is sampling? How is it different from Census
Method? Give advantages of sampling over census.
Ans:
Population - entire group of people, events or things that the
researcher wants to investigate.
Sample – is a subset of a population. It comprises some
members of the population.
By studying the sample the researcher should be able to draw
conclusions that would be generalisable to the population
of interest.
Sampling is the process of selecting a sufficient number of
elements from the population, so that a study of the sample and
an understanding of its properties or characteristics would
make it possible to genaralise such properties or
characteristics to the population elements. All conclusions
drawn about the sample are genarlised to the population.
Census Method : This method enumerates completely all
elements in a population. In such an enquiry, no element of
chance is left and the highest accuracy is expected to be
obtained.

Advantages of Sampling over Census.
•Convenient for large samples.
•Easier research.
•No magnification of sampling bias.
•Less cost.
•Less time consuming.

5Q. Discuss various scales of measurements giving suitable examples?
• A scale is a tool or mechanism by which individuals are distinguished as to how far they differ from one another on the variables of interest to the study.
•There are four basic types of scales 1. Nominal Scale 2. Ordinal Scale 3. Interval Scale 4. Ratio Scale
1.Nominal ScaleIt allows the researcher to assign subjects to certain categories or groups.
For eg: variables of gender can be grouped into two categories male and female. - There are no quantitative properties for this variable or these classes and, therefore, gender is a nominal variable
• Other Examples– country of origin– animal or non-animal
• Ordinal Scale• It not only categorizes the variables in such a way as to denote differences
among the various categories, it also rank- orders the categories in some meaningful way.
• With any variable for which the categories are to be ordered according to some preferences , the ordinal scale will be used. The preference would be ranked from best to worst or from first to last and numbered one, two and so on.
• For eg: Rank the following 5 characteristics in a job in terms of their importance.
• 3. Interval Scale• Origin of interval scale is an arbitrary zero.
• It allows us to perform certain arithmetical operations on the data collected from the respondents.
• It is an indication of magnitude of differences among the ranks.
• It measures the distance between two points on the scale.
• Helps to compute mean and standard deviation.

4.Ratio Scale
• It overcomes the disadvantage of the arbitrary origin point of the interval scale, in that it has an absolute zero point which is a meaningful measurement point.
•Thus the ratio scale not only measures the magnitude of differences between points on the scale but also taps the proportion between the scales.
for eg: weighing balance.
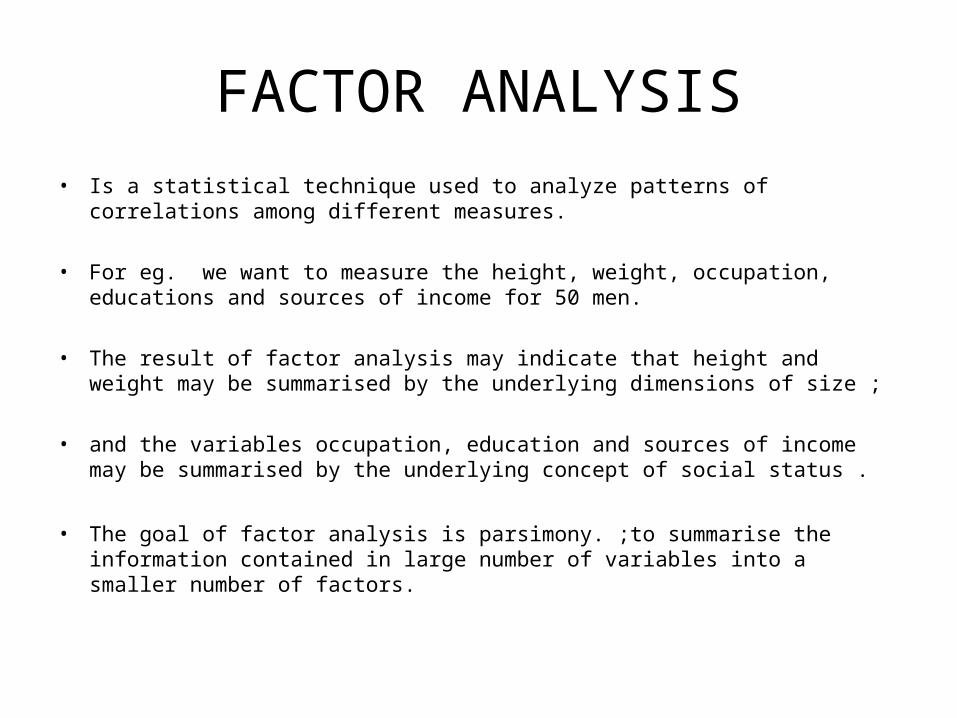
FACTOR ANALYSIS• Is a statistical technique used to analyze patterns of correlations among different
measures.
• For eg. we want to measure the height, weight, occupation, educations and sources of income for 50 men.
• The result of factor analysis may indicate that height and weight may be summarised by the underlying dimensions of size ;
• and the variables occupation, education and sources of income may be summarised by the underlying concept of social status .
• The goal of factor analysis is parsimony. ;to summarise the information contained in large number of variables into a smaller number of factors.

Nonparametric Test•For many of the statistical test it is necessary to assume that population is normally distributed.
•If it is normal the error associated with making inferences about the population from the sample data can be estimated, but if it is not normal the error may be large and cannot be estimated.
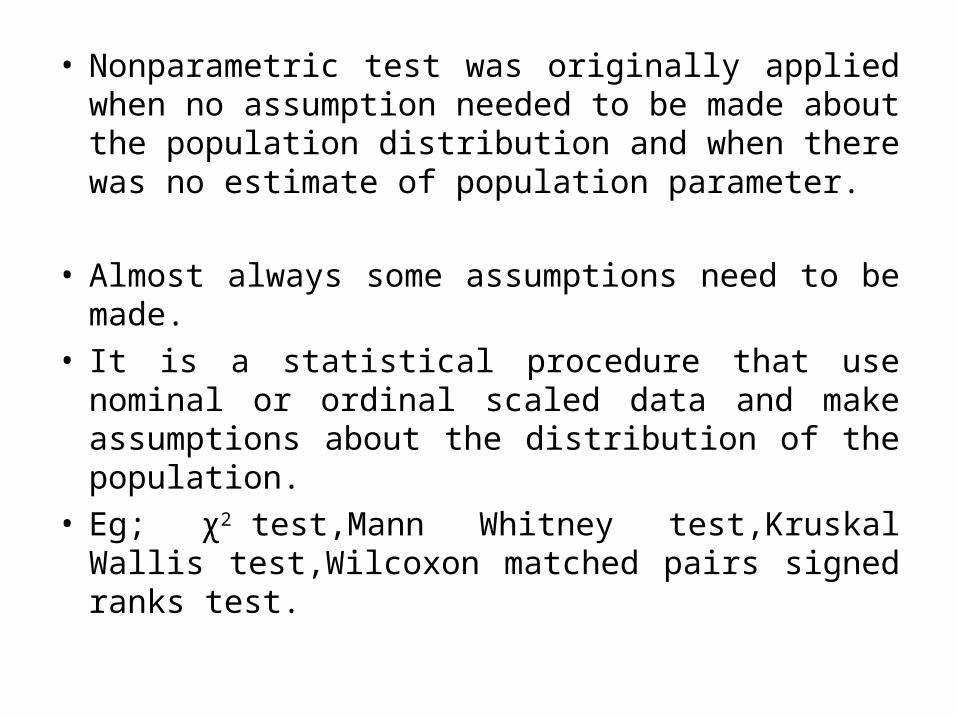
• Nonparametric test was originally applied when no assumption needed to be made about the population distribution and when there was no estimate of population parameter.
• Almost always some assumptions need to be made.• It is a statistical procedure that use nominal or
ordinal scaled data and make assumptions about the distribution of the population.
• Eg; χ2 test,Mann Whitney test,Kruskal Wallis test,Wilcoxon matched pairs signed ranks test.

ADVANTAGES
• Computation is simple.• It is easier to collect data.• Avoid the error caused by assuming that
population is normally distributed when it is not.