queensland university of technology faculty of …diffusion process and its sub-categories...
TRANSCRIPT

Queensland University of Technology Faculty of Information Technology
Exploring the Relationship of Organisational Culture to Enterprise System Success
PhD Thesis 2008 Peter Birbeck BSc(Hons) MBA

Exploring the Relationship of Organisational Culture to Enterprise Systems Success
Candidate: Peter Birbeck
Student Number: N04647548
Award: PhD
Mode: Full Time
Submission: 2008
Research Centre: Faculty of Information Technology
L5, 126 Margaret Street, Brisbane, QLD 4000
Supervisors: Associate Professor Glenn Stewart
Professor Christine Bruce
Professor Guy Gable
I

Exploring the Relationship of Organisational Culture to Enterprise Systems Success
Table of Contents
1. Chapter 1: Introduction 1-3
1.1. Motivation for Conducting the Research 1-3
1.2. The Research Object 1-8
1.3. Research Aims, Objectives & Outcomes 1-8
1.4. Research Significance and Importance 1-9
1.5. Informing Theories 1-11
1.6. Research Design Summary 1-12
1.7. Research Design & Thesis Structure 1-19
2. Chapter 2: Literature Review: Measuring ES Success 2-1
2.1. Introduction: Informing Theories 2-3
2.2. Enterprise Systems 2-5
2.3. Enterprise System Success 2-9
2.4. Measuring ES Success 2-16
2.5. Summary 2-19
3. Chapter 3: Literature Review: Measuring Organisational Culture 3-1
3.1. Introduction: Organisational Culture 3-4
3.2. Organisational Culture Defined 3-4
3.3. Values: The Core of Culture 3-8
3.4. Levels of Culture within an Organisation 3-9
3.5. Interpretivist approaches to measuring culture 3-12
3.6. Common Themes 3-15
3.7. Organisational Culture and Leadership 3-16
3.8. Organisational Homogeneity: Sub-cultures 3-17
3.9. Measuring Organisational Culture 3-18
3.10. Organisational Culture Influencing Information Systems 3-20
II

Exploring the Relationship of Organisational Culture to Enterprise Systems Success
3.11. Research Approaches to Studying and Measuring OC 3-22
3.12. Quantitative Research Methods 3-23
3.13. Qualitative Research Methods 3-25
3.14. Quantitative versus Qualitative Approaches 3-27
3.15. Instrument Selection 3-30
3.16. Summary Findings in the Literature 3-38
4. Chapter 4: Research Design 4-3
4.1. RQ: How can we explore the OC- ESS relationship? 4-5
4.2. RQ: Who can inform on the OC-ESS relationship? 4-8
4.3. RQ: Who can inform on ES Success within the target
organisation? 4-8
4.4. RQ: Who can inform on OC external to the organisation? 4-10
4.5. Data Collection Methods 4-17
4.6. Qualitative Data Collected 4-17
4.7. Quantitative Data Collected 4-20
4.8. RQ: How was the data collected? 4-22
4.9. Pilot Study Data Collection 4-23
4.10. Main Consultant Data Collection 4-23
4.11. Revelatory Case Study Data Collection 4-24
4.12. Research Design Summary 4-26
5. Chapter 5: The Pilot Study 5-4
5.1. Qualitative Data Collected 5-5
5.2. Qualitative Data Analysis 5-7
5.3. Qualitative Results: First Pass – Open Coding 5-12
5.4. Qualitative Results: Second Pass – Axial Coding 5-19
5.5. Qualitative Results: Third Pass – Selective Coding 5-27
5.6. Pilot Results 5-28
5.7. Pilot Qualitative Protocol Reflections 5-33
III

Exploring the Relationship of Organisational Culture to Enterprise Systems Success
5.8. Pre-Interview Instruments 5-33
5.9. Existing Question Changes 5-33
5.10. Question Addition 5-34
5.11. Interview Duration 5-35
5.12. Summary 5-36
5.13. Reflections on Instruments 5-36
6. Chapter 6: The Consultant’s Study 6-4
6.1. Study Participants 6-5
6.2. Qualitative Analysis 6-6
6.3. Qualitative Open and Axial Coding 6-14
6.4. Qualitative Selective Coding 6-49
6.5. Quantitative Results: OCAI Radar Plots 6-54
6.6. Combining the Consultant OCAI and Consultant
Qualitative Results 6-62
6.7. Summary of Results 6-64
7. Chapter 7: Revelatory Case Study 7-1
7.1. Revelatory Case Study 7-4
7.2. Suitability of the Organisation for Inclusion in the Study 7-5
7.3. Data Collection 7-8
7.4. Quantitative Data: ESS + OCAI Analysis and Interpretation 7-11
7.5. Case Study Review & Summary 7-31
8. Chapter 8: Cross-Case Analysis 8-4
8.1. The Relationship of the Clan Culture to Successful ES 8-4
8.2. Market Culture Very Strong in Least Successful ES 8-10
8.3. OCAI Clan and OCAI Market Negatively Correlated 8-14
8.4. Hierarchy Strong in Both Successful & Least
Successful ES 8-16
8.5. The Ideal Culture 8-21
IV

Exploring the Relationship of Organisational Culture to Enterprise Systems Success
8.6. Cross-Case Analysis Summary Findings 8-24
9. Chapter 9: Conclusions, Contributions and Future Research 9-1
9.1. Summary of Overall Research 9-3
9.2. The Research Aims Achieved 9-5
9.3. Summary of Findings 9-6
9.4. Model Output 9-7
9.5. Future Work 9-8
9.6. Implications for Practice 9-11
9.7. Research Limitations 9-12
9.8. Conclusions and Research Contributions 9-15
Figures
Figure 1-1. The focal relationship 1-8
Figure 1-2. Informing theories from the literature 1-11
Figure 1-3. Design summary 1-12
Figure 1-4. Elements of the initial phase of the research 1-14
Figure 1-5. Early stages of the research cycle 1-16
Figure 1-6. All elements of the design incorporating chapter numbers 1-19
Figure 2-1. Reference disciplines framing the study 2-3
Figure 2-2. Information and material flows in a business process model 2-7
Figure 2-3. Information flows along the value chain 2-7
Figure 2-4. Vendors of Enterprise Systems and their products 2-8
Figure 2-5. IS Success Model 2-9
Figure 2-6. A re-specification of the DeLone & McLean model 2-10
Figure 2-7. An updated model of IS Success 2-12
Figure 2-8. Determinants of users' expectations 2-13
Figure 2-9. Updated IS Success model 2-13
V
Exploring the Relationship of Organisational Culture to Enterprise Systems Success
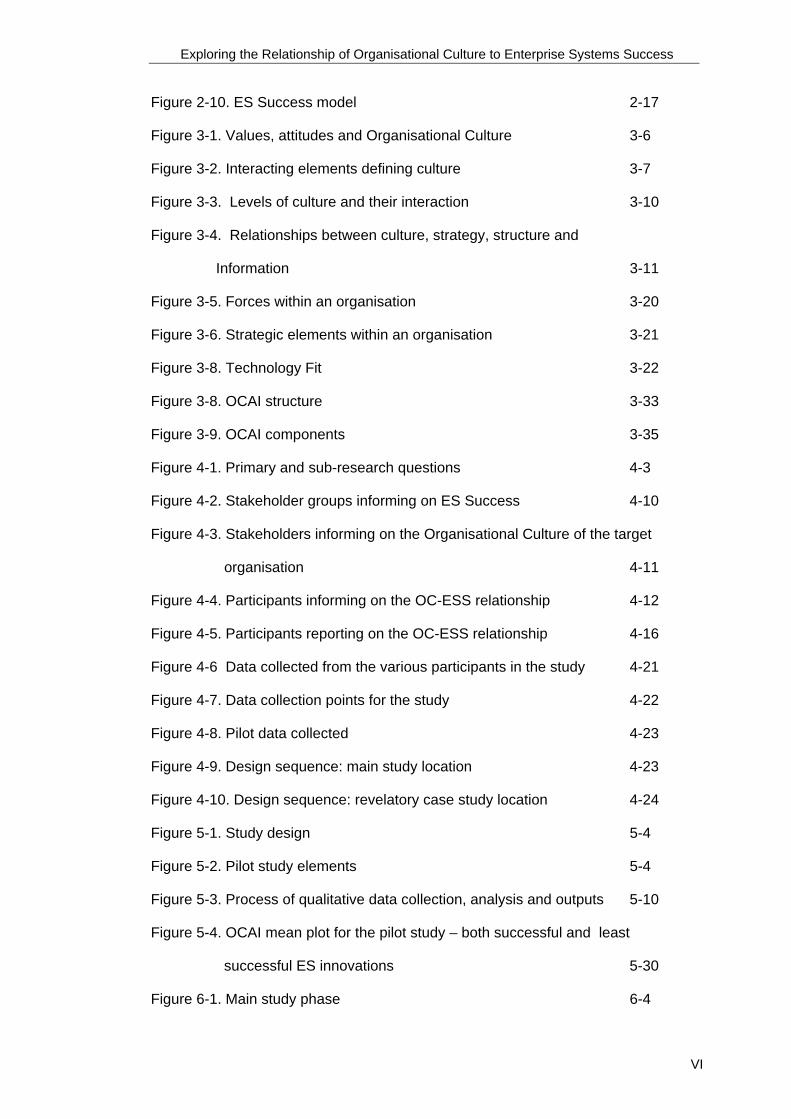
Figure 2-10. ES Success model 2-17
Figure 3-1. Values, attitudes and Organisational Culture 3-6
Figure 3-2. Interacting elements defining culture 3-7
Figure 3-3. Levels of culture and their interaction 3-10
Figure 3-4. Relationships between culture, strategy, structure and
Information 3-11
Figure 3-5. Forces within an organisation 3-20
Figure 3-6. Strategic elements within an organisation 3-21
Figure 3-8. Technology Fit 3-22
Figure 3-8. OCAI structure 3-33
Figure 3-9. OCAI components 3-35
Figure 4-1. Primary and sub-research questions 4-3
Figure 4-2. Stakeholder groups informing on ES Success 4-10
Figure 4-3. Stakeholders informing on the Organisational Culture of the target
organisation 4-11
Figure 4-4. Participants informing on the OC-ESS relationship 4-12
Figure 4-5. Participants reporting on the OC-ESS relationship 4-16
Figure 4-6 Data collected from the various participants in the study 4-21
Figure 4-7. Data collection points for the study 4-22
Figure 4-8. Pilot data collected 4-23
Figure 4-9. Design sequence: main study location 4-23
Figure 4-10. Design sequence: revelatory case study location 4-24
Figure 5-1. Study design 5-4
Figure 5-2. Pilot study elements 5-4
Figure 5-3. Process of qualitative data collection, analysis and outputs 5-10
Figure 5-4. OCAI mean plot for the pilot study – both successful and least
successful ES innovations 5-30
Figure 6-1. Main study phase 6-4
VI

Exploring the Relationship of Organisational Culture to Enterprise Systems Success
Figure 6-2. Management influences sub-categories 6-15
Figure 6-3. Sponsor interaction in OC-ESS 6-19
Figure 6-4. The role of champions in the OC-ESS relationship 6-23
Figure 6-5. Sub-categories within MI>Leadership 6-24
Figure 6-6. Vision component in the OC-ESS relationship 6-30
Figure 6-7. Diffusion Process and its sub-categories summarised 6-31
Figure 6-8. Change Acceptance interacting in the OC-ESS relationship 6-36
Figure 6-9. User support in the Diffusion Process in the
OC-ESS relationship 6-37
Figure 6-10. User support and managerial understanding of the
Diffusion Process 6-39
Figure 6-11. Employee development component in the OC-ESS
Relationship 6-41
Figure 6-12. Learning Organisation role in the OC-ESS relationship 6-42
Figure 6-13. Organisational structure characteristics influencing OC-ESS 6-44
Figure 6-14. Sub-culture presence in the OC-ESS relationship 6-48
Figure 6-15. Selective coding to Clan DO 6-51
Figure 6-16. OCAI Adhocracy influences 6-52
Figure 6-17. OCAI hierarchy control and coordination influence 6-53
Figure 6-18. OCAI radar plot all consultants 6-54
Figure 6-19. Implementation consultants OCAI 6-58
Figure 6-20. Change consultants OCAI 6-59
Figure 6-21. Vendor consultants OCAI 6-60
Figure 6-22. Summary of Consultant findings 6-65
Figure 7-1. Information System portfolio Oz Dairy 7-6
Figure 7-2. Oz Dairy ESS results 7-11
Figure 7-3. Survey response by geographic unit 7-18
Figure 7-4 Survey response by employment cohort 7-22
VII

Exploring the Relationship of Organisational Culture to Enterprise Systems Success
Figure 7-5. OCAI Operations Business Unit 7-24
Figure 7-6. OCAI Shipping Business Unit 7-25
Figure 7-7. OCAI Finance Business Unit 7-25
Figure 7-8. OCAI Sales Business Unit 7-26
Figure 7-9. OCAI IT Business Unit 7-27
Figure 7-10. OCAI Head Office 7-27
Figure 8-1. Mean OCAI all Consultant categories showing clan most
successful 8-5
Figure 8-2. Most Successful BU from the revelatory case study –
‘extremely clan’ 8-6
Figure 8-3. Internal change consultants report the most successful BU as
‘strongly clan’ 8-6
Figure 8-4. Vendor consultants report the most successful BU
as ‘strongly clan’ 8-7
Figure 8-5. Market strong in least successful ES 8-10
Figure 8-6. OCAI plot for the BU that reported the lowest scores for
ES Success 8-11
Figure 8-7. Clan and market relationship 8-15
Figure 8-8. Hierarchy strong in both successful and least successful ES 8-16
Figure 8-9. Implementation consultants found hierarchy strong in both
successful and least successful ES 8-17
Figure 9-1. OC-ESS model 9-7
Tables
Table 1-1. Criteria for case studies 1-18
Table 2-1. Sources of information 2-4
Table 2-2. ERP characteristics 2-5
Table 2-3. Users of Enterprise Systems 2-11
VIII
Exploring the Relationship of Organisational Culture to Enterprise Systems Success
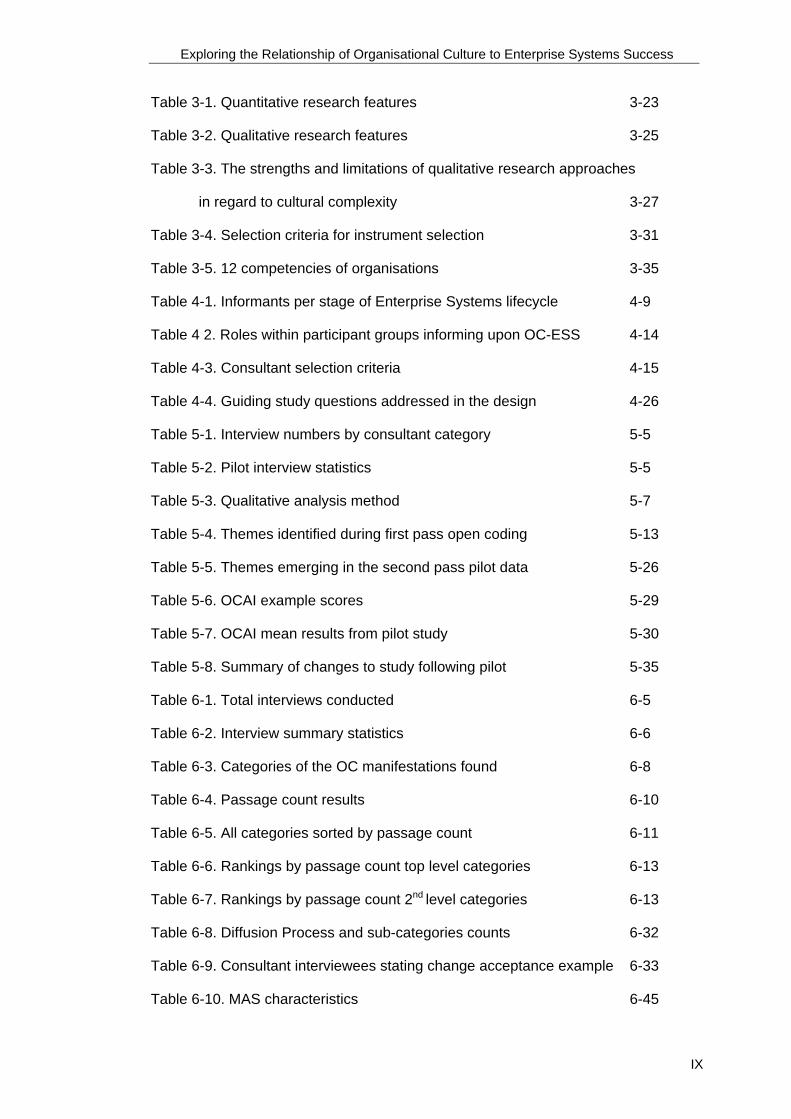
Table 3-1. Quantitative research features 3-23
Table 3-2. Qualitative research features 3-25
Table 3-3. The strengths and limitations of qualitative research approaches
in regard to cultural complexity 3-27
Table 3-4. Selection criteria for instrument selection 3-31
Table 3-5. 12 competencies of organisations 3-35
Table 4-1. Informants per stage of Enterprise Systems lifecycle 4-9
Table 4 2. Roles within participant groups informing upon OC-ESS 4-14
Table 4-3. Consultant selection criteria 4-15
Table 4-4. Guiding study questions addressed in the design 4-26
Table 5-1. Interview numbers by consultant category 5-5
Table 5-2. Pilot interview statistics 5-5
Table 5-3. Qualitative analysis method 5-7
Table 5-4. Themes identified during first pass open coding 5-13
Table 5-5. Themes emerging in the second pass pilot data 5-26
Table 5-6. OCAI example scores 5-29
Table 5-7. OCAI mean results from pilot study 5-30
Table 5-8. Summary of changes to study following pilot 5-35
Table 6-1. Total interviews conducted 6-5
Table 6-2. Interview summary statistics 6-6
Table 6-3. Categories of the OC manifestations found 6-8
Table 6-4. Passage count results 6-10
Table 6-5. All categories sorted by passage count 6-11
Table 6-6. Rankings by passage count top level categories 6-13
Table 6-7. Rankings by passage count 2nd level categories 6-13
Table 6-8. Diffusion Process and sub-categories counts 6-32
Table 6-9. Consultant interviewees stating change acceptance example 6-33
Table 6-10. MAS characteristics 6-45
IX

Exploring the Relationship of Organisational Culture to Enterprise Systems Success
Table 6-11. Dimension of gender 6-46
Table 6-12. OCAI constructs by passage 6-49
Table 6-13. OCAI scores all consultants mean 6-54
Table 6-14 IC OCAI scores 6-57
Table 6-15. Change Consultants OCAI score 6-58
Table 6-16. Vendor Consultants OCAI scores 6-59
Table 6-17. Table of the culture types ranking 6-61
Table 6-18. Combined OCAI and Consultant findings 6-62
Table 7-1. Oz Dairy financial results 7-4
Table 7-2. Case study demographics collected 7-9
Table 7-3. Summary of BU ranked by % responses and ESS scores 7-13
Table 7-4. Business Unit ranked by overall ESS score 7-13
Table 7-5. Business Units ranked by OI scores 7-14
Table 7-6. Business Units ranked by II scores 7-14
Table 7-7. Business Units ranked by SQ scores 7-14
Table 7-8. Business Unit ranked by IQ scores 7-15
Table 7-9. Operations BU all results 7-15
Table 7-10. Shipping Unit results 7-16
Table 7-11. Finance Unit all results 7-17
Table 7-12. Sales & Marketing Unit all results 7-17
Table 7-13. IT Unit all results 7-17
Figure 7-14. ES Success by Geographic Unit 7-18
Table 7-15. ESS Results summary by location 7-19
Table 7-16. Location ranked by overall ESS score 7-19
Table 7-17. Location ranked by OI score 7-20
Table 7-18. Location ranked by II score 7-20
Table 7-19. Location ranked by SQ 7-20
Table 7-20. Location ranked by IQ 7-21
X

Exploring the Relationship of Organisational Culture to Enterprise Systems Success
Table 7-21. ESS results by employment cohort 7-22
Table 7-22. ESS Scores by module ranked by overall ESS score 7-23
Table 7-23. Correlation/linear regressions of the OCAI culture types 7-29
Table 7-24. OCAI types by ESS item 7-30
Table 8-1. Evidence summary for clan as most successful culture type 8-8
Table 8-2. Clan significantly correlated to ES Success 8-8
Table 8-3. Market culture negatively correlated 8-11
Table 8-4. Overall ESS score and IQ scores the lowest 8-12
Table 8-5. Market negatively correlated to IQ 8-12
Table 8-6. Summary of the range of evidence supporting the market as
least successful ES culture 8-14
Table 8-7. Clan and market negatively correlated 8-15
Table 8-8. Hierarchy score in successful ES 8-17
Table 8-9. Hierarchy score in least successful ES 8-18
Table 8-10. Hierarchy selective coding 8-19
Table 8-11. Components of the ideal culture as reported by
the consultants 8-21
Table 8-12. Summary of ideal culture items when selectively coded
against the OCAI sub-constructs 8-22
XI

Exploring the Relationship of Organisational Culture to Enterprise Systems Success
Abstract
The doctoral research project is titled ‘An Exploration of the Relationship of
Organisational Culture and Enterprise System Success and sought to address the
research gap identified in the literature between organisational culture literature and
Information System success literature. This is a research project which is funded by
the Australian Research Council in conjunction with industry. The industry sponsors
for this research were SAP AG, SAP USA and SAP ANZ.
The research project adopted a multi-method research design, grounded in practice,
in order to surface any reported relationship between Enterprise Systems Success
(ESS) and Organisational Culture (OC). A critical part of the study was to identify
who could report on this relationship. Partners in implementation include internal
change managers, internal consultants, vendor consultants and implementation
partner consultants. Representatives from each of these constituents were
interviewed, covering a range of industry sectors and Enterprise Systems vendor
organisations. The first phase of the research was to qualitatively assess the
perception of these participants on the role of culture to Enterprise Systems
Success. This phase used open, axial and selective coding of the responses
obtained in a semi-structured interview.
The next phase of the research was to gather quantitative measures of
Organisational Culture and Enterprise Systems Success. The Organisational
Culture Assessment Inventory (OCAI) of Cameron and Quinn was selected to
gather quantitative data on Organisational Culture. The Enterprise Systems Success
instrument of Gable, Sedera and Chan was selected to measure the perception of
ESS because of its proven reliability and validity.
Each of these data sets were then analysed to determine if an association existed
between the cultures of organisations that achieved most success with the
Enterprise System as opposed to the culture types reported of organisations that
achieved the least success with the ES. These findings then assisted in the
development of a model of interaction between OC and ESS.
Finally, the relationship of OC to ESS was explored in a rich case study of one large
firm, to determine if the consultant’s reported relationships could be identified in the
subcultures of the organisation.
The key findings of this study were:
XII

Exploring the Relationship of Organisational Culture to Enterprise Systems Success
1. There was a relationship reported between culture type and success types.
The findings a-e below represent findings using the culture definitions from
Cameron & Quinn’s culture instrument:
a. clan cultures which emphasised the behaviours of development of others were related to reports of ESS
b. hierarchical cultures which emphasised the behaviours of control and
coordination were related to reports of ESS
c. hierarchical cultures which were poor in the execution of control and
coordination were related to reports of the least success with ES
d. market cultures which emphasised (internal) competitiveness were
strongly related to reports of least success with ES
e. literature attributes of continuous improvement (CI), flexibility (F) and
innovation (I), which are often described as antecedents to innovation
success and are found in the culture type of adhocracy, were reported as
strongly related to success of ES, but the culture type of adhocracy was
not reported as being present in the quantitative data describing
consultant experiences with enterprises which had implemented ES.
2. that the literature supported theoretical reasons for the above findings
3. that these patterns of association were found in the case study.
The research supports the proposition that there is a relationship between
Organisational Culture type and ESS. Certain culture types practice behaviours that
correspond to reported necessary behaviours for innovation success and ESS,
whilst other culture types practice behaviours that correspond to behaviours for
failure of innovation and of ES failure. A model of and explanation for this
relationship was proposed as a result of the findings. Future research is now
required to empirically test this model.
Keywords
Organisational culture, enterprise systems, enterprise systems success, measuring
organisational culture, measuring enterprise system success, ES, ES
implementation, information systems, multi-method research, erp,
XIII

Exploring the Relationship of Organisational Culture to Enterprise Systems Success
Statement of Original Authorship
This thesis is presented to fulfil the requirements for the award of the degree of
Doctor of Philosophy. The work contained in this thesis has not been previously
submitted for a degree or diploma at any other higher education institution. To the
best of my knowledge and belief, the thesis contains no material previously
published or written by another person except where due reference is made.
Signed:
Peter Birbeck
Date: 01/06/08
XIV

Exploring the Relationship of Organisational Culture to Enterprise Systems Success
XV
Acknowledgements
The researcher wishes to acknowledge SAP AG, SAP USA and SAP ANZ for their
interest in and support to this research project through the grant of an Australian
Post-graduate Industry Award PhD scholarship.
I would also like to express my thanks to my supervisory team for their support and
guidance throughout the journey that is the PhD. In particular I would like to
acknowledge the support of my principal supervisor, Associate Professor Glenn
Stewart and the support of my associate supervisors Professor Guy Gable and
Professor Christine Bruce.
I would also like to thank my advisory team of Dr Bob Smyth and Karen Stark for
assistance in research and literature issues.
I would like to acknowledge the research study participants, the various consultants
for their time and insight and participation in the study and of course the Case Study
organisation who generously agreed to be part of the study.
Finally I would like to thank the Faculty of IT at Queensland University of
Technology for their support, guidance, resource provision and providing the
opportunity to undertake the PhD.
For S and T

Exploring the Relationship of Organisational Culture to Enterprise Systems Success
Chapter 1
Introduction
Chapter 1: Introduction 1-1
Exploring the Relationship of Organisational Culture to Enterprise Systems Success
Table of Contents - Chapter 1 Introduction
1. Introduction.............................................................................................................1-3
1.1. Motivation for Conducting the Research ..........................................................1-3
1.2. The Research Object .......................................................................................1-8
1.3. Research Aims, Objectives & Outcomes .........................................................1-8
1.4. Research Significance and Importance ...........................................................1-9
1.5. Informing Theories .........................................................................................1-11
1.6. Research Design Summary ...........................................................................1-12
1.7. Research Design & Thesis Structure .............................................................1-19
Figures
Figure 1-1. The focal relationship.................................................................................. 1-8
Figure 1-2. Informing theories from the literature ........................................................ 1-11
Figure 1-3. Design summary ....................................................................................... 1-12
Figure 1-4. Elements of the initial phase of the research ............................................ 1-14
Figure 1-5. Early stages of the research cycle (adapted from
(Gorman & Clayton, 2005)......................................................................... 1-16
Figure 1-6. All elements of the design incorporating chapter numbers ....................... 1-19
Tables
Table 1-1. Criteria for case studies (adapted from Yin, 1994)..................................... 1-18
Chapter 1: Introduction 1-2

Exploring the Relationship of Organisational Culture to Enterprise Systems Success
1. Introduction
Information Systems (IS) research has been defined as ‘the systematic investigation
of the development, operation, use and/or impact of an Information System in an
organisational environment’ (Ives, Hamilton & Davis, 1980). An Enterprise System is
a commercial package integrated Information System which brings significant
change to organisations business processes, ways of working and workflows, in
addition to often requiring high investment in upgrades to IT hardware infrastructure
(Bancroft, Seip & Sprengel, 1998; Baskerville & Myers, 2002; Bingi, Sharma &
Godla, 1999; Brady, Monk & Wagner, 2001; Garrity & Sanders, 1998; Karahanna-
Evaristo, Straub & Chervany, 1999; Markus & Tanis, 2000; Parr & Shanks, 2000).
Enterprise Systems research has viewed implementations as socio-technical
processes which involve significant change in organisational processes, structures
and tasks. In addition, these packaged solutions are often accompanied by radical
shifts in technology. Research into similar significant changes has reported that
success was dependant upon culture, leadership, top management support and
user support.
Organisational culture is defined in many ways, and its definitions will be explored in
greater detail in the literature review. Organisational Culture has been defined as
‘the shared meanings – patterns of belief, symbols, rituals and myths that evolve
across time and that function as social glue’ (Smircich, 1983). It is the ‘pattern of
shared values and beliefs that help individuals understand organisational functioning
and thus provide them with the norms for behaviour in the organisation’
(Deshpande, Farley & Webster, 1993). Organisational Culture is the medium within
which organisational artefacts, functions and structures are embedded (Deetz, Tracy
& Simpson, 2000); it is the organisational glue. Organisational Culture establishes
the norms, values and beliefs that govern employee behaviour (Cooke & Rousseau,
1988; Schein, 1996) and Organisational Culture has been shown to influence
change and the rate of change within organisations (Hannan & Carroll, 2003).
This PhD study’s cultural focus is Organisational Culture.
1.1. Motivation for Conducting the Research
Enterprise Systems are organisation-wide Information Systems that bring
substantial changes to an organisation’s software platform, hardware infrastructure,
Chapter 1: Introduction 1-3
Exploring the Relationship of Organisational Culture to Enterprise Systems Success
methods of working and information flows. The investment required in ES by an
organisation is large, costing organisations much in time, money and effort, and
failure is not unusual, with 45% reporting no additional business benefits.
ES have been adopted by over 60% of Fortune 500 companies in the USA (SAP,
2003). In Australia, the majority of state and federal government agencies has
installed ES, with SAP R/3, Oracle, PeopleSoft and Mincom being most numerous.
SAP is the largest vendor having secured the greater majority of market share both
here in Australia and internationally. The market for Enterprise Resource Planning
(ERP) packages has seen substantial growth, the global market is currently worth
US$21 billion, with revenues of SAP alone, rising to US$9.2 billion in 2005
(Hamerman & Wang, 2005).
These commercial IS are designed to provide ‘seamless integration of all
information flowing throughout a company’ (Davenport, 1998). There are many
benefits that an organisation can, in theory, expect to achieve through a successful
implementation of an ES. Shang & Seddon (2002) categorise these as: Operational
benefits, Managerial benefits, Strategic benefits, IT Infrastructure benefits and
Organisational benefits.
However, despite the potential benefits many organisations have reported less than
satisfactory experiences with ES. For example, Foxmeyer went bankrupt in 1996
after attempting to implement SAP for over three years (Kalakota and Robinson,
1999). Unisource Worldwide Ltd and Dell Computer Corporation have both written
off significant amounts invested in aborted SAP implementations (Bingi et al., 1999).
Other worldwide brands have very publicly cited their failed implementations:
Whirlpool and Gore-Tex blasted SAP and PeopleSoft in separate front page articles
in Wall Street Journal articles, and Hershey Food Corp criticised its ES vendor SAP
for order processing problems (Calogero, 2000). Several researchers have also
found empirical evidence to support problems with ES. Wood and Caldas (2000)
found low levels of satisfaction in their survey of firms that had actually implemented
ES, with 45% of firms perceiving no improvements whatsoever from implementation
and 43% claiming no cycle reduction.
Since the majority of the world’s largest companies have now installed ES, the
vendors have sought to maintain revenue streams through extending the capabilities
of the ES. During the past five years, the majority of vendor and implementation
partner sales revenue has been generated through system upgrades and the selling
Chapter 1: Introduction 1-4

Exploring the Relationship of Organisational Culture to Enterprise Systems Success
of additional system components, to their existing customer base. These extensions
to the ES include:
• Web Portals
Portals seek to provide users a single unified view of key information and
applications that span the entire enterprise (SAP, 2004).
• Customer Relationship Management (CRM) modules
Evolving out of traditional marketing concepts, CRM is a business strategy
that goes beyond increasing transaction volume (Gray, 2001). The objectives
of CRM are to increase profitability, revenue, and customer satisfaction. To
achieve more effective customer relationships, a company-wide set of tools,
technologies and procedures promote the relationship with the customer to
increase sales (The Sweeney Group, 2000).
• Business Analytics
These are applications that allow the business to use statistical data analysis
to drive fact-based decisions about the business. The techniques involve
data and text mining, forecasting, econometrics and modeling (Oracle,
2006). These applications include Decision Support Systems (DSS),
Management Information Systems (MIS) and EIS (Executive Information
Systems).
However, even as ES are maturing and evolving, problems with upgrades, modules,
integration and extensions continue to be documented. The technology keeps
improving, hardware and computer processing power increases, software becomes
more sophisticated and capable yet organisations still experience significant
problems with these IT innovations. Client firms have no choice but to continue
developing their ES as the costs to uninstall or remove the system are prohibitive.
Others report difficulties with failed upgrades and unsatisfactory overall system
performance with the ES simply not meeting the organisation’s needs.
Questions therefore arise as to what are the reasons for these failures? What
factors are influencing the success or failure of ES? What is the relationship
between an ES and the organisation that is using the innovation? Why are some
organisations successful whilst superficially similar organisations less successful
with their ES?
Chapter 1: Introduction 1-5

Exploring the Relationship of Organisational Culture to Enterprise Systems Success
Some suggested factors are project team configuration, executive support and
change management (Bancroft et al., 1998).
Debate in the literature has suggested that there may be several factors that
influence the success of an ES, and whilst no universal consensus has been
reached, some researchers have however attempted to capture some of the factors.
For example (Bancroft et al., 1998) presents nine critical success factors that
emerge from case studies into SAP R/3 implementations:
1. Understand your corporate culture in terms of readiness and capability for
change
2. Begin business process changes prior to implementation. Make the hard
decisions early and stick to them
3. Communicate continuously with all levels of new users in business, not
technical terms. Set reasonable expectations. Then communicate again
4. Provide superior executive championship for the project
5. Ensure the project manager is capable of negotiating equally between the
technical, business and change management requirements
6. Choose a balanced (IS and business) team and provide it with clear role
definitions. Expect to shift to non-traditional roles
7. Select a good project methodology with measurements
8. Train users and provide support for job changes, don't forget to train the
project team
9. Expect problems to arise: commit to the change
Organisational Culture has also been shown in many studies to significantly
influence processes operating within organisations (Cameron & Quinn, 1999;
Cooper, 1994; Denison, 2001; Gregory, 1983; Hofstede, 1998; Rokeach, 1972;
Schein, 1985; Smircich, 1983; Yeung, Brockbank & Ulrich, 1991). Elements of
Organisational Culture also influence the manner in which technology is accepted by
an organisation (Davis, Bagozzi & Warshaw, 1989). The social character of an
organisation’s peer (employee) network affects the rate at which an IT innovation
diffuses throughout an organisation (Rogers, 1995).
Ettlie (1998) observed that Organisational Culture may be a barrier to
implementation success as culture bounds organisational change.
Chapter 1: Introduction 1-6
Exploring the Relationship of Organisational Culture to Enterprise Systems Success
Kampmeier (1998), Scheider (1999) and Capron & Kuiper (1998) observed that
ERP failures may be related to lack of attention to Organisational Culture.
Finally, Fisher (1997) observed that avoidance of failure in risk averse or risk neutral
cultures leads to learned helplessness and thus may have contributed to failed
implementations.
We therefore suggest that Enterprise Systems Success will be influenced in some
way by Organisational Culture. The PhD study focuses upon the relationship
between Organisational Culture and the success of the Enterprise System.
Identifying the nature of the relationship between Organisational Culture and IT
innovations will provide significant benefits to both industry and the research
community as it may surface barriers and enablers to success.
Chapter 1: Introduction 1-7

Exploring the Relationship of Organisational Culture to Enterprise Systems Success
1.2. The Research Object
The research object in this study was the relationship between Organisational
Culture and Enterprise Systems Success.
The study seeks to explore this relationship in order to help inform on the manner in
which organisations interact with their IT innovations and what the role of
Organisational Culture may be in this relationship.
Figure 1-1 below shows the focus of the study.
Organisational Culture
Enterprise System SuccessRelationship
The research object: Studying the relationship
Figure 1-1. The focal relationship
The next section discusses the goals of the research study.
1.3. Research Aims, Objectives & Outcomes
The PhD research aims and objectives were as follows:
The aim of this research was to explore the relationship between Organisational
Culture and Enterprise Systems Success. Enterprise Systems are examples of IT
Innovations; Enterprise Systems once implemented may be considered more or less
successful than originally anticipated, and so while success may be relative, the
study sought to explore the nature of the relationship of OC to the ES success.
The objectives of this research were to model the relationship between
Organisational Culture and Enterprise System Success.
This objective was achieved through the following methods:
1. A multi-method study of a representative sample of 20 stakeholders taken
across public and private industry, drawn from vendor, client and
implementation partner organisational settings using both qualitative and
Chapter 1: Introduction 1-8

Exploring the Relationship of Organisational Culture to Enterprise Systems Success
quantitative techniques, based on established instruments for measuring
culture and Enterprise Systems Success.
2. A revelatory case study in an organisation applying quantitative and
qualitative methods
3. A cross case analysis comparing and contrasting the findings from the
consultants, the organisational study and the literature.
The key outcome was an operant model of the Organisational Culture – Enterprise
System Success relationship.
This research is focused in the domain of Enterprise Systems and their extensions
since:
• the major source of IT investment occurring is now into the extended ES field
• failure of large system installations continue to be reported
• the scope of the research is focused upon Organisational Culture
• the study is framed within Australia, so national culture issues do not apply in
this study, study of national culture was outside the scope of the research.
1.4. Research Significance and Importance
This research has developed a model that describes the relationship between
organisational culture and Enterprise System success.
As early as 1993 researchers in the IS field had identified that future IS researchers
needed to place greater emphasis on research on the relationship between IS
related processes and the organisational environment (Cheon, Grover & Sabherwal,
1993). Several researchers have attempted to define the role that culture plays in
the use of an Information System (Cooper, 1994; Ishman, 1998; Krumbholz &
Maiden, 2001; Lau, Wong, Chan & Law, 2001) and these studies suggest that
Organisational Culture impacts upon Information Systems (Davenport, 1998;
Murphy & Simon, 2002; Myers & Tan, 2002). Yet, despite existing theory providing
clues and possible explanations into the role that OC could or may play, no research
to date has categorically been able to demonstrate how OC interacts with ESS.
Leidner & Kayworth (2006) conducted an extensive literature review in an attempt to
arrive at some meaningful propositions. The authors concluded that there were
many challenges facing researchers into the area, not least caused by the
complexity of the OC phenomenon. These complexities involve disagreements
Chapter 1: Introduction 1-9

Exploring the Relationship of Organisational Culture to Enterprise Systems Success
amongst researchers across a range of issues including such fundamental concepts
as how to define OC, what level of culture to study and how to measure culture.
And yet, whilst indicating that culture does play a role, all the research to date fails
to identify ‘how’ culture affects these unique IT innovations. This exploratory PhD
research study has sought to address this gap, therefore representing a unique
contribution to knowledge.
There is currently no model describing the role of Organisational Culture either in IT
innovations or its operation in extended Enterprise Systems. Therefore this research
has contributed new knowledge through the development of a model of the
relationship of Organisational Culture to Enterprise Systems Success.
The research has made a significant contribution to the body of knowledge in that it
is the first to explore the Organisational Culture – Enterprise System Success
relationship. This study has shown that such a relationship exists and has identified
key elements of that relationship. The work will now continue to build testable
hypothesis and to further develop and test the model that has been developed.
Chapter 1: Introduction 1-10

Exploring the Relationship of Organisational Culture to Enterprise Systems Success
Chapter 1: Introduction 1-11
1.5. Informing Theories
The research builds upon several existing models and theories, including the
Technology Acceptance Model (Davis, 1989; Davis et al., 1989), Theory of
Reasoned Action (Fishbein & Ajzen, 1975), Diffusion of Innovation Theory (Rogers,
1962), Information System Success Models (DeLone & McLean, 1992, 2003), the
ES Success Measurement Model (Gable, Sedera & Chan, 2003) and various
models of Organisational Culture. These models and instruments, identified in the
literature review, have been validated and tested for reliability by many researchers
and are underpinned by many empirically strong studies. Themes present in the
literature suggest that these models capture the important constructs and
successfully described the phenomenon that they purport to explain. In summary,
the key informing theories from the literature are illustrated below:
Figure 1-2. Informing theories from the literature
The primary research goal was to explore and ultimately model the relationship
between Organisational Culture and IT innovations in the context of Enterprise
Systems. An IT innovation could be deemed to be successful or not successful, in
terms of it meeting the client organisations’ needs. In the context of ES and their
extensions, a measure of the success of the innovation would be Enterprise System
Success. The literature review chapter presents a discussion on the definitions of IS
success, what is success and how to measure success of an IS. Being able to
measure ESS will assist in answering the higher research question of the
relationship of Organisational Culture and IT innovations.
This PhD study also suggested new factors not yet identified that may influence the
success of an ES.
ES SuccessERP
Organisational Culture
Technology Acceptance
& Diffusion of Innovation

Exploring the Relationship of Organisational Culture to Enterprise Systems Success
Chapter 1: Introduction 1-12
1.6. Research Design Summary
The research design was driven by the primary research questions shown below:
RQ1. What is the relationship between OC and ESS?
Once this had been established key derived sub-questions were:
RQ1.1. How can this relationship be explored?
RQ1.2. Who can inform on the OC-ESS relationship?
RQ1.3. What data will need to be gathered?
RQ1.4. How will the data be collected?
The answers to these questions were used to drive the design of the study. The
third chapter discusses the research design in detail giving the rationale and
background justifications as to why certain design decisions were made. The design
development itself took many months of effort, revision, development and adaptation
before a suitably robust and strong design was completed. The overall final study
design is summarised in the figure below, whilst each of the study components is
discussed briefly in the next sections.
Figure 1-3. Design summary
Early data analysis during a study has been shown to assist the researcher in
refinement of the design. The approach can be refined as the research progresses
Cross-Case Analysis
Revelatory Case Study
Case Study Qualitative Interviews
Case Study Quantitative
Survey
+
Consultant Qualitative Interviews
Consultant Quantitative
Survey
+
Main Study
Pilot Study
Consultant Qualitative Interviews
Consultant Quantitative
Survey
+
Study Design
Research Aims Literature Review Study Design Document

Exploring the Relationship of Organisational Culture to Enterprise Systems Success
and lessons are learnt (Miles & Huberman, 1994), and this approach was adopted.
Literature had indicated that by commencing data analysis early and by providing
periods of review and reflection throughout the study, the design could evolve as the
data was collected. To allow this refinement of the design, clear periods of review
and reflection were purposefully incorporated into the study. The design, protocols
and methods were modified as the experience of the researcher improved until a
final robust design was completed.
In summary, the key learning’s from these early stages were:
1. the need to conduct a pilot study
2. the need to explore the broadest possible range of experiences of the OC-
ESS relationship
3. the need to identify those who could inform on the relationship
4. the separation of the consultants into implementation, partner and vendor
categories.
We shall now take each of these design elements in turn to understand how the
study was developed. The first phase involved identifying how to explore the OC-
ESS relationship; this was the first research sub-question to be addressed.
1.6.1. Research Design Summary: Early Design Phase
Research Aims Study Design
Pilot Study
Cross Case
Analysis Revelatory
Case Study
Main Study
The design phase sought to address the key study sub-question, namely:
RQ1.1. How can the OC-ESS relationship be explored?
Due to the complexity of this relationship, the social nature of the problem and the
components themselves, it was concluded that a rich understanding of the
relationship was needed to fully investigate the problem. The first step in answering
the research question was to identify at the highest level, which research approach
was most appropriate to study the OC-ESS relationship. The design phase of the
study is shown in figure 1-4 overleaf.
Chapter 1: Introduction 1-13

Exploring the Relationship of Organisational Culture to Enterprise Systems Success
Primary Research Question
Lit Review Study Aims Objectives
Study Design
Document
Form Context Frame
Plan Study
Identify Research Method
Design Interview Protocols
Identify Target Organisations
Develop Field Procedures
Outputs
RQ1.1. How can we explore OC-ESS relationship?
RQ1.2. Who can inform on the OC-ESS relationship?
RQ1.4. How will the data be collected?
RQ1.3. What data will need to be gathered?
Figure 1-4. Elements of the initial phase of the research
The early design phase identified the need to select a multi-method approach,
incorporating both a qualitative sub-study and a quantitative sub-study. These
studies were then to be validated in a case study.
Multi-method research approaches have frequently been recommended for
exploratory research studies. Qualitative data can be gathered for discovery,
exploration and building hypothesis building, these hypothesis can later be studied
using quantitative methods (Miles & Huberman, 1994).
A review of the Organisational Culture literature had indicated that OC could be
studied by either quantitative methods (Cooke, Rousseau & Lafferty, 1988; Denison,
1996; Hofstede, 1980; Hooijberg, 1996; Trompenaars, 1998), or qualitative methods
(Alasuutari, 1995; Ashkanasy, Wilderom & Peterson, 2000; Langan-Fox & Tan,
1997; Reissner, 2005; Sackmann, 2001; Silvester, Anderson & Patterson, 1999).
But many researchers had suggested that OC could and should be studied by both
methods (Hofstede, 1990; Schein, 1997; Yauch & Steudel, 2003).
The IS literature also demonstrated support for the use of multi-method research, for
example Galliers (1993, 1991) used survey and case study, Landry & Banville
(1992) studied MIS via interview and survey, Orlikowski (1993) studied systems
development through interview and study, and Gable (1994) recommended case
study and survey for IS research. Others include Trauth & Jessup (2000) who used
positivist and interpretivist methods to investigate group support systems (GSS),
Markus (1994) who studied email use via survey and questionnaire, and Kaplan
Chapter 1: Introduction 1-14

Exploring the Relationship of Organisational Culture to Enterprise Systems Success
(c2006) who used both qualitative and quantitative methods for IS research in the
healthcare industry.
There was very strong support from both research fields for using a multi-method
approach in this study since:
1. different research methods generate different information about different
aspects of the world (Mingers, 2001a). This was needed in order to fully
explore the nature of the OC-ESS relationship
2. combining research methods can yield richer and more reliable research
results (Mingers, 2001b). Richness of the data was sought so as to explore
the dimensions of the relationship
3. multi-method has been used successfully in both OC and IS studies.
It was therefore identified that a multi-method approach was both feasible and
desirable for the study into OC and ESS.
The need for a pilot study to test aspects of the study design, including the
qualitative protocols and the quantitative instruments was also identified. Pilot
studies can be used to test ideas or methods or to explore the implications of the
methods (Maxwell, 2005). The next section discusses the pilot study elements.
1.6.2. Research Design Summary: Pilot Study
Pilot Study Cross Case
Analysis
Research Aims Literature Review
Study Design
Main Study
Revelatory
Case Study
The pilot itself can be used to learn about the research process, interview schedule,
observation techniques and the researcher themself (Gorman & Clayton, 2005).
Other authors have argued that their research design would not have been finalised
without some form of exploratory pilot research prior to the main phase (Light,
Singer & Willett, 1990). They recommended that a pilot study should be carried out if
any aspect of the design needs clarification or exploration.
The figure below illustrates the early research circle.
Chapter 1: Introduction 1-15
Exploring the Relationship of Organisational Culture to Enterprise Systems Success
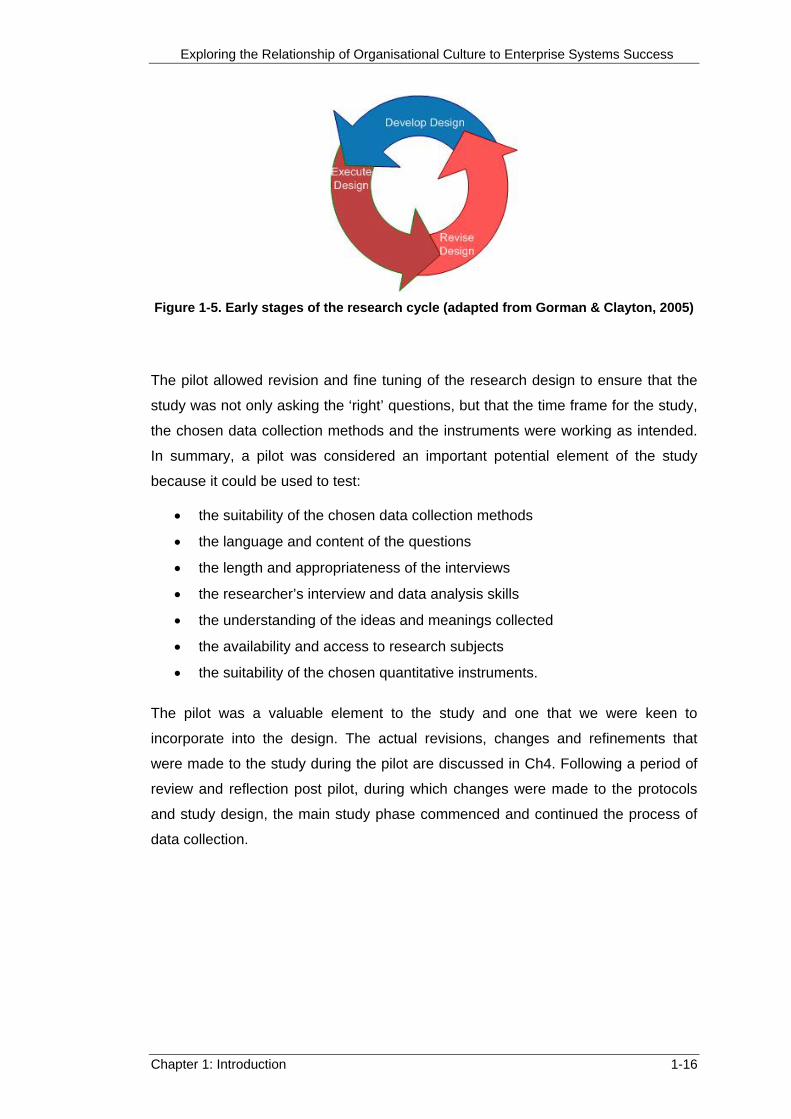
Figure 1-5. Early stages of the research cycle (adapted from Gorman & Clayton, 2005)
The pilot allowed revision and fine tuning of the research design to ensure that the
study was not only asking the ‘right’ questions, but that the time frame for the study,
the chosen data collection methods and the instruments were working as intended.
In summary, a pilot was considered an important potential element of the study
because it could be used to test:
• the suitability of the chosen data collection methods
• the language and content of the questions
• the length and appropriateness of the interviews
• the researcher’s interview and data analysis skills
• the understanding of the ideas and meanings collected
• the availability and access to research subjects
• the suitability of the chosen quantitative instruments. The pilot was a valuable element to the study and one that we were keen to
incorporate into the design. The actual revisions, changes and refinements that
were made to the study during the pilot are discussed in Ch4. Following a period of
review and reflection post pilot, during which changes were made to the protocols
and study design, the main study phase commenced and continued the process of
data collection.
Chapter 1: Introduction 1-16

Exploring the Relationship of Organisational Culture to Enterprise Systems Success
1.6.3. Research Design Summary: Main Study
Pilot Study
Cross Case
Analysis
Revelatory Case Study
Research Aims Literature Review
Study Design
Main Study
The purpose of the main study, following the pilot study, was to continue the
collection of data from the participants. The aim of the main study was to continue
gathering sufficient data in order to fully explore the OC-ESS relationship. The target
number of interviews in the main study was 15, which would bring the total number
of interviews carried out in the study to 20. In reviewing the literature both Yin (1994)
and Miles & Huberman (1994) suggested that dependent upon the level of detail in
the data, 15 to 20 interviews represented a good balance between data richness
and manageability.
A technique useful for investigating ‘real world’ problems is the case study. The next
design element to be considered is the case study which formed an important
component of the study and was incorporated into the design for a number of
reasons. The details and rationale for its inclusion is discussed in this section.
1.6.4. Research Design Summary: Case Study
Research Aims Literature Review
Study Design
Revelatory Case Study
Main Study
Cross Case
Analysis
Pilot Study
A case study has been defined as ‘an empirical enquiry that investigates a
contemporary phenomenon within its real life context, especially when the
boundaries between phenomenon and context are not clearly evident’ (Yin,
1994).
Taking these characteristics in turn we can see that the OC-ESS investigation meets
the case study requirements, i.e.
1. contemporary phenomenon – the study seeks to investigate a phenomenon
that is happening in the present.
Chapter 1: Introduction 1-17

Exploring the Relationship of Organisational Culture to Enterprise Systems Success
2. real life context – the OC-ESS is a phenomenon that is occurring in
organisations at the present. It is not a problem that can be studied by
experimentation in a laboratory.
3. boundaries between phenomenon and context are not clearly evident – the
nature of the OC-ESS relationship is not fully known. The boundaries and
interactions are not clear.
Case studies themselves have certain characteristics, these characteristics can be
used to help understand what a case study is, but also to identify whether a case
study is suitable for a particular study. Benbasat, Goldstein & Mead (1987) had
identified eleven key characteristics of case studies.
The table below applies these characteristics to their appropriateness for the PhD
study.
Key Characteristic of Case Study Suitability in the OC-ESS Study 1. Phenomenon is examined in a natural setting We wished to explore the OC-ESS in the real world,
the results of research to have practical implications for industry.
2. Data is collected by multiple means Multi-method has already been identified as suitable for this research problem. Both qualitative and quantitative data was needed.
3. One or few entities are examined The two OC and ESS dimensions were examined
4. The complexity of the unit is studied intensively. An opportunity was available to spend some considerable time with an organisation in researching the OC-ESS.
5. Case studies are more suitable for the exploration, classification and the hypothesis development stages of the knowledge building process. The investigator should have a receptive attitude towards exploration.
This research is an exploratory study, the problem is complex and needed to be fully explored prior to hypotheses’ development.
6. No experimental controls or manipulation are involved
Not able to control for Organisation Culture
7. The investigator may not specify the set of independent and dependent variables in advance.
Since the research was exploratory, no variable could be set in advance
8. The results derived depend heavily on the integrative powers of the investigator.
Qualitative research methods are heavily dependent on the interviewer as part of the investigation.
9. Changes in site selection and data collection methods could take place as the investigator develops new hypotheses.
Periods of review and reflection were made available to evolve the study. The study was designed to be flexible in the early stages.
10. Case research is useful in the study of ‘why’ and ‘how’ questions because these deal with operational links to be traced over time rather than with frequency or incidence.
The study of OC-ESS is a ‘how’ question, i.e. how does OC interact with ESS?
11. The focus is on contemporary events. The events are current and the study wanted to focus on current, ongoing ES innovations.
Table 1-1. Criteria for case studies (Benbasat, Goldstein & Mead (1987) adapted from Yin, 1994)
Chapter 1: Introduction 1-18

Exploring the Relationship of Organisational Culture to Enterprise Systems Success
These characteristics of a case study are aligned with both the objectives of the
study and the nature of the problem. We can see that in the OC-ESS study, which
sought to investigate the problem in its natural setting, to build hypothesis and
examine using multiple means, a case study would be a very desirable element.
1.7. Research Design & Thesis Structure
The research method identified that a multi-method approach incorporating pilot and
case study components would allow full exploration of the OC-ESS relationship. The
thesis itself reports on these individual components in the following manner: This
study design summary section has provided an overview of the major components
in the finalised study design.
Cross Case Analysis
Future Research Contributions
Findings, Model & Outcomes
Conclusions
Chapter 1 - 4
Chapter 5 + 6: The Consultants’ Story
Chapter 8
Chapter 7: Case Study
Revelatory Case Study
Main Study
Pilot Study
Research Aims Literature Review
Study Design
Chapter 9
Figure 1-6. All elements of the design incorporating chapter numbers
The next chapter is ‘Chapter 2: The Literature Review’. This chapter reviews and
discusses the theories identified during the literature review phase of the study
suggesting clues to what might be occurring in the OC-ESS relationship. The
literature review covered research methodologies, Organisational Culture,
Enterprise Systems, ESS, Technology Acceptance and Innovation Diffusion
theories. Findings in the literature guided the study design, qualitative research
methods and quantitative instrument selection.
Chapter 1: Introduction 1-19

Exploring the Relationship of Organisational Culture to Enterprise Systems Success
Chapter 2
Literature Review: Measuring ES Success
Chapter 2: Literature Review Part A 2-1

Exploring the Relationship of Organisational Culture to Enterprise Systems Success
Table of Contents – Chapter 2 Literature Review: Measuring ES Success
Chapter 2........................................................................................................................2-1
Literature Review: Measuring ES Success ....................................................................2-1
2.1. Introduction: Informing Theories ................................................................2-3
2.2. Enterprise Systems....................................................................................2-5
2.3. Enterprise System Success .......................................................................2-9
2.4. Measuring ES Success............................................................................2-16
2.5. Summary..................................................................................................2-19
Figures
Figure 2-1. Reference disciplines framing the study ............................................2-3
Figure 2-2. Information and material flows in a business process model (adapted Monk & Wagner, 2006).........................................................................................2-7
Figure 2-3. Information flows along the value chain .............................................2-7
Figure 2-4. Vendors of Enterprise Systems and their products............................2-8
Figure 2-5. IS Success Model (DeLone & McLean, 1992) ...................................2-9
Figure 2-6. A re-specification of the DeLone & McLean model ..........................2-10
Figure 2-7. An updated model of IS Success (Garrity & Sanders, 1998) ...........2-12
Figure 2-8. Determinants of users' expectations (Pitt et al., 1995).....................2-13
Figure 2-9. Updated IS Success model (DeLone & McLean, 2003)...................2-13
Figure 2-10. ES Success model (Sedera et al., 2004) .......................................2-17
Tables
Table 2-1. Sources of information ........................................................................2-4
Table 2-2. ERP characteristics (Gartner Group Inc, 1990)...................................2-5
Table 2-3. Users of Enterprise Systems.............................................................2-11
Chapter 2: Literature Review Part A 2-2

Exploring the Relationship of Organisational Culture to Enterprise Systems Success
2.1. Introduction: Informing Theories
This chapter discusses the findings in the literature. The purpose of the literature
review was to identify key theories in order to create a theoretical base upon which
to position the study.
The literature contained many clues as to what may be happening in the OC-ESS
relationship. Whilst the literature does not provide definitive answers as to ‘how’ OC
interacts with ESS, it does nevertheless suggest possible points of interaction.
As shown in the first chapter, three distinct research areas were identified in the
literature as potentially informing on the OC-ESS relationship.
Enterprise System Success literature informs on how ES success is measured, possible inhibitors/enablers to success and ‘what’ is success in an ES context
ERP/ES literature is used to define the characteristics of an ES, how organisations use them and the evolution of ES into their current form
II ERP/ES/
ES Success
I Organisational Culture
Clues to the interaction between OC-ESS may be found at this point
III Diffusion of Innovation,
TAM
The study is informed on the theories intersecting at this point
OC literature informs on what is OC, how it is measured and how OC manifests itself in an organisation
Diffusion of Innovation Theory informs on how IT innovations are diffused throughout an organisation
The Technology Acceptance Model informs on how the innovations are adopted and accepted by organisations
Figure 2-1. Reference disciplines framing the study
In order to underpin the study with the most rigorous and validated theories, the
literature review concentrated its efforts on the top tier journal, top tier conference
publications and seminal texts. The three areas of the research are all reasonably
sized in terms of the number of publications available in the three areas, none of the
fields are particularly small and so finding publications was not an issue. A
conscious decision was therefore made to select the highest quality papers that
were representative of the actual field itself. Selecting representative publications
from the top tier journals ensured that research decisions made based on the
literature findings could be better defended whilst at the same time helping to build a
Chapter 2: Literature Review Part A 2-3

Exploring the Relationship of Organisational Culture to Enterprise Systems Success
more robust, stronger research design. The majority of the literature was taken from
the following journals:
Top IS Journals Top Business Journals
MIS Quarterly Management Science
European Journal of Information
Systems
Academy of Management
Journal
Communications of the AIS Administrative Science Quarterly
IS Research Harvard Business Review
JAIS Academy of Management
Review
Information & Management Strategic Management Journal
Journal of Strategic IS Organisational Science
Journal of Information
Technology
Table 2-1. Sources of information
The readings from the above journals (and their associated conferences) formed the
backbone of the literature review.
The first area to be reviewed in detail is the ERP/ES literature. The purpose of this
section of the literature review was to identify the nature of ES, their historical
development and the unique characteristics of these ERP’s. This is followed by a
review of Enterprise Systems Success. The purpose of this section is to identify
relevant theories of success and measures of success. Next follows a section on
technology acceptance, as the adoption, implementation and use of an Information
System is a form of technology acceptance. This is followed by a discussion on how
TAM and Organisation Culture are related.
This literature review closes with a section on technology diffusion that discusses
the manner in which IT innovations have been found to permeate into an
organisation.
Chapter 2: Literature Review Part A 2-4

Exploring the Relationship of Organisational Culture to Enterprise Systems Success
2.2. Enterprise Systems
ERP systems evolved out of Materials Requirements Planning (MRP) software from
the 1960s and 1970s; in essence MRP packages were simple inventory systems.
MRP functions were handled by mainframe computers allowing Electronic Data
Interchange (EDI) to handle the purchasing process automatically (Brady, Monk &
Wagner, 2001). EDI also allowed the manufacturer and supplier to predict and
manage their production schedules in tandem leading to the introduction of supply
chain management concepts.
Organisations and vendors quickly realised that the supply chain was not the only
function with which the software could assist. A successful business generally has
similar functions to its successful competitors. MRP developers realised that generic
software could be applied to different organisations since most organisations have
common functions and activities, revolving around finance, HR and manufacturing.
The MRP vendors started to develop integrated systems that processed the data in
real time and allowed users to view the same data whether they were in the
marketing, production or payroll department. These integrated systems became
known as Enterprise Resource Planning systems (ERP’s) and later Enterprise
Systems. A checklist for whether a piece of software can be considered an ERP
(Gartner Group Inc, 1990) is shown below:
Table 2-2. ERP characteristics (Gartner Group Inc, 1990)
Chapter 2: Literature Review Part A 2-5

Exploring the Relationship of Organisational Culture to Enterprise Systems Success
In the early 1990s computing power was increasing rapidly and software vendors
were keen to exploit the new power available to them, so the MRP and MRPII
packages shifted from predominantly manufacturing and supplier based systems to
organisation-wide IS. Vendors developed modules that sought to address the
functional needs of the entire business in an integrated manner. These MRP
packages evolved into ERP’s and ES that spanned across multiple functional
boundaries within an organisation. These ERP’s have been defined as a packaged
business software system that allows a company to:
1. automate and integrate the majority of its business processes
2. share common data and practices across the entire enterprise
3. produce and access information in a real time environment (Deloitte
Consulting, 1999).
ERP’s are examples of large complex Information Systems that cross functional
departmental boundaries integrating horizontally and vertically throughout an
organisation (Bingi, Sharma & Godla, 1999; Brady et al., 2001; Parr & Shanks,
2000; Ross & Vitale, 2000; Umble, Haft & Umble, 2003). Evolving out of the ERP
term – to indicate that these integrated systems were not just about resource
management – came the term Enterprise Systems, defined as ‘an off-the-shelf
package that provides an integrated suite of applications which provide transaction
processing and management Information Systems for the common core of business
processes found in accounting, human resource management, manufacturing and
sales and distribution’ (Hernandez, 1999).
ERP solutions exist for finance, marketing, human resources, payroll, accounting
and supply chain management, all interconnected to ideally create a seamless
environment for information sharing (Bernard, 2004). Most large enterprises have an
Enterprise System, indeed by as early as 1998, SAP sales have been made to 60%
of Fortune 500 companies including seven out of the top ten pharmaceutical and
petroleum companies (Kumar & van Hillegersberg, 2000). The ERP software allows
these very large enterprises to effectively coordinate information across all their
business areas, information can flow across the organisation via its business
processes (Monk & Wagner, 2006).
Chapter 2: Literature Review Part A 2-6

Exploring the Relationship of Organisational Culture to Enterprise Systems Success
Manufacturing
Sup
plie
rs
Cus
tom
ers
Marketing & Sales
Finance &Accounting
Procurement Logistics
Top Management
AccountsPayable
AccountsReceivable
Information Flow
Material & Product Flow
Figure 2-2. Information and material flows in a business process model (adapted Monk & Wagner, 2006)
Since organisations are not isolated entities, interacting with both their suppliers and
buyers, vendors have been seeking to extend their ES to support the whole supply
chain. This can extend the benefits of sharing information not just intra-
organisational but inter-organisationally, i.e. suppliers and buyers sharing
information.
Retail Outlet Consumer
Information Flows
ProductionSupplier Distribution
Figure 2-3. Information flows along the value chain
Chapter 2: Literature Review Part A 2-7

Exploring the Relationship of Organisational Culture to Enterprise Systems Success
The ES vendor market is dominated by a few key players. The major software
vendors and their products offerings (2006) are shown below:
Oracle
Mincom
Navision
Great Plains Solomon
Axapta (SCM)
SAP R/3
SAP ‘All-in-One’
mySAP
E-Business Suite
JD Edwards Enterprise One
Siebel
PeopleSoft
SAP ‘Business One’
Ellipse
SSA Global Baan
SAP
Microsoft
Business Solutions
SSA Global Suite
MS CRM MS SCM
Figure 2-4. Vendors of Enterprise Systems and their products
The next section identifies themes relating to the success of these IS within
organisations.
Chapter 2: Literature Review Part A 2-8
Exploring the Relationship of Organisational Culture to Enterprise Systems Success
2.3. Enterprise System Success
It was important to the study to have a clearly defined understanding of ESS, to
understand how success was defined and how success (or failure) could be
measured. Only through fully understanding the nature of ES ‘Success’ could the
relationship between ESS and OC be properly studied. This first section of the
literature review therefore sought to identify and learn from research into ESS.
Some researchers have sought to investigate how to evaluate an IS (of which ES
are examples) from a business manager’s perspective (Shang & Seddon, 2002) and
identified that different stakeholders and users may have very different system
needs and subsequent perceptions of what the system means to them. Success can
be referenced against many criterion, including the stated goals of the organisation,
past performance, financial measurement or on-time delivery (Markus & Tanis,
2000).
Several models have been proposed that describe dimensions of system success.
However, the most frequently cited model is the IS Success model (DeLone &
McLean, 1992). This model is highly influential in the field underpinning many of the
models. The IS Success (DeLone & McLean, 1992) model is shown below:
Figure 2-5. IS Success Model (DeLone & McLean, 1992)
DeLone and McLean developed the model following a review of 180 empirical
studies. The studies were then organised according to dimensions of the taxonomy.
The dimensions were subsequently drawn together to present the above descriptive
Chapter 2: Literature Review Part A 2-9

Exploring the Relationship of Organisational Culture to Enterprise Systems Success
model of IS Success. The authors then presented researchers with a challenge to
validate the model through empirical research. Indeed, many researchers took up
the challenge with over 200 papers reviewing, exploring and testing the original
model.
Some researchers have viewed the model with a critical eye. One paper questions
the inclusion of ‘system use’ as a success variable in a causal model (Seddon,
1997). Seddon argues that ‘use’ precedes impacts and benefits, but it does not
cause them, and that the critical factor for IS Success measurement is not system
‘use’ but that net benefits should flow from use. Seddon considers that the original
IS Success model attempted to combine both process and causal explanations of IS
Success in the one model, an approach that is flawed. Seddon proposed a
redefined DeLone and McLean model, shown below:
Key:
3. Other measures of net benefits of IS use
Net o: benefits t
2. General perceptual measures of net benefits of IS use
1. Measures of information & system quality
System Quality
Information
Perceived Usefulness
User Satisfaction
Individuals
Organisation
Society
Expectations about the net
benefits of future IS use
IS use
Individual, organisational, and societal consequences of IS use (not evaluated as either good or bad)
IS Success Model
Observation, personal experience and reports from others
Feedback
(partial basis for revised expectations)
Rectangular boxes IS Success Model
Rounded boxes Partial behavioural model of IS use
Solid line arrows Independent (necessary and sufficient) causality
Dotted line arrows Influence (not causal, since observer’s goals are known)
Figure 2-6. A re-specification of the DeLone & McLean model
Chapter 2: Literature Review Part A 2-10
Exploring the Relationship of Organisational Culture to Enterprise Systems Success
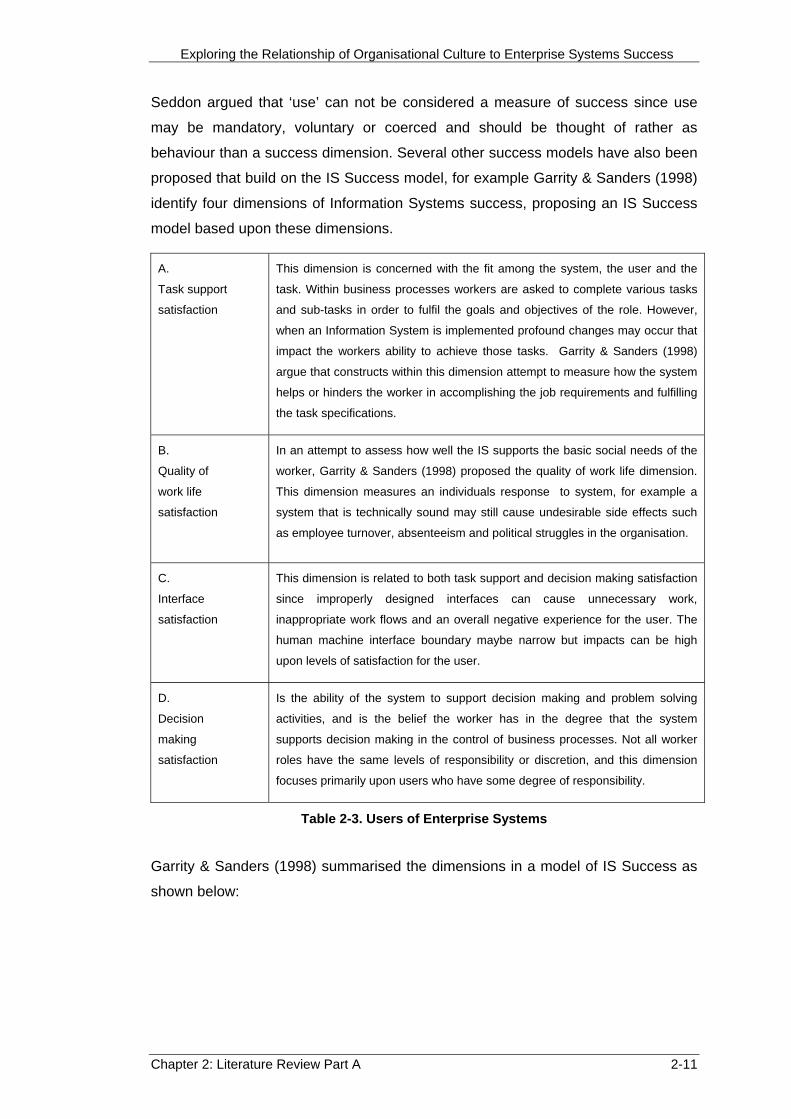
Seddon argued that ‘use’ can not be considered a measure of success since use
may be mandatory, voluntary or coerced and should be thought of rather as
behaviour than a success dimension. Several other success models have also been
proposed that build on the IS Success model, for example Garrity & Sanders (1998)
identify four dimensions of Information Systems success, proposing an IS Success
model based upon these dimensions.
A.
Task support
satisfaction
This dimension is concerned with the fit among the system, the user and the
task. Within business processes workers are asked to complete various tasks
and sub-tasks in order to fulfil the goals and objectives of the role. However,
when an Information System is implemented profound changes may occur that
impact the workers ability to achieve those tasks. Garrity & Sanders (1998)
argue that constructs within this dimension attempt to measure how the system
helps or hinders the worker in accomplishing the job requirements and fulfilling
the task specifications.
B.
Quality of
work life
satisfaction
In an attempt to assess how well the IS supports the basic social needs of the
worker, Garrity & Sanders (1998) proposed the quality of work life dimension.
This dimension measures an individuals response to system, for example a
system that is technically sound may still cause undesirable side effects such
as employee turnover, absenteeism and political struggles in the organisation.
C.
Interface
satisfaction
This dimension is related to both task support and decision making satisfaction
since improperly designed interfaces can cause unnecessary work,
inappropriate work flows and an overall negative experience for the user. The
human machine interface boundary maybe narrow but impacts can be high
upon levels of satisfaction for the user.
D.
Decision
making
satisfaction
Is the ability of the system to support decision making and problem solving
activities, and is the belief the worker has in the degree that the system
supports decision making in the control of business processes. Not all worker
roles have the same levels of responsibility or discretion, and this dimension
focuses primarily upon users who have some degree of responsibility.
Table 2-3. Users of Enterprise Systems
Garrity & Sanders (1998) summarised the dimensions in a model of IS Success as
shown below:
Chapter 2: Literature Review Part A 2-11

Exploring the Relationship of Organisational Culture to Enterprise Systems Success
Figure 2-7. An updated model of IS Success (Garrity & Sanders, 1998)
In contrast Pitt, Watson & Kavan (1995) write about ideas of service quality that
have been taken from the field of marketing and apply these notions of ‘service
quality’ in an Information Systems arena. Pitt et al. (1995) use the SERVQUAL
instrument (Parasuraman, Zeithaml & Berry, 1988) in an attempt to measure IS
service quality, arguing that, since IS departments have always had a service role,
measuring service quality is one possible measure of IS Success. Pitt et al. (1995)
draw on Cameron & Whetten (1983) in relation to organisational effectiveness,
whose latter work also underpins the Competing Values Framework (Cameron &
Quinn, 1999) discussed in the next section. The IS Success model is also evidenced
throughout and Pitt et al. (1995) suggest an augmented IS Success model that
incorporates service quality as a dimension of IS Success. In concluding, Pitt et al.
(1995) suggested that service quality can be both an independent and dependent
variable in IS research, and that IS service is an antecedent of use and user
satisfaction. The model of determinants of user expectations is shown below:
Chapter 2: Literature Review Part A 2-12

Exploring the Relationship of Organisational Culture to Enterprise Systems Success
Figure 2-8. Determinants of users' expectations (Pitt et al., 1995)
These are just some of the examples evidenced throughout the literature of the
influence of the IS Success model on research into IS Success. Indeed, by 2002
over 285 papers had been published that referenced the original 1992 IS Success
model. In light of this and further findings in their own research, DeLone & McLean
(2003) published a 10-year update to their model. The updated model is shown
below:
Figure 2-9. Updated IS Success model (DeLone & McLean, 2003)
The authors concluded that 36 of the 38 original success factor associations had
been found to be significant with the results supporting the causal structure of the
model (DeLone & McLean, 2003). The most marked change to the model is the
removal of ‘Individual Impacts’ and ‘Organisational Impacts’ and their replacement
Chapter 2: Literature Review Part A 2-13
Exploring the Relationship of Organisational Culture to Enterprise Systems Success
with ‘Net Benefits’. Many researchers have suggested wide ranging IS impact
measures and rather than seek to incorporate all these potential measures of
impacts. DeLone & McLean (2003) sought to simplify the category and incorporate
all impact measures into the single category of net benefits. In addition to modifying
the impacts, service quality was introduced as a measure of success. System use is
another measure that the new model extends, which has been variously studied, for
example, self-reporting usage versus computer recorded usage (Straub, Limayem &
Karahanna-Evaristo, 1995), initial and future intended usage, mandatory versus
voluntary, effective versus ineffective use. However, whilst there is much debate
about how to successfully measure system usage in the literature, there is general
consensus that system use at some point is a key variable in understanding IS
Success.
Taking a different approach, Markus & Tanis (2000) sought to identify the stages
that need to be followed to enable a successful ES implementation. The key
characteristics of an ES include integration, package typologies, client vendor
relationships and ES life cycles. Markus & Tanis (2000) try to frame the analysis of
ES Success and discuss: ‘What IS Success with ES? Why does it not always occur
and what can be done to improve the chances of success?’
Success, Markus & Tanis (2000) argue, is multi-dimensional and relative; relative
first to the time that it is assessed, relative to the organisation’s unique goals and
relative to the average business benefits realised by similar firms in its industry.
Markus, Axline, Petrie & Tanis (2000) identified several success measures for each
of the different phases of ES implementation, and identified unique success
measures relevant to different phases.
A. Success in the project phase
1. Project cost relative to budget
2. Project completion time relative to schedule
3. Completed and installed system functionality relative to original project scope
B. Success in the shakedown phase
1. Short term changes occurring after system ‘go-live’ in key business
performance indicators such as operating labour cost
2. Length of time before key performance indicators achieve normal or
expected levels
Chapter 2: Literature Review Part A 2-14

Exploring the Relationship of Organisational Culture to Enterprise Systems Success
3. Short term impact on the organisation’s adopters, suppliers and customers
such as average time on hold when placing a telephone order
C. Success in the onward and upward phase
1. Achievement of business results expected for the ES project, such as
reduced IT operating costs and reduced inventory carrying costs
2. Ongoing improvements in business results after the expected results have
been achieved
3. Ease in adopting new ES releases, other new IT innovations, improved
business practices, improved decision making, etc after the ES has achieved
stable operations.
It can be seen from the literature that there are several views as to what is system
success. However, based on research published to date it is clear that the majority
of research is based in one way or another on the IS Success model. This was an
important consideration in choosing an appropriate instrument to measure ES
success. The IS success model which is used as the basis for the research is the
Updated IS Success model (DeLone & McLean, 2003).
Chapter 2: Literature Review Part A 2-15

Exploring the Relationship of Organisational Culture to Enterprise Systems Success
2.4. Measuring ES Success
In addition to understanding what constitutes ES success, an instrument was
required that could measure the relative success (or failure) of an ES.
In the IS literature, the term “success” has been used in a number of contexts and
somewhat loosely. However, Thong, Yap & Raman (1994: 252) state that
effectiveness of an IS can be “defined as the extent to which an information system
actually contributes to achieving organizational goals.”
Within the literature there are very few published instruments for actually measuring
ES success. A few researchers, for example Zvarin et al (2005) have measured
ERP systems success by using user satisfaction. A widely used instrument was
developed by Ives, Olson, and Baroudi (1983), but this measures ES success from
the perspective of the end user and by measuring satisfaction. The user satisfaction
instrument was further developed, but its focus still remained on measuring user
satisfaction, (Doll & Torkzadeh, 1988).
Tan & Pan (2002) developed a framework for ERP systems success assessment by
including both technical and strategic valuation of ERP systems success; however
this instrument has yet to be validated. To date the Gable et al (2003, 2004 and
2005) instrument provides the most comprehensive ES systems success
measurement model.
The instrument selected for the PhD study was the ES Success measurement
model (Gable, Sedera & Chan, 2003), which is a 27 item questionnaire based
instrument. The model has been validated in several studies and has four
quadrants: (1) Individual Impact, (2) Organisational Impact, (3) Information Quality,
and (4) System Quality, which are based on the IS Success dimensions of (DeLone
& McLean, 1992). The Gable et al. (2003) model has been adopted for this study
since it is based on the IS Success model, previously discussed. The Gable et al.
(2003) model has also proven itself to be reliable, robust and manageable in several
recent studies.
The ES success model (Sedera, Gable & Chan, 2004) is shown below:
Chapter 2: Literature Review Part A 2-16

Exploring the Relationship of Organisational Culture to Enterprise Systems Success
Figure 2-10. ES Success model (Sedera et al., 2004)
This measurement instrument has been selected for use in this study because it has
shown to be:
1. Reliable,
2. Robust,
3. Validated and Manageable
DeLone and McLean (1992) suggest that in order to develop a comprehensive
measurement model/instrument for a particular context, the constructs and
measures should be systematically selected considering contingency variables,
such as the organizational structure, size, or technology, and the individual
characteristics of the system. This suggests that where the aim is to gain a full,
overarching view of success, it is critical that the complete set of success
dimensions be employed, not a selected subset, the ES Success model (Sedara &
Gable, 2004) sought to achieve this.
Construct Validity
Construct validity seeks agreement between a theoretical concept and a specific
measuring device or procedure. Construct validity comprises convergent validity and
discriminant validity and it is evidenced by observed agreement among ratings
gathered independently of one another, where theory suggests the measures should
be related. Several sets of data were used to test construct validity during the
development of the instrument by the authors. The results of the studies provided
very strong support for the validity and reliability of the enterprise system success
measurement instrument as an acceptable measure of contemporary information
systems (Sedara & Gable, 2004).
Chapter 2: Literature Review Part A 2-17

Exploring the Relationship of Organisational Culture to Enterprise Systems Success
Chapter 2: Literature Review Part A 2-18
The exploratory factor analysis results of the specification and the confirmation
surveys suggested a very high factor structure for the ESS.

Exploring the Relationship of Organisational Culture to Enterprise Systems Success
2.5. Summary
Research into the IS field guides us into the design of the investigation.
Resulting from a substantial review of the IS came the selection of an instrument for
measurement of Enterprise System Success. As indicated the instrument selected
was the ES impacts instrument developed by Gable et al. (2004). An instrument was
required to measure the success of the ES in order to triangulate Organisational
Culture against. An instrument was required to quantify the ESS component of the
OC-ESS relationship. Much work was undertaken in reviewing the available
literature before final selection of the Gable instrument. The instrument has proven
to be an acceptable measure of contemporary information systems and research
results provide very strong support for the validity and reliability of the enterprise
system success measurement instrument. The construct validity of the ES Success
measurement instrument has been thoroughly examined through a number of
studies including confirmatory factor analysis. These analyses examined the fit of
the theoretically based model to the data gathered from separate samples and
confirmed a very strong fit (Sedera and Gable 2004). The results from the various
studies indicate that the instrument is a reliable and valid instrument by which to
measure ES Success.
The IS literature review, in addition to guiding ESS instrument selection also
informed on the potential interaction with OC and ESS. In reviewing the guiding
theories in the IS literature clear themes and patterns were seen to emerge. Many of
the theories and models into IS introduce concepts of ‘behaviour’, ‘attitudes’ and
organisational social structures playing some role in the organisations interactions
with its Information Systems. It is the nature of the organisations human
characteristics that need to be taken into account, not necessarily the type of
innovation which is being adopted. As we shall see in the next section of the
literature review, attitudes, beliefs and behaviours is the language of organisational
culture.
Chapter 2: Literature Review Part A 2-19
Exploring the Relationship of Organisational Culture to Enterprise Systems Success
Chapter 3:
Literature Review: Measuring Organisational Culture
Chapter 3: Literature Review Part B 3-1

Exploring the Relationship of Organisational Culture to Enterprise Systems Success
Table of Contents – Chapter 3 Literature Review:
Measuring Organisational Culture
Chapter 3:................................................................................................................3-1
Literature Review: Measuring Organisational Culture .............................................3-1
3.1. Introduction: Organisational Culture ..........................................................3-4
3.2. Organisational Culture Defined .................................................................3-4
3.3. Values: The Core of Culture ......................................................................3-8
3.4. Levels of Culture within an Organisation ...................................................3-9
3.5. Interpretivist approaches to measuring culture........................................3-12
3.6. Common Themes ....................................................................................3-15
3.7. Organisational Culture and Leadership ...................................................3-16
3.8. Organisational Homogeneity: Sub-cultures .............................................3-17
3.9. Measuring Organisational Culture ...........................................................3-18
3.10. Organisational Culture Influencing Information Systems.........................3-20
3.11. Research Approaches to Studying and Measuring OC...........................3-22
3.12. Quantitative Research Methods ..............................................................3-23
3.13. Qualitative Research Methods ................................................................3-25
3.14. Quantitative versus Qualitative Approaches............................................3-27
3.15. Instrument Selection................................................................................3-30
3.16. Summary Findings in the Literature.........................................................3-38
Chapter 3: Literature Review Part B 3-2

Exploring the Relationship of Organisational Culture to Enterprise Systems Success
Figures
Figure 3-1. Values, attitudes and Organisational Culture (Hofstede, 1998) ............3-6
Figure 3-2. Interacting elements defining culture ....................................................3-7
Figure 3-3. Levels of culture and their interaction (Schein, 1985) ........................3-10
Figure 3-4. Relationships between culture, strategy, structure and Information
Technology (Katz & Townsend, 2000) ..................................................................3-11
Figure 3-5. Forces within an organisation (Leavitt, 1965) .....................................3-20
Figure 3-6. Strategic elements within an organisation...........................................3-21
Figure 3-7. Technology Fit Rockart and Hoffman (1992) ......................................3-22
Figure 3-8. OCAI structure (Cameron and Quinn, 1999).......................................3-33
Figure 3-9. OCAI components (Cameron and Quinn, 1999) .................................3-35
Tables Table 3-1. Quantitative research features (Neuman, 2000) ..................................3-23
Table 3-2. Qualitative research features (Neuman, 2000) ....................................3-25
Table 3-3. The strengths and limitations of qualitative research approaches in
regard to cultural complexity (adapted from Sackmann, 2001) .............................3-27
Table 3-4. Selection criteria for instrument selection.............................................3-31
Table 3-5. 12 competencies of organisations (Cameron and Quinn, 1999) ..........3-35
Chapter 3: Literature Review Part B 3-3

Exploring the Relationship of Organisational Culture to Enterprise Systems Success
3.1. Introduction: Organisational Culture
This section of the literature review is concerned with Organisational Culture, what it
is, how it manifests itself and how we can quantify Organisational Culture. We then
conclude with a section that highlights where we consider the points of convergence
to be situated between Organisational Culture and ESS.
This section of literature discusses Organisational Culture and introduces the major
theories that have arisen out of the empirical studies. Culture is a wide ranging
concept whose theoretical basis spans several traditional fields of study including
psychology, anthropology, management and other social sciences. The word
‘culture’ has been used to describe societies and ethnic or regional groups,
(Hofstede, 1980). However, the phrase was taken up by early writers in
organisational studies since it can be applied equally to other human categories
such as organisations. Drawing on these theories from anthropology, sociology and
social psychology, researchers have made a number of efforts to understand the
behaviour of individuals and groups within organisations using concepts such as
semeiotics, rituals, ceremonies, stories and language (Rowlinson & Hassard, 1993;
Smircich, 1983; Trice & Beyer, 1993; Wilkins & Ouchi, 1983).
3.2. Organisational Culture Defined
To understand what culture is, it is useful to review the development of the field and
to consider the major milestones that presented paradigm shifts in the way that
researchers viewed organisations. The field had developed incrementally over a
period of 30 years or so until a shift in focus during the 1980s. During the early
stages of the field’s development the majority of researchers applied strict scientific
measures to organisations in an attempt to understand them. Organisational studies
in general were very much focused on outcomes such as productivity, fiscal
measures and organisation effectiveness. This approach began to be questioned
during the late 1970s and early 1980s as the concept of Organisational Culture
began to develop. ‘Culture is altogether a much “softer” organisation characteristic
than for example productivity, it is more about the social behaviour of individuals and
groups within the organisation than machine efficiency.’ (Geertz, 1973). Definitions
of OC evolved that reflected these ‘softer’ aspects which are:
Chapter 3: Literature Review Part B 3-4

Exploring the Relationship of Organisational Culture to Enterprise Systems Success
Organisational Culture, ‘the collective programming of the mind which distinguishes
the members of one organisation from another’ (Hofstede, 1990)
Organisational Culture, defined as the observable norms and values that
characterise an organisation, influences which aspects of its operations and its
members become salient and how members perceive and interact with one another,
approach decisions and solve problems (Trice & Beyer, 1993) and (O'Reilly,
Chatman & Caldwell, 1991)
Culture is taken to be the shared attitudes, values, beliefs and customs of members
of a social unit or organisation (Martin & Siehl, 1983)
Organisational Culture … shared meanings – patterns of belief, symbols, rituals and
myths that evolve across time and that function as social glue (Smircich, 1983).
Deshpande, Farley & Webster (1993) reviewed more than 100 studies in
organisational behaviour, sociology and anthropology, defining Organisational
Culture as ‘the pattern of shared values and beliefs that help individuals understand
organisational functioning and thus provide them with the norms for behaviour in the
organisation’.
It is clear from the above definitions, that whilst the language differs and there are
subtle differences in emphasis, many of the writers are using similar phrases and
terminology. Terms such as attitudes, values and beliefs keep recurring.
A definition of OC that captures the key elements from various models is described
below:
OC is ‘a pattern of shared basic assumptions that the group learned as it solved its
problems of external adaptation and internal integration, that has worked well
enough to be considered valid and therefore, to be taught to new members as the
correct way to perceive, think and feel, in relation to those problems’ (Schein, 1985).
The PhD study needed a positioning definition of what OC is and the above
definition by Schein was taken as the formal definition for OC. This definition has
been adopted for many studies and is the most widely used definition by number of
cited works.
The manner in which OC manifests itself within an organisation has been the
subject of much debate. For example, Peters & Waterman (1982) identified that
culture can demonstrate its presence in six key ways:
1. the way in which people interact, their terms of address and the language
and technical jargon they use
Chapter 3: Literature Review Part B 3-5

Exploring the Relationship of Organisational Culture to Enterprise Systems Success
Chapter 3: Literature Review Part B 3-6
2. the way in which they dress, e.g. formal business suits versus smart casual
wear
3. the norms which govern the way in which work is organised and conducted,
e.g. reporting arrangements, preferences for written or verbal forms of
communication
4. the organisation’s self-image and dominant values it espouses, both within
and outside the organisation, e.g. the importance it places on particular
organisational functions, the extent to which it wishes to be recognised as a
‘tough’ or ‘caring’ and/or environmentally friendly organisation
5. the way in which it treats its employees and responds to its customers. The
rules for playing the organisational game, e.g. what it considers to be a
‘good’ employee or ‘effective’ manager
6. the climate as conveyed by its physical layout and general atmosphere, e.g.
whether it receives its visitors or customers with warm friendliness or cold
efficiency, whether it maintains executive only dining rooms and similar
restricted facilities
How OC manifests its visibility within an organisation is discussed in greater detail in
‘Measuring OC’ discussed later in this chapter. However, the elements of culture
that many of the definitions do describe are summarised in the model (Hofstede,
1998) shown below. Hofstede had sought to provide a summary model that
incorporated the key components of culture surfaced by the field’s major research
studies.
Figure 3-1. Values, attitudes and Organisational Culture (Hofstede, 1998)

Exploring the Relationship of Organisational Culture to Enterprise Systems Success
Whilst no model has been universally adopted as the de-facto standard for
describing OC, there is some consensus in underlying thinking. The mind map in
Appendix 3.1 summarises the various manifestations found and the studies which
surfaced these manifestations.
Another model that attempts to describe the various manifestations of OC within the
organisation is the Cultural Web (Johnson, 2000). The web attempts to describe the
ways in which the various manifestations of OC surface within an organisation, with
the sum representing the OC paradigm for that organisation. The model is shown
below:
Stories
Rituals & Routines
Organisational Structure
Paradigm
Symbols
Control Systems
Power Structures
Figure 3-2. Interacting elements defining culture
The language is similar to many models, identifying symbols, rituals, stories and
power as being important cultural elements of an organisation.
The next section summarises some of the common concepts found in the OC
literature, and again a mind map is shown in Appendix 3.2 that summarises the key
findings from the literature.
Chapter 3: Literature Review Part B 3-7

Exploring the Relationship of Organisational Culture to Enterprise Systems Success
3.3. Values: The Core of Culture
Social systems exist because human behaviour is not random, but to some extent
predictable (Lewin, 1936). We each try to predict people’s behaviour around us
based on our assumptions of that person’s mental programming. This mental
programming leads to the same person showing more or less the same behaviour in
similar situations. As early as the beginning of the 20th century researchers were
recognising the benefit in being able to predict human behaviour to a wide range of
applications. Lewin (1936) even proposed a mathematical formula to describe a
person’s behaviour:
B = f(P,S)
Where
B = predicted behaviour
P = a contribution of the person
S = a contribution of the situation or environment
f = some probabilistic interactive function, most likely not specifiable in exact
mathematical terms
These mental programs are described as mental constructs. Mental constructs are
‘not directly accessible to observation but [are] inferable from verbal statements and
other behaviours and useful in predicting still other observable and measurable
verbal and nonverbal behaviour’ (Levitin, 1973).
In relation to the specific OC phenomenon several authors consider important
mental constructs that individuals rely on to be ‘values’.
Several definitions of values are:
‘a conception, explicit or implicit, distinctive of an individual or characteristic
of a group, of the desirable which influences the selection from available
modes, means and ends of actions’ (Kluckhohn, 1951).
‘To say that a person “has a value” is to say that he has an enduring belief
that a specific mode of conduct or end state of existence is personally and
socially preferable to alternative modes of conduct or end states of
existence’ (Rokeach, 1972).
Chapter 3: Literature Review Part B 3-8

Exploring the Relationship of Organisational Culture to Enterprise Systems Success
According to Kluckhohn (1951) values have both intensity and direction. The
intensity of the value is the degree of relevance that it holds for us and the direction
is whether the outcomes of the value are good or bad.
The research by these authors, whilst introducing a variety of subtle differences in
definition, do nevertheless confirm the importance of the role that an individuals’
values have in shaping the collective culture and social framework of the
organisation to which they belong.
3.4. Levels of Culture within an Organisation
Within organisations OC has been suggested to operate at four levels (Denison,
1995; Schein, 1985). The four cultural levels are:
1. artefacts or symbols, i.e., the visible products of a culture
2. patterns of behaviour, the socially shared rules and norms/concrete actions
3. values and beliefs, which underlie these actions
4. basic assumptions about the world and how it is, which unconsciously
underpin the other three levels
At the lowest level are basic assumptions, embedded within a person’s
subconscious and invisible to observers. Basic assumptions are formed throughout
childhood and help an individual make sense of the world around. Values and
beliefs are at the next level defining patterns of behaviour in the individual. Only at
the very highest level do we actually see the very visible manifestations of culture –
the symbols present within the organisation that can give an indication of the culture
of the society. It is in part because of these deep ‘hidden’ levels that culture can be
very difficult to study.
The model overleaf describes the levels of culture and their interaction (Schein,
1985).
Chapter 3: Literature Review Part B 3-9

Exploring the Relationship of Organisational Culture to Enterprise Systems Success
Figure 3-3. Levels of culture and their interaction (Schein, 1985)
Schein (1985) distinguishes various levels of analysis, ranging from core
assumptions that represent the deepest level of culture, to beliefs and values as an
intermediate level, to norms and artefacts that are visible at the surface level. Schein
does however warn the researcher of being lulled into a false sense of security into
thinking that artefacts alone, whilst very easy to witness around an organisation,
describe an organisation’s culture. A researcher can quickly consider that they have
established an organisation’s culture solely from these artefacts. However, whilst the
data is easy to obtain it is hard to interpret. It is easy to describe ‘how’ a group
constructs its environment and ‘what’ behaviour patterns are discernible amongst its
members, but not ‘why’ a group behaves in a certain way. The underlying logic is
often hidden.
Trompenaars (1998) considers norms, defined as ‘the mutual sense a group has of
what is right and wrong’, to be of particular importance. Trompenaars also
emphasises three aspects of organisational structure as important in determining
corporate culture, which are:
1. the general relationship between employees and their organisations
Chapter 3: Literature Review Part B 3-10

Exploring the Relationship of Organisational Culture to Enterprise Systems Success
2. the vertical or hierarchical system of authority defining superiors and
subordinates
3. the general views of employees about the organisation’s destiny, purpose
and goals and their place in this
Katz & Townsend (2000) have sought to describe the role of Information Technology
in the ‘fit’ between culture, business strategy and organisational structure. They
proposed a framework for understanding how organisational structure and
Information Technology will vary based on culture within the confines of the chosen
competitive strategy.
Figure 3-4. Relationships between culture, strategy, structure and
Information Technology (Katz & Townsend, 2000)
Cooke & Rousseau (1988) and Cooke, Rousseau & Lafferty (1988) also study
culture from a positivist view and suggest that quantitative approaches may be more
practical for purposes of analysing data-based change in organisations. Indeed,
there are many studies of OC that adopt a positivist approach to studying the
phenomenon, however in contrast other researchers adopt a different research
methodology to studying OC.
Chapter 3: Literature Review Part B 3-11

Exploring the Relationship of Organisational Culture to Enterprise Systems Success
3.5. Interpretivist approaches to measuring culture
There are many researchers who have studied Organisational Culture in an
interpretive manner. Trice & Beyer (1984) write about myths, stories and rituals
taking a more qualitative approach to studying Organisational Culture. They
proposed a typology of rites and ceremonies, identifying six rites present within
organisations. The six rites studied are those of: (1) passage, (2) degradation, (3)
enhancement, (4) renewal, (5) conflict reduction, and (6) integration. Trice & Beyer
also consider that culture is inherently symbolic emphasising the expressive side of
human behaviour rather than the technical or practical side. They consider that
symbolism plays a very important role in cultural communication and expression.
Trice & Beyer (1993) consider that symbols are the most pervasive and general of
cultural forms. Symbols manifest themselves in an organisation through myths,
stories and rituals, symbols that can be studied qualitatively.
Inspired by Peters & Waterman (1982), Deal & Kennedy also study Organisational
Culture through ritual, rites and heroes. Whilst Deal & Kennedy (1982) saw values
as the bedrock of any corporate culture in contrast to some writers, Deal & Kennedy
consider values to be visible indicators of culture. Slogans, phrases and advertising
positioning statements they consider represent core values because they become
the essence of the organisation’s philosophy; others would categorise these as
artefacts, e.g. Schein (1985). Deal & Kennedy proposed a range of activities that the
observer can undertake to diagnose an organisation’s culture. These include:
1. Study the physical setting
2. Read what the company says about its culture
3. Test how the company greets strangers
4. Interview company people
5. Observe how people spend their time
6. An insider can go even further, provided they try and view the culture
through the lens of objectivity
7. Understand the career path and progression of employees
8. Question, how long people stay in jobs, particularly middle management
9. Look at the content of what is being discussed or written about
Chapter 3: Literature Review Part B 3-12

Exploring the Relationship of Organisational Culture to Enterprise Systems Success
10. Pay particular attention to the anecdotes and stories that pass through the
cultural network
An author very prominent in the field of Organisational Culture is Edgar Schein.
Schein studies culture very much from an interpretivist standpoint. Schein also talks
about values, but introduces the other dimensions of artefacts, beliefs and
assumptions. Schein considers that the essence of culture is the set of basic
assumptions that people share regarding such things as human nature, social
relationships and relationships among social institutions and their environment.
Schein also discusses how organisations can influence culture but concludes that
Organisational Culture is very difficult to change because:
1. much of Organisational Culture is taken for granted and it is difficult to
change things that are implicitly part of people’s thinking and behaviour
2. much Organisational Culture has deep historical roots
3. certain power groups have vested interests in the beliefs and assumptions
and are unlikely to be willing to discard them
4. cultural changes lead to increased anxiety for group members
In trying to measure Organisational Culture, Schein (1999) states that culture
surveys do not and cannot measure culture. He suggests that
‘you don't know what to ask about or what question to design, even with
utilising those methods that claim to have isolated a limited set of relevant
dimensions. Asking individuals about a shared phenomenon is inefficient and
invalid. Culture is a group phenomenon and should be measured as such’.
Schein (1996) airs his frustrations with the quantitative efforts to define culture.
‘Particularly in relation to culture, when I see my colleagues inventing
questionnaires to "measure" culture, I feel that they are simply not seeing
what is there, and this is particularly dangerous when one is dealing with a
social force that is invisible yet very powerful. We are in grave danger of not
seeing our own culture, our assumptions about methods, about theory, about
what is important to study or not study, and, in that process, pay too much
attention only to what suits our needs.’
Rather, in trying to identify an organisations culture, researchers can gather data by
using a combination of the following approaches:
Chapter 3: Literature Review Part B 3-13

Exploring the Relationship of Organisational Culture to Enterprise Systems Success
1. Analysing the process and content of socialisation of new members, by
interviewing socialisation agents, such as supervisors and older peers of new
members
2. Analysing responses to critical incidents in the organisation’s history by
constructing a careful organisational biography from documents, interviews
and perhaps even surveys of present and past key members. For each crisis
or incident identified it is then necessary to determine what was done.
3. Analysing beliefs, values and assumptions of ‘Culture Creators or Carriers’.
When interviewing founders, current leaders or culture creators or carriers,
one should initially make an open ended chronology of each person’s history
in the organisation – his or her goals, modes of action and assessment of
outcomes.
4. Jointly exploring and analysing with insiders the anomalies or puzzling
features observed or uncovered in interviews. It is a joint inquiry that will help
to disclose basic assumptions and help determine how they interrelate to
form the cultural paradigm (Schein, 1984).
Schein’s approaches to studying culture are very different to the quantitative
researcher’s methods. Schein considers that to analyse why members behave the
way they do, we should look for the values that govern behaviour (the second
cultural level). However, values are hard to view directly and often it is necessary to
infer them from interviewing key members. Even this analysis may be flawed
because we are usually only noting the manifest or espoused values of a culture,
i.e., what people say is the reason for their behaviour, what they would like those
reasons to be and what are often rationalisations for their behaviour. The underlying
reasons for their behaviour remain concealed or unconscious.
Schein goes a long way in convincing the reader of the underlying validity of his
approach to understanding culture. In comparison, many of the positivist views of
culture pale into comparison and look overly simplistic and superficial.
Regardless of the research approach, whether positivist or interpretivist, there are
some common themes and patterns that emerge, which are discussed in the next
section.
Chapter 3: Literature Review Part B 3-14

Exploring the Relationship of Organisational Culture to Enterprise Systems Success
3.6. Common Themes
Some researchers study culture from the stance of norms, e.g. Cooke & Rousseau
(1988). Harrison & Carroll (1991) studied social expectations that are based on
underlying values, others study culture through the rituals, stories or myths found in
organisations, e.g. Louis, Posner & Powell (1983), Martin & Siehl (1983) and (Trice
& Beyer (1993). Thus we see many different points of departure for the evaluation,
assessment and modelling of culture.
A study by Meyerson & Martin (1987) supports the view of Smircich (1983) in
defining what culture is, i.e., that organisations are cultures, and that culture is not
just a discrete set of variables to be manipulated. Martin & Meyerson’s view of
organisations as patterns of meaning, values and behaviour is also similar to that
described by Schein.
There are indeed many models present in academic literature that attempt to
describe Organisational Culture. Some of the models are based on primary
empirical research whilst others are based on secondary research and use other’s
finding to pull together several concepts into one unified model. It is therefore
difficult for a researcher to recommend one particular model has having captured
the essence of Organisational Culture over the others. There does however seem to
be consensus within several aspects of defining Organisational Culture and many of
the models consider the following common aspects of organisations, i.e., elements
of the culture of the organisation, as being important:
• Values
• Assumptions
• Artefacts
• Rituals
These dimensions of culture are repeated in many of the different models. It would
therefore seem appropriate in considering organisational cultural models and their
use to be mindful of these most common traits in choosing or proposing one
particular model over another. Even though the overriding similarity in the
Organisational Culture literature is referenced to a shared value system, there is
further debate over such issues as the level of analysis and research methodology
used (Cooke & Rousseau, 1988).
Chapter 3: Literature Review Part B 3-15

Exploring the Relationship of Organisational Culture to Enterprise Systems Success
3.7. Organisational Culture and Leadership
It has been suggested that leadership is a variable and dimension of the culture
system that greatly affects an organisation’s culture. Schein (1985) described five
primary behaviours that leaders exhibit in their attempts to shape Organisational
Culture:
1. What leaders pay attention to, measure and control – systematic and
consistent attention to details, performance measures and control
mechanisms congruent to organisational goals
2. Leader reactions to critical incidents and organisational crises – the
emotionally charged atmosphere surrounding a crisis provides members of
an organisation an opportunity to observe leader reactions and behaviours
and increases member learning intensity.
3. Deliberate role modelling, teaching and coaching – the visible, overt
behaviour of a leader provides greater clarity and understanding of beliefs
and values to observing members.
4. Criteria for rewards and status allocation – synchronising reward systems
and status allocation to members whose behaviours represent espoused
values, maximise the impact of culture derived from the leader’s vision
5. Criteria for recruitment, selection, promotion, retirement and
excommunication – culture perpetuates itself through the selection of
individuals demonstrating a propensity for the cultural values that the leader
exhibits
Leaders’ behaviours interact with what Schein terms ‘secondary reinforcement
mechanisms’: (1) the organisation’s design and structure, (2) organisational systems
and procedures, (3) design of physical space, facades and buildings, (4) stories,
legends, myths and parables about important events and people, (5) formal
statements of organisational philosophy, creeds and charters.
Therefore leaders can heavily influence Organisational Culture both from a historical
standpoint and in terms of shaping the current culture.
Whilst leaders can shape culture so too ironically can culture shape leaders. As
early as 1992 Kotter & Heskett identified four factors that shape managerial
behaviour: (1) the corporate culture, (2) formal structure, systems, plans and
policies, (3) leadership and the efforts to articulate and implement a business vision
and strategy, (4) the competitive and regulatory environment. OC has also been
Chapter 3: Literature Review Part B 3-16

Exploring the Relationship of Organisational Culture to Enterprise Systems Success
shown to be a source of cues by which leaders make sense of their own
organisations (Ravesi & Schultz, 2006). This complexity of relations is characteristic
of Organisational Culture and represents one example of the difficulty researcher’s
face in studying dimensions of culture.
3.8. Organisational Homogeneity: Sub-cultures
‘One of the great errors of the recent literature on corporate culture has been to
assume that organisations are homogeneous’ (Goffee & Jones, 1996).
Organisations are rarely characterised by a single culture (Wilkins & Ouchi, 1983).
The Competing Values Model (Cameron & Quinn, 1999) even states one of its
cultural types as that of the clan culture, inferring an independent tribal type culture
comprised of discrete cultural sub units. If an organisation has several sub-cultures
present within, how does the Organisational Culture surface or be unearthed? The
question needs to be asked, what writers and researchers are actually describing
when they refer to the Organisational Culture?
One argument proposed by Beyer & Cameron (1997) is that when a researcher
refers to the Organisational Culture frequently in these organisations they are often
describing only the managerial sub-cultures subscribed to by those at the top level
of an organisation. The presence of various sub-cultures in an organisation may not
necessarily affect the practical search for the organisation-wide culture provided that
the researcher is aware from the outset that there is a high probability that there will
be sub-cultures present in the organisation. The organisation-wide culture based on
the organisation’s espoused values and beliefs may still be present, possibly at a
deeper level than an individual Business Units (BU) sub-culture. Certainly though it
can be envisaged that in a large business there must be a highly complex and
dynamic set of sub-cultures present within the organisation. In the light of this
argument for the presence of sub-cultures within organisations some of the
proposed models purporting to describe or measure Organisational Culture do
indeed look decidedly simplistic.
The presence of sub-cultures within the one organisation has implications for the
study. In order to effectively investigate the nature of the OC-ESS relationship we
needed to identify the OC type present in the organisation. Without understanding
the full cultural profile of the organisation we would be unable to draw generalised
conclusions from the data, for example, if we only studied a particular BU, which had
Chapter 3: Literature Review Part B 3-17

Exploring the Relationship of Organisational Culture to Enterprise Systems Success
a unique culture, then findings based on these results alone could be questionable.
The possible presence of sub-cultures within the one organisation and the
implications for the study is discussed in Chapter 4 Research Design.
The next section discusses the various approaches that have been undertaken in
attempts to measure the culture of an organisation.
3.9. Measuring Organisational Culture
In comparison to the physical sciences, the social sciences, including OC studies,
deal with systems at a much higher level of complexity. The General Hierarchy of
Systems, Von Bertalanffy (1968) defines various systems in levels of complexity: (1)
static frameworks, (2) dynamic systems with predetermined motions, (3) closed-loop
control or cybernetic systems, (4) homeostatic, self-controlling systems like the
biological cell, (5) the living plant, (6) the animal, (7) man, (8) human organisations
and society, and (9) transcendental systems. Each higher level adds a dimension of
complexity. Social sciences are considered to reside at level ‘8’ where the degree of
complexity is overwhelming. At this level of complexity we use models to try and
simplify the system in order to understand the system. However, in the simplification
process we are subjectively choosing and discarding elements from the system and
this is where our errors will occur. It is this level of complexity in social systems that
create the difficulties, already discussed, in defining what culture is, what the
constructs are that define the notion of culture, how these interact with each other,
and as the next section discusses how one measures Organisational Culture.
In this PhD study it was necessary to have a clearly stated method for measuring
Organisational Culture. As we have seen there are many definitions, models and
views proposed, the same applies to research into how to measure Organisational
Culture.
The complexity inherent in an organisational social systems means that
Organisational Culture has many facets that together make the whole. Many studies
appear able to validate their instruments by focussing upon only one or two of the
dimensions of Organisational Culture. They may indeed be exploring aspects of an
Organisational Culture, yet the models are either too simplistic or appear to be
missing many dimensions or factors that other researchers have found to be
important. As an example, Goffee & Jones' model of Organisational Culture (1996)
claims that OC can be analysed along just two dimensions sociability and solidarity.
Chapter 3: Literature Review Part B 3-18

Exploring the Relationship of Organisational Culture to Enterprise Systems Success
Schein counters, that to rate an organisation along dimensions like solidarity or
sociability may be accurate but irrelevant and superficial. A company may truly
operate as a friendly network or as a fragmented collection of individuals as Goffee
and Jones suggest, but that fact may not be very important to the company's OC.
The danger of the typology being that it will seduce managers into believing that
they now understand their culture when, in fact, they may have only scratched the
surface (Schein, 1997).
Chapter 3: Literature Review Part B 3-19

Exploring the Relationship of Organisational Culture to Enterprise Systems Success
3.10. Organisational Culture Influencing Information Systems
This section will now discuss some of the perceived linkages between
Organisational Culture and Information Systems as evidenced in the literature to
date.
In the literature many have sought to define the role that culture plays in various
organisational settings, processes and facets of organisational being, yet whilst
many comment and describe the relationship in models, there is scant empirical
evidence to support their hypotheses. In addition, the models themselves are
suitably ambiguous and present the reader with a reasonable proposition, one that
common sense would suggest appears reasonable, yet on closer examination are
lacking in rigour and supporting evidence.
There are some researchers that have presented cases to indicate that culture
should be important in socio-technical processes, just as it is important in many
other business processes. For example, Moreton & Chester (1996) discuss many
dimensions of IS and IT in the modern organisation and consider the interaction of
the strategic elements for introducing change to the IS function; their ideas are
based on the work of Rockart & Hofman (1992) and Rockart & Morton (1984).
Initially, Rockart & Morton (1984) developed Leavitt’s model of the four social forces
present in an organisation. Leavitt’s (1965) original model is shown below:
Figure 3-5. Forces within an organisation (Leavitt, 1965)
In the revised model Rockart & Morton (1984) take into account the impact of
technology and define five elements of the business: (1) organisation structure and
Chapter 3: Literature Review Part B 3-20
Exploring the Relationship of Organisational Culture to Enterprise Systems Success
culture, (2) strategy, (3) technology, (4) processes, and (5) people. These elements
need to be harmonised so as to they ‘exist in a state of dynamic equilibrium’
(Rockart & Morton, 1984). The revised concept includes management processes at
the centre and a ‘permeable membrane’ that allows the five internal forces different
amounts of exposure to the two external forces provided by the socio-economic and
technological environments.
The interaction of strategic elements in an organisation (Rockart & Morton, 1984)
are shown in the figure below:
Figure 3-6. Strategic elements within an organisation
(Rockart and Morton, 1984)
Rockart & Hofman (1992) developed the model further to include the changes
required to introduce a new technology into the IS function, and in this model the
authors argue that Organisational Culture influences all the other constructs.
This model is shown overleaf:
Chapter 3: Literature Review Part B 3-21

Exploring the Relationship of Organisational Culture to Enterprise Systems Success
Figure 3-7. Technology Fit Rockart and Hoffman (1992)
In a wider ranging literature study Leidner & Kayworth (2006) sought to identify the
nature of culture. Through a substantial literature review they proposed that a
combined culture approach should be adopted.
The research that led to development of these and other models, does suggest that
Organisational Culture has a role to play in IT innovation success. Yet none of the
prior research defines how, to what extent and at what points Organisational Culture
exerts itself on the IT innovation. The models did suggest that Organisational
Culture would play a role but do not demonstrate ‘how’, the PhD research sought to
answer this question.
The next section examines research approaches to studying and measuring
Organisational Culture.
3.11. Research Approaches to Studying and Measuring OC
Distinguishing qualitative against quantitative methods in assessing OC may seem
obvious; qualitative approaches are the opposite of survey type assessments
(Davey & Symon, 2001). However, the distinction between the two approaches may
not be that clear cut since even a method that does not involve the quantification of
data may still be guided by a positivist understanding of the problem. Several
Chapter 3: Literature Review Part B 3-22

Exploring the Relationship of Organisational Culture to Enterprise Systems Success
Chapter 3: Literature Review Part B 3-23
researchers introduce both methods into the one study; others advocate choosing
one method, and remaining with that one method for the duration of the entire study.
Nevertheless, regardless of the epistemological debate, most researchers clearly
state the approach the have adopted.
3.12. Quantitative Research Methods
Quantitative research methods were originally developed in the natural sciences and
examples of quantitative methods include surveys, laboratory experiments and
numerical methods such as mathematical modelling. Quantitative research is about
quantifying relationships between variables. The researcher measures variables in a
sample of subjects, and expresses the relationship between variables using effect
statistics, such as correlations, relative frequencies, or differences between means
(Hopkins, 2000). Some of the characteristics of quantitative research are shown
below:
Table 3-1. Quantitative research features (Neuman, 2000)
Quantitative instruments have many strengths which include:
Strength 1: They are replicable, creating generalisations and enabling bench
marking
One of the greatest strengths of quantitative research is that benchmarking can take
place between studies, thereby allowing creation of a standardised problem or test
that can serve as the basis for evaluation or comparison between different
occurrences of the phenomenon. This allows evaluation and comparison to take
place.
Strength 2: Reliability and validity may be determined more objectively than
qualitative techniques.

Exploring the Relationship of Organisational Culture to Enterprise Systems Success
Validity represents how well a variable measures what it is supposed to, and
reliability indicates how reproducible results are on a re-test. There are three types
of reliability that have been suggested by Neuman (2000):
1. Stability reliability – does the measure deliver the same answer when applied
in different time periods?
2. Representative reliability – does the indicator deliver the same answer when
applied to different groups?
3. Equivalence reliability – does the measure yield consistent results across
different indicators?
Whilst both qualitative and quantitative researchers want a valid and reliable
measurement, each method will treat the specifics differently. Quantitative data,
generally in form of numeric data, lends itself especially well to tests of reliability and
validity.
Strength 3: A quantitative research design allows flexibility in the treatment of
data, in terms of comparative analyses, statistical analyses.
Since quantitative data and results are numeric, a whole range of statistical analysis
techniques can be brought to bear on the study enabling in-depth exploration of the
data. Descriptive statistics can be utilised to describe the numerical data, e.g. uni-
variate, bi-variate and multi-variate analysis can be used to highlight associations
between theoretical constructs.
However, quantitative research, like any other approach, does have certain
limitations.
Limitation 1: Sample size
Sample size is an important factor in quantitative studies. Sample size has to be
large enough in a quantitative study for the researcher to be sure that they are
detecting the smallest worthwhile effect or relationship between variables. It is
generally accepted that detecting the effect 80% of the time indicates statistical
significance and ‘detecting’ means getting a statistically significant effect. This
means that more than 95% of the time you would expect to see a value for the effect
numerically smaller than what was observed, i.e., if there was no effect at all in the
population (the ‘p’ value for the effect has to be less than 0.05).
If there are too few subjects in a study and yet a statistically significant effect is
identified, most academics would regard this finding as invalid.
Chapter 3: Literature Review Part B 3-24

Exploring the Relationship of Organisational Culture to Enterprise Systems Success
Limitation 2: Limited for exploration
The standardisation of questionnaires can limit testing to predetermined hypotheses.
Questionnaires have respondents react to specific question and answer lists that are
in fact created by the researcher, therefore there is an argument that the researcher
is looking for something that they already know exists. The researcher may, albeit
unwittingly, be directing the instrument to return a result that validates their
predefined hypothesis.
3.13. Qualitative Research Methods
Qualitative OC studies use methods taken from both psychology and anthropology.
Psychological approaches consider individual behaviours and expand these out into
group culture dynamics, whilst the anthropological methods operate at the group
level. As a field anthropology may have naturally closer ties to Organisational
Culture. Qualitative research does have some distinct features summarised below:
Table 3-2. Qualitative research features (Neuman, 2000)
It has been argued that qualitative research approaches clearly have their strengths
in developing grounded theory in regard to the issues under investigation. Such an
approach is valuable when looking at for example cultural complexity within an
organisation, since little knowledge will exist about issues such as multiple cultural
membership, cultural context at the organisational level and the impact on
performance. Little will be known about the messiness of the cultural context or
about inherent contradictions and paradoxes (Sackmann, 2001).
Qualitative approaches also have other strengths, they are flexible and adaptable.
As a qualitative study progresses new knowledge is generated, this new knowledge
can be used to alter sampling techniques, data collection and research questions.
Qualitative research can be very flexible in this regard.
Chapter 3: Literature Review Part B 3-25
Exploring the Relationship of Organisational Culture to Enterprise Systems Success
Qualitative research is also very good where theory building is required, leading
many researchers away from quantitative research. As Richards (1990) states,
particularly where theory is sought and not merely tested, qualitative methods hold
the promise of the ‘emergence of theory’. In grounded theory for example, the theory
grows through theoretical sampling, recording comparisons with newly acquired
data and developing paths that may be quite distinct from the original data; a
process that cannot be matched by quantitative analysis (Strauss, 1987).
A further strength of qualitative research is the richness of data and information that
can be obtained. A great deal of intangible factors and fuzzy and soft issues can all
be surfaced in qualitative research, something that quantitative methods have
difficulty exploring.
Other researchers also consider that qualitative data itself has some important
strengths and make several claims as to the power of qualitative data. Typically,
qualitative data focuses upon real life events and can give a strong insight into ‘real
life’ phenomenon, and this is coupled with the fact that the data is generally
collected in close proximity to the specific phenomenon being investigated (Miles &
Huberman, 1994). However, qualitative approaches also have their limitations. The
primary limitation with qualitative research being that the findings are bound to the
specific case under investigation, there is no benchmarking or generalisation that
can be drawn from the study and there can be no direct comparing of results gained
from other studies. The results of qualitative research are very unique to the
phenomenon being studied; this also limits the degree to which generalisations can
be drawn and proposed.
There is also the issue of validity. Questions should be asked regarding do the
reported findings really capture the essence of the research setting and to what
extent do they reflect systematic biases of the researcher and his or her professional
training (Sackmann, 2001).
Qualitative approaches can also have limitations in terms of time and cost. The time
needed to be spent in the research setting and the time needed to condense and
analyse the qualitative data can be extensive. In addition, data from interviews
needs to be transcribed and the resulting transcripts themselves will require
condensing.
A summary table of strengths and limitations of qualitative methods, particularly in
relation to studying cultural complexity is shown in the table overleaf:
Chapter 3: Literature Review Part B 3-26

Exploring the Relationship of Organisational Culture to Enterprise Systems Success
Strengths Limitations
Rich, detailed and meaningful descriptions of the cultural setting under investigation to develop grounded theory
Difficult to compare findings from the case study with other case studies
Insights about the dynamics of cultural complexity (e.g. contradictions, paradoxes, shifting group boundaries related to different issues)
Generalisations beyond the researched setting are not possible
Interactive – assessors get immediate feedback if their questions or research methods may not be adequate for the setting under investigation
No explanations or predictions can be made about the researched phenomena
Adaptive/Flexible – all methods, research activities and research questions can be adjusted as research efforts progress to respond to new insights
Remaining doubt: Has the researcher really captured the essence of the research setting or do the findings and interpretations reflect predominantly the researcher’s personal and professional biases?
Insights gained from the research lead to propositions/hypotheses grounded in organisational life
Costly in terms of time needed for data collection and data analysis
Table 3-3. The strengths and limitations of qualitative research approaches in regard to cultural complexity (adapted from Sackmann, 2001)
In summary qualitative research approaches and methods can be used to gain a
better understanding of organisational life and can yield rich data about specific
cases and can help develop grounded theory if needed or required.
3.14. Quantitative versus Qualitative Approaches
In terms of recommending quantitative over qualitative approaches to investigating
or measuring Organisational Culture, it is not as clear cut as simply adopting a
positivist or interpretivist approach and stating that your research is going to study
the phenomenon from one perspective or the other. Organisational Culture is a very
complex entity to try to describe and model, much less to even measure. This
complexity has led to ambiguity and confusion within the field regarding how to
define, model, interpret and measure Organisational Culture within an organisation.
Even Hofstede has come under criticism for his work because the results were
based solely on statistical analysis of questionnaire data. He discusses the most
common criticisms that are aimed at his work:
1. Surveys are not suitable to measure cultural differences
Answer: They should not be the only way.
2. Any set of functionally equivalent samples can supply information about such
differences.
Chapter 3: Literature Review Part B 3-27

Exploring the Relationship of Organisational Culture to Enterprise Systems Success
3. The IBM data are old and therefore obsolete
Answer: The dimensions found are assumed to have centuries old roots.
They have been validated against all kinds of external measurements; recent
replications show no loss of validity.
4. Four or five dimensions are not enough
Answer: Additional dimensions should be statistically independent of the
dimensions defined earlier. They should be valid on the basis of correlations
with external measures; candidates are welcome to apply (Hofstede, 1998).
This confirms earlier discussions in this paper about the difficulty of measuring,
identifying and modelling Organisational Culture and the debate amongst
researchers as to the most appropriate method to adopt. Researchers cannot even
agree on a research methodology let alone which tools to use to measure
Organisational Culture. Yet Organisational Culture needs to be studied and
researchers at some point, need to adopt and define a research approach that will
allow them to investigate culture fit for their purposes. Many of the cultural
instruments reviewed in this paper have proven merit confirmed by many separate
studies taken across a broad range of industries, organisational types and sizes.
Instruments that have been validated in this way by several research studies were
considered for this study.
At this stage in the field’s development there is an argument for those wishing to
study Organisational Culture to utilise a range of tools, taken from both quantitative
and qualitative view points, to capture the key elements of a business’
Organisational Culture.
Denison (1995) demonstrates that studies can effectively utilise both qualitative and
quantitative research methods to study Organisational Culture. Two linked studies
formed the basis of that research; the first study undertaken involved five firms in a
case study analysis. Each case was analysed by reviewing publicly available
sources of information about the company, interviewing knowledgeable outsiders
(30-40 people for each case) and direct interviews with between 25 and 100
individuals within each organisation. The interviews that were carried out focussed
upon interviewee’s identity and career history, the core values of the organisation,
organisational history and power and prestige of different subgroups. The purpose
of the first study was to facilitate theory building. Following the first case study
analysis phase of his research a second study was undertaken to test the model
Chapter 3: Literature Review Part B 3-28

Exploring the Relationship of Organisational Culture to Enterprise Systems Success
Chapter 3: Literature Review Part B 3-29
and hypothesis that Denison had identified. A survey was developed and from 3,625
surveys that were sent to top executives across five industries, 764 completed
surveys were returned. Factor analysis and multi-dimensional scaling were used to
assess the validity of the questionnaire items developed to measure the four cultural
traits. This approach importantly for the study confirms the validity of undertaking
both qualitative and quantitative research to study Organisational Culture (Denison,
1995).
There have been other studies undertaken that have used quantitative and
qualitative methods to study Organisational Culture. For example, Rousseau &
Gundry (1994) whose research was based on a study into 149 recent employees in
12 electronics manufacturing firms. In particular the authors sought to investigate
how new employees come to understand the culture with specific reference to
behavioural norms. Although the initial research employed critical incidents
methodology (a qualitative method), Gundry & Rousseau linked this to a quantitative
assessment of behavioural norms, the study therefore supports the use of the two
methods to investigate a problem. To study behavioural norms Gundry & Rousseau
used the OCI developed by Cooke & Lafferty in 1989.
Many of the instruments are surveys based, adopting a positive quantitative
approach whilst others adopt qualitative methods. With each methodology there are
strengths, weaknesses, limitations and benefits. This section has discussed the
various characteristics of the two different methodologies, quantitative versus
qualitative. The next section discusses the instrument selection process for this
research project.

Exploring the Relationship of Organisational Culture to Enterprise Systems Success
3.15. Instrument Selection
In attempts to measure OC, many instruments have been developed. A starting
point for a researcher in deciding which instrument to adopt is perhaps to consider
the underlying research methodology adopted by the instruments and to consider
the instruments based upon their approach. Once a thorough understanding of the
various instruments has been obtained an informed decision can then be made as
to the appropriate instrument to adopt for a particular study. It should be a decision
and choice that can be defended by the researcher as being the most appropriate
tool for the job in hand.
An in-depth review of the most validated and rigorously tested instruments used for
measuring Organisational Culture was undertaken as part of the research. The
details of the particular instruments are given in Appendix 3.5, but a summary of the
instruments and rationale for suitability for the PhD study is presented here.
Many of the studies into Organisational Culture have sought to develop instruments
to measure and quantify a firm’s Organisational Culture. However, regardless of the
difficulties associated with identifying suitable instruments, ultimately my research
needs to identify a suitable instrument that meets the needs of this study.
Looking at the research requirements, there are clear goals and objectives all set
within the bounds of a 3-year PhD project. Therefore, the choice of instrument
needs to reflect academic, research and project considerations. In arriving at any
decision, a series of questions (criteria) are asked of the object, against which the
suitability of that option can be judged and measured. This process was applied in
assessing the different instruments. A summary of the criteria against which the
numerous instruments were measured against is shown in the following table:
Chapter 3: Literature Review Part B 3-30
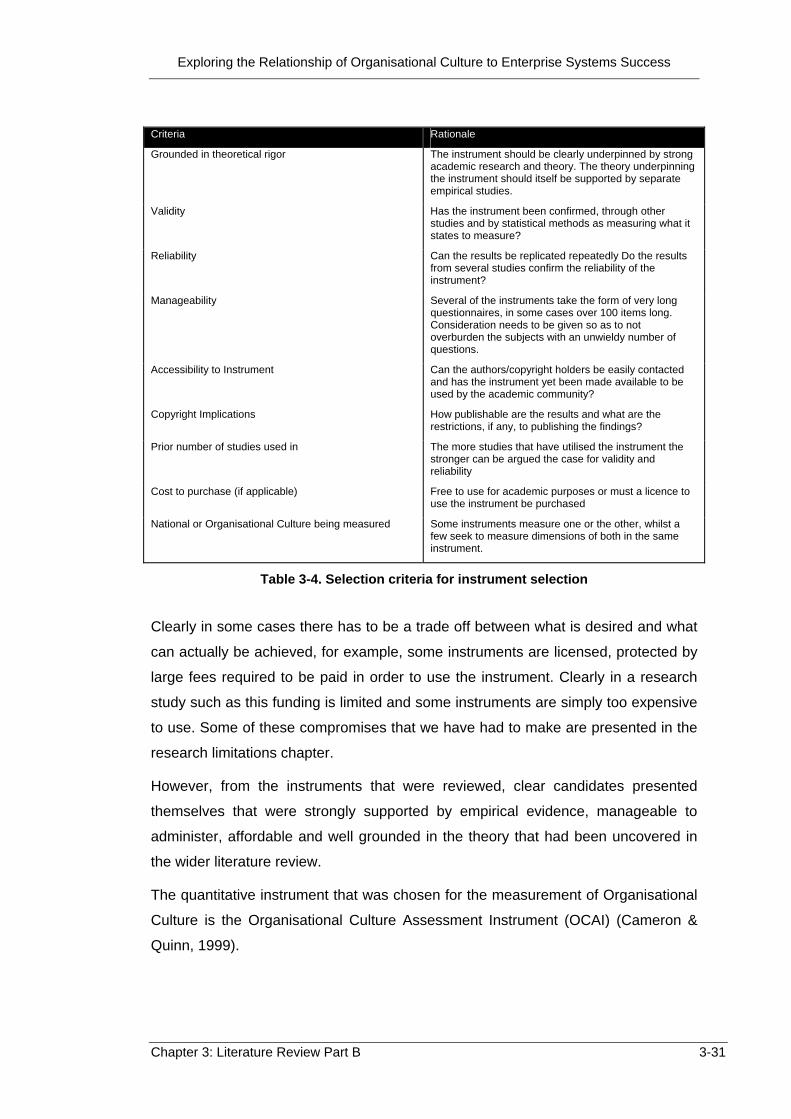
Exploring the Relationship of Organisational Culture to Enterprise Systems Success
Criteria Rationale
Grounded in theoretical rigor The instrument should be clearly underpinned by strong academic research and theory. The theory underpinning the instrument should itself be supported by separate empirical studies.
Validity Has the instrument been confirmed, through other studies and by statistical methods as measuring what it states to measure?
Reliability Can the results be replicated repeatedly Do the results from several studies confirm the reliability of the instrument?
Manageability Several of the instruments take the form of very long questionnaires, in some cases over 100 items long. Consideration needs to be given so as to not overburden the subjects with an unwieldy number of questions.
Accessibility to Instrument Can the authors/copyright holders be easily contacted and has the instrument yet been made available to be used by the academic community?
Copyright Implications How publishable are the results and what are the restrictions, if any, to publishing the findings?
Prior number of studies used in The more studies that have utilised the instrument the stronger can be argued the case for validity and reliability
Cost to purchase (if applicable) Free to use for academic purposes or must a licence to use the instrument be purchased
National or Organisational Culture being measured Some instruments measure one or the other, whilst a few seek to measure dimensions of both in the same instrument.
Table 3-4. Selection criteria for instrument selection
Clearly in some cases there has to be a trade off between what is desired and what
can actually be achieved, for example, some instruments are licensed, protected by
large fees required to be paid in order to use the instrument. Clearly in a research
study such as this funding is limited and some instruments are simply too expensive
to use. Some of these compromises that we have had to make are presented in the
research limitations chapter.
However, from the instruments that were reviewed, clear candidates presented
themselves that were strongly supported by empirical evidence, manageable to
administer, affordable and well grounded in the theory that had been uncovered in
the wider literature review.
The quantitative instrument that was chosen for the measurement of Organisational
Culture is the Organisational Culture Assessment Instrument (OCAI) (Cameron &
Quinn, 1999).
Chapter 3: Literature Review Part B 3-31

Exploring the Relationship of Organisational Culture to Enterprise Systems Success
Instrument Characteristics
This section discusses the instrument and the rationale for its suitability in this study.
A summary of the other instruments that were considered as prospective candidates
is shown in Appendix 3.5.
Two prominent authors in the Management Research field, Cameron & Quinn
(1999) developed an instrument to identify an organisation’s culture. The instrument,
the OCAI, was based upon the Competing Values Framework (CVF), the purpose of
which was to diagnose an organisation’s culture. The instrument takes the form of a
questionnaire that requires individuals to respond to just six items. Each question
has four alternatives and respondents are asked to divide 100 points amongst these
four alternatives. A higher number of points is given to the alternative that the
respondent considers is most similar to his/her organisation.
The Competing Values Framework itself was developed from a list of organisational
effectiveness criteria first developed by Campbell (1977). Campbell had identified 39
indicators that were claimed to represent all possible measures of organisational
effectiveness. Quinn & Rohrbaugh (1983) then submitted the 39 indicators to a
statistical analysis and identified two major dimensions that organised the indicators
into four main clusters. They found that clusters of values reproduced the
dimensions developed by Jung (1923) and Myers & Briggs (1962) to describe
psychological archetypes. One dimension differentiates effectiveness criteria that
emphasise flexibility, discretion and dynamism from criteria that stresses stability,
order and control. The second dimension differentiates effectiveness criteria that
emphasise an internal orientation, integration and unity from criteria that highlight an
external orientation, differentiation and rivalry.
These two dimensions form four quadrants which represent sets of organisational
effectiveness indicators. These indicators then represent what people value about
an organisation’s performance; they are in effect representations of the core values
of the organisation. The CVF expresses three specific criteria that must be met in
order to test its applicability to Organisational Culture analysis:
1. Organisational Culture must be described in terms of bipolar dimensions of
shared values
2. Two of those dimensions must reflect values for control versus flexibility and
values for internal versus external constituents
3. These two dimensions must bisect to form a 2x2 framework
Chapter 3: Literature Review Part B 3-32

Exploring the Relationship of Organisational Culture to Enterprise Systems Success
Competing Values Framework (Cameron & Quinn, 1999):
Figure 3-8. OCAI structure (Cameron and Quinn, 1999)
The four cultural typologies that the instrument shows tell the researcher what type
of culture the organisation possess and the culture type is considered to be the
more dominant within the organisation. The formal definitions of the four culture
types are as follows:
1. Clan
A friendly place to work where people share a lot of themselves. It is like an
extended family. Leaders are thought of as mentors, even as parent figures.
The organisation is held together by loyalty and tradition. Commitment is
high. The organisation emphasises the long term benefit of individual
development with high cohesion and morale being important. Success is
defined in terms of internal climate and concern for people. The organisation
places a premium on team work, participation and consensus.
2. Adhocracy A dynamic, entrepreneurial and creative workplace. People stick their necks
out and take risks. Effective leadership is visionary, innovative and risk
oriented. The glue that holds the organisation together is commitment to
experimentation and innovation. The emphasis is on being at the leading
edge of new knowledge, products and/or services. Readiness for change
Chapter 3: Literature Review Part B 3-33

Exploring the Relationship of Organisational Culture to Enterprise Systems Success
and meeting new challenges are important. The organisation’s long term
emphasis is on rapid growth and acquiring new resources. Success means
producing unique and original products and services.
3. Market A results oriented workplace. Leaders are hard driving producers and
competitors. They are tough and demanding. The glue that holds the
organisation together is an emphasis on winning. The long term concern is
on competitive actions and achieving stretch goals and targets. Success is
defined in terms of market share and penetration. Outpacing the competition
and market leadership are important.
4. Hierarchy
The organisation is characterised by a formal and structured place to work.
Procedures govern what people do. Effective leaders are good coordinators
and organisers. Maintaining a smooth running organisation is important. The
long term concerns of the organisation are stability, predictability and
efficiency. Formal rules and policies hold the organisation together.
The OCAI can also be extended to consider and incorporate other dimensions of
organisational performance and Whetten & Cameron (1998) have extended the CVF
to include mapping managerial behaviours into a culture change process. Whetten &
Cameron (1998) developed the Management Skills Assessment Instrument (MSAI),
which is based on prior research by the authors into critical management skills.
Whetten & Cameron (1998) clustered the skills and competencies that emerged
from these studies into a set of competencies applicable from mid-level to upper
level managers.
Twelve competency categories are mapped into the CVF, i.e., three categories per
culture type.
Chapter 3: Literature Review Part B 3-34

Exploring the Relationship of Organisational Culture to Enterprise Systems Success
Figure 3-9. OCAI components (Cameron and Quinn, 1999)
The twelve competency categories are summarised below:
Table 3-5. 12 competencies of organisations (Cameron and Quinn, 1999)
Chapter 3: Literature Review Part B 3-35

Exploring the Relationship of Organisational Culture to Enterprise Systems Success
Strengths of the OCAI instrument
Cameron & Quinn believe that this instrument provides practitioners with a useful
tool to diagnosing an organisation’s culture because it offers the advantages of
being:
Practical It captures key dimensions of culture that have been found to make a difference in
organisation’s success.
Timely The process of diagnosing and creating a strategy for change can be accomplished
in a reasonable amount of time.
Involving
The steps in the process can include every member of the organisation, but they
especially involve all those with responsibility to establish direction, reinforce values
and guide fundamental change.
Quantitative & Qualitative
The process relies on quantitative measurement of key cultural dimensions as well
as qualitative methods including stories, incidents and symbols that represent the
right brained ambience of the organisation.
Manageable
The process of diagnosis and change can be undertaken and implemented by a
team within the organisation, usually the management team. Outside diagnosticians,
culture experts or change consultants are not required for success implementation.
Valid
The framework on which the process is built not only makes sense to people as they
consider their own organisation, but is supported by extensive empirical literature
and the underlying dimensions have a verified scholarly foundation.
Several large studies have utilised the CVF in Organisational Culture studies, these
studies provide evidence of the instruments’ reliability and validity.
Some of these studies are discussed overleaf.
Chapter 3: Literature Review Part B 3-36

Exploring the Relationship of Organisational Culture to Enterprise Systems Success
One study that tested the reliability of the CVF was carried out by Quinn & Spreitzer
(1991), in which 796 executives from 86 different public utility firms rated their own
organisations’ culture. Cronbach alpha coefficients were calculated for each of the
culture types being assessed by the instrument, and the results confirmed that
respondents rated their organisations’ culture consistently across the various
questions in the instrument. Another large study conducted by Yeung, Brockbank &
Ulrich (1991) involved 10,300 executives in 1,064 businesses; many of these were
Fortune 500 companies. The respondents were human resource executives and
senior managers. Again Cronbach alpha coefficients were calculated to test
reliability. The results showed clan culture reliability was .79, the adhocracy culture
reliability was .80, the hierarchy culture was .76 and the market culture reliability
was .77. These more than exceeded satisfactory levels. A large study carried out in
2005 sampled 6,869 employees from 55 manufacturing companies using the CVF
(Patterson et al., 2005). The study concluded that the CVF was a robust instrument
that could be used as the basis for empirical study of an organisations culture.
Zammuto & Krakower (1991) also used the CVF to investigate the culture of higher
education levels. Over 1,300 respondents rated the culture of their organisations,
resulting in reliability coefficients of clan reliability .82, adhocracy reliability .83,
hierarchy reliability .67 and market reliability .78. More recently Kwan & Walker
(2004) used the CVF in an inter-educational study measuring the culture across a
range of institutions.
In Australia, several studies have used the CVF to investigate Organisational
Culture of specific organisations, but at the same time these studies have also
sought to test the suitability of the CVF to be used in the context of the Australian
culture (Igo & Skitmore, 2006; Lamond, 2003). These studies concluded that the
CVF was indeed a valid and reliable instrument and one that was appropriate to be
used in the Australian culture.
Further research that has tried to explore direct relationships between specific
construct of culture and a particular culture type has been undertaken by Homburg
& Pflesser (2000). The research approach included elements of qualitative and
quantitative research. The study results support the existence of a market oriented
culture and identify key values that are present within the CVF cultural paradigm.
We therefore see strong support in the literature for the reliability, validity and
strength of the CVF and the OCAI instrument. All of these factors contributed to the
decision to select this instrument for use in the PhD study.
Chapter 3: Literature Review Part B 3-37

Exploring the Relationship of Organisational Culture to Enterprise Systems Success
3.16. Summary Findings in the Literature
As we have seen, the literature informs on possible aspects of the relationship
between OC-ESS. However, the literature does not explain how Organisational
Culture interacts with Enterprise System Success. This is the problem identified as
the primary target for the PhD study.
The literature review also highlights that the relationship between OC and ESS is a
challenging phenomenon to study for several reasons.
Firstly, the relationship between Organisational Culture and ESS is a complex
system and complex social systems are notoriously difficult to study. Many studies
have sought to explore research problems in social settings and have failed in their
attempts to adequately describe or answer the problem that they initially sought to
address.
Secondly, regarding Organisational Culture, researchers still cannot agree on
suitable definitions of ‘what’ Organisation Culture is and ‘how’ it can be measured.
This presents problems of context and clarity for the study.
Thirdly, the literature on ESS also experiences difficulties with meanings. ‘What is
ESS?’ and ‘How to measure ESS?’ are questions that are yet to be fully answered in
the literature. These conflicts within the ESS literature are in part a result of the
relative ‘newness’ of the field, the field is simply in its early stages of evolution. The
research domain has not been thoroughly or completely investigated and so the
various models published may not be entirely complete or be in the early stages of
development.
However, just as the literature identified the relationship between OC and ESS as
challenging to study, it did suggest possible strategies for moving forward with the
design of the investigation.
The next sections briefly summarises the key findings of this chapter.
Organisational Culture Literature
Research into the OC field, whilst frequently in disagreement or providing conflicting
findings, does have agreed areas of consensus and commonality that are relevant
to the OC-ESS study.
1. Research does confirm common themes and language; terms such as
values, beliefs and assumptions are continually surfaced in research studies.
Chapter 3: Literature Review Part B 3-38

Exploring the Relationship of Organisational Culture to Enterprise Systems Success
Chapter 3: Literature Review Part B 3-39
2. OC has been shown in many studies to influence organisational performance
and effectiveness.
3. OC can be investigated in the one study through combined
quantitative/qualitative methods.
4. External and internal stakeholders can both inform on a particular OC.
5. OC has been shown in many studies to influence organisational change and
can operate as either an enabler or inhibitor to a successful change process.
Enterprise System Success Literature
Research into this field clearly represents a ‘work in progress’. Suitable definitions
and measures of ES Success have yet to be agreed upon by researchers operating
in the field. However, studies to date have shown that:
1. ESS can be measured quantitatively - instruments to measure ESS
quantitatively have been developed
2. ESS literature supports the notion that beliefs and attitudes may play a role
in the success of an ES
3. Multi-method studies have been successfully undertaken in IS research
4. Beliefs and attitudes are critical constructs in the
a. Technology Acceptance Model;
b. Theory of Reasoned Action and Theory of Planned Behaviour, upon
which TAM is based, indicate that attitudes and beliefs affect a users
use and perception of an IS.
It can therefore be seen that the literature informs on many aspects of the study,
whilst there are differences of opinion amongst researchers, there are also important
areas of agreement. There are clearly areas of convergence within the published
studies with commonalities in the fields being observed. The literature very strongly
indicates that OC should play a role in the success of an ES.

Exploring the Relationship of Organisational Culture to Enterprise Systems Success
Chapter 4
Research Design
Chapter 4: Research Design 4-1

Exploring the Relationship of Organisational Culture to Enterprise Systems Success
Table of Contents – Chapter 4 Research Design
4. Introduction: Research Design ..............................................................................4-3
4.1. RQ: How can we explore the OC- ESS relationship? .....................................4-5
4.2. RQ: Who can inform on the OC-ESS relationship? ........................................4-8
4.3. RQ: Who can inform on ES Success within the target organisation? .............4-8
4.4. RQ: Who can inform on OC external to the organisation?............................4-10
4.5. Data Collection Methods ...............................................................................4-17
4.6. Qualitative Data Collected.............................................................................4-17
4.7. Quantitative Data Collected ..........................................................................4-20
4.8. RQ: How was the data collected? .................................................................4-22
4.9. Pilot Study Data Collection............................................................................4-23
4.10. Main Consultant Data Collection...................................................................4-23
4.11. Revelatory Case Study Data Collection ........................................................4-24
4.12. Research Design Summary ..........................................................................4-26
Figures Figure 4-1. Primary and sub-research questions ...........................................................4-3
Figure 4-2. Stakeholder groups informing on ES Success...........................................4-10
Figure 4-3. Stakeholders informing on the Organisational Culture of the target
organisation ................................................................................................4-11
Figure 4-4. Participants informing on the OC-ESS relationship ...................................4-12
Figure 4-5. Participants reporting on the OC-ESS relationship ....................................4-16
Figure 4-6 Data collected from the various participants in the study...........................4-21
Figure 4-7. Data collection points for the study ............................................................4-22
Figure 4-8. Pilot data collected .....................................................................................4-23
Figure 4-9. Design sequence: main study location.......................................................4-23
Figure 4-10. Design sequence: revelatory case study location ....................................4-24
Tables Table 4-1. Informants per stage of Enterprise Systems lifecycle ...................................4-9
Table 4-2. Roles within participant groups informing upon OC-ESS............................4-14
Table 4-3. Consultant selection criteria ........................................................................4-15
Table 4-4. Guiding study questions addressed in the design.......................................4-26
Chapter 4: Research Design 4-2

Exploring the Relationship of Organisational Culture to Enterprise Systems Success
Chapter 4: Research Design 4-3
4. Introduction: Research Design
This chapter describes the research design and methodology for the study. The
rationale for various design issues is discussed in relation to meeting the research
questions and the objectives of the study. The study was driven by the primary research
question
RQ: What is the relationship between Organisational Culture and ESS? Once this had been established key derived sub-questions were:
RQ: How can this relationship be explored?
RQ: Who can inform on the OC-ESS relationship?
RQ: What data will need to be gathered?
RQ: How will the data be collected?
The relationships between these questions are shown in the figure below:
Figure 4-1. Primary and sub-research questions
Answers to these questions are found in the following sections. The first phase of the
study was concerned with framing the study. The final goal of this phase being to
What is the relationship between Organisational Culture
and ES Success?
How can this relationship be explored?
Who can inform on the OC-ESS relationship?
What data will need to be gathered?
How will the data be collected?
------- Primary Research Question ----
OC ESS
Guiding Study Design questions defining how to enable exploration of

Exploring the Relationship of Organisational Culture to Enterprise Systems Success
Chapter 4: Research Design 4-4
develop a research design that was robust, rigorous and methodologically sound. The
guiding study questions were used to build up the various elements of the design. Each
of these questions formed a critical element to the study – ultimately defining how the
OC-ESS relationship was to be explored. Each of these questions is discussed in detail
in the next sections.

Exploring the Relationship of Organisational Culture to Enterprise Systems Success
4.1. RQ: How can we explore the OC- ESS relationship?
The objective of the study was to explore the OC-ESS relationship and build theory
based on the findings. Therefore in developing the study design, the methods
selected were those that would allow the widest exploration of the relationship and
all its facets.
In order to fully explore the relationship a number of guiding criteria were developed
that could be used to assist in the selection of particular methods for the study.
Clearly there are many ways in which the study could have been undertaken, but by
applying these criteria a design was built that was strong, robust and aligned with
meeting the primary study aim:
To explore the relationship across the widest possible organisational and industry settings
There may have been different experiences of the OC-ESS relationship across
different industries, public and private settings, and different market sectors. The
aim was to identify as many experiences and variations of the relationship as
possible. A decision was therefore made to not limit the study to a particular
industry or indeed a single organisation.
Capture the experiences from experienced participants in the relationship
Again in order to explore the relationship as fully as possible, it was identified that
by selecting experienced actors in the relationship a wide, thorough and detailed
insight in the relationship would be afforded. Experienced actors would be able to
recount a range of experiences over a number of years.
Explore the relationship across a range of degrees of success
To avoid selection bias, i.e., to not only study the most successful ES experiences
(Denrell, 2005), the study sought to investigate the relationship across both
successful and least successful Enterprise Systems. Studying ES at the two
extremes of success would surface the full range of experiences of the relationship
and capture all experiences of the OC-ESS relationship, both positive and negative.
Capturing the widest variations was important to the confidence with which
conclusions could be drawn from the data.
Chapter 4: Research Design 4-5

Exploring the Relationship of Organisational Culture to Enterprise Systems Success
Building the study based on these criteria would allow for the fullest investigation of
the nature of the relationship.
There is a wide variety of research approaches available to researchers to
investigate a problem. The difficulties encountered with selecting one approach
over another are numerous, not least because researchers, who have studied OC
and ESS, have used quantitative and qualitative methods. There are powerfully
held beliefs about which approach is most appropriate. The richness and depth of
information that the data can contain means that qualitative data is well placed for
exploratory research methods. This view is further supported by van Manen (1977),
who argued that qualitative data can elicit people’s ‘perceptions, assumptions,
prejudgements and presuppositions’.
One technique that has been used in complex social studies is to apply a multi-
method approach, i.e., both qualitative and quantitative methods combined in one
study. Within organisational studies, it has been identified that a diversity of
methods is often necessary in studies that deal with organisational contexts due to
the complexity of the problems (Cheon, Grover & Sabherwal, 1993). Within IS
research, combining several research methods into a single study, can provide a
richer understanding of a research topic with each method focussing upon different
aspects of the problem (Mingers, 2001). Mingers (2001) argues that the results
themselves will also be more reliable if different research approaches are
combined.
Mingers (2003) undertook a review of the major IS journals in order to identify how
many published studies between 1993 and 2000 had adopted multi-method
approaches. Empirical papers represented 66% of total papers published, and of
these 20% used multi-method in the one study.
Support for a combined method approach is also present in the Organisational
Culture literature. Several researchers promote the use of qualitative research
methods as the better way to fully understand and appreciate Organisational
Culture. Researchers that have adopted combined multi-method approaches in
Organisational Culture studies include Ashkanasy, Edwin & Earnshaw (2002);
Ashkanasy, Wilderom & Peterson (2000); Bagchi, Cerveny, Hart & Peterson (2003);
Bernard (1998); Cameron & Quinn (1999); Collins (1998); Davey & Symon (2001);
Heales & Cockcroft (2003); Hofstede (1990); Hooijberg (1996); House, Javidan &
Dorfman (2001); House, Javidan, Hanges & Dorfman (2002); Langan-Fox & Tan
(1997), and Meyerson & Martin (1987).
Chapter 4: Research Design 4-6

Exploring the Relationship of Organisational Culture to Enterprise Systems Success
Chapter 4: Research Design 4-7
The literature review chapters covered the various philosophical debates
associated with qualitative and quantitative research methods, but in summary
there is strong support both in the IS and OC literature, particularly in exploratory
studies, for the adoption of a multi-method approach. A multi-method approach was
therefore adopted for this PhD study which included the following three elements.
1. A qualitative sub-study
Aim: to explore the OC-ESS relationship across a range of industry,
organisational and perspective settings
Objective: to identify the nature of the OC-ESS relationship and allow theory
building to be undertaken based on the findings within the data
2. A quantitative sub-study
Aim: to measure the level of ES Success experienced and the culture type
Objective: to measure the level of ES Success and OC type, using suitable
quantitative instruments to allow benchmarking and statistical analysis of the
relationship
3. The study was then validated in a case study
Aim: to validate and benchmark the findings from the consultant elements
Objective: to explore the relationship between Organisational Culture and IT
innovations in the context of Enterprise Systems and their extensions in a
revelatory case study
Having established that a multi-method approach was desirable, the next question
to be addressed was ‘who’ could inform on the relationship.

Exploring the Relationship of Organisational Culture to Enterprise Systems Success
4.2. RQ: Who can inform on the OC-ESS relationship?
In our study there are two components to the relationship:
Enterprise System Success
Organisational Culture
When studying culture and its relationship to ESS, attention was given to:
Who do we ask to describe a firm’s Organisational Culture?
Who do we ask that can comment on the role of both Organisational Culture
and ESS?
From whose perspective do we measure a successful ES?
Each of these design components needed to be addressed separately in terms of
‘who can inform on each’ before being brought together. The first component to be
discussed is the ES Success element.
4.3. RQ: Who can inform on ES Success within the target organisation?
Typically, when an organisation implements an ES it will call upon expertise from a
variety of agents to assist with identifying a suitable product, testing, customising
and implementing the ES. The whole process from discovery and implementation to
exploitation can take many months. The project will be complex and very time
consuming for the organisation, typically involving three process stages as shown in
the following table.
Chapter 4: Research Design 4-8

Exploring the Relationship of Organisational Culture to Enterprise Systems Success
Table 4-1. Informants per stage of Enterprise Systems lifecycle (SAP 2006)
The various participants in the processes will change dependant upon issues such
as vendor/product selected, functionality required, in house technical expertise, the
current phase and method of adoption. However, three partners have been
identified in numerous studies as being highly critical to the success of the ES
irrespective of the ES stage. These three partners are:
1. Client organisations
2. Vendors
3. Implementation Partners
These three partnering agents typically are extensively involved in all three phases
working closely together for extended periods of time (Bingi, Sharma & Godla,
1999; Mabert, Soni & Venkataramanan, 2003; Parr & Shanks, 2000; Umble, Haft &
Umble, 2003).
These participants would be defined as stakeholders (Freeman, 1984) since
they are ‘individuals or groups with an interest in the success of an organisation in
delivering intended results and maintaining the viability of the organisation's
Chapter 4: Research Design 4-9

Exploring the Relationship of Organisational Culture to Enterprise Systems Success
products and services. Stakeholders influence programs, products, and
services’.
Thus, these groups are well placed to comment on the success of the Enterprise
System. The relationship of these groups to ES Success is shown in the following
figure:
Client Organisation
Implementation Partners
ES Vendors
ESS
Figure 4-2. Stakeholder groups informing on ES Success
Having established who informs on ESS, the next question considers the OC
component of the OC-ESS relationship.
4.4. RQ: Who can inform on OC external to the organisation?
The Organisational Culture element of the OC-ESS relationship requires
identification of the participants (called ‘actors’), who are able to inform on the OC
dimension within the target organisation. The literature review chapter discussed
who could inform on the culture of an organisation, the various ways to measure
OC, and the strengths and weakness of the different approaches. Applying these
findings to the study identifies ‘who’ can inform on the OC part of the OC-ESS
relationship.
Clearly the client organisation can inform on its own culture, and information can be
gathered by either qualitative or quantitative means. Certain participants within the
client organisation can be examined in order to obtain a picture of the culture
present within the organisation. In addition to members of the target organisations
Chapter 4: Research Design 4-10

Exploring the Relationship of Organisational Culture to Enterprise Systems Success
Chapter 4: Research Design 4-11
themselves being studied to form a view of the Organisational Culture, researchers
have identified that external, third parties should also be studied since these actors
can inform on the Organisational Culture perceived from an ‘outside looking in’
perspective (Schein, 1996). These external stakeholders (Freeman, 1984) of the
organisation should be close enough to the target organisation that they understand
the culture present within the target organisation, but not so close that they
‘become’ part of the culture. Typical examples of these stakeholders include
consultants, suppliers, buyers and even competitors – all these groups can provide
strong insights into the Organisational Culture of the client organisation.
These stakeholders are shown in the figure below:
Figure 4-3. Stakeholders informing on the Organisational Culture of the target organisation
We can see that there are common participants, shown in figure 4-3 in yellow, that
are also present in the ESS framework; these are the client organisation, ES vendor
and implementation consultants.
Thus we can see that these participants, client organisation, implementation
partners and vendors are well placed to provide insight into both the ES Success
and OC elements of the relationship. They are able to inform on the OC-ESS
relationship itself.
Client organisation
Implement Partners
CustomersES Vendors
Consultants Advisors
Suppliers Advisory Bodies e.g. Auditors, Advisors,
Partners Buyers
Sta
keho
lder
gro
ups
exam
ples
OC

Exploring the Relationship of Organisational Culture to Enterprise Systems Success
Chapter 4: Research Design 4-12
Figure 4-4. Participants informing on the OC-ESS relationship
Having identified these important actor groups we now need to identify ‘who’ in
these sets are best able to inform on the OC-ESS relationship. The identification of
the individuals (defined by role), located within these three stakeholder groups, was
guided by the primary research aims and objectives. Since we needed to focus on
the relationship rather than the part, the question specifically becomes, who can
inform on the relationship from these groups. The first actor group participant to be
addressed is the client organisation.
Client organisation: Who within client organisations can inform on the OC-ESS
relationship?
The client organisation was defined for the purposes of this study as ‘those
organisations that have implemented an ES application or ES extension, either
enterprise wide or in selected business units’. The client organisation could provide
clues to the relationship, in particular, the level of ES Success achieved, the culture
of the organisation, sub-cultures present in the organisation, the stage of diffusion
reached, issues relating to ES Success and issues relating to the ES product.
Within client organisations, not all employees will be in a position to inform on the
OC-ESS relationship to the same extent. Factors such as role, seniority, prior
experience and exposure to the ES come in to play. Yet there are internal
‘consultants’ that are in a unique position to inform on the OC-ESS relationship.
Internal consultants are known variously as Change Managers, Strategic Managers
and ES Project Managers; and they will have some key experiences to report.
These types of roles will be involved in ES implementation, adoption and diffusion,
Client Organisation
Implementation Partners
ES Vendors
OC ESS

Exploring the Relationship of Organisational Culture to Enterprise Systems Success
typically across a range of business units and across various stages of software roll
out.
Individuals in these roles will be able to comment on a range of aspects of the
relationship, for example, sub-cultures present throughout the organisation
(business unit specific and geographic specific), observations of an ES Success
across different business units and the specific product, functionality and ES
implemented. These internal change consultants (CC) were therefore identified as
suitable actors able to inform on the OC-ESS relationship.
The next participant group to be investigated was ES vendor firms.
ES vendor firms: Who within ES vendor firms can inform on the OC-ESS
relationship?
Vendors were defined as ‘those organisations that develop and sell the ES
applications and their extensions’ and include such organisations as SAP, Oracle
and Mincom. The vendors can obviously inform on the product features and its
functionality, but also the OC of the client organisation and the level of success
achieved for the ES.
Actors present within the ES vendors who may inform on the OC-ESS relationship
are:
Vendor Implementation Consultants (VC): These employees are employed
within the vendor firm, are specifically involved with the selection, development,
implementation and evolution of the ES package within the client organisation. The
VC’s are not only to provide insight into the ES itself but also the OC of the client
organisation and the level of success achieved by the ES.
The Vendor Implementation Consultants were therefore identified as suitable actors
able to inform on the OC-ESS relationship.
Who within Implementation partner firms can inform on the OC-ESS relationship?
The final actor group were the implementation partners which are considered next.
Implementation Partners: The implementation partners were defined as ‘those
firms that the client organisation has partnered with in order to implement and
diffuse the ES through the organisation’. These participants were identified as being
able to provide insights into the level of ES Success achieved, the culture of the
client organisation, any sub-cultures present, the diffusion stage reached and
issues relating to the ES product.
Chapter 4: Research Design 4-13

Exploring the Relationship of Organisational Culture to Enterprise Systems Success
However, again, within implementation partner there were clear roles that would be
better positioned than others to inform on the OC-ESS relationship. It was identified
that experienced implementation consultants (IC), employed within an
implementation partner firm, who have been involved in a range of ES
implementations across different organisations, industries and even ES products,
would be ideally placed to provide clues into the relationship.
The IC’s were therefore positioned to inform upon the OC-ESS relationship, in
particular dimensions of the Organisational Culture of the client organisation, the
relative level of success achieved, the stage of success achieved and possibly the
culture of the vendor firm.
The analysis has specified the precise roles (internal change consultants,
implementation consultants, and vendor consultants) within each agency (client
organisation, implementation partner and vendor consultant). The selected roles
are summarised in the table below:
Informing Upon Stakeholder Group
Participant role type and location within the OC-ESS relationship
OC ESS
Internal Stakeholders
Internal Change Consultants within the target organisation
External Stakeholders
Implementation Consultants
Vendor Consultants
Table 4-2. Roles within participant groups informing upon OC-ESS
Once the consultants types had been identified, a strict selection criteria for
participation in the study was developed in order to ensure that the study satisfied
the overarching criteria of:
1. exploring the relationship across the widest possible organisational and
industry settings
2. capturing the experiences from experienced participants in the relationship
3. exploring the relationship across a range of degrees of success.
Chapter 4: Research Design 4-14

Exploring the Relationship of Organisational Culture to Enterprise Systems Success
All the consultants participating in the study were required to satisfy the following
criteria:
Consultant Type Selection Criteria
All Have experienced at least one implementation of an Enterprise System
Are still involved with the client organisation
Have experienced both successful and less successful ES
Have a minimum of four years experience
Additional criteria for individual consultant categories
Currently employed within client organisation
Hold Middle to Senior Management positions
Experienced at least two ES innovations (for experience)
Employed in medium to large businesses
Have experienced ES innovations across at least two business units
Internal Change/Project
Managers
Are in a position to comment on how successful/unsuccessful that ES is
two to four years from ‘go live’
Implementation Consultants
Currently employed with implementation partner
Vendor Consultants
Currently employed in a vendor firm
Table 4-3. Consultant selection criteria
In summary, the actors, stakeholders and entities that were identified as best
placed to report upon experiences of the OC-ESS relationship are shown in the
following conceptual framework.
Chapter 4: Research Design 4-15

Exploring the Relationship of Organisational Culture to Enterprise Systems Success
Chapter 4: Research Design 4-16
Figure 4-5. Participants reporting on the OC-ESS relationship
Having identified the pivotal role that consultants play in the system, consideration
was then given as to how best explore their experiences and what data should be
collected. The first phase was to identify what data should be collected that could
best allow exploration of the OC-ESS relationship. The next section will first discuss
how the qualitative data was collected, followed by the quantitative data.
SAP
Oracl
MincoIBM
Accenture
KPMG BCG
Informing Upon:
ES Success internally Culture of the organisation Sub-cultures present
Project Managers Change
ManagersStrategic Managers
Defined As:
Those organisations that have implemented an ES application either enterprise-wide or in select BU’s.
Defined As:
Partner that assists with the implementation of the ES, development and integration. Providing technical support, advice and direction to the client.
Defined As:
A commodity seller of an ES application. Some vendors provide implementation and development support directly to the client
Informing Upon:
ES Success within target organisation Culture of the client organisation Culture of the vendor Features of the ES app
Informing Upon:
ES Success within client organisation Culture of the organisation Features of the ES
Implementation Consultants
Technical Consultants
Change Consultants
Client Org
Implement Partners
ES Vendors
OC ESS

Exploring the Relationship of Organisational Culture to Enterprise Systems Success
4.5. Data Collection Methods
This research applied a multi-method approach using both qualitative and
quantitative data. The next section discusses the qualitative data collection. This is
followed by a section on the quantitative data collection.
4.6. Qualitative Data Collected
An interview was used to extract and probe issues related to the OC-ESS
relationship. This allowed for rich data to be gathered, clarifying statements and
probing of the participants experiences of the relationship.
Sampling strategies in qualitative research differ from those employed in
quantitative research. Typically qualitative researchers work with small samples of
people situated in the study context (Miles & Huberman, 1994). Too many data
sources and the study will become unwieldy, too few and the richness of data is
lost. In reviewing the literature, both Yin (1994) and Miles & Huberman (1994)
suggest that dependent upon the level of detail in the data, 15 to 20 points
represent a good balance between data richness and manageability. The sampling
size also needed to recognise the constraints of time and resources present in all
PhD projects. The study protocol was therefore built up around the need to conduct
a minimum of 15 and up to 20 semi-structured interviews.
In the current literature there is no universally accepted theory and practise to
conducting a qualitative research interview. However, Steinar (1996) has attempted
to summarise the various aspects of a qualitative research interview presenting
twelve common aspects. In evolving the interview protocols these aspects helped
guide the development. We shall now take each of the aspects and consider how
they apply to the OC-ESS study.
1. Centred on the interviewees’ life world, the purpose is to describe and
understand the central themes the interviewee experiences.
Application to the OC-ESS study: Consultants and actors were identified as
being able to inform on the OC-ESS relationship through their own
experiences. That is the interviewees’ life world.
Chapter 4: Research Design 4-17

Exploring the Relationship of Organisational Culture to Enterprise Systems Success
2. Seeking to understand the meaning of phenomena in his/her life world, the
main task is to understand the meaning of what is said.
Application to the OC-ESS study: The semi-structured interview permitted
probing and clarification of the responses.
3. Qualitative – neither in the interview phase or the data analysis phase is the
primary purpose to obtain quantifiable responses.
Application to the OC-ESS study: The purpose of this element to the study
was to explore the relationship and the individual’s unique experiences. The
focus was in observation of the role of culture rather than the collection of
statistics.
4. Descriptive – the qualitative research interview aims at obtaining
uninterrupted descriptions.
Application to the OC-ESS study: The semi structured approach allowed
extensive probing. The questions themselves facilitated uninterrupted
descriptions of the phenomenon
5. Specific – seeks to describe specific situations and actions
Application to the OC-ESS study: Specifically exploring the OC-ESS
relationship in the context of Enterprise Systems
6. Presupposition less – rather than the interviewer coming with ready made
categories and schemes of interpretation, the implication is one of
openness. The interviewer should be curious and sensitive to what is said.
Application to the OC-ESS study: No categories or schemes of description
were pre prepared prior to interview data being collected. Probing and
articulation questions were used in the semi-structured interview.
7. Focused upon certain themes – not strictly structured and not entirely non-
directed but focussed on certain themes
Application to the OC-ESS study: The interviews were designed to be semi-
structured. Focussed on the OC-ESS theme but full exploration was allowed
of the interviewees’ experiences with OC, ES and OC-ESS.
8. Open for ambiguities – contradictions and ambiguities are common in
research interviews
Application to the OC-ESS study: These were surfaced and probed in the
semi-structured interview.
Chapter 4: Research Design 4-18

Exploring the Relationship of Organisational Culture to Enterprise Systems Success
9. Depends upon the changes – during an interview an interviewee may
discover new aspects and relationships which he/she may not have been
aware of before, the process of reflection caused during the interview is
acceptable
Application to the OC-ESS study: The use of extensive questioning allowed
the pursuit of new aspects of the relationship in the OC-ES to be
discovered.
10. Sensitivity of the interviewer – interviews by different interviewers using the
same interview guide may be different due to varying sensitivity by the
interviewer.
Application to the OC-ESS study: Sensitivity of the interviewer was
improved as the interviewers skills improved. However, the one interviewer
conducted all the interviews.
11. An interpersonal interaction – interviewee and interviewer react in relation to
each other; the interviewer needs to be conscious of the inter-personal
dynamics within the interaction and take it into account in the interview
analysis
Application to the OC-ESS study: The semi-structured interview allowed
extensive interaction to occur, it was not simply the interviewer delivering a
set of scripted questions.
12. May be a positive experience – the interview may be a favourable
experience for the interviewee and can be an enriching experience for the
interviewee.
Application to the OC-ESS study: After the interviews many of the
interviewees commented on the positive experience that they had.
Qualitative data was therefore collected via a semi-structured interview.
After the qualitative data collection, quantitative data was collected.
Chapter 4: Research Design 4-19

Exploring the Relationship of Organisational Culture to Enterprise Systems Success
4.7. Quantitative Data Collected
The purpose for the collection of quantitative data was two fold:
1. to gather further data regarding the individual examples given by the
interviewees, the data collected informing further on OC-ESS relationship
2. to further elaborate upon the relationship between Organisational Culture
and ESS. The quantitative data allowed for the benchmarking and
quantification of the Organisational Culture type and the level of ESS
experienced
Two sets of quantitative data were collected. The quantitative instruments
themselves are detailed in Chapter 2.
First Quantitative Data Set: Consultants (Pilot + Main)
Each consultant was asked to complete the OCAI culture instrument for each of the
ES innovations (1x successful and 1x least successful) discussed during the
interviews. Therefore a total of two responses from each consultant was collected;
twenty consultants giving a grand total of 40 completed OCAI. The OCAI allowed
quantification of the actual culture type the consultants were describing for their
least successful and most successful ES examples
Second Quantitative Data Set: Revelatory Case Study
Whilst quantitative data was collected from the consultants a further collection of
data was undertaken through the revelatory case study. The revelatory case study
is fully detailed in Chapter 5. Both the OCAI and ESS instruments were
administered to the organisation, with the purpose of conducting a cross-case
analysis.
In summary, both qualitative and quantitative data was collected from the
consultants. The qualitative data collected was interview transcripts of the
consultants’ experiences of the OC-ESS relationship. The quantitative data
collected was survey data of the OC-ESS relationship. The figure below
summarises the data types collected from the participants in the study:
Chapter 4: Research Design 4-20

Exploring the Relationship of Organisational Culture to Enterprise Systems Success
Revelatory Case Study
VC
VC
VC IC
IC
IC
VC IC
CCCC
CC
Qualitative Interview Transcript
Quantitativ OCAI Survey
Qualitative Interview Transcript
Quantitativ OCAI Survey
Qualitative Interview Transcript
Quantitativ OCAI Survey
Implementation Consultants Vendor
Consultants
Change Managers
Qualitative
Quantitativ
Interview
OCAI SurveyESS Survey
Client Org
Implement Partners
ES Vendors
OC ESS
Figure 4-6 Data collected from the various participants in the study
The next section discusses how the data was collected at the various points in the
study design.
Chapter 4: Research Design 4-21

Exploring the Relationship of Organisational Culture to Enterprise Systems Success
4.8. RQ: How was the data collected?
This section describes how the qualitative and quantitative data was collected.
Each of the data collection phases resulted in separate outputs. The key data
collection phases for the study were the consultant’s (pilot and main) phase and the
revelatory case study. The extract from the overall design shown below identifies
the key data collection points for the study:
Consultant Study Revelatory Case Study Qualitative
Qualitative
Figure 4-7. Data collection points for the study
Each of these phases resulted in further data being collected that could be used in
the cross-analysis phase to inform on the relationship. The outputs from each
phase are shown in the following figures.
Pilot Study Qualitative
+ Quantitative Consultant Study
Quantitative Revelatory Case
Study Quantitative
Cross Case Analysis
Data Collection Phase 1
Data Collection Phase 2
Data Collection Phase 3
Research Aims Literature Review
Study Design
Chapter 4: Research Design 4-22

Exploring the Relationship of Organisational Culture to Enterprise Systems Success
4.9. Pilot Study Data Collection
Figure 4-8. Pilot data collected
The pilot study was designed to provide six interview transcripts for analysis and 12
completed OCAI surveys (two from each consultant). A key purpose of the pilot
study was to begin the process of collecting data.
In addition to assisting with meeting one of the primary research objectives, the pilot
study was also undertaken in order to test the reliability of the field study protocols,
the appropriateness of the interview questions and to provide an opportunity for
testing proof of concept. As can be seen from the design the pilot study allows not
just for data collection but also periods of review and reflection. This ability to fine
tune and adapt the protocol accordingly was an important objective of the pilot
study and an important part of the overall study, the findings from the pilot did not
just inform on the research objective itself but also the suitability of the design in
enabling the meeting of those objectives.
4.10. Main Consultant Data Collection
Figure 4-9. Design sequence: main study location
Pilot Study
Cross Case
Analysis
Research Aims Literature
Review Study
Main Study
Revelatory
Case Study
Pilot Study Qualitative
+ Quantitative
Transcripts (x6)
Revised Protocol
Survey Interview
Revise
Action Reflect
Survey (x12)
Chapter 4: Research Design 4-23

Exploring the Relationship of Organisational Culture to Enterprise Systems Success
The next data collection phase was from the consultants forming the main
consultant study. This second round of data gathering was designed to provide a
further 14 interview transcripts and 28 completed OCAI surveys (again two from
each consultant). The full data collection process and protocols are discussed in
Chapter 6: The Consultant’s Study. The interview and data collection protocols
were evolved following the pilot study – see Chapter 5 for details. However, the fine
tuning resulted only in minor changes to the interview questions. The core elements
remained the same and no changes were made to the quantitative instruments.
4.11. Revelatory Case Study Data Collection
Pilot Study
Cross Case Analysis
Figure 4-10. Design sequence: revelatory case study location
The final round of data was collected during the revelatory case study. Quantitative
and qualitative data was again collected but with the addition of the quantitative
ESS instrument. Change managers were interviewed and experienced users were
invited to complete the OCAI and ESS instruments. The full data collection protocol
is discussed in Chapter 6: The Revelatory Case Study.
The various elements to the study were designed to capture data in such a way as
to assist with answering the primary research question, whilst capturing as a broad
a range of experiences of the OC-ESS relationship as possible.
Protocols
Yin (1994) has stated that having a protocol for qualitative research is essential and
assists in the clarification, data collection and analysis of the data. Full data
collection protocols and interview protocols were developed for the study. The
specific protocol items developed for the study were adapted from those identified
by Yin (1994) and are shown below:
1. An overview of the project
2. Field procedures (credentials and access to the study sites, general sources
of information and procedural reminders)
Revelatory Case Study
Main Study
Research Aims
Literature Review Study
Chapter 4: Research Design 4-24

Exploring the Relationship of Organisational Culture to Enterprise Systems Success
Chapter 4: Research Design 4-25
3. Interview questions (the specific questions that the case study investigator
must bear in mind in collecting the data and the potential sources of
information for answering each question)
4. A guide for the report
Pre-Interview Instrument, Interview Questions and Script
To encourage implementation firms, client firms and vendor firms to participate in
the study, consideration was given with regard to the confidentiality and anonymity
of the research participants. It was felt that whilst the implementation consultants
may be comfortable in giving details of their own firm and themselves, they would
be unwilling, or unable, to divulge specific identification of the client organisation.
Change consultants similarly were unlikely to be able to divulge details that could
lead to the identification of their organisation. In reality, the identity of the individual
or the organisation was not required to explore the OC-ESS relationship. The
exploration was of the relationship, not the individual, and so total anonymity whilst
beneficial for the participants did not affect the research aims. The exploration of
the OC-ESS was not influenced either positively or negatively by reporting on the
individual consultant or organisation.
Instruments to assist the consultants in thinking about their experience prior to the
interview were sent one week prior to the interview. The pre-instrument simply
sought to help the respondent think about the extended ES IT innovations that they
had experienced. The protocol called for examples of ES that were at least two
years post ‘go live’.
The purpose of providing the instrument was two fold, firstly, to avoid the
respondent feeling ‘put on the spot’ and struggling for examples in the interview.
Secondly, it gives the interviewee some time to really consider which the most and
least successful examples were. Internal, vendor and implementation consultants
were sent different packs to reflect the different organisational settings in which they
operate. However, all interviewees were asked the same questions in the interview.
The formal field procedures, interview questions are shown in Appendix 4.1, 4.2,
4.3, 4.4 and 4.5.

Exploring the Relationship of Organisational Culture to Enterprise Systems Success
4.12. Research Design Summary
The previous sections have discussed how the various elements of the research
design evolved in order to complete a robust research design that would allow the
researchers to fully explore the OC-ESS relationship. The key characteristics of the
design were:
• Widest possible variations in the experiences were actively sought
• Implementation partner, vendor partners and client organisations were
identified as the key stakeholder groups with in the relationship
• The need for a pilot, main and revelatory case study elements was identified
• Experienced individual consultant types were identified as being able to
inform on the OC-ESS relationship
• Fifteen to twenty interviews was identified as being the suggested number
• A multi-method approach was chosen in order to capture qualitative and
quantitative data of the experiences of the relationship
• Avoid bias
Each of the guiding study questions was addressed as summarised in the following
table:
Guiding Study Research Questions Resolution
How can we explore the relationship between
Organisational Culture and ES Success in the real
world?
Multi-method approach, capturing actors
experiences of the OC-ESS relationship
Who can inform on the OC-ESS relationship? Change consultants from client organisations
Implementation consultants from ES vendors
and partner consultants
What data will need to be gathered? Semi-structured interviews and surveys and
OCAI + ESS survey data, capturing the
respondents’ least and most successful ES
experiences
How will the data be collected? Pilot study, consultant study and revelatory case
study
Table 4-4. Guiding study questions addressed in the design
The next chapter discusses the first data collection phase, the pilot study, and
reports on the actual data collection, analysis and findings from this first phase.
Chapter 4: Research Design 4-26

Exploring the Relationship of Organisational Culture to Enterprise Systems Success
Chapter 5: The Pilot Study 5-1
Chapter 5
Pilot Study

Exploring the Relationship of Organisational Culture to Enterprise Systems Success
Table of Contents – Chapter 5 Pilot Study
5. Introduction: The Pilot Study .....................................................................5-4
5.1. Qualitative Data Collected .........................................................................5-5
5.2. Qualitative Data Analysis...........................................................................5-7
5.3. Qualitative Results: First Pass – Open Coding .......................................5-12
5.4. Qualitative Results: Second Pass – Axial Coding ...................................5-19
5.5. Qualitative Results: Third Pass – Selective Coding ................................5-27
5.6. Pilot Results.............................................................................................5-28
5.6.1. Quantitative Component ............................................................................. 5-28
5.6.2. Quantitative Results Pilot Study.................................................................. 5-28
5.7. Pilot Qualitative Protocol Reflections.......................................................5-33
5.8. Pre-Interview Instruments........................................................................5-33
5.9. Existing Question Changes .....................................................................5-33
5.10. Question Addition ....................................................................................5-34
5.11. Interview Duration....................................................................................5-35
5.12. Summary .................................................................................................5-36
5.13. Reflections on Instruments ......................................................................5-36
Figures
Figure 5-1. Study design .....................................................................................5-4
Figure 5-2. Pilot study elements ..........................................................................5-4
Figure 5-3. Process of qualitative data collection, analysis and outputs (adapted
from (Stewart, 2001)..........................................................................................5-10
Figure 5-4. OCAI mean plot for the pilot study – both successful and least
successful ES innovations.................................................................................5-30
Chapter 5: The Pilot Study 5-2
Exploring the Relationship of Organisational Culture to Enterprise Systems Success
Tables Table 5-1. Interview numbers by consultant category ............................................5-5
Table 5-2. Pilot interview statistics .........................................................................5-5
Table 5-3. Qualitative analysis method ..................................................................5-7
Table 5-4. Themes identified during first pass open coding .................................5-13
Table 5-5. Themes emerging in the second pass pilot data.................................5-26
Table 5-6. OCAI example scores .........................................................................5-29
Table 5-7. OCAI mean results from pilot study.....................................................5-30
Table 5-8. Summary of changes to study following pilot ......................................5-36
Chapter 5: The Pilot Study 5-3
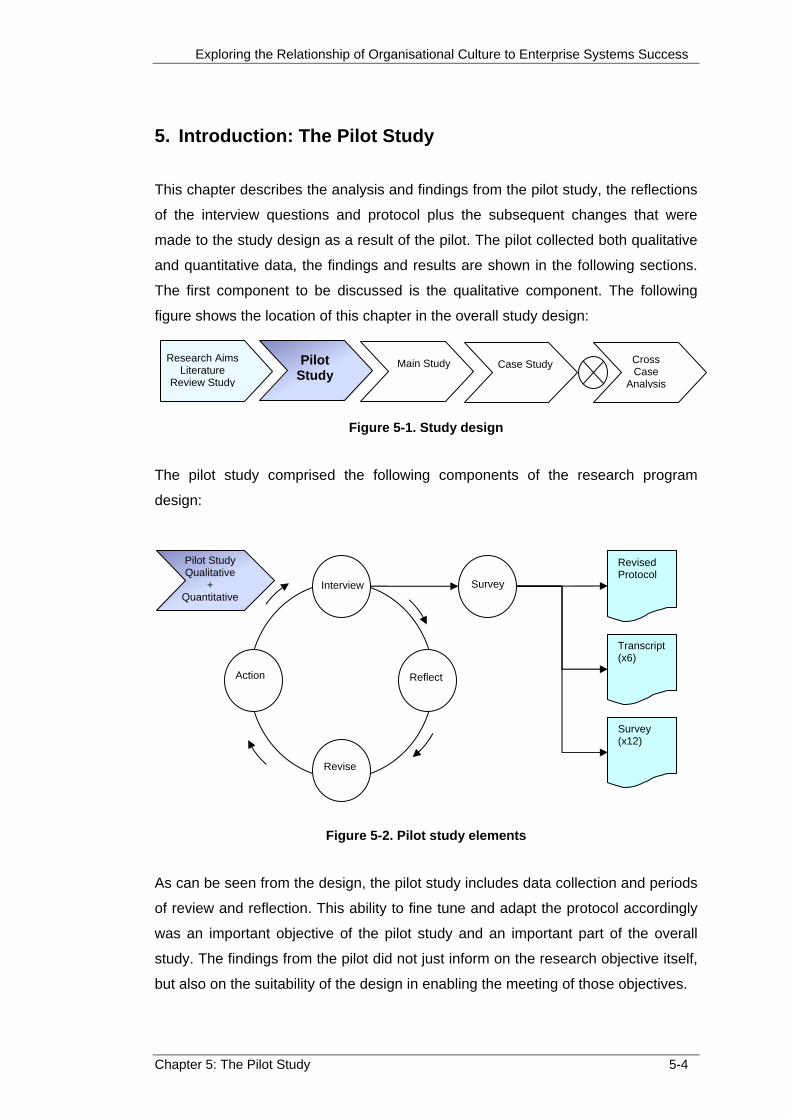
Exploring the Relationship of Organisational Culture to Enterprise Systems Success
Chapter 5: The Pilot Study 5-4
5. Introduction: The Pilot Study
This chapter describes the analysis and findings from the pilot study, the reflections
of the interview questions and protocol plus the subsequent changes that were
made to the study design as a result of the pilot. The pilot collected both qualitative
and quantitative data, the findings and results are shown in the following sections.
The first component to be discussed is the qualitative component. The following
figure shows the location of this chapter in the overall study design:
Figure 5-1. Study design
The pilot study comprised the following components of the research program
design:
Figure 5-2. Pilot study elements
As can be seen from the design, the pilot study includes data collection and periods
of review and reflection. This ability to fine tune and adapt the protocol accordingly
was an important objective of the pilot study and an important part of the overall
study. The findings from the pilot did not just inform on the research objective itself,
but also on the suitability of the design in enabling the meeting of those objectives.
Pilot Study Qualitative
+ Quantitative
Transcript(x6)
Survey (x12)
Revised Protocol
Survey Interview
Revise
Action Reflect
Pilot Study
Cross Case
Analysis
Research Aims Literature
Review Study
Main Study
Case Study

Exploring the Relationship of Organisational Culture to Enterprise Systems Success
Chapter 5: The Pilot Study 5-5
5.1. Qualitative Data Collected
The pilot study protocol called for the collection of data from six interviews taken
from the following consultant categories. Interviews were digitally recorded and the
files transcribed. The table below shows the number of interviews conducted with
the various consultant categories.
Implementation
Partner
Consultants
Vendor
Consultants
Public Sector
Internal
Consultant
Private
Sector
Internal
Consultant
Pilot Study Numbers
Targeted
2 2 1 1
Pilot Study Numbers Actual 0 3 1 1
Table 5-1. Interview numbers by consultant category
Due to access considerations a total of five interviews were completed in the pilot
phase. The interview times varied in length with the longest interview taking 58
minutes, whilst the shortest was completed in 25 minutes. The transcript lengths
also varied; the longest transcript was 9,699 words in length (17 pages) and the
shortest 3,544 words in length (7 pages). Details for all the pilot interviews are
shown in the table below, the interviews are sequenced in chronological order:
Interview Time (mins) Words Passages Pages1 26 3544 126 72 25 3782 133 83 38 5923 206 124 51 7249 346 155 58 9699 228 17
Min 25 3544 126 7Max 58 9699 346 17
Average 40 6039 208 12
Table 5-2. Pilot interview statistics
The interview statistics show some reasonably large variances in the length and
duration of the interviews. In particular, we can see that interviews one and two
were the shortest whilst four and five were the longest. There was a noticeable
trend of increasing length and word count with each successive interview.
As more interviews were conducted it was noticed that there was a distinct increase
in the interviewers own skills as a qualitative researcher. Since these early

Exploring the Relationship of Organisational Culture to Enterprise Systems Success
interviews were the first attempts at conducting qualitative interviews, the
researchers own skills gradually improved with each interview. The first interviews
were rather mechanical, the questions were read out to the interviewee, who then
responded and the next question was asked.
However, as the researcher became more comfortable with the process and the
questions, probing and exploration of the interviewee’s responses was increasingly
undertaken. The interview, whilst still semi-structured, became a lot more engaging
and discursive.
During coding of the transcripts the number of manifestations, utterances and
patterns identified increased dramatically from interview two onwards. The data
became richer and fuller, as a direct result of the improvements in the researchers
own skills. This does not diminish the findings from the first interviews, they have
still contributed to the research, but the data that was being collecting from later
interviews became richer and more informing on the OC-ESS relationship.
Not only were the pilot interviews a good test of proof of concept of the research
design, they were an excellent opportunity for the researcher to hone his own skills
as a qualitative researcher.
We shall now consider the methods used in the analysis of the interview transcripts.
Chapter 5: The Pilot Study 5-6

Exploring the Relationship of Organisational Culture to Enterprise Systems Success
5.2. Qualitative Data Analysis
Many researchers place great emphasis upon the manner and method in which the
data is analysed. It has been argued that it is important to have a general analytic
strategy from the outset since the overall goal is to treat the evidence consistently
and to produce compelling conclusions (Yin, 1994). Conducting qualitative data
analysis can be carried out in a number of different ways. Miles & Huberman (1994)
suggest that there are nine ways as shown in the table below:
Qualitative Analysis Method Adopted for the
OC-ESS study?
1. Contact summary sheet – a simple way to summarise time limited data, the researcher reviews written up field notes and answers each question briefly to develop summaries of the main point in the contact.
2. First level coding
3. Second level or pattern coding
4. Memoing x
5. Case analysis meeting x
6. Interim case summary x
7. Vignette x
8. Pre-structured case x
9. Sequential analysis x
Table 5-3. Qualitative analysis method
This study adopted coding for the qualitative data analysis. Coding data in
qualitative research has a different meaning and role to quantitative data coding
and analysis (Neuman, 2000). A researcher organises the data in qualitative
research into conceptual categories and creates themes and concepts. ‘Codes are
tags or labels for assigning units of meaning to the descriptive or inferential
information complied during a study. Codes usually are attached to “chunks” of
varying size – words, phrases, sentences or whole paragraphs, connected or
unconnected to a specific setting’ (Miles & Huberman, 1994). To code data into
themes a researcher needs to be able to first identify the themes running through
the data and it requires four skills to accomplish this:
• recognise patterns in the data
Chapter 5: The Pilot Study 5-7

Exploring the Relationship of Organisational Culture to Enterprise Systems Success
• think in terms of systems and concepts
• posses tacit knowledge or in depth background knowledge
• have the necessary relevant information (Neuman, 2000)
Once the researcher is able to decipher and identify themes in the data the
production of codes can begin. According to Boyatzis (1998) codes comprise five
parts:
1. a one to three word label
2. a definition
3. a flag description of how to recognise the code in the data
4. any exclusions or qualifications
5. an example
Strauss (1987) describes three kinds of coding; the researcher reviews the data
three times and on each occasion uses a different code, so that the same data is
coded in three separate passes. Strauss’ approach was adopted for this study.
First Pass - Open Coding
The themes in the data were surfaced based on the initial research question and
concepts that had been identified in the literature. Some researchers suggest that
the researcher should begin the coding with a pre-defined list of concepts (Miles &
Huberman, 1994), whilst other researchers suggest that the first pass coding should
be undertaken with no preconceived concepts, (Glaser & Strauss, 1967). However,
Neuman (2000) argues that regardless of whether or not the researcher begins with
a list of themes, a list of themes should result out of the first pass coding. The data
was coded inline with the research question and the themes identified in the
literature as per Miles & Huberman (1994).
Second Pass – Axial Coding or Pattern Coding
A second pass was then undertaken to identify clusters of categories. This is in
contrast to the initial open coding. Whilst first level coding is a way of summarising
segments of data, pattern coding seeks to group those summaries into smaller sets
of themes (Neuman, 2000).
The second pass resulted in categories that were clustered around central themes.
Chapter 5: The Pilot Study 5-8

Exploring the Relationship of Organisational Culture to Enterprise Systems Success
Third Pass – Selective Coding
Selective coding was then undertaken. This involved scanning the data and the
previous codes, looking for cases that illustrated the themes or patterns identified in
the first two passes. By comparing and contrasting these patterns the major themes
identified were further consolidated.
These qualitative analysis techniques were applied to the pilot study data. The
interview transcripts were analysed using the NVivo Software package, developed
by QSR (Bazeley & Richards, 2000). NVivo is a powerful research tool that assists
with pattern coding of the transcripts. The researcher documents text at nodes to
track emerging theories, themes and concepts. Nodes can then be organised into
sets, clusters and hierarchies as the researcher progresses through the data on
subsequent passes.
On the first pass, the transcripts were analysed looking for key themes and
assigned initial codes to form the data into broad categories in a semi-open
manner, i.e., informed in part by findings in the literature. The themes were based
on the researcher’s understanding of the problem, broad concepts that had been
identified in the literature review and the researcher’s own prior experience.
Once the first pass had been completed, a second pass was conducted beginning
with the organised set of initial codes. This axial coding further consolidated the
themes into clustered groups and hierarchies.
The data was then subjected to a third pass, selective coding. This was not carried
out until all the interview data for interviews 1 to 15 had been collected. Additionally,
it was carried out before the OCAI data from the interviews and case study had
been analysed. This was to ensure that no propositioning of the results was
incurred. Here, both the data and previous codes were scanned for cases that
illustrated the themes and patterns specifically identified in the OCAI and ESS
literature. The cases that demonstrated the themes were compared and contrasted
with each other in order to further complete the major themes that had been
identified.
It became clear from the pattern coding during the first and second passes, that
visible manifestations of the OC-ESS relationship were being surfaced from the
pilot interviews. Themes and patterns emerged that described the components of
the relationship. The figure below summarises the steps taken during the pilot
interview data collection and analysis:
Chapter 5: The Pilot Study 5-9

Exploring the Relationship of Organisational Culture to Enterprise Systems Success
Conduct Interviews
Transcribe Tapes
First Pass Open
Coding
Second Pass Axial
Coding
Third Pass Selective Coding
Interview Tapes
Clusters of Categories identified
Categories identified against OCAI + ESS instruments
Finalised list of categories, hierarchies
List of themes identified.
Text Files
Figure 5-3. Process of qualitative data collection, analysis and outputs (adapted from (Stewart, 2001)
Verification or truthfulness
According to Glaser and Strauss, the researcher and the reader, “share a joint
responsibility’ for establishing the final value of the qualitative research product’,
(Glaser & Strauss, 1967: 232). Patton has stated that the, ‘pragmatic validation
means that the perspective presented is judged by its relevance to and use by
those to whom it is presented: their perspective and actions joined to the
researcher’s perspective and actions’, (Patton, 1990: 485).
Strauss & Corbin (1990: 250) believe that when judging qualitative work, the ‘usual
cannon of good science require redefinition in order to fit the realities of qualitative
research and the complexities of social phenomena, significance, theory
observation compatibility, generalisability, consistency, reproducibility, precision
and verification’. Verification involves, ‘looking for evidence in the data to verify our
statements of relationship’ whilst ‘also looking for instances when they might not
hold up’, Strauss & Corbin, 1990: 108). The developed theory is actually verified by
the rigorousness of the research process (Strauss & Corbin, 1990:109). They argue
that the steps within the data analysis offer verification, ‘throughout the course of a
research project, rather than assuming that verification is possible only through
follow up research’ (Strauss & Corbin, 1994: 274).
Chapter 5: The Pilot Study 5-10

Exploring the Relationship of Organisational Culture to Enterprise Systems Success
The reliability of qualitative research in general refers to the replicability of results, ‘if
another researcher repeated the research project, what is the probability that he or
she would arrive at the same results’, (Booth 1992: 64). However this may not be a
reasonable question to ask, since the intricacies of the method applied by different
researchers will not be the same, (Marton & Svensson, 1985). Data analysis
involves a researcher constituting some relationship with the data and the
researcher’s unique background is an essential part of the relationship.
Clearly the qualitative researcher bears much of the burden for discovering and
interpreting the data and drawing conclusions. However utilising sound and
established research approaches and building a strong research design the
researcher can offer up the results and the design as true to the data. In this study
evidence for the trustworthiness of the data and the analysis was the coding
approaches taken and the analysis of the data with the involvement of the research
team and the participants at various stages.
Chapter 5: The Pilot Study 5-11

Exploring the Relationship of Organisational Culture to Enterprise Systems Success
Chapter 5: The Pilot Study 5-12
5.3. Qualitative Results: First Pass – Open Coding
At the highest level, manifestations emerged from the transcripts that presented a
distinct hierarchy. For example, one of the broadest themes that emerged was
‘management influences’. This is the manner in which ‘management’ was
influencing, impacting or otherwise interacting with the relationship between
Organisational Culture and ESS. Many of the statements that interviewees made
concerned the role of management in the OC-ESS relationship, statements such
as:
‘… but I also think that management or whoever runs the company needs to
be, I guess, helping to sustain a particular culture.’
and
‘I believe a more positive management supported implementation creates a
positive environment where users learn more quickly and retain the
knowledge because it is seen as important.’
‘SAP was seen as something for admin staff, not for use at managerial level,
and so consequently, that negativity perpetuated through the system.’
Looking at statements such as these through a cultural lens indicates that
‘management’ is an important component in the OC-ESS interaction. The role of
management could be seen as an enabler or inhibitor to the success of the ES.
From an Organisational Culture perspective, the ‘environment’ that management
helped to foster appears to affect the relative success or not of the ES.
This process of coding through the pilot transcripts continued during the first pass
coding until no more high level themes could be identified in the data. As per
Boyatzis (1998) each major theme had its attributes described by:
1. a one to three word label
2. a definition
3. a flag description of how to recognise the code in the data
4. any exclusions or qualifications
5. an example
The final result of the first pass coding is shown in table 5-4 overleaf.
Following the table is a discussion on the how the themes emerged from the data.

Exploring the Relationship of Organisational Culture to Enterprise Systems Success
Label Definition Looking for Not Examples
1. Management Influences The manner in which 'management' was influencing,
impacting or otherwise interacting with the relationship
between Organisational Culture and ESS
Management, managers,
leader, owners, managerial,
leaders
Users ‘… but I also think that management or whoever runs the
company needs to be, I guess, helping to sustain a particular
culture’
2. Change Management Organisational change management is the process of
developing a planned approach to change in an
organisation
Change, change
management, change
process
‘I think one of the major reasons for the success was strong
management commitment and also strong focus on change
management. I think those were the factors clearly identified at
the beginning of the project which would probably lead to
success or failure.’
3. Employee Development The way and manner in which the OC is supporting,
developing and nurturing employees
Development, support,
training, education, training
‘They never spent much money on training.’
4. Admin Policies
Procedures
How does the organisation conduct its admin policies
and procedures and in what way do these activities:
A. demonstrate the OC type
B. influence the success of the IT innovation
Admin, policies,
procedures, manuals,
documentation
‘Agreed, it is seen as and administrative tool for the secretary or
sales assistant to enter orders and produce reports.
Consequently, even with specialised training and help guides
there is a resistance to use the system, together with a general
lack of enthusiasm.’
5. Learning Organisation Learning organisations are corporations that overcome
inherent obstacles to learning and develop dynamic
ways to pinpoint the threats that face them and to
recognize new opportunities (Senge 1994).
Learning, innovative,
creative, training,
knowledge, learnt
Just referring to
training
‘And they just started expanding their own solution based on this
success, and were using the principles they learnt in the first
one.’
6. Project Management Project management is the discipline of organising and
managing resources in such a way that these
resources deliver all the work required to complete a
project within defined scope, time, and cost constraints.
On time, deadlines, budget,
project, project
management, cost,
resources
‘That’s an integral part of the project and it’s addressed right up
front and money is budgeted towards that.’
7. Business Processes A specific ordering of work activities across time and
place, with a beginning, and an end, and clearly
identified inputs and output (Davenport 1993).
A collection of activities that takes one or more kinds of
input and creates an output that is of value to the
customer (Hammer & Champy 1993).
Business process, BPM,
BP reengineering, models,
modelling, process view,
processes
‘You can’t drag them along to that; they’ve got to take the step. In
a lot of cases their not integrated in their business processes, this
is before they put an integrated package in.’
Table 5-4. Themes identified during first pass open coding
Chapter 5: The Pilot Study 5-13
Exploring the Relationship of Organisational Culture to Enterprise Systems Success
Discussion
Within many of the comments made by the interviewees the statements indicated at
the broadest level that the general influences of what we called Management
Influences were numerous. This very high level category covered a very broad
range during the first pass. Subsequently this high level category was broken down
into many categories such as Leadership, Vision, Style and Control. But from the
first coding this general theme of Management Influences proved to cover a wide
range of manifestations.
Change Management (CM) This category was removed in the main study – since on reflection it was more
concerned with the diffusion of the innovation, learning organisation, TAM
dimensions.
Employee Development (ED) A theme surfaced out of the data that reflected issues of employee support,
nurturing and development of the employees in the organisation. The interviewees
surfaced issues of the OC supporting the users along a whole range of issues –
these included change programs, skills development and training. The way in which
the OC not just supported but also enabled these support structures to be active
seemed to be important to the OC-ESS relationship.
Statements were made such as:
‘An understanding of integration of systems, whether they’re IT or otherwise
and the training and implementation requirements surrounding them.’
‘We had training teams, I think about sixteen people just writing and then
delivering over 2000 going, we did over two thousand training sessions.’
‘But there are support mechanisms in place so that when people are using
the system, it doesn’t lead to frustration.’
Discussion
The ED theme itself was identified as a top level since the statements made in the
interviewees were hinting at particular aspects of ED as being important in the
relationship. Employee Development encompassed more than just training, it was
also concerned with the level, type and method of support in which the organisation
and management were supporting employees with the diffusion of the innovation.
Chapter 5: The Pilot Study 5-14

Exploring the Relationship of Organisational Culture to Enterprise Systems Success
ED contained statements about the nature of the Information System and the
employee support for knowledge, use and general Management attitude towards
user support.
Admin Policies Procedures (AP) Another broad theme that surfaced during early analysis of the pilot interviewee
data was that of Admin Policies and Procedures (AP). References were made that
the method, nature and degree of ‘administration’ was influencing the OC-ESS
relationship. Several broad themes were raised:
1. The way in which the organisation conducted its administration policies and
procedures
2. The amount and reliance on administration
3. The importance that management placed on compliance with the admin
policies and rules
Statements were made in regards to AP such as:
‘SAP was seen as something for administration staff, not for use at
managerial level, and so consequently, that negativity perpetuated through
the system.’
‘before you do an installation they have all these wonderful spreadsheets
and custom built systems, and they’re so used to it’
‘It’s like using old, years ago we used to have old paper payroll, we used to
have pay cards with everyone’s name on it. Now it’s just, everything is like
automated including, even our leave forms.’
‘We had to have a lot of infrastructure to help people get to accept the
system and I think that was the success of the system because it was not
only the technical part but there was a lot of policy procedure, work
practice reviews as well.’
Discussion
We can see from the above statements that general observations were made that
reflected administration issues. There were many statements made similar to these
that indicated the organisations manner of administration was involved in the OC-
ESS relationship. How the organisation managed the policies and procedures of
Chapter 5: The Pilot Study 5-15

Exploring the Relationship of Organisational Culture to Enterprise Systems Success
their systems, looking through these via a cultural lens, suggested that some
components of these were indicative of cultural dimension within the organisation.
Learning Organisation (LO) A further theme also emerged during the early coding of the pilot interviewees, this
was the Learning Organisation. The pilot interviewees surfaced issues involved with
an organisations ability to learn and the nature of the organisations culture in
allowing learning (and mistakes) to take place. For example, following statements
were made:
‘… but the users wanted to learn and I think that that’s essential’
‘Users had a longer term view of becoming a learning organisation, with
skilled resources and the implementation was viewed as an opportunity to
increase skill.’
‘Everyone’s learning.’
‘We actually worked very well and I think that created the success, because
we used some of their learning’s, but we also used some of our learning’s as
well.’
Discussion
Issues such as obstacles to Learning or a culture enabling Learning seemed
important in a number of the examples discussed during the pilot interviews. High
level themes were identified that suggested the role of Learning within an
organisation appeared important in the OC-ESS relationship. The statements
suggested that the degree to which the organisation fostered, supported and
enabled learning within the organisation were important. This first pass was again a
high level pass through the data but a large theme category formed around this
category.
Project Management (PM) The literature had already indicated that implementation, exploitation and
embedding of an ES within an organisation are a complex ongoing project. We
would therefore expect to find some references made to PM type issues, and in the
pilot data there were early indications of PM elements being active in the OC-ESS
relationship. Much has been written on the nature, management and success of
projects, the PM literature is a wide ranging, mature, well established research field.
Chapter 5: The Pilot Study 5-16
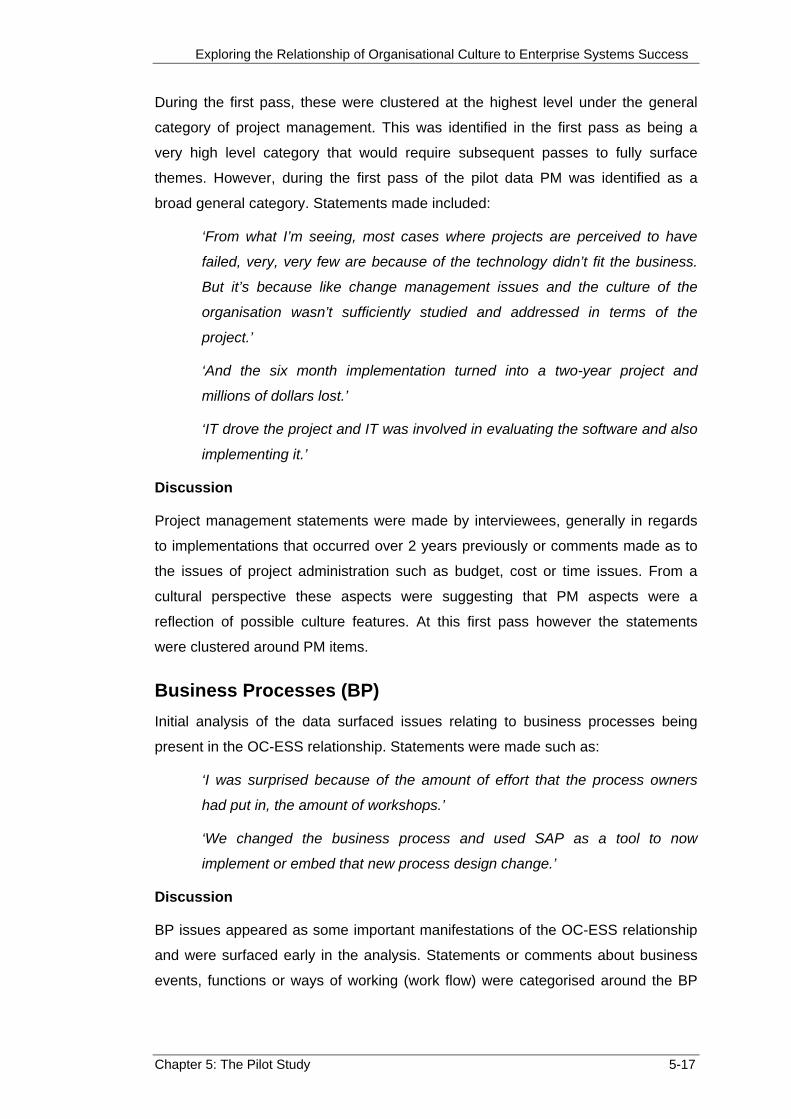
Exploring the Relationship of Organisational Culture to Enterprise Systems Success
During the first pass, these were clustered at the highest level under the general
category of project management. This was identified in the first pass as being a
very high level category that would require subsequent passes to fully surface
themes. However, during the first pass of the pilot data PM was identified as a
broad general category. Statements made included:
‘From what I’m seeing, most cases where projects are perceived to have
failed, very, very few are because of the technology didn’t fit the business.
But it’s because like change management issues and the culture of the
organisation wasn’t sufficiently studied and addressed in terms of the
project.’
‘And the six month implementation turned into a two-year project and
millions of dollars lost.’
‘IT drove the project and IT was involved in evaluating the software and also
implementing it.’
Discussion
Project management statements were made by interviewees, generally in regards
to implementations that occurred over 2 years previously or comments made as to
the issues of project administration such as budget, cost or time issues. From a
cultural perspective these aspects were suggesting that PM aspects were a
reflection of possible culture features. At this first pass however the statements
were clustered around PM items.
Business Processes (BP) Initial analysis of the data surfaced issues relating to business processes being
present in the OC-ESS relationship. Statements were made such as:
‘I was surprised because of the amount of effort that the process owners
had put in, the amount of workshops.’
‘We changed the business process and used SAP as a tool to now
implement or embed that new process design change.’
Discussion
BP issues appeared as some important manifestations of the OC-ESS relationship
and were surfaced early in the analysis. Statements or comments about business
events, functions or ways of working (work flow) were categorised around the BP
Chapter 5: The Pilot Study 5-17

Exploring the Relationship of Organisational Culture to Enterprise Systems Success
theme. Processes or a process way of working was being surfaced as a theme
running through the data.
Chapter 5: The Pilot Study 5-18

Exploring the Relationship of Organisational Culture to Enterprise Systems Success
5.4. Qualitative Results: Second Pass – Axial Coding
During the second pass of coding, more themes were identified and the process of
clustering the themes began. As more themes were identified, in conjunction the
broad themes identified in the first pass, clusters were formed. The clusters were
formed in the context of each other rather than on the basis of a theory or
framework. In this way hierarchies of the categories started to emerge. Conceptual
formation of the clusters may use (1) related characteristics, (2) identification of an
underlying construct, or (3) a causal or development hierarchy (Boyatzis, 1998).
In the process of forming cluster therefore, key words and phrases were used to
identify similarities or relationships between the various themes. Often the
interviewee was discussing an issue that was clearly linked to a theme or one that
was clearly sub-ordinate to higher themes, which began the development of
hierarchies within the clusters.
For example, the ‘management influences’ (MI) node could be further categorised
down into the two further distinct themes ‘Champions & Sponsors’ and ‘Leadership’.
Frequently the interviewee for example would be relating to specific issues with
sponsorship of the ES throughout the organisation. Sponsors therefore represent a
sub-category within a more overarching theme of general management influences.
The table overleaf shows the themes further categorised and clustered during the
second coding passes for the pilot study interviews.
However, it should be noted here, that clearly not all the themes, categories,
patterns or hierarchies were identified during the pilot. During the later interviews,
as more data was gathered, more themes were surfaced until eventually no more
new themes were being identified. However, the themes identified during the pilot
study represented only a small set of the final categories. This is discussed in the
following chapters, but it is important to note that the pilot was serving more as a
proof of concept and that the design, data collection methods and methods of
analysis were working as intended.
Hierarchies Forming
As the second pass coding progressed, clear hierarchies started to emerge, from
the broad themes identified in the first pass. The most noticeable clusters emerged
within the MI categories. Many statements and utterances were made that
Chapter 5: The Pilot Study 5-19
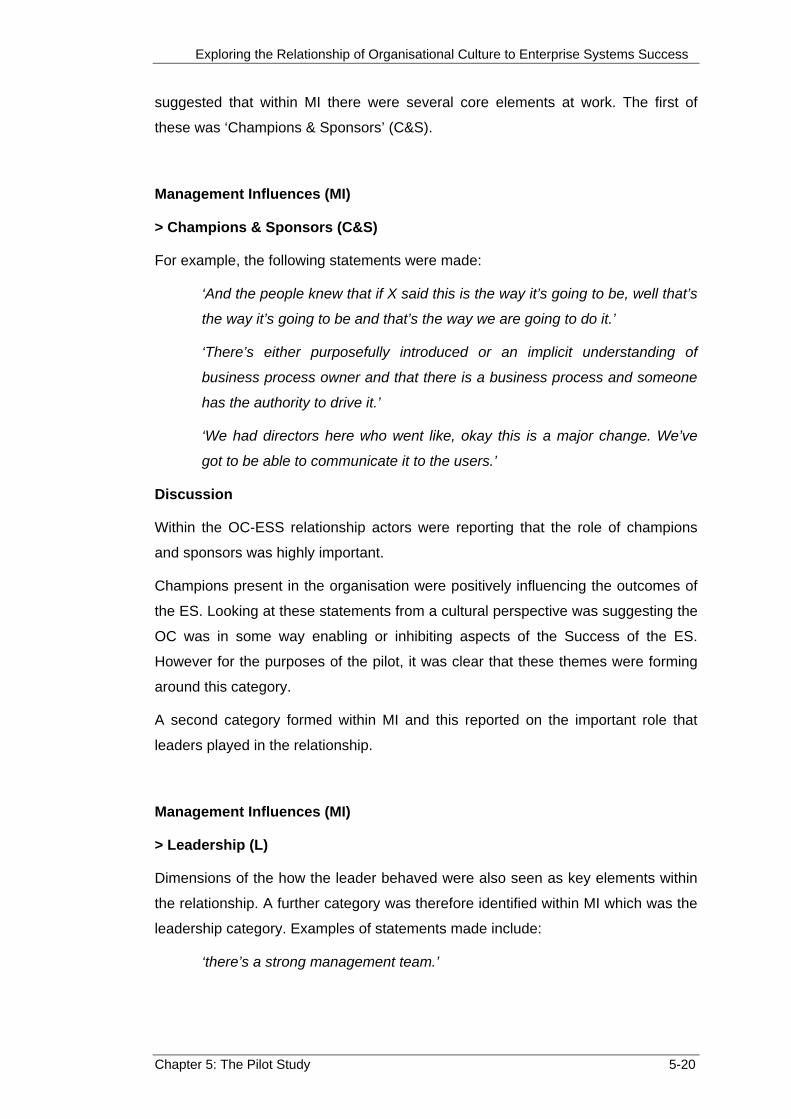
Exploring the Relationship of Organisational Culture to Enterprise Systems Success
suggested that within MI there were several core elements at work. The first of
these was ‘Champions & Sponsors’ (C&S).
Management Influences (MI)
> Champions & Sponsors (C&S)
For example, the following statements were made:
‘And the people knew that if X said this is the way it’s going to be, well that’s
the way it’s going to be and that’s the way we are going to do it.’
‘There’s either purposefully introduced or an implicit understanding of
business process owner and that there is a business process and someone
has the authority to drive it.’
‘We had directors here who went like, okay this is a major change. We’ve
got to be able to communicate it to the users.’
Discussion
Within the OC-ESS relationship actors were reporting that the role of champions
and sponsors was highly important.
Champions present in the organisation were positively influencing the outcomes of
the ES. Looking at these statements from a cultural perspective was suggesting the
OC was in some way enabling or inhibiting aspects of the Success of the ES.
However for the purposes of the pilot, it was clear that these themes were forming
around this category.
A second category formed within MI and this reported on the important role that
leaders played in the relationship.
Management Influences (MI)
> Leadership (L)
Dimensions of the how the leader behaved were also seen as key elements within
the relationship. A further category was therefore identified within MI which was the
leadership category. Examples of statements made include:
‘there’s a strong management team.’
Chapter 5: The Pilot Study 5-20

Exploring the Relationship of Organisational Culture to Enterprise Systems Success
‘Understanding the need to have somebody who actually had leadership
skills and understood the people part.’
‘We had it described to us by one of the directors, in driving this change.’
Discussion
In addition to hierarchies starting to form, as more analysis and coding were
undertaken, new themes were identified by the amalgamation of previous themes.
As a deeper understanding of the data became known, the patterns emerged and
the relationships between the various themes surfaced.
New high level themes surfaced
In the second pass through the first pilot interviews new themes emerged as the
categories were continued to be evolved.
Organisational Structure & Infrastructure (OS)
Organisational structure surfaced in the interviews as being a component of the
OC-ESS relationship. In particular the manner in which the ES spanned across
functions, and from an OC view point, whether the organisation was ready for this
way of working.
‘So there was this huge IT department who kind of, pretty much ran all the
systems.’
‘So we were one of the first in Queensland and we had this integrated
system, so we took care of all their finance needs. It was a blanket system
across both, their human resource needs, their payroll needs.’
‘I think they were empowered, I guess it’s a purely flat organisational
structure, nobody had to go seeking levels of approval for anything and I
think that’s a big differentiator, is that culture that says, you’re the decision
maker.’
Knowledge Management (KM)
The next new theme that surfaced was ‘knowledge management’. Quotes include:
‘And not only that, like at that point it was just the beginning of the ERP
cycles, so very little knowledge, but others believed they could do it in
house without consultants.’
Chapter 5: The Pilot Study 5-21

Exploring the Relationship of Organisational Culture to Enterprise Systems Success
Chapter 5: The Pilot Study 5-22
‘The information from it was so much more intelligent, you can actually you
know, press a few buttons and get some good data and we could make
good business decisions.’
Discussion
KM is defined in the literature as ‘a fluid mix of framed experience, values,
contextual information, and expert insight that provides a framework for evaluating
and incorporating new experiences and information’ (Davenport & Prusak, 2000).
Issues relating to KM appeared in the OC-ESS relationship. The data surfaced
some important aspects of KM that appeared to be a component of the relationship.
KM themes were emerging around data and information use and the manner in
which OC was supporting these aspects of the business.
User Support (US)
The final new theme that emerged during the pilot was the notion of ‘user support’
(US). Examples include:
‘Access to people with the understanding of the system. Like the helpdesk
and that kind of stuff.’
‘A lot of communication to staff at the grass roots, this is what you do now,
this is what you will do in the future.’
Discussion
Utterances were made in regard to the way in which users were supported and the
manner in which some OC types seem to enable US to function more successfully
than others.
The table overleaf summarises the themes and the hierarchy beginning to emerge
from the data.
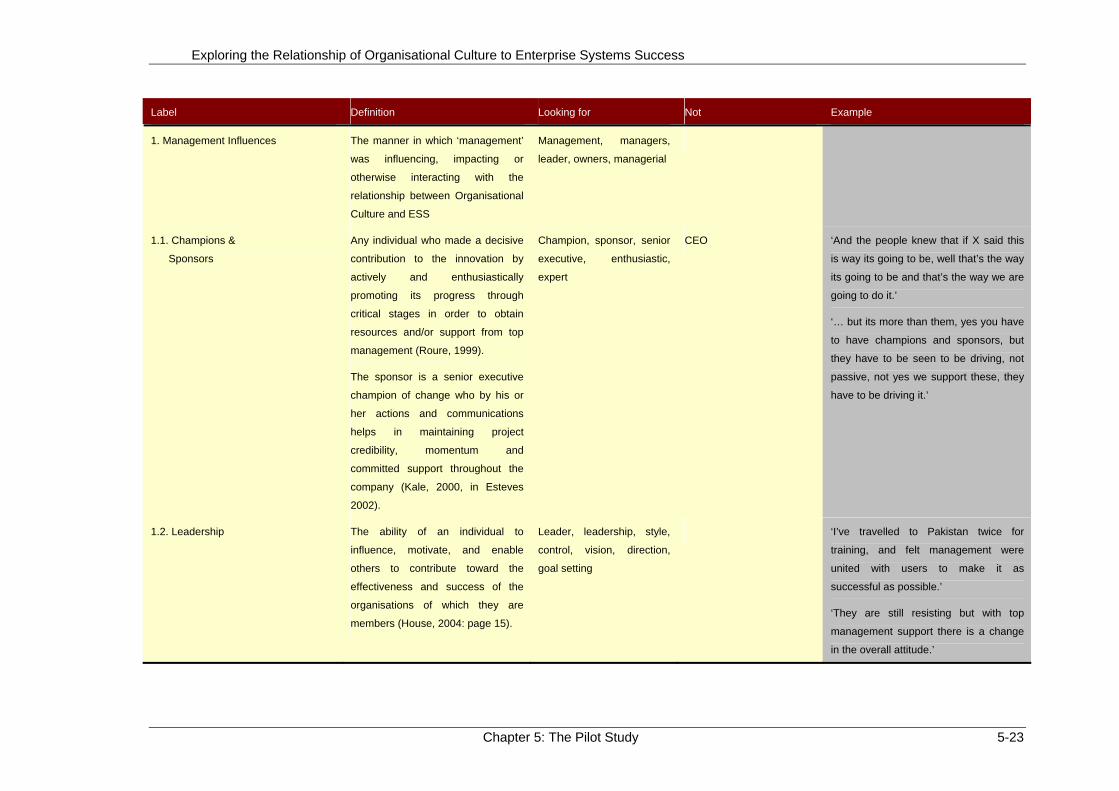
Exploring the Relationship of Organisational Culture to Enterprise Systems Success
Label Definition Looking for Not Example
1. Management Influences The manner in which ‘management’
was influencing, impacting or
otherwise interacting with the
relationship between Organisational
Culture and ESS
Management, managers,
leader, owners, managerial
1.1. Champions &
Sponsors
Any individual who made a decisive
contribution to the innovation by
actively and enthusiastically
promoting its progress through
critical stages in order to obtain
resources and/or support from top
management (Roure, 1999).
The sponsor is a senior executive
champion of change who by his or
her actions and communications
helps in maintaining project
credibility, momentum and
committed support throughout the
company (Kale, 2000, in Esteves
2002).
Champion, sponsor, senior
executive, enthusiastic,
expert
CEO ‘And the people knew that if X said this
is way its going to be, well that’s the way
its going to be and that’s the way we are
going to do it.’
‘… but its more than them, yes you have
to have champions and sponsors, but
they have to be seen to be driving, not
passive, not yes we support these, they
have to be driving it.’
1.2. Leadership The ability of an individual to
influence, motivate, and enable
others to contribute toward the
effectiveness and success of the
organisations of which they are
members (House, 2004: page 15).
Leader, leadership, style,
control, vision, direction,
goal setting
‘I’ve travelled to Pakistan twice for
training, and felt management were
united with users to make it as
successful as possible.’
‘They are still resisting but with top
management support there is a change
in the overall attitude.’
Chapter 5: The Pilot Study 5-23

Exploring the Relationship of Organisational Culture to Enterprise Systems Success
Label Definition Looking for Not Example
2. Change Management
Organisational change management
is the process of developing a
planned approach to change in an
organisation.
Change, change
management, change
process
‘I think one of the major reasons for the
success was strong management
commitment and also strong focus on
change management. I think those were
the factors clearly identified at the
beginning of the project which would
probably lead to success or failure.’
3. Employee Development The way and manner in which the
OC is supporting, developing and
nurturing employees
Development, support,
training, education, training
‘They never spent much money on
training.’
4. Admin Policies Procedures How does the organisation conduct
its admin policies and procedures
and in what way do these activities:
A. demonstrate the OC type
B. influence the success of the IT
innovation
Admin, policies,
procedures, manuals,
documentation
‘Agreed, it is seen as an administrative
tool for the secretary or sales assistant
to enter orders and produce reports.
Consequently, even with specialised
training and help guides there is a
resistance to use the system, together
with a general lack of enthusiasm.’
5. Learning Organisation Learning Organisations are
corporations that overcome inherent
obstacles to learning and develop
dynamic ways to pinpoint the threats
that face them and to recognise new
opportunities (Senge, 1994).
Learning, innovative,
creative, training,
knowledge, learnt
‘And they just started expanding their
own solution based on this success, and
were using the principles they learnt in
the first one.’
Chapter 5: The Pilot Study 5-24

Exploring the Relationship of Organisational Culture to Enterprise Systems Success
Label Definition Looking for Not Example
6. Project Management Project management is the
discipline of organising and
managing resources in such a way
that these resources deliver all the
work required to complete a project
within defined scope, time and cost
constraints.
On time, deadlines, budget,
project, project
management, cost,
resources
‘That’s an integral part of the project and
it’s addressed right up front and money
is budgeted towards that.’
7. Knowledge Management Knowledge is a fluid mix of framed
experience, values, contextual
information, and expert insight that
provides a framework for evaluating
and incorporating new experiences
and information. It originates and is
applied in the minds of knowers. In
organisations it often becomes
embedded not only in documents or
repositories but also in organi-
sational routine processes, practices
and norms (Davenport, 2000).
Knowledge, knowledge
transfer knowledge base,
expert systems, knowledge
repositories, knowledge
management, intellectual
capital, knowledge storage
‘Nobody had complete knowledge and
nobody was sharing knowledge, so that
the organisation per se didn’t know how
to do anything.’
8. Business Processes A specific ordering of work activities
across time and place, with a
beginning and an end, and clearly
identified inputs and output
(Davenport, 1993). A collection of
activities that takes one or more
kinds of input and creates an output
that is of value to the customer
(Hammer & Champy, 1993).
Business process, BPM,
BP reengineering, models,
modelling, process view,
processes
‘You know, most of them in the market
right down require a certain degree of
integration of business process to be
successful in its use and a lot of smaller
companies are not integrated prior to
implementation of that package.’
Chapter 5: The Pilot Study 5-25

Exploring the Relationship of Organisational Culture to Enterprise Systems Success
Chapter 5: The Pilot Study 5-26
Label Definition Looking for Not Example
9. Organisational Structure &
Infrastructure
The manner in which the OC reflects
the organisation’s structure and form
of the organisation and the manner
in which this interacts with the IT
innovation.
Organisational structure: The
organisation's formal framework by
which job tasks are divided, grouped
and coordinated (divisional, simple,
matrix, organic, mechanistic).
Elements of structure describe
formalisation, centralisation and
specialisation, departmentalism,
chain of command, span of control.
Structure, form,
departments, organisational
chart, work groups
‘They were not integrated in the
structure of the business, very dynamic
organisation, had lots of things going on
all the time. So they had all the reasons
to fail, they didn’t because they were
dynamic enough to deal with the
change.’
10. User Support
The manner in which and the extent
to which the OC supports the user.
User, support Training ‘… and what it takes to get the users
comfortable with the system. So, that’s
an integral part of the project and it’s
addressed right up front and money is
budgeted towards that.’
Table 5-5. Themes emerging in the second pass pilot data

Exploring the Relationship of Organisational Culture to Enterprise Systems Success
5.5. Qualitative Results: Third Pass – Selective Coding
Third pass selective coding of the data was not undertaken on the pilot data until all
the interviews from both the pilot and the main study had been completed. The third
pass results for the pilot interviews are shown in the next chapter along with the
main consultant results.
In the next section we review the pilot study results.
Chapter 5: The Pilot Study 5-27

Exploring the Relationship of Organisational Culture to Enterprise Systems Success
5.6. Pilot Results
5.6.1. Quantitative Component
A total of eight (four successful and four least successful) OCAI radar plots were
produced as a result of the completed OCAI surveys from the pilot study
participants. Although five interviews were conducted, only four fully completed
OCAI surveys were received from the participants. The results gave an early
indication of some of the culture typologies associated with the most successful and
least successful ES innovations.
However, the quantitative results were not analysed until all the survey data had
been collected from both the pilot, main and case study elements of the study. This
was an intentional decision, designed to ensure that the researcher was not guided
by knowledge of the quantitative results in the qualitative analysis. It was important
during the qualitative data analysis and coding that the theories emerged as much
as possible from the data without undue influence from the quantitative findings.
The pilot study, from the quantitative perspective, was more designed to test,
generate familiarisation with the instrument and identify any issues early on with the
OCAI and ESS instruments themselves. We needed to test the instruments in the
‘real world’ for suitability, manageability and reliability early in the research study in
order to make any changes to the instruments should this be required. The results
presented below are the results gathered from the pilot study participants alone, but
it must be reiterated, the quantitative results were not analysed until all the data had
been collected from the pilot, main and case study components.
5.6.2. Quantitative Results Pilot Study
Completion of the 24 item OCAI gives an individual score to each of the each of the
four culture types. The combined scores for all of the four culture types always total
100.
Balancing the ratios of the individual scores out of a total of ‘100’ score is one of the
OCAI’s strengths. Cameron & Quinn (1999), the developers of the instrument,
found in their studies, that organisations have an element of each of the four culture
types. It is the relative ratios of these to each other that are important. In some
Chapter 5: The Pilot Study 5-28

Exploring the Relationship of Organisational Culture to Enterprise Systems Success
organisations, one is clearly very dominant, in others two are seen as being overly
strong.
For example, we may see an environment in which all the cultures are roughly
equally represented, in this case the survey may report on scores for the each of
the four types, as shown in the table below:
Organisation A Organisation B
Cultures equally
strong
Market most
dominant culture
type
Culture
Type
Clan 25 12
Adhocracy 24 10
Market 26 65
Hierarchy 25 13
Total Score
(100)
100 100
Table 5-6. OCAI example scores
The individual scores indicate the relative strength (or not) of that particular culture
type within the organisation. A ‘Zero’ is the lowest possible score whilst ‘100’ is the
maximum possible, a figure of 25 for each of the culture types indicates that none is
dominant or stronger over the others, i.e., evenly balanced. Variances above ‘25’
indicate that a particular culture type is stronger, whilst a score below ‘25’ indicates
that the culture type is relatively weaker than some or all of the others.
The survey asks the respondents a number of questions, in all six questions for
each of the four culture types. The results are then presented in a table and
visualised in a radar plot. The mean OCAI results for the pilot study are as follows:
Chapter 5: The Pilot Study 5-29

Exploring the Relationship of Organisational Culture to Enterprise Systems Success
Successful ES Score Least Successful ES Score Clan 31.25 Clan 17.71 Adhocracy 21.88 Adhocracy 14.17 Market 16.46 Market 26.04 Hierarchy 30.83 Hierarchy 42.50 Total = 100 Total = 100
Table 5-7. OCAI mean results from pilot study
When the results are plotted into a radar graph we see a visual representation of
the findings. The radar plot for the pilot surveys is shown in the figure below. The
blue plot represents the OCAI for the successful ES innovation whilst the red plot
represents the least successful ES innovation.
Figure 5-4. OCAI mean plot for the pilot study – both successful and least successful ES innovations
Reviewing the radar plot we find some clear cultural differences between successful
and least successful ES innovations.
A. Least Successful: Hierarchy 42.50:
The most striking feature identified in the radar plot is the influence of hierarchy
cultures. The hierarchy culture was clearly the dominant culture typology identified
in the organisations that had experienced least successful innovations with a mean
Chapter 5: The Pilot Study 5-30

Exploring the Relationship of Organisational Culture to Enterprise Systems Success
score of 42.50. In organisations that had least successful innovations the hierarchy
was consistently seen as being the dominant culture type. The quantitative data
suggested that the organisations that were predominantly hierarchy culture biased
were those that experienced the least successful innovations.
B. Least Successful: Market 26.04:
The second culture typology that was strongly evident in the quantitative data set
for the least successful ESS innovations was the market culture. The market culture
has a strong emphasis on external aspects of the environment centered on
customer service, competitiveness and fostering competitive capabilities, and an
aggressive orientation toward exceeding competitor’s performance (Cameron &
Quinn, 1999).
C. Most Successful: Clan 31.25:
The quantitative data from the pilot study indicated that the most successful
cultures were those of the clan culture types. Clan cultures are defined as enabling,
effective, cohesive, smooth functioning, high performance teamwork, facilitating
effective interpersonal relationships including supportive feedback, listening,
resolving interpersonal problems, assisting individuals to improve their
performance, expanding their competencies and obtaining personal development
opportunities (Cameron & Quinn, 1999).
The clan is a supportive, developmental culture that may provide employees with
the training and support necessary to fully adopt, embed and exploit the innovation
in the workplace.
D. Second Most Successful: Hierarchy 30.83:
On the surface there appears to be a certain paradox here. The hierarchy culture
also featured in being the second most successful culture types – which appears to
be at odds with hierarchy culture as the least successful culture with a score of
42.50. The hierarchy culture appears to have the potential to be a successful
culture in terms of the exploitation of the ES innovation, but at the same time it has
the potential to be the least successful culture type and one that will struggle to fully
accept and adapt to the innovation. For possible reasons to this apparent duality it
may be beneficial to firstly revisit the features of the hierarchy culture:
Chapter 5: The Pilot Study 5-31

Exploring the Relationship of Organisational Culture to Enterprise Systems Success
Hierarchy features include, helping individuals become clear about what is
expected of them, what the culture and standards of the organisation are and how
they can best fit into the work setting also ensuring that procedures, measurements
and monitoring systems are in place to keep processes and performance under
control (Cameron & Quinn, 1999).
In many regards to a first time user an ES innovation might appear to be a heavily
procedural and controlling administration tool. Within the ES there are clearly
defined ways of working, and very hierarchical organisations of the data, even the
menus themselves are hierarchical, drill down interfaces that allow the user to
access information through successive layers of data. The ES innovation itself may
be described as having its own ‘culture’ – one which is predominately hierarchical.
The quantitative results from the pilot study suggest that an ES innovation situated
within the hierarchy culture has the potential to either be a highly successful or a
highly unsuccessful innovation due to the nature of the ES innovation itself and the
unique requirements of the hierarchy culture organisation.
The next section discusses some reflections on the instruments themselves from
the experiences of the pilot study.
Chapter 5: The Pilot Study 5-32

Exploring the Relationship of Organisational Culture to Enterprise Systems Success
5.7. Pilot Qualitative Protocol Reflections
The results from the pilot study were very positive, both in terms of the interview
questions capturing the richness of data needed and the soundness of the design in
surfacing manifestations of the OC-ESS relationship. The pilot interviews did
provide the required richness of data needed in the exploration of the OC-ESS
relationship. At the end of the pilot though a period of review and reflection was
carried out to consider the success of the design and the overall robustness of the
questions and protocols we had been using. This period of reflection was an
important component of the pilot phase and a break point that had been very
specifically and very deliberately incorporated into the study design.
5.8. Pre-Interview Instruments
These instruments were not collected and had been provided to the participants
one week prior to the interview to assist them in considering their least and most
successful ES examples. However, in discussions with the interviewees to whether
they had found the instruments helpful, the feedback was very positive. The
interviewees found the instruments aided their preparations, helped them to clarify
their thoughts and provided a useful guide for them during the interviews. The
layout and design of the instruments was felt to be clear, useable and appropriate.
In all the pilot interviews the participants used these instruments often referring to
them during the interview. Because the instruments were working so well it was
decided to continue with the instruments in their existing form for the remainder of
the consultancy interviews.
5.9. Existing Question Changes
Since the existing questions were surfacing clear components and manifestations
of the OC-ESS relationship, it was considered that no changes to the existing
questions needed to be made. The interviewees’ reactions to the questions had
been favourable; the questions did not appear to be overly threatening, too
restrictive or too leading. In all cases the interviewees appeared to be comfortable
Chapter 5: The Pilot Study 5-33

Exploring the Relationship of Organisational Culture to Enterprise Systems Success
and relaxed in answering the questions. No questions were declined or answered
with a high degree of difficulty. The consultants were able to report on their
experiences of the Organisational Culture manifestations; the OC dimensions,
describing the OC, the ES innovation and components of the OC-ESS relationship.
Because of the richness of the data being collected, the interviewees’ positive
reactions to the questions and the ease with which the consultants were able to
report on their experiences, the existing questions were not changed.
5.10. Question Addition
Even though the existing questions had been working well there was one area in
which it was felt that the data being gathered was a little ambiguous. When the
consultants were reporting on success factors and dimensions of the relationship in
their successful example, the interviewees were almost reporting on what they
considered to be components in the ‘best’ or most supportive culture that allowed
ES innovation success. Upon reflection it was felt that this was an important view to
surface because it would serve as a focussing final statement that could be used as
a summary statement by the consultant. The benefit to the researcher was that it
pulled together many manifestations that were otherwise scattered throughout the
interview.
The most direct way to surface this ‘perfect’ Organisational Culture was to simply
ask the consultants what they considered to be components of the perfect culture.
Therefore it was decided to include an additional question into the interview
protocol:
‘Describe the perfect supportive Organisational Culture for achieving success with
ICT innovations.’
The question was presented at the end in the concluding questions section in order
to provide a summary statement that brought together into the one statement the
consultants experiences previously dispersed throughout the interview.
Chapter 5: The Pilot Study 5-34

Exploring the Relationship of Organisational Culture to Enterprise Systems Success
5.11. Interview Duration
The interviews were being completed in a reasonable time – in about an hour – and
even with the addition of the extra question the duration of the interview was still felt
to be manageable and not too onerous or time consuming for the consultants. All
the participants completed the interview questions with no one having to leave part
way through because the interview was taking too long.
Chapter 5: The Pilot Study 5-35

Exploring the Relationship of Organisational Culture to Enterprise Systems Success
5.12. Summary
In summary the pilot phase confirmed several aspects of the design and protocol.
Design Aspect Impact on Design
Protocol tested for
manageability, robustness,
reliability and Validity
Therefore no changes necessary
Questions capturing OC-ESS
manifestations
Yes, with the addition of one extra
question
Pre-Interview instruments
working as intended
Yes, no changes necessary
Interview duration manageable Yes, no changes necessary
Consultants able to engage with
the process and return
experiences of the OC-ESS
relationship
Data gathered was informing on the
relationship. Interviews were active
exchanges with consultants keen to
recount their experiences. No
changes to design identified.
Appropriate richness of data The level of detail sufficient for
detailed analysis.
Table 5-8. Summary of changes to study following pilot
The qualitative element of the Pilot had been a useful proving ground both in terms
of the data it yielded and as a test of the interview protocols. The next component of
the Pilot to be reviewed is the quantitative element. Again the purpose of the
quantitative Pilot was to gather some data and also test the reliability, usability and
suitability of the quantitative instruments we had selected for the study.
5.13. Reflections on Instruments
The OCAI instrument worked well in the pilot study. The instrument was given to
the consultants at the end of the interview. The interviewees could then complete
the survey in their own time and return it in an envelope provided.
Chapter 5: The Pilot Study 5-36

Exploring the Relationship of Organisational Culture to Enterprise Systems Success
Chapter 5: The Pilot Study 5-37
Five pilot interviews were completed of which four completed their instruments. This
represented a response rate of 80% which is very high for any survey regardless of
sample size.
In terms of effort involved to complete the instrument, a test run was conducted in
the research centre prior to the pilot, which indicated the instrument took no more
than 15 minutes to complete. Feedback from the pilot interviewees confirmed this,
with interviewees stating that on average the instrument took 12 minutes to
complete; the maximum completion time being 20 minutes. The respondents did
not consider the instrument to be overly complex or time consuming and felt
comfortable with the survey questions.
The feedback, response rate and manageability experienced in handling the
instrument indicated that the instrument was a suitable choice for the study.
The next chapter considers the main consultant data collection exercise following
the pilot phase of the research.

Exploring the Relationship of Organisational Culture to Enterprise Systems Success
Chapter 6: Main Study 6-1
Chapter 6
Main Study

Exploring the Relationship of Organisational Culture to Enterprise Systems Success
Chapter 6: Main Study 6-2
Table of Contents – Chapter 6 Main Study
6. The Consultant’s Study....................................................................................6-4
6.1. Study Participants ............................................................................................6-5
6.2. Qualitative Analysis..........................................................................................6-6
6.3. Qualitative Open and Axial Coding ................................................................6-14
6.4. Qualitative Selective Coding ..........................................................................6-49
6.5. Quantitative Results: OCAI Radar Plots ........................................................6-54
6.6. Combining the Consultant OCAI and Consultant Qualitative Results............6-62
6.7. Summary of Results.......................................................................................6-64
Figures
Figure 6-1. Main study phase......................................................................................6-1
Figure 6-2. Management influences sub-categories .................................................6-15
Figure 6-3. Sponsor interaction in OC-ESS ..............................................................6-19
Figure 6-4. The role of champions in the OC-ESS relationship ................................6-23
Figure 6-5. Sub-categories within MI>Leadership ....................................................6-24
Figure 6-6. Vision component in the OC-ESS relationship .......................................6-30
Figure 6-7. Diffusion Process and its sub-categories summarised ...........................6-31
Figure 6-8. Change Acceptance interacting in the OC-ESS relationship..................6-36
Figure 6-9. User support in the Diffusion Process in the OC-ESS relationship ........6-37
Figure 6-10. User support and managerial understanding of the Diffusion Process.6-39
Figure 6-11. Employee development component in the OC-ESS relationship .........6-41
Figure 6-12. Learning Organisation role in the OC-ESS relationship .......................6-42
Figure 6-13. Organisational structure characteristics influencing OC-ESS...............6-44
Figure 6-14. Sub-culture presence in the OC-ESS relationship................................6-48
Figure 6-15. Selective coding to Clan DO...................................................................6-1
Figure 6-16. OCAI Adhocracy influences....................................................................6-1
Figure 6-17. OCAI hierarchy control and coordination influence ...............................6-1
Figure 6-18. OCAI radar plot all consultants .............................................................6-54
Figure 6-19. Implementation consultants OCAI ........................................................6-58
Figure 6-20. Change consultants OCAI ....................................................................6-59
Figure 6-21. Vendor consultants OCAI .....................................................................6-60
Figure 6-22. Summary of Consultant findings.............................................................6-1

Exploring the Relationship of Organisational Culture to Enterprise Systems Success
Chapter 6: Main Study 6-3
Tables
Table 6-1. Total interviews conducted............................................................................6-5
Table 6-2. Interview summary statistics .........................................................................6-6
Table 6-3. Categories of the OC manifestations found ..................................................6-8
Table 6-4. Passage count results.................................................................................6-10
Table 6-5. All categories sorted by passage count ......................................................6-11
Table 6-6. Rankings by passage count top level categories ........................................6-13
Table 6-7. Rankings by passage count 2nd level categories.........................................6-13
Table 6-8. Diffusion Process and sub-categories counts .............................................6-32
Table 6-9. Consultant interviewees stating change acceptance example....................6-33
Table 6-10. MAS characteristics (Hofstede, 1990).......................................................6-45
Table 6-11. Dimension of gender ...................................................................................6-1
Table 6-12. OCAI constructs by passage.....................................................................6-49
Table 6-13. OCAI scores all consultants mean ............................................................6-54
Table 6-14 IC OCAI scores ..........................................................................................6-57
Table 6-15. Change Consultants OCAI score ..............................................................6-58
Table 6-16. Vendor Consultants OCAI scores .............................................................6-59
Table 6-17. Table of the culture types ranking .............................................................6-61
Table 6-18. Combined OCAI and Consultant findings .................................................6-62

Exploring the Relationship of Organisational Culture to Enterprise Systems Success
Chapter 6: Main Study 6-4
6. The Consultant’s Study
This chapter describes the analysis and findings from the main study. The main
consultant’s study collected both qualitative and quantitative data, the findings and
results are shown in the following sections.
The following figure shows the location of this chapter in the overall study design:
The purpose of this phase of the study was to:
1. Reveal the qualitative influences in the OC-ESS relationship
2. Identify OCAI distributions in order to reveal any quantitative variations of OC
The aim of the main study was to continue gathering sufficient data in order to fully
explore the OC-ESS relationship. The target number of interviews in the main study was
15, which would bring the total number of interviews carried out in the study to 20.
Pilot Study
Cross Case Analysis
Research Aims Literature
Review Study Design
Main Study
Case Study
Figure 6-1. Main study phase

Exploring the Relationship of Organisational Culture to Enterprise Systems Success
Chapter 6: Main Study 6-5
6.1. Study Participants
The original protocol targeted specific numbers of consultants from the various
categories. At the conclusion of the study, the following consultants had been
interviewed:
Consulting Firms
(Implementation Consultants)
Vendor Firms
(Vendor Consultants)
Private/Public Sector Clients
(Internal Consultants)
Totals
Pilot Study Numbers Actual (Targeted) 0
(2)
3
(2)
2
(2)
5
(6)
Main Study Numbers Actual
(Targeted)
4
(5)
4
(5)
4
(4)
12
(14)
Total No. of Consultants Actual
(Targeted)
4 (7)
7 (7)
6 (6)
17
(20)
Table 6-1. Total interviews conducted
During the data gathering exercise, the original numerical target of consultant type was
followed as closely as possible, i.e., capturing data from consultants that met the criteria
whilst at the same time ensuring they were drawn from the correct consultant type
categories. The target number of consultants for the study was between 15 and 20. A
total of 17 consultants were interviewed. The frequency and categories of these
consultants are shown in table 6-1. Perusal of this table shows that a representative
sample from each category was included.
In addition, during the main data collection element interviews were carried out with
implementation consultants (5 targeted - 4 actual) and vendor consultants (5 targeted - 4
actual), with six internal consultants also interviewed (6 targeted - 4 actual). The total
number from both the pilot and main elements was therefore 17.
Interview length stabilised around 60 minutes duration and 18 pages in length. The
interviews themselves were on average of greater duration, passage length and word
count than the pilot interviews.
The tables overleaf indicate the actual durations:

Exploring the Relationship of Organisational Culture to Enterprise Systems Success
Chapter 6: Main Study 6-6
Pilot Interviews
Interview Time (mins) Words Passages Pages1 26 3544 126 72 25 3782 133 83 38 5923 206 124 51 7249 346 155 58 9699 228 17
Min 25 3544 126 7Max 58 9699 346 17
Average 40 6039 208 12
Main Interviews
Interview Time (mins) Words Passages Pages6 72 10442 417 217 95 13001 387 238 42 6963 190 139 39 4715 197 10
10 44 6616 223 1311 43 5535 361 1412 87 11215 490 2313 57 6512 321 1714 71 8232 404 1915 63 7024 425 1416 45 6123 290 1317 66 7245 303 15
Min 39 4715 190 13Max 87 13001 490 23
Average 60 7953 335 16
Table 6-2. Interview summary statistics
6.2. Qualitative Analysis
The analysis continued in the same manner as the analysis undertaken for the pilot
interviews. Analysis was undertaken as each interview was gathered and the patterns
and nodes built up. The process was evolutionary; as new categories were discovered,
the list developed becoming fuller and more ‘complete’ as more of the interviews were
conducted. As the coding continued, the list of categories increased, reaching its peak at
122 manifestations at the end of open coding. The second pass which applied the axial
coding technique, consolidated this list as the manifestations were built up into their
hierarchies.
The coding was undertaken through a cultural lens, and effort was made to keep the
focus on the observation through this lens, rather than becoming clouded by other
aspects of organisational theory such as Project Management theory, Strategy or

Exploring the Relationship of Organisational Culture to Enterprise Systems Success
Chapter 6: Main Study 6-7
Knowledge Management theory. So, for example, when an interviewee made a
statement concerning control issues – the coding and analysis was directed through our
cultural lens which asked what OC components were influencing this control.
The number of new manifestations raised declined as the number of interviews
increased. For example, by interview 12 significantly fewer new categories were being
identified. Indeed, by interview 9 over 75% of all the final categories had been identified
and by interview 12 85% of the final categories had been discovered. By interview 14 no
new manifestations were being raised from any of the interviews. This was supportive of
the literature findings which suggested that by approximately interview 14 most
manifestations of a social phenomenon would have been identified, (Miles & Huberman,
1994).
Although this first and second pass coding sounds relatively simple, in reality the
process was very time consuming, and to completely code the total 17 study interviews
took well over 14 months. The average interview was an hour plus in length and 20
pages long. The average number of words per interview was 6,039 and in total there
were 111,359 words to be encoded. Due to the nature of the qualitative analysis the
researcher is detecting subtleties and nuances within the transcripts that are not always
immediately visible. So in addition to the sheer volume of words and passages to code,
the manifestations are not always easily identified and may take some time before they
are raised, let alone categorised. This combination of factors led to the coding taking a
substantial amount of time.
It was also identified that an additional pass through the categories was required
because, on reflection, some of the statements were less about the Organisational
Culture components and more about an individual’s skills. As an example, consider the
statement below which reflects more about a particular manager’s skills, rather than
elements of Organisational Culture in the OC-ESS relationship:
‘So he was an up and out man, as opposed to a controlling and insight
consolidating organisation, the CEO was in the same sort of context and there
was actually holding and binding these guys together and providing a strong
guidance and leadership for this project.’
Once the additional pass had been completed, the remaining OC manifestations
represented the final categories of description for the consultant interviews. The final OC
manifestation categories are shown in figure on the next page.

Exploring the Relationship of Organisational Culture to Enterprise Systems Success
Chapter 6: Main Study 6-8
Table 6-3. Categories of the OC manifestations found
Whilst one of the possible measures of a category’s importance could be to count the
number of times this was uttered, there are other possible measures that may be used.
Categories
Management Influences
Sponsors
Leadership
Command & Control
Vision
Style Diffusion Process
OC of Change Acceptance
Exploiting the ES
User Involvement in DP
User Support
Managerial Support for the DP
Management Understanding
Employee Development
Admin Policy & Procs
Learning Organisation
Project Management
Knowledge Management
Business Processes
Organisational Structure & Form
Age
National Culture
Sub Cultures
Norms
Prior Experience
Long Term Orientation
TAM
1st Tier 2nd Tier 3rd Tier
Champions
Gender M/F

Exploring the Relationship of Organisational Culture to Enterprise Systems Success
Chapter 6: Main Study 6-9
At the most basic level, interviews are conversations (Kvale, 1996). Kvale defines
qualitative research interviews as ‘attempts to understand the world from the subjects'
point of view, to unfold the meaning of peoples' experiences, to uncover their lived world
prior to scientific explanations.’ Patton (1987) points out that any face-to-face interview is
also an observation. The skilled interviewer is sensitive to non-verbal messages, effects
of the setting on the interview and nuances of the relationship. While these subjective
factors can sometimes be considered threats to validity, they can also be strengths
because the skilled interviewer can use flexibility and insight to ensure an in-depth,
detailed understanding of the participant's experience.
Passage count is therefore only one indicator of a manifestations importance. Simply
because a phrase is repeated less frequently does not mean that its influence or relative
importance is any less than one repeated many times (Patton, 1987).
Other attributes of a phrase need to be taken into consideration (Kvale, 1996), and may
include:
• Clarity of expression
A phrase may have been stated just once but very clearly, outright and with
conviction. A strong, simple, single statement may have been made but just
not repeated many times, but that does not mean that the OC manifestation is
less influential or important in the OC-ESS relationship.
• Passage duration
A long statement, as opposed to a short statement in regard to one OC
manifestation could be indicative of its influence.
• Frequency per interview
Repeated reference to one OC manifestation by one interviewee may indicate
it is considered highly important to that one consultant.
• Notes
During the interviews notes were taken as comments to non-verbal
expressions that the interviewees made.
Nevertheless, counting the number of passages for a given category is a useful exercise
that gives some measure of the strength of its involvement within the OC-ESS
relationship.
The table overleaf summarises categories by passage count.
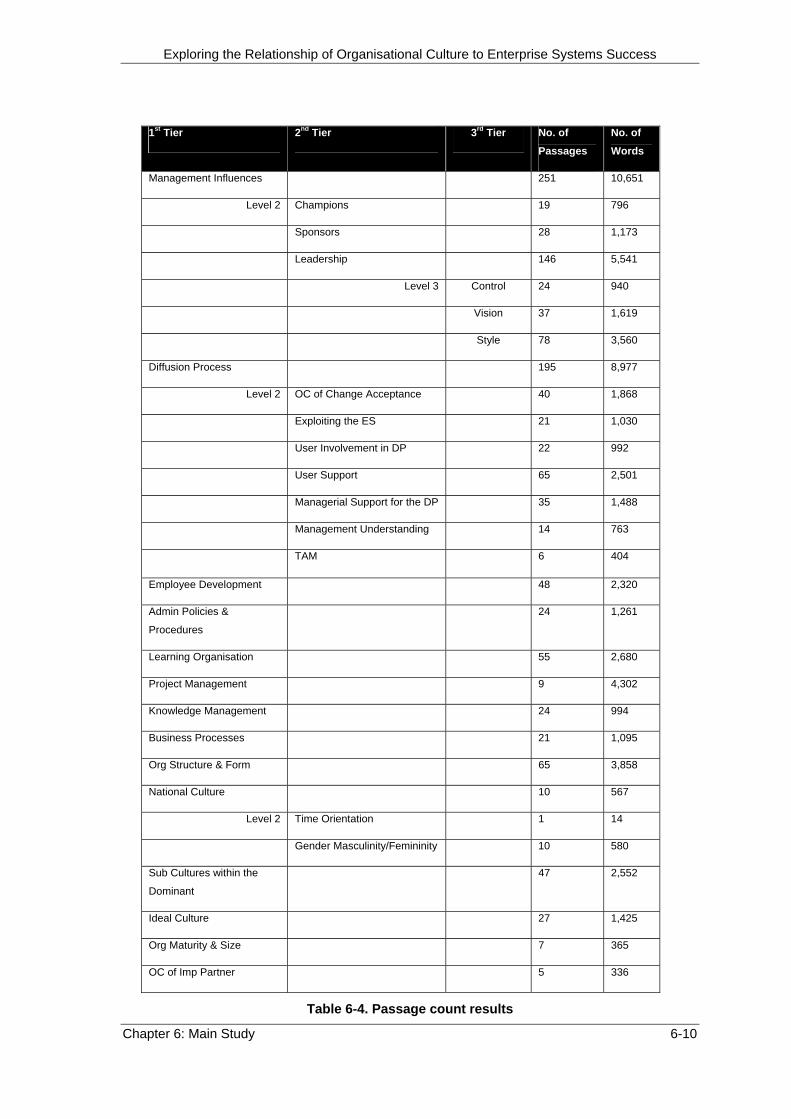
Exploring the Relationship of Organisational Culture to Enterprise Systems Success
Chapter 6: Main Study 6-10
1st Tier 2nd Tier 3rd Tier No. of
Passages No. of Words
Management Influences 251 10,651
Level 2 Champions 19 796
Sponsors 28 1,173
Leadership 146 5,541
Level 3 Control 24 940
Vision 37 1,619
Style 78 3,560
Diffusion Process 195 8,977
Level 2 OC of Change Acceptance 40 1,868
Exploiting the ES 21 1,030
User Involvement in DP 22 992
User Support 65 2,501
Managerial Support for the DP 35 1,488
Management Understanding 14 763
TAM 6 404
Employee Development 48 2,320
Admin Policies &
Procedures
24 1,261
Learning Organisation 55 2,680
Project Management 9 4,302
Knowledge Management 24 994
Business Processes 21 1,095
Org Structure & Form 65 3,858
National Culture 10 567
Level 2 Time Orientation 1 14
Gender Masculinity/Femininity 10 580
Sub Cultures within the
Dominant
47 2,552
Ideal Culture 27 1,425
Org Maturity & Size 7 365
OC of Imp Partner 5 336
Table 6-4. Passage count results

Exploring the Relationship of Organisational Culture to Enterprise Systems Success
Chapter 6: Main Study 6-11
The word and passage count data shows some interesting results.
The categories can now be sorted by passage counts, as shown in the following table:
Category No. of Passages
No. of Words
Management Influences 251 10,651
Diffusion 195 8,977
Leadership 146 5,541
Style 78 3,560
Org Structure & Form 65 3,858
User Support 65 2,501
Learning Organisation 55 2,680
Employee Development 48 2,320
Sub Cultures within the Dominant
47 2,552
OC of Change Acceptance 40 1,868
Vision 37 1,619
Managerial Support for the DP 35 1,488
Sponsors 28 1,173
Ideal Culture 27 1,425
Admin Policies & Procedures 24 1,261
Control 24 940
Knowledge Management 24 994
User Involvement in DP 22 992
Business Processes 21 1,095
ES a Change Process 21 1,030
Champions 19 796
Management Understanding 14 763
Gender Masculinity/Femininity 10 580
National Culture 10 567
Project Management 9 4,302
Org Maturity & Size 7 365
TAM 6 404
OC of Imp Partner 5 336
Time Orientation 1 14
Table 6-5. All categories sorted by passage count

Exploring the Relationship of Organisational Culture to Enterprise Systems Success
Chapter 6: Main Study 6-12
In table 6-5 we see that the largest category by number of passages identified in the
interviews was ‘Management Influences’ (MI) at 251 passages or 18% of the total
number of passages. MI related to statements about the way managers, leaders and
supervisors interacted in OC-ESS relationship. Many of the statements in this category
recounted experiences of the manner in which management, at its broadest level of
description, interacted in the relationship. For example,
‘the managers that managed their team, and they were quite I guess scared, in
terms of not knowing how to make their staff use it’.
We also see that within the higher order MI category, the sub-category of ‘Leadership’
represented a major category. Within MI utterances about leadership accounted for
nearly 60% of the total statements. Clearly, MI and its sub-categories were an important
influential component within the OC-ESS relationship based on number of statements
made in the categories.
The second largest high order category by number of passages was ‘Diffusion Process’
(DP). A total of 195 passages were identified that formed this cluster. This category
related to the manner in which the innovation being discussed diffused throughout the
organisation. However, within the DP category a clear hierarchy emerged, the most
populous sub-category being ‘User Support’ (US) within the DP, which accounted for
33% (65 of 195) passages.
Other large passage counts were seen for ‘Employee Development’ (ED) 48, ‘Learning
Organisation’ (LO) 55, ‘Organisation Structure’ (OS), ‘Business Processes’ (BP) 65 and
‘Sub-Cultures’ (SC) 47 categories.
Looking at different levels of categories we also see different values for the number of
passages associated with the categories.
These are shown in the tables overleaf.

Exploring the Relationship of Organisational Culture to Enterprise Systems Success
Chapter 6: Main Study 6-13
At the highest level category, Tier 1, the most populous categories were:
Category – Tier 1 No. of Passages
No. of Words
Management Influences 251 10,651
Diffusion 195 8,977
Org Structure & Form 65 3,858
Learning Organisation 55 2,680
Employee Development 48 2,320
Sub Cultures within the Dominant
47 2,552
Admin Policies & Procs 24 1,261
Knowledge Management 24 994
Business Processes 21 1,095
National Culture 10 567
Project Management 9 4,302
Org Maturity & Size 7 365
OC of Imp Partner 5 336
Table 6-6. Rankings by passage count top level categories
The largest categories identified accounted for the larger portions of statements made by
a significant amount. It can be seen that there is a large range from 251 for the largest to
just 5 utterances for the smallest category. Looking at the next level down for categories,
the tier 2 categories, again a clear ranking emerged for the number of passages, shown
in the table below:
Category – Tier 2 No. of Passages
No. of Words
Leadership 146 5,541
User Support 65 2,501
OC of Change Acceptance
40 1,868
Managerial Support for the DP
35 1,488
Sponsors 28 1,173
ES a Change Process 21 1,030
User Involvement in DP 22 992
Champions 19 796
Management Understanding
14 763
Gender Masculinity/Femininity
10 580
TAM 6 404
Time Orientation 1 14
Table 6-7. Rankings by passage count 2nd level categories
The next section discusses the individual categories themselves and how these
categories were developed.

Exploring the Relationship of Organisational Culture to Enterprise Systems Success
Chapter 6: Main Study 6-14
6.3. Qualitative Open and Axial Coding
As per the pilot study, the categories were built up iteratively over a number of passes as
the interview data were gathered. Using Strauss’ (1997) method, three separate passes
were carried out through the data. These passes are:
1. first pass – Open coding;
2. second pass – Axial or pattern coding;
3. third pass – Selective coding
The categories were then described again following the method prescribed by Boyatzis
(1998), where codes comprise five parts:
1. a one to three word label
2. a definition
3. a flag description
4. any exclusions or qualifications
5. an example
Once the lowest level categories had been discovered in the 3rd pass, the OC
manifestations were finally categorised into the successful and least successful
examples. It was at this point that the OC manifestations were informing upon the
differences between the successful and least successful OC and surfacing differences in
‘how’ OC influences the success/failure of an ES.
Each of the 1st pass top level categories and its corresponding sub-categories will now
be taken in turn.
The first set of codes to be discussed is situated in the ‘Management Influences’
category.
Management Influences A key theme emerged from the data was Management Influences (MI). This was
formally defined as ‘the management practices that focused upon changing the culture
to accept the innovation’.
The literature indicated that various aspects of ‘Management’ ranging from Leadership
Theories through to Management structures play a significant role in shaping an
organisation’s culture. The analysis of the interviews suggested the very wide ranging
and complex manner in which the many various dimensions of ‘Management’ appeared

Exploring the Relationship of Organisational Culture to Enterprise Systems Success
Chapter 6: Main Study 6-15
to be influencing OC-ESS. The second level axial coding sought to further examine this
issue and identified sub-categories of ‘Champions’, ‘Sponsors’ and ‘Leadership’.
Leadership was further coded into ‘Leadership Style’, ‘Vision’ and ‘Control’.
Examples of MI statements include:
‘With a successful implementation, there is generally a high level of
managerial support’
‘I believe a more positive management supported implementation creates a
positive environment where users learn more quickly and retain the knowledge
because it is seen as important.’
‘It was successful because it was driven from the top.’
‘You say, stuff it, I’m not doing it. And the boss would have to say well, stuff it,
you are going to do it.’
Discussion
Here we see statements that firstly suggest the component parts of the category
‘Management Influences’, and then comments around the nature of the influence upon
the relationship. The interviewees indicated that high levels of managerial support were
important and that success was driven by the top. The last example statement indicates
that the style, ‘you are going to do it’, is important in some way.
We can see from the above examples that at the high level the MI category comprised
many different dimensions of ‘Management’. The subsequent coding passes through the
MI category identified strong clusters around ‘Sponsors’, ‘Champions’ and ‘Leadership’.
The figure below shows the top level ‘Management Influence’ category with its
component 2nd pass sub categories:
Figure 6-2. Management influences sub-categories
Management Influences
Sponsors S + LS
Champions S + LS
Leadership

Exploring the Relationship of Organisational Culture to Enterprise Systems Success
Chapter 6: Main Study 6-16
Examples of these are shown in the section below.
Sponsors are the Executive and Senior Managers responsible for sponsoring and
supporting the ES. Literature on champions, top management support (TMS) and
executive sponsorship of projects has been well documented as a success factor in
Project Management, Management Theory and BPM. In various forms many statements
were made as to the importance of executive sponsorship for the ES program.
Each of these were analysed in terms of their contribution to or reaction from
Organisational Culture, as distinct from the actual behaviour required as a critical
success factor. In discussing these themes, firstly the desired behaviours for success
are discussed, followed by behaviours associated with least success, and closed with
the relationship of the theme to Organisational Culture.
At the final level of coding the themes were tagged into the successful and least
successful examples. The purpose of keeping the successful and least successful tags
was to enable variances not just in the OC experiences to be identified but also
manifestations of the dimensions of success. In this way we would be able to identify
variances within the OC-ESS relationship in terms of level of success.
Taking firstly sponsors, this is defined as:
‘The sponsor is a senior executive champion of change who by his or her actions
and communications helps in maintaining project credibility, momentum and
committed support throughout the company’ (Kale, 2000 in Esteves & Pastor,
2002).
Consider the following extract as an example of the presence of sponsorship as a
requirement for success:
‘The key to every successful implementation all that I have ever worked on is not
just the executive sign off or the executive buy in, but the executive driving of
the project and driving of the outcomes.’
Here we see a clear statement of the executive driving the innovation success. Another
example of the role of the sponsor in positioning the organisation to have success with
the Enterprise System is as follows:
‘[The] strength of the executive and that the executive is a driver, not a set the
objective and walk away and expect someone else to make it happen.’
‘Top down support, so basically, very much it has to be sponsored from the
business.’
Exploring the Relationship of Organisational Culture to Enterprise Systems Success
Chapter 6: Main Study 6-17
As a counterpoint to positive sponsor behaviour, note the following sponsor least
successful example:
‘I you don’t have someone strong that’s guiding and advocating the change, or
the innovation, I'm not sure that you can actually ever achieve it.’
These examples indicate the requirement for sponsorship within the relationship. Further
analysis revealed differences in the types of behaviour displayed by the sponsor and the
influence on the relationship in successful and least successful innovations.
Sponsor successful
‘Its executive driven to say we are going to appoint that person and that person
will have the say and it will get disseminated down.’
The executive were seen to be driving the innovation and actively appointing key
personnel to drive that through the organisation.
‘They knew they were going to have problems, so the decision was from the
executive we’ve got to do it anyway, we’re six months into a new start-up
company, it’s got to be in place.’
Here a statement is made about the sponsors understanding the nature of the
organisation and acting accordingly to ensure that the innovation is successfully
implemented.
‘You have to have champions and sponsors but they have to be seen to be
driving, not passive, not yes we support these, they have to be driving it.’
The sponsors must not only be present but they must be visible to the organisation,
actively giving support to the innovation.
Sponsor least successful
‘He had a mindset of we need to go and do this, let’s just do it. But he forgot that
the culture in his organisation doesn’t operate that way.’
Whilst the sponsor recognised that something needed to be done, the manner in which
he went about this caused failure – because he did not understand the culture of the
organisation.

Exploring the Relationship of Organisational Culture to Enterprise Systems Success
Chapter 6: Main Study 6-18
‘When the new CEO came on board for X he went through it and he said the
same, this is our one factor that will differentiate us from the other banks, but the
message never got down.’
The sponsor did not drive the message through the organisation and push the innovation
rather the message was weak and poorly communicated.
From these examples one concludes that effective sponsorship behaviour is required for
ES success. These behaviours are: strong sponsorship, i.e., it must be present; and
clear direction and communication from the sponsor.
The behaviours which are related to OC are: understanding the organisational culture, a
culture that enables the sponsor to operate in, and a culture that values and listens to
the sponsor direction when this is present.
The behaviours which are related to individual leadership are: strong leadership, clear
direction, and visible support for the innovation
Thus, one concludes that the sponsor is an important figure in the OC-ESS relationship.
Much of the literature on Organisational Culture stresses the importance of Executives
driving the cultural attributes of exhibiting certain behaviours. Schein (1985) described
five primary behaviours that leaders exhibit in their attempts to shape Organisational
Culture:
1. What leaders pay attention to, measure and control
2. Leader reactions to critical incidents and organisational crises
3. Deliberate role modelling, teaching and coaching
4. Criteria for rewards and status allocation
5. Criteria for recruitment, selection, promotion, retirement and excommunication
Leaders’ behaviours interact with what Schein terms ‘secondary reinforcement
mechanisms’ and include formal statements of organisational philosophy, creeds and
charters. OC has also been shown to be a source of cues by which leaders make sense
of their own organisations (Ravesi & Schultz, 2006).
Looking at the role of the sponsor through a cultural lens, whilst an effective sponsor
may be a critical success factor to an ES project, the data suggests that a sponsor may
be more effective in certain culture types.
‘There’s a managerial support for that change.’
A culture of change is present within the organisation.
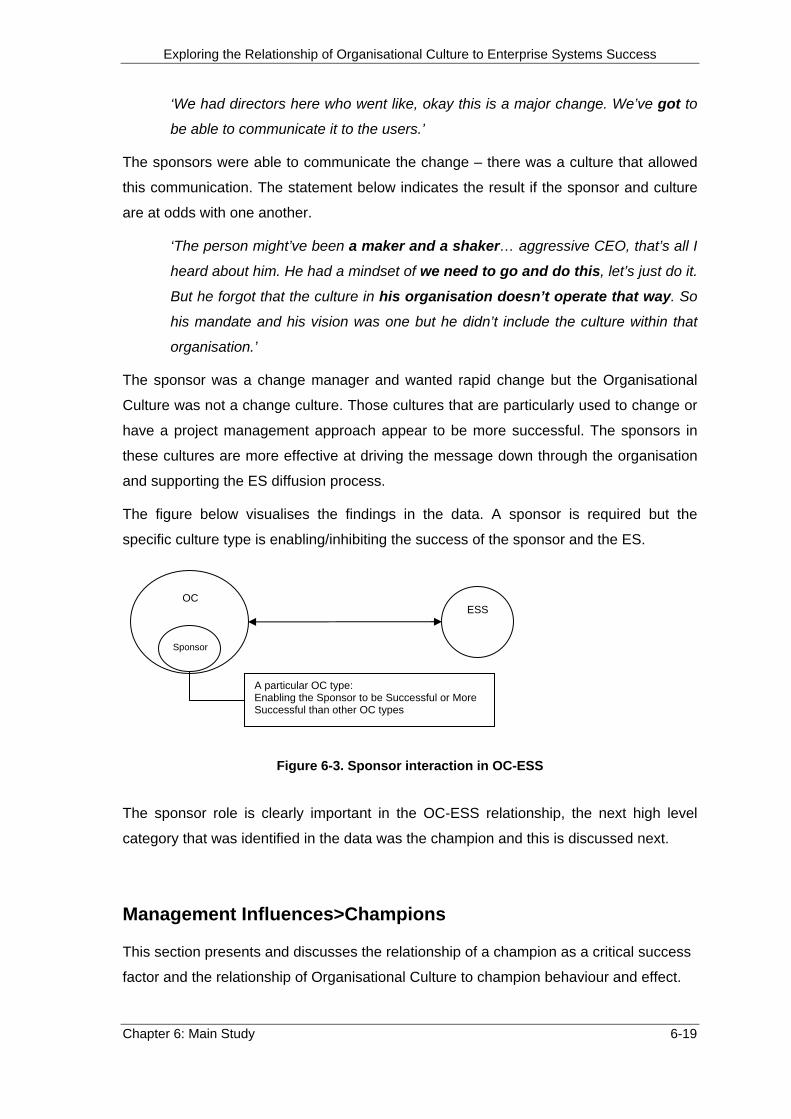
Exploring the Relationship of Organisational Culture to Enterprise Systems Success
Chapter 6: Main Study 6-19
‘We had directors here who went like, okay this is a major change. We’ve got to
be able to communicate it to the users.’
The sponsors were able to communicate the change – there was a culture that allowed
this communication. The statement below indicates the result if the sponsor and culture
are at odds with one another.
‘The person might’ve been a maker and a shaker… aggressive CEO, that’s all I
heard about him. He had a mindset of we need to go and do this, let’s just do it.
But he forgot that the culture in his organisation doesn’t operate that way. So
his mandate and his vision was one but he didn’t include the culture within that
organisation.’
The sponsor was a change manager and wanted rapid change but the Organisational
Culture was not a change culture. Those cultures that are particularly used to change or
have a project management approach appear to be more successful. The sponsors in
these cultures are more effective at driving the message down through the organisation
and supporting the ES diffusion process.
The figure below visualises the findings in the data. A sponsor is required but the
specific culture type is enabling/inhibiting the success of the sponsor and the ES.
Figure 6-3. Sponsor interaction in OC-ESS
The sponsor role is clearly important in the OC-ESS relationship, the next high level
category that was identified in the data was the champion and this is discussed next.
Management Influences>Champions
This section presents and discusses the relationship of a champion as a critical success
factor and the relationship of Organisational Culture to champion behaviour and effect.
OC ESS
Sponsor
A particular OC type: Enabling the Sponsor to be Successful or More Successful than other OC types

Exploring the Relationship of Organisational Culture to Enterprise Systems Success
Chapter 6: Main Study 6-20
Champions have been documented in the literature (Gartner, 2005) as being important
to the success of many organisational activities including Project Management, Business
Process Reengineering and Change Management Programs. However, in the context of
this study, champions appear to be important in the OC-ESS relationship for different
reasons. This section shows the data analysis and the rationale for this assertion.
The definition of a champion is:
‘Any individual who made a decisive contribution to the innovation by actively and
enthusiastically promoting its progress through critical stages in order to obtain
resources and/or support from top management’ (Roure, 1999).
An example of championship behaviour from the data is given below.
‘The people who really say, this is fantastic, I’m going to advocate the system
and I’m going to you, and people, I guess generally people that you know, are
well respected by others. So, they use it and other people think, oh you know, it
might be pretty good.’
Above we see an example from the data of a champion present who is actively and
enthusiastically supporting the innovation. Other examples from the data are:
‘And the people knew that if Mr X said this is the way it’s going to be, well that’s
the way it’s going to be and that’s the way we are going to do it.’
In the above example the champion has some clear power and influence within the
organisation, power to make the decision and also to enforce the decision.
The data revealed insights into the differences between the successful and least
successful examples.
Champions successful examples
‘There’s either purposefully introduced or an implicit understanding of business
process owner and that there is a business process and someone has the
authority to drive it.’
Within the successful ES there are ES process owners that have the power to drive
change. In addition, in successful ES, if the champion is not present they can be
purposefully introduced.

Exploring the Relationship of Organisational Culture to Enterprise Systems Success
Chapter 6: Main Study 6-21
‘But its more than them, yes you have to have champions and sponsors but they
have to be seen to be driving, not passive, not yes we support these, they have
to be driving it.’
Not only should the champion exist, but in successful ES they are visible and active.
‘Sometimes you’ve got individuals that really stand out because they’ve been
there a long time or people really like them, or people see them as an
authority and believe what they say, or are scared of them.’
Whilst champions were visible, they were also a reflection of OC. In the statement above
we see comment on the length of time that the champion had been present; this
suggests they are part of the culture and that they have shaped the culture through their
presence.
‘Solution champions within the organisation, and they grow the circle of users
piece by piece’
Once a cohort of champions has been established they appear to organically persuade
and influence users around them. A culture that fosters this changing, learning and
evolving environment appears important.
‘Very strong core of champions who wanted change’
Again a core of champions driving, promoting and supporting the ES through the
organisation is present in the successful ES.
The behaviour of champions was different in those organisations that were seen to be
least successful as demonstrated in the following extracts:
Champions least successful example
We also see examples from least successful ES:
‘The ones that you see fail they’ll almost certainly be, if you don’t assign the
process owner.’
‘Champions are not assigned within the organisation.’
Exploring the Relationship of Organisational Culture to Enterprise Systems Success
Chapter 6: Main Study 6-22
‘The business owner who was sacked, and the analyst, business analyst... So
there was no one in the organisation now with the drive.’
The champions and the process drivers were not valued by the organisation. In this
example the organisation felt threatened and reacted accordingly.
Champions absent
Finally, the absence of champions was also seen to be associated with organisations
that were least successful in ES as shown in the following extract:
‘In most cases they don’t even have business process change agents. You
can’t drag them along to that, they’ve got to take the step.’
Thus, the data shows the correlation of the presence and positive behaviours of
champions to ES Success and the absence or negative behaviours of champions to ES
least successful.
In addition, the cultures which appear to be most supportive or foster the existence of
champions were seen to experience success. This behaviour can only occur in certain
culture types. These culture types need to support champions contained the following
elements: readiness to accept change, open communication, directed sponsor support
for the seeding of champions throughout the organisation,
The data therefore indicated the key role and influence to ESS played by the champions
in the organisation. The presence (or absence) of a group of champions driving forward
the exploitation and adoption of the ES in a particular OC serves not only to confirm the
important role they play – as confirmed by many studies into project management
success. But, from an OC perspective the fact that champions exist and flourish in a
particular organisation, whilst not in another, indicates that the champions maybe both a
driver of continued ESS and also a product of the OC that allows them to exist. The data
suggested the important role that champions play post implementation in the continued
success or an ES. Even though ‘go live’ may have occurred over two years ago, and the
implementation project team had been long since disbanded, the role of ES champions
in the continued diffusion of the innovation throughout the organisation appeared to be of
continued importance.
The figure overleaf summarises the findings for the role of champions in the OC-ESS
relationship.

Exploring the Relationship of Organisational Culture to Enterprise Systems Success
Chapter 6: Main Study 6-23
Figure 6-4. The role of champions in the OC-ESS relationship
The next category to be discussed is the Management Influences>Leadership sub-
category.
OC ESS
Champions ES Successful Champions driving diffusion of the innovation throughout the organisation.
Positive Aspects OC that allows existence of Champions and Allowing Champions to flourish

Exploring the Relationship of Organisational Culture to Enterprise Systems Success
Chapter 6: Main Study 6-24
Management Influences>Leadership
The third sub-category to be identified within MI was ‘Leadership’. The coding raised
many dimensions of leadership with multiple themes and issues emerging, and thus
indicating that leadership was a complex category. However, during the second pass
coding the themes clustered around three distinct areas. These were ‘Leadership
Control’, ‘Leadership Vision’ and ‘Leadership Style’, as summarised in the figure below:
Figure 6-5. Sub-categories within MI>Leadership
The initial label definitions, examples and tags for leadership were based upon the
following attributes:
Label: Leadership
Definition: ‘The ability of an individual to influence, motivate, and enable others to
contribute toward the effectiveness and success of the organisations of which they are
members’ (House, Javidan, Hanges & Dorfman, 2002).
Leadership Example:
‘However, gaining the support of top level management altered the message and
added the weight of authority to the message that non-commitment would not be
tolerated, and anyone that wasn’t doing the right thing, they’d be named openly.’
The role of leaders in many organisational activities has been well researched and
documented. The general category of leadership itself covered a wide range of issues
with a large number of statements being in reference to Leadership in the OC-ESS by
the interviewees.
Management Influences
Sponsors S + LS
Champions S + LS
Leadership
S + LS Control
Vision
Style
S + LS
S + LS

Exploring the Relationship of Organisational Culture to Enterprise Systems Success
Chapter 6: Main Study 6-25
Within the data there were clear statements that reflected the leadership dimension.
Examples included:
‘with a successful implementation, there is generally a high level of managerial
support’
Showing leadership support for the innovation.
‘I’ve travelled to the site twice for training, and felt management were united
with users to make it as successful as possible’
Showing Leadership attitude towards the ES.
‘poor support leadership and no representative management involved in the
project’
A lack of leadership or poor leadership for the project.
‘This negative view of SAP has been promoted, however this is being addressed
by a change from top down management due to the large investment, the MD
has promoted the system and is insisting on its utilisation to improve efficient
operations.’
Leadership directed at promoting and mandating the use of the ES.
‘communicating to your employees what the nature of the business is’
Leaders openly communicating with their staff.
‘This one had strong leadership and the other one didn’t, so where you have
obviously a highly siloed organisation or an organisation with widely divergent
cultures, you’ve got to have some, something’s got to hold it together.’
Leadership coordinating the cultures and holding the organisation together.
But within leadership patterns did emerge on the 2nd pass that suggested three particular
leadership dimensions were strong influences in the OC-ESS relationship.
These three patterns were ‘Control’, ‘Vision’ and ‘Style’, these are discussed in detail in
the following section.

Exploring the Relationship of Organisational Culture to Enterprise Systems Success
Chapter 6: Main Study 6-26
The first sub-category to be discussed is the ‘Control’ category.
Management Influences>Leadership>Control The control characteristics that the organisations and leader exhibited.
Label: Control
Definition: Control has two components
1. Chain of command: An unbroken line of authority that extends from the upper
levels of the organisation to the lowest levels and clarifies who reports to whom.
2. Span of control: The number of sub-ordinates a manager can supervise efficiently
and effectively (Robbins et al., 2006).
Example:
‘restrict and reinforce discipline to round the processes but not stopping them
from being maverick and entrepreneur in terms of getting the sales’
Within the data we see statements as regards the line of authority and the numbers of
sub-ordinates that a manager coordinates.
Control successful examples
‘There was a clear line of communication from the top, they knew who was
doing what and where it was coming from.’
In successful ES there were clearly defined and understood chains of command.
‘Managing a small number of team leaders meant they could get things done
quickly.’
A narrow span of control appeared to aid decision making in the OC-ESS relationship.
‘I think there were only two layers of management to get to top management, the
guys on the ground knew they could get guidance easily.’
In a successful ES statement one of the success factors identified was the short change
of command.
Therefore we see in these leadership examples that short, open communication
channels were aiding the success of the ES. Looking at these through a cultural lens it

Exploring the Relationship of Organisational Culture to Enterprise Systems Success
Chapter 6: Main Study 6-27
appears that these characteristics present in the culture assist the organisation in its
diffusion of the innovation.
The next MI>Leadership sub-category to be identified was the ‘Style’ sub-category.
Management Influences>Leadership>Style Label: Style
Definition: The style adopted and displayed by the leader. Leadership style is a
combination of task behaviour and relationship behaviour displayed by the leader
(Hershey, Blanchard & Natemeyer, 1979). Task behaviour refers to the leaders
directions, relationship behaviour is the two way communication, including listening and
support by the leader.
Examples:
‘Within the organisation, the area itself, it was a small, tightly knit group, similar to
a family environment, managerial staff fully supported the process generating
enthusiasm for the change within the group’
Examples for the category Management Influences>Leadership>Style sub-category
were:
Leadership style successful example:
‘I believe a more positive management supported implementation creates a
positive environment where users learn more quickly and retain the knowledge
because it is seen as important.’
The leadership style, in this case positive and supportive, created an environment where
users could develop. Other statements were made in regards to the style of the leaders,
such as:
‘strong management focus on commitment to success’
The leadership style here is focused upon the outcomes and goal oriented.
‘A bit dictatorial in some ways’
Within a success full ES the leadership style was telling and somewhat directing.

Exploring the Relationship of Organisational Culture to Enterprise Systems Success
Chapter 6: Main Study 6-28
‘The CEO was in the same sort of context and there was actually holding and
binding these guys together and providing a strong guidance, direction and
leadership for this project. He was a very straight shooter.’
Through a strong and closely articulated style the CEO was holding the organisation
together though a difficult change period.
‘The Director used to walk around’
A very visible leadership style supported the ES diffusion.
Leadership style least successful example:
Within the least successful examples style of leadership were also raised.
‘They were coming into the implementation with an in house system development
mentality and the executive wasn’t strong enough to drive that down to say,
we’re going to do a package and you are going to have to adjust your working
practices to work within the package.’
In the above example the Executive is not strong enough to push the message through
the organisation. Rather the style is too consensual and not autocratic enough.
‘So it was really just culture of the organisation, it was almost a fear of making a
decision. They were almost incapable of doing it, the culture was every decision
was made by a committee so they couldn’t rely on one person.’
The style of leadership here is focused upon negotiation and committee resulting in a
lack of decision making. The cultural lens would suggest that the fear of making a
decision for fear of the repercussions indicates a culture inhibiting the success.
‘I don’t understand why they were unable to make a choice and to move forward.
Maybe they, they themselves, the leadership can’t see the path, can’t see a clear
path, so we’re not going to lead you anywhere.’
The leadership style is one that is lacking clear direction. Without clear goals the
leadership were unable to find a path through.

Exploring the Relationship of Organisational Culture to Enterprise Systems Success
Chapter 6: Main Study 6-29
Discussion
From the ‘Leadership Style’ categories above we see that leadership within an
organisation that supports the ES openly can lead to actively encouraged users. The
leadership style that openly reinforces the organisation’s commitment to the ES appears
to be successful. This suggests that one of the components of the OC-ESS relationship
important in successful ES is a culture where open communication can take place
between management and users.
The least successful leadership style statements do suggest that a ‘weak’ Executive not
openly supporting the ES can inhibit the success of the ES. This not only confirms the
key role of top management support (as identified previously and in the literature), but
when viewed through a cultural lens, further supports the suggestion that an OC that
enables open communication between management and users is required for an ES to
be successful. The final sub-category within leadership was that of ‘Vision’.
Management Influences>Leadership>Vision Label: Vision
Definition: A vision is a description of the business as it wants to be. It is defined as ‘a
mental image produced by the imagination’. It involves seeing the optimal future for the
business, and vividly describing this vision. The description might include how things will
be, where, who with, what you'll be doing and how you'll feel (Hamel & Prahalad, c1999).
Example:
‘Having a vision of where you want to take the organisation who is using it’
Examples for the Management Influences>Leadership>Vision sub-category are shown
below.
Vision successful statements:
‘The message of that vision communicated through the organisation’
The statement indicates that not only in the presence of a clear vision necessary but that
the vision must be communicated effectively through the organisation.
‘It’s a vision driven organisation, so they repaint the vision and everyone works
towards it, and that’s down to everyone working in the office.’

Exploring the Relationship of Organisational Culture to Enterprise Systems Success
Chapter 6: Main Study 6-30
The leadership of the organisation were constantly repainting the vision for the
enterprise. However, simply having a vision it suggests is not enough, the organisation
must ensure that at all levels the users are working towards the same goal.
There were statements in the data as regards the lack of a vision or a poorly defined and
communicated vision in the least successful examples.
Vision least successful statements:
We also see statements made in regards to vision in the least successful examples:
‘If you don’t have a clear reason for being there and something you’re delivering
that’s going to make a difference, then you’re in trouble.’
‘When the new CEO came on board for X bank he went through it and he said
the same, this is our one factor that will differentiate us from the other banks, but
the message never got down to the people who were making the decisions.’
Discussion
Whilst having a vision for the organisation is clearly important – and this has been well
documented in the literature, the cultural aspect of the manifestation indicates that it is
more about the manner in which the vision is communicated (or not) throughout the
organisation that is important for ESS. In addition to communicating the vision, the vision
also has to be continually repainted and communicated down through the organisation.
So the data is showing that having a vision is very necessary and without it the ESS will
not be as successful, but it is in conjunction with open communication – articulating the
vision throughout the organisation – that the vision is most influential in the relationship.
The findings from the data are summarised in figure below:
Figure 6-6. Vision component in the OC-ESS relationship
OC ESS
Vision
Successful ES OC allows the Vision to be communicated thereby reinforcing commitment to ES
Open Communication

Exploring the Relationship of Organisational Culture to Enterprise Systems Success
Chapter 6: Main Study 6-31
The data indicated another high level category during the 1st pass around ‘Diffusion
Processes’. Diffusion is defined as ‘the process by which an innovation is communicated
through certain channels over time among the members of a social system’ (Rogers,
1995), and is discussed in the next section.
Diffusion Process (DP) Statements were made by interviewees with regard to how the ES is diffused (or not)
through the organisation. At the top level the broad statements related to how the
Enterprise System diffused through the various Business Units. During the 2nd and 3rd
passes through the data, further coding revealed sub categories and themes present
within this overarching category.
Figure 6-7. Diffusion Process and its sub-categories summarised
The ‘Diffusion Process’ sub-categories are discussed in turn in the following sections.
The table overleaf the passage counts for categories above.
Diffusion Process (DP)
OC of Change Acceptance
Exploiting the ES
User Involvement in DP
User Support
Managerial Support for the DP
Management Understanding
S + LS
S + LS
S + LS
S + LS
S + LS
S + LS

Exploring the Relationship of Organisational Culture to Enterprise Systems Success
Chapter 6: Main Study 6-32
Category
No. of Passages
No. of Words
Diffusion Process
195 8,977
OC of Change Acceptance
40 1,868
Exploiting the ES 21 1,030
User Involvement in DP
22 992
User Support 65 2,501
Managerial Support for the DP
35 1,488
Management Understanding
14 763
Table 6-8. Diffusion Process and sub-categories counts
The first category to be found in the data within the larger ‘Diffusion Process’ category
was the ‘Change Acceptance’ category, and this is discussed in the next section.

Exploring the Relationship of Organisational Culture to Enterprise Systems Success
Chapter 6: Main Study 6-33
Diffusion Process>OC of Change Acceptance The most prominent theme that was raised in the DP, as measured by number of
utterances was ‘Change Acceptance’. Interviewees recounted that through their
experiences they had seen differences between successful and least successful ES
influenced by the degree to which the OC was accepting of change.
Label: OC of Change Acceptance
Definition: How readily the OC accepts the change and the degree to which the OC
allows or inhibits change to take place.
Example:
‘Culturally I think clearly, the branches that were successful were the ones who
just adopted the change, understood it and knew what value it was going to do
and felt comfortable.’
The ‘Change Acceptance’ category was not only one of the largest 2nd pass categories
identified when measured by passage count but it was also one of the largest when
viewed by numbers of consultants making statements in this category. The table below
shows the frequencies for this category.
Consultants making Statements Number %
Total Study Interviews 17 100
Successful Examples 17 100
Least Successful Examples 14 82
Table 6-9. Consultant interviewees stating change acceptance example
Change acceptance successful examples:
Within successful examples we see statements such as:
‘and also the ability to communicate which is the change management and the
communication back to the business about what’s happening’
‘So, accepting, cooperative, a learning environment, they’re prepared to learn
and adopt new things’
‘The culture would be one that accepted ICT innovations and understood the
importance of change management to system acceptance and success.’

Exploring the Relationship of Organisational Culture to Enterprise Systems Success
Chapter 6: Main Study 6-34
The ‘Change Acceptance’ category indicates that a culture that enables and supports
change and is comfortable with change can influence the OC-ESS positively. The data
showed clear evidence of the importance of this manifestation on the OC-ESS
relationship. Further statements were shown:
‘All the change, adoption of change, whatever that change is and you can make
someone use the system and they can do all the right things, hit the right buttons
but have they adopted it in the sense of they radically changed the way they do
their job?’
The statement above suggests that an ES will change the way people work but that
there also needs to a move to the next step which is embracing the change and adopting
the ES.
‘whereas here people were actually looking forward to the thing’
In this organisation the staff were positively awaiting the change. The least successful
examples also indicated ‘Change Acceptance’ as being influential.
Change acceptance least successful examples:
Within least successful examples we see statements such as:
‘the export sales area in particular, we had a situation where people had been
with the company a long time, very resistant to change… had a system which
they were already using which they did not want to change, and they were
constantly comparing it with the new system’
This statement illustrates that the people were resisting the change and trying to make
the IS work to the ‘way we’ve always done it’. The OC was not one that encouraged or
fostered change – users preferred to do things the way that they had always done
things.
‘Perhaps it’s because they’re not working across boundaries, they put less
emphasis in some of that whole cultural innovation and change management
across those boundaries.’

Exploring the Relationship of Organisational Culture to Enterprise Systems Success
Chapter 6: Main Study 6-35
The culture of the organisation is not organised to allow change to span the internal
boundaries, rather the focus internally within the particular units, whereas the change
should be adopted across the organisational boundaries.
‘Predominantly because I think there’s a resistance to change. There’s not a
great drive for them to change, they don’t feel the need and the culture is very
much well, you tell me what I, the customer is saying to the implementation team,
you tell me what I need to do’.
Here we see a very clear statement that identifies a ‘resistance to change’ as a response
to the ES. This resistance was evident in other least successful examples.
‘I just think there are those who are out there and those who just wanted to shrink
back and do things the way they always did.’
Some users want to continue to work the way they always have. Within the management
layers there was also resistance to change.
‘now, it’s that, it’s the middle management that don’t want to change.’
‘The upper management want to change, the young gunghos want to
change because to adopt technology, you know, they can’t believe we’re not,
haven’t got the technology now, so they’re chomping at the bit. We’ve got
middle management on the project I’m working on at the moment saying, which
was sort of on the fence.’
Discussion
An Organisational Culture that resists change seems to resist the ES innovation in its
day to day use by inhibiting its successful communication amongst its members. The
successful ES examples are used to change, thereby allowing them to be flexible,
accepting and open to the ES, whilst at the same time openly communicating the ES
throughout the Business Units. There also appear to differences in management layers
in resisting the changes, and in particular middle management are the most resisting.

Exploring the Relationship of Organisational Culture to Enterprise Systems Success
Chapter 6: Main Study 6-36
Figure 6-8. Change Acceptance interacting in the OC-ESS relationship
The next DP sub-category that was identified is ‘User Involvement in the DP’.
Diffusion Process>User Involvement in Diffusion Process
Label: User Involvement in the Diffusion Process
Definition: Involving users in the Diffusion Process through the organisation
Example:
‘However, it is my belief where someone is forced to use a system or process,
their attitude is quite different to the situation where they personally identify the
benefits to themselves and choose to use it.’
Within ‘User Involvement’ there were no positive statements made in the successful
example, rather the comments were made in reference to the least successful example.
User involvement in DP least successful example:
‘If you haven’t got the staff are not prepared and been communicated to, you are
in trouble.’
‘In the operational side of the business they weren’t willing to buy into, everyone
in their branches using it. So it became not compulsory.’
Least successful ES cultures do not appear to pay heed to the involvement of the user in
the Diffusion Process. In addition to support and training, the active process of
involvement may be required to foster a more positive attitude to the ES. The user gets
to identify the potential benefits for themselves.
OC ESS
OC of Change Acceptance
Positive Influence Assists DP of the innovation
Negatively: Absence leads to resisting the innovation

Exploring the Relationship of Organisational Culture to Enterprise Systems Success
Chapter 6: Main Study 6-37
Involvement in the DP may also assist in creating pockets of power users and
champions throughout the Business Units. Conversely a lack of user involvement in the
DP may lead to possible lower levels of engagement and buy in to the ES.
The Organisational Cultures that seem to encourage these manifestations may be more
successful than those that do not. Several statements were made that indicate that this
is the case:
‘We had a business transition plan. We worked closely with managers, a lot of
communication was happening.’
‘Again it’s the communication and I believe that created the success.’
The above statements indicate that the Diffusion Process and communication is
important. Open communication, engaged and visible Diffusion Processes and a culture
that fosters these components seem to assist in ES successful exploitation in any
Organisational Culture.
Figure 6-9. User support in the Diffusion Process in the OC-ESS relationship
In addition to involving users in the Diffusion Process directly, there was also evidence to
suggest that managerial support and understanding for the Diffusion Process itself was
also important. This is the next coding category that was identified in the data.
Diffusion Process>Managerial Support for the Diffusion Process Organisational Cultures that can foster support for the diffusion process both at the user
and managerial level seem particularly successful in exploiting the ES. The data
presented here indicates that direct visible support from management sends a very clear
message throughout the organisation.
OC ESS
Diffusion Process
Positively Influencing by Open communication Positive attitude towards the ES Leading to Exploitation Phase of ES success
Supported by Training, User Support
Exploring the Relationship of Organisational Culture to Enterprise Systems Success
Chapter 6: Main Study 6-38
Label: Managerial support for the Diffusion Process
Definition: The extent to which management understand and support the Diffusion
Process
Example:
‘Management understood the benefits of the system changes to their workgroups
and what this meant to the organisation.’
Managerial support for the DP successful example:
‘Managerial representation is essential for success on an SAP project. This
sends a positive message that the organisation is committed and believed in the
project’
Managerial support for the DP least successful example:
‘But the engineering and management group there avoided using the system.’
‘Particularly, communicating it in such a way that the middle management
actually knows and understands and are embracing it, hasn’t been done and
that’s why the culture is so resistant.’
We see here statements that indicate the important place that managerial support for the
diffusion process has in the OC-ESS relationship. Without an understanding of the
Diffusion Process managers will not be able to support the ES successfully. In the least
successful examples not only were managers not supporting the users in the Diffusion
Process they were also demonstrating little understanding of ‘how’ to enable the
Diffusion Process to occur successfully. The negative aspects of lack of user support in
the Diffusion Process were exacerbated by management not having an understanding of
the Diffusion Process itself. The figure below combines the user support and managerial
understanding findings into the one framework.
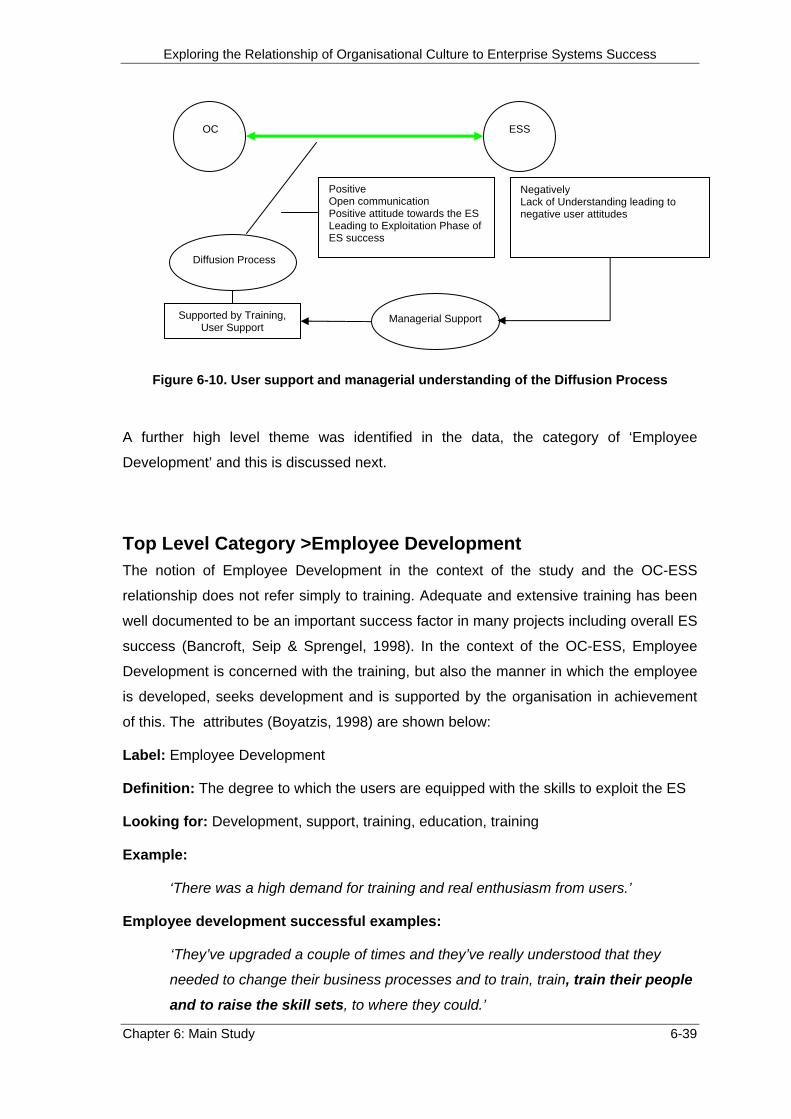
Exploring the Relationship of Organisational Culture to Enterprise Systems Success
Chapter 6: Main Study 6-39
Figure 6-10. User support and managerial understanding of the Diffusion Process
A further high level theme was identified in the data, the category of ‘Employee
Development’ and this is discussed next.
Top Level Category >Employee Development The notion of Employee Development in the context of the study and the OC-ESS
relationship does not refer simply to training. Adequate and extensive training has been
well documented to be an important success factor in many projects including overall ES
success (Bancroft, Seip & Sprengel, 1998). In the context of the OC-ESS, Employee
Development is concerned with the training, but also the manner in which the employee
is developed, seeks development and is supported by the organisation in achievement
of this. The attributes (Boyatzis, 1998) are shown below:
Label: Employee Development
Definition: The degree to which the users are equipped with the skills to exploit the ES
Looking for: Development, support, training, education, training
Example:
‘There was a high demand for training and real enthusiasm from users.’
Employee development successful examples:
‘They’ve upgraded a couple of times and they’ve really understood that they
needed to change their business processes and to train, train, train their people
and to raise the skill sets, to where they could.’
OC ESS
Diffusion Process
Positive Open communication Positive attitude towards the ES Leading to Exploitation Phase of ES success
Supported by Training, User Support
Managerial Support
Negatively Lack of Understanding leading to negative user attitudes

Exploring the Relationship of Organisational Culture to Enterprise Systems Success
Chapter 6: Main Study 6-40
Here we see clear identification of the role that employee training played in the success
of the relationship.
‘But I guess in terms of silos of culture, I guess that whole HR strategy and policy
and how they treat their people is something that needs to be considered.’
‘But that is where they sit down and say, oh it’s affecting me in this way and
therefore I would like my questions answered, or I would like half an hour with my
manager, or I would like this particular training course, or I don’t want that
training course, or whatever it is.’
‘But I think in some way individualising the approach so, individuals feel that they
actually are enabled to, and it’s good too because we need people to prepare for
themselves.’
Employee development least successful examples:
‘You know, I think a lot of workers were sort of do I have to use this, because
they were quite scared of it.’
‘Underneath the ERP system, when we look at their work processes, in the
redesign of it we often, paint that end to end process and then train people in
their specific bits and pieces so they understand where things are coming in and
where, and how it goes out and to who it goes, and what they do with it. That
often is a big change in itself because they don’t know or mostly they don’t
care, and even when they have that insight they still don’t really care
because they can’t sort of internalise it.’
In this last statement, we can see that in the Least Successful examples, the employees
were disinterested and unconcerned about the innovation. The particular culture the
employees were engaged in had fostered or created this negative, ambivalent attitude to
the ES.
Most of the organisations that interviewees discussed provided training to a lesser or
greater extent for their employees. The training whilst an important success factor in its
own right, however, says more about the OC and the ESS relationship in terms of the
way it was provided. It might be that certain Organisational Cultures are better able to
provide the support necessary to employees, not in terms of the actual training, but the
providing of the appropriate supportive environments to assist with the full diffusion and

Exploring the Relationship of Organisational Culture to Enterprise Systems Success
Chapter 6: Main Study 6-41
exploitation of the ES. The fact that training is given is relevant, but what is more
important in the OC-ESS context is the manner, delivery and importance that is placed
on the training by the organisation since this is indicative of the organisation’s
commitment to the ES. The data suggest that perhaps certain culture types are better
able to provide individuals with the opportunities for development, a supportive
environment and recognising the importance of developing employees above and
beyond simply providing lots of training and workshops. The figure below summarises
the findings so far in the data:
Figure 6-11. Employee development component in the OC-ESS relationship
Another high level theme emerged that was linked to but discrete from the ED, which
was the ‘Learning Organisation’ (LO).
Top Level Category> Learning Organisation Learning organisations have been defined in the literature as ‘corporations that
overcome inherent obstacles to learning and develop dynamic ways to pinpoint the
threats that face them and to recognize new opportunities’ (Senge, 1994). Organisations
that display some of these characteristics appear to have higher levels of success with
the ES rather than those that do not. Many of the interviewees described some of these
‘learning’ attributes to be significant in the OC-ESS relationship. The Boyatzis (1998)
attributes are shown below for LO:
Label: Leaning Organisation
Looking for: Learning, innovative, creative, training, knowledge, learnt
OC ESS
Employee Development
Training Support Encouragement Importance
Organisational Culture Setting the parameters for ED components Moderating ED components

Exploring the Relationship of Organisational Culture to Enterprise Systems Success
Chapter 6: Main Study 6-42
Example:
‘And they just started expanding their own solution based on this success, and
were using the principles they learnt in the first one.’
Learning Organisation successful:
‘Developing a commitment to continued innovation, not just implement a system
and allow it to stagnate, but continue to develop and build on the system’
‘So, accepting, cooperative, a learning environment, they’re prepared to learn
and adopt new things’
In the above statements we can see the employee wants to learn and also that the
organisation facilitated and delivered this in the successful examples.
Learning Organisation least successful:
‘The culture was one of lack of flexibility; really it was a lack of flexibility.’
‘The ones that fail have a lack of flexibility; they’re not willing to adjust their
practice to a package.’
Contrary to the successful examples the least successful examples identify the
reluctance to learn and develop new approaches to practices. Organisational Cultures
that tend to have the characteristics of a LO seem to be more successful in the uses of
their Enterprise Systems since it fosters an environment of change acceptance and the
flexibility to exploit the new opportunities that an ES affords. In summary the figure below
visualises the findings:
Figure 6-12. Learning Organisation role in the OC-ESS relationship
The categories continued to be discovered as the data analysis continued. The next top
level category that was identified was the ‘Organisational Structure’ (OS) theme.
OC ESS
Learning Organisation
Positively influencing by: OC allowing the flexibility to change and dynamic approach to Learning Negatively influencing by: Inflexibility restricting exploitation of the ES
Exploring the Relationship of Organisational Culture to Enterprise Systems Success
Chapter 6: Main Study 6-43
Top Level Category>Organisational Structure Organisational Structure is the formal framework by which job tasks are divided, grouped
and coordinated (Mintzberg, 1979). A number of statements were made in relation to the
various organisational forms having an influence on the degree of ESS experienced by a
particular organisation. Whether the organisation has a flatter organic structure or is
more vertically hierarchically oriented seems to have a bearing on some of the
components of ESS. Whilst the nature of an organisations structure is a different aspect
of an organisations makeup to its culture, research has suggested that OS and OC are
linked in a number of ways.
Label: Organisational Structure
Looking for: Structure, organisation, types of structure
Example:
‘A purely flat organisational structure, nobody had to go seeking levels of
approval for anything and I think that’s a big differentiator.’
The following are examples of the successful and least successful statements in regard
to Organisational Structure.
Organisational Structure successful:
‘I guess it’s a purely flat organisational structure, nobody had to go seeking
levels of approval for anything and I think that’s a big differentiator’
Organisational Structure least successful:
‘Misunderstanding behaviours, misunderstanding the impact of the structure and
so on. So this was an organisation that was a financial organisation, structured
in silos. Each of the business units was essentially a little business under its own
right, it had own IT group and so on and some of that was historical, as
acquisitions had occurred, and some of it was, um, designed in saying well, we’ll
structure like this and we’ll have this decentralised structure and it will allow us to
be flexible and innovative, and of course, it’s not usually the way it works.’
The comments indicated by some interviewees suggest that those with a flatter structure
are more nimble in their decision making, i.e., fewer layers to reach the decision maker.
Matrix organisations are examples of flatter, organic, project oriented organisations that
are used to handling project, working to methodologies and coping with regular change.
Many of the successful ES examples are cited as organisations that have the
characteristics of organic structures i.e. are used to managing projects, are innovative

Exploring the Relationship of Organisational Culture to Enterprise Systems Success
Chapter 6: Main Study 6-44
and fluid. Organisations that are flexible, adaptable and innovative may be more rapidly
able to exploit the ES and may therefore experience greater success with the ES.
The connection to the OC-ESS relationship occurs because literature suggests that
Organisational Structure is in part a function of and influenced by Organisational Culture,
i.e., the ‘preferred’ way of working is reflected in the ‘preferred’ structure. Organisational
Culture may therefore be moderating ESS via the Organisational Structure.
Figure 6-13. Organisational structure characteristics influencing OC-ESS
This is an area that will require further research but at this point is another intriguing
dimension to the OC-ESS relationship.
The data showed another category of description at the highest level based on gender
and its role within the OC-ESS relationship.
OC Manifestation: National Culture/Gender (Masculinity & Feminity) Research conducted by Hofstede (1980) indicated that cultural dimensions exist around
the notions of masculinity and feminity. Hofstede argues that the duality of the sexes is
fundamental to all societies and that ‘the predominant socialisation pattern is for men to
be more assertive and for women to be more nurturing. In organisations, there is a
relationship between the perceived goals of the organisation and the career possibilities
for men and women’.
OC ESS
Organisational Structure
Organic Free Flow of Information Decentralized Low Formalisation
Mechanistic Rigid Departmentalism Centralized High Formalisation
Negative Inflexible Lack of free flowing information Many rules and regulations
Positive Flexible Adaptable Innovative

Exploring the Relationship of Organisational Culture to Enterprise Systems Success
Chapter 6: Main Study 6-45
Hofstede bases much of his research on the work of Chetwynd, who is quoted as ‘the
sex role system is at the core of our cultural norms’ (Chetwynd & Hartnett, 1978;3).
Hofstede also subscribes to a widely held belief in anthropology and psychology fields
that there is a pattern of male assertiveness and female nurturance which tends to male
dominance in many areas of politics, economy and religion.
A factor score of 40 countries was used as the basis of the Masculinity Index (MAS). The
MAS measures the extent to which respondents tend to endorse goals usually more
popular amongst men (high MAS score) or amongst women (low MAS score). Typical
characteristics of low and high MAS societies are shown in the table below.
Table 6-10. MAS characteristics (Hofstede, 1990)
Countries with a low score (feminine) in the study were Sweden (5), Norway (8) and the
Netherlands (14); countries with high MAS score (masculine) were Japan (95), Austria
(79) and Venezuela (73). Australia is a high MAS score country.
A number of interviewees identified that in some Organisational Cultures there was an
element of differences in ES success along the male/female cultural dimensions. The
findings provide further support for that male and female characteristics can be less or
more dominant in certain organisations and therefore influential in the OC-ESS
relationship (Hofstede, 1990). In particular,
Masculinity/feminity successful example:
‘That’s the other thing, which was observable, maybe because there is a lot of
female branch managers out there, that we certainly found the women branch
managers were really gung ho.’
‘We just give them indications, things to think about, but men want solutions.’
Masculinity/feminity least successful example:
‘I think it’s sort of, part of the culture because a lot of X Bank was mainly female
and X Water for example, you can imagine the guys that work out in the field

Exploring the Relationship of Organisational Culture to Enterprise Systems Success
Chapter 6: Main Study 6-46
doing maintenance and sewerage and stuff, there’s no females at all, and it’s a
particular type of male, and I really think that’s, even such a simple thing as
gender, it’s really important to consider.’
There is evidence to suggest that the feminine dimension of ‘nurturing’ may be more
supportive of the ES, fostering its use and diffusion throughout the organisation.
OC Manifestation: Sub-Cultures present within the Dominant OC Literature indicated that sub-cultures within a dominant overarching culture type are
common occurrences in larger organisations (Goffee & Jones, 1998; Wilkins & Ouchi,
1983). Many of the statements made by interviewees confirm the presence of sub-
cultures with the dominant. The sub-cultures may exist in separate Business Units,
within the one entity, separate geographic locations or even entire separate
companies/divisions in large multi-national conglomerates. The existence of sub-cultures
in itself does not appear to be an automatic precursor for failure or a problematic ES.
Rather it appears that it is the manner in which these sub-cultures interact that is
important in the OC-ESS relationship. However, there were far more negative comments
regarding the presence of strongly disparate sub-cultures within an organisation, than
there were positive experiences.
Label: Sub-cultures present within the dominant
Definition: A sub-culture is a set of people with distinct sets of behaviour and beliefs
that differentiate them from a larger culture of which they are a part.
Looking for: Groups, clusters, they do things this way,
Example:
‘Export sales are viewed by those within the group as a part from the group with
their own rules.’
OC ESS
Nurturing
Positive Supportive of diffusion of the ES
Table 6-11. Dimension of gender
Exploring the Relationship of Organisational Culture to Enterprise Systems Success
Chapter 6: Main Study 6-47
Within the data there were numerous statements with regard to the negative impact that
sub-cultures had on the relationship. Some of these examples are presented below.
Sub-Cultures least successful example:
‘In a similar way to ABC Export, engineering were involved more with
petroleum exploration and generating income and were largely, non-
conformists who did not want to follow the standard process.’
‘like the firm I worked on, I was like in the sales so we had the more savvy
people, that is the part which was run very badly was the maintenance.’
‘Always, and it’s more than that, within very large organisations some of those
groups will actually be in conflict.’
‘That’s exactly the feeling when I talk to them, resistance to more rule and
structure; it is probably the formalisation of the structure, which they rebel
against.’
The statements suggested that in certain situations the sub-cultures may be actively
resisting the ES, for example,
‘Engineering were involved more with petroleum exploration and generating
income and were largely, non-conformists who did not want to follow the
standard process’
Or they may for whatever reasons be following their own agenda, for example,
‘We had the technology group saying, we don’t like it, this is a Microsoft system
and we’re a J2EE shop, so what we’re going to do is, we’re going to build a front
end, a J2EE front end on it, and everyone was out of control and nobody with the
big picture.’
There may also be power struggles at play between the cultural groups, where each
group is motivated by their own requirements foremost.
‘I mean I think that’s about human nature, effectively it’s about power and how do
you get there. And some people are motivated that way and not always taking
the best interests of everyone around them at heart.’

Exploring the Relationship of Organisational Culture to Enterprise Systems Success
Chapter 6: Main Study 6-48
In summary, we can conclude with some observations that sub-culture may be
influencing the OC-ESS relationship via:
Groups in conflict: Some sub-cultures may actually be in conflict or competing with
each other. The groups are more concerned with self-interest, self-promotion and
protectionism than with the greater organisational success.
Self interest and power issues: Some sub-cultures resist the ES due to perceptions of
relinquishing power or redistributing power to other ‘competing’ sub-cultures.
Lack of perceived benefit: A number of sub-cultures within the dominant were reported
as resisting the ES because of inadequacies with the functionality of the ES. The ES did
not ‘do’ what the group wanted and the group was failing to see the value in the ES.
Figure 6-14. Sub-culture presence in the OC-ESS relationship
OC ESS -Negative Least Successful Groups in Conflict Competing Power Issues Promoting Self Interest Non-sharing of Information Building, Maintaining barriers
Differing Sub Cultures experiencing differing levels of ESS
Sub Culture
A
Sub Culture
B

Exploring the Relationship of Organisational Culture to Enterprise Systems Success
Chapter 6: Main Study 6-49
6.4. Qualitative Selective Coding
The third pass through the transcripts involved selective coding. The cultural
manifestations and components that had been previously identified were then coded
against the OCAI. The purpose of the selective coding was to explore the OC-ESS
relationship directly through the OCAI constructs and sub-constructs lens. Analysing the
themes against the OCAI constructs allowed the mapping of the themes directly into the
OCAI. By mapping the themes into the OCAI a direct exploration of the OCAI sub-
constructs, cultural types and ESS dynamics could be made. Statements at the lowest
level in the hierarchy (i.e. the S/LS level within an OC manifestation) were analysed to
see if the statement concerned an OCAI construct directly.
The table below summarises the number of utterances made that were clearly
discussing one of the OCAI constructs, ranked by number of passages.
Successful ES Least Successful
Rank OCAI Construct No. of
Passages
Rank OCAI Construct No. of
Passages 1 OCAI C (DO) 35 1 OCAI H (COOR) 34 2 OCAI A (CI) 34 2 OCAI H (CON) 21 3 OCAI A (F) 25 3 OCAI A (CI) 17 4 OCAI A (I) 18 4 OCAI A (F) 12 5 OCAI H (COOR) 17 5 OCAI C (DO) 9 6 OCAI C (T) 15 6 OCAI M (CO) 5 7 OCAI H (CON) 8 7 OCAI C (IR) 3 8 OCAI C (IR) 6 8 OCAI C (T) 3 9 OCAI H (A) 1 9 OCAI A (I) 1
10 OCAI M (CO) 0 10 OCAI H (A) 0 11 OCAI M (CS) 0 11 OCAI M (CS) 0 12 OCAI M (E) 0 12 OCAI M (E) 0
Table 6-12. OCAI constructs by passage
The frequency counts alone indicate the importance of the clan culture type in the
successful ES, and specifically the influence of the DO sub-construct (Development of
Others - Helping individuals improve their performance, expand their competencies and
obtain personal development opportunities) to the OC-ESS relationship in successful
ES.
In the least successful ES the passage counts indicate the large number of utterances
that relate to the Hierarchy COOR (Coordination - Fostering coordination within the
organisation as well as with external units and managers and sharing information across
boundaries) and Hierarchy CON (Control - Ensuring that procedures, measurements
and monitoring systems are in place to keep processes and performance under control)

Exploring the Relationship of Organisational Culture to Enterprise Systems Success
Chapter 6: Main Study 6-50
as being particularly influential (negatively so) in the OC-ESS relationship in the least
successful ES. These two OCAI constructs alone accounted for 52% of the total
passage count.
The next section reviews the major OCAI categories identified.
Successful ES OCAI Clan Sub-Construct DO (Development of Others): Many of the consultants indicated that the way in which management encouraged,
promoted or failed to support employees in regard to the ES was particularly critical.
These statements, in a cultural context, suggest that the DO sub-construct has a strong
influence on the OC-ESS relationship.
The Clan DO sub-construct represents the largest OCAI category for successful ES by
passage count; some of the statements are shown below:
Clan DO ES successful:
‘They’ve upgraded a couple of times and they’ve really understood that they
needed to change their business processes and to train, train, train their people
and to raise the skill sets, to where they could.’
‘I think we focus a lot on enabling the people so they can actually know how to
use it and be comfortable sort of, pressing the right buttons and stuff like that,
and less on if they really want it.’
‘But I think in some way individualising the approach so, individuals feel that they
actually are enabled to, and it’s good too because we need people to prepare for
themselves.’
Clan DO ES least successful:
‘asked the senior supervisors why don’t your staff know what happens in the
whole process. The response is “Oh, I only teach them what they’re capable”.’
‘and there wasn’t any stroking going on and they probably needed some stroking
to get them over the line, but they were being told, this is what you will do’
The figure overleaf visualises the findings from the Clan DO coding.
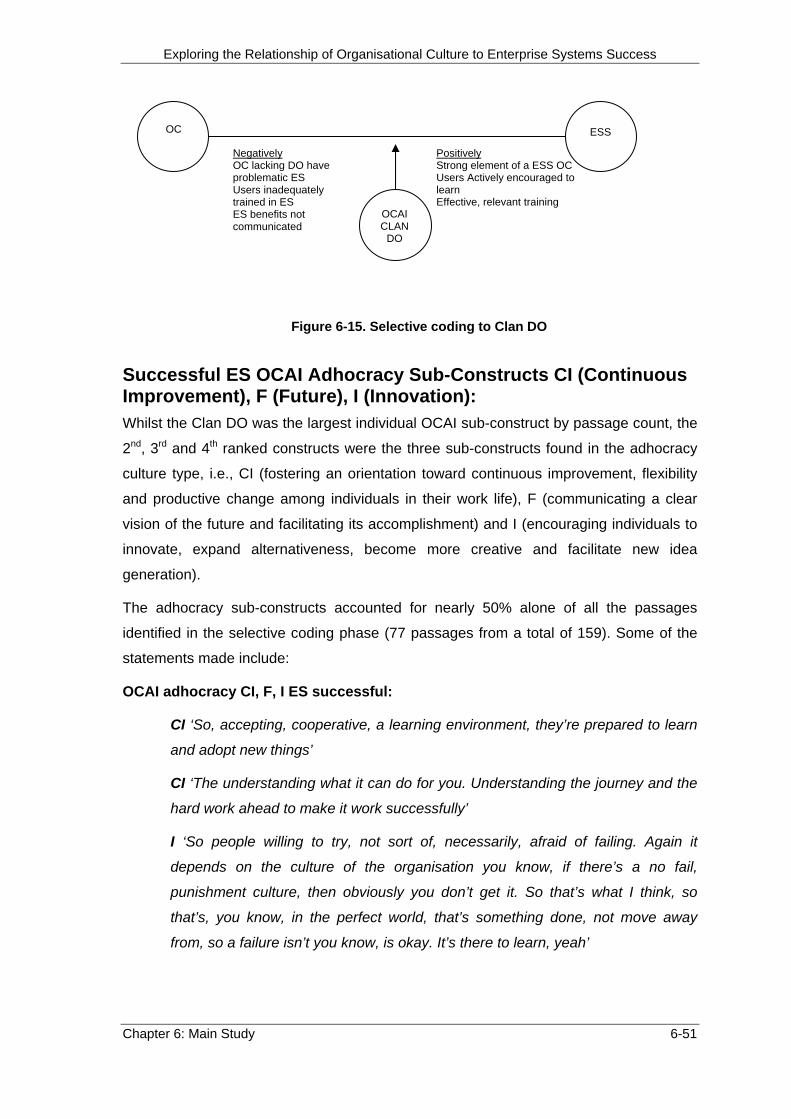
Exploring the Relationship of Organisational Culture to Enterprise Systems Success
Chapter 6: Main Study 6-51
Successful ES OCAI Adhocracy Sub-Constructs CI (Continuous Improvement), F (Future), I (Innovation): Whilst the Clan DO was the largest individual OCAI sub-construct by passage count, the
2nd, 3rd and 4th ranked constructs were the three sub-constructs found in the adhocracy
culture type, i.e., CI (fostering an orientation toward continuous improvement, flexibility
and productive change among individuals in their work life), F (communicating a clear
vision of the future and facilitating its accomplishment) and I (encouraging individuals to
innovate, expand alternativeness, become more creative and facilitate new idea
generation).
The adhocracy sub-constructs accounted for nearly 50% alone of all the passages
identified in the selective coding phase (77 passages from a total of 159). Some of the
statements made include:
OCAI adhocracy CI, F, I ES successful:
CI ‘So, accepting, cooperative, a learning environment, they’re prepared to learn
and adopt new things’
CI ‘The understanding what it can do for you. Understanding the journey and the
hard work ahead to make it work successfully’
I ‘So people willing to try, not sort of, necessarily, afraid of failing. Again it
depends on the culture of the organisation you know, if there’s a no fail,
punishment culture, then obviously you don’t get it. So that’s what I think, so
that’s, you know, in the perfect world, that’s something done, not move away
from, so a failure isn’t you know, is okay. It’s there to learn, yeah’
OC ESS
Positively Strong element of a ESS OC Users Actively encouraged to learn Effective, relevant training
OCAI CLAN
DO
Negatively OC lacking DO have problematic ES Users inadequately trained in ES ES benefits not communicated
Figure 6-15. Selective coding to Clan DO

Exploring the Relationship of Organisational Culture to Enterprise Systems Success
Chapter 6: Main Study 6-52
OCAI adhocracy CI, F, I ES least successful:
CI ‘If your organisation doesn’t accept that, if I’ve got an inflexible organisation,
big or small then it’s not going to work. Because they are not going to use it the
way it should be used and they are going to be fighting it all the time.’
CI I ‘Almost to a person, people are going into it thinking, well we’ll just tweak this
and pull that and make it do it the way we’ve always done it.’
The figure below summarises the findings from the adhocracy constructs on the
relationship.
Least Successful ES OCAI Hierarchy Sub-Constructs COOR (Coordination), CON (Control): The analysis of the least successful ES transcripts revealed the prevalence of
statements, that when selectively encoded against the OCAI, clustered around the
hierarchy sub-constructs COOR (fostering coordination within the organisation as well as
with external units and managers and sharing information across boundaries) and CON
(ensuring that procedures, measurements and monitoring systems are in place to keep
processes and performance under control). These OCAI constructs seem particularly
important in the OC-ESS relationship in the least successful examples. The consultants
revealed that a lack of sharing information across boundaries, a lack of control of policy
and procedures or a severe degree of over control could stifle the success of the ES.
Organisational Cultures that allowed sharing of information and offered a degree of
Figure 6-16. OCAI Adhocracy influences

Exploring the Relationship of Organisational Culture to Enterprise Systems Success
Chapter 6: Main Study 6-53
control and direction experienced greater levels of ESS. Least successful ES were
influenced greatly by information sharing and control issues.
OCAI hierarchy COOR & CON ES least successful:
CON ‘The governance in the organisation wasn’t very strong.’
CON ‘So you know, how do you make them use something. You know they might
get into a fight literally, and you know say, stuff it I’m not doing it. And the boss
would have to say well, stuff it, you are going to do it.’
COOR ‘I mean I think that’s about human nature, effectively its about power and
how do you get there. And some people are motivated that way and not always
taking the best interests of everyone around them at heart.’
COOR ‘So they had to see across their team, if you like, and they were not used
to that and I guess were quite siloed thinkers and, that was hard to break
through.’
The figure below summarise the influences of OCAI H CON and COOR identified in the
data.
Figure 6-17. OCAI hierarchy control and coordination influence

Exploring the Relationship of Organisational Culture to Enterprise Systems Success
Chapter 6: Main Study 6-54
6.5. Quantitative Results: OCAI Radar Plots
Each interviewee was asked to complete two OCAI surveys at the conclusion of the
interview; one for the successful ES example and one for the least successful ES
example discussed in the interview. A total of 17 interviews were conducted therefore a
theoretical 34 OCAI’s (17 Successful OCAI and 17 least successful OCAI’s) were to be
collected. However, in total 12 interviewees returned fully completed surveys yielding 24
OCAI’s (12 successful OCAI and 12 least successful OCAI). The actual overall scores
are shown in the table below, together with the radar plot for the ‘All Consultant’
categories is shown below.
OCAI Culture Type Successful Least Successful
Clan 32 22
Adhocracy 20 16
Market 18 23
Hierarchy 30 39
Table 6-13. OCAI scores all consultants mean
Figure 6-18. OCAI radar plot all consultants

Exploring the Relationship of Organisational Culture to Enterprise Systems Success
Chapter 6: Main Study 6-55
The OCAI instrument identifies that all organisations have attributes of the four types but
that organisations have varying mixes of the four types. Some organisations tend
towards a hierarchy whilst others tend to have more of the characteristics of a market
culture. The most successful ES organisations have a clear tendency towards the clan
typology with a mean score of 32, the next is ‘Hierarchy’, ‘Adhocracy’ and finally ‘Market’.
Clan Culture The clan culture is typified by ‘a friendly place to work where people share a lot of
themselves. It is like an extended family. Leaders are thought of as mentors, even as
parent figures. The organisation is held together by loyalty and tradition. Commitment is
high. The organisation emphasises the long term benefit of individual development with
high cohesion and morale being important. Success is defined in terms of internal
climate and concern for people. The organisation places a premium on team work,
participation and consensus’ (Cameron & Quinn, 1999).
The data therefore suggests a hypothesis for testing:
H1: Those organisations that have a strong Clan culture element will experience the
greatest levels of ES success
Market Culture The culture type that is least prevalent in successful ES (18) and has the second highest
score in least successful ES (23) is the market culture. The market culture is typified by
‘a results oriented workplace. Leaders are hard driving producers and competitors. They
are tough and demanding. The glue that holds the organisation together is an emphasis
on winning. The long-term concern is on competitive actions and achieving stretch goals
and targets. Success is defined in terms of market share and penetration. Outpacing the
competition and market leadership are important’ (Cameron & Quinn, 1999).
Since market cultures appear to be associated with least success a second hypothesis
emerges for testing:
H2: Those organisations that are strongly Market culture oriented will experience the
lowest levels of ES success

Exploring the Relationship of Organisational Culture to Enterprise Systems Success
Chapter 6: Main Study 6-56
Hierarchy Culture Hierarchy cultures appear to have the potential to be very successful – ranked as the 2nd
highest dimension in successful ES (30) or very least successful (39). Hierarchy culture
components were seen as being the least successful by a clear margin – nearly double
the score of the next culture type. There is an interesting paradox here. Some
organisations that are strongly hierarchical have the potential for ES Success whilst
other organisations that are highly hierarchical experience low levels of ES Success.
Hierarchy cultures therefore have the potential to be highly successful and yet also
highly unsuccessful.
H3: Hierarchy cultures are associated with the least successful ES organisations
H4: Dimensions of the hierarchy culture are important in successful ES organisations
Adhocracy Culture When one considers the adhocracy culture type there are some interesting results. The
adhocracy culture type has a moderate score for successful ES (20, rank third for mean
consultant scores) and the lowest score in least successful ES (16).
The adhocracy dimension is seen as being only weakly prevalent in the successful ES.
Yet these results are very curious. When we revisit the literature, the theory tells us that
Learning Organisations (Senge, 2004) - organisations that are very flexible, creative and
innovative - are the organisational types that modern organisations should aspire to
become. Research indicates that these contemporary organisations are agile, lean and
adaptable, poised to exploit new opportunities, aggressively entering new markets and
able to change rapidly to meet the challenges of the market. They are perceived to be
the ‘new’ successful organisational types.
The adhocracy sub-constructs (CI – Continuous Improvement, F – Future Orientation, I –
Innovation), are these exact qualities that we would expect to find in very successful ES.
But curiously we do not find evidence of this in the OCAI plots from the consultants, the
adhocracy culture type and its sub-constructs are not seen as being the most important
in successful ES organisations. There are a number of possible explanations for this:
Adhocracy cultures are simply not that common. Whilst the literature may be correct and
organisations that display these qualities are indeed successful, they may simply not be
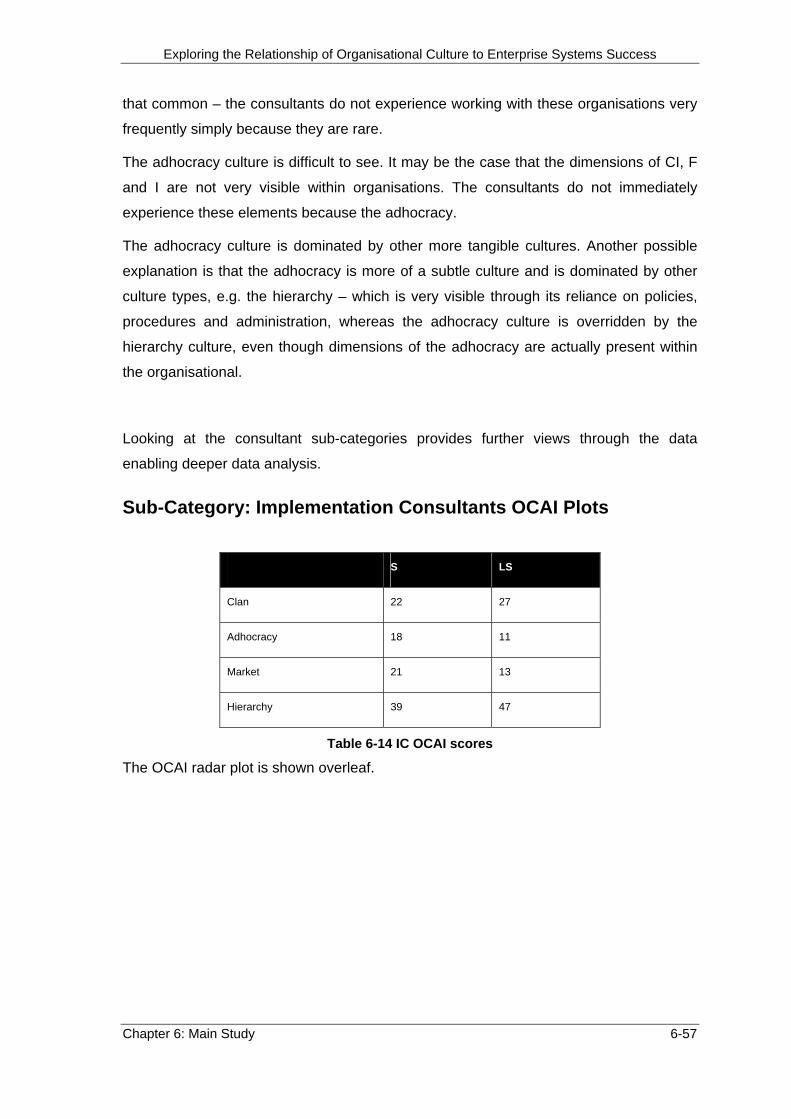
Exploring the Relationship of Organisational Culture to Enterprise Systems Success
Chapter 6: Main Study 6-57
that common – the consultants do not experience working with these organisations very
frequently simply because they are rare.
The adhocracy culture is difficult to see. It may be the case that the dimensions of CI, F
and I are not very visible within organisations. The consultants do not immediately
experience these elements because the adhocracy.
The adhocracy culture is dominated by other more tangible cultures. Another possible
explanation is that the adhocracy is more of a subtle culture and is dominated by other
culture types, e.g. the hierarchy – which is very visible through its reliance on policies,
procedures and administration, whereas the adhocracy culture is overridden by the
hierarchy culture, even though dimensions of the adhocracy are actually present within
the organisational.
Looking at the consultant sub-categories provides further views through the data
enabling deeper data analysis.
Sub-Category: Implementation Consultants OCAI Plots
S LS
Clan 22 27
Adhocracy 18 11
Market 21 13
Hierarchy 39 47
Table 6-14 IC OCAI scores
The OCAI radar plot is shown overleaf.
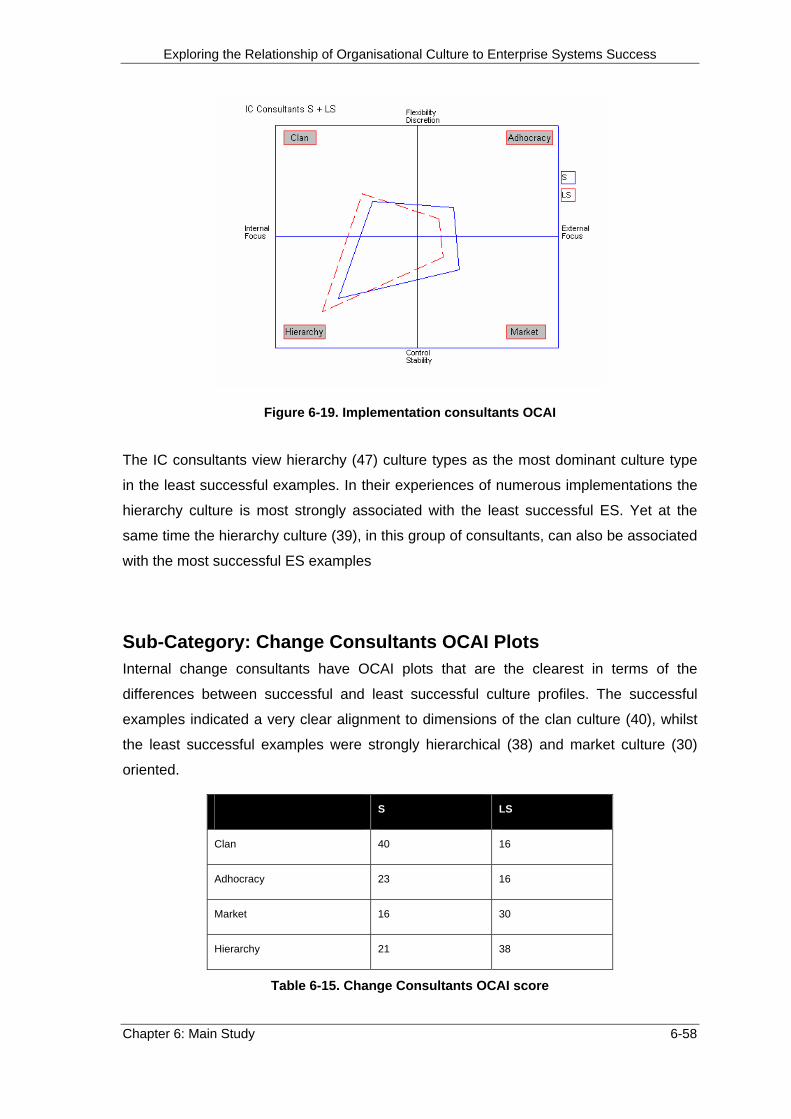
Exploring the Relationship of Organisational Culture to Enterprise Systems Success
Chapter 6: Main Study 6-58
Figure 6-19. Implementation consultants OCAI
The IC consultants view hierarchy (47) culture types as the most dominant culture type
in the least successful examples. In their experiences of numerous implementations the
hierarchy culture is most strongly associated with the least successful ES. Yet at the
same time the hierarchy culture (39), in this group of consultants, can also be associated
with the most successful ES examples
Sub-Category: Change Consultants OCAI Plots Internal change consultants have OCAI plots that are the clearest in terms of the
differences between successful and least successful culture profiles. The successful
examples indicated a very clear alignment to dimensions of the clan culture (40), whilst
the least successful examples were strongly hierarchical (38) and market culture (30)
oriented.
S LS
Clan 40 16
Adhocracy 23 16
Market 16 30
Hierarchy 21 38
Table 6-15. Change Consultants OCAI score

Exploring the Relationship of Organisational Culture to Enterprise Systems Success
Chapter 6: Main Study 6-59
Figure 6-20. Change consultants OCAI
Sub-Category: Vendor Consultants OCAI Plots The vendor consultants confirmed the results of the IC and VC consultant categories;
Hierarchy was evident as the dominant culture in the least successful examples whilst
dimensions of clan and hierarchy were dominant in the most successful examples.
S LS
Clan 31 22
Adhocracy 18 21
Market 19 24
Hierarchy 33 33
Table 6-16. Vendor Consultants OCAI scores

Exploring the Relationship of Organisational Culture to Enterprise Systems Success
Chapter 6: Main Study 6-60
Figure6-21. Vendor consultants OCAI
Summary: OCAI Consultants Plots The OCAI results from the consultants present some very interesting findings. Firstly,
that the hierarchy is consistently associated with the least successful ES examples
across all the consultant categories. Regardless of consultant type, organisational
setting or organisational type, the hierarchy is most closely associated with the least
successful ES.
Secondly, the Organisational Culture type most dominant in the most successful ES is
the clan culture. The clan culture is clearly shown as being the dominant culture type in
the most successful ES organisations.
Thirdly, the market culture is the second most dominant culture type in the least
successful ES.
Fourthly, and paradoxically, the hierarchy culture is also strongly represented in the
successful ES organisations. Hierarchy culture characteristics closely follow behind clan
cultures, being the second most in those organisations that experience successful ES.
There are two possible explanations as to why the hierarchy is seen as dominant in the
least successful but at the same time important in successful ES organisations.
The hierarchy culture is comprised of three sub-constructs (‘Coordination’, ‘Control’ and
‘Acculturation’). Not all the dimensions are responsible for equal influence in the OC-
ESS. Certain of these constructs may be more important and influential in the successful
and least successful ES than the others.

Exploring the Relationship of Organisational Culture to Enterprise Systems Success
Chapter 6: Main Study 6-61
The clan and hierarchy cultures are strongly represented in the successful ES examples
since it may be that the combination of these two culture types together fosters a
positive environment for the ES.
In summary, the culture types were ranked as shown in the table below:
Successful ES Culture
Types
Least Successful ES
Culture Types
1st Most Dominant Clan Hierarchy
2nd Most Dominant Clan & Hierarchy Market
Cul
ture
Hie
rarc
hy
3rd Most Dominant Hierarchy
Table 6-17. Table of the culture types ranking

Exploring the Relationship of Organisational Culture to Enterprise Systems Success
Chapter 6: Main Study 6-62
6.6. Combining the Consultant OCAI and Consultant Qualitative
Results
The OCAI radar plots indicate that the most successful ES are located within
organisations that are dominated by dimensions of the clan culture. The least successful
ES are located within organisations that are dominated by dimensions of the hierarchy
culture. The quantitative findings from the consultant study are supported by the
qualitative data from the consultant interviews. The pattern coding identified a number of
manifestations that were in support of the OCAI results. The individual triangulated
points of support are shown in the table below.
Aspect of the OC-ESS
relationship
Quantitative Finding Qualitative Finding
A Successful ES example Clan most dominant culture type in
successful ES
Selective coding of transcripts against
OCAI reveals clan sub-construct DO
most numerous by passage count in
successful ES
Comment Both the qualitative and the quantitative data from the consultant’s study
indicated that the clan and in particular the clan DO sub-construct are strongly
evident in those organisations that were most successful. The two independent
sets of results indicate the important influence of the clan in successful ES.
Aspect of the OC-ESS
relationship
Quantitative Finding Qualitative Finding
B Least successful ES example Hierarchy most dominant culture
type in least successful ES
Selective coding of transcripts against
OCAI reveals hierarchy COOR and
CON constructs most numerous by
passage count in least successful ES
Comment The hierarchy culture appears to be negatively associated with ES Success.
The qualitative data indicates that the two constructs associated with the lack
of success in these hierarchies is caused by:
A lack of information sharing across boundaries (COOR) and a lack/or too
extreme control (CON) in these culture types
Aspect of the OC-ESS
relationship
Quantitative Finding Qualitative Finding
C Least Successful ES example Market culture orientation very
dominant in the last successful ES
examples
No statements were made by any
consultants as regards dimensions of
the market culture being present in
successful ES examples
Comment Market cultures from the quantitative data are associated with least successful
ES examples. No consultants indicated that any of the dimensions of the
market culture were associated with successful ES. The components of the
market culture do not appear to assist in the success of the ES.
Table 6-18. Combined OCAI and Consultant findings

Exploring the Relationship of Organisational Culture to Enterprise Systems Success
Chapter 6: Main Study 6-63
The analysis of the consultant data took a great deal of time, however, by studying the
OC-ESS relationship via both quantitative and qualitative techniques, even though it was
time consuming, rich and comprehensive observations of the research object were
made. The wide variety of individual findings discussed in this chapter is evidence of the
breadth and depth of results obtained by the multi-method approach. The next section
summarises the major findings of the consultant’s study.

Exploring the Relationship of Organisational Culture to Enterprise Systems Success
Chapter 6: Main Study 6-64
6.7. Summary of Results
The Consultant study presented a number of interesting findings.
The major discoveries are summarised below.
A. The actual consultant categories seemed less important than first envisaged. There
was much repetition of manifestations in the interviews regardless of consultant
category. The repetition of manifestations started early in the data gathering exercise,
the same manifestations being expressed by interviewees as early as interview three,
and by the close of interview six, over half of the final manifestations had been identified.
The fact that interviewees were repeating and confirming manifestations early in the
process indicated two important elements:
The interview questions and interview structure were working well. The repetition in the
latter interviews of manifestations already discovered in earlier interviews indicated a
strong design that was indeed exploring the OC-ESS relationship. The reliability of the
data collected was very strong.
The same manifestations were being experienced regardless of individual consultant or
individual organisational setting. The experiences and manifestations of the relationship
between Organisational Culture and ES Success appear to be similar regardless of the
actual ES Innovation, organisational setting or consultant type. These findings are
discussed in greater detail in chapter 7. The next section presents the findings and
results from the consultant’s study
B. The findings in the qualitative data were supported by the findings in the quantitative
data. For example from the OCAI survey the clan culture was most dominant in
successful ES and the qualitative data confirmed the strong presence of clan culture
dimension DO in the successful ES examples.
C. The hierarchy and market culture types may be most dominant in least successful ES
organisations. Again, both the quantitative and qualitative data support this finding.
The figure overleaf visualises the influences.
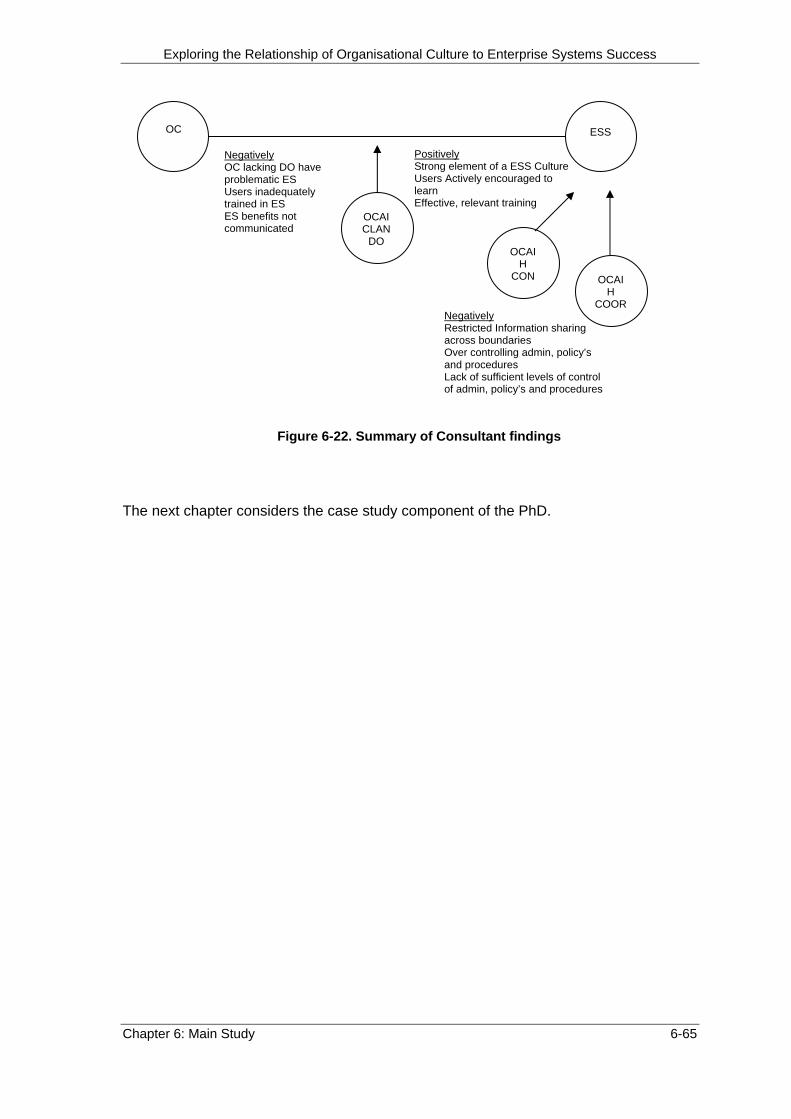
Exploring the Relationship of Organisational Culture to Enterprise Systems Success
OC
The next chapter considers the case study component of the PhD.
Chapter 6: Main Study 6-65
ESS
Negatively Restricted Information sharing across boundaries Over controlling admin, policy’s and procedures Lack of sufficient levels of control of admin, policy’s and procedures
OCAI H
COOR
OCAI H
CON
OCAI CLAN
DO
Negatively OC lacking DO have problematic ES Users inadequately trained in ES ES benefits not communicated
Positively Strong element of a ESS Culture Users Actively encouraged to learn Effective, relevant training
Figure 6-22. Summary of Consultant findings

Exploring the Relationship of Organisational Culture to Enterprise Systems Success
Chapter 7
Revelatory Case Study
Chapter 7: Revelatory Case Study 7-1

Exploring the Relationship of Organisational Culture to Enterprise Systems Success
Table of Contents – Chapter 7 Revelatory Case Study
7. Revelatory Case Study.......................................................................................... 7-1
7.1. Revelatory Case Study ............................................................................... 7-4
7.2. Suitability of the Organisation for Inclusion in the Study ............................. 7-5
7.3. Data Collection............................................................................................ 7-8
7.4. Quantitative Data: ESS + OCAI Analysis and Interpretation..................... 7-11
7.5. Case Study Review & Summary ............................................................... 7-31
Figures
Figure 7-1. Information System portfolio Oz Dairy ................................................ 7-6
Figure 7-2. Oz Dairy ESS results ........................................................................ 7-11
Figure 7-3. Survey response by geographic unit ................................................... 7-1
Figure 7-4 Survey response by employment cohort ............................................ 7-22
Figure 7-5. OCAI Operations Business Unit ........................................................ 7-24
Figure 7-6. OCAI Shipping Business Unit ........................................................... 7-25
Figure 7-7. OCAI Finance Business Unit............................................................. 7-25
Figure 7-8. OCAI Sales Business Unit ................................................................ 7-26
Figure 7-9. OCAI IT Business Unit ...................................................................... 7-27
Figure 7-10. OCAI Head Office ........................................................................... 7-27
Chapter 7: Revelatory Case Study 7-2

Exploring the Relationship of Organisational Culture to Enterprise Systems Success
Tables
Table 7-1. Oz Dairy financial results...................................................................... 7-4
Table 7-2. Case study demographics collected..................................................... 7-9
Table 7-3. Summary of BU ranked by % responses and ESS scores................. 7-13
Table 7-4. Business Unit ranked by overall ESS score ....................................... 7-13
Table 7-5. Business Units ranked by OI scores .................................................. 7-14
Table 7-6. Business Units ranked by II scores .................................................... 7-14
Table 7-7. Business Units ranked by SQ scores ................................................. 7-14
Table 7-8. Business Unit ranked by IQ scores .................................................... 7-15
Table 7-9. Operations BU all results.................................................................... 7-15
Table 7-10. Shipping Unit results ........................................................................ 7-16
Table 7-11. Finance Unit all results ..................................................................... 7-17
Table 7-12. Sales & Marketing Unit all results..................................................... 7-17
Table 7-13. IT Unit all results............................................................................... 7-17
Figure 7-14. ES Success by Geographic Unit ..................................................... 7-18
Table 7-15. ESS Results summary by location ................................................... 7-19
Table 7-16. Location ranked by overall ESS score ............................................. 7-19
Table 7-17. Location ranked by OI score ............................................................ 7-20
Table 7-18. Location ranked by II score .............................................................. 7-20
Table 7-19. Location ranked by SQ..................................................................... 7-20
Table 7-20. Location ranked by IQ ...................................................................... 7-21
Table 7-21. ESS results by employment cohort .................................................. 7-22
Table 7-22. ESS Scores by module ranked by overall ESS score ...................... 7-23
Table 7-23. Correlation/linear regressions of the OCAI culture types ................. 7-29
Table 7-24. OCAI types by ESS item .................................................................. 7-30
Chapter 7: Revelatory Case Study 7-3

Exploring the Relationship of Organisational Culture to Enterprise Systems Success
7.1. Revelatory Case Study
Research Aims Literature Review
Study Design
Pilot Study
Cross Case Analysis
Revelatory Case Study
Main Study
This chapter describes the revelatory case study that commenced upon completion
of the consultant’s study. The purpose of the case study was to further explore the
OC-ESS relationship in a revelatory environment to provide further data regarding
experiences of the OC-ESS relationship.
In order to satisfy the study design requirements for the study, the revelatory case
study needed to be undertaken in an organisation that met the needs of the
overarching research design, in order to capture experiences of the OC-ESS across
the broadest possible range from experienced consultants.
Organisational Setting
The organisation involved in the case study was a large Australian dairy
cooperative, called Oz Dairy. The organisation was founded in 1950 and has
subsequently grown to become one of the largest processors of milk in Australia.
The company has eight plants and processes 35% of the nation’s milk supply into
quality products which are sold on both domestic and export markets. The
organisation employs some 2,200 people and exports its products, which include
Butter, Cheese, Milk Powders and UHT products, to over 100 countries.
A summary of financial results is shown below:
AU$ (Millions) 2000 2001 2002 2003 2004
Total Sales Revenues 1420 1613 2012 1663 1613
Exporting Sales Revenue 863 1103 1312 1003 1013
Operating Profit (pre tax) 30 50 63 5 13
Total Shareholders Equity 345 404 500 527 544
Issued Ordinary Capital 66 84 105 123 130
Reserves And Retained Profits 206 238 298 295 302
Total Assets 887 1065 1302 1212 1319
Milk Intake (million litres) 3134 3393 4130 3635 3506
Table 7-1. Oz Dairy financial results
Chapter 7: Revelatory Case Study 7-4

Exploring the Relationship of Organisational Culture to Enterprise Systems Success
The organisation is a substantial entity and offered an opportunity to investigate the
research object in a significant enterprise.
7.2. Suitability of the Organisation for Inclusion in the Study
The organisation fulfilled a number of key criteria that allowed its inclusion into the
study. The key criteria were:
1. 2 years post ‘go live’
2. deployment of multiple modules
3. use of the system across the Business Units
4. geographically diverse
5. Australian-based
6. to be able to both qualitatively and quantitatively explore the relationship of
culture to perceptions of ESS.
Size
Oz Dairy is a large organisation with a turnover of AU$1.4 billion and employing
over 2,000 staff. It had organisational units dispersed geographically including city
and country elements. It had a typical organisational structure functionally derived
with different business units for sales and marketing, production and finance. Such
an organisation has been shown to have the potential for sub-cultures. Thus, Oz
Dairy provided an opportunity to investigate the existence of a relationship between
micro culture type and the perceptions of Enterprise Systems Success.
Enterprise System SAP R/3
The organisation has an integrated ES, having implemented SAP R/3 in a two
phase roll out. Phase I commenced in 2001 and Phase II was completed in 2002.
This represented a sufficient amount of time from ‘go live’ to data collection (July
2005) to meet our criteria for interviews (2-4 years post implementation).
SAP R/3 has been implemented across a range of Business Units and functions
and enabled investigation into the OC-ESS relationship within a private sector
organisation.
The organisation currently has in operation Financial Accounting and Control (FI-
CO), Materials Management (MM), Sales & Distribution (SD), Production Planning
Chapter 7: Revelatory Case Study 7-5

Exploring the Relationship of Organisational Culture to Enterprise Systems Success
for Process Industries (PP-PI) and Plant Maintenance (PM) modules. An overview
of the current SAP R/3 functionality and integration into the various functions is
shown in the diagram below:
Labplus MILAP
Fax Serv
Suppliers Pay Share Register
Plant Maintenance
Fleet Mgmt Product Costing
Edisoft
Trident
ExDoc
EXIT
Bank
SAP
Trading debtors
Payroll Emp
Equity
Trading Stores
Banks EFT
Cheques Reports
SAP Entry
Farms
Factories Warehouses
Raw material Processing
Finished Goods
Despatch
Orders: Retail
Corporate Export
Industrial
Payments
AQIS
Customs
Figure 7-1. Information System portfolio Oz Dairy
Thus, OZ Dairy met all the criteria for deployment and use of an Enterprise System:
1. 2 years post ‘go live’
2. deployment of multiple modules
3. use of the system across the Business Units
4. geographically diverse
5. Australian-based
Location & Accessibility
The organisation kindly agreed to allow full access to its various Business Units
within both its Head Office and branch network. Located in Australia, the
organisation afforded convenient access to the researcher and presented a viable
opportunity to collect the data.
Chapter 7: Revelatory Case Study 7-6

Exploring the Relationship of Organisational Culture to Enterprise Systems Success
Diversity
The organisation is both geographically diverse, having several regional sites in
addition to the Head Office (where over 400 staff are located). It also has many
Business Units that offer a degree of segregation and functional departmentalism.
These two factors alone offered an opportunity to study cultural and ESS variances
across geographic boundaries and also organisational structure entities. The case
study sought to capture and explore these aspects.
Users
Within the organisation, some of the employees are based in farming, dairy
production/collection and operational aspects of the business, and these employees
have minimal exposure to and use of SAP R/3. However, in the various plants and
Head Office, approximately 200 employees actively use the ES. Users from this
group of 200 were actively targeted for inclusion in the study, provided that they met
the strict study criteria which are discussed below. In total 40 from this cohort were
identified that met the criteria for participation in the study.
Chapter 7: Revelatory Case Study 7-7

Exploring the Relationship of Organisational Culture to Enterprise Systems Success
7.3. Data Collection
Data collected was both qualitative (interviews) and quantitative (paper-based
survey). The same qualitative interview protocols from the consultant study were
followed in order to ensure comparability and consistency of the results. The
interviews obtained met the original protocol requirements.
Internal Consultants drawn from the following organisational settings:
• internal consultants employed within client organisation
• hold middle to senior management position
• experienced at least two innovations
• employed in medium to large business
• have experienced innovations across at least two Business Units
• are in a position to comment on how successful/unsuccessful that IT
innovation is 2-4 years out from ‘go live’
Internal consultants that met the above criteria were included in the study and
invited to participate. The pre-interview instruments, interview questions and
OCAI/ESS data collection process were the same as those used in the pilot and
main consultant interviews. The actual survey document is shown in its entirety in
Appendix 4.6.
Demographics were also collected whilst maintaining the respondent’s anonymity
as per the ethical requirements. Again the survey participants were selected based
on the following criteria:
• have a minimum 4 years experience with the organisation
• are in a position to comment on how successful/unsuccessful that IT
innovation is 2-4 years out from ‘go live’
The surveys were sent to respondents, coupled with a blank return envelope for
return within seven days.
Much effort and thought went into designing and identifying the demographics that
would best allow full exploration of the relationship.
The following table shows the demographic item and the rationale for collection.
Chapter 7: Revelatory Case Study 7-8

Exploring the Relationship of Organisational Culture to Enterprise Systems Success
Demographic Item Rationale
Business Unit
Since Organisational Culture is a group phenomenon, the smallest
organisational structure unit that could be identified in the organisation was the
Business Unit. The data could therefore be analysed against Business Units
within the organisation.
Geographic Location
Captured in order to complete the cultural map of the organisation and enabling
branch/head office variations to be explored
Current Role
The type of role that the respondent fulfilled within Oz Dairy.
1. Strategic/Senior Manager; 2. Middle Manager; 3. Operational Staff; 4. Other
These employment types were the same as used in the original ESS study and
followed the categorisation developed by Anthony (1965). The work of Anthony
(1965) has been utilised in many studies, and particular studies in the IS field
have adopted these or variants of these criteria for survey respondents. The
original employment categories described by Anthony were 1. Strategic; 2.
Management; 3. End User, and 4.Technical staff.
Length of Service To enable variances in experience and culture and ESS based on how long the
employee had been with the organisation to be investigated, in addition
confirming that the participant met the minimum four years experience criteria
IT Innovation Data was collected to identify the exact IT innovation that the respondent was
reporting upon, i.e., all SAP R/3 modules or just a selection of the various
modules (All, MM, SD, PP-PI, PM, FI-CO) in their day to day role
Use Type In addition to which modules were used, data was also collected as to how the
IT innovation was being used.
Use Frequency How often the IT Innovation was being used
Table 7-2. Case study demographics collected
Both qualitative and quantitative data were collected from Oz Dairy. The qualitative
data came from interviews with four internal consultants (drawn from senior
managers and project managers). The qualitative data has been reported in the
previous chapter. The quantitative data came from 40 responses to the survey. This
represented 80% from those meeting the criteria for survey participation. The
researcher spent two working weeks full-time at the organisation. This included:
• notes and observations taken during the time in the organisation
• exposure to company documentation
• observation of groups working together
• informal discussions with the staff
• present in meetings and discussions
Chapter 7: Revelatory Case Study 7-9

Exploring the Relationship of Organisational Culture to Enterprise Systems Success
The major quantitative effort of the PhD study revolved around the case study
organisation. The unit of analysis in this phase of the study was the IT innovation
being investigated; this could represent the entire ES or one of the extensions to
the ES, for example the CRM module. Data was collected from a variety of
business units throughout the organisation that have experienced the innovation.
The surveys themselves were mailed to the participants in a double blind envelope,
i.e., a return envelope was provided for the survey to be returned within the
research package. The return envelope address contained no identifiers that could
lead to identification of the respondent. As an additional safeguard for anonymity
the surveys were to be returned to a central administration point for collection
before they were collected by the researcher. In this way there were no
identification keys that could suggest to the researcher the identity of the survey
respondent. Thus the survey results were totally anonymous.
The next sections describe the results of the data analysis.
Chapter 7: Revelatory Case Study 7-10

Exploring the Relationship of Organisational Culture to Enterprise Systems Success
7.4. Quantitative Data: ESS + OCAI Analysis and Interpretation
The quantitative data was subjected to a variety of statistical analysis techniques in
an effort to explore the relationship and the manner in which the various sub-
constructs were interacting with each other.
7.4.1 Descriptive Statistics
This section discusses the descriptive statistics for the case study. The survey
instruments collected data that included ES use, respondent role, Business Unit
and Geographic Unit, in addition to the OCAI cultural typology data and ES
Success data. The purpose for collecting the additional data per respondent was to
allow a fuller understanding of specific aspects of the OC-ESS relationship. The
histogram below summarises the ES Success results, showing overall frequencies:
1 2 3 4 5 6 70
2
4
6
8
10
12
Freq
uenc
y
ES Success Across All Respondents
StronglyDisagree
Neutral StronglyAgree
Figure 7-2. Oz Dairy ESS results
Chapter 7: Revelatory Case Study 7-11
Exploring the Relationship of Organisational Culture to Enterprise Systems Success
The results indicate that all the survey respondents were neutral or agree that the
ES was successful. Overall, the mean score for ESS across all respondents
showed that 64% rated the ES as being either a 5 or 6 (agree) that the ES was
successful. The mean showed a large cohort as neutral. The bars in the histogram
above report the actual number (frequency) of the respondents that scored the ES
a particular score. The bell curve shows the bias to an interpretation of success.
The peak in the curve is the mode score.
The next elements to be discussed are the demographic profiles of the
respondents, including ES Success measures and the OCAI plots for the categories
of Business Unit, Geographic Unit and Employment Cohort.
7.4.2 ESS Business Unit Results
The five Business Units which participated in the study were ‘Operations’,
‘Shipping’, ‘Finance’, ‘Sales & Marketing’ and ‘IT’. A brief description of each
follows.
Operations: This unit is responsible for overseeing much of the day to day
operational activities of the organisation – plant maintenance, administration,
production and production planning.
Shipping: This is responsible for exports and export documentation, customs and
freight delivery.
Finance: This is responsible for Accounts Payable, Accounts Receivable, Invoicing
and Payroll.
Sales & Marketing: This is responsible for new business generation, branding,
advertising and PR.
IT: This is responsible for IT support, infrastructure services, network maintenance
and data integrity.
The table overleaf summarises the responses and the ESS scores.
Chapter 7: Revelatory Case Study 7-12

Exploring the Relationship of Organisational Culture to Enterprise Systems Success
ESS Individual ESS Item Score
Business Unit % of Total Responses
Overall Score
OI II SQ IQ
Operations 49 5.43 4.83 5.77 5.46 5.65
Finance 22 5.52 5.28 6.18 5.02 5.58
Shipping 11 4.77 4.92 5.58 4.37 5.22
Sales & Marketing 11 3.62 4.50 4.75 3.56 1.67
IT 7 5.66 5.13 5.50 6.0 6.0
Table 7-3. Summary of BU ranked by % responses and ESS scores
The greatest number of responses (49%) was obtained from the Operations
Business Unit. ‘Finance’ contributed the next highest number of respondents at
22%, ‘Shipping’ and ‘Sales & Marketing’ Units both equally contributed 11% and ‘IT’
the smallest contribution at 7%.
The Business Units are ranked by overall ESS score in the table below:
ESS Individual ESS Item Score
Business Unit Overall Score
OI II SQ IQ
IT 5.66 5.13 5.50 6.0 6.0
Finance 5.52 5.28 6.18 5.02 5.58
Operations 5.43 4.83 5.77 5.46 5.65
Shipping 4.77 4.92 5.58 4.37 5.22
Sales & Marketing 3.62 4.50 4.75 3.56 1.67
Table 7-4. Business Unit ranked by overall ESS score
The Business Unit that was most satisfied and reported the highest level of ESS
was the IT Business Unit with a score of 5.66. This was followed by ‘Finance’ at
5.52, ‘Operations’ at 5.43, ‘Shipping’ at 4.77 and the lowest ESS score was
reported by ‘Sales & Marketing’ at 3.62.
There is clearly a wide variance in the level of success reported by the different
Business Units within the organisation.
Each Business Unit also reported significant variations in ES Success across the
individual ESS sub-constructs.
Chapter 7: Revelatory Case Study 7-13

Exploring the Relationship of Organisational Culture to Enterprise Systems Success
The following tables show the findings per individual item scores.
Individual ESS Item Score
Business Unit OI
Finance 5.28
IT 5.13
Shipping 4.92
Operations 4.83
Sales & Marketing 4.50
Table 7-5. Business Units ranked by OI scores
Finance BU reported the greatest satisfaction with the OI item of the ESS measure,
with a score of 5.28. Next was ‘IT’ with 5.13, ‘Shipping’ 4.92, ‘Operations’ at 4.83
and finally ‘Sales & Marketing’ reported the lowest with 4.50.
Individual ESS Item Score
Business Unit II
Finance 6.18
Operations 5.77
Shipping 5.58
IT 5.50
Sales & Marketing 4.75
Table 7-6. Business Units ranked by II scores
‘Finance’ also reported the highest score for Individual Impact (II) with 6.18.
‘Operations’ followed second with 5.77, ‘Shipping’ 5.58, ‘IT’ 5.50 and again Sales &
Marketing Business Unit with a score of 4.75 ranked lastly.
The table below shows the Business Units ranked by System Quality (SQ) results:
Individual ESS Item Score
Business Unit SQ
IT 6.0
Operations 5.46
Finance 5.02
Shipping 4.37
Sales & Marketing 3.56
Table 7-7. Business Units ranked by SQ scores
Chapter 7: Revelatory Case Study 7-14

Exploring the Relationship of Organisational Culture to Enterprise Systems Success
‘IT’ reported the highest satisfaction levels with an SQ score of 6.0, ‘Operations’
was ranked second with 5.46, ‘Finance’ third with a score of 5.02, ‘Shipping’ 4.37
and lastly ‘Sales & Marketing’ with a score of 3.56.
The final ES individual item to be reported is Information Quality (IQ), and the table
below reports on the IQ scores by Business Unit:
Individual ESS Item Score
Business Unit IQ
IT 6.0
Finance 5.58
Operations 5.65
Shipping 5.22
Sales & Marketing 1.67
Table 7-8. Business Unit ranked by IQ scores
‘IT’ reported the highest levels of ESS for the IQ item with a score of 6.0. The next
highest was ‘Finance’ with 5.58, third was ‘Operations’ with 5.65. ‘Shipping’ ranked
fourth with 5.22 and by far the lowest score was ‘Sales & Marketing’ with 1.67.
The individual results for each of the Business Units are now discussed in detail.
Operations Business Unit Results (49% of total responses)
The Operations BU reported a relatively high level of ES success overall with a
score of 5.43. Employees here indicated that they were mostly satisfied with the
ES. The table below shows all the scores for the Operations BU.
ES Success by Business Unit
ESS Individual Item Score
Business Unit
Overall Score OI II SQ IQ
Operations 5.43 4.83 5.77 5.46 5.65
Ranking
3rd 4th 2nd 2nd 1st
Table 7-9. Operations BU all results
Chapter 7: Revelatory Case Study 7-15

Exploring the Relationship of Organisational Culture to Enterprise Systems Success
When the individual item scores are reviewed for the Operations BU we see that all
the results are relatively high. The highest single score was 5.77 for ‘Individual
Impact’ whilst the lowest score, 4.83 for OI, is still above neutral for level of ES
Success reported. When the results are viewed in comparison to the other business
units we also see that except for OI, this Business Unit was ranked either first or
second for the all individual items.
The next Business Unit to be examined is the Shipping BU.
Shipping Business Unit Results (11% of total responses)
The Shipping Business Unit reported the second lowest ES overall success score
of all Business Units. Employees in this BU are most satisfied with ‘Information
Quality’ (5.22) and least satisfied with ‘System Quality’ (4.37). However, all the
scores, when compared against the other Business Units, were either second or
third lowest. Indeed, the only item that users in this BU ranked above neutral was
IQ.
ES Success by Business Unit
ESS Individual Item Score
Business Unit
Overall Score OI II SQ IQ
Shipping &
Export
4.77 4.92 4.58 4.37 5.22
Ranking
4th 3rd 3rd 4th 4th
Table 7-10. Shipping Unit results
Finance Business Unit Results (22% of total responses)
After ‘IT’, ‘Finance’ reported the second highest score for overall ES Success and
the highest positive score for ‘Individual Impact’. Employees in this Business Unit
indicated very high levels of satisfaction with the ES, and, in particular, thought the
individual impact of the ES had been very positive. ‘Finance’ also reported the
highest ‘Information Quality’ score for all the BU’s. ‘Finance’ thought the impact of
the ES upon themselves personally was very positively high, and in particular they
were highly satisfied with the ‘Information Quality’.
Chapter 7: Revelatory Case Study 7-16

Exploring the Relationship of Organisational Culture to Enterprise Systems Success
ES Success by Business Unit
ESS Individual Item Score
Business Unit Overall Score OI II SQ IQ
Finance 5.52 5.28 6.18 5.02 5.58
Ranking 2nd 1st 1st 3rd 2nd
Table 7-11. Finance Unit all results
Sales & Marketing Business Unit Results (11% of the total responses)
The Sales & Marketing Business Unit reported the lowest overall level of ES
success for all the Business Units.
In particular the ‘Information Quality’ (IQ) and ‘System Quality’ (SQ) constructs were
very low and the lowest scores for all the Business Units. Overall the ES Success
level was low and highly negative.
ES Success by Business Unit
ESS Individual Item Score
Business Unit Overall Score OI II SQ IQ
Sales &
Marketing
3.62 4.50 4.75 3.56 1.67
Ranking 5th 5th 5th 5th 5th
Table 7-12. Sales & Marketing Unit all results
IT Business Unit Results (7% of total responses)
Perhaps also not surprisingly, ‘IT’ reported the highest overall ES Success score for
all the Business Units and was very satisfied across all four of the Individual items.
In particular, IT rated the System Quality (6.0) and Information Quality (6.0)
constructs the highest for all Business Units.
ES Success by Business Unit
ESS Individual Item Score
Business Unit Overall Score OI II SQ IQ
IT 5.66 5.13 5.50 6.0 6.0
Ranking
1st 2nd 4th 1st 1st
Table 7-13. IT Unit all results
Chapter 7: Revelatory Case Study 7-17

Exploring the Relationship of Organisational Culture to Enterprise Systems Success
Chapter 7: Revelatory Case Study 7-18
There were some clear trends emerging in the data when viewed through Business
Unit. ‘Operations’ was highest in IQ, ‘Sales & Marketing’ was the lowest in all items
whilst ‘Finance’ was highest in OI and II.
The next section discusses the ESS results across the Geographic Units of the
organisation.
7.4.3 ESS Geographic Unit Results
The figure below shows response rates for the survey by Geographic Unit. The
organisation operates from several plants (K1, M1, R1, L1 and C1) in addition to a
central Head Office (H1).
The majority of the survey responses were taken from Head Office (40%), with the
next largest cohort coming from the C1 plant (26%).
All Geographic Units indicated a positive ES Success experience with small
variance across each unit from the mean. The summary results for the ESS data is
shown in the table below:
ES Success by Geographic Unit
ESS Individual Item Score
Geographic Unit Overall OI II SQ IQ
M1 5.48 5.63 6.00 4.78 5.50
R1 5.47 5.06 5.75 5.38 5.66
L1 5.54 5.38 5.81 5.19 5.80
C1 4.94 4.81 5.25 4.80 4.88
H1 4.94 4.66 5.40 4.94 4.63
Figure 7-14. ES Success by Geographic Unit
Survey Response by Geographic Unit
4% 4% 7%
19%
26%
40%
K1
M1 R1 L1
C1 H1
Figure 7-3. Survey response by geographic unit
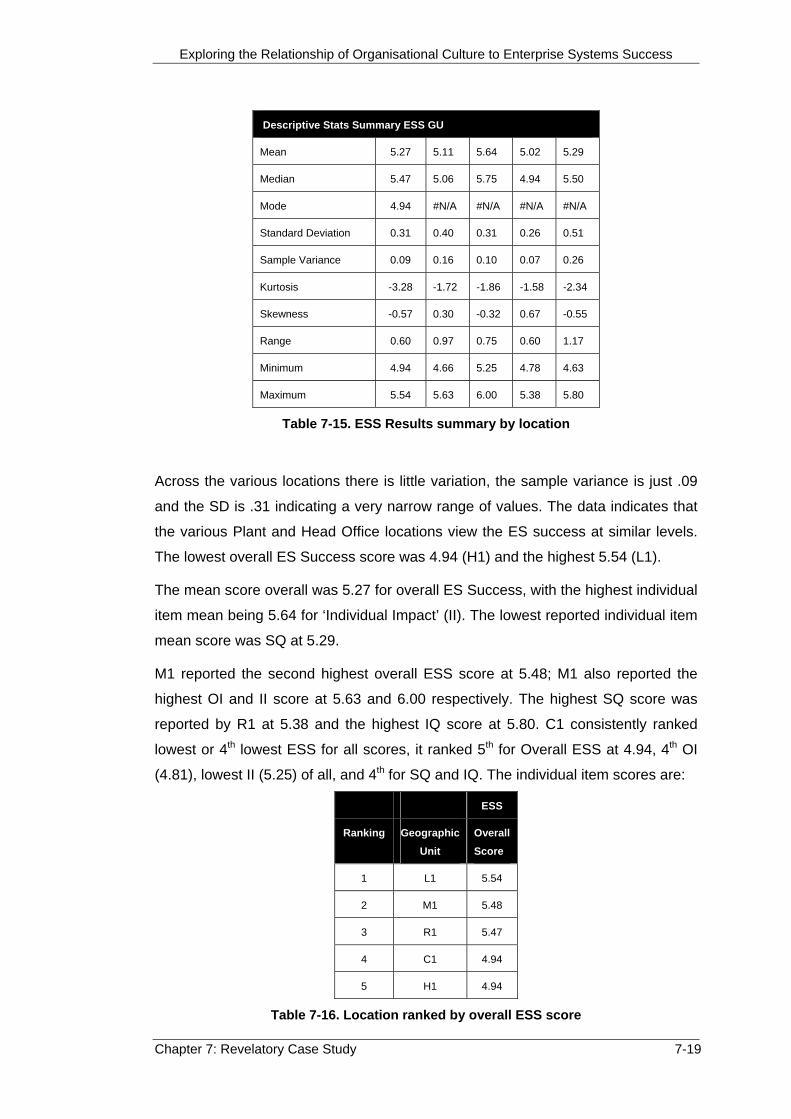
Exploring the Relationship of Organisational Culture to Enterprise Systems Success
Descriptive Stats Summary ESS GU
Mean 5.27 5.11 5.64 5.02 5.29
Median 5.47 5.06 5.75 4.94 5.50
Mode 4.94 #N/A #N/A #N/A #N/A
Standard Deviation 0.31 0.40 0.31 0.26 0.51
Sample Variance 0.09 0.16 0.10 0.07 0.26
Kurtosis -3.28 -1.72 -1.86 -1.58 -2.34
Skewness -0.57 0.30 -0.32 0.67 -0.55
Range 0.60 0.97 0.75 0.60 1.17
Minimum 4.94 4.66 5.25 4.78 4.63
Maximum 5.54 5.63 6.00 5.38 5.80
Table 7-15. ESS Results summary by location
Across the various locations there is little variation, the sample variance is just .09
and the SD is .31 indicating a very narrow range of values. The data indicates that
the various Plant and Head Office locations view the ES success at similar levels.
The lowest overall ES Success score was 4.94 (H1) and the highest 5.54 (L1).
The mean score overall was 5.27 for overall ES Success, with the highest individual
item mean being 5.64 for ‘Individual Impact’ (II). The lowest reported individual item
mean score was SQ at 5.29.
M1 reported the second highest overall ESS score at 5.48; M1 also reported the
highest OI and II score at 5.63 and 6.00 respectively. The highest SQ score was
reported by R1 at 5.38 and the highest IQ score at 5.80. C1 consistently ranked
lowest or 4th lowest ESS for all scores, it ranked 5th for Overall ESS at 4.94, 4th OI
(4.81), lowest II (5.25) of all, and 4th for SQ and IQ. The individual item scores are:
ESS
Ranking Geographic Unit
Overall Score
1 L1 5.54
2 M1 5.48
3 R1 5.47
4 C1 4.94
5 H1 4.94
Table 7-16. Location ranked by overall ESS score
Chapter 7: Revelatory Case Study 7-19
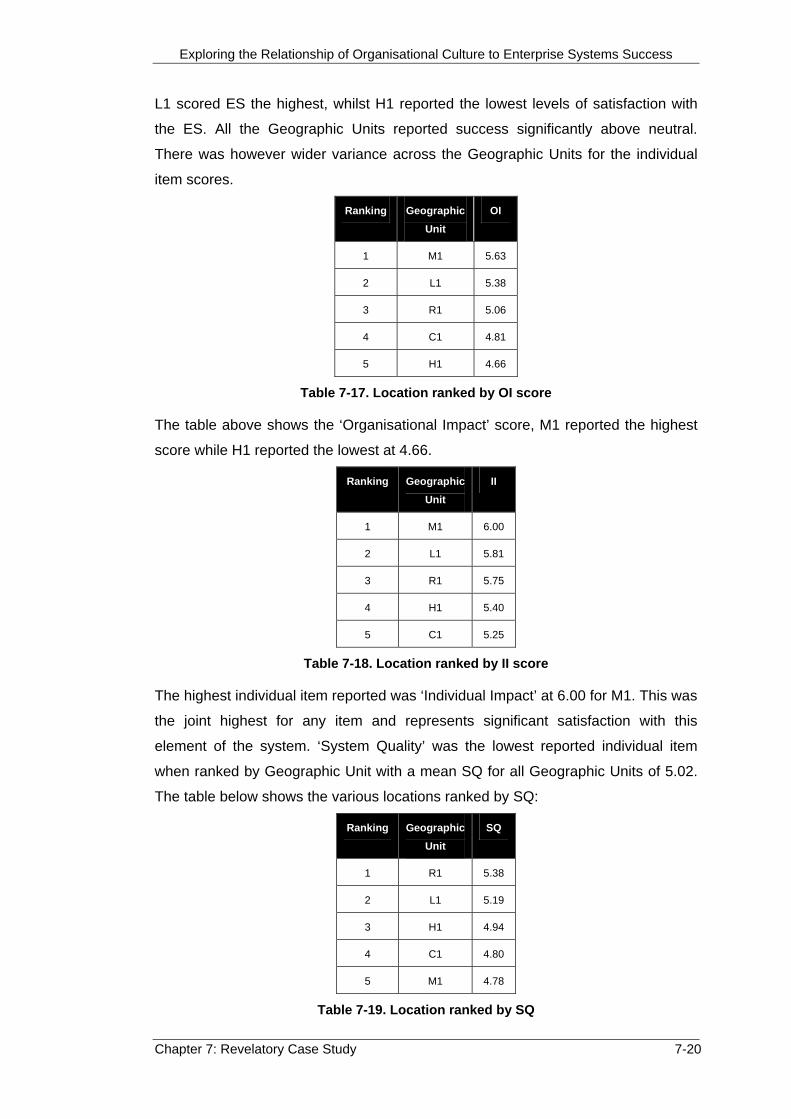
Exploring the Relationship of Organisational Culture to Enterprise Systems Success
L1 scored ES the highest, whilst H1 reported the lowest levels of satisfaction with
the ES. All the Geographic Units reported success significantly above neutral.
There was however wider variance across the Geographic Units for the individual
item scores.
Ranking Geographic Unit
OI
1 M1 5.63
2 L1 5.38
3 R1 5.06
4 C1 4.81
5 H1 4.66
Table 7-17. Location ranked by OI score
The table above shows the ‘Organisational Impact’ score, M1 reported the highest
score while H1 reported the lowest at 4.66.
Ranking Geographic Unit
II
1 M1 6.00
2 L1 5.81
3 R1 5.75
4 H1 5.40
5 C1 5.25
Table 7-18. Location ranked by II score
The highest individual item reported was ‘Individual Impact’ at 6.00 for M1. This was
the joint highest for any item and represents significant satisfaction with this
element of the system. ‘System Quality’ was the lowest reported individual item
when ranked by Geographic Unit with a mean SQ for all Geographic Units of 5.02.
The table below shows the various locations ranked by SQ:
Ranking Geographic Unit
SQ
1 R1 5.38
2 L1 5.19
3 H1 4.94
4 C1 4.80
5 M1 4.78
Table 7-19. Location ranked by SQ
Chapter 7: Revelatory Case Study 7-20

Exploring the Relationship of Organisational Culture to Enterprise Systems Success
The final individual item score was ‘Information Quality’ (IQ). The scores are shown
below:
Ranking Geographic Unit
IQ
1 L1 5.80
2 R1 5.66
3 M1 5.50
4 C1 4.88
5 H1 4.63
Table 7-20. Location ranked by IQ
The reported range for IQ was large at 5.80 (maximum) and 4.63 (minimum).
There were some clear trends emerging in the data when viewed through
Geographic Unit. The locations that consistently ranked lowest across the overall
score and the individual item scores were H1 (Head Office) and plant C1. In all but
one category (SQ) either one of these locations reported the lowest score. Whilst
L1 consistently reported the highest score or second highest score across all the
items. The next section looks at the ESS scores by employment cohort.
7.4.4 ESS by Employment Cohort
The demographic data also identified the role and employment cohort (Anthony,
1965) that the respondent undertook within their BU. The majority of the
respondents were categorised as middle managers (45%), the second most
prevalent category was operational staff (44%), with the fewest number of
respondents taken from the senior management category. The ratios are a
reflection of the typical pyramid hierarchy present in most organisations. Even
though the respondents were invited to the study based on selection criteria, i.e.,
not randomly selected and not based on managerial level. Due to the normal
hierarchy structure there were fewer senior managers than operational staff who
fitted the selection criteria.
Chapter 7: Revelatory Case Study 7-21
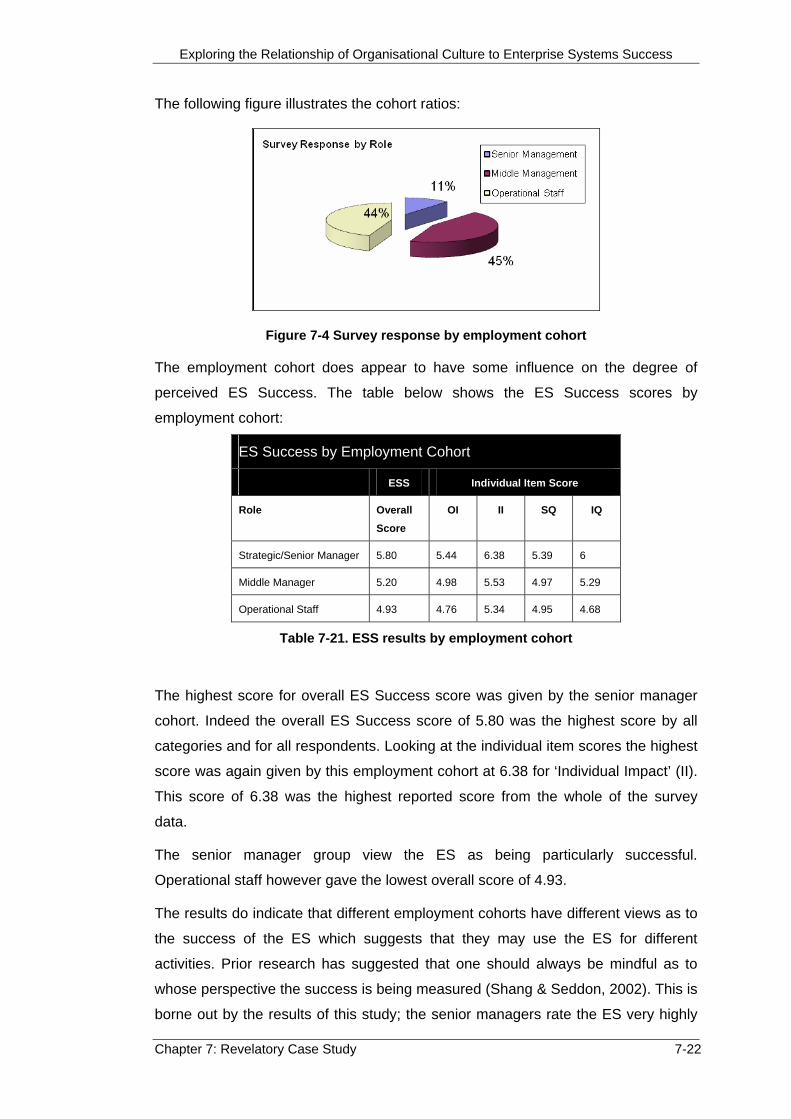
Exploring the Relationship of Organisational Culture to Enterprise Systems Success
The following figure illustrates the cohort ratios:
Figure 7-4 Survey response by employment cohort
The employment cohort does appear to have some influence on the degree of
perceived ES Success. The table below shows the ES Success scores by
employment cohort:
ES Success by Employment Cohort
ESS Individual Item Score
Role Overall Score
OI II SQ IQ
Strategic/Senior Manager 5.80 5.44 6.38 5.39 6
Middle Manager 5.20 4.98 5.53 4.97 5.29
Operational Staff 4.93 4.76 5.34 4.95 4.68
Table 7-21. ESS results by employment cohort
The highest score for overall ES Success score was given by the senior manager
cohort. Indeed the overall ES Success score of 5.80 was the highest score by all
categories and for all respondents. Looking at the individual item scores the highest
score was again given by this employment cohort at 6.38 for ‘Individual Impact’ (II).
This score of 6.38 was the highest reported score from the whole of the survey
data.
The senior manager group view the ES as being particularly successful.
Operational staff however gave the lowest overall score of 4.93.
The results do indicate that different employment cohorts have different views as to
the success of the ES which suggests that they may use the ES for different
activities. Prior research has suggested that one should always be mindful as to
whose perspective the success is being measured (Shang & Seddon, 2002). This is
borne out by the results of this study; the senior managers rate the ES very highly
Chapter 7: Revelatory Case Study 7-22
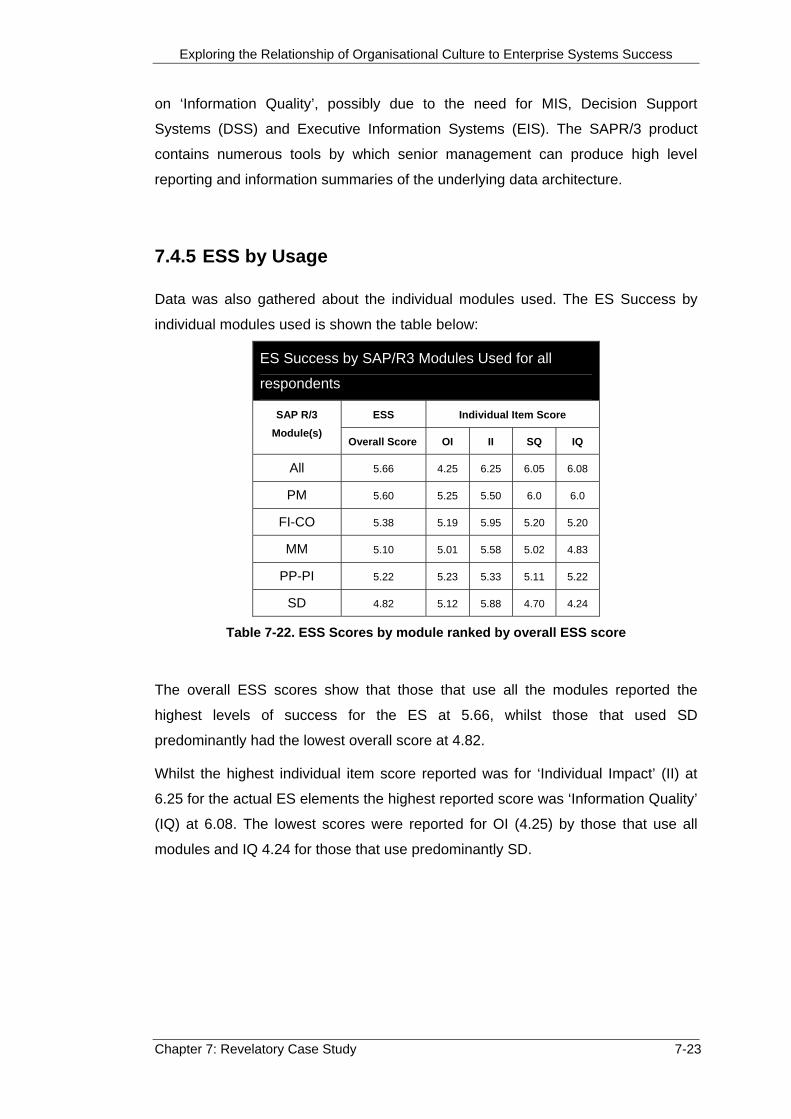
Exploring the Relationship of Organisational Culture to Enterprise Systems Success
on ‘Information Quality’, possibly due to the need for MIS, Decision Support
Systems (DSS) and Executive Information Systems (EIS). The SAPR/3 product
contains numerous tools by which senior management can produce high level
reporting and information summaries of the underlying data architecture.
7.4.5 ESS by Usage
Data was also gathered about the individual modules used. The ES Success by
individual modules used is shown the table below:
ES Success by SAP/R3 Modules Used for all
respondents
ESS Individual Item Score SAP R/3 Module(s)
Overall Score OI II SQ IQ
All 5.66 4.25 6.25 6.05 6.08
PM 5.60 5.25 5.50 6.0 6.0
FI-CO 5.38 5.19 5.95 5.20 5.20
MM 5.10 5.01 5.58 5.02 4.83
PP-PI 5.22 5.23 5.33 5.11 5.22
SD 4.82 5.12 5.88 4.70 4.24
Table 7-22. ESS Scores by module ranked by overall ESS score
The overall ESS scores show that those that use all the modules reported the
highest levels of success for the ES at 5.66, whilst those that used SD
predominantly had the lowest overall score at 4.82.
Whilst the highest individual item score reported was for ‘Individual Impact’ (II) at
6.25 for the actual ES elements the highest reported score was ‘Information Quality’
(IQ) at 6.08. The lowest scores were reported for OI (4.25) by those that use all
modules and IQ 4.24 for those that use predominantly SD.
Chapter 7: Revelatory Case Study 7-23

Exploring the Relationship of Organisational Culture to Enterprise Systems Success
7.4.6 OCAI Business Unit Results
The survey data collected from the participants also included the OCAI survey
instrument. This section presents the OCAI results firstly by Business Unit and then
by Geographic Unit.
Operations Business Unit OCAI Results
The culture of the Operations BU, as reported via the OCAI, is shown in the plot
below. The BU has strong elements of clan and hierarchy culture types. Employees
in this BU are internally focussed, valuing high levels of structure, policy and
procedure and control. They are concerned with team work and value strong
leaders.
Figure 7-5. OCAI Operations Business Unit
Shipping Business Unit OCAI Results
The culture profile for the BU indicates that similar to the Operations BU,
employees are strongly oriented towards dimensions of ‘Hierarchy and Clan’, yet
the strength of these dimensions is much higher and more extreme than the
Operations BU. Employees in this BU value very highly control, policies, procedures
and team work.
The OCAI radar plot for the Business Unit is shown overleaf.
Chapter 7: Revelatory Case Study 7-24
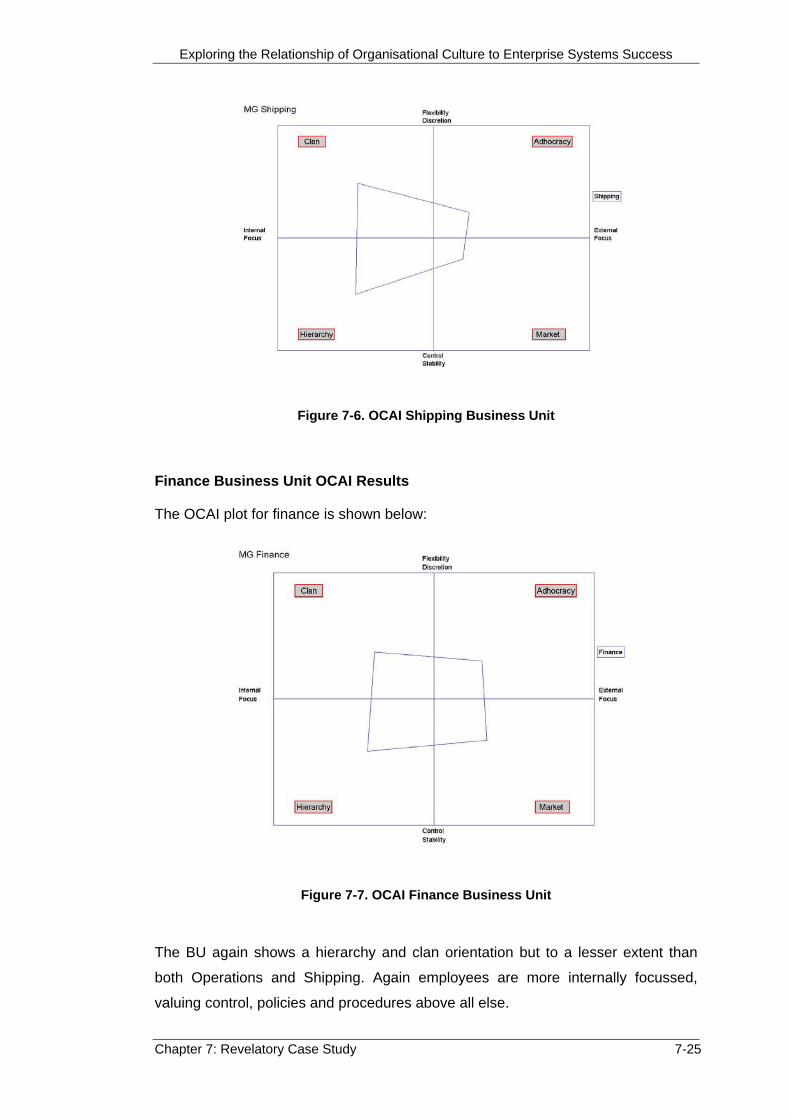
Exploring the Relationship of Organisational Culture to Enterprise Systems Success
Figure 7-6. OCAI Shipping Business Unit
Finance Business Unit OCAI Results
The OCAI plot for finance is shown below:
Figure 7-7. OCAI Finance Business Unit
The BU again shows a hierarchy and clan orientation but to a lesser extent than
both Operations and Shipping. Again employees are more internally focussed,
valuing control, policies and procedures above all else.
Chapter 7: Revelatory Case Study 7-25

Exploring the Relationship of Organisational Culture to Enterprise Systems Success
Sales & Marketing Business Unit OCAI Results
Perhaps not surprisingly the OCAI profile for this Business Unit indicates a very
strong external focus orientation, with the BU displaying the typically sales oriented
culture profile. Employees are competitive, customer centric and highly goal
oriented. They value results and winning above all else. The Sales & Marketing BU
in addition to reporting the highest Market score also reported the lowest clan and
hierarchy scores of all the BU’s.
Figure 7-8. OCAI Sales Business Unit
IT Business Unit OCAI Results
Interestingly ‘IT’, the BU which reported the highest ES Success score, had a
directly opposite culture profile to the Sales & Marketing BU, i.e., the BU that
reported the lowest ES success score. The OCAI plot for IT BU shows a very
strongly clan oriented culture, that is internally focussed, values team work and the
development of others.
Chapter 7: Revelatory Case Study 7-26

Exploring the Relationship of Organisational Culture to Enterprise Systems Success
Figure 7-9. OCAI IT Business Unit
In summary the results of the OCAI data by Business Unit show that the most
hierarchy oriented type is the Shipping Business Unit, followed by Finance
Business Unit. The most Clan oriented Business Unit is the IT department, the most
Market oriented unit is the Sales and Marketing Business Unit. In terms of the least
oriented the lowest Market score is for the Shipping Business Unit, the lowest Clan
is for the Sales and Marketing Business Unit and the lowest Hierarchy is for the IT
Business Unit.
7.4.7 OCAI Geographic Unit Results
The OCAI radar plots for the Geographic Units (GU’s) present a similar picture as
the ES Success scores, i.e., little variances across the individual GU’s, the
individual plots per location are shown in Appendix 7.2. However, the mean HO plot
is shown below:
Figure 7-10. OCAI Head Office
Chapter 7: Revelatory Case Study 7-27

Exploring the Relationship of Organisational Culture to Enterprise Systems Success
The culture profile for the GU’s confirms the findings of the culture plots across the
BU’s, i.e., the culture is predominantly a clan and hierarchy profile. The GU’s
themselves value team work, are internally focussed and are reliant upon policy,
procedures and administration control frameworks. The culture profile across the
organisation throughout the state is uniform geographically, but as previously
shown, has significant variance based on the Business Unit and functional
department that employees are assigned to.
7.4.8 Interpretive Statistics
The sample size was relatively small at N=27. However, there are statistical
methods that may be used to explore the OC-ESS relationship with this sample
size. Whilst not wishing to draw categorical conclusions based purely on the
statistical results the analysis can be used, in conjunction with the qualitative data
to help describe the relationship further. However, even with the limitations of small
sample size the results do indicate certain trends, offer intriguing insights and do
suggest directions for further research.
An initial correlation analysis was used to examine the relationship between ES
Success (overall and individual item level) and the OCAI types (C, A, M, H). A
Pearson product moment correlation coefficient is used to describe the relationship
between two variables (Coakes, 2005). This technique was used to test the
strength and direction of the correlation between the culture types in the OCAI. The
table overleaf shows the results of the analysis, those cells highlighted in yellow
indicate that the results were statistically significant.
Chapter 7: Revelatory Case Study 7-28

Exploring the Relationship of Organisational Culture to Enterprise Systems Success
ES Success Overall score and OCAI types
ESS Clan Adhocracy Market Hierarchy ESS overall Pearson
Correlation 1 .385 .208 -.493(*) .061
Sig. (2-tailed) .104 .393 .032 .804 N 21 19 19 19 19Clan Pearson
Correlation .385 1 -.059 -.767(**) -.309
Sig. (2-tailed) .104 .783 .000 .142 N 19 24 24 24 24Adhocracy Pearson
Correlation .208 -.059 1 .024 -.515(**)
Sig. (2-tailed) .393 .783 .910 .010 N 19 24 24 24 24Market Pearson
Correlation -.493(*) -.767(**) .024 1 -.253
Sig. (2-tailed) .032 .000 .910 .232 N 19 24 24 24 24Hierarchy Pearson
Correlation .061 -.309 -.515(**) -.253 1
Sig. (2-tailed) .804 .142 .010 .232 N 19 24 24 24 24
Table 7-23. Correlation/linear regressions of the OCAI culture types * Correlation is significant at the 0.05 level (2-tailed). ** Correlation is significant at the 0.01 level (2-tailed).
The results show that at p <.05 ‘Market’ is negatively correlated (-.493) to overall
ES Success, i.e., the market cultures experienced the lowest levels of ES Success.
In addition, ‘Clan’ is very strongly negatively correlated to ‘Market’. This suggests
that in this organisation ‘Clan’ is unlikely to occur in conjunction with the market
culture.
The clan culture is also strongly positively correlated (.385) to ES Success.
‘Adhocracy’ is also negatively correlated to ‘Hierarchy’ suggesting that these two
culture types are unlikely to occur together.
At the individual item level the results provide further insights into the relationship.
The tables overleaf show the individual ESS items correlated against the OCAI
culture types.
Chapter 7: Revelatory Case Study 7-29

Exploring the Relationship of Organisational Culture to Enterprise Systems Success
Individual Impact II Clan Adhocracy Market Hierarchy Pearson Correlation 1 .068 .216 -.108 -.068
Sig. (2-tailed) .762 .335 .633 .762
II
N 25 22 22 22 22
Organisational Impact OI Clan Adhocracy Market Hierarchy Pearson Correlation 1 -.108 .238 -.089 .089
Sig. (2-tailed) .643 .298 .701 .700
OI
N 24 21 21 21 21
Information Quality IQ Clan Adhocracy Market Hierarchy Pearson Correlation 1 .328 .035 -.619(**) .304
Sig. (2-tailed) .127 .876 .002 .159
IQ
N 26 23 23 23 23** Correlation is significant at the 0.01 level (2-tailed).
System Quality SQ Clan Adhocracy Market Hierarchy Pearson Correlation 1 .345 .104 -.382 -.019
Sig. (2-tailed) .126 .654 .087 .935
SQ
N 23 21 21 21 21
Table 7-24. OCAI types by ESS item
The strongest correlation is shown between ‘Information Quality’ and ‘Market’
(-.619). The negative correlation suggests that within the market culture type the
item that is most influencing ES Success is the Information Quality construct.
Chapter 7: Revelatory Case Study 7-30

Exploring the Relationship of Organisational Culture to Enterprise Systems Success
7.5. Case Study Review & Summary
In summary, the case study formed an important part of the study because OZ
Dairy, a live organisation, met the key criteria of
1. 2 years post ‘go live’
2. deployment of multiple modules
3. use of the system across the business units
4. geographically diverse
5. Australian-based
6. being able to both qualitatively and quantitatively explore the relationship of
culture to perceptions of ESS
Summary of the Main Findings
The summary findings from the revelatory case study were as follows:
1. Different Business Units could clearly be seen to be reporting differing levels
of success for the ES. IT Business Unit experienced highest level of
success, whilst ‘Sales & Marketing’ reported the lowest overall score. We
could therefore see large variations in the range of success reported.
2. The individual item scores of OI, II, SQ, IQ also reported different scores for
each Business Unit. The largest single variance was between ‘IT’ and ‘Sales
& Marketing’ on the IQ construct. ‘IT’ reported 6.0 whilst ‘Sales & Marketing’
1.67. There was therefore large variation reported in the organisation across
individual item scores.
3. There was also wide variance in the degree of ES Success when viewed by
Geographic Unit. Significantly, ‘Head Office’ reported lowest or second
lowest level of success across all ESS item scores.
4. When the organisation was viewed through employment cohort, the role that
reported the greatest degree of success for the ES was strategic/senior
managers whilst operational staff reported the lowest. Ironically, the
operational cohort formed the largest proportion of users.
Chapter 7: Revelatory Case Study 7-31

Exploring the Relationship of Organisational Culture to Enterprise Systems Success
Chapter 7: Revelatory Case Study 7-32
5. The OCAI results show that the different Business Units reported different
culture types. This confirms the literature findings that organisations have
sub-cultures present within the one entity.
6. The Sales & Marketing BU which reported the lowest ESS score was
strongly market oriented in its culture profile. The IT BU, which had the
highest ESS score, was very strongly clan culture oriented. Combining the
ESS and OCAI results indicates that we do see evidence of different culture
types experiencing differing levels of success with the one organisation.
7. The statistical analysis of the data indicated that market culture type is
negatively correlated to overall ES Success. In addition, market culture type
(the culture of the lowest ranking Business Unit by ES Success) was also
negatively correlated to clan type (the culture of the highest ranking
Business Unit). This indicates that ‘Market’ is unlikely to experience high
levels of ES Success whilst ‘Clan’ is likely to be associated with high levels
of ES Success, and also that the two types, ‘Market’ and ‘Clan’, are unlikely
to occur together in this organisation.
8. ‘Market’ was also negatively correlated to the Information Quality (IQ)
individual item score. This suggests that IQ in market types is the individual
item that is most responsible for the low level of ESS reported.
9. ‘Hierarchy’ was negatively correlated to ‘Adhocracy’, meaning that
‘Hierarchy’ is unlikely to occur with ‘Adhocracy’.
The results from the revelatory case study were very enlightening on the OC-ESS
relationship; clear patterns could be seen to be emerging and the nature of the
relationship was beginning to be discerned.
The next chapter, the Cross-Case Analysis, combines the results from the pilot,
main consultant study and the revelatory case study.

Exploring the Relationship of Organisational Culture to Enterprise Systems Success
Chapter 8
Cross-Case Analysis
Chapter 8: Cross-Case Analysis 8-1

Exploring the Relationship of Organisational Culture to Enterprise Systems Success
Table of Contents – Chapter 8 Cross-Case Analysis
8. Cross-Case Analysis .......................................................................................8-4
8.1. The Relationship of the Clan Culture to Successful ES ............................8-4
8.2. Market Culture Very Strong in Least Successful ES...............................8-10
8.3. OCAI Clan and OCAI Market Negatively Correlated...............................8-14
8.4. Hierarchy Strong in Both Successful & Least Successful ES .................8-16
8.5. The Ideal Culture.....................................................................................8-21
8.6. Cross-Case Analysis Summary Findings................................................8-24
Figures Figure 8-1. Mean OCAI all Consultant categories showing clan most
successful.............................................................................................8-5
Figure 8-2. Most Successful BU from the revelatory case study –
‘extremely clan’.....................................................................................8-6
Figure 8-3. Internal change consultants report the most successful BU as
‘strongly clan’........................................................................................8-6
Figure 8-4. Vendor consultants report the most successful BU
as ‘strongly clan’ ...................................................................................8-7
Figure 8-5. Market strong in least successful ES .................................................8-10
Figure 8-6. OCAI plot for the BU that reported the lowest scores for
ES Success ........................................................................................8-11
Figure 8-7. Clan and market relationship ...............................................................8-1
Figure 8-8. Hierarchy strong in both successful and least successful ES ............8-16
Figure 8-9. Implementation consultants found hierarchy strong in both
successful and least successful ES....................................................8-17
Chapter 8: Cross-Case Analysis 8-2

Exploring the Relationship of Organisational Culture to Enterprise Systems Success
Tables Table 8-1. Evidence summary for clan as most successful culture type ................8-8
Table 8-2. Clan significantly correlated to ES Success ..........................................8-8
Table 8-3. Market culture negatively correlated ...................................................8-11
Table 8-4. Overall ESS score and IQ scores the lowest ......................................8-12
Table 8-5. Market negatively correlated to IQ ......................................................8-12
Table 8-6. Summary of the range of evidence supporting the market as least
successful ES culture ..........................................................................8-14
Table 8-7. Clan and market negatively correlated................................................8-15
Table 8-8. Hierarchy score in successful ES........................................................8-17
Table 8-9. Hierarchy score in least successful ES ...............................................8-18
Table 8-10. Hierarchy selective coding ................................................................8-19
Table 8-11. Components of the ideal culture as reported by the consultants ......8-21
Table 8-12. Summary of ideal culture items when selectively coded against the
OCAI sub-constructs .........................................................................8-22
Chapter 8: Cross-Case Analysis 8-3

Exploring the Relationship of Organisational Culture to Enterprise Systems Success
8. Cross-Case Analysis
The previous chapters have reported on the findings from the three main phases of
the research. In particular, chapter 5 discussed the findings of the pilot study.
Chapter 6 reported the consultants’ experiences of the OC-ESS relationship and
found that the same manifestations were being reported by consultants across a
range of organisational settings. Chapter 7 reported on the results from the
revelatory case study and found that different culture types were experiencing
differing levels of Enterprise System Success.
The purpose of this chapter is to bring the three sets of data together in order to
distil the core workings of the OC-ESS relationship, thus forming a cross-case
analysis.
The results from the previous phases have indicated that the nature of the OC-ESS
relationship is complex but we do see patterns emerging. Whilst each of the phases
has identified unique elements they have also simultaneously confirmed many of
each others findings, albeit by different methods.
The multi method approach has proven robust in its design and provided different
views of the OC-ESS relationship. This has been a key strength of the study. This
chapter seeks to triangulate the results and show the evidence for the combined
conclusions.
Each of the major findings shall now be taken in turn. This will be presented by
examining the culture type associated with successful use of the Enterprise
System; this is the clan culture.
8.1. The Relationship of the Clan Culture to Successful ES
Each of the studies showed that the clan culture was associated with reporting most
success with Enterprise Systems.
The ‘Clan Culture’ is typified by:
‘a friendly place to work where people share a lot of themselves. It is like an
extended family. Leaders are thought of as mentors, even as parent figures.
The organisation is held together by loyalty and tradition. Commitment is
high. The organisation emphasises the long term benefit of individual
Chapter 8: Cross-Case Analysis 8-4
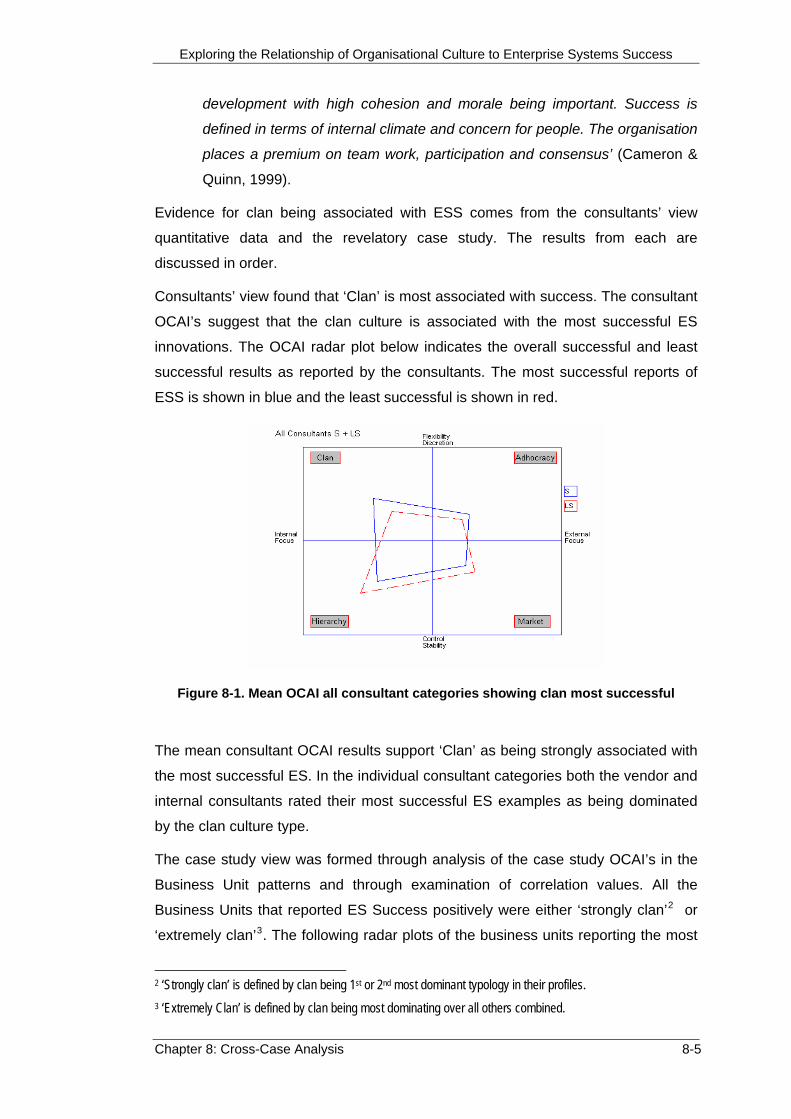
Exploring the Relationship of Organisational Culture to Enterprise Systems Success
Chapter 8: Cross-Case Analysis 8-5
development with high cohesion and morale being important. Success is
defined in terms of internal climate and concern for people. The organisation
places a premium on team work, participation and consensus’ (Cameron &
Quinn, 1999).
Evidence for clan being associated with ESS comes from the consultants’ view
quantitative data and the revelatory case study. The results from each are
discussed in order.
Consultants’ view found that ‘Clan’ is most associated with success. The consultant
OCAI’s suggest that the clan culture is associated with the most successful ES
innovations. The OCAI radar plot below indicates the overall successful and least
successful results as reported by the consultants. The most successful reports of
ESS is shown in blue and the least successful is shown in red.
Figure 8-1. Mean OCAI all consultant categories showing clan most successful
The mean consultant OCAI results support ‘Clan’ as being strongly associated with
the most successful ES. In the individual consultant categories both the vendor and
internal consultants rated their most successful ES examples as being dominated
by the clan culture type.
The case study view was formed through analysis of the case study OCAI’s in the
Business Unit patterns and through examination of correlation values. All the
Business Units that reported ES Success positively were either ‘strongly clan’2 or
‘extremely clan’3. The following radar plots of the business units reporting the most
2 ‘Strongly clan’ is defined by clan being 1st or 2nd most dominant typology in their profiles. 3 ‘Extremely Clan’ is defined by clan being most dominating over all others combined.
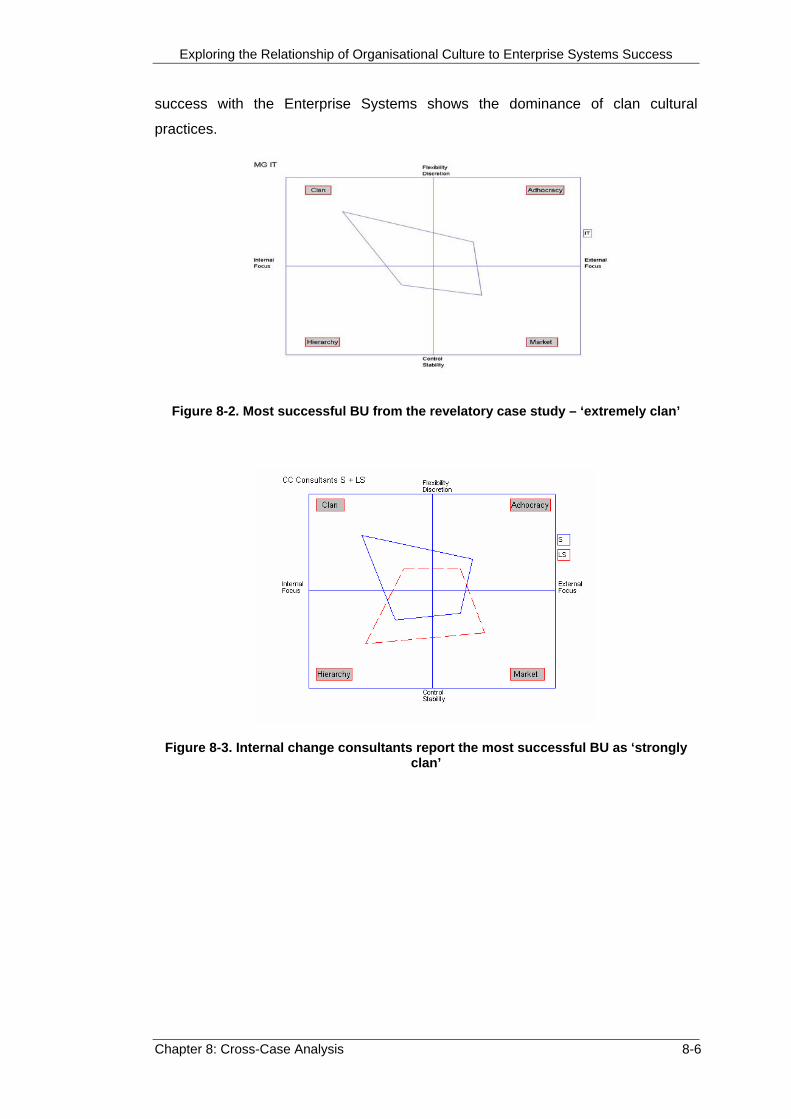
Exploring the Relationship of Organisational Culture to Enterprise Systems Success
success with the Enterprise Systems shows the dominance of clan cultural
practices.
Figure 8-2. Most successful BU from the revelatory case study – ‘extremely clan’
Figure 8-3. Internal change consultants report the most successful BU as ‘strongly clan’
Chapter 8: Cross-Case Analysis 8-6

Exploring the Relationship of Organisational Culture to Enterprise Systems Success
Figure 8-4. Vendor consultants report the most successful BU as ‘strongly clan’
The Pearson correlation value of 0.385 for ‘Clan’ on ESS is almost significant at
p <.05, which suggests a positive correlation between ‘Clan’ and ES Success.
The qualitative view was formed through content analysis of the interview data with
consultants and axial coding using the culture constructs. Within the ‘Clan’ there are
three sub-constructs: Development of Others (DO), Interpersonal Relationships,
Team Work. The qualitative data indicates that the DO sub-construct is the most
influential of these in the OC-ESS relationship. This study analysed the attributes of
a culture related most to successful Enterprise Systems. ‘Development of Others’
was a specific element associated with successful use of Enterprise Systems. This
is not surprising as the sub-construct DO is described as ‘helping individuals
improve their performance, expand their competencies and obtain personal
development opportunities’.
These behaviours, when linked to supportive training and management, led to
greater competencies with the system and thus higher levels of success.
However, in addition to encouraging uses to learn, the culture also needs to allow
the user to learn by supporting them, with managers being seen as very visible
ambassadors stressing the importance of self-development.
The table overleaf summarises the data that leads to the finding that clan culture
type is most strongly associated with successful Enterprise System:
Chapter 8: Cross-Case Analysis 8-7

Exploring the Relationship of Organisational Culture to Enterprise Systems Success
OCAI Consultant study Results Clan most dominant
OCAI Consultant study radar plots which show that the clan culture type is most dominant with strongest support from internal and vendor consultants
Qualitative Data – Selective Coding Clan most dominant
The clan culture type - Development of others – is consistently reported as key characteristic of the most successful Enterprise Systems
Revelatory Case Study Results Clan most dominant
Clan most dominant in most Successful BU Clan on ESS Pearson Correlation .385strongly positively correlated with the ESS constructs. Being significantly correlated at the 0.05 level
Table 8-1. Evidence summary for clan as most successful culture type
In addition to this support from the consultant study, the revelatory case study also
supports the clan culture as being most associated with successful Enterprise
Systems. The IT Business Unit, the individual business that reported the greatest
level of ES Success, was extremely oriented towards the clan culture.
Whilst it is perhaps not surprising that the IT Business Unit thought the ES was
highly successful, it does provide further support for their being a relationship
between high ES Success levels and a clan culture types.
We therefore see that there is strong support for the clan and its association with
the most successful ES examples from the OCAI data.
The ESS data from the Oz Dairy case study supports the OCAI findings, suggesting
a positive relationship between the clan and ES Success. The table below shows
the ES Success score and the correlation to the various culture types. ‘Clan’ has
the strongest positive correlation.
ESS Clan Adhocracy Market Hierarchy ESS overall Pearson
Correlation 1 .385 .208 -.493(*) .061
Sig. (2-tailed) .104 .393 .032 .804
Table 8-2. Clan significantly correlated to ES Success
The qualitative data indicated that the clan sub-construct ‘Development of Others’
(DO), defined as ‘helping individuals improve their performance, expand their
competencies and obtain personal development opportunities’, was particularly
important in the successful examples. Many of the consultants in the interviews
discussed the importance of a culture that actively encouraged users to learn.
Chapter 8: Cross-Case Analysis 8-8

Exploring the Relationship of Organisational Culture to Enterprise Systems Success
However, in addition to encouraging uses to learn, the culture also needed to allow
the user to learn by supporting them, with managers being seen as very visible
ambassadors stressing the importance of self development.
The qualitative data therefore supported the quantitative findings that the clan was
important in the most successful ES but also that in particular it was the DO sub-
construct that was interacting strongly with ES Success.
In summary, the clan culture has been indicated to be the most dominant culture
type in the most successful ES innovations:
• Consultant qualitative and quantitative data support this finding
• Revelatory case study quantitative also supports this finding
The range of evidence for the clan culture being most associated with the most
successful ES is therefore strong. The fact that the data from all the various
sources supports this finding, adds strength to the results.
The next section discusses the culture most associated with the least successful
ES.
Chapter 8: Cross-Case Analysis 8-9

Exploring the Relationship of Organisational Culture to Enterprise Systems Success
8.2. Market Culture Very Strong in Least Successful ES
The OCAI culture that is most commonly associated with the least successful ES
innovations is the ‘Market’.
The market culture is typified by:
‘a results-oriented workplace. Leaders are hard driving producers and
competitors. They are tough and demanding. The glue that holds the
organisation together is an emphasis on winning. The long-term concern is
on competitive actions and achieving stretch goals and targets. Success is
defined in terms of market share and penetration. Outpacing the competition
and market leadership are important’ (Cameron & Quinn, 1999).
Evidence for the market culture type being associated with least successful ES
comes from the consultants’ view, the case study view and the qualitative study
view. The results from each are discussed in order.
The consultants’ view as reported in the OCAI shows that the dimensions of the
market were reported as the second most common culture type for least successful
Enterprise Systems.
Figure 8-5. Market strong in least successful ES
The case study view also indicated that market was strong in the least successful
ES.
Chapter 8: Cross-Case Analysis 8-10
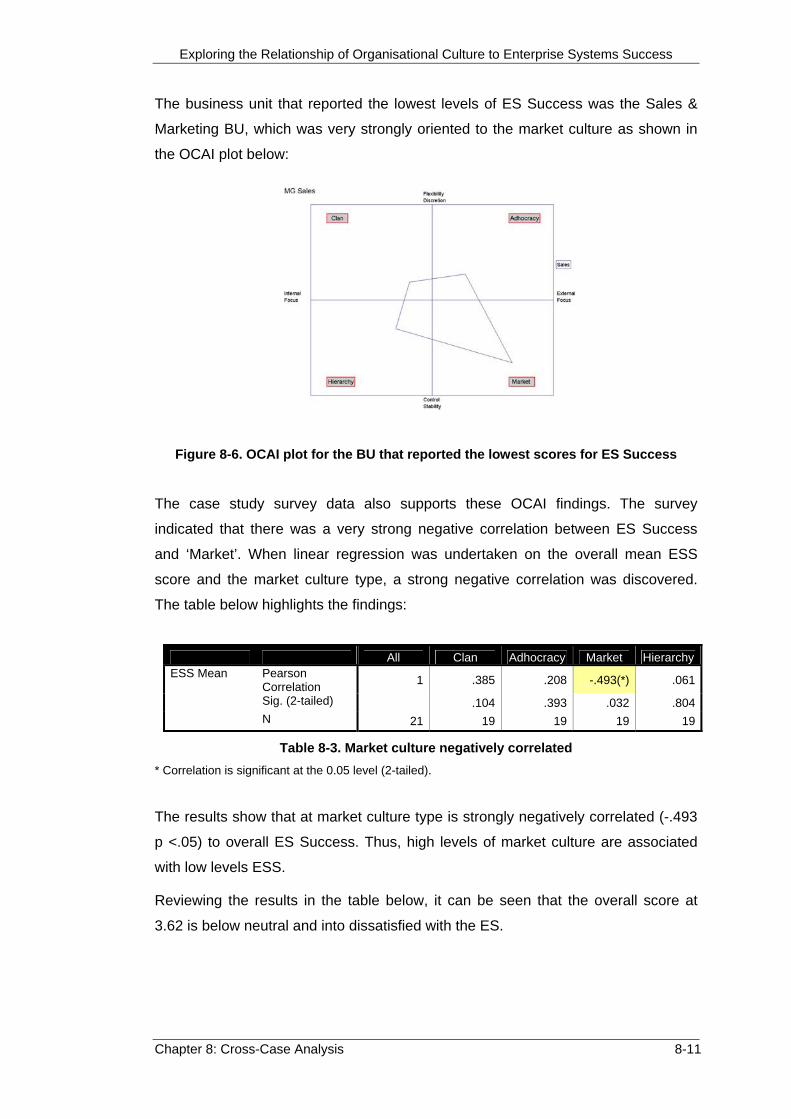
Exploring the Relationship of Organisational Culture to Enterprise Systems Success
The business unit that reported the lowest levels of ES Success was the Sales &
Marketing BU, which was very strongly oriented to the market culture as shown in
the OCAI plot below:
Figure 8-6. OCAI plot for the BU that reported the lowest scores for ES Success
The case study survey data also supports these OCAI findings. The survey
indicated that there was a very strong negative correlation between ES Success
and ‘Market’. When linear regression was undertaken on the overall mean ESS
score and the market culture type, a strong negative correlation was discovered.
The table below highlights the findings:
All Clan Adhocracy Market HierarchyESS Mean Pearson
Correlation 1 .385 .208 -.493(*) .061
Sig. (2-tailed) .104 .393 .032 .804 N 21 19 19 19 19
Table 8-3. Market culture negatively correlated * Correlation is significant at the 0.05 level (2-tailed).
The results show that at market culture type is strongly negatively correlated (-.493
p <.05) to overall ES Success. Thus, high levels of market culture are associated
with low levels ESS.
Reviewing the results in the table below, it can be seen that the overall score at
3.62 is below neutral and into dissatisfied with the ES.
Chapter 8: Cross-Case Analysis 8-11

Exploring the Relationship of Organisational Culture to Enterprise Systems Success
ES Success by Business Unit
ESS Individual Item Score
Business Unit Overall Score OI II SQ IQ
Sales &
Marketing
3.62 4.50 4.75 3.56 1.67
Table 8-4. Overall ESS score and IQ scores the lowest
In addition to a low overall ESS score, the Information Quality factor was the lowest
individual item score given by all respondents at 1.67. When linear regression was
undertaken at the individual item level for the ESS instrument the results indicated
that there was a very strong negative correlation between ‘Market Culture’ and
‘Information Quality’ (IQ variable in the table).
Information Quality BIQ Clan Adhocracy Market Hierarchy IQ Pearson
Correlation 1 .328 .035 -.619(**) .304
Sig. (2-tailed) .127 .876 .002 .159 N 26 23 23 23 23
Table 8-5. Market negatively correlated to IQ ** Correlation is significant at the 0.01 level (2-tailed).
The qualitative data from the consultant interviews suggest some possible causes
for the quantitative findings. A number of the consultants had highlighted that in
many of the least successful ES examples there were sub-cultures operating with
the one overarching dominant culture type. Many organisations have sub-cultures
present within themselves and this has been well documented in the literature
(Beyer & Cameron, 1997; Cameron & Quinn, 1999; Wilkins & Ouchi, 1983; Goffee
& Jones, 1996). The presence of sub-cultures by itself does not automatically mean
that an ES will be failing; sub-cultures can be either a positive or negative influence
on the organisation.
However, what does appear to be occurring, at least in the context of ES
innovations in the least successful examples, is that some of sub-cultures may
actually be in conflict or competing with each other. The individual groups with a
market culture are generally more concerned with self-interest, self-promotion and
protectionism than with the greater organisational success. Whilst many
organisations experience difficulties with controlling individual power groups and the
sometimes competing interests of individual stake holder groups, the competitive
Chapter 8: Cross-Case Analysis 8-12

Exploring the Relationship of Organisational Culture to Enterprise Systems Success
nature of the market culture may be exaggerating this effect. If some of the sub-
cultures are market oriented, then these marketing cultures may be resisting the ES
due to issues of conformity, perceptions of the ES as an ‘admin’ system and as
resisting ‘another Head Office’ directive.
The findings from the consultant interviews suggest that the market culture views
the ES as another controlling administration tool that prevents them from carrying
out what they perceive to be the more important task of capturing more business.
Marketing cultures view administration, compliance with policies and procedures as
onerous chores and if the perception of the ES is one that it is predominately an
admin tool then the reaction to it will be adverse.
A number of consultants reported that an Organisational Culture of change acceptance was critical to the success of the ES innovation. A culture of change
acceptance assists the diffusion process (Rogers, 1995), allowing the innovation to
quickly and easily become embedded in the organisation. Numerous statements
were made to this effect by all consultant categories, e.g.:
‘Culturally I think clearly, the branches that were successful were the ones
who just adopted the change, understood it and knew what value it was
going to do and felt comfortable.’
‘The culture would be one that accepted ICT innovations and understood
the importance of change management to system acceptance and success.’
Yet, marketing cultures have a tendency to be naturally competitive, rule breaking
and fostering the ‘us and them’ mentality, if this attitude is allowed to be applied to
the ES then success may be adversely impacted.
In summary, the market culture type has been indicated to often be associated with
the least successful ES.
The range of evidence in support of market culture and least successful association
is summarised in the table overleaf.
Chapter 8: Cross-Case Analysis 8-13

Exploring the Relationship of Organisational Culture to Enterprise Systems Success
OCAI Consultant study least successful: Market is most dominant culture type in the least successful organisations’ as demonstrated in Evidence from OCAI OCAI All Consultant
radar plots Least Successful
Change Consultant OCAI radar plots most dominant type
Market most dominant in most Least Successful BU
Market very strong
Qualitative Data – Selective Coding Least Successful Market ‘competitiveness’ perceived
negatively Perceptions of ‘admin’ tool on ES by Marketing culture
Market very strong
Case Study Market most
dominant in most Least Successful BU
IQ of Market BU lowest score 1.67
IQ negatively correlated on Market Culture (-.619)
Market very strong
Table 9-6. Summary of the range of evidence supporting the market as least successful ES culture
8.3. OCAI Clan and OCAI Market Negatively Correlated
An interesting result was found in regards to the way in which the clan and market
culture types interacted with each other. The quantitative data from the revelatory
case study indicated a strong negative correlation between the clan and market
culture types.
The data from the OCAI survey in the case study indicated that these were
negatively correlated to each other, where we can see a very strong negative
correlation between the market and clan culture types (-.767 significant at the
p<0.01 level).
The correlation analysis is shown in the table overleaf:
Chapter 8: Cross-Case Analysis 8-14

Exploring the Relationship of Organisational Culture to Enterprise Systems Success
Chapter 8: Cross-Case Analysis 8-15
ESS Clan Adhocracy Market Hierarchy ESS overall Pearson
Correlation 1 .385 .208 -.493(*) .061
Sig. (2-tailed) .104 .393 .032 .804 N 21 19 19 19 19Clan Pearson
Correlation .385 1 -.059 -.767(**) -.309
Sig. (2-tailed) .104 .783 .000 .142 N 19 24 24 24 24
Table 8-7. Clan and market negatively correlated ** Correlation is significant at the 0.01 level (2-tailed).
This study has shown ‘Clan’ to be the culture type that is most dominant in the most
successful ES. Dimensions of the clan culture seem to be important and dominant
in the most successful ES. The market culture type however has been consistently
found to be strong in the least successful ES. Business Units that were very market
oriented were associated with the least successful ES.
When we look at the characteristics of the clan and market types, the literature
indicates that the two culture types are very different in nature, i.e., ‘Clan’ – internal
focus, high stability and high control; ‘Market’ - external focus, low levels of control
and stability, highly competitive. The Pearson correlation from the data also
supports the strong differences between the two types, ‘Clan’ is strongly associated
with successful ES and ‘Market’ with least successful ES and they are unlikely to
occur together. The figure overleaf visualises the findings.
In addition to the ‘Clan’ and ‘Market’ being negatively correlated, the ‘Adhocracy’
and ‘Hierarchy’ also were negatively correlated.
The next findings that we examine revolve around the hierarchy culture type.
S ESS OCAI Clan
OC
OCAI Market LS
ESS
Negatively correlated
Very strong in
Very strong in
Figure 8-7. Clan and market relationship

Exploring the Relationship of Organisational Culture to Enterprise Systems Success
8.4. Hierarchy Strong in Both Successful & Least Successful ES
The hierarchy culture type is defined as:
‘The organisation is characterised by a formal and structured place to work.
Procedures govern what people do. Effective leaders are good coordinators
and organisers. Maintaining a smooth running organisation is important. The
long-term concerns of the organisation are stability, predictability and
efficiency. Formal rules and policies hold the organisation together’
(Cameron & Quinn, 1999).
The findings from the various phases of the study indicate strong support for the
hierarchy having high levels of influence in both the successful and least
successful ES examples. Initially this appears paradoxical; how can one culture
type be dominant or very strong in both successful and least successful ES? A
closer examination of the data provides some understanding of this paradoxical
state, through examining the hierarchical culture components most strongly
associated with either outcome.
This analysis will be undertaken through examining the OCAI data in the
consultant’s study and the case study, both of which show the presence of the
hierarchy in both successful and least successful ES.
The mean OCAI for all consultants shows ‘Hierarchy’ as being strong in both
successful (ranked 2nd after ‘Clan’) and least successful ES (the strongest culture in
the least successful).
Figure 8-8. Hierarchy strong in both successful and least successful ES
Chapter 8: Cross-Case Analysis 8-16

Exploring the Relationship of Organisational Culture to Enterprise Systems Success
Implementation consultants in particular ranked ‘Hierarchy’ the strongest culture
type in the least and also most successful ES examples.
Figure 8-9. Implementation consultants found hierarchy strong in both successful and least successful ES
The OCAI radar plots show the influence that the hierarchy culture type is having on
the least successful ES examples. In all these plots the ‘Hierarchy’ is the dominant
in the least successful ES. Yet, the ‘Hierarchy’ also appears to be strong in the
successful ES examples. Scores for ‘Hierarchy’ are shown in tables below, these
are the rankings for the mean ‘All Consultants’ category.
Successful Rank
Clan 32 1st
Hierarchy 30 2nd
Adhocracy 20 3rd
Market 18 4th
Table 8-8. Hierarchy score in successful ES
Overall, in reviewing the actual values, for example ‘All Consultants’, the ‘Hierarchy’
was 2nd most dominant (30) in the successful and the most dominant in the least
successful (39). The next table shows the results for ‘Hierarchy’ and least
successful.
Chapter 8: Cross-Case Analysis 8-17

Exploring the Relationship of Organisational Culture to Enterprise Systems Success
Least S Rank
Hierarchy 39 1st
Market 23 2nd
Clan 22 3rd
Adhocracy 16 4th
Table 8-9. Hierarchy score in least successful ES
The least successful score is significant since it is nearly double that of the next
closest score ‘Market’ (23). This pattern of most dominant in the least successful
and 2nd most dominant in the successful was repeated throughout many of the
OCAI categories.
The qualitative data reveals a deeper meaning to these contradictory states for the
hierarchy culture: most successful and least successful. The hierarchy culture type
is comprised of three sub-constructs
• Acculturation (A): Helping individuals become clear about what is expected
of them, what the culture and standards of the organisation are and how
they can best fit into the work setting
• Control (CON): Ensuring that procedures, measurements and monitoring
systems are in place to keep processes and performance under control
• Coordination (COOR): Fostering coordination within the organisation as well
as with external units and managers and sharing information across
boundaries
The next table overleaf highlights these hierarchy sub-constructs, ranked by
passage count when the interviews were selectively coded against the OCAI
constructs.
Chapter 8: Cross-Case Analysis 8-18

Exploring the Relationship of Organisational Culture to Enterprise Systems Success
Successful ES Least Successful
Rank OCAI ConstructNo. of
Passages
Rank OCAI Construct No. of
Passages 1 OCAI C (DO) 35 1 OCAI H (COOR) 34 2 OCAI A (CI) 34 2 OCAI H (CON) 21 3 OCAI A (F) 25 3 OCAI A (CI) 17 4 OCAI A (I) 18 4 OCAI A (F) 12 5 OCAI H (COOR) 17 5 OCAI C (DO) 9 6 OCAI C (T) 15 6 OCAI M (CO) 5 7 OCAI H (CON) 8 7 OCAI C (IR) 3 8 OCAI C (IR) 6 8 OCAI C (T) 3 9 OCAI H (A) 1 9 OCAI A (I) 1
10 OCAI M (CO) 0 10 OCAI H (A) 0 11 OCAI M (CS) 0 11 OCAI M (CS) 0 12 OCAI M (E) 0 12 OCAI M (E) 0
Table 8-10. Hierarchy selective coding
In the least successful ES examples, many of the consultants made clear
statements in regard to a lack of communication, coordination and sharing across
BU and functional boundaries negatively impacting upon the ES. Indeed these two
OCAI sub-constructs accounted for over half of all the OCAI passages.
Coordination (COOR) comments were very evident in the selectively coded
passages. Least success ES examples were consistently reported to have been
problematic due to issues of poor levels of information sharing, lack of
communication of important messages across the organisation and protectionism of
information between BU’s.
A number of issues relating to control (CON) were also raised. A lack of adequate
control, policies and procedures, inherent in the organisation could indicate a
culture that was used to low levels of control. This would adversely affect the
success of the ES because users were now being asked to work in a very
structured and controlled manner – something to which they were not used,
therefore resistance levels were high. The users resisted the ES because they
perceived it as being too controlling. Conversely, statements were made indicating
that over control and too much control, in an organisation that was too bureaucratic,
too administration focussed and too procedures oriented could also be stifling to the
ES Success. Both a lack of control and too much control could negatively affect the
ES.
Chapter 8: Cross-Case Analysis 8-19

Exploring the Relationship of Organisational Culture to Enterprise Systems Success
Conversely, the organisations that have the balance right in terms of COOR and
CON issues appear in the most successful ES. The level of communication, i.e.
COOR, present within the organisation seems to directly influence the success of
the ES. In those organisations that were seen to have successful ES, managers
communicated vision, communicated across boundaries and shared information.
Successful achievement of these activities appears to heavily influence the success
of the ES.
In summary, the interaction of the hierarchy and its sub-constructs in the OC-ESS
relationship is complex. On the one hand, the hierarchy culture type is seen the
least successful culture for achieving ESS when poor communication and control
occurs. On the other hand, hierarchy is strongly evident in the successful ES
organisations, where coordination and control function well. The data does suggest
that it is the levels and types of COOR and CON activities that appear to be very
influential in the OC-ESS relationship. Open information sharing, open cross
functional communication and compliance with clearly defined policies and
procedures are influential in the OC-ESS relationship.
This chapter has triangulated data to derive a model of the interaction of culture in
organisations with the most success in Enterprise Systems and the interaction of
culture types to organisations with the least success in Enterprise Systems.
In order to further articulate this relationship, analysis of the question ‘Describe the
perfect supportive Organisational Culture for achieving success with ICT
innovations’ leads to a model of the ideal culture for Enterprise Systems Success,
which is discussed in the next section.
Chapter 8: Cross-Case Analysis 8-20

Exploring the Relationship of Organisational Culture to Enterprise Systems Success
8.5. The Ideal Culture
The question ‘Describe the perfect supportive Organisational Culture for achieving
success with ICT innovations’ was added to the interview question as a summary
type question in order to capture the interviewees overall cultural experiences taken
from across all the implementations that they had been involved in.
The attributes of ideal culture are shown in the following table:
Ideal Culture Item Defined as
Visionary Clear goals for the projects, ES, organisation, a clear direction for the organisation
Accepting of the Innovation How well the users accepted the innovation
Business Users Involved The degree to which the users were involved in the diffusion process
Continuous Improvement Fostering a culture of change, change review and adaptation
Cooperation Users supporting each other and the manner in which managers supported other BU managers
Effective Leadership Strong, clear, direct and respected leaders
Feedback Allowed The degree to which management encouraged, allowed, supported feedback from users
Implementation Partner Valued The closeness of the IC relationship
Innovative Flexible and willing to take risks
Learning Organisation Knowledge and information, shared, retained and reused across the organisation
Open Communication Vertically and horizontally throughout the organisation
Table 8-11. Components of the ideal culture as reported by the consultants
The final selective coding of the interviews carried out during the analysis of the
interview transcripts selectively coded the ideal culture elements against the OCAI
constructs. The results were interesting in the support that they gave to the findings
from the OCAI survey data itself. The full coding and results for the qualitative data
is shown in Chapter 5, however the table overleaf summarises the ideal culture
items, and the OCAI sub-constructs that were identified when the transcripts were
selectively coded.
Chapter 8: Cross-Case Analysis 8-21

Exploring the Relationship of Organisational Culture to Enterprise Systems Success
OCAI selective coding construct mapping
Clan Adhocracy Market Hierarchy
Ideal Culture Item
DO IR T CI F I C CE E A CON COOR
Visionary
Accepting of the Innovation
Business Users Involved
Continuous Improvement
Cooperation
Effective Leadership
Feedback Allowed
Implementation Partner Valued
Innovative
Learning Organisation
Open Communication
Positive Prior Experiences
Supportive
Table 8-12. Summary of ideal culture items when selectively coded against the OCAI sub-constructs
The table above indicates the ideal vulture manifestations can be mapped into the
OCAI constructs. It can be seen that many of the manifestations of the ideal OC
cluster around the ‘Clan’ and ‘Adhocracy’ constructs, in particular the ‘Development
of Others’ (DO), ‘Continuous Improvement’ (CI), ‘Interpersonal Relationships’ (IR)
and ‘Innovative’ (I) constructs.
These findings again support the key role of the clan typology in successful ES with
an emphasis on the DO sub-construct that were suggested by the OCAI radar plots
and coding of the interviewees responses from the previous questions in the
interview.
Chapter 8: Cross-Case Analysis 8-22

Exploring the Relationship of Organisational Culture to Enterprise Systems Success
The coding of the ‘ideal culture question’ also showed strong support for the
influence of the hierarchy sub-construct ‘Coordination’ (COOR - Fostering
coordination within the organisation as well as with external units and managers
and sharing information across boundaries). Again the selective coding of the ‘ideal
culture’ question shows further support for the findings from the previous interview
questions and the OCAI and ESS survey data.
In summary, the ‘ideal culture’ question shows support for the findings from the
other data sources, namely:
• the clan culture factor Development of Others (DO) is strongly influential in
the successful ES examples and the ideal OC
• the clan culture factor Interpersonal Relationships (IR) is strongly influential
in the successful ES and the ideal OC
• the hierarchy culture factor Coordination (COOR) sub-construct influential in
the relationship and the ideal OC.
Chapter 8: Cross-Case Analysis 8-23

Exploring the Relationship of Organisational Culture to Enterprise Systems Success
Chapter 8: Cross-Case Analysis 8-24
8.6. Cross-Case Analysis Summary Findings
This chapter has sought to bring the findings from the consultant study and case
study together in order to identify associations between the findings from the
various data sources.
The purpose of a multi-method approach being adopted by the study was to enable
full exploration of the OC-ESS relationship. The various data sets did raise different
dimensions of the relationship but at the same time confirmed each other in some
of the key dimensions of the relationship. These data sets included interviews,
surveys of experience and in-situ survey reports.
Several key findings have emerged from the data, namely:
1. the clan culture was very dominant in successful Enterprise Systems
2. market culture was very strong in least successful Enterprise Systems
3. hierarchy culture was strong in both successful and least successful
Enterprise Systems
4. characteristics of the ideal culture were found
5. OCAI clan and OCAI market cultures are negatively correlated
6. OCAI adhocracy and hierarchy cultures are negatively correlated.
The next chapter concludes the thesis with an integration of these findings with the
literature, which leads to the presentation of a model of the relationship of
Organisational Culture to Enterprise Systems Success. Limitations of the study are
also discussed, along with proposed future work.

Exploring the Relationship of Organisational Culture to Enterprise Systems Success
Chapter 9: Conclusions and Implications for Future Research 9-1
Chapter 9 Conclusions, Contributions and Future Research

Exploring the Relationship of Organisational Culture to Enterprise Systems Success
Chapter 9: Conclusions and Implications for Future Research 9-2
Table of Contents – Chapter 9 Conclusions
9.
Conclusions, Contributions and Future Research ...................................................9-1
9.1. Summary of Overall Research ..................................................................9-3
9.2. The Research Aims Achieved...................................................................9-5
9.3. Summary of Findings ................................................................................9-6
9.4. Model Output.............................................................................................9-7
9.5. Future Work ..............................................................................................9-8
9.6. Implications for Practice ..........................................................................9-11
9.7. Research Limitations...............................................................................9-12
9.8. Conclusions and Research Contributions ...............................................9-15
Table of Figures
Figure 9-1. OC-ESS model .................................................................................................. 9-1

Exploring the Relationship of Organisational Culture to Enterprise Systems Success
Chapter 9: Conclusions and Implications for Future Research 9-3
9.1. Summary of Overall Research
The research results indicate that there is a relationship between Organizational
Culture and the perceptions of Enterprise Systems Success. In particular, those
cultures which foster a culture of change, support for innovation and the
development of others, when coupled with strong leadership and effective project
management, are more likely to report success than failure.
The literature review identified that there was a gap in research on the relationship
between Organizational Culture and Innovation Success. This gap was the stimulus
for this doctoral research project titled ‘An Exploration of the Relationship between
Organizational Culture and IT Innovations in the context of Enterprise Systems’.
The research project was funded by the Australian Research Council in conjunction
with SAP AG, SAP USA and SAP ANZ through the ARC Linkage Grant program.
The research project adopted a multi-method research design, grounded in
practice, in order to surface any reported relationship between Enterprise Systems
Success and Organizational Culture. A critical part of the study was to identify who
could report on this relationship. Much care and time were developed in creating a
research design that was robust, rigorous and strong, whilst still remaining
achievable within the confines of a PhD study. It was identified that key partners in
implementation include internal change managers, internal consultants, vendor
consultants and implementation partner consultants would be best placed to inform
on the relationship. Representatives from each of these constituents were
interviewed, covering a range of industry sectors and Enterprise Systems vendor
organisations.
The first phase of the research was to qualitatively assess the perception of these
participants on the role of culture to Enterprise Systems Success. This phase used
semi-structured interviews and applied open, axial and selective coding of the
responses.
The second phase of the research was to gather quantitative measures of
Organizational Culture and Enterprise Systems Success as reported by the
consultants. The Organizational Culture Assessment Inventory (OCAI) of Cameron
and Quinn (1999) was selected to gather quantitative data on Organisational
Exploring the Relationship of Organisational Culture to Enterprise Systems Success
Chapter 9: Conclusions and Implications for Future Research 9-4
Culture (OC). This instrument was selected because it has been shown to be
robust, reliable and well validated across a range of organisational settings, industry
sectors and national cultures. The Enterprise Systems Success (ESS) instrument of
Gable, Sedera and Chan (2004) was selected to measure the perception of ESS
again because of its proven reliability and validity. This data was gathered from the
participating consultants post-interview, as to not polarise their statements on the
relationship between culture and Enterprise Systems Success.
Each of these data sets were then analysed to determine if a pattern existed
between the cultures of organisations that achieved most success with the
Enterprise System as opposed to the culture types reported of organisations that
achieved the least success with the Enterprise System.
Finally, in the third phase of the research project, the relationship of OC to ESS was
explored in a rich case study of one large firm, to determine if the consultant’s
reported relationships could be identified in the micro-cultures of the organisation.

Exploring the Relationship of Organisational Culture to Enterprise Systems Success
Chapter 9: Conclusions and Implications for Future Research 9-5
9.2. The Research Aims Achieved
The aims and objectives of the research project were:
Aim: To explore the relationship between Organisational Culture and ES Success.
Objective: The objective of this research was to model the relationship between
Organisational Culture and ES Success.
The objective was achieved through the following methods:
1. A multi-method study of a representative sample of 20 stakeholders taken
across public and private industry, drawn from vendor, client and
implementation partner organisational settings using both qualitative and
quantitative techniques, based on established instruments for measuring
culture and Enterprise Systems Success.
2. A revelatory case study in an organisation applying quantitative and
qualitative methods
3. A cross-case analysis comparing and contrasting the findings from the
consultants, the organisational study and the literature.
The key outcome was an operant model of the Organisational Culture – Enterprise
System Success relationship and the relationship explored.
The aims and objectives of the study were therefore achieved. The primary aim of
the research was achieved and the research objective achieved, with a proposed
model of the relationship.
A summary of the findings is presented in the following section.

Exploring the Relationship of Organisational Culture to Enterprise Systems Success
Chapter 9: Conclusions and Implications for Future Research 9-6
9.3. Summary of Findings
The key findings of this study were:
1. that there was a relationship reported between Organisational Culture type
and success types (most and least) in that:
a. clan cultures which emphasised the behaviours of development
of others were strongly related to reports of Enterprise Systems
Success
b. hierarchical cultures which emphasised the behaviours of control
and coordination were related to reports of Enterprise Systems
Success
c. hierarchical cultures which were poor in the execution of control
and coordination were related to reports of the least success with
ES
d. market cultures which emphasised (internal) competitiveness
were strongly related to reports of least success with ES
e. that literature attributes of ‘Continuous Improvement’ (CI),
‘Flexibility’ (F) and ‘Innovation’ (I), which are often described as
antecedents to innovation success and are found in the culture
type of adhocracy, were reported as strongly related to success
of Enterprise Systems; but the culture type of adhocracy was not
reported as being present in the quantitative data describing
consultant experiences with enterprises which had implemented
Enterprise Systems
2. that the literature identified theoretical reasons for such relationships
3. that these patterns of relationships were found in the case study.
The PhD research supports the proposition that there is a relationship between
Organisational Culture type and Enterprise Systems Success. Certain culture types
practice behaviours that correspond to reported necessary behaviours for
innovation success and Enterprise Systems Success, whilst other culture types
practice behaviours that correspond to behaviours for failure of innovation and of
Enterprise Systems failure. The key behaviours of success were found to be the
development of others, effective control and effective coordination. The key
behavioural barriers to success were found to be ineffective control, ineffective

Exploring the Relationship of Organisational Culture to Enterprise Systems Success
Chapter 9: Conclusions and Implications for Future Research 9-7
coordination and strong internal competitiveness. The literature emphasises the
need for continuous improvement, flexibility, and innovation, but this culture type of
adhocracy was not reported as found in either the successful or least successful
organisations in their perception of Enterprise Systems Success.
9.4. Model Output
A model of and explanation for this relationship was proposed as a result of the
findings. The model is shown below:
The model shows that there are reported antecedent behaviours such as top
management support, leadership and user empowerment. These behaviours are
fostered or attenuated through the Organisational Culture of the enterprise. For
those cultures which emphasise the clan behaviour of development of others, then
the probability of Enterprise System Success is higher than those enterprises in
which development of others is not a key value. Similarly, for those organisations
which practice effective control and coordination, then the probability of Enterprise
Systems success is higher than that of organisations in which there is ineffective
control or ineffective coordination. Finally, those organisations which emphasise
internal competitiveness as found in market cultures, will have a lower probability of
Figure 9-1. OC-ESS model

Exploring the Relationship of Organisational Culture to Enterprise Systems Success
Chapter 9: Conclusions and Implications for Future Research 9-8
success than those organisations in which internal competitiveness for resources
are reduced.
9.5. Future Work
The major area for further investigation that is now required is to empirically test the
model.
The model should be tested across:
• a range of national culture settings
• a range of industry settings
• a range of organisational sizes
• public and private sector settings
Propositions surfaced by the research are:
P1: Organisations with effective control behaviours report higher perceptions of
Enterprise System Success than those organisations with ineffective control
behaviours.
P2: Organisations with effective coordination behaviours report higher perceptions
of Enterprise System Success than those organisations with ineffective coordination
behaviours.
P3: Organisations with effective development of others behaviours report higher
perceptions of Enterprise Systems success than those organisations with
ineffective development of others behaviours.
P4: There is no difference in the reports of Enterprise System Success in
organisations that emphasise organisational flexibility as compared with
organisations that do not emphasise organisational flexibility.
P5: There is no difference in the reports of Enterprise System Success in
organisations that emphasise innovation as compared with organisations that do
not emphasise innovation.

Exploring the Relationship of Organisational Culture to Enterprise Systems Success
Chapter 9: Conclusions and Implications for Future Research 9-9
P6: There is no difference in the reports of Enterprise System Success in
organisations that emphasise continuous improvement as compared with
organisations that do not emphasise continuous improvement.
Further studies are required on the existence and industry sector distribution for
organisations reporting predominantly adhocracy characteristics. It may be that
such organisations prosper in the small enterprise segment and are not present in
the large enterprise segment which can afford to invest in Enterprise Systems.
This study should be repeated in other innovation settings. However, a key criterion
to include is that the innovation needs to impact on the wider organisation, than just
one component. It is only when the innovation spans the organisation that the
elements of Organisational Culture are invoked. Such innovations include business
process change, the adoption of tele-working, and radical restructurings to become
more agile. Technology innovations that may be useful to examine include RFID in
logistics and transportation, network centric warfare or network enabled operations
through the deployment of mobile and interconnected battle space management
systems, or the wide spread adoption of pervasive computing in a business or
social setting.
Other cultural instruments should be used in similar studies to detect further
interactions. In addition, the role of national culture to innovation success should be
investigated and the relationship between Organisational Culture and national
culture explored.
The ES itself may actually change the OC past go live Some researchers have suggested that the Enterprise System itself may actually
bring cultural change to an organisation. If changes to culture can be tracked over
time it would be of value to investigate the changes to the OC-ESS relationship
over a period of time. A longitudinal study could shed new light on the relationship
before, during and post implementation to see the effects of the ES itself upon the
OC-ESS relationship.
Micro cultures present within the organisation Sub cultures (micro cultures) are those cultures present within an organisation, and
have been identified as existing in a number of other studies. The PhD study
supports the proposition for the presence of sub cultures with an organisation via

Exploring the Relationship of Organisational Culture to Enterprise Systems Success
Chapter 9: Conclusions and Implications for Future Research 9-10
the case study. The case study showed that within the one organisation there were
different OCAI profiles across the different business units. An area for future study
is to investigate the OC-ESS relationship across other large organisations to further
explore the sub culture influence on the relationship.
National Cultures One clear area for future work is to investigate the relationship across National
cultures, Hofstede in his work clearly identified and quantified national culture and
found six overarching dimensions. Further research to be undertaken will examine
the OC-ESS relationship not just across other national cultures but also against the
dimensions that Hofstede proposed. The nature of the relationship (OC-ESS) will
be examined within the context of these dimensions

Exploring the Relationship of Organisational Culture to Enterprise Systems Success
Chapter 9: Conclusions and Implications for Future Research 9-11
9.6. Implications for Practice
There are a number of practical implications arising from this research these are:
1. to benchmark Organisational Culture prior to systems selection in order to determine barriers and enablers to such innovation success. This can be undertaken through the application of the OCAI throughout the
organisation, ensuring adequate sample size for each business unit or sub-
culture identified.
2. to commence change management practices early which are designed to improve organisational behaviours known to be associated with innovation success and to ameliorate those organisational behaviours known to be associated with innovation failure. Organisations can commence these practices prior to large system changes
or in seeking improvements to the success of the ES to be experienced.
3. to monitor change management programs for changes in Organisational Culture. Organisational Culture has been shown to change, albeit slowly, over time.
Large, long-term change management programs will need to monitor
cultures for signs of change.
4. to re-position the implementation processes, with full knowledge of organisational friction arising from cultural issues. Organisations and vendors will be able to reposition their implementation
methodologies accordingly to accommodate the findings from the study.

Exploring the Relationship of Organisational Culture to Enterprise Systems Success
Chapter 9: Conclusions and Implications for Future Research 9-12
9.7. Research Limitations
As with any research project, decisions had to be made that led to compromises
being made or paths not being chosen for further investigation. Within the PhD
there are clearly bounds of time, resource and topic and this study is no different to
any other PhD in this regards. The identified limitations are as follows:
Organisational Culture not National Culture The study investigated the relationship of Organisational Culture and not National
Culture to Enterprise System Success. Due to size and scope a decision was made
to focus the study upon Organisational Culture.
Australian Study The findings from the study we recognise are based on Australian business
experiences. It may be that there are different results in other national settings.
Industry Sector The findings from the study we recognise are based on Australian business
experiences in specific industry sectors. Not all industry sectors were examined. It
may be that there are different results in other industry sector settings.
OC and ES Success Instrument Choice Clearly a decision had to be made as to which instruments to use. Within both fields
there were many instruments available that could have been chosen. All
instruments have their detractors and their supporters, some might agreed with our
instrument choice whilst others will disagree. However, instruments were selected
against our criteria of grounded in theoretical rigor, validity, reliability and a
significant number of prior studies, and the OCAI and ESS impacts instruments met
these criteria and were selected for use.
The use of particular instruments however could lead to criticism of the results
based on the instruments chosen. However, we feel that by using instruments that
were very well tested, validated and supported in the literature only strengthens the
research results.

Exploring the Relationship of Organisational Culture to Enterprise Systems Success
Chapter 9: Conclusions and Implications for Future Research 9-13
Bias The potential for bias exists in all research projects and the researcher needs to be
aware of the potential for bias and employ strategies to ensure bias does not occur.
In the study a number of strategies were utilised, and care taken, in particular via
the study design to guard against bias.
In regards to the selection of Consultants, all consultants that participated in the
research were experienced senior consultants that had significant experience
gained over several years across a range of industries. The maturity and seniority
of the consultants meant that they had a full range of experiences to report on. The
Consultants were invited from various categories in line with the requirement to
capture a broadest range of experiences as possible. Since the goal was to select
the consultants from the broadest range as possible, with the greatest range of
experiences the issue of bias will therefore not arise.
Consultant names, Consultant firms and Client firms were not reported in the
research. The Consultants knew this from the documentation given prior to
participation in the research and the statements made by the interviewer in the
interviews. The consultants were encouraged to speak with truthfulness and candor
and this was clearly articulated at the start of each interview by the interviewer.
Consultant Choice Except for the internal change consultants the majority of the consultants were
external to the organisations to which they reported upon. Questions could be
asked as to whether these were able to comment on an organisation’s culture when
they were external to this organisation.
We would argue that research has suggested that these are the best positioned
stakeholders to comment on the organisation’s culture (Schein, 1997).
Survey Numbers From the case study we had 27 responses completed, and from the 17 consultant
interviews we received 30 responses. The numbers are low from a statistical
perspective, but the study was exploratory. The next task is now to gather further
data to fully test the initial model and findings. As further data is gathered and
analysed more fully supported conclusions can be drawn.

Exploring the Relationship of Organisational Culture to Enterprise Systems Success
Chapter 9: Conclusions and Implications for Future Research 9-14
Case Study Results The results from the case study are of course from but one organisation, the
findings on their own are clearly weak if we try to generalise from them. However,
support for the case study comes from the pilot and main consultant studies;
because independently these findings also supported the findings from the case
study. So finding the same results from the different data sets and via different
research methods suggests there is some consistency in the results.
Enterprise Systems The research was focussed in the domain of ES and their extensions. So questions
may be asked as regards the applicability of the study in the wider context of IT
innovations. The research has sought to demonstrate that ES are examples of IT
innovations – unique yes, but nevertheless one type of innovation. We now need to
test the model fully across other IT innovation settings to fully test this assertion.
Some researchers have suggested that ES benefits perception may change over time Research from a variety of studies has indicated that Enterprise System benefits
perceptions may change over time within an organisation which may well be the
case. However, the PhD study was not a longitudinal study, rather the OC-ESS was
investigated and explored at a very specific point in time i.e. 2 years past Go Live.
By sampling always at this point in the ES lifecycle the effects of potential changes,
if any, in the OC-ESS relationship during the normal hectic implementation, would
be minimalised. Future research will be to study the OC-ESS relationship over a
period of time and at different points in an implementation. The purpose of the PhD
study however was not to investigate the OC-ESS relationship over time.

Exploring the Relationship of Organisational Culture to Enterprise Systems Success
Chapter 9: Conclusions and Implications for Future Research 9-15
9.8. Conclusions and Research Contributions
The research project has been an exploratory journey that sought to investigate a
complex research object. However, even though the study was exploratory in
nature, tried and tested, rigorous research approaches were adopted and followed
in order to pursue a strong and robust program of study.
The research was a multi-method study, purposefully selected to be multi-method,
in order to capture and explore as many of the dimensions of the relationship as
possible. Identified, established and validated instruments were adopted where
appropriate and established qualitative methods undertaken to ensure that the
study was strong in design and approach.
The research has made a significant contribution to the body of knowledge in that it
is the first to explore the Organisational Culture – Enterprise System Success
relationship. This study has shown that such a relationship exists and has identified
key elements of that relationship. The key behaviours of success were found to be
the ‘Development of Others’, effective control and effective coordination. The key
behavioural barriers to success were found to be ineffective control, ineffective
coordination and strong internal competitiveness. The literature emphasises the
need for continuous improvement, flexibility, and innovation, but this culture type,
Adhocracy in the OCAI was not reported as found in either the successful or least
successful organisations in their perception of Enterprise Systems Success. This
latter observation should stimulate further studies in determining the frequency of
occurrence of this culture type in those organisations which use Enterprise
Systems.
The research outputs will have implications for both practice and research and point
the way for future work to be undertaken.
I have personally gained skills in designing research, conducting case study
research, undertaking qualitative research and application of quantitative methods.
The PhD journey has been challenging but enormously rewarding and I have very
much enjoyed the experience of becoming a researcher. I look forward to
continuing the work that the PhD study has begun and the moving on the next
phase of the research.

Exploring the Relationship of Organisational Culture to Enterprise Systems Success
Chapter 9: Conclusions and Implications for Future Research 9-16
The work will now continue to build testable hypothesis and to further develop and
test the model that has been developed.

Exploring the Relationship of Organisational Culture to Enterprise Systems Success
Reference List
Ajzen, I. (1991). The Theory of Planned Behavior. Organizational Behavior and
Human Decision Processes, 50, 179-211.
Alasuutari, P. (1995). Researching culture : qualitative method and cultural
studies. London ; Thousand Oaks, Calif :: Sage Publications,.
Anthony, R. N. (1965). Planning and Control Systems: A Framework for
Analysis. Boston: Harvard University Press.
Ashkanasy, N., Wilderom, C., & Peterson, M. (Eds.). (2000). Handbook of
Organizational Culture and Climate. London: Sage.
Ashkanasy, N., Edwin, T., & Earnshaw, L. (2002). The Anglo Cluster: Legacy
of the British Empire. Journal of World Business, 37, 28-39.
Bagchi, K., Cerveny, R., Hart, P., & Peterson, M. (2003). The Influence of
National Culture in Information Technology Product Adoption. Paper
presented at the Ninth Americas Conference on Information Systems,
Tampa.
Bancroft, N., Seip, H., & Sprengel, A. (1998). Implementing SAP R/3 (2nd
ed.). Greenwich: Manning.
Baskerville, R., & Myers, M. (2002). Information Systems as a Reference
Discipline, MIS Quarterly (Vol. 26, pp. 1): MIS Quarterly & The Society for
Information Mgt.
Bazeley, P., & Richards, L. (2000). The NVivo Qualitative Project Book.
Thousand Oaks: Sage Publications.
Becker, J., Uhr, W., & Vering, O. (2001). Retail Information Systems Based
on SAP Products. Berlin: Springer.
Benbasat, I., Goldstein, D., & Mead, M. (1987). The Case Research Strategy
in Studies in Information Systems. MIS Quarterly, 11(3).
Bernard, H. (1998). Handbook of Methods in Cultural Anthropology. London:
Sage.
References: R-1

Exploring the Relationship of Organisational Culture to Enterprise Systems Success
Bernard, S. A. (2004). An introduction to enterprise architecture (1st ed. ed.).
Bloomington, Ind. AuthorHouse,.
Beyer, J., & Cameron, K. (1997). Organisational Culture. In D. Druckman
(Ed.), Enhancing Organisational Performance.
Bhattacherjee, A., & Premkumar, G. (2004). Understanding Changes in
Belief and Attitude Toward Information Technology Usage: A Theoretical
Model and Longitudinal Test. MIS Quarterly, 28(2).
Bingi, P., Sharma, M., & Godla, K. (1999). Critical Issues Affecting an ERP
Implementation. Information Systems Management;, 16(3).
Boyatzis, R. (1998). Transforming qualitative information: Thematic analysis
and code development. Thousand Oaks: Sage.
Brady, J., Monk, E., & Wagner, B. (2001). Concepts in Enterprise Resource
Planning. Boston: Thomson Learning.
Brady, J., Monk, E., & Wagner, B. (2001). Concepts in Enterprise Resource
Planning. Boston: Thomson Learning.
Calogero, B. (2000). Who is to blame for ERP failure? Retrieved 10/11/2003,
2003, from
http://www.serverworldmagazine.com/sunserver/2000/06/erp_fail.shtml
Cameron, K., & Quinn, R. (1999). Diagnosing and Changing Organisational
Culture, Based on the Competing Values Framework: Addison-Wesley.
Cameron, K., & Whetten, D. (1983). Organisational Effectiveness: a
Comparison of Multiple Models. Journal of Management Information
Systems, 12, 37-57.
Cheon, M., Grover, V., & Sabherwal, R. (1993). The evolution of empirical
research in IS: A study in IS maturity. Information & Management, 24, 107-
119.
Cheon, M., Grover, V., & Sabherwal, R. (1993). The evolution of empirical
research in IS: A study in IS maturity. Information & Management, 24, 107-
119.
References: R-2

Exploring the Relationship of Organisational Culture to Enterprise Systems Success
Coakes, S. (2005). SPSS: analysis without anguish: version 12.0 for
Windows. Milton, Queensland: John Wiley & Sons.
Collins, D. (1998). Organizational Change Sociological Perspectives. NY:
Routledge.
Cooke, R., Rousseau, D., & Lafferty, J. (1988). A Quantitative Approach to
the Assessment of Organizational Culture: Organizational Cultural Inventory
(OCI). Group & Organisation Studies, 13(3).
Cooper, R. (1994). The inertial impact of culture on IT Implementation.
Information and Management, 27, 17-31.
Davenport, T. (1998). Putting the Enterprise into Enterprise System. Harvard
Business Review, 76(4), 121-131.
Davenport, T., & Prusak, L. (2000). Working Knowledge: how organizations
manage what they know. Boston: Harvard Business School Press.
Davey, K., & Symon, G. (2001). Recent Approaches to the Qualitative
Analysis of Organizational Culture. In C. Cooper, S. Cartwright & P. C.
Earley (Eds.), The International Handbook of Organizational Culture &
Climate. London: Wiley & Sons Ltd.
Davis, F. (1989). Perceived Usefulness, Perceived Ease of Use, and User
Acceptance of Information Technology. MIS Quarterly, 13(3), 318.
Davis, F., Bagozzi, R., & Warshaw, P. (1989). User Acceptance of Computer
Technology: A comparison of two theoretical models. Management Science,
35(8), 982.
Deal, T., & Kennedy, A. (1982). Corporate Cultures, The Rites and Rituals of
Corporate Life. NY: Addison-Wesley.
Deetz, S., Tracy, S., & Simpson, J. (2000). Leading organizations through
transition: Communication and Cultural Change. Thousand Oaks: Sage.
Deloitte Consulting. (1999). ERP's Second Wave Maximizing the Value of
ERP Enabled Process.
DeLone, W., & McLean, E. (1992). Information System Success: The Quest
for the Dependent Variable. Information Systems Research, 3, 60-95.
References: R-3

Exploring the Relationship of Organisational Culture to Enterprise Systems Success
DeLone, W., & McLean, E. (2003). The DeLone and McLean model of
information systems success: A ten-year update. Journal of Management
Information Systems, 19(4), 9.
Denison, D. (1995). Toward a Theory of Organisational Culture &
Effectiveness. Organisation Science, 6(2), 204-223.
Denison, D. (1996). What is the Difference between organisational culture
and organisational climate? A native's point of view on a decade of paradigm
wars. Academy of Management, 21(3), 619-654.
Denison, D. (2001). Organizational Culture: Can it be a Key Lever for Driving
Organizational Change? In C. Cooper, S. Cartwright & P. C. Earley (Eds.),
The International Handbook of Organizational Culture & Climate (pp. 347-
376). New York: John Wiley & Sons.
Denrell, J. (2005). Selection Bias and the Perils of Benchmarking. Harvard
Business Review.
Deshpande, R., Farley, J. U., & Webster, F. E. J. (1993). Corporate culture,
customer orientation, and innovativeness. Journal of Marketing, 57(1), 23.
Dishaw, M., & Strong, D. (1997, 1997). Extending the Technology
Acceptance Model. Paper presented at the Americas Conference on
Information Systems.
Dishaw, M., Strong, D., & Bandy, B. (2002). Extending the Task-Technology
Fit Model with Self-Efficacy Constructs. Paper presented at the Eighth
Americas Conference on Information Systems.
Eisenhardt, K. (1989). Building Theories from Case Study Research.
Academy of Management Review, 14(4), p532.
Esteves, J., & Pastor, J. (2002). Understanding the ERP Project Champion
Role and its Criticality. Paper presented at the European Conference on
Information Systems, Gdansk, Poland.
Fishbein, M., & Ajzen, I. (1975). Belief, Attitude, Intention and Behavior: An
introduction to Theory and Research. Reading: Addison-Wesley.
References: R-4

Exploring the Relationship of Organisational Culture to Enterprise Systems Success
Freeman, R. (1984). Strategic Management: a Stakeholder Approach.
Boston: Pittman.
Gable, G. (1994). Integrating case study and survey research methods an
example in information systems. European Journal of Information Systems,
3(2), 112-126.
Gable, G., Sedera, D., & Chan, T. (2003). Enterprise Systems Success: a
measurement model. Paper presented at the 24th International Conference
on Information Systems, Seattle, Washington.
Galliers, R. (1993). Research Issues in Information Systems. Journal of
Information Technology, 8(2), 92-98.
Galliers, R. (Ed.). (1991). Choosing appropriate information systems
research approaches: A revised taxonomy. Oxford: Blackwell.
Garrity, E., & Sanders, G. (1998). Dimensions of Information Systems
Success. In E. Garrity & G. Sanders (Eds.), Information Systems Success
Measurement. NY: Idea Group Publishing.
Gartner Group Inc (2005). Management Update: Define Your Roles for
Business
Gartner Group Inc. (1990). ERP: A Vision of the Next-Generation MRPII.
Computer Integrated Manufacturing.
Geertz, C. (1973). The Interpretation of Cultures: Selected essays. New
York: Basic Books.
Gefen, D., Karahanna-Evaristo, E., & Straub, D. (2003). Trust and TAM in
online shopping: An Integrated Model. MIS Quarterly, 27(1), 51-90.
Glaser, B., & Strauss, A. (1967). The discovery of grounded theory:
strategies for qualitative research. New York: Aldine Pub Co.
Goffee, R., & Jones, G. (1996). What holds the modern company together?
Harvard Business Review, 74(6), 133.
Goffee, R., & Jones, G. (1998). The character of a corporation : how your
company's culture can make or break your business (1st ed. ed.). New York :
London :: HarperBusiness ; HarperCollins Business,.
References: R-5

Exploring the Relationship of Organisational Culture to Enterprise Systems Success
Goodhue, D., & Thompson, R. (1995). Task-Technology Fit and Individual
Performance. MIS Quarterly, 19(2), 213.
Gordon, G. G. (1991). Industry determinants of Organisational Culture.
Academy of Management Review, 16(2), 396.
Gorman, G., & Clayton, P. (2005). Qualitative research for the information
professional (2nd ed.). London: Facet Publishing.
Gray, P. (2001). Customer Relationship Management: University of
California, Center for Research on Information Technology and
Organizations.
Gregory, K. L. (1983). Native-View Paradigms: Multiple Cultures and Culture
Conflicts in Organizations. Administrative Science Quarterly, 28(3), 359.
Hamel, G., & Prahalad, C. (Eds.). (c1999). Competing for the Future. Boston:
Harvard Business School Press.
Hamerman, R., & Wang, R. (2005). ERP Applications - The Technology and
Industry Battle Heats Up, 2005, from www.forrester.com
Hannan, M. T., & Carroll, G. R. (2003). The Fog of Change: Opacity and
Asperity in Organizations. Administrative Science Quarterly, 48(3), 399-432.
Harrison, J. R., & Carroll, G. R. (1991). Keeping the Faith: A Model of
Cultural Transmission in Formal Organisations. Administrative Science
Quarterly, 36(4), 552.
Heales, J., & Cockcroft, S. (2003). The Influence of National Culture on the
Level and Outcome of IS Decision Making in the IS
Evolution/Redevelopment Decision. Paper presented at the Ninth Americas
Conference on Information Systems, Tampa.
Hersey, P., Blanchard, K., & Natemeyer, W. (1979). Situational Leadership,
Perception and the impact of Power. Group & Organization Studies (pre-
1986), 4(4), 418.
Hofstede, G. (1980). Culture's Consequences, International Differences in
Work-Related Values. London: Sage.
References: R-6

Exploring the Relationship of Organisational Culture to Enterprise Systems Success
Hofstede, G. (1990). Measuring Organisational Cultures: A Qualitative and
Quantitative Study Across Twenty Cases. Administrative Science Quarterly,
35, 286-316.
Hofstede, G. (1991). Cultures and organisations: software of the mind.
London: McGraw-Hill.
Hofstede, G. (1998). Attitudes, Values and Organisational Culture:
Disentangling the Concepts. Organisation Studies, 19/3, 477-492.
Hofstede, G. (2006). Cultural Dimensions. Retrieved 6 March, 2006, from
http://www.geert-hofstede.com/
Homburg, C., & Pflesser, C. (2000). A multiple-layer model of market-
oriented Organisational Culture: Measurement issues and performance
outcomes. Journal of Marketing Research, 37(4), 449.
Hooijberg, R. (1996). A multidirectional approach toward leadership: An
extension of the concept of behavioural complexity. Human Relations, 49(7),
917-932.
House, R., Javidan, M., & Dorfman, P. (2001). Project GLOBE: An
Introduction. Applied Psychology: An International Review, 50(4), 489-505.
House, R., Javidan, M., Hanges, P., & Dorfman, P. (2002). Understanding
cultures and implicit leadership theories across the globe: an Introduction to
project GLOBE. Journal of World Business, 37(1), 3-10.
Igo, T., & Skitmore, M. (2006). Diagnosing the Organisational Culture of an
Australian engineering consultancy using the competing values framework.
Construction Innovation, 6(2), 121.
Ishman, M. (1998). Measuring Information Success at the Individual Level in
Cross Cultural Environments. In E. Garrity & G. Sanders (Eds.), Information
Systems Success Measurement. NY: Idea Group Publishing.
Ives, B., Hamilton, S., & Davis, G. (1980). A framework for research in
computer based management Information Systems. Management Science,
29(9), 910-934.
References: R-7
Exploring the Relationship of Organisational Culture to Enterprise Systems Success
Johnson, G. (2000). Strategy through a Cultural Lens, Learning from
Managers’ Experience. Management Learning, 31(4), 403.
Kaplan, B. (c2006). Combining qualitative and quantitative methods in IS in
healthcare revisited. In T. Spil & R. Schuring (Eds.), E-health systems
diffusion and use : the innovation, the user and the Use IT model (pp. xvi,
342 p. :). Hershey :: Idea Group,.
Karahanna-Evaristo, E., Straub, D., & Chervany, N. (1999). Information
Technology Adoption Across Time: A cross-Sectional Comparison of Pre-
Adoption and Post-Adoption Beliefs. MIS Quarterly, 23(2), 183-213.
Katz, j., & Townsend, J. (2000). The Role of Information Technology in the
'Fit' Between Culture, Business Strategy and Organisational Structure of
Global Firms. Journal of Global Information Management, 8(2), 24-35.
Kluckhohn, C. (1951). Values and value orientations in theory of action: An
exploration in definition and classification. In T. S. Parsons, E (Ed.), Toward
a general theory of action (pp. 395). Cambridge: Harvard University Press.
Kotter, J., & Heskett, J. (1992). Corporate Culture and Performance. New
York: Free Press.
Krumbholz, M., & Maiden, N. (2001). The Implementation of Enterprise
Resource Planning packages in different Organizational and National
Cultures. Information Systems, 26, 185-204.
Kvale, S. (1996). Inter Views: An introduction to qualitative research
interviewing. Thousand Oaks, CA: Sage.
Kumar, K., & van Hillegersberg, J. (2000). ERP Experiences and Evolution.
Communications of the ACM, 43(4).
Kwan, P., & Walker, A. (2004). Validating the Competing Values Model as a
Representation of Organisational Culture through inter-Institutional
Comparisions. Organisational Analysis, 12(1), 21.
Lamond, D. (2003). The value of Quinn's competing values model in an
Australian context. Journal of Managerial Psychology, 18(1/2), 46.
References: R-8

Exploring the Relationship of Organisational Culture to Enterprise Systems Success
Landry, M., & Banville, C. (1992). A disciplined methodological pluralism for
MIS research. Accounting, Management & Information Technology, 2(2), 77-
97.
Langan-Fox, J., & Tan, P. (1997). Images of culture in transition: Personal
constructs of organizational stability and change. Journal of Occupational
and Organizational Psychology, 70, 273-293.
Lau, T., Wong, Y. H., Chan, K. F., & Law, M. (2001). Information technology
and the work environment - does IT change the way people interact at work?
Human Systems Management, 20(3), 267.
Leavitt, H. J. (1965). Applied Organisational Change in Industry: Structural,
Technological and Humanistic Approaches. In J. March (Ed.), Handbook of
Organisations. Chicago: Rand McNally.
Leidner, D. E., & Kayworth, T. (2006). A Review of Culture in Information
Systems Research: Toward a Theory of Information Technology Culture
Conflict. MIS Quarterly, 30(2).
Levin, J. (1973). Elementary Statistics in Social Research. NY: Harper Row.
Levitin, T. (1973). Values. In J. S. Robinson, P (Ed.), Measures of Social
psychological attitudes (pp. 489-502). Michigan: University of Michigan.
Lewin, K. (1936). Some social-psychological difference between the United
States and Germany. In Resolving Social Conflicts. New York: Harper Row.
Light, R., Singer, J., & Willett, J. (1990). By design: Conducting research on
higher education. Cambridge, MA: Harvard University Press.
Louis, M. R., Posner, B. Z., & Powell, G. N. (1983). The Availability and
Helpfulness of Socialization Practices. Personnel Psychology, 36(4), 857.
Mabert, V., Soni, A., & Venkataramanan, M. (2003). Enterprise resource
planning: Managing the implementation process. European Journal of
Operational Research, 146, 302-314.
Markus, L. (1994). Electronic Mail as the Medium of Managerial Choice.
Organization Science, 5(4), 502-527.
References: R-9

Exploring the Relationship of Organisational Culture to Enterprise Systems Success
Markus, L., & Tanis, C. (2000). The Enterprise System Experience - From
Adoption to Success. In R. Zmud (Ed.), Framing the Domains of IT
Management Projecting the future through the past. Cincinnati: Pinnaflex.
Markus, L., Axline, S., Petrie, D., & Tanis, C. (2000). Learning from adopters'
experiences with ERP: problems encountered and success achieved.
Journal of Information Technology, 15, 245-265.
Martin, J., & Siehl, C. (1983). Organisational Culture and Counterculture: An
Uneasy Symbiosis. Organisational Dynamics, 12(2), 52.
Maxwell, J. (2005). Qualitative Research Design. Thousand Oaks: Sage
Publications.
Meyerson, D., & Martin, J. (1987). Cultural Change: An integration of three
different views. Journal of management studies, 24(6), 623-647.
Miles, M., & Huberman, M. (1994). Qualitative data analysis: an expanded
source book. Thousand Oaks: Sage.
Mingers, J. (2001a). Combining IS research methods: Towards a pluralist
methodology. Information Systems Research, 12(3), 240.
Mingers, J. (2001b). Combining IS research methods: variety is (not) the
spice of life. Paper presented at the Seventh Americas Conference on
Information Systems, Boston.
Mintzberg, H. (1979). The Structuring of Organizations: Prentice Hall
Business Publishing.
Monk, E., & Wagner, B. (2006). Concepts in Enterprise Resource Planning.
Boston: Thomson Learning Inc.
Moreton, r., & Chester, m. (1996). Transforming the business: the IT
contribution: McGraw Hill.
Murphy, K., & Simon, S. (2002). Intangible benefits valuation in ERP
projects. Information Systems Journal, 12, 301-320.
Myers, M., & Tan, F. (2002). Beyond Models of National Culture in
Information Systems Research. Journal of Global Information Management,
10(1), 24-32.
References: R-10

Exploring the Relationship of Organisational Culture to Enterprise Systems Success
Neuman, W. L. (2000). Social Research Methods; Qualitative & Quantitative
Approaches. Boston: Allyn & Bacon.
Oracle. (2006). Siebel Business Analytics Applications. Retrieved 10
October, 2006, from http://www.oracle.com/applications/crm/siebel/business-
analytics/index.html
O'Reilly, C., Chatman, J., & Caldwell, D. (1991). People and Organisational
Culture: A profile comparison approach to assessing person organisation fit.
Academy of Management Journal, 34, 487-516.
Orlikowski, W. (1993). CASE Tools as organizational change: Investigating
incremental and radical changes in systems development. MIS Quarterly,
17(3), 309.
Parasuraman, A., Zeithaml, V., & Berry, L. (1988). SERVQUAL: A Multiple
Scale for Measuring Consumer Perceptions of Service Quality. Journal of
Retailing, 64(1), 12-40.
Parr, A., & Shanks, G. (2000). A model of ERP project implementation.
Journal of Information Technology, 15, 289-303.
Patterson, M. G., West, M. A., Shackleton, V. J., Dawson, J. F., Lawthom,
R., Maitlis, S., et al. (2005). Validating the organisational climate measure:
links to managerial practices, productivity and innovation. Journal of
Organisational Behavior, 26(4), 379.
Patton, M. Q. (1987). How to use qualitative methods in evaluation. Newbury
Park, CA: Sage.
Peters, T. J., & Waterman, R. H. (1982). In search of excellence : lessons
from America's best-run companies (Warner Books ed. ed.). New York, NY ::
Warner Books,.
Pitt, L., Watson, R., & Kavan, C. (1995). Service Quality: A measure of
information systems effectiveness. MIS Quarterly, 19(2), 173-188.
Quinn, R. E., & Rohrbaugh, J. (1983). A Spatial Model of Effectiveness
Criteria: Towards a Competing Values Approach to Organisational Analysis.
Management Science, 29(3), 363.
References: R-11

Exploring the Relationship of Organisational Culture to Enterprise Systems Success
Ravesi, D., & Schultz, M. (2006). Responding to Orgainzational Identity
Threats: Exploring the Role of Organisational Culture. Academy of
Management Journal, 49(3), 433-458.
Reissner, S. C. (2005). Learning and innovation: a narrative analysis. Journal
of Organizational Change Management, 18(5), 482.
Richards, L. (1990). Critiquing qualitative computing : grounded theory
method vs code and retrieve techniques. Paper presented at the Social
Research Conference, Queensland.
Rockart, J., & Hofman, J. (1992). Systems Delivery: Evolving New
Strategies. Sloan Management Review, 33(4), 21.
Rockart, J., & Morton, M. (1984). Implications of Changes in Information
Technology for Corporate Strategy. Interfaces, 14(1), 84.
Rogers, E. (1962). Diffusion of innovations (1st ed.). New York: The Free
Press.
Rogers, E. (1995). Diffusion of innovations (4th ed.). New York: The Free
Press.
Rokeach, M. (1972). Beliefs, attitudes and values: A theory of organization
and change. San Francisco: Jossey Bass.
Ross, J. W., & Vitale, M. (2000). The ERP Revolution: Surviving vs Thriving.
Information Systems Frontiers, 2(2), 233-241.
Rousseau, D., & Gundry, L. (1994). Critical incidents in communicating
culture to newcomers: The meaning is the message. Human Relations,
47(9), 1063-1087.
Rowlinson, M., & Hassard, J. (1993). The invention of corporate culture: A
history of the histories of Cadbury. Human Relations, 46(3), 299-326.
Sackmann, S. (2001). Cultural Complexity in Organisations: the Value and
limitations of Qualitative Methodology and Approaches. In C. Cooper, S.
Cartwright & P. C. Earley (Eds.), Organisational Culture and Climate. NY:
John Wiley & Sons.
References: R-12

Exploring the Relationship of Organisational Culture to Enterprise Systems Success
Sackmann, S. (2001). Cultural Complexity in Organizations: the Value and
limitations of Qualitative Methodology and Approaches. In C. Cooper, S.
Cartwright & P. C. Earley (Eds.), Organizational Culture and Climate. NY:
John Wiley & Sons.
SAP. (2004). SAP Enterprise Portal. Retrieved 08/04, 2004, from
http://www.sap.com/solutions/netweaver/enterpriseportal/
Schein, E. (1984). Coming to a New Awareness of Organisational Culture.
Sloan Management Review(Winter), 3-16.
Schein, E. (1985). Organisational Culture and Leadership. San Francisco:
Jossey-Bass.
Schein, E. (1996). Culture: the missing concept in organization studies.
Administrative Science Quarterly [H.W. Wilson - SSA], 41, 229.
Schein, E. (1997). Letters to the editor. Harvard Business Review, Vol.
75(Nov/Dec97, Issue 6), 174.
Schein, E. (1999). The Corporate Culture Survival Guide. San Francisco:
Jossey-Bass.
Seddon, P. (1997). A respecification and extension of the DeLone and
McLean model of IS success. Information Systems Research, 8(3), 240-253.
Sedera, D., Gable, G., & Chan, T. (2004). Measuring Enterprise Systems
Success: The Importance of a multiple stakeholder perspective. Paper
presented at the European Conference on Information Systems, Finland.
Sedera, D. and Tan, F., (2005). “User Satisfaction: An Overarching Measure
of Enterprise System Success,” Proceedings of the Pacific Asia Conference
on Information Systems (PACIS), Bangkok, Thailand.
Sedera, D., Gable, G., & Palmer, A. (2002, September 3-5). Enterprise
Resource Planning systems impacts: a Delphi study of Australian public
sector organisations. Paper presented at the Pacific Asian Conference on
Information Systems (PACIS '02), Tokyo, Japan.
Senge, P. (1994). The fifth discipline: the art and practice of the learning
organization (A Currency paperback. ed.). New York :: Doubleday/Currency,.
References: R-13
Exploring the Relationship of Organisational Culture to Enterprise Systems Success
Senge, P. (2004). Learn to Innovate. Executive Excellence, 21(6), 3.
Shang, S., & Seddon, P. (2002). Assessing and managing the benefits of
enterprise systems: the business manager's perspective. Information
Systems Journal, 12, 271-299.
Silvester, J., Anderson, N., & Patterson, F. (1999). Organizational culture
change: An inter-group attributional analysis. Journal of Occupational and
Organizational Psychology, 72, 1-23.
Sirkin, M. (2006). Statistics for the Social Sciences. Thousand Oaks: Sage
Publications Inc.
Smircich, L. (1983). Concepts of Culture and Organizational Analysis.
Administrative Science Quarterly, 28(3), 339.
Sousa, R., & Goodhue, D. (2003). Understanding Exploratory Use of ERP
Systems. Paper presented at the Ninth Americas Conference on Information
Systems, Tampa.
Steinar, K. (1996). Interviews: An introduction to qualitative research
interviewing. Thousand Oaks, California: Sage Publications.
Stewart, G. (2001). Emancipating IT leadership : an action research
program. Unpublished PhD, Queensland University of Technology, Brisbane.
Straub, D., Limayem, M., & Karahanna-Evaristo, E. (1995). Measuring
System Usage: Implications for IS theory testing. Management Science,
41(8), 1328-1342.
Strauss, A. (1987). Qualitative analysis for social scientists. New York:
Cambridge University Press.
Tan, C.W. and Pan, S.L., (2002). “ERP Success: The Search for a
Comprehensive Framework,” Proceedings of the 8th. Americas Conference
on Information Systems (AMCIS).
The Sweeney Group. (2000). What is CRM? Retrieved 08/04, 2004, from
http://www.sweeneygroup.com/crm.htm
References: R-14

Exploring the Relationship of Organisational Culture to Enterprise Systems Success
Trauth, E., & Jessup, L. (2000). Understanding computer mediated
discussions: positivist and interpretive analyses of group support system use.
MIS Quarterly, 24(1), 43-79.
Trice, H., & Beyer, J. (1984). Studying Organisational Cultures Through Rites
and Ceremonials. Academy of Management. The Academy of Management
Review, 9(4).
Trice, H., & Beyer, J. (1993). The Cultures of Work Organizations.
Englewood Cliffs: Prentice Hall.
Trompenaars, F. (1998.). Riding the waves of culture : understanding cultural
diversity in business (2nd ed.). New York: McGraw Hill.
Umble, E., Haft, R., & Umble, M. (2003). Enterprise resource planning:
Implementation procedures and critical success factors. European Journal of
Operational Research, 146(2), 241.
Venkatesh, V., Morris, M., Davis, G., & Davis, F. (2003). User Acceptance of
Information Technology: Toward a Unified View. MIS Quarterly, 27(2).
Von Bertalanffy, L. (1968). General Systems Theory: Foundations,
Development, Application. New York: George Braziller.
Wallace, J., Hunt, J., & Richards, C. (1999). The relationship between
organisational culture, organisational climate and managerial values. The
International Journal of Public Sector Management, 12(7), 548.
Whetten, D., & Cameron, K. (1998). Developing management skills (4th ed.
ed.). Reading, Mass. :: Addison Wesley,.
Wilkins, A., & Ouchi, W. (1983). Efficient Cultures: Exploring the Relationship
Between Culture and Organizational Performance. Administrative Science
Quarterly, 28(3), 468.
Yauch, C., & Steudel, H. (2003). Complementary use of qualitative and
quantitative cultural assessment methods. Organizational Research
Methods, 6(4), 465.
References: R-15

Exploring the Relationship of Organisational Culture to Enterprise Systems Success
References: R-16
Yeung, A., Brockbank, W. J., & Ulrich, D. (1991). Organizational Culture and
Human Resource Practices: An Empirical Assessment. Research in
Organizational Change & Development, 5, 59-81.
Yin, R. (1994). Case Study Research: Design & Methods. Thousand Oaks:
Sage.
Zviran, M., Pliskin, N. and Levin, R., (2005). “Measuring User Satisfaction
and Perceived Usefulness in the ERP Context,” Journal of Computer
Information Systems, Volume 45, Number 3, pp.43-52.

Exploring the Relationship of Organisational Culture to Enterprise Systems Success
Appendices: A-1
Table of Contents - Appendices
The following appendices are attached in support of the following chapters.
Appendices....................................................................................................................... A-1
Appendix 3.0. Authors & Ideologies.............................................................................. A-2 Appendix 3.1. Components and Instruments of Culture............................................... A-5 Appendix 3.4. Hofstede’s Dimensions .......................................................................... A-7 Appendix 3.5. Instruments Measuring Organisational Culture ................................... A-11 Appendix 3.6. Studies into Culture and Information Systems Research................... A-12 Appendix 4.1. Interview Protocols for Participants ..................................................... A-15 Appendix 4.2. Pre Interview Instruments .................................................................... A-16 Appendix 4.3. Interview Questions and Script............................................................ A-21 Appendix 4.4. Field Protocols ..................................................................................... A-23 Appendix 4.5. Confidentiality and Ethical Clearance.................................................. A-24 Appendix 4.6. Survey Questionnaire .......................................................................... A-25 Appendix 7.2. OCAI Plots per Location for Case Study ............................................. A-26 Appendix 7.3. Histograms of Survey Responses by ES Success Item...................... A-28 Appendix 7.4. Response Rate by BU & GU ............................................................... A-30 Appendix 7.5. ES Success Categories ....................................................................... A-31 Appendix 7.6. ANOVA Results ................................................................................... A-33

Exploring the Relationship of Organisational Culture to Enterprise Systems Success
Appendices: A-2
Appendix 3.0 Authors & Ideologies
A summary of some of the prominent authors and the dominant ideologies is shown
below:
Types of Organisational Cultures
Dominant Ideologies Authors
9 Point Instrument to measure ‘climate’
Structure (rules and regulations vs informality)
Responsibility (the feeling of being your own boss; not having to double check all your decisions)
Rewards (positive rewards vs punishment; perceived fairness of pay and promotion)
Risk (calculated risk vs playing it safe)
Warmth (a feeling of good fellowship and helpfulness)
Support (mutual support from above and below)
Standards (emphasis of management on high standards of excellence)
Conflict (management is not afraid of different opinions; emphasis placed on settling differences here and now)
Identity (feelings of involvement in and belonging to an organisation)
Litwin & Stringer, 1968
Type A
Type J
Type Z
Hierarchical control, high specialization, short term employment, individual responsibility
Clan Control, low specialization, life time employment, collective responsibility, collective decision making
Clan Control, moderate specialization, long term employment, individual responsibility, consensual decision making
Ouchi and Jaeger, 1978
Ouchi 1981
Process
Tough-guy-Macho
Work hard-Play hard
Bet your company
Low risk, tight hierarchy, ‘cover your ass’ mentality
High Risk, quick feedback, fluctuating structure.
Moderately low risk, race to the quick, flexible structure
Very high risk, slow feedback, clear cut hierarchy
Deal & Kennedy, 1982
Sensation-thinking
Intuition-thinking
Intuition-feeling
Sensation-feeling
Impersonal, abstract, certainty, specificity, authoritarian
Flexible, adaptive, global notions, goal driven
Caring, decentralised, flexible, no explicit rules or regulations
Personal, homelike, relationship driven, non bureaucratic
Mitroff & Kilmann, 1975
Apathetic
Caring
Exacting
Integrative
Demoralizing and cynical orientation
High concern for employees, no high performance expectations
Performance and success really count
High concern for employees with high concern for performance
Sethia & Von Gilnow, 1985

Exploring the Relationship of Organisational Culture to Enterprise Systems Success
Appendices: A-3
Types of Organisational Cultures
Dominant Ideologies Authors
Paranoid
Avoidant
Charismatic
Bureaucratic
Schizoid
Fear, distrust, suspicion
Lack of self confidence, powerlessness, inaction
Drama, power, success, abject follower ship
Compulsive, detailed, depersonalised, rigid
Politicised, social isolation
Kets de Vries & Miller, 1984
The Family
The Eiffel Tower culture
The Guided Missile culture
The Incubator culture.
A highly personal but hierarchical and power oriented culture. It displays a highly paternalistic attitude towards its employees and their welfare and gives a low priority to efficiency but a high priority to effectiveness
A highly structured culture with a bureaucratic division of labour and roles. The logic of subordination is clearly rational and coordinative and is manifested in rules.
This culture differs from the previous two in that it is egalitarian. It is also impersonal and highly task oriented. Its members tend to be intrinsically motivated by their enthusiasm for the task.
The basis of this culture is its minimal structure. Its belief being that, if organisations are to be tolerated at all, they should exist as incubators for self expression and self fulfilment.
Trompenaars, 1993
Artefacts & Symbols
Patterns of Behaviour
Values & Beliefs
Basic Assumptions
The visible products of a culture
The socially shared rules and norms/concrete actions
Which underlie these actions
About the world and how it is, which unconsciously underpin the other three levels
Cultural artefacts include:-
Physical setting and layout
Product and company literature
Press Releases
Company slogans and rituals
In House journals and manuals
The presence/absence of organisational charts
Stories, myths and other critical incidents which have become part of organisational folklore
Schein, 1985
Denison, 1990

Exploring the Relationship of Organisational Culture to Enterprise Systems Success
Appendices: A-4
Types of Organisational Cultures
Dominant Ideologies Authors
Practices
Symbols
Heroes
Rituals
Values
words, gestures, pictures and objects that carry a particular meaning
persons (real or imaginary) who possess characteristics highly prised in the culture
collective activities that are technically superfluous but are socially essential Core of Culture
broad, non specific feelings of good and evil, normal and abnormal, rational & irrational.
Within Practices Hofstede found 6 independent dimensions
P1 = Process Orientated vs Results Orientated
P2 = Employee Orientated vs Job Orientated
P3 = Parochial vs Professional
P4 = Open System vs Close System
P5 = Loose Control vs Tight Control
P6 = Normative vs Pragmatic (Customer Orientation)
Hofstede, 1990
Hierarchy Culture
Market Culture
Clan Culture
Adhocracy Culture
Formalised and structured place to work. Control fosters efficiency, timeliness and smooth functioning.
Organisation functions as a market itself, Competition fosters productivity, market share, goal achievement, external focus.
Family type organisation, participation fosters commitment, cohesion, Parent/Mentor leader type.
Temporary specialised, dynamic, innovativeness fosters new resources, cutting edge output, visionary, entrepreneurial leader type.
Utilizing the Organisational Culture Assessment instrument, six key dimensions of culture are identified. These six dimensions are
Dominant characteristics
Organisational leadership
Management of employees
Organisation glue
Strategic emphases
Criteria of success
(Quinn & Rohrbaugh, 1983)
(Cameron & Quinn, 1999)

Exploring the Relationship of Organisational Culture to Enterprise Systems Success
Appendices: A-5
Appendix 3.1 Components and Instruments of Culture
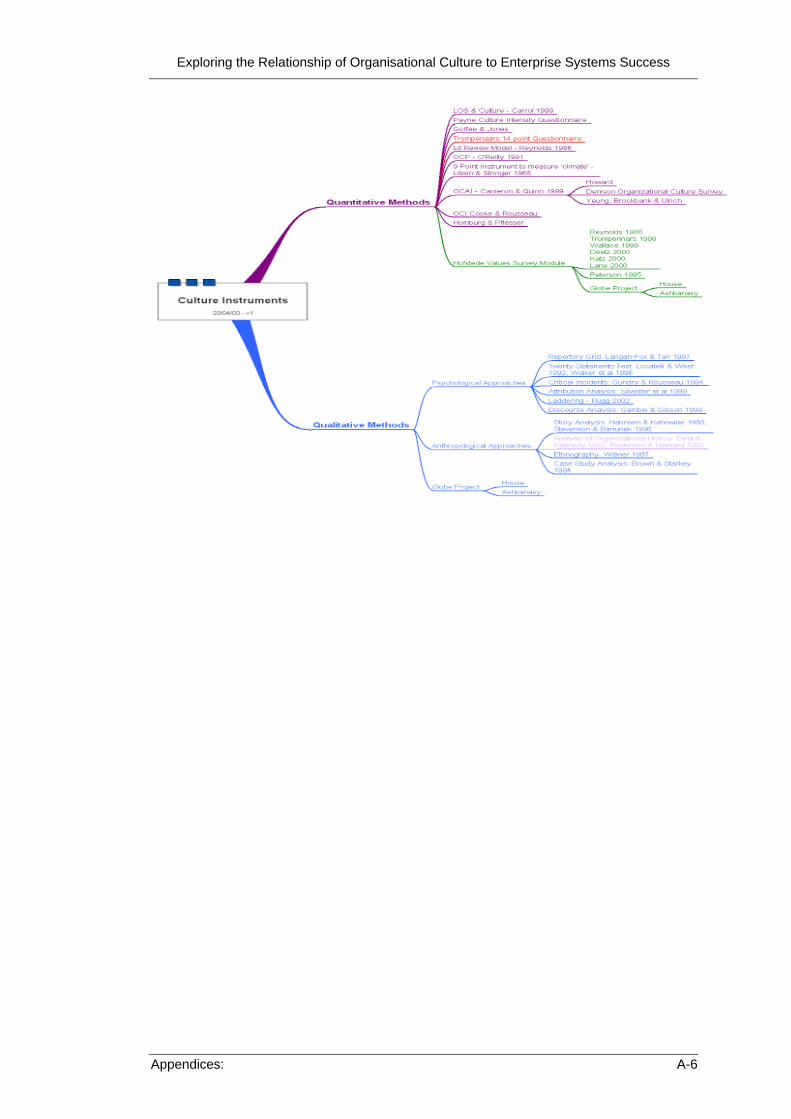
Exploring the Relationship of Organisational Culture to Enterprise Systems Success
Appendices: A-6

Exploring the Relationship of Organisational Culture to Enterprise Systems Success
Appendices: A-7
Appendix 3.4 Hofstede’s Dimensions
Many studies into Culture, in particular National Culture, have utilised either wholly
or in part research conducted by Hofstede. It is therefore worth taking a closer look
at the dimensions of culture that Hofstede discovered since they had a profound
impact on the culture studies that followed.
1. Power Distance
In the 1980 study Hofstede analysed the data collected from the questionnaires and
measured the levels of Power Distance as derived from three specific questions in
the questionnaire. This gives a Power Distance Index score for a particular country.
The PDI calculation uses mean percent values for the three questions, using mean
scores on a five point scale (1= very frequently, 5= seldom). The actual calculation
gives the country index a value range between zero (small Power distance) and 100
(large Power Distance). Hofstede argues that the PDI is a measure of values found
in an organisation or its subsidiaries and some of the scenarios for PDI differences
are shown below:-
Low PDI Countries High PDI Countries
A. Managers seen as making decisions after consulting with subordinates
B. Employees less afraid of disagreeing with their boss
C. Employees show more cooperativeness
D. Close supervision negatively evaluated by subordinates
A. Managers seen as making decisions autocratically and paternalistically
B. Employees fear to disagree with their boss
C. Employees reluctant to trust each other
D. Close supervision positively evaluated by subordinates
In conclusion, Hofstede's study showed that power distance between B and S is to
a considerable extent determined by their national culture.
2. Uncertainty Avoidance
The second dimension of culture that Hofstede found in the data was Uncertainty
Avoidance. Uncertainty about the future is a basic fact of human life, which society
tries to cope with and future proof against by having such things as laws, religion
and technology. Organisations, Hofstede argues, also try to cope with uncertainty,
but via technology, rules and rituals. Data from the study showed that the tolerance
for uncertainty varies considerably amongst subsidiaries in different countries.
Similar to the PDI, three indicators in the questionnaire were used to create an

Exploring the Relationship of Organisational Culture to Enterprise Systems Success
Appendices: A-8
index, this time to produce an Uncertainty Avoidance Index. The three questions
related to rule orientation, employment stability and stress.
Humans live with uncertainty, but perhaps more importantly are conscious of it,
extreme uncertainty creates anxiety and society has developed mechanisms to
cope with this inherent uncertainty. Different societies however, have adapted to
uncertainty in differing ways, transferred and reinforced through family, school and
state. Organisations reduce internal uncertainty by the setting rules, rituals and
regulations. Uncertainty avoiding rituals in an organisation do not make the future
more predictable rather they relieve some of the stress of the uncertainty by giving
members a sense of security.
Hofstede defines the main underlying dimension as 'the tolerance for uncertainty
(ambiguity) which can be found in individuals and which leads some individuals in
the same situation to perceive a greater need for action for overcoming the
uncertainty than others'.
Analysis from the three questions in the questionnaire that relate to rule orientation,
employment stability and stress, gives a theoretical UAI value of between -150
(lowest uncertainty avoidance i.e. all think that rules can be broken, no one wants to
stay and no one ever feels nervous) to 230 (highest uncertainty avoidance i.e. all
think that rules should not be broken, everyone wants to stay more than five years
and everyone always feels nervous). Some of the connotations of UAI differences in
the study are shown below:-
Low UAI Countries High UAI Countries
A. Greater readiness to live by the day
B. Preference for smaller organisations as employers
C. Hierarchical structures of organisations can be by-passed for pragmatic reasons
D. Conflict in organisations is natural
A. More worry about the job
B. Preference for larger organisations as employers
C. Hierarchical structures of organisations should be clear and respected
D. Conflict in organisations is undesirable
In consequence for cultures, a greater need for uncertainty avoidance should lead
to greater formalization, specialization and standardization, in lower UAI countries
managers will be less inclined to want to view the fine detail, wishing instead to
engage in more strategic activities.
3. Individualism v's Collectivism
The third dimension of culture is Individualism; this dimension describes the
relationship between the individual and the collectivity and is reflected in the way

Exploring the Relationship of Organisational Culture to Enterprise Systems Success
Appendices: A-9
that people live together in societies. High IDV countries place importance on time
for personal life whilst low IDV countries place importance on being trained by the
company, Hofstede also found that the Individualism Index is negatively correlated
to the Power Distance Index.
Whilst it is generally accepted that humans are social animals, the data suggested
that different societies show differing degrees of gregariousness. The relationship
between the individual and the collectivity in human society is linked to societal
norms and affects the structure and functioning of many organisations and
institutions in the society. Throughout much of this analysis there is a perception
that Western societies are generally more individualistic than many Eastern
cultures. Hofstede considers that the norm prevalent in a society regarding the
degree of individualism/collectivism will strongly affect the relationship between a
person and the organisation to which they belong. The level of
individualism/collectivism will influence a member’s reason for complying with the
organisational requirements.
The IDV values have a theoretical minimum of zero (high collectivism) and a max
value of 100 (high individualism). The highest IDV values were found in the USA,
Australia and UK whilst the lowest scores were found in Venezuela, Columbia and
Pakistan, mid range were Germany, Austria and Spain. IDV manifests itself in
various way, for example:-
Low IDV Countries High IDV Countries
A. Emotional dependence on the company
B. Moral involvement with the company
C. Group decisions are considered better than individual decisions
D. More importance attached to training and use of skills in jobs
A. Emotional independence from the company
B. Calculative involvement with the company
C. Individual decisions are considered better than group decisions
D. More importance attached to freedom and challenge in jobs
With regard to organisations, there are therefore consequences to having different
IDV levels. In low IDV societies members will consider the organisation as being
part of an extended family or clan to which they belong. In high IDV societies
members will expect to remain emotional independent from the organisation.
4. Masculinity vs Femininity
The fourth dimension that Hofstede identified is that of Masculinity and its opposing
value, Femininity. Hofstede argues that the duality of the sexes is fundamental to all
societies. Hofstede states that, 'the predominant socialization pattern is for men to

Exploring the Relationship of Organisational Culture to Enterprise Systems Success
Appendices: A-10
be more assertive and for women to be more nurturing. In organisations, there is a
relationship between the perceived goals of the organisation and the career
possibilities for men and women'. Hofstede bases much of his argument for this
dimension on the work of Chetwynd, who is quoted as, 'the sex role system is at the
core of our cultural norms,' (Chetwynd & Hartnett, 1978;3). Hofstede also
subscribes to a widely held belief in anthropology and psychology fields that there is
a pattern of male assertiveness and female nurturance which tends to male
dominance in many areas of politics, economy and religion.
A factor score on the 40 countries in the study, that considers masculine or feminine
gaols, was used as the basis of the Masculinity Index (MAS). The MAS measures
the extent to which respondents tend to endorse goals usually more popular
amongst men (high MAS score) or amongst women (low MAS score). Countries
with a low score (feminine) in the study were Sweden 5, Norway 8 and the
Netherlands 14 and countries with high MAS score (masculine) were Japan 95,
Austria 79 and Venezuela 73.
Low MAS Countries High MAS Countries
A. Belief in group decisions
B. Managers relatively less interested in leadership, independence and self realization
C. Lower job stress
D. Managers have a more service ideal
A. Belief in the independent decision maker
B. Managers have leadership, independence and self realization ideal
C. Higher job stress
D. Managers relatively less attracted by service role
The study confirmed that the impact of the differences in masculine /femininity in
societies can be very large and pervade all aspects of a society’s makeup.
5. Long v’s Short term orientation
The fifth dimension Hofstede found in a study among students in 23 countries
around the world, using a questionnaire designed by Chinese scholars it deals with
Virtue regardless of Truth. Values associated with Long Term Orientation are thrift
and perseverance; values associated with Short Term Orientation are respect for
tradition, fulfilling social obligations, and protecting one's 'face'. Both the positively
and the negatively rated values of this dimension are found in the teachings of
Confucius, the most influential Chinese philosopher who lived around 500 B.C.;
however, the dimension Hofstede also applies to countries without a Confucian
heritage (Hofstede, 1991).

Exploring the Relationship of Organisational Culture to Enterprise Systems Success
Appendices: A-11
Appendix 3.5. Instruments Measuring Organisational Culture
The following table is a summary of some of the instruments that have been
identified in the academic literature as purporting to measure dimensions of national
and/or Organisational Culture.
Research Approach
Date of Author Instrument Tools
Instrument
Qualitative 1982 Deal & Kennedy Co Literature Organisational History
1985 Schein Interviews Qualitative Methods
1993 Hansen & Kahnweiler Interviews & Documentation
Story Analysis
1999 Silvester Interviews Attribution Analysis
1999 Rowlinson & Hassard Interviews Organisational History
1999 Gamble & Gibson Interviews Discourse Analysis
2000 Johnson Focus Groups Focus Groups
Quantitative 1968 Litwin & Stringer Questionnaire 9 Point Instrument to
1980 Hofstede Questionnaire Values Survey Module
1983 Quinn and Rohrbaugh Questionnaire OCAI
1983 Cooke & Lafferty Questionnaire OCI
1986 Reynolds Questionnaire Four Part Questionnaire
1990 O'Reilly, Chatman & Questionnaire OCP - Organisational
1990 Denison Questionnaire Organisational Culture Survey
1990 Caldwell & Chapman Questionnaire 16 item Questionnaire
1993 Trompenaars Questionnaire 16 Item Instrument
1995 House et al Questionnaires GLOBE
1996 Goffee & Jones Questionnaire questionnaire
1999 Carroll & Harrison Simulation Model
2001 Payne questionnaire 3 dimensional framework
Triangulation 1990 Hofstede Interviews Values Survey Module
1994 Gundry & Rousseau Critical Incidents interviews
Critical Incidents
1995 Denison Questionnaire Case Study & Survey
1997 Langan-Fox & Tan Interviews Repertory Grid
2000 Homburg & Pflesser Questionnaire

Exploring the Relationship of Organisational Culture to Enterprise Systems Success
Appendices: A-12
Appendix 3.6 Studies into Culture and Information Systems Research
A few researchers over the last decade have attempted to understand the role that
culture, plays in the use of IS within organisations. The vast majority of these
studies have relied solely upon Hofstede’s national culture dimensions and have
paid little heed to other models and views of culture other than those of Hofstede.
(Myers & Tan, 2002) presented a summary of IS research that has been published
over the last decade or so involving the study of culture and IS. As already
discussed, Hofstede’s dimensions, whilst still valid and helpful in studying the
culture phenomenon, do have weaknesses. Yet researchers have still attempted to
rely upon these dimensions in their research, coupled with our thoughts on the
limitations of the Hofstede model, it brings into question the validity of research
based upon a total reliance on Hofstede’s dimensions of culture in IS research. A
summary table of research into IS is shown below:-
Authors Cultural Dimensions Explored Topics Studied
Burn, Saxena, Ma, & Cheung (1993)
Individualism, Uncertainty Avoidance, Power Distance & Masculinity
IS and Culture – top management issues in HK
Cumming & Guynes (1994) Individualism, Uncertainty Avoidance, Power Distance & Masculinity
HQ versus subsidiaries
Ein-Dor, Segev &Orgad (1993) Economic, Demographic & Socio-psychological
Effect of National Culture on IS
Garfield & Watson (1998) Uncertainty Avoidance, Power Distance
Impact of national culture on national information infrastructure
Harvey (1997) Individualism, Uncertainty Avoidance, Power Distance & Masculinity, Ethnographic approach
Comparing GIS designs and implementation between USA & Germany
Hasan & Ditsa (1999) Individualism, Uncertainty Avoidance, Power Distance, Masculinity, Time Orientation, Context, Mono/Polymorphic, Mono/Polychrony
National culture and the adoption of IT
Hill, Loch, Straub & El-Sheshai Critical approach – no predefined cultural dimensions tested
IT transfer in Arab culture
Hofstede (2000) Individualism, Uncertainty Avoidance, Power Distance, Masculinity
Effects of differences in national culture within MNC’s
Hunter & Beck (2000) Individualism, Uncertainty Avoidance, Power Distance, Masculinity
Cultural differences in the perception of the qualities of excellent systems analysts
Keil et al (2000) Uncertainty avoidance Effect of national culture on project risk propensity/perception
Keil, Mixon, Saarinem & Tuunainen (1995)
Uncertainty Avoidance Effect of national culture on escalating commitment to IT

Exploring the Relationship of Organisational Culture to Enterprise Systems Success
Appendices: A-13
projects
Lally (1994) Individualism Emerging technologies
Authors Cultural Dimensions Explored Topics Studied
Martinsons & Westwood (1997) Culture in general MIS in Chinese business culture
Mcleod et al (1997) Individualism, Uncertainty Avoidance, Power Distance
Views of CIO roles and IRM process
Mejias, Shepherd, Vogel & Lazaneo (1997)
Individualism, Uncertainty Avoidance, Power Distance, Masculinity
Perceived satisfaction and consensus levels in GSS/non GSS
Menou (1983) Objective/Subjective Impact of culture on information generation, presentation and use
Milberg, Burke, Smith & Kallman (1995)
Individualism, Uncertainty Avoidance, Power Distance
Information privacy and culture
Moores & Gregory (2000) Avoidance of Group debates and use of multiple languages
Cultural problems in applying soft systems methodology
Niederman (1997) Individualism, Uncertainty Avoidance, Power Distance
Comparing US and Mexican GSS facilitators views
Palvia & Hunter (1996) Individualism, Uncertainty Avoidance, Power Distance, Masculinity
IS Development methods
Png, Tan & Wee (Forthcoming) Uncertainty Avoidance, Power Distance
Culture and corporate adoption of IT infrastructure
Robey & Rodriguez-Dias (1989)
Culture in general MNC implementation in Latin America
Shore & Venkatachalam (1994) Power distance & Uncertainty Avoidance
Cross culture transfer of IS applications
Shore & Venkatachalam (1995) Power distance & Uncertainty Avoidance
Culture in systems analysis and design
Straub (1994) Uncertainty Avoidance & Language style
Diffusion of IT across cultures
Tan et al (1995) Power Distance GSS to dampen power distance effects
Tan, Wei, Watson, Clapper & McLean (1998)
Individualism National culture, majority influence and computer mediated communication
Tan, Wei, Watson & Walczuch (1998)
Power distance National culture, status influence and computer mediated communication
Thanasankit & Corbitt (2000) Ethnographic Approach Cultural context and its impact on requirements elicitation in Thailand
Trauth (2001) Ethnographic Approach Influences and impacts of Cultural, economic and political factors in the Republic of Ireland
Trauth & Thomas (1993) Bottom Up/top down Global EDI

Exploring the Relationship of Organisational Culture to Enterprise Systems Success
Appendices: A-14
Authors Cultural Dimensions Explored Topics Studied
Tricker (1988) Family Orientation Cross Cultural information resource management
Walczuch, Singh & Palmer (1995)
Individualism, Uncertainty Avoidance, Power Distance, Masculinity
Cultural motivations for trans border data flow legislation
Watson & Bracheau (1991) Individualism, Uncertainty Avoidance, Power Distance, Masculinity
Key issues in IS management
Watson et al (1994) Individualism & Power Distance Culture as a 4th dimension of GSS
Watson, Kelly, Galliers & Bracheau (1997)
Individualism, Uncertainty Avoidance, Power Distance, Masculinity
Concerns of IS executives across nations
IS research on national cultures (adapted from Myers & Tan (2002)

Exploring the Relationship of Organisational Culture to Enterprise Systems Success
Appendices: A-15
Appendix 4.1 Interview Protocols for Participants
Demographic Data Collected
Contact Type: Consulting Firm:
Visit: Site:
(place) Today’s Date:
Phone: Written by:
(with whom)
Demographics
IC’s Name:
Position Title
No. of Years experience as an
IC/CC/VC (yrs)
Due to ethical requirements – all data was subsequently de identified post interview
to maintain participant and organizational anonymity.

Exploring the Relationship of Organisational Culture to Enterprise Systems Success
Appendices: A-16
Appendix 4.2 Pre Interview Instruments
ES use proceeds along various stages and can be categorised along the phases
such as those shown below
Beginning Final Desired End State
Phase 1 Phase 2 Phase 3 Phase 4
Adopt
Implement
Embed
Exploit
Choice of IT Innovation
made
Rolling out the technical solution
Using the intended functionality as planned, achieving goals articulated in the business case.
Adaptation of the innovation by adapting the-
IS to the Business needs or Business needs to the IS
Extending the functionality in
innovative ways achieving strategic
value
Thinking about the above phases, consider four (4) examples of extended ES
implementations or use that you have been involved with.
These four examples should represent what you consider to be the two (2) most
successful examples of an IT innovation and the two (2) least successful examples
of the use of an IT Innovation. The example organizations should be at least two
years out from implementation and you must have been actively involved with the
organization since that time.
Summary of Criteria Selection
The innovation that you consider for your example should meet following criteria:-
Criteria Checklist Have been in regular contact
Go Live more than 2 years ago
Context of extended ES

Exploring the Relationship of Organisational Culture to Enterprise Systems Success
Appendices: A-17
The next section contains reflective questions for you to use in considering each
case. Please complete these forms and give the completed forms to the researcher
during the interview. Please do not name the organisations on which you are
reflecting.
Please add additional comments if you like and attach to the data collection form.

Exploring the Relationship of Organisational Culture to Enterprise Systems Success
Appendices: A-18
Example One: Successful ES IT Innovation
Stage of Success Reached
Adopt
Implement
Embed
Exploit
Describe the innovation that you consider successful:
Adapt
IS to business
Business to IS
Checklist
Have been in regular contact
Go Live more than 2years ago
Context of extended ES
What are the characteristics of this organization’s success with this innovation?
What elements of organizational culture have contributed to this success?
What other factors have influenced the success of the innovation?

Exploring the Relationship of Organisational Culture to Enterprise Systems Success
Appendices: A-19
Informed Consent Form (To be completed by each participant in the study)
Organizational Culture and ES Success IT Professional Services
Faculty of IT, QUT Level 5, 126 Margaret St
Brisbane, 4000 AUSTRALIA
Ph: +61 7 3864 9477 Fax: +61 7 3864 9390
Email: [email protected]
Glenn Stewart Associate Professor
Peter Birbeck Researcher
Statement of Consent
By signing below, you are indicating that you:
• have read and understood the information sheet about this project;
• have had any questions answered to your satisfaction;
• understand that if you have any additional questions you can contact the research team;
• understand that you are free to withdraw at any time, without comment or penalty;
• understand that you can contact the research team if you have any questions about the project, or the Research Ethics Officer on 3864 2340 if you have concerns about the ethical conduct of the project; and
• Agree to participate in the project.
Name
Signature
Date / /

Exploring the Relationship of Organisational Culture to Enterprise Systems Success
Appendices: A-20

Exploring the Relationship of Organisational Culture to Enterprise Systems Success
Appendices: A-21
Appendix 4.3 Interview Questions and Script
The interview will be between 45 mins to 60 mins duration and seeks to gain
answers to the following questions:-
How do you recognise a successful IT Innovation?
Topic: View of Success
Describe an ES innovation that worked well
Describe the organization that has incorporated this innovation
What was their principle measurement of the success of the system?
With this organization in mind, describe its culture
Describe the relationship between organizational culture and the innovation
you have given.
How has Organizational Culture influenced the success of the ES innovation
Topic: View of Least successful
Describe an ES innovation that did not work well
Describe the organization that has incorporated this innovation
What was their principle measurement of the success of the system?
With this organization in mind, describe its culture
Describe the relationship between organizational culture and the innovation
you have given.
Topic: Heterogeneous Example
Many organizations typically have culturally diverse groups. Within the
organizations you have dealt with can you describe such culturally diverse groups?
Have you noticed any of these groups within these organisations using the
Innovation successfully whilst other groups of the organization are using the
Innovation unsuccessfully? Please describe a specific incident that demonstrates
any variation.
Topic: Concluding
What factors do you think might have led have led to differences in
successful utilisation of the target innovation?

Exploring the Relationship of Organisational Culture to Enterprise Systems Success
Appendices: A-22
What role do you think organizational cultural differences play in successful
use of an ICT innovation?
Which other organizational factors do you think have influenced the
successful/unsuccessful adoption of these IT innovations?
Describe the perfect supportive organizational culture for achieving success
with ICT innovations.

Exploring the Relationship of Organisational Culture to Enterprise Systems Success
Appendices: A-23
Appendix 4.4 Field Protocols
Field Procedures 1.1. Initial Scheduling of Field Visits
The pilot field study took place during September/October 2004. The
remaining fourteen interviews were completed during 2005.
1.2. Determination of Organizations to Participate in the Study The study was exploratory in nature. In order to capture as many of
the experiences of the OC-ESS relationship as possible, it was
identified that the Consultant groups should be drawn from as wide a
base of experience as possible. Interviewing experienced consultants
with very broad industry experience, across a range of ES innovations
with differing degrees of ES success provided the greatest breadth of
opportunity to explore the OC-ESS relationship.
Approaches were therefore made to larger consulting firms, client
organizations and vendor firms, practising in cross industry
environments. Large international consulting firms have wide
experiences of successful/less successful ES in a range of industries;
large client organizations have experience of ES operating across
different business units.
1.3. Approaches to Target Organizations Letters of introduction were sent out to the selected consulting firms
during August 2004, with a view to making telephone contact leading
to face to face interviews.
1.4. Number of Consultants to be interviewed Min 15; Max 20
Initial pilot of six interviews, after which the protocol was revised and
small changes made prior to the second full round of interviews in
2005.
1.5. Length of interview time required with Consultants Up to 60mins

Exploring the Relationship of Organisational Culture to Enterprise Systems Success
Appendices: A-24
Appendix 4.5 Confidentiality and Ethical Clearance
Statement given to research participants Confidentiality
Only the research team will have access to the information that you provide. The interview tapes will
be transcribed and any identifiers to yourself, your firm and the example organizations that we discuss
in the interview will be removed. Once the interview tapes have been transcribed, the tapes
themselves will be destroyed.
Your anonymity and confidentiality will be further safeguarded in any publication of the results of this
research, through the use of pseudonyms and aliases. The survey instruments do not collect any
personally identifiable information.
Personal Information
Storage - In light of the above, no personal information will be stored after the study has been
completed. During the study information will be stored in a secure location at QUT’s Centre for
Information Technology Innovation.
Publication & Reporting of Results - Participants will not be identifiable in any publication of results, or
the reporting of results to a third party.
Information Category - De-identified (not re-identifiable, anonymous) - The research results, and in
particular the interview transcripts, will be subject to a process of de-identification in order to protect
your identity, your firm for which you work and the examples that are discussed during the interview.
Voluntary participation Your participation in the project is totally voluntary and any subsequent decision to withdraw from the
project will involve no penalty or loss of benefits to which you would otherwise be entitled. You may
discontinue participation at any time without comment or penalty.
Inducements In order to express our thanks for participating in this research we will provide to each consultant 6
mixed wines as a gift for completing the interviews, surveys and instruments.
Questions/Further information If you have any question, queries or require further information regarding any aspect of the research
please contact the researchers on:
Dr Glenn Stewart Associate Professor QUT Centre for Information Technology Innovation Faculty of Information Technology Phone: 07 3864 9480 Mobile 0417 761 501 Email: [email protected]
Peter Birbeck Researcher QUT Centre for Information Technology Innovation Faculty of Information Technology Phone: 07 3864 9477 Mobile 0412 513 261 Email: [email protected]
Concerns/ComplaintsThis research protocol has been approved by the QUT University Research
Ethics Committee. Any concerns regarding this study can be directed to the University Research
Ethics Officer, Wendy Heffernan at (07) 3864 2340, [email protected].

Exploring the Relationship of Organisational Culture to Enterprise Systems Success
Appendices: A-25
Appendix 4.6 Survey Questionnaire

Exploring the Relationship of Organisational Culture to Enterprise Systems Success
Appendices: A-26
Appendix 7.2 OCAI Plots per Location for Case Study

Exploring the Relationship of Organisational Culture to Enterprise Systems Success
Appendices: A-27

Exploring the Relationship of Organisational Culture to Enterprise Systems Success
Appendices: A-28
Appendix 7.3 Histograms of Survey Responses by ES Success Item
1 2 3 4 5 6 70
2
4
6
8
10
12
Freq
uenc
y
Mean = 5.42Std. Dev. = 0.886N = 25
II across All Responses
Strongly Disagree Neutral StronglyAgree
1 2 3 4 5 6 70
3
6
9
12
15
Freq
uenc
y
Mean = 4.9076Std. Dev. = 0.65303N = 23
OI across All Responses
Strongly Disagree Neutral StronglyAgree

Exploring the Relationship of Organisational Culture to Enterprise Systems Success
Appendices: A-29
1.00 2.00 3.00 4.00 5.00 6.00 7.000
2
4
6
8
10
12
14
Freq
uenc
y
Mean = 4.9679Std. Dev. = 1.42441N = 26
IQ Across All Respondents
Strongly Disagree Neutral StronglyAgree
1 2 3 4 5 6 70
2
4
6
8
10
Freq
uenc
y
Mean = 4.9324Std. Dev. = 1.01213N = 23
SQ Across All Responses
Strongly Disagree Neutral StronglyAgree

Exploring the Relationship of Organisational Culture to Enterprise Systems Success
Appendices: A-30
Appendix 7.4 Response Rate by BU & GU
The overall response rates by Business Unit and by Geographic Unit are shown in
the tables below.
By Business Unit Frequency
(f)
By Geographic
Unit
Frequency
(f)
IT 2 Koroit 1
Operations 13 Maffra 1
Shipping 3 Rochester 2
Finance 6 Leongatha 5
Sales & Marketing 3 Cobram 7
Head Office 11
Sum (∑) 27 Sum (∑) 27
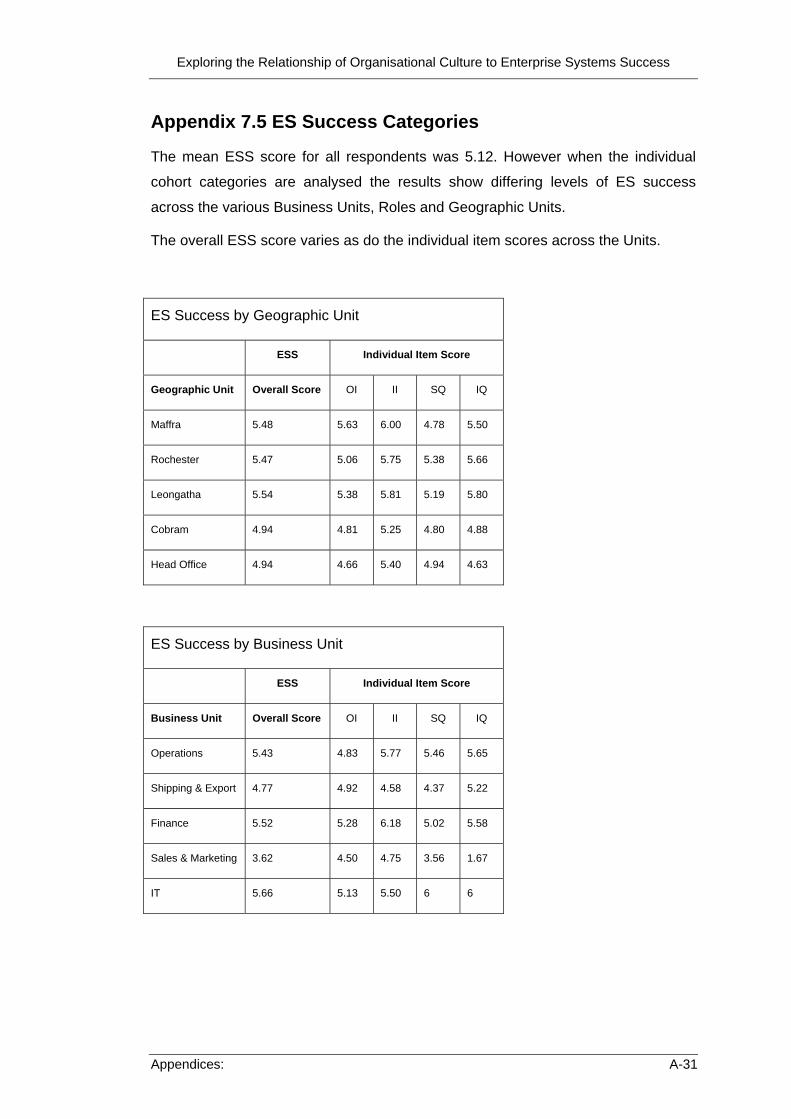
Exploring the Relationship of Organisational Culture to Enterprise Systems Success
Appendices: A-31
Appendix 7.5 ES Success Categories
The mean ESS score for all respondents was 5.12. However when the individual
cohort categories are analysed the results show differing levels of ES success
across the various Business Units, Roles and Geographic Units.
The overall ESS score varies as do the individual item scores across the Units.
ES Success by Geographic Unit
ESS Individual Item Score
Geographic Unit Overall Score OI II SQ IQ
Maffra 5.48 5.63 6.00 4.78 5.50
Rochester 5.47 5.06 5.75 5.38 5.66
Leongatha 5.54 5.38 5.81 5.19 5.80
Cobram 4.94 4.81 5.25 4.80 4.88
Head Office 4.94 4.66 5.40 4.94 4.63
ES Success by Business Unit
ESS Individual Item Score
Business Unit Overall Score OI II SQ IQ
Operations 5.43 4.83 5.77 5.46 5.65
Shipping & Export 4.77 4.92 4.58 4.37 5.22
Finance 5.52 5.28 6.18 5.02 5.58
Sales & Marketing 3.62 4.50 4.75 3.56 1.67
IT 5.66 5.13 5.50 6 6

Exploring the Relationship of Organisational Culture to Enterprise Systems Success
Appendices: A-32
ES Success by Role
ESS Individual Item Score
Role Overall Score OI II SQ IQ
Strategic/Senior
Manager
5.80 5.44 6.38 5.39 6
Middle Manager 5.20 4.98 5.53 4.97 5.29
Operational Staff 4.93 4.76 5.34 4.95 4.68
ES Success by SAP/R3 Modules Used
ESS Individual Item Score
Business Unit Overall Score OI II SQ IQ
All 5.66 4.25 6.25 6.05 6.08
MM 5.10 5.01 5.58 5.02 4.83
SD 4.82 5.12 5.88 4.70 4.24
PP-PI 5.22 5.23 5.33 5.11 5.22
PM 5.60 5.25 5.50 6 6
FI-CO 5.38 5.19 5.95 5.20 5.20

Exploring the Relationship of Organisational Culture to Enterprise Systems Success
Appendices: A-33
Appendix 7.6 ANOVA Results
ANOVA Clan on ESS overall
ANOVA(b)
Model Sum of
Squares df Mean Square F Sig. Regression 1.703 1 1.703 2.951 .104(a)
Residual 9.810 17 .577
1
Total 11.513 18 a Predictors: (Constant), ACweight b Dependent Variable: BAllmean
ANOVA Adhocracy on ESS overall
ANOVA(b)
Model Sum of
Squares df Mean Square F Sig. Regression .497 1 .497 .768 .393(a)
Residual 11.015 17 .648
1
Total 11.513 18 a Predictors: (Constant), AAweight b Dependent Variable: BAllmean
ANOVA Market on ESS overall
ANOVA(b)
Model Sum of
Squares df Mean Square F Sig. Regression 2.799 1 2.799 5.460 .032(a)
Residual 8.714 17 .513
1
Total 11.513 18 a Predictors: (Constant), AMweight b Dependent Variable: BAllmean

Exploring the Relationship of Organisational Culture to Enterprise Systems Success
Appendices: A-34
ANOVA Hierarchy on ESS overall
ANOVA(b)
Model Sum of
Squares df Mean Square F Sig. Regression .043 1 .043 .064 .804(a)
Residual 11.470 17 .675
1
Total 11.513 18 a Predictors: (Constant), AHweight b Dependent Variable: BAllmean