québec electricity, clean energy par excellence · ghg emission rate according to a study by...
TRANSCRIPT

QUÉBEC ELECTRICITY, CLEAN ENERGY PAR EXCELLENCE
Comparison of Power Generation Options
Comparison of Electricity Mixes
Third Party Expertise

Comparison of Power Generation Options
HYDRO-QUÉBEC, NORTH AMERICAN LEADER IN THE FIGHT AGAINST CLIMATE CHANGE
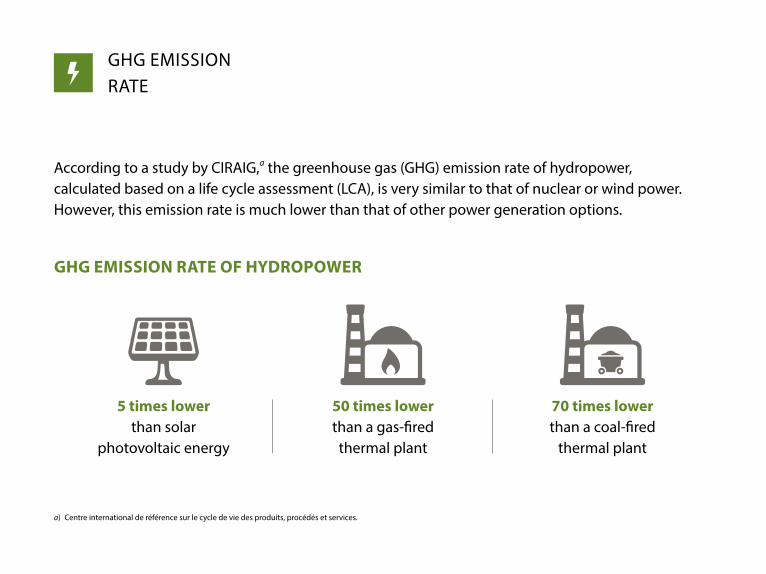
GHG EMISSION RATE
According to a study by CIRAIG,a the greenhouse gas (GHG) emission rate of hydropower, calculated based on a life cycle assessment (LCA), is very similar to that of nuclear or wind power. However, this emission rate is much lower than that of other power generation options.
a) Centre international de référence sur le cycle de vie des produits, procédés et services.
GHG EMISSION RATE OF HYDROPOWER
5 times lowerthan solar
photovoltaic energy
50 times lowerthan a gas-firedthermal plant
70 times lowerthan a coal-fired
thermal plant
HYDRO-QUÉBEC, NORTH AMERICAN LEADER IN THE FIGHT AGAINST CLIMATE CHANGE

GHG EMISSION RATE
GHG EMISSIONS – POWER GENERATION OPTIONS BASED ON LCA (g CO2 eq./kWh)
Hydropower –run-of-river
Hydropower –reservoirb
Nuclear
Continuous-output option
Intermittent-output option
a) Hydro-Québec’s results.
b) Reservoir hydropower differs from run-of-river hydropower with respect to GHG emissions. After it is impounded, a reservoir releases GHG emissions, the emission rate diminishing gradually over the following ten years. This is why GHG emission rates are higher for reservoir hydropower than for run-of-river hydropower.
Wind Solar photovoltaïc
Thermal – natural gas
Thermal – oil
Thermal – coal
317=
316=
216=
24=7=7=4=3=
64
620
878 879
17a1486a

HYDROPOWER, THE CLEANEST OPTION
HYDROPOWER HAS THE SMALLEST ENVIRONMENTAL IMPACTHydropower ranks number one among generation options based on the following environmental indicators. It has been also ranked as second for the resource use indicator.
Acidification
Eutrophication
Climate change
Ozone layer depletion
Photochemical oxidation (smog)
Human toxicity
Comparison of Electricity Mixes
QUÉBEC’S ELECTRICITY MIX: 97% RENEWABLE ENERGY

QUÉBEC’S ELECTRICITY MIX
The electricity mix is the energy generated by all electricity generating stations in operation, including purchases from independent producers and imports from neighboring systems.
According to the CIRAIG study, Québec’s electricity mix contributes the least to climate change and has the smallest impact on human health and ecosystem quality.
QUÉBEC’S ELECTRICITY GHG EMISSION RATE
25 times lowerthan Denmark’s mix
30 times lowerthan Germany’s mix
35 times lowerthan the U.S. mix
55 times lowerthan China’s mix

GHG EMISSION RATE
QC
MB
BC NL
ON NB
Nor
way
Swed
en
Fran
ce
Braz
il
Finl
and
Spai
n
Den
mar
k
Port
ugal
Ger
man
y
Mex
ico
Russ
ia
U.S
.A.
Chin
a
Indi
a
Provinces Countries25 68 11
7 288 40
6 491
529 59
3 671 73
2
757
783
1,19
2
450=
348=
220=
205=
212=
185=
212=
102=
45=42=12=8= 160=
142=
132=
105=
70=
18=8=3=
1,53
8
22 31
129
139 33
7
684
GHG EMISSIONS – ELECTRICITY MIX BY PROVINCE AND COUNTRY (g CO2 eq./kWh)
Value shown corresponds to the generation, purchase, import, transmission and distribution of electric power.

GHG EMISSION RATE
Hydro-Québec New YorkVermont New Hampshire
Connecticut Maine Massachusetts Rhode Island
365=
300=
192=
192=
192=
188=
20=12=
3419
374374371 375
589
713
GHG EMISSIONS – HYDRO-QUÉBEC AND SELECTED U.S. STATES (g CO2 eq./kWh)
Value shown corresponds to the generation and transmission of electric power.

QUÉBEC ELECTRICITY, AMONG THE BEST!
QUÉBEC’S ELECTRICITY MIX – 2012 PRIMARY ENERGY BREAKDOWN (%)
The electricity distributed in Québec:• 80% is generated by Hydro-Québec, mainly
by its hydroelectric generating stations
• 20% is purchased from Québec independent power producers (small hydropower plants or wind, biomass or biogas power) or imported from other Canadian provinces or the U.S. Northeast.
Hydropower95.33%
Thermal – fossilOil 0.03%
Natural gas 0.21%
Coal 0.30%
Nuclear 2.62%
Wind 0.88%
Thermal – renewableBiogas 0.09%
Biomass 0.53%

Third Party Expertise
MANDATE ENTRUSTED TO CIRAIGHydro-Québec asked CIRAIG, a world-renowned centre of expertise in life cycle assessments, to compare different power generation options and the electricity mixes in different parts of the world. CIRAIG based the comparison on life cycle assessments and published a report of the study in 2014 titled Comparaison des filières de production d’électricité et des bouquets d’énergie électriquea (in French only).
a) http://www.hydroquebec.com/developpement-durable/centre-documentation/acv-comparaison-filiere-production-electricite.html
LIFE CYCLE ASSESSMENTA life cycle assessment determines and quantifies the environmental impacts of a product, process or service over its entire life cycle.
Manufacturing/production
Transportation/distribution
Use/consumption
End-of-life/recycling
Resource extraction

© Hydro-Québec Affaires corporatives et secrétariat général
Reproduction authorized with reference to source
Legal deposit – 4th quarter 2015 Bibliothèque et Archives nationales du Québec ISBN 978-2-550-74448-1 ISBN 978-2-550-74449-8 (PDF)
2015G246A
Ce document est également publié en français.
This is a translation of the original French text.