quarterly report q2 2017 - philips · quarterly report. business segments the 6% comparable sales...
TRANSCRIPT
Philips reports Q2 sales of EUR 4.3 billion, with 4% comparable sales growth;net income from continuing operations amounted to EUR 161 million, driven bya 15% increase in Adjusted EBITA to EUR 439 million
Amsterdam, July 24, 2017
Second-quarter highlights
• Sales increased to EUR 4.3 billion, with comparable sales growth of 4%; comparable order intakeincreased 8% compared to Q2 2016
• Net income from continuing operations amounted to EUR 161 million, compared to EUR 118 millionin Q2 2016
• Adjusted EBITA improved 15% to EUR 439 million, or 10.2% of sales, compared to EUR 383 million,or 9.3% of sales, in Q2 2016
• Income from operations (EBIT) amounted to EUR 252 million, or 5.9% of sales, compared to EUR265 million, or 6.4% of sales, in Q2 2016
• Operating cash flow totaled EUR 73 million, compared to EUR 177 million in Q2 2016• EUR 1.5 billion share buyback program to start in the third quarter of 2017• As of Q2 2017, Philips presents the results of Philips Lighting as a discontinued operation
Frans van Houten, CEO:
“Philips’ performance in the second quarter of 2017 was solid, with 4% comparable sales growth in our HealthTech portfolio driven byWestern Europe, North America and China, and a strong 8% increase in our order intake. We achieved a 90-basis-point increase inthe Adjusted EBITA margin, driven by higher volumes, operational improvements and cost productivity.
Our Personal Health businesses delivered another strong quarter, with 6% comparable sales growth and a 120-basis-pointimprovement in the Adjusted EBITA margin. In a soft market, our Diagnosis & Treatment businesses showed a robust 3% comparablesales growth, strong order intake growth and an 80-basis-point operational improvement. Our Connected Care & Health Informaticsbusinesses recorded a 90-basis-point increase in the Adjusted EBITA margin, and I am confident that the performance of thesebusinesses will continue to improve in the second half of the year, based on the strength of their order book.
In the second quarter, we extended our portfolio with targeted acquisitions that we identified in the past two years. For example, tostrengthen the leading position of our Image-Guided Therapy business and expand its portfolio of therapy devices, we signed anagreement to acquire Spectranetics, a leader in vascular intervention and lead management solutions. We also acquiredCardioProlific, a US-based start-up company that develops catheter-based thrombectomy technology to treat peripheral vasculardisease. I am also pleased with the progress of several of our organic growth initiatives, such as the FDA clearance of ourcomprehensive Digital Pathology solution for primary diagnostic use in the US. Furthermore, we completed the Lumileds transactionand reduced our stake in Philips Lighting to 41.16% net.
In line with our Capital Allocation policy, which aims at a balanced mix of investments in organic and inorganic growthopportunities, actions to drive balance sheet efficiency and returns to shareholders, we also announced a new EUR 1.5 billion sharebuyback program to be launched in the third quarter of 2017. This program will more than offset the share dilution in connectionwith Philips’ long-term incentive programs and dividend in shares.
Despite continued volatility in the markets in which we operate, our outlook for 2017 remains unchanged as we expect furtheroperational improvements and comparable sales growth in the year to be back-end loaded, supported by a strong order book. Weare on track to deliver 4-6% comparable sales growth and an improvement in Adjusted EBITA margin of around 100 basis points peryear.”
Q2 2017Quarterly report

Business segmentsThe 6% comparable sales growth of the Personal Health businesses was driven by double-digit growth in Health & Wellness, high-single-digit growth in Personal Care and mid-single-digit growth in Sleep & Respiratory Care; the Adjusted EBITA margin improvedby 120 basis points. The 3% comparable sales growth of the Diagnosis & Treatment businesses was driven by mid-single-digit growthin Ultrasound and Image-Guided Therapy, while the Adjusted EBITA margin improved by 80 basis points. Comparable order intakeincreased by 7%, with all business groups contributing. In the Connected Care & Health Informatics businesses, comparable salesincreased by 1%, reflecting low-single-digit growth in Patient Care & Monitoring Solutions. The Adjusted EBITA margin was 90 basispoints higher than in the same period last year. Comparable order intake increased by 8%.
Philips’ ongoing focus on innovation through organic and inorganic growth initiatives resulted in the following highlights in thequarter:
• Building on its portfolio of long-term strategic partnerships, Philips signed multiple new agreements in the quarter. For example,Philips has partnered with the Singapore Institute of Advanced Medicine Holdings to provide its new oncology center with arange of Philips’ advanced diagnostic imaging systems, combined with clinical informatics and services for a multi-year term.Philips also signed a new 10-year Managed Equipment Services agreement for patient monitoring solutions with Le Confluent,one of the top three private hospitals in France for cardiovascular care.
• Demonstrating further progress on advanced data analytics, Philips received FDA clearance for its IntelliSpace Portal 9.0 and arange of innovative applications for radiology. The platform gives clinicians a comprehensive view of each patient, helping themto diagnose conditions. Further highlighting its leadership in health informatics, Philips signed several multi-year agreements withhospitals in the US to provide them with enterprise imaging informatics solutions.
• Philips’ IntelliSite Pathology Solution is currently the only digital pathology solution in the US to receive FDA clearance forprimary diagnostic use. This achievement reinforces Philips’ leadership in digital pathology, a solution that is central to thediagnosis of complex diseases such as cancer.
• Building on its leadership in power toothbrushes, the Philips Sonicare DiamondClean Smart pilot with top Chinese online retailerJD.com reached a 94% rating (out of a full score of 100%), with consumers highlighting the benefits of the coaching app and thepremium design.
• Strengthening its Personal Health businesses, Philips acquired UK-based Health & Parenting, a leading developer of mobileapplications for expectant and new parents, used by one in two expectant mothers in the UK. The company also signed anagreement to acquire Respiratory Technologies, a US-based provider of an innovative airway clearance solution for patients withchronic respiratory conditions.
• To further strengthen its Diagnosis & Treatment businesses, Philips signed an agreement to acquire Spectranetics. Its highlycomplementary portfolio, including laser atherectomy catheters, the AngioSculptX drug-coated scoring balloon and the Stellarexdrug-coated balloon, will support Philips’ expansion in image-guided therapy devices. Furthermore, to reinforce its leadershipposition in ultrasound, Philips acquired TomTec Imaging Systems, a leading provider of clinical applications and intelligent image-analysis software.
Cost savings
In the second quarter, procurement savings amounted to EUR 61 million. Other productivity programs resulted in savings of EUR 48million.
Capital Allocation
As announced on June 28, 2017, Philips will launch a share buyback program for an amount of EUR 1.5 billion in the third quarter of2017, to be completed in two years. As the program will be initiated for capital reduction purposes, Philips intends to cancel all of theshares acquired under the program. Philips intends to execute part of the program through a series of individual forwardtransactions, unevenly distributed over the two-year period.
In July 2017, Philips made a contribution of USD 250 million to the Philips US pension fund to further improve the funding ratio. Thiswill further decrease Philips’ interest costs going forward.
Miscellaneous
As previously reported, Philips continues to be in discussions on a civil matter with the US Department of Justice representing theFDA, arising from past inspections by the FDA in and prior to 2015, focusing primarily on the external defibrillator business in the US.
Philips Lighting
On April 25, 2017, Philips sold 22.25 million shares in Philips Lighting, of which 3.5 million shares were acquired by Philips Lightingand were cancelled. Philips’ shareholding in Philips Lighting decreased to 40.97% of Philips Lighting’s issued and outstanding share
Quarterly report 2017 - Q2 2

capital, down from 55.18% prior to the transaction. In addition, in Q2 2017, Philips Lighting acquired 0.65 million of its own shares inconnection with its long-term incentive programs. As of June 30, 2017, Philips’ shareholding in Philips Lighting was 41.16% of theissued and outstanding share capital. Philips continues to consolidate Philips Lighting under International Financial ReportingStandards (IFRS). As loss of control is highly probable within one year due to further sell-downs, Philips Lighting is presented as adiscontinued operation in the financial statements of Philips as of the second quarter of 2017. Full details about the financialperformance of Philips Lighting in the second quarter were published on July 21, 2017. The related report can be accessed here.
Conference call and audio webcast
Frans van Houten, CEO, and Abhijit Bhattacharya, CFO, will host a conference call for investors and analysts at 10:00 am CET todayto discuss the results. A live audio webcast of the conference call will be available on the Philips Investor Relations website and canbe accessed here.
4 Quarterly report Q2 2017
Philips Group performance
Key data in millions of EUR unless otherwise stated
Q2 2016 Q2 2017
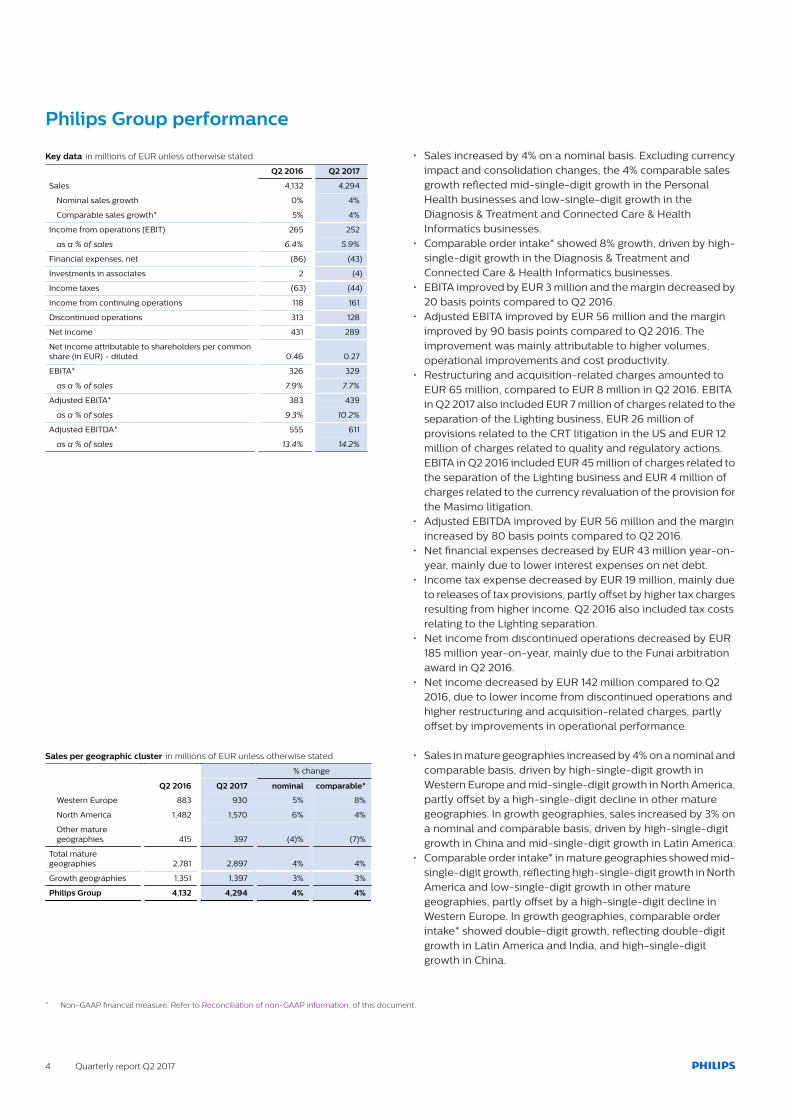
Sales 4,132 4,294
Nominal sales growth 0% 4%
Comparable sales growth* 5% 4%
Income from operations (EBIT) 265 252
as a % of sales 6.4% 5.9%
Financial expenses, net (86) (43)
Investments in associates 2 (4)
Income taxes (63) (44)
Income from continuing operations 118 161
Discontinued operations 313 128
Net income 431 289
Net income attributable to shareholders per commonshare (in EUR) - diluted 0.46 0.27
EBITA* 326 329
as a % of sales 7.9% 7.7%
Adjusted EBITA* 383 439
as a % of sales 9.3% 10.2%
Adjusted EBITDA* 555 611
as a % of sales 13.4% 14.2%
• Sales increased by 4% on a nominal basis. Excluding currencyimpact and consolidation changes, the 4% comparable salesgrowth reflected mid-single-digit growth in the PersonalHealth businesses and low-single-digit growth in theDiagnosis & Treatment and Connected Care & HealthInformatics businesses.
• Comparable order intake* showed 8% growth, driven by high-single-digit growth in the Diagnosis & Treatment andConnected Care & Health Informatics businesses.
• EBITA improved by EUR 3 million and the margin decreased by20 basis points compared to Q2 2016.
• Adjusted EBITA improved by EUR 56 million and the marginimproved by 90 basis points compared to Q2 2016. Theimprovement was mainly attributable to higher volumes,operational improvements and cost productivity.
• Restructuring and acquisition-related charges amounted toEUR 65 million, compared to EUR 8 million in Q2 2016. EBITAin Q2 2017 also included EUR 7 million of charges related to theseparation of the Lighting business, EUR 26 million ofprovisions related to the CRT litigation in the US and EUR 12million of charges related to quality and regulatory actions.EBITA in Q2 2016 included EUR 45 million of charges related tothe separation of the Lighting business and EUR 4 million ofcharges related to the currency revaluation of the provision forthe Masimo litigation.
• Adjusted EBITDA improved by EUR 56 million and the marginincreased by 80 basis points compared to Q2 2016.
• Net financial expenses decreased by EUR 43 million year-on-year, mainly due to lower interest expenses on net debt.
• Income tax expense decreased by EUR 19 million, mainly dueto releases of tax provisions, partly offset by higher tax chargesresulting from higher income. Q2 2016 also included tax costsrelating to the Lighting separation.
• Net income from discontinued operations decreased by EUR185 million year-on-year, mainly due to the Funai arbitrationaward in Q2 2016.
• Net income decreased by EUR 142 million compared to Q22016, due to lower income from discontinued operations andhigher restructuring and acquisition-related charges, partlyoffset by improvements in operational performance.
Sales per geographic cluster in millions of EUR unless otherwise stated
% change
Q2 2016 Q2 2017 nominal comparable*
Western Europe 883 930 5% 8%
North America 1,482 1,570 6% 4%
Other maturegeographies 415 397 (4)% (7)%
Total maturegeographies 2,781 2,897 4% 4%
Growth geographies 1,351 1,397 3% 3%
Philips Group 4,132 4,294 4% 4%
• Sales in mature geographies increased by 4% on a nominal andcomparable basis, driven by high-single-digit growth inWestern Europe and mid-single-digit growth in North America,partly offset by a high-single-digit decline in other maturegeographies. In growth geographies, sales increased by 3% ona nominal and comparable basis, driven by high-single-digitgrowth in China and mid-single-digit growth in Latin America.
• Comparable order intake* in mature geographies showed mid-single-digit growth, reflecting high-single-digit growth in NorthAmerica and low-single-digit growth in other maturegeographies, partly offset by a high-single-digit decline inWestern Europe. In growth geographies, comparable orderintake* showed double-digit growth, reflecting double-digitgrowth in Latin America and India, and high-single-digitgrowth in China.
* Non-GAAP financial measure. Refer to Reconciliation of non-GAAP information, of this document.
Quarterly report Q2 2017 5
Cash balance
Q2 2016 Q2 2017
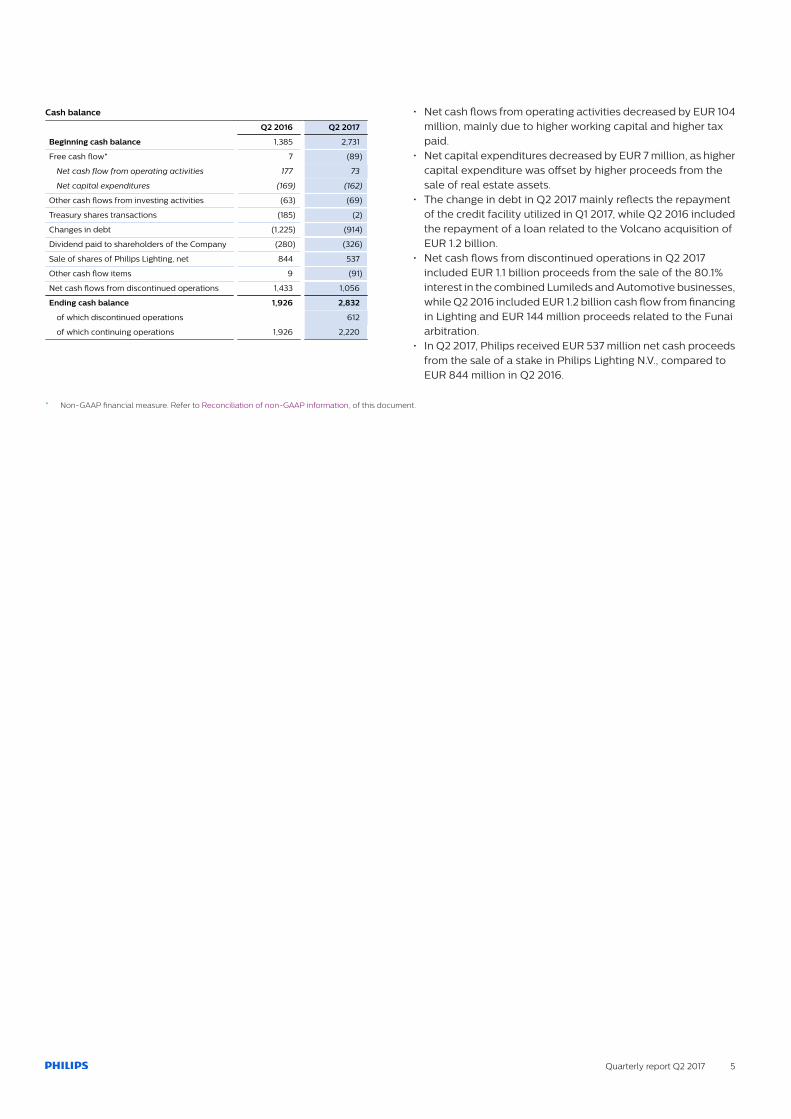
Beginning cash balance 1,385 2,731
Free cash flow* 7 (89)
Net cash flow from operating activities 177 73
Net capital expenditures (169) (162)
Other cash flows from investing activities (63) (69)
Treasury shares transactions (185) (2)
Changes in debt (1,225) (914)
Dividend paid to shareholders of the Company (280) (326)
Sale of shares of Philips Lighting, net 844 537
Other cash flow items 9 (91)
Net cash flows from discontinued operations 1,433 1,056
Ending cash balance 1,926 2,832
of which discontinued operations 612
of which continuing operations 1,926 2,220
• Net cash flows from operating activities decreased by EUR 104million, mainly due to higher working capital and higher taxpaid.
• Net capital expenditures decreased by EUR 7 million, as highercapital expenditure was offset by higher proceeds from thesale of real estate assets.
• The change in debt in Q2 2017 mainly reflects the repaymentof the credit facility utilized in Q1 2017, while Q2 2016 includedthe repayment of a loan related to the Volcano acquisition ofEUR 1.2 billion.
• Net cash flows from discontinued operations in Q2 2017included EUR 1.1 billion proceeds from the sale of the 80.1%interest in the combined Lumileds and Automotive businesses,while Q2 2016 included EUR 1.2 billion cash flow from financingin Lighting and EUR 144 million proceeds related to the Funaiarbitration.
• In Q2 2017, Philips received EUR 537 million net cash proceedsfrom the sale of a stake in Philips Lighting N.V., compared toEUR 844 million in Q2 2016.
* Non-GAAP financial measure. Refer to Reconciliation of non-GAAP information, of this document.
6 Quarterly report Q2 2017
Performance per segment
Personal Health businessesKey data in millions of EUR unless otherwise stated
Q2 2016 Q2 2017
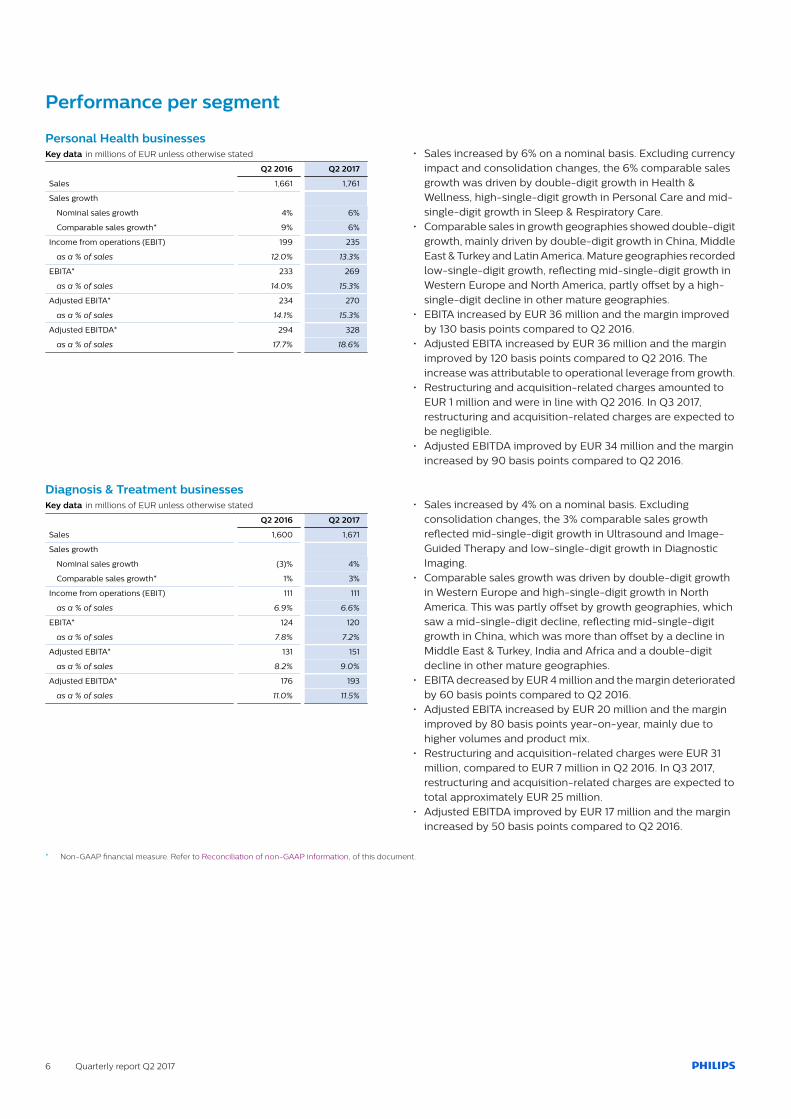
Sales 1,661 1,761
Sales growth
Nominal sales growth 4% 6%
Comparable sales growth* 9% 6%
Income from operations (EBIT) 199 235
as a % of sales 12.0% 13.3%
EBITA* 233 269
as a % of sales 14.0% 15.3%
Adjusted EBITA* 234 270
as a % of sales 14.1% 15.3%
Adjusted EBITDA* 294 328
as a % of sales 17.7% 18.6%
• Sales increased by 6% on a nominal basis. Excluding currencyimpact and consolidation changes, the 6% comparable salesgrowth was driven by double-digit growth in Health &Wellness, high-single-digit growth in Personal Care and mid-single-digit growth in Sleep & Respiratory Care.
• Comparable sales in growth geographies showed double-digitgrowth, mainly driven by double-digit growth in China, MiddleEast & Turkey and Latin America. Mature geographies recordedlow-single-digit growth, reflecting mid-single-digit growth inWestern Europe and North America, partly offset by a high-single-digit decline in other mature geographies.
• EBITA increased by EUR 36 million and the margin improvedby 130 basis points compared to Q2 2016.
• Adjusted EBITA increased by EUR 36 million and the marginimproved by 120 basis points compared to Q2 2016. Theincrease was attributable to operational leverage from growth.
• Restructuring and acquisition-related charges amounted toEUR 1 million and were in line with Q2 2016. In Q3 2017,restructuring and acquisition-related charges are expected tobe negligible.
• Adjusted EBITDA improved by EUR 34 million and the marginincreased by 90 basis points compared to Q2 2016.
Diagnosis & Treatment businessesKey data in millions of EUR unless otherwise stated
Q2 2016 Q2 2017
Sales 1,600 1,671
Sales growth
Nominal sales growth (3)% 4%
Comparable sales growth* 1% 3%
Income from operations (EBIT) 111 111
as a % of sales 6.9% 6.6%
EBITA* 124 120
as a % of sales 7.8% 7.2%
Adjusted EBITA* 131 151
as a % of sales 8.2% 9.0%
Adjusted EBITDA* 176 193
as a % of sales 11.0% 11.5%
• Sales increased by 4% on a nominal basis. Excludingconsolidation changes, the 3% comparable sales growthreflected mid-single-digit growth in Ultrasound and Image-Guided Therapy and low-single-digit growth in DiagnosticImaging.
• Comparable sales growth was driven by double-digit growthin Western Europe and high-single-digit growth in NorthAmerica. This was partly offset by growth geographies, whichsaw a mid-single-digit decline, reflecting mid-single-digitgrowth in China, which was more than offset by a decline inMiddle East & Turkey, India and Africa and a double-digitdecline in other mature geographies.
• EBITA decreased by EUR 4 million and the margin deterioratedby 60 basis points compared to Q2 2016.
• Adjusted EBITA increased by EUR 20 million and the marginimproved by 80 basis points year-on-year, mainly due tohigher volumes and product mix.
• Restructuring and acquisition-related charges were EUR 31million, compared to EUR 7 million in Q2 2016. In Q3 2017,restructuring and acquisition-related charges are expected tototal approximately EUR 25 million.
• Adjusted EBITDA improved by EUR 17 million and the marginincreased by 50 basis points compared to Q2 2016.
* Non-GAAP financial measure. Refer to Reconciliation of non-GAAP information, of this document.
Quarterly report Q2 2017 7
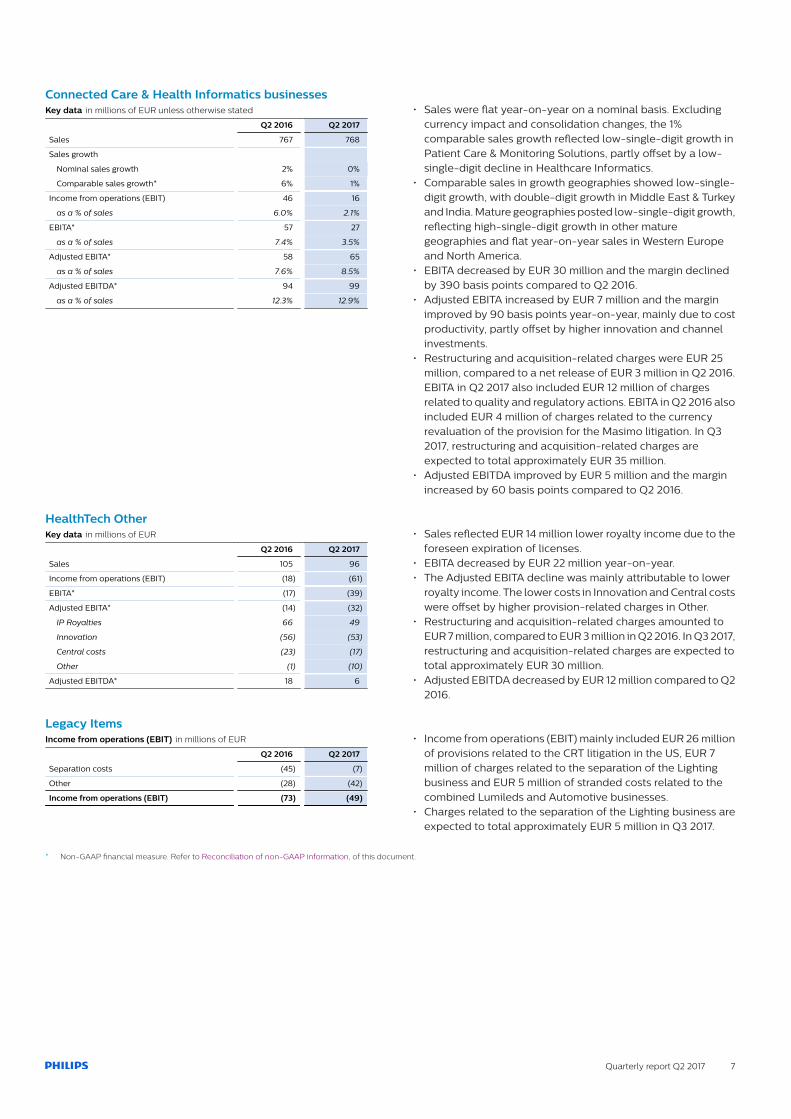
Connected Care & Health Informatics businessesKey data in millions of EUR unless otherwise stated
Q2 2016 Q2 2017
Sales 767 768
Sales growth
Nominal sales growth 2% 0%
Comparable sales growth* 6% 1%
Income from operations (EBIT) 46 16
as a % of sales 6.0% 2.1%
EBITA* 57 27
as a % of sales 7.4% 3.5%
Adjusted EBITA* 58 65
as a % of sales 7.6% 8.5%
Adjusted EBITDA* 94 99
as a % of sales 12.3% 12.9%
• Sales were flat year-on-year on a nominal basis. Excludingcurrency impact and consolidation changes, the 1%comparable sales growth reflected low-single-digit growth inPatient Care & Monitoring Solutions, partly offset by a low-single-digit decline in Healthcare Informatics.
• Comparable sales in growth geographies showed low-single-digit growth, with double-digit growth in Middle East & Turkeyand India. Mature geographies posted low-single-digit growth,reflecting high-single-digit growth in other maturegeographies and flat year-on-year sales in Western Europeand North America.
• EBITA decreased by EUR 30 million and the margin declinedby 390 basis points compared to Q2 2016.
• Adjusted EBITA increased by EUR 7 million and the marginimproved by 90 basis points year-on-year, mainly due to costproductivity, partly offset by higher innovation and channelinvestments.
• Restructuring and acquisition-related charges were EUR 25million, compared to a net release of EUR 3 million in Q2 2016.EBITA in Q2 2017 also included EUR 12 million of chargesrelated to quality and regulatory actions. EBITA in Q2 2016 alsoincluded EUR 4 million of charges related to the currencyrevaluation of the provision for the Masimo litigation. In Q32017, restructuring and acquisition-related charges areexpected to total approximately EUR 35 million.
• Adjusted EBITDA improved by EUR 5 million and the marginincreased by 60 basis points compared to Q2 2016.
HealthTech OtherKey data in millions of EUR
Q2 2016 Q2 2017
Sales 105 96
Income from operations (EBIT) (18) (61)
EBITA* (17) (39)
Adjusted EBITA* (14) (32)
IP Royalties 66 49
Innovation (56) (53)
Central costs (23) (17)
Other (1) (10)
Adjusted EBITDA* 18 6
• Sales reflected EUR 14 million lower royalty income due to theforeseen expiration of licenses.
• EBITA decreased by EUR 22 million year-on-year.• The Adjusted EBITA decline was mainly attributable to lower
royalty income. The lower costs in Innovation and Central costswere offset by higher provision-related charges in Other.
• Restructuring and acquisition-related charges amounted toEUR 7 million, compared to EUR 3 million in Q2 2016. In Q3 2017,restructuring and acquisition-related charges are expected tototal approximately EUR 30 million.
• Adjusted EBITDA decreased by EUR 12 million compared to Q22016.
Legacy ItemsIncome from operations (EBIT) in millions of EUR
Q2 2016 Q2 2017
Separation costs (45) (7)
Other (28) (42)
Income from operations (EBIT) (73) (49)
• Income from operations (EBIT) mainly included EUR 26 millionof provisions related to the CRT litigation in the US, EUR 7million of charges related to the separation of the Lightingbusiness and EUR 5 million of stranded costs related to thecombined Lumileds and Automotive businesses.
• Charges related to the separation of the Lighting business areexpected to total approximately EUR 5 million in Q3 2017.
* Non-GAAP financial measure. Refer to Reconciliation of non-GAAP information, of this document.
8 Quarterly report Q2 2017
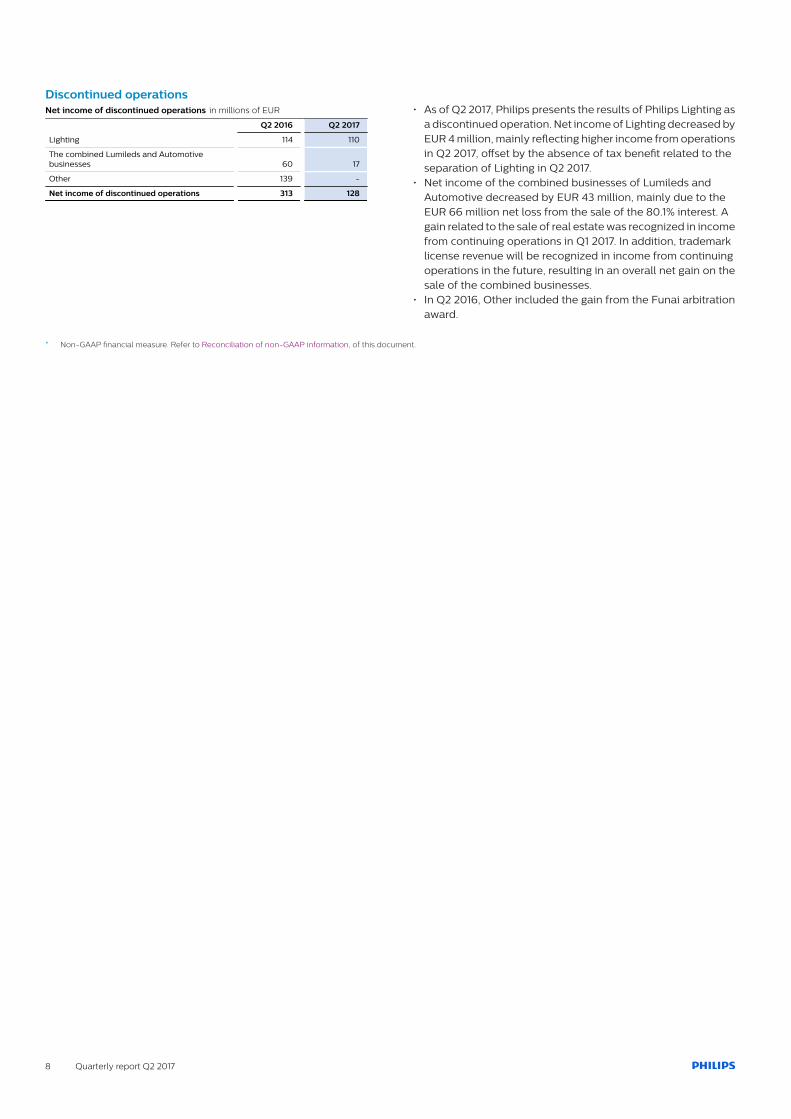
Discontinued operationsNet income of discontinued operations in millions of EUR
Q2 2016 Q2 2017
Lighting 114 110
The combined Lumileds and Automotivebusinesses 60 17
Other 139 -
Net income of discontinued operations 313 128
• As of Q2 2017, Philips presents the results of Philips Lighting asa discontinued operation. Net income of Lighting decreased byEUR 4 million, mainly reflecting higher income from operationsin Q2 2017, offset by the absence of tax benefit related to theseparation of Lighting in Q2 2017.
• Net income of the combined businesses of Lumileds andAutomotive decreased by EUR 43 million, mainly due to theEUR 66 million net loss from the sale of the 80.1% interest. Again related to the sale of real estate was recognized in incomefrom continuing operations in Q1 2017. In addition, trademarklicense revenue will be recognized in income from continuingoperations in the future, resulting in an overall net gain on thesale of the combined businesses.
• In Q2 2016, Other included the gain from the Funai arbitrationaward.
* Non-GAAP financial measure. Refer to Reconciliation of non-GAAP information, of this document.
Quarterly report Q2 2017 9
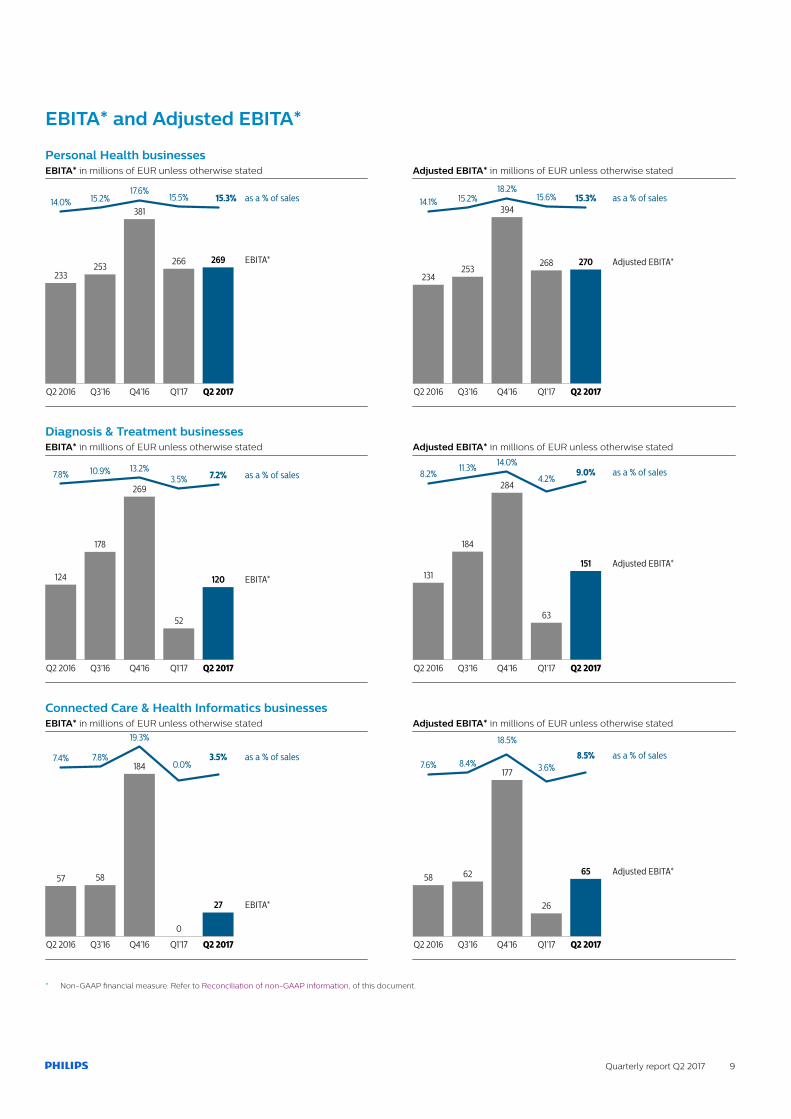
EBITA* and Adjusted EBITA*
Personal Health businessesEBITA* in millions of EUR unless otherwise stated
233
Q2 2016
253
Q3’16
381
Q4’16
266
Q1’17
269 EBITA*
Q2 2017
14.0% 15.2%17.6%
15.5% 15.3% as a % of sales
Adjusted EBITA* in millions of EUR unless otherwise stated
234
Q2 2016
253
Q3’16
394
Q4’16
268
Q1’17
270 Adjusted EBITA*
Q2 2017
14.1% 15.2%18.2%
15.6% 15.3% as a % of sales
Diagnosis & Treatment businessesEBITA* in millions of EUR unless otherwise stated
124
Q2 2016
178
Q3’16
269
Q4’16
52
Q1’17
120 EBITA*
Q2 2017
7.8% 10.9% 13.2%3.5% 7.2% as a % of sales
Adjusted EBITA* in millions of EUR unless otherwise stated
131
Q2 2016
184
Q3’16
284
Q4’16
63
Q1’17
151 Adjusted EBITA*
Q2 2017
8.2%11.3% 14.0%
4.2%9.0% as a % of sales
Connected Care & Health Informatics businessesEBITA* in millions of EUR unless otherwise stated
57
Q2 2016
58
Q3’16
184
Q4’16
0
Q1’17
27 EBITA*
Q2 2017
7.4% 7.8%
19.3%
0.0%3.5% as a % of sales
Adjusted EBITA* in millions of EUR unless otherwise stated
58
Q2 2016
62
Q3’16
177
Q4’16
26
Q1’17
65 Adjusted EBITA*
Q2 2017
7.6% 8.4%
18.5%
3.6%8.5% as a % of sales
* Non-GAAP financial measure. Refer to Reconciliation of non-GAAP information, of this document.
10 Quarterly report Q2 2017
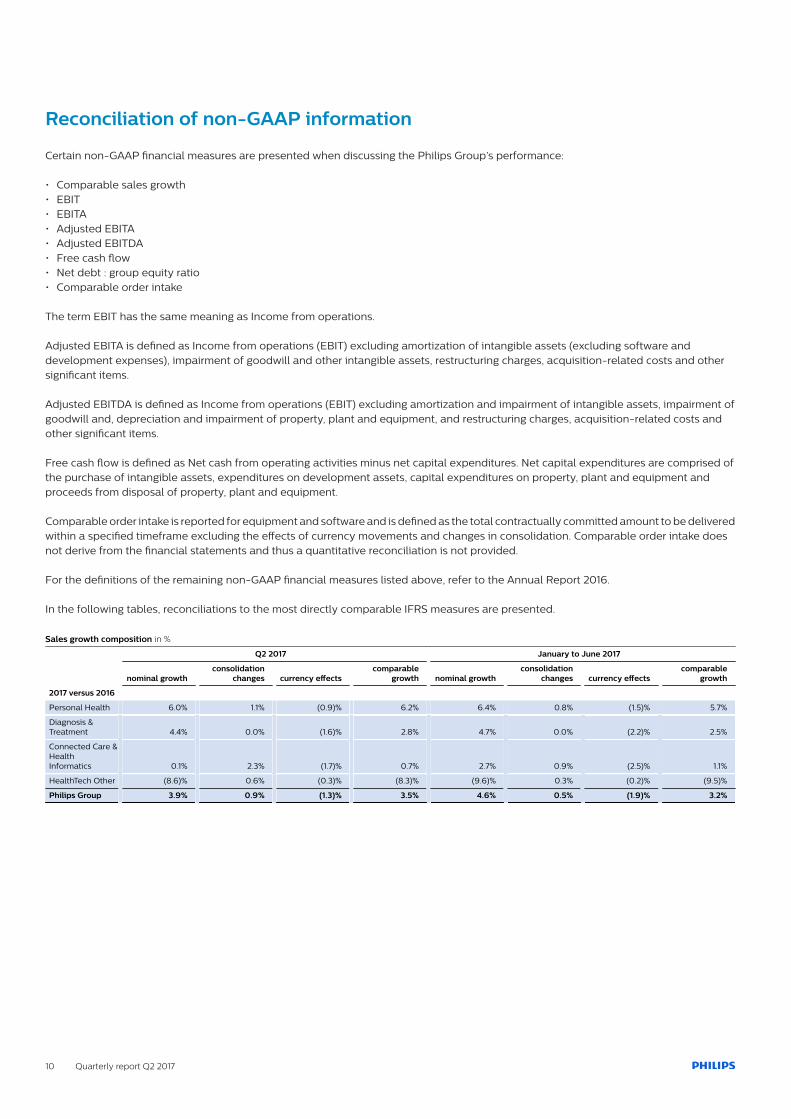
Reconciliation of non-GAAP information
Certain non-GAAP financial measures are presented when discussing the Philips Group’s performance:
• Comparable sales growth• EBIT• EBITA• Adjusted EBITA• Adjusted EBITDA• Free cash flow• Net debt : group equity ratio• Comparable order intake
The term EBIT has the same meaning as Income from operations.
Adjusted EBITA is defined as Income from operations (EBIT) excluding amortization of intangible assets (excluding software anddevelopment expenses), impairment of goodwill and other intangible assets, restructuring charges, acquisition-related costs and othersignificant items.
Adjusted EBITDA is defined as Income from operations (EBIT) excluding amortization and impairment of intangible assets, impairment ofgoodwill and, depreciation and impairment of property, plant and equipment, and restructuring charges, acquisition-related costs andother significant items.
Free cash flow is defined as Net cash from operating activities minus net capital expenditures. Net capital expenditures are comprised ofthe purchase of intangible assets, expenditures on development assets, capital expenditures on property, plant and equipment andproceeds from disposal of property, plant and equipment.
Comparable order intake is reported for equipment and software and is defined as the total contractually committed amount to be deliveredwithin a specified timeframe excluding the effects of currency movements and changes in consolidation. Comparable order intake doesnot derive from the financial statements and thus a quantitative reconciliation is not provided.
For the definitions of the remaining non-GAAP financial measures listed above, refer to the Annual Report 2016.
In the following tables, reconciliations to the most directly comparable IFRS measures are presented.
Sales growth composition in %
Q2 2017 January to June 2017
nominal growth consolidation
changes currency effects comparable
growth nominal growth consolidation
changes currency effects comparable
growth
2017 versus 2016
Personal Health 6.0% 1.1% (0.9)% 6.2% 6.4% 0.8% (1.5)% 5.7%
Diagnosis &Treatment 4.4% 0.0% (1.6)% 2.8% 4.7% 0.0% (2.2)% 2.5%
Connected Care &HealthInformatics 0.1% 2.3% (1.7)% 0.7% 2.7% 0.9% (2.5)% 1.1%
HealthTech Other (8.6)% 0.6% (0.3)% (8.3)% (9.6)% 0.3% (0.2)% (9.5)%
Philips Group 3.9% 0.9% (1.3)% 3.5% 4.6% 0.5% (1.9)% 3.2%
Quarterly report Q2 2017 11
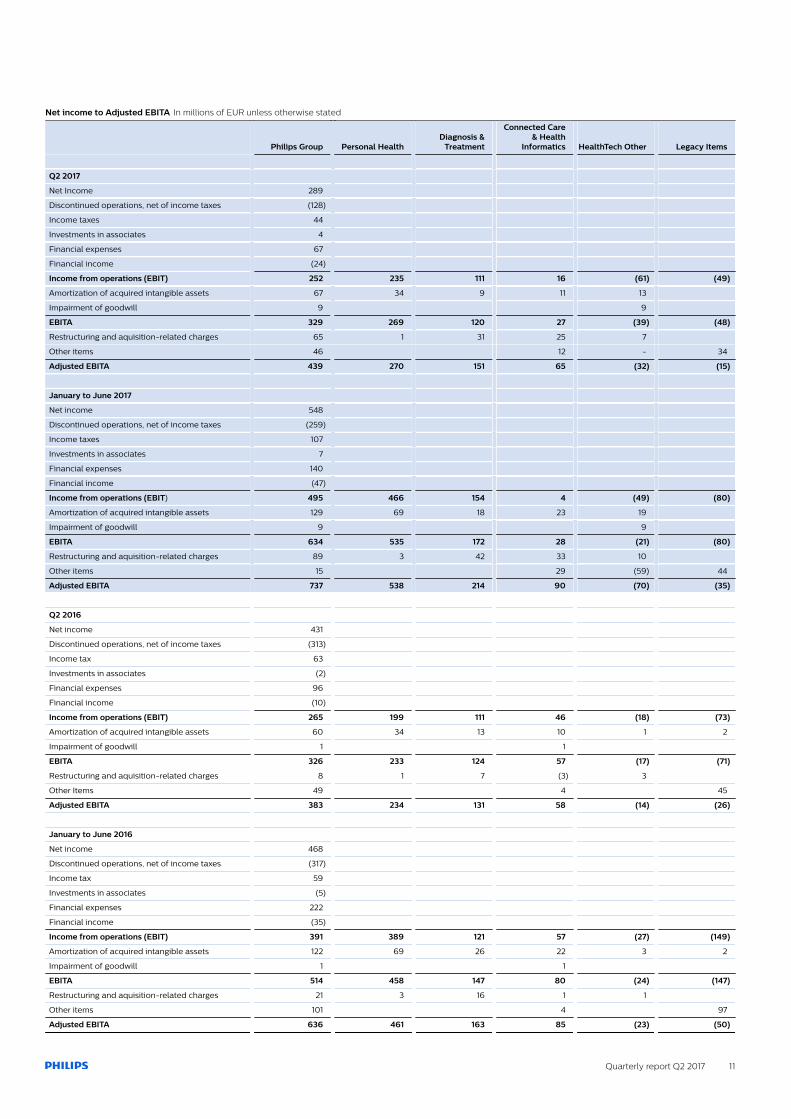
Net income to Adjusted EBITA In millions of EUR unless otherwise stated
Philips Group Personal Health Diagnosis &
Treatment
Connected Care& Health
Informatics HealthTech Other Legacy Items
Q2 2017
Net Income 289
Discontinued operations, net of income taxes (128)
Income taxes 44
Investments in associates 4
Financial expenses 67
Financial income (24)
Income from operations (EBIT) 252 235 111 16 (61) (49)
Amortization of acquired intangible assets 67 34 9 11 13
Impairment of goodwill 9 9
EBITA 329 269 120 27 (39) (48)
Restructuring and aquisition-related charges 65 1 31 25 7
Other items 46 12 - 34
Adjusted EBITA 439 270 151 65 (32) (15)
January to June 2017
Net income 548
Discontinued operations, net of income taxes (259)
Income taxes 107
Investments in associates 7
Financial expenses 140
Financial income (47)
Income from operations (EBIT) 495 466 154 4 (49) (80)
Amortization of acquired intangible assets 129 69 18 23 19
Impairment of goodwill 9 9
EBITA 634 535 172 28 (21) (80)
Restructuring and aquisition-related charges 89 3 42 33 10
Other items 15 29 (59) 44
Adjusted EBITA 737 538 214 90 (70) (35)
Q2 2016
Net income 431
Discontinued operations, net of income taxes (313)
Income tax 63
Investments in associates (2)
Financial expenses 96
Financial income (10)
Income from operations (EBIT) 265 199 111 46 (18) (73)
Amortization of acquired intangible assets 60 34 13 10 1 2
Impairment of goodwill 1 1
EBITA 326 233 124 57 (17) (71)
Restructuring and aquisition-related charges 8 1 7 (3) 3
Other Items 49 4 45
Adjusted EBITA 383 234 131 58 (14) (26)
January to June 2016
Net income 468
Discontinued operations, net of income taxes (317)
Income tax 59
Investments in associates (5)
Financial expenses 222
Financial income (35)
Income from operations (EBIT) 391 389 121 57 (27) (149)
Amortization of acquired intangible assets 122 69 26 22 3 2
Impairment of goodwill 1 1
EBITA 514 458 147 80 (24) (147)
Restructuring and aquisition-related charges 21 3 16 1 1
Other items 101 4 97
Adjusted EBITA 636 461 163 85 (23) (50)
12 Quarterly report Q2 2017
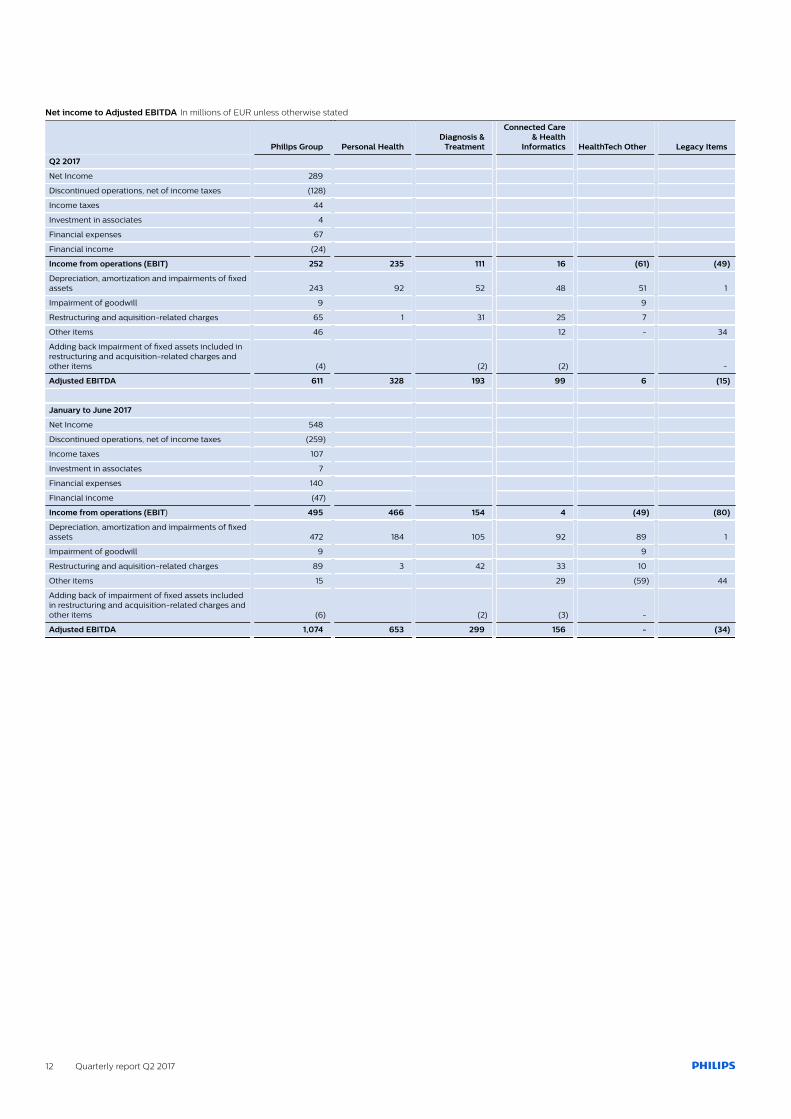
Net income to Adjusted EBITDA In millions of EUR unless otherwise stated
Philips Group Personal Health Diagnosis &
Treatment
Connected Care& Health
Informatics HealthTech Other Legacy Items
Q2 2017
Net Income 289
Discontinued operations, net of income taxes (128)
Income taxes 44
Investment in associates 4
Financial expenses 67
Financial income (24)
Income from operations (EBIT) 252 235 111 16 (61) (49)
Depreciation, amortization and impairments of fixedassets 243 92 52 48 51 1
Impairment of goodwill 9 9
Restructuring and aquisition-related charges 65 1 31 25 7
Other items 46 12 - 34
Adding back impairment of fixed assets included inrestructuring and acquisition-related charges andother items (4) (2) (2) -
Adjusted EBITDA 611 328 193 99 6 (15)
January to June 2017
Net Income 548
Discontinued operations, net of income taxes (259)
Income taxes 107
Investment in associates 7
Financial expenses 140
Financial income (47)
Income from operations (EBIT) 495 466 154 4 (49) (80)
Depreciation, amortization and impairments of fixedassets 472 184 105 92 89 1
Impairment of goodwill 9 9
Restructuring and aquisition-related charges 89 3 42 33 10
Other items 15 29 (59) 44
Adding back of impairment of fixed assets includedin restructuring and acquisition-related charges andother items (6) (2) (3) -
Adjusted EBITDA 1,074 653 299 156 - (34)
Quarterly report Q2 2017 13
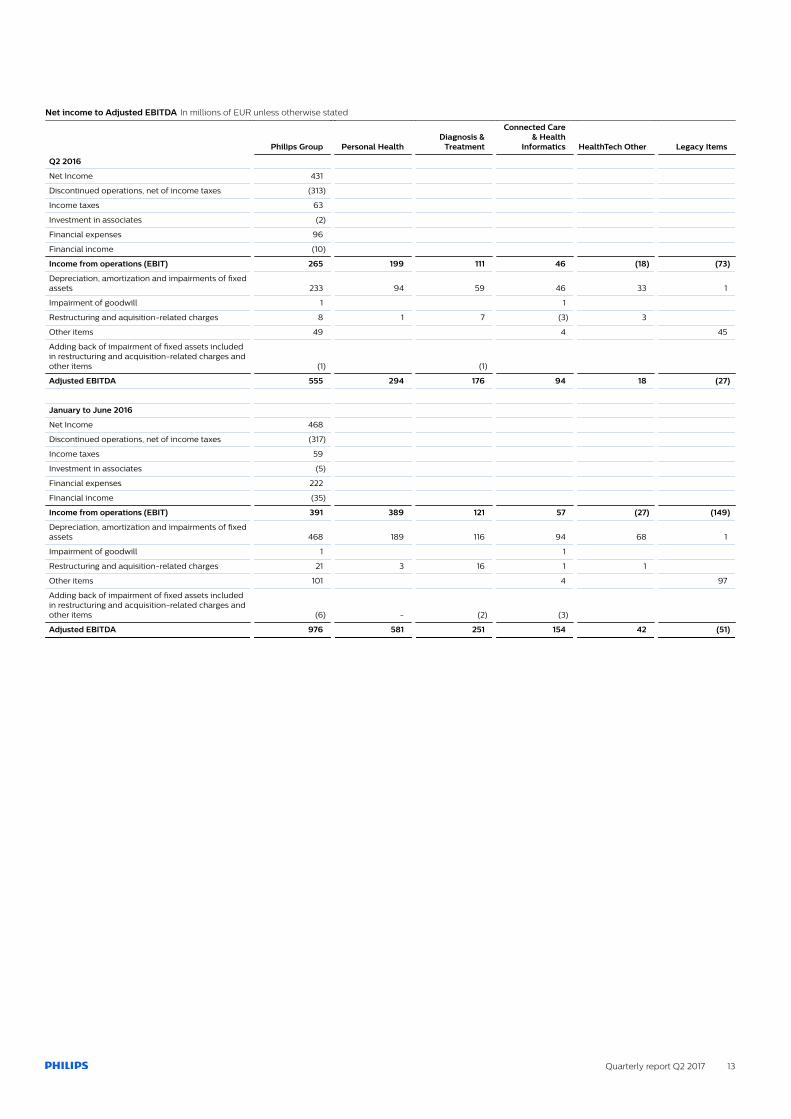
Net income to Adjusted EBITDA In millions of EUR unless otherwise stated
Philips Group Personal Health Diagnosis &
Treatment
Connected Care& Health
Informatics HealthTech Other Legacy Items
Q2 2016
Net Income 431
Discontinued operations, net of income taxes (313)
Income taxes 63
Investment in associates (2)
Financial expenses 96
Financial income (10)
Income from operations (EBIT) 265 199 111 46 (18) (73)
Depreciation, amortization and impairments of fixedassets 233 94 59 46 33 1
Impairment of goodwill 1 1
Restructuring and aquisition-related charges 8 1 7 (3) 3
Other items 49 4 45
Adding back of impairment of fixed assets includedin restructuring and acquisition-related charges andother items (1) (1)
Adjusted EBITDA 555 294 176 94 18 (27)
January to June 2016
Net Income 468
Discontinued operations, net of income taxes (317)
Income taxes 59
Investment in associates (5)
Financial expenses 222
Financial income (35)
Income from operations (EBIT) 391 389 121 57 (27) (149)
Depreciation, amortization and impairments of fixedassets 468 189 116 94 68 1
Impairment of goodwill 1 1
Restructuring and aquisition-related charges 21 3 16 1 1
Other items 101 4 97
Adding back of impairment of fixed assets includedin restructuring and acquisition-related charges andother items (6) - (2) (3)
Adjusted EBITDA 976 581 251 154 42 (51)
14 Quarterly report Q2 2017
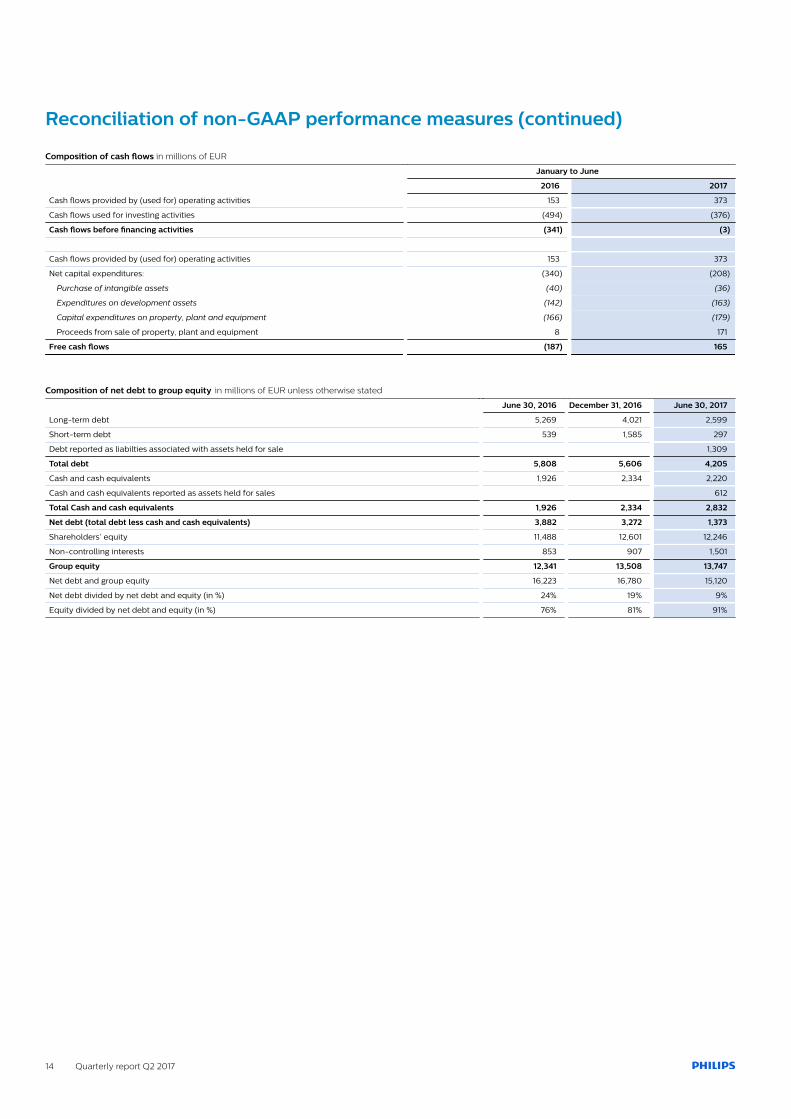
Reconciliation of non-GAAP performance measures (continued)
Composition of cash flows in millions of EUR
January to June
2016 2017
Cash flows provided by (used for) operating activities 153 373
Cash flows used for investing activities (494) (376)
Cash flows before financing activities (341) (3)
Cash flows provided by (used for) operating activities 153 373
Net capital expenditures: (340) (208)
Purchase of intangible assets (40) (36)
Expenditures on development assets (142) (163)
Capital expenditures on property, plant and equipment (166) (179)
Proceeds from sale of property, plant and equipment 8 171
Free cash flows (187) 165
Composition of net debt to group equity in millions of EUR unless otherwise stated
June 30, 2016 December 31, 2016 June 30, 2017
Long-term debt 5,269 4,021 2,599
Short-term debt 539 1,585 297
Debt reported as liabilties associated with assets held for sale 1,309
Total debt 5,808 5,606 4,205
Cash and cash equivalents 1,926 2,334 2,220
Cash and cash equivalents reported as assets held for sales 612
Total Cash and cash equivalents 1,926 2,334 2,832
Net debt (total debt less cash and cash equivalents) 3,882 3,272 1,373
Shareholders’ equity 11,488 12,601 12,246
Non-controlling interests 853 907 1,501
Group equity 12,341 13,508 13,747
Net debt and group equity 16,223 16,780 15,120
Net debt divided by net debt and equity (in %) 24% 19% 9%
Equity divided by net debt and equity (in %) 76% 81% 91%
Quarterly report Q2 2017 15
Philips statisticsin millions of EUR unless otherwise stated
2016 2017
Q1 Q2 Q3 Q4 Q1 Q2 Q3 Q4
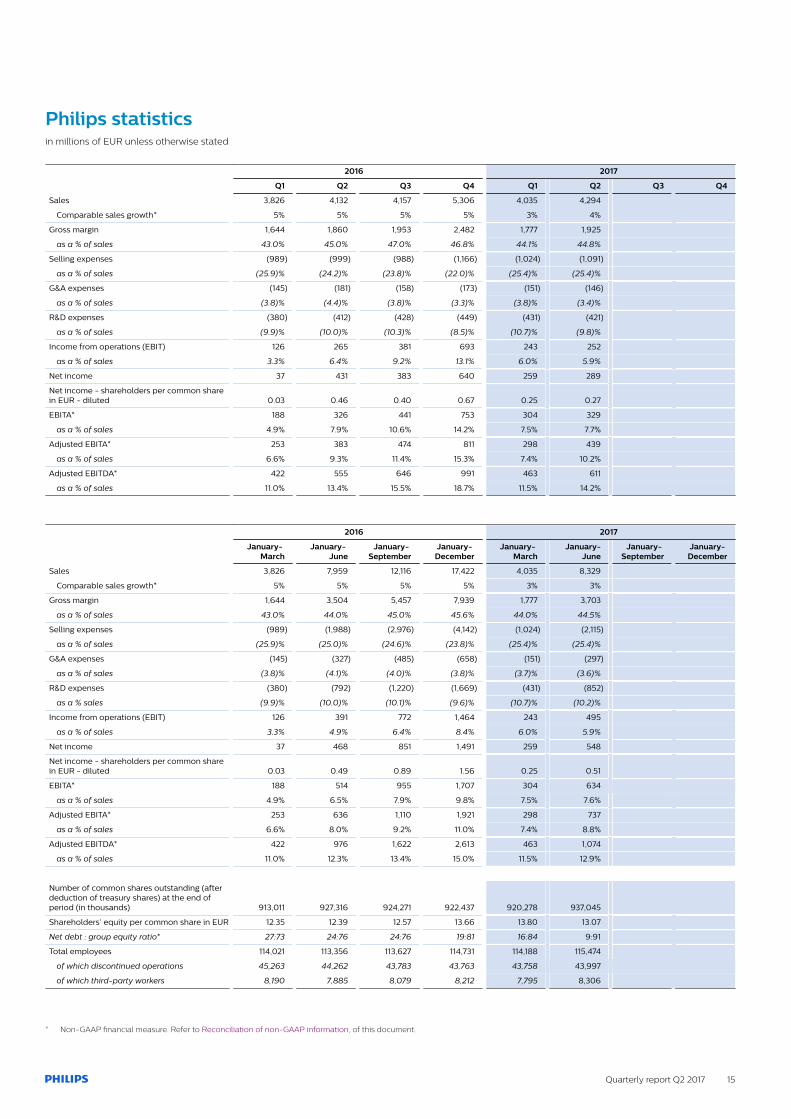
Sales 3,826 4,132 4,157 5,306 4,035 4,294
Comparable sales growth* 5% 5% 5% 5% 3% 4%
Gross margin 1,644 1,860 1,953 2,482 1,777 1,925
as a % of sales 43.0% 45.0% 47.0% 46.8% 44.1% 44.8%
Selling expenses (989) (999) (988) (1,166) (1,024) (1,091)
as a % of sales (25.9)% (24.2)% (23.8)% (22.0)% (25.4)% (25.4)%
G&A expenses (145) (181) (158) (173) (151) (146)
as a % of sales (3.8)% (4.4)% (3.8)% (3.3)% (3.8)% (3.4)%
R&D expenses (380) (412) (428) (449) (431) (421)
as a % of sales (9.9)% (10.0)% (10.3)% (8.5)% (10.7)% (9.8)%
Income from operations (EBIT) 126 265 381 693 243 252
as a % of sales 3.3% 6.4% 9.2% 13.1% 6.0% 5.9%
Net income 37 431 383 640 259 289
Net income - shareholders per common sharein EUR - diluted 0.03 0.46 0.40 0.67 0.25 0.27
EBITA* 188 326 441 753 304 329
as a % of sales 4.9% 7.9% 10.6% 14.2% 7.5% 7.7%
Adjusted EBITA* 253 383 474 811 298 439
as a % of sales 6.6% 9.3% 11.4% 15.3% 7.4% 10.2%
Adjusted EBITDA* 422 555 646 991 463 611
as a % of sales 11.0% 13.4% 15.5% 18.7% 11.5% 14.2%
2016 2017
January- March
January- June
January- September
January- December
January- March
January-June
January- September
January- December
Sales 3,826 7,959 12,116 17,422 4,035 8,329
Comparable sales growth* 5% 5% 5% 5% 3% 3%
Gross margin 1,644 3,504 5,457 7,939 1,777 3,703
as a % of sales 43.0% 44.0% 45.0% 45.6% 44.0% 44.5%
Selling expenses (989) (1,988) (2,976) (4,142) (1,024) (2,115)
as a % of sales (25.9)% (25.0)% (24.6)% (23.8)% (25.4)% (25.4)%
G&A expenses (145) (327) (485) (658) (151) (297)
as a % of sales (3.8)% (4.1)% (4.0)% (3.8)% (3.7)% (3.6)%
R&D expenses (380) (792) (1,220) (1,669) (431) (852)
as a % sales (9.9)% (10.0)% (10.1)% (9.6)% (10.7)% (10.2)%
Income from operations (EBIT) 126 391 772 1,464 243 495
as a % of sales 3.3% 4.9% 6.4% 8.4% 6.0% 5.9%
Net income 37 468 851 1,491 259 548
Net income - shareholders per common sharein EUR - diluted 0.03 0.49 0.89 1.56 0.25 0.51
EBITA* 188 514 955 1,707 304 634
as a % of sales 4.9% 6.5% 7.9% 9.8% 7.5% 7.6%
Adjusted EBITA* 253 636 1,110 1,921 298 737
as a % of sales 6.6% 8.0% 9.2% 11.0% 7.4% 8.8%
Adjusted EBITDA* 422 976 1,622 2,613 463 1,074
as a % of sales 11.0% 12.3% 13.4% 15.0% 11.5% 12.9%
Number of common shares outstanding (afterdeduction of treasury shares) at the end ofperiod (in thousands) 913,011 927,316 924,271 922,437 920,278 937,045
Shareholders’ equity per common share in EUR 12.35 12.39 12.57 13.66 13.80 13.07
Net debt : group equity ratio* 27:73 24:76 24:76 19:81 16:84 9:91
Total employees 114,021 113,356 113,627 114,731 114,188 115,474
of which discontinued operations 45,263 44,262 43,783 43,763 43,758 43,997
of which third-party workers 8,190 7,885 8,079 8,212 7,795 8,306
* Non-GAAP financial measure. Refer to Reconciliation of non-GAAP information, of this document.

16 Quarterly report Q2 2017
Forward-looking statements and other important information
Forward-looking statementsThis document and the related oral presentation, includingresponses to questions following the presentation, containcertain forward-looking statements with respect to the financialcondition, results of operations and business of Philips andcertain of the plans and objectives of Philips with respect to theseitems. Examples of forward-looking statements includestatements made about the strategy, estimates of sales growth,future EBITA, future developments in Philips’ organic businessand the completion of acquisitions and divestments, includingthe tender offer for and merger with Spectranetics. By theirnature, these statements involve risk and uncertainty becausethey relate to future events and circumstances and there aremany factors that could cause actual results and developmentsto differ materially from those expressed or implied by thesestatements.
These factors include but are not limited to: domestic and globaleconomic and business conditions; developments within theeuro zone; the successful implementation of Philips’ strategy andthe ability to realize the benefits of this strategy; the ability todevelop and market new products; changes in legislation; legalclaims; changes in exchange and interest rates; changes in taxrates; pension costs and actuarial assumptions; raw materialsand employee costs; the ability to identify and completesuccessful acquisitions, including Spectranetics, and to integratethose acquisitions into the business; the ability to successfullyexit certain businesses or restructure the operations; the rate oftechnological changes; political, economic and otherdevelopments in countries where Philips operates; industryconsolidation and competition; and the state of internationalcapital markets as they may affect the timing and nature of thedisposition by Philips of its interests in Philips Lighting. As a result,Philips’ actual future results may differ materially from the plans,goals and expectations set forth in such forward-lookingstatements. For a discussion of factors that could cause futureresults to differ from such forward-looking statements, see theRisk management chapter included in the Annual Report 2016.
Third-party market share dataStatements regarding market share, including those regardingPhilips’ competitive position, contained in this document arebased on outside sources such as research institutes, industryand dealer panels in combination with management estimates.Where information is not yet available to Philips, thosestatements may also be based on estimates and projectionsprepared by outside sources or management. Rankings arebased on sales unless otherwise stated.
Use of non-GAAP informationIn presenting and discussing the Philips Group financial position,operating results and cash flows, management uses certain non-GAAP financial measures. These non-GAAP financial measuresshould not be viewed in isolation as alternatives to the equivalentIFRS measures and should be used in conjunction with the mostdirectly comparable IFRS measures. Non-GAAP financialmeasures do not have standardized meaning under IFRS andtherefore may not be comparable to similar measures presentedby other issuers. A reconciliation of these non-GAAP measures
to the most directly comparable IFRS measures is contained inthis document. Further information on non-GAAP measures canbe found in the Annual Report 2016. Comparable order intakeand Adjusted EBITDA are measures included to enhancecomparability with other companies.
Use of fair-value measurementsIn presenting the Philips Group financial position, fair values areused for the measurement of various items in accordance withthe applicable accounting standards. These fair values are basedon market prices, where available, and are obtained from sourcesthat are deemed to be reliable. Readers are cautioned that thesevalues are subject to changes over time and are only valid at thebalance sheet date. When quoted prices or observable marketdata are not readily available, fair values are estimated usingappropriate valuation models and unobservable inputs. Such fairvalue estimates require management to make significantassumptions with respect to future developments, which areinherently uncertain and may therefore deviate from actualdevelopments. Critical assumptions used are disclosed in theAnnual Report 2016. Independent valuations may have beenobtained to support management’s determination of fair values.
PresentationAll amounts are in millions of euros unless otherwise stated. Dueto rounding, amounts may not add up precisely to totalsprovided. All reported data is unaudited. Financial reporting is inaccordance with the accounting policies as stated in the AnnualReport 2016, unless otherwise stated.
In addition, we have simplified our Q1 and Q3 reporting byexcluding the cash flow statement, the statement of changes inequity and certain other tables in the detailed financialinformation section not required to be disclosed. In our semi-annual and annual reporting we will continue to present thesestatements and tables. Summary cash flow information isprovided in the Philips performance section of this document.
Prior-period financial statements have been restated for thetreatment of the segment Lighting as discontinued operations.
Market Abuse RegulationThis press release contains inside information within the meaningof Article 7(1) of the EU Market Abuse Regulation.
Quarterly report Q2 2017 17
Philips semi-annual report 2017
IntroductionThis report contains the semi-annual report of Koninklijke PhilipsN.V. (‘the Company’ or ‘Philips’), a company with limited liability,headquartered in Amsterdam, the Netherlands. The principalactivities of the Company and its group companies (‘the Group’)are described in the Annual Report 2016 and in Segmentinformation, of this document. The semi-annual report for the sixmonths ended June 30, 2017 consists of the semi-annualcondensed consolidated financial statements, the semi-annualmanagement report and responsibility statement by theCompany’s Board of Management. The information in this semi-annual report is unaudited.
Responsibility statementThe Board of Management of the Company hereby declares thatto the best of their knowledge, the semi-annual financialstatements for the six-month period ended June 30, 2017, whichhave been prepared in accordance with IAS 34 Interim Financial
Reporting as endorsed by the EU, give a true and fair view of theassets, liabilities, financial position and profit or loss of theCompany and the undertakings included in the consolidationtaken as a whole, and that the semi-annual management reportfor the six-month period ended June 30, 2017 gives a fair view ofthe information required pursuant to article 5:25d paragraph 8and 9 of the Dutch Financial Markets Supervision Act (Wet op hetFinancieel toezicht).
Amsterdam, July 24, 2017
Board of Management
Frans van Houten
Abhijit Bhattacharya
Pieter Nota
18 Quarterly report Q2 2017
Management report
Philips performance
Key data in millions of EUR unless otherwise stated
January to June
2016 2017
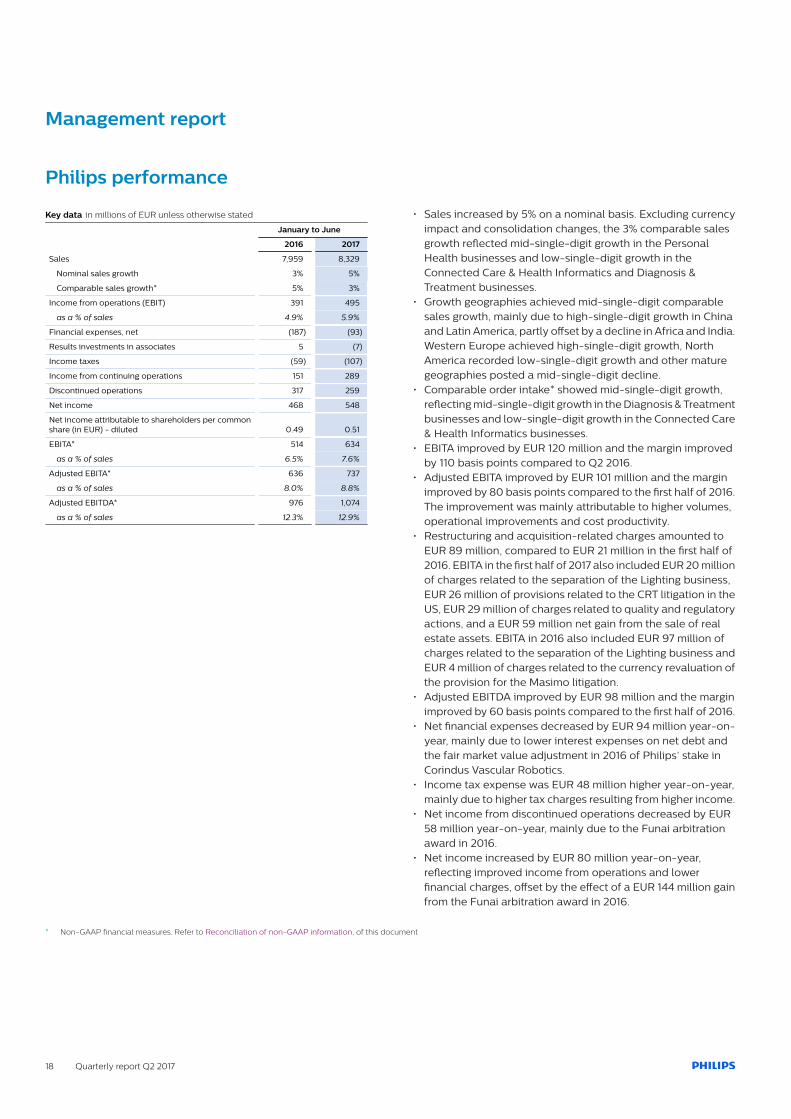
Sales 7,959 8,329
Nominal sales growth 3% 5%
Comparable sales growth* 5% 3%
Income from operations (EBIT) 391 495
as a % of sales 4.9% 5.9%
Financial expenses, net (187) (93)
Results investments in associates 5 (7)
Income taxes (59) (107)
Income from continuing operations 151 289
Discontinued operations 317 259
Net income 468 548
Net income attributable to shareholders per commonshare (in EUR) - diluted 0.49 0.51
EBITA* 514 634
as a % of sales 6.5% 7.6%
Adjusted EBITA* 636 737
as a % of sales 8.0% 8.8%
Adjusted EBITDA* 976 1,074
as a % of sales 12.3% 12.9%
• Sales increased by 5% on a nominal basis. Excluding currencyimpact and consolidation changes, the 3% comparable salesgrowth reflected mid-single-digit growth in the PersonalHealth businesses and low-single-digit growth in theConnected Care & Health Informatics and Diagnosis &Treatment businesses.
• Growth geographies achieved mid-single-digit comparablesales growth, mainly due to high-single-digit growth in Chinaand Latin America, partly offset by a decline in Africa and India.Western Europe achieved high-single-digit growth, NorthAmerica recorded low-single-digit growth and other maturegeographies posted a mid-single-digit decline.
• Comparable order intake* showed mid-single-digit growth,reflecting mid-single-digit growth in the Diagnosis & Treatmentbusinesses and low-single-digit growth in the Connected Care& Health Informatics businesses.
• EBITA improved by EUR 120 million and the margin improvedby 110 basis points compared to Q2 2016.
• Adjusted EBITA improved by EUR 101 million and the marginimproved by 80 basis points compared to the first half of 2016.The improvement was mainly attributable to higher volumes,operational improvements and cost productivity.
• Restructuring and acquisition-related charges amounted toEUR 89 million, compared to EUR 21 million in the first half of2016. EBITA in the first half of 2017 also included EUR 20 millionof charges related to the separation of the Lighting business,EUR 26 million of provisions related to the CRT litigation in theUS, EUR 29 million of charges related to quality and regulatoryactions, and a EUR 59 million net gain from the sale of realestate assets. EBITA in 2016 also included EUR 97 million ofcharges related to the separation of the Lighting business andEUR 4 million of charges related to the currency revaluation ofthe provision for the Masimo litigation.
• Adjusted EBITDA improved by EUR 98 million and the marginimproved by 60 basis points compared to the first half of 2016.
• Net financial expenses decreased by EUR 94 million year-on-year, mainly due to lower interest expenses on net debt andthe fair market value adjustment in 2016 of Philips’ stake inCorindus Vascular Robotics.
• Income tax expense was EUR 48 million higher year-on-year,mainly due to higher tax charges resulting from higher income.
• Net income from discontinued operations decreased by EUR58 million year-on-year, mainly due to the Funai arbitrationaward in 2016.
• Net income increased by EUR 80 million year-on-year,reflecting improved income from operations and lowerfinancial charges, offset by the effect of a EUR 144 million gainfrom the Funai arbitration award in 2016.
* Non-GAAP financial measures. Refer to Reconciliation of non-GAAP information, of this document
Quarterly report Q2 2017 19
Performance per segment
Personal Health businessesKey data in millions of EUR unless otherwise stated
January to June
2016 2017
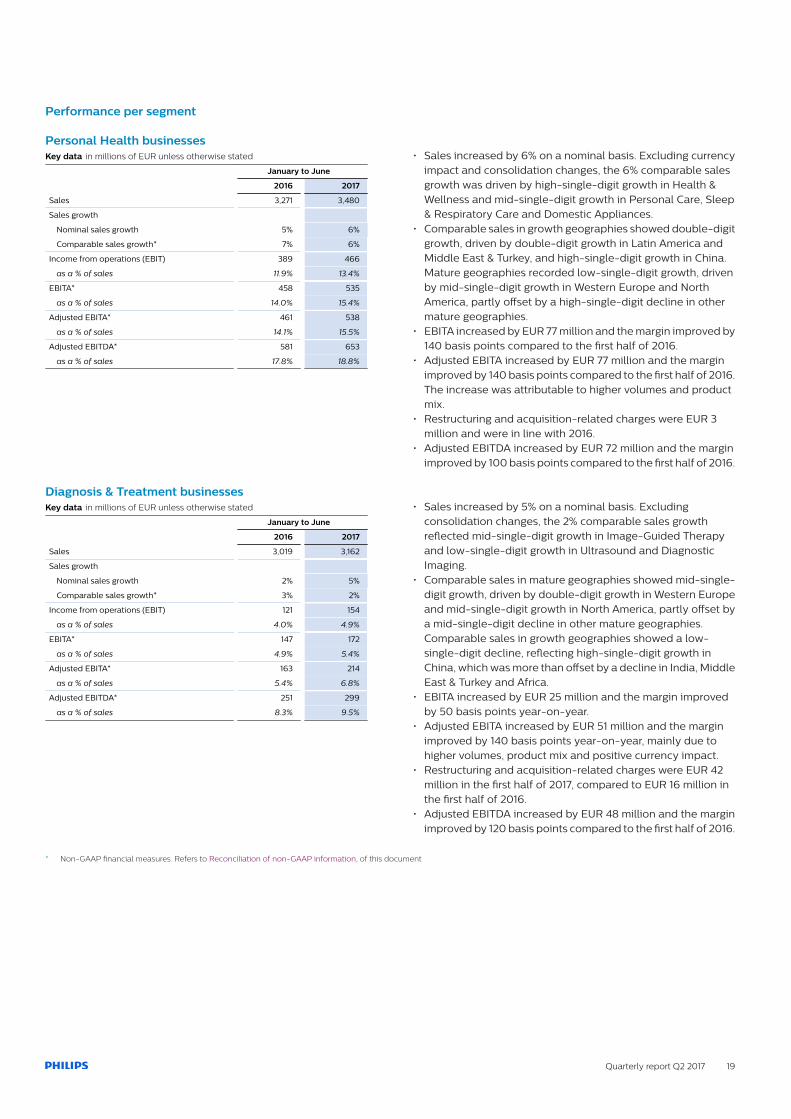
Sales 3,271 3,480
Sales growth
Nominal sales growth 5% 6%
Comparable sales growth* 7% 6%
Income from operations (EBIT) 389 466
as a % of sales 11.9% 13.4%
EBITA* 458 535
as a % of sales 14.0% 15.4%
Adjusted EBITA* 461 538
as a % of sales 14.1% 15.5%
Adjusted EBITDA* 581 653
as a % of sales 17.8% 18.8%
• Sales increased by 6% on a nominal basis. Excluding currencyimpact and consolidation changes, the 6% comparable salesgrowth was driven by high-single-digit growth in Health &Wellness and mid-single-digit growth in Personal Care, Sleep& Respiratory Care and Domestic Appliances.
• Comparable sales in growth geographies showed double-digitgrowth, driven by double-digit growth in Latin America andMiddle East & Turkey, and high-single-digit growth in China.Mature geographies recorded low-single-digit growth, drivenby mid-single-digit growth in Western Europe and NorthAmerica, partly offset by a high-single-digit decline in othermature geographies.
• EBITA increased by EUR 77 million and the margin improved by140 basis points compared to the first half of 2016.
• Adjusted EBITA increased by EUR 77 million and the marginimproved by 140 basis points compared to the first half of 2016.The increase was attributable to higher volumes and productmix.
• Restructuring and acquisition-related charges were EUR 3million and were in line with 2016.
• Adjusted EBITDA increased by EUR 72 million and the marginimproved by 100 basis points compared to the first half of 2016.
Diagnosis & Treatment businessesKey data in millions of EUR unless otherwise stated
January to June
2016 2017
Sales 3,019 3,162
Sales growth
Nominal sales growth 2% 5%
Comparable sales growth* 3% 2%
Income from operations (EBIT) 121 154
as a % of sales 4.0% 4.9%
EBITA* 147 172
as a % of sales 4.9% 5.4%
Adjusted EBITA* 163 214
as a % of sales 5.4% 6.8%
Adjusted EBITDA* 251 299
as a % of sales 8.3% 9.5%
• Sales increased by 5% on a nominal basis. Excludingconsolidation changes, the 2% comparable sales growthreflected mid-single-digit growth in Image-Guided Therapyand low-single-digit growth in Ultrasound and DiagnosticImaging.
• Comparable sales in mature geographies showed mid-single-digit growth, driven by double-digit growth in Western Europeand mid-single-digit growth in North America, partly offset bya mid-single-digit decline in other mature geographies.Comparable sales in growth geographies showed a low-single-digit decline, reflecting high-single-digit growth inChina, which was more than offset by a decline in India, MiddleEast & Turkey and Africa.
• EBITA increased by EUR 25 million and the margin improvedby 50 basis points year-on-year.
• Adjusted EBITA increased by EUR 51 million and the marginimproved by 140 basis points year-on-year, mainly due tohigher volumes, product mix and positive currency impact.
• Restructuring and acquisition-related charges were EUR 42million in the first half of 2017, compared to EUR 16 million inthe first half of 2016.
• Adjusted EBITDA increased by EUR 48 million and the marginimproved by 120 basis points compared to the first half of 2016.
* Non-GAAP financial measures. Refers to Reconciliation of non-GAAP information, of this document
20 Quarterly report Q2 2017
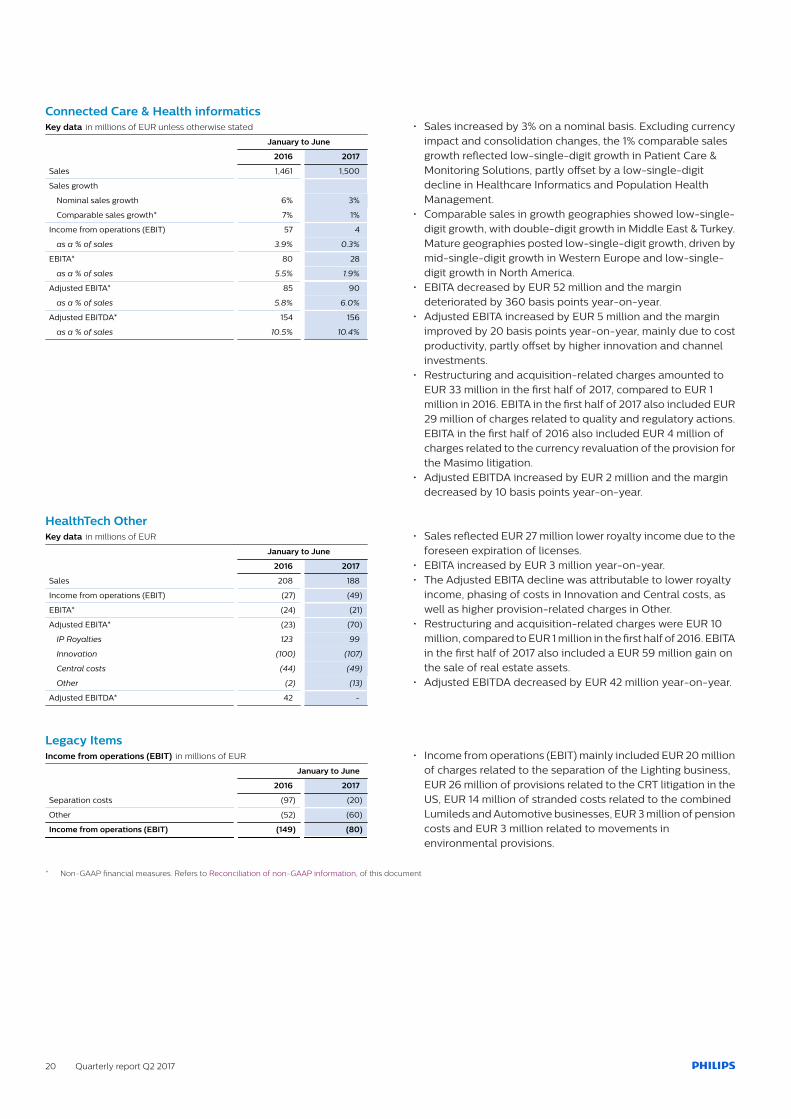
Connected Care & Health informaticsKey data in millions of EUR unless otherwise stated
January to June
2016 2017
Sales 1,461 1,500
Sales growth
Nominal sales growth 6% 3%
Comparable sales growth* 7% 1%
Income from operations (EBIT) 57 4
as a % of sales 3.9% 0.3%
EBITA* 80 28
as a % of sales 5.5% 1.9%
Adjusted EBITA* 85 90
as a % of sales 5.8% 6.0%
Adjusted EBITDA* 154 156
as a % of sales 10.5% 10.4%
• Sales increased by 3% on a nominal basis. Excluding currencyimpact and consolidation changes, the 1% comparable salesgrowth reflected low-single-digit growth in Patient Care &Monitoring Solutions, partly offset by a low-single-digitdecline in Healthcare Informatics and Population HealthManagement.
• Comparable sales in growth geographies showed low-single-digit growth, with double-digit growth in Middle East & Turkey.Mature geographies posted low-single-digit growth, driven bymid-single-digit growth in Western Europe and low-single-digit growth in North America.
• EBITA decreased by EUR 52 million and the margindeteriorated by 360 basis points year-on-year.
• Adjusted EBITA increased by EUR 5 million and the marginimproved by 20 basis points year-on-year, mainly due to costproductivity, partly offset by higher innovation and channelinvestments.
• Restructuring and acquisition-related charges amounted toEUR 33 million in the first half of 2017, compared to EUR 1million in 2016. EBITA in the first half of 2017 also included EUR29 million of charges related to quality and regulatory actions.EBITA in the first half of 2016 also included EUR 4 million ofcharges related to the currency revaluation of the provision forthe Masimo litigation.
• Adjusted EBITDA increased by EUR 2 million and the margindecreased by 10 basis points year-on-year.
HealthTech OtherKey data in millions of EUR
January to June
2016 2017
Sales 208 188
Income from operations (EBIT) (27) (49)
EBITA* (24) (21)
Adjusted EBITA* (23) (70)
IP Royalties 123 99
Innovation (100) (107)
Central costs (44) (49)
Other (2) (13)
Adjusted EBITDA* 42 -
• Sales reflected EUR 27 million lower royalty income due to theforeseen expiration of licenses.
• EBITA increased by EUR 3 million year-on-year.• The Adjusted EBITA decline was attributable to lower royalty
income, phasing of costs in Innovation and Central costs, aswell as higher provision-related charges in Other.
• Restructuring and acquisition-related charges were EUR 10million, compared to EUR 1 million in the first half of 2016. EBITAin the first half of 2017 also included a EUR 59 million gain onthe sale of real estate assets.
• Adjusted EBITDA decreased by EUR 42 million year-on-year.
Legacy ItemsIncome from operations (EBIT) in millions of EUR
January to June
2016 2017
Separation costs (97) (20)
Other (52) (60)
Income from operations (EBIT) (149) (80)
• Income from operations (EBIT) mainly included EUR 20 millionof charges related to the separation of the Lighting business,EUR 26 million of provisions related to the CRT litigation in theUS, EUR 14 million of stranded costs related to the combinedLumileds and Automotive businesses, EUR 3 million of pensioncosts and EUR 3 million related to movements inenvironmental provisions.
* Non-GAAP financial measures. Refers to Reconciliation of non-GAAP information, of this document

Quarterly report Q2 2017 21
Discontinued operationsNet income of discontinued operations in millions of EUR
January to June
2016 2017
Lighting 94 177
The combined Lumileds and Automotivebusinesses 92 83
Other 131 (1)
Net income of discontinued operations 317 259
• As of Q2 2017, Philips presents the results of Philips Lighting asa discontinued operation. Net income of Lighting increased byEUR 83 million, mainly reflecting higher income fromoperations.
• Net income of the combined businesses of Lumileds andAutomotive decreased by EUR 9 million and included the EUR66 million net loss from the sale of the 80.1% interest. A gainrelated to the sale of real estate was recognized in income fromcontinuing operations in Q1 2017. In addition, trademark licenserevenue will be recognized in income from continuingoperations in the future, resulting in an overall net gain on thesale of the combined businesses.
• Other includes the gain from the Funai arbitration award in thefirst half of 2016.
Risks and uncertaintyThe Annual Report 2016 describes certain risk categories and risks (including risk appetite) which could have a material adverse effect onPhilips’ financial position and results. Those categories and risks remain valid and should be read in conjunction with this semi-annualreport.
Looking ahead to the second half of 2017, financial markets continue to be highly volatile due to political and macroeconomic issues inmost major regions such as Europe (including Brexit), United States, China, Russia, Middle East & Turkey and Latin America. Such conditionsin financial markets may adversely affect the timing of and revenues from the ongoing divestment of Philips Lighting.
Also, Philips operates in a highly regulated product safety and quality environment. Philips products and facilities are subject to regulationand ongoing inspections by various government agencies, including, in particular, the FDA (US) and comparable non-US agencies. Philipsis undertaking considerable efforts to improve quality and management systems in all of its operations. The remediation work in this areawill continue to affect the Company’s results.
Additional risks not known to Philips, or currently believed not to be material, could later turn out to have a material impact on Philips’business, objectives, revenues, income, assets, liquidity or capital resources.
22 Quarterly report Q2 2017
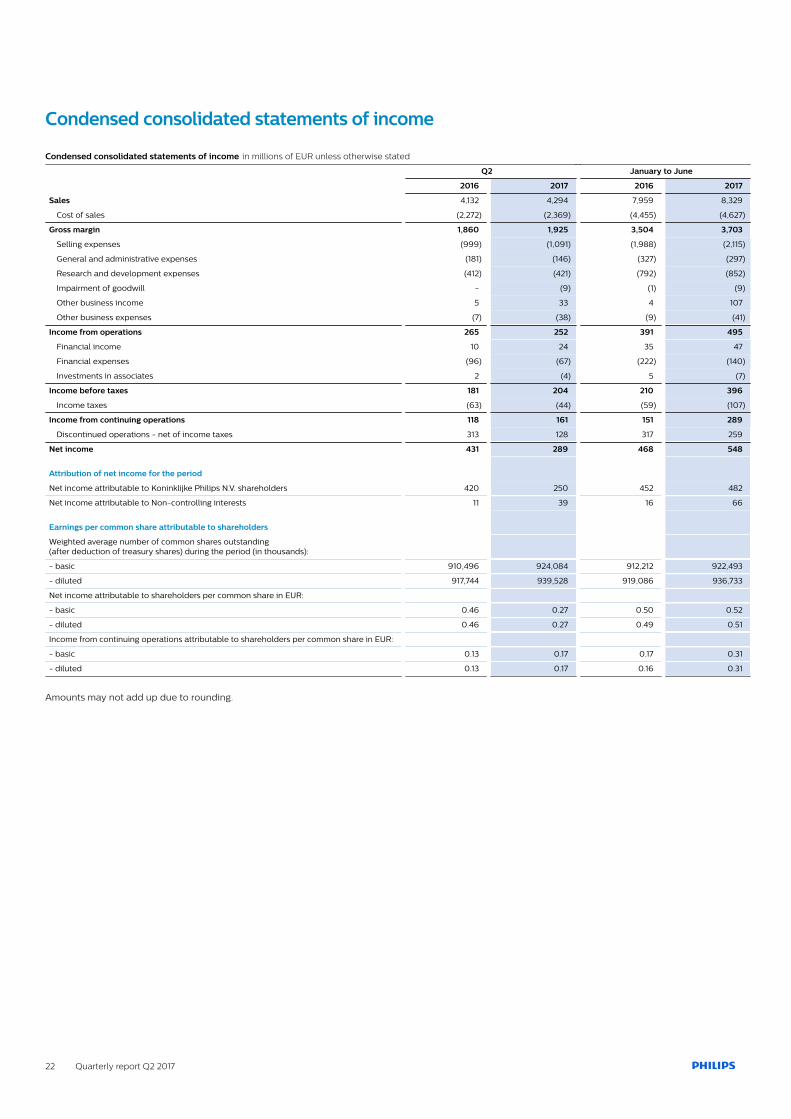
Condensed consolidated statements of income
Condensed consolidated statements of income in millions of EUR unless otherwise stated
Q2 January to June
2016 2017 2016 2017
Sales 4,132 4,294 7,959 8,329
Cost of sales (2,272) (2,369) (4,455) (4,627)
Gross margin 1,860 1,925 3,504 3,703
Selling expenses (999) (1,091) (1,988) (2,115)
General and administrative expenses (181) (146) (327) (297)
Research and development expenses (412) (421) (792) (852)
Impairment of goodwill - (9) (1) (9)
Other business income 5 33 4 107
Other business expenses (7) (38) (9) (41)
Income from operations 265 252 391 495
Financial income 10 24 35 47
Financial expenses (96) (67) (222) (140)
Investments in associates 2 (4) 5 (7)
Income before taxes 181 204 210 396
Income taxes (63) (44) (59) (107)
Income from continuing operations 118 161 151 289
Discontinued operations - net of income taxes 313 128 317 259
Net income 431 289 468 548
Attribution of net income for the period
Net income attributable to Koninklijke Philips N.V. shareholders 420 250 452 482
Net income attributable to Non-controlling interests 11 39 16 66
Earnings per common share attributable to shareholders
Weighted average number of common shares outstanding (after deduction of treasury shares) during the period (in thousands):
- basic 910,496 924,084 912,212 922,493
- diluted 917,744 939,528 919,086 936,733
Net income attributable to shareholders per common share in EUR:
- basic 0.46 0.27 0.50 0.52
- diluted 0.46 0.27 0.49 0.51
Income from continuing operations attributable to shareholders per common share in EUR:
- basic 0.13 0.17 0.17 0.31
- diluted 0.13 0.17 0.16 0.31
Amounts may not add up due to rounding.
Quarterly report Q2 2017 23
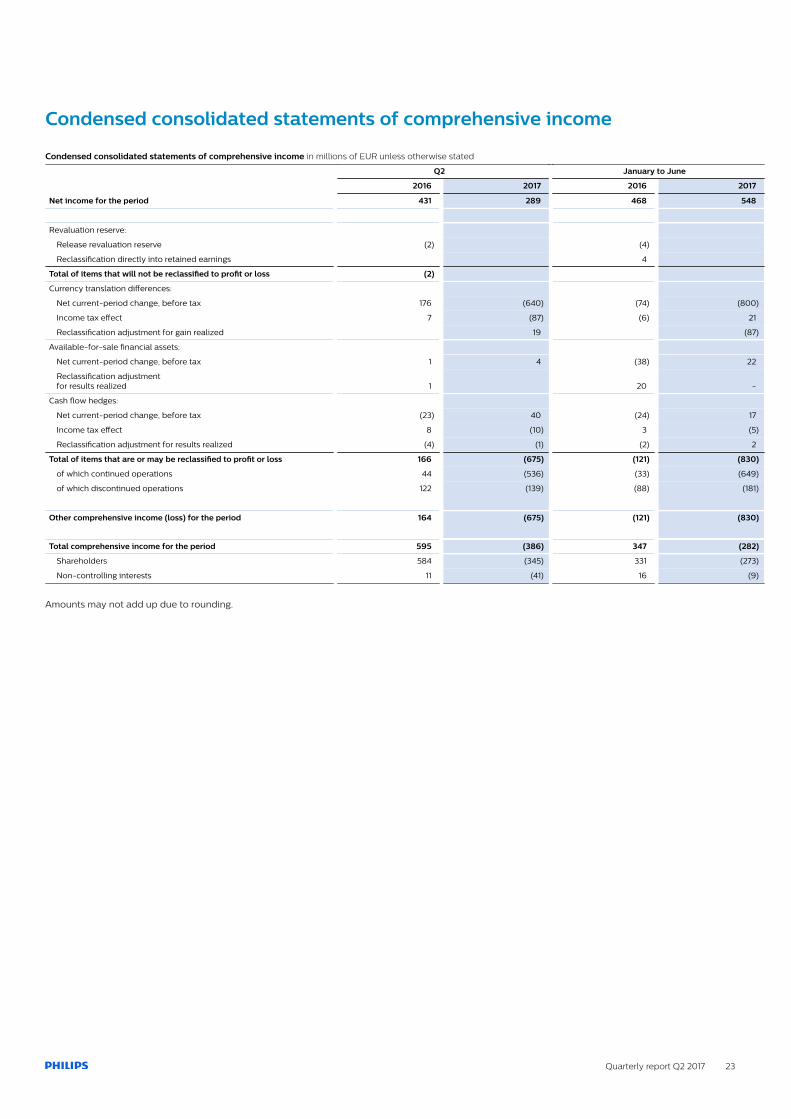
Condensed consolidated statements of comprehensive income
Condensed consolidated statements of comprehensive income in millions of EUR unless otherwise stated
Q2 January to June
2016 2017 2016 2017
Net income for the period 431 289 468 548
Revaluation reserve:
Release revaluation reserve (2) (4)
Reclassification directly into retained earnings 4
Total of items that will not be reclassified to profit or loss (2)
Currency translation differences:
Net current-period change, before tax 176 (640) (74) (800)
Income tax effect 7 (87) (6) 21
Reclassification adjustment for gain realized 19 (87)
Available-for-sale financial assets:
Net current-period change, before tax 1 4 (38) 22
Reclassification adjustmentfor results realized 1 20 -
Cash flow hedges:
Net current-period change, before tax (23) 40 (24) 17
Income tax effect 8 (10) 3 (5)
Reclassification adjustment for results realized (4) (1) (2) 2
Total of items that are or may be reclassified to profit or loss 166 (675) (121) (830)
of which continued operations 44 (536) (33) (649)
of which discontinued operations 122 (139) (88) (181)
Other comprehensive income (loss) for the period 164 (675) (121) (830)
Total comprehensive income for the period 595 (386) 347 (282)
Shareholders 584 (345) 331 (273)
Non-controlling interests 11 (41) 16 (9)
Amounts may not add up due to rounding.
24 Quarterly report Q2 2017
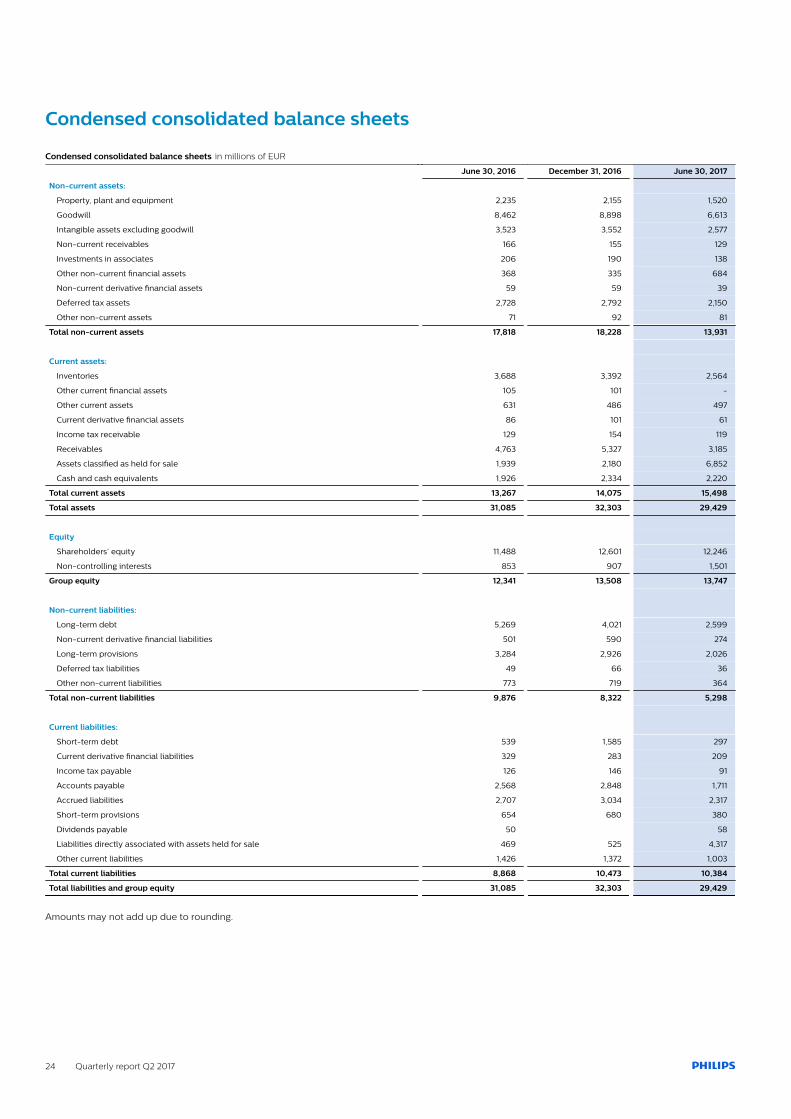
Condensed consolidated balance sheets
Condensed consolidated balance sheets in millions of EUR
June 30, 2016 December 31, 2016 June 30, 2017
Non-current assets:
Property, plant and equipment 2,235 2,155 1,520
Goodwill 8,462 8,898 6,613
Intangible assets excluding goodwill 3,523 3,552 2,577
Non-current receivables 166 155 129
Investments in associates 206 190 138
Other non-current financial assets 368 335 684
Non-current derivative financial assets 59 59 39
Deferred tax assets 2,728 2,792 2,150
Other non-current assets 71 92 81
Total non-current assets 17,818 18,228 13,931
Current assets:
Inventories 3,688 3,392 2,564
Other current financial assets 105 101 -
Other current assets 631 486 497
Current derivative financial assets 86 101 61
Income tax receivable 129 154 119
Receivables 4,763 5,327 3,185
Assets classified as held for sale 1,939 2,180 6,852
Cash and cash equivalents 1,926 2,334 2,220
Total current assets 13,267 14,075 15,498
Total assets 31,085 32,303 29,429
Equity
Shareholders’ equity 11,488 12,601 12,246
Non-controlling interests 853 907 1,501
Group equity 12,341 13,508 13,747
Non-current liabilities:
Long-term debt 5,269 4,021 2,599
Non-current derivative financial liabilities 501 590 274
Long-term provisions 3,284 2,926 2,026
Deferred tax liabilities 49 66 36
Other non-current liabilities 773 719 364
Total non-current liabilities 9,876 8,322 5,298
Current liabilities:
Short-term debt 539 1,585 297
Current derivative financial liabilities 329 283 209
Income tax payable 126 146 91
Accounts payable 2,568 2,848 1,711
Accrued liabilities 2,707 3,034 2,317
Short-term provisions 654 680 380
Dividends payable 50 58
Liabilities directly associated with assets held for sale 469 525 4,317
Other current liabilities 1,426 1,372 1,003
Total current liabilities 8,868 10,473 10,384
Total liabilities and group equity 31,085 32,303 29,429
Amounts may not add up due to rounding.

Quarterly report Q2 2017 25
Condensed consolidated statements of cash flows
Condensed consolidated statements of cash flows in millions of EUR
January to June
2016 2017
Cash flows from operating activities
Net income 468 548
Results of discontinued operations - net of income tax (317) (259)
Adjustments to reconcile net income (loss) to net cash provided by (used for) of operating activities:
Depreciation, amortization and impairments of fixed assets 468 472
Impairment of goodwill and other non-current financial assets 20 14
Net loss (gain) on sale of assets (106)
Interest income (21) (27)
Interest expense on debt, borrowings and other liabilities 145 99
Income taxes 59 107
Results from investments in associates (5) 3
Decrease (increase) in working capital: (93) (82)
Decrease (increase) in receivables and other current assets 175 621
Decrease (increase) in inventories (216) (246)
Increase (decrease) in accounts payable, accrued and other current liabilities (52) (456)
Decrease (increase) in non-current receivables, other asset and other liabilities (193) (309)
Increase (decrease) in provisions (208) (39)
Other items 85 216
Interest paid (145) (124)
Interest received 20 27
Dividends received from investments in associates 6 6
Income taxes paid (136) (173)
Net cash provided by (used for) operating activities 153 373
Cash flows from investing activities
Net capital expenditures (340) (208)
Purchase of intangible assets (40) (36)
Expenditures on development assets (142) (163)
Capital expenditures on property, plant and equipment (166) (179)
Proceeds from sale of property, plant and equipment 8 171
Net proceeds from (cash used for) derivatives and current financial assets (98) (155)
Purchase of other non-current financial assets (18) (32)
Proceeds from other non-current financial assets 6 5
Purchase of businesses, net of cash acquired (43) (48)
Net proceeds from sale of interests in businesses, net of cash disposed of - 62
Net cash used for investing activities (494) (376)
Cash flows from financing activities
Proceeds from issuance (payments) of short-term debt (1,178) 20
Principal payments on short-term portion of long-term debt (30) (1,250)
Proceeds from issuance of long-term debt 48 56
Re-issuance of treasury shares 24 121
Purchase of treasury shares (366) (180)
Proceeds from sale of Philips Lighting shares 863 1,065
Transaction costs paid for sale of Philips Lighting shares (19) (5)
Dividend paid to shareholders of Koninklijke Philips N.V. (280) (326)
Net cash provided by (used for) financing activities (937) (500)
Net cash provided by (used for) continuing operations (1,278) (503)
Net cash provided by (used for) discontinued operations 1,469 1,121
Net cash provided by (used for) continuing and discontinued operations 191 618
Effect of change in exchange rates on cash and cash equivalents (31) (120)
Cash and cash equivalents at the beginning of the period 1,766 2,334
Cash and cash equivalents at the end of the period 1,926 2,832
Cash and cash equivalents of discountinued operations at the end of the period 612
Cash and cash equivalents of continuing operations at the end of the period 1,926 2,220
For a number of reasons, principally the effects of translation differences, certain items in the statements of cash flows do not correspond to the differences between the balance sheetamounts for the respective items.
Amounts may not add up due to rounding.
26 Quarterly report Q2 2017
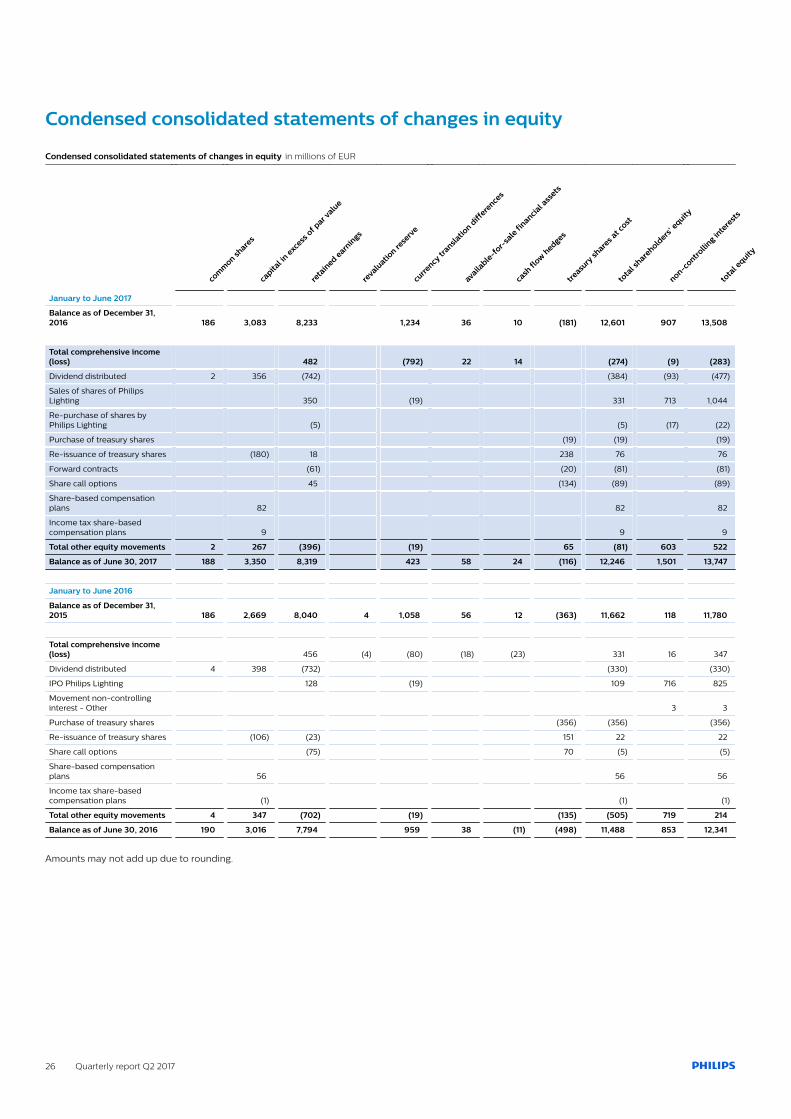
Condensed consolidated statements of changes in equity
Condensed consolidated statements of changes in equity in millions of EUR
com
mon sh
ares
capita
l in e
xcess
of p
ar valu
e
reta
ined e
arnin
gs
reva
luatio
n rese
rve
curre
ncy tr
anslatio
n diff
erence
s
availa
ble-f
or-sa
le fi
nancial a
ssets
cash
flow
hedges
treasu
ry sh
ares a
t cost
tota
l share
holders
’ equity
non-contro
lling in
tere
sts
tota
l equity
January to June 2017
Balance as of December 31,2016 186 3,083 8,233 1,234 36 10 (181) 12,601 907 13,508
Total comprehensive income(loss) 482 (792) 22 14 (274) (9) (283)
Dividend distributed 2 356 (742) (384) (93) (477)
Sales of shares of PhilipsLighting 350 (19) 331 713 1,044
Re-purchase of shares byPhilips Lighting (5) (5) (17) (22)
Purchase of treasury shares (19) (19) (19)
Re-issuance of treasury shares (180) 18 238 76 76
Forward contracts (61) (20) (81) (81)
Share call options 45 (134) (89) (89)
Share-based compensationplans 82 82 82
Income tax share-basedcompensation plans 9 9 9
Total other equity movements 2 267 (396) (19) 65 (81) 603 522
Balance as of June 30, 2017 188 3,350 8,319 423 58 24 (116) 12,246 1,501 13,747
January to June 2016
Balance as of December 31,2015 186 2,669 8,040 4 1,058 56 12 (363) 11,662 118 11,780
Total comprehensive income(loss) 456 (4) (80) (18) (23) 331 16 347
Dividend distributed 4 398 (732) (330) (330)
IPO Philips Lighting 128 (19) 109 716 825
Movement non-controllinginterest - Other 3 3
Purchase of treasury shares (356) (356) (356)
Re-issuance of treasury shares (106) (23) 151 22 22
Share call options (75) 70 (5) (5)
Share-based compensationplans 56 56 56
Income tax share-basedcompensation plans (1) (1) (1)
Total other equity movements 4 347 (702) (19) (135) (505) 719 214
Balance as of June 30, 2016 190 3,016 7,794 959 38 (11) (498) 11,488 853 12,341
Amounts may not add up due to rounding.
Quarterly report Q2 2017 27
Notes to the unaudited semi-annual condensed consolidated financial
statements
Prior-period financial statements have been restated for thetreatment of the segment Lighting as a discontinued operation(see note Discontinued operations and other assets classified asheld for sale). Movement schedules of balance sheet itemsinclude items from continuing and discontinued operations andtherefore cannot be reconciled to income from continuingoperations and cash flow from continuing operations only.
The note Discontinued operations and other assets classified asheld for sale will, in addition to the IFRS requirements, contain atable on material assets and liabilities that have been transferredfrom the respective balance sheet caption to Assets held for saleor to Liabilities associated with assets held for sale reported inthe balance sheet. If not deemed necessary these transfers willnot be mentioned in the notes of the balance sheet captiondisclosed. If for a balance sheet caption this is the only relevantchange compared with the Annual Report 2016, this materialchange will only be disclosed in the note Discontinuedoperations and other assets classified as held for sale.
Significant accounting policies
The significant accounting policies applied in these semi-annualcondensed consolidated financial statements are consistent withthose applied in the Annual Report 2016, except for theaccounting policy changes following from the adoption of newStandards and Amendments to Standards which are alsoexpected to be reflected in the Company’s consolidated IFRSfinancial statements as at and for the year ending December 31,2017 as disclosed in the Annual Report 2016. These new andamended standards did not have a material impact on theCompany’s semi-annual condensed consolidated financialstatements.
The Company has the following updates to information providedin the Annual Report 2016 about the standards issued but not yeteffective which may be the most relevant to the Company’sconsolidated IFRS financial statements.
IFRS 9 Financial InstrumentsIFRS 9 Financial Instruments brings together the classificationand measurement, impairment and hedge accounting phases ofthe IASB’s project to replace IAS 39 Financial Instruments:Recognition and Measurement. No changes to the assessmenton the transition to IFRS 9 have taken place compared with theAnnual Report 2016 disclosure.
ClassificationAt this moment the Company has assessed that the newclassification requirements will not have a material impact on itsaccounting for trade receivables, loans, investments in debtsecurities and investments in equity securities that are managedon a fair value basis. On the classification of financial liabilitiesunder IFRS 9, the Company’s current assessment did not indicateany material impact.
ImpairmentThe Company performed a detailed analysis on how itsimpairment provisions would be impacted by the newimpairment model under IFRS 9 and no material differences wereidentified.
Hedge accountingThe Company’s current plan is that it will elect to apply the newhedge accounting requirements of IFRS 9 rather than to make theaccounting policy choice to continue the IAS 39 requirements.
The Company’s current assessment indicated that the types ofhedge accounting relationships that the Company currentlydesignates should be capable of meeting the requirements ofIFRS 9 if the Company completes certain planned changes to itsinternal documentation and monitoring processes. Accordingly,the Company does not expect a significant impact on theaccounting for its hedging relationships.
IFRS 15 Revenue from Contracts with Customers
GeneralThe Company performed a subsequent analysis on topics whichwere initially assessed as not having material differences underIFRS 15 in comparison with current accounting standards. Thesetopics were related to the measurement of revenue related toseparately identifiable components (current relative fair valueapproach compared to relative standalone selling prices underIFRS 15) and the timing of revenue recognition for the sale ofgoods and rendering of services (current transfer of risks andrewards compared to new transfer of control). As anticipated inthe Annual Report 2016, no material differences have beenidentified so far as result of this analysis.
Royalty incomeAs previously disclosed in the Annual Report 2016, the Companyhas identified a potential impact on revenues originating from itsIP royalties (segment HealthTech Other). A detailed investigationinto contracts existing at the date of this report is still ongoing.Up to now, the Company estimates the transition impact to beapproximately EUR 30 million of deferred revenue that will berecorded as a retained earnings increase in equity, while theannual impact on future IP revenue is not material.
Costs of obtaining a contractThe Company identified that certain sales commissions paid tothird parties and internal employees are qualified as incrementalcosts of obtaining a contract. These costs are mostly paid andcapitalized upon issuance of sales orders and recognition ofrevenue related to the sale of goods or rendering of services.Such costs are commonly expensed in line with the revenuerecognition pattern of the related goods or services. Based onfurther investigation performed on these sales commissions, itwas noted that these are largely amortized within a year andtherefore Philips currently intends to implement the practicalexpedient of expensing sales commissions when incurred. Whenfollowing this practical expedient, an estimated adjustment of

28 Quarterly report Q2 2017
approximately EUR 70 million will be recorded as a retainedearnings decrease in equity on transition, while the annualimpact on future sales commission costs is not material.
TransitionThe Company has decided to apply the cumulative effecttransition method when adopting IFRS 15 in its Consolidatedfinancial statements for the year ending December 31, 2018,applying the new standard to those contracts that are notconsidered completed contracts at the date of initial application.This means that comparative figures will not be restated and willbe presented in accordance with current accounting standards.
IFRS 16 LeasesIFRS 16 must be adopted for periods beginning on or afterJanuary 1, 2019, with earlier adoption permitted if theabovementioned IFRS 15 has also been adopted. The Companyis currently assessing the impact of the new standard, and thereare no new developments compared to what was disclosed inthe Annual Report 2016.
Other changesDuring the first half of 2017, Philips entered into Money MarketFunds, which are part of the cash and cash equivalent balance.Due to this, the definition of cash and cash equivalents from theAnnual Report 2016 has been updated to the following: Cash andcash equivalents include all cash balances, money market fundsand short-term highly liquid investments with an originalmaturity of three months or less that are readily convertible intoknown amounts of cash.
As part of the financial reporting improvement process, thepresentation of the line item Investments in associates wasmoved into the subtotal Income before taxes in the Condensedconsolidated statements of income. This change did not impactthe results of operations or financial position.
Segment information
Sales and income (loss) from operations in millions of EUR unless otherwise stated
Q2 2016 Q2 2017
sales sales includingintercompany income from operations sales
sales includingintercompany income from operations
as a % of sales as a % of sales
Personal Health 1,661 1,663 199 12.0% 1,761 1,763 235 13.3%
Diagnosis & Treatment 1,600 1,614 111 6.9% 1,671 1,690 111 6.6%
Connected Care & HealthInformatics 767 781 46 6.0% 768 775 16 2.1%
HealthTech Other 105 159 (18) 96 135 (61)
Legacy Items 5 (73) 2 (49)
Inter-segment eliminations (89) (70)
Philips Group 4,132 4,132 265 6.4% 4,294 4,294 252 5.9%
Sales and income (loss) from operations in millions of EUR unless otherwise stated
January to June
2016 2017
sales sales includingintercompany income from operations sales
sales includingintercompany income from operations
as a % of sales as a % of sales
Personal Health 3,271 3,277 389 11.9% 3,480 3,489 466 13.4%
Diagnosis & Treatment 3,019 3,044 121 4.0% 3,162 3,186 154 4.9%
Connected Care & HealthInformatics 1,461 1,484 57 3.9% 1,500 1,519 4 0.3%
HealthTech Other 208 312 (27) 188 258 (49)
Legacy Items 5 (149) 1 2 (80)
Inter-segment eliminations (163) (125)
Philips Group 7,959 7,959 391 4.9% 8,329 8,329 495 5.9%
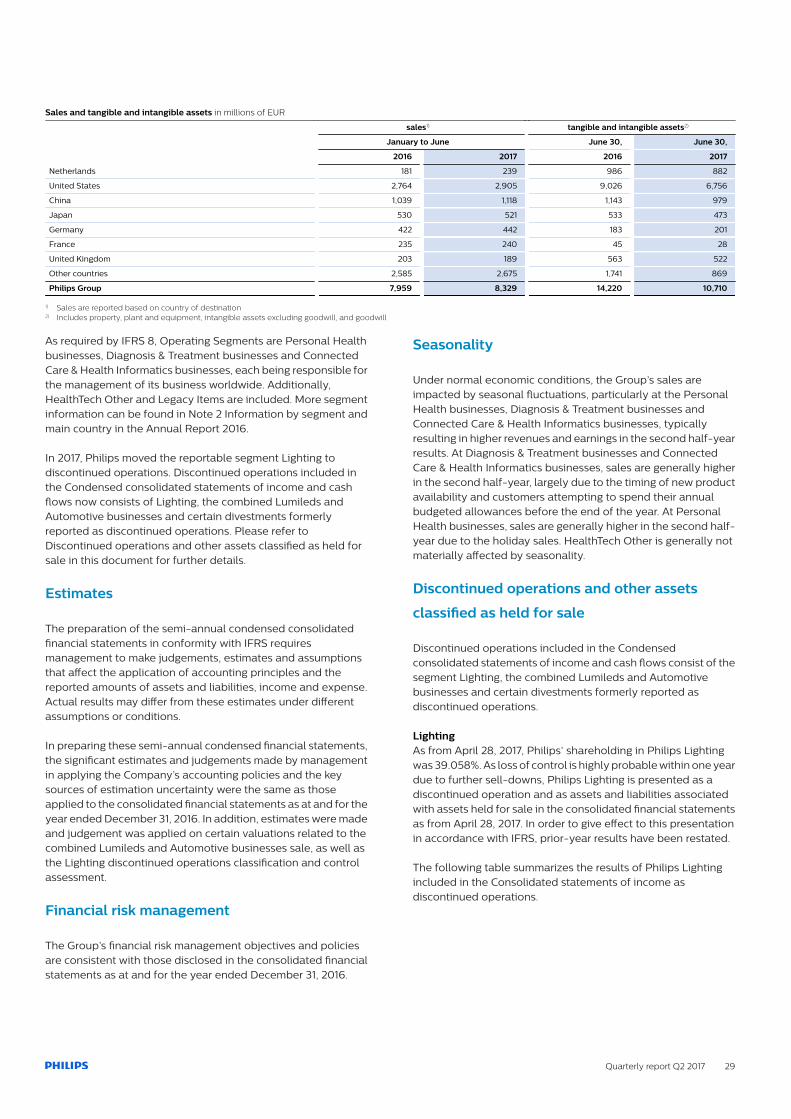
Quarterly report Q2 2017 29
Sales and tangible and intangible assets in millions of EUR
sales1) tangible and intangible assets2)
January to June June 30, June 30,
2016 2017 2016 2017
Netherlands 181 239 986 882
United States 2,764 2,905 9,026 6,756
China 1,039 1,118 1,143 979
Japan 530 521 533 473
Germany 422 442 183 201
France 235 240 45 28
United Kingdom 203 189 563 522
Other countries 2,585 2,675 1,741 869
Philips Group 7,959 8,329 14,220 10,710
1) Sales are reported based on country of destination2) Includes property, plant and equipment, intangible assets excluding goodwill, and goodwill
As required by IFRS 8, Operating Segments are Personal Healthbusinesses, Diagnosis & Treatment businesses and ConnectedCare & Health Informatics businesses, each being responsible forthe management of its business worldwide. Additionally,HealthTech Other and Legacy Items are included. More segmentinformation can be found in Note 2 Information by segment andmain country in the Annual Report 2016.
In 2017, Philips moved the reportable segment Lighting todiscontinued operations. Discontinued operations included inthe Condensed consolidated statements of income and cashflows now consists of Lighting, the combined Lumileds andAutomotive businesses and certain divestments formerlyreported as discontinued operations. Please refer toDiscontinued operations and other assets classified as held forsale in this document for further details.
Estimates
The preparation of the semi-annual condensed consolidatedfinancial statements in conformity with IFRS requiresmanagement to make judgements, estimates and assumptionsthat affect the application of accounting principles and thereported amounts of assets and liabilities, income and expense.Actual results may differ from these estimates under differentassumptions or conditions.
In preparing these semi-annual condensed financial statements,the significant estimates and judgements made by managementin applying the Company’s accounting policies and the keysources of estimation uncertainty were the same as thoseapplied to the consolidated financial statements as at and for theyear ended December 31, 2016. In addition, estimates were madeand judgement was applied on certain valuations related to thecombined Lumileds and Automotive businesses sale, as well asthe Lighting discontinued operations classification and controlassessment.
Financial risk management
The Group’s financial risk management objectives and policiesare consistent with those disclosed in the consolidated financialstatements as at and for the year ended December 31, 2016.
Seasonality
Under normal economic conditions, the Group’s sales areimpacted by seasonal fluctuations, particularly at the PersonalHealth businesses, Diagnosis & Treatment businesses andConnected Care & Health Informatics businesses, typicallyresulting in higher revenues and earnings in the second half-yearresults. At Diagnosis & Treatment businesses and ConnectedCare & Health Informatics businesses, sales are generally higherin the second half-year, largely due to the timing of new productavailability and customers attempting to spend their annualbudgeted allowances before the end of the year. At PersonalHealth businesses, sales are generally higher in the second half-year due to the holiday sales. HealthTech Other is generally notmaterially affected by seasonality.
Discontinued operations and other assets
classified as held for sale
Discontinued operations included in the Condensedconsolidated statements of income and cash flows consist of thesegment Lighting, the combined Lumileds and Automotivebusinesses and certain divestments formerly reported asdiscontinued operations.
LightingAs from April 28, 2017, Philips’ shareholding in Philips Lightingwas 39.058%. As loss of control is highly probable within one yeardue to further sell-downs, Philips Lighting is presented as adiscontinued operation and as assets and liabilities associatedwith assets held for sale in the consolidated financial statementsas from April 28, 2017. In order to give effect to this presentationin accordance with IFRS, prior-year results have been restated.
The following table summarizes the results of Philips Lightingincluded in the Consolidated statements of income asdiscontinued operations.
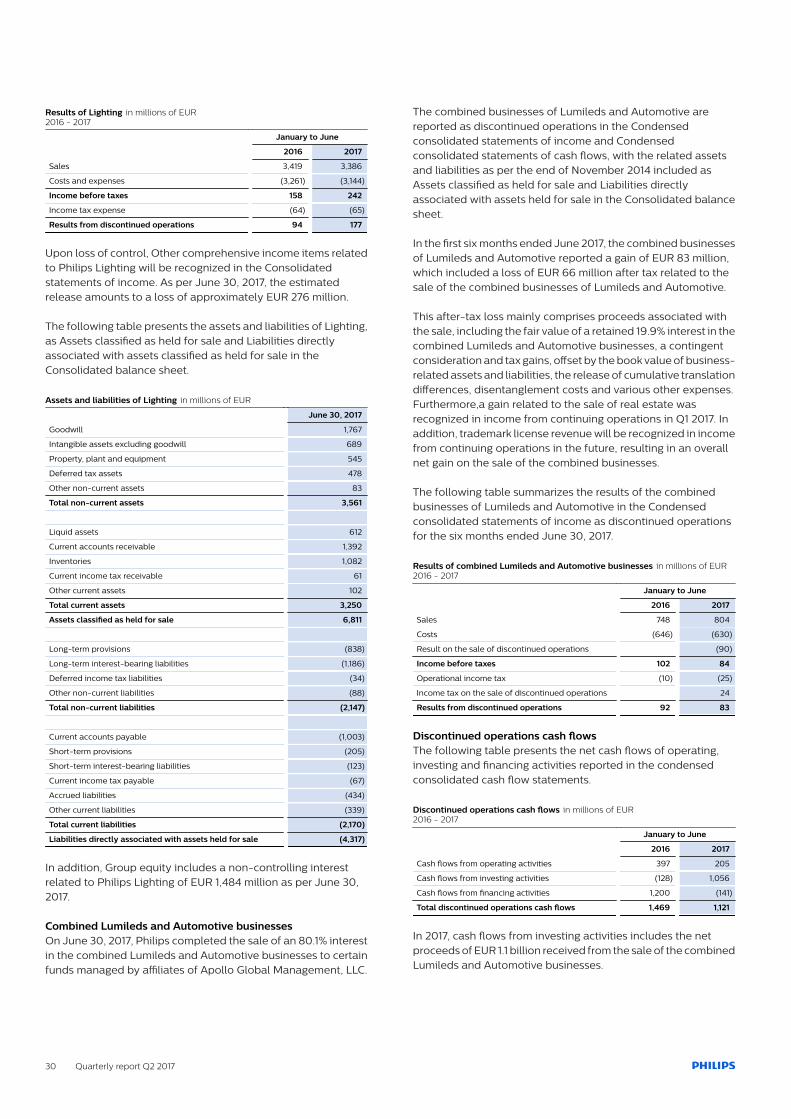
30 Quarterly report Q2 2017
Results of Lighting in millions of EUR2016 - 2017
January to June
2016 2017
Sales 3,419 3,386
Costs and expenses (3,261) (3,144)
Income before taxes 158 242
Income tax expense (64) (65)
Results from discontinued operations 94 177
Upon loss of control, Other comprehensive income items relatedto Philips Lighting will be recognized in the Consolidatedstatements of income. As per June 30, 2017, the estimatedrelease amounts to a loss of approximately EUR 276 million.
The following table presents the assets and liabilities of Lighting,as Assets classified as held for sale and Liabilities directlyassociated with assets classified as held for sale in theConsolidated balance sheet.
Assets and liabilities of Lighting in millions of EUR
June 30, 2017
Goodwill 1,767
Intangible assets excluding goodwill 689
Property, plant and equipment 545
Deferred tax assets 478
Other non-current assets 83
Total non-current assets 3,561
Liquid assets 612
Current accounts receivable 1,392
Inventories 1,082
Current income tax receivable 61
Other current assets 102
Total current assets 3,250
Assets classified as held for sale 6,811
Long-term provisions (838)
Long-term interest-bearing liabilities (1,186)
Deferred income tax liabilities (34)
Other non-current liabilities (88)
Total non-current liabilities (2,147)
Current accounts payable (1,003)
Short-term provisions (205)
Short-term interest-bearing liabilities (123)
Current income tax payable (67)
Accrued liabilities (434)
Other current liabilities (339)
Total current liabilities (2,170)
Liabilities directly associated with assets held for sale (4,317)
In addition, Group equity includes a non-controlling interestrelated to Philips Lighting of EUR 1,484 million as per June 30,2017.
Combined Lumileds and Automotive businessesOn June 30, 2017, Philips completed the sale of an 80.1% interestin the combined Lumileds and Automotive businesses to certainfunds managed by affiliates of Apollo Global Management, LLC.
The combined businesses of Lumileds and Automotive arereported as discontinued operations in the Condensedconsolidated statements of income and Condensedconsolidated statements of cash flows, with the related assetsand liabilities as per the end of November 2014 included asAssets classified as held for sale and Liabilities directlyassociated with assets held for sale in the Consolidated balancesheet.
In the first six months ended June 2017, the combined businessesof Lumileds and Automotive reported a gain of EUR 83 million,which included a loss of EUR 66 million after tax related to thesale of the combined businesses of Lumileds and Automotive.
This after-tax loss mainly comprises proceeds associated withthe sale, including the fair value of a retained 19.9% interest in thecombined Lumileds and Automotive businesses, a contingentconsideration and tax gains, offset by the book value of business-related assets and liabilities, the release of cumulative translationdifferences, disentanglement costs and various other expenses.Furthermore,a gain related to the sale of real estate wasrecognized in income from continuing operations in Q1 2017. Inaddition, trademark license revenue will be recognized in incomefrom continuing operations in the future, resulting in an overallnet gain on the sale of the combined businesses.
The following table summarizes the results of the combinedbusinesses of Lumileds and Automotive in the Condensedconsolidated statements of income as discontinued operationsfor the six months ended June 30, 2017.
Results of combined Lumileds and Automotive businesses in millions of EUR2016 - 2017
January to June
2016 2017
Sales 748 804
Costs (646) (630)
Result on the sale of discontinued operations (90)
Income before taxes 102 84
Operational income tax (10) (25)
Income tax on the sale of discontinued operations 24
Results from discontinued operations 92 83
Discontinued operations cash flowsThe following table presents the net cash flows of operating,investing and financing activities reported in the condensedconsolidated cash flow statements.
Discontinued operations cash flows in millions of EUR2016 - 2017
January to June
2016 2017
Cash flows from operating activities 397 205
Cash flows from investing activities (128) 1,056
Cash flows from financing activities 1,200 (141)
Total discontinued operations cash flows 1,469 1,121
In 2017, cash flows from investing activities includes the netproceeds of EUR 1.1 billion received from the sale of the combinedLumileds and Automotive businesses.
Quarterly report Q2 2017 31
In 2016, cash flows from investing activities includes EUR 144million related to the Funai arbitration and cash flows fromfinancing activities includes the loan facility of EUR 1.2 billiontaken out by Lighting.
Other assets classified as held for saleAssets and liabilities directly associated with assets held for salerelate to property, plant and equipment for an amount of EUR 38million and businesses of EUR 3 million at June 30, 2017.
Acquisitions and divestments
AcquisitionsIn the six months ended June 30, 2017, Philips completed threeacquisitions, which involved an aggregated consideration of EUR113 million.
CardioProlific Inc. (CardioProlific), a US-based, privately-heldcompany that is developing catheter-based thrombectomyapproaches to treat peripheral vascular disease, was the mostnotable acquisition. Philips completed this acquisition on June29, 2017.
Futhermore, prior to the publication date of this semi-annualreport Philips announced several acquisitions. Theseacquisitions are highlighted in Subsequent events, of thisdocument.
DivestmentsPhilips completed three divestments in the six months endedJune 30, 2017.
The most notable divestment was the sale of an 80.1% interest inLumileds to certain funds managed by affiliates of Apollo GlobalManagement, LLC. For details of this transaction reference ismade to Discontinued operations and other assets classified asheld for sale, of this document.
The two remaining divestments involved an aggregatedconsideration of EUR 53 million.
Interest in entities
In this section we discuss changes since December 31, 2016, inthe nature of, and risks associated with, the Company’s interestsin its consolidated entities and associates, and the effects ofthose interests on the Company’s financial position and financialperformance.
Interest in subsidiariesIn February and April 2017, the Company sold 32.167% of itsinterest in Philips Lighting through two accelerated bookbuildofferings to institutional investors, reducing its remaining interestin Philips Lighting from 71.225% to 39.058%. As part of theseofferings, Philips Lighting repurchased 7 million shares. Thesedivestment transactions did not impact the profit and lossaccount of the Company, as Philips Lighting continues to be fullyconsolidated because it is controlled by Royal Philips. After thebuy-back of 7 million shares and 653,373 shares (refer to Non-
controlling interests section in this note), Royal Philips’shareholding in Philips Lighting’s issued and outstanding sharecapital increased to 41.158 % as of June 30, 2017.
The two offerings had a positive impact on Shareholders’ equityof the Company of EUR 331 million. This amount includes (1) thedifference between the proceeds and the carrying value of32.167% of the shares in Philips Lighting (increase of EUR 356million), (2) costs related to the accelerated bookbuild offeringwhich were directly recognized in Shareholders’ equity (decreaseof EUR 6 million) and (3) certain reallocations of Comprehensiveincome items to Non-controlling interests (decrease of EUR 19million).
Sales and Income from operations of Philips Lighting arereflected in Discontinued operations and other assets classifiedas held for sale, of this document.
Non-controlling interestsAs a result of these offerings, Non-controlling interests increasedby EUR 713 million. This amount includes (1) the carrying value ofthe shares in Philips Lighting (increase of EUR 694 million) and(2) certain reallocations of Other comprehensive income itemsfrom Shareholders’ equity (increase of EUR 19 million). Pleaserefer also to Equity, of this document.
In May 2017, Philips Lighting distributed dividend of EUR 157million. Royal Philips received EUR 64 million whereas EUR 93million has been recognized in Non-controlling interests. In Mayand June 2017, Philips Lighting purchased an additional 653,373shares in market transactions. The transactions involved anamount of EUR 22 million, of which EUR 17 million was deductedfrom Non-controlling interests and EUR 5 million was directlyrecognized in Shareholder’s equity.
Net income attributable to Non-controlling interests was EUR 66million for the six months ended June 30, 2017 and mainly relatesto entitlements of non-controlling interest holders to net incomeof Philips Lighting.
Property, plant and equipment
The main increase in property, plant and equipment consists ofadditions of EUR 254 million (six months ended June 30, 2016:EUR 260 million). This was offset by depreciation and impairmentcharges of EUR 245 million (six months ended June 30, 2016: EUR284 million).
Goodwill
For information regarding the most recent impairment test of thedifferent cash-generating units, including Home Monitoring,reference is made to Note 11 Goodwill in the 2016 FinancialStatements. No events have been identified by management inthe first half of 2017 that required management to perform anupdate of the mentioned impairment tests.
32 Quarterly report Q2 2017
Intangible assets excluding goodwill
The changes in intangible assets excluding goodwill in 2017 aresummarized as follows:
Intangible assets excluding goodwill in millions of EUR unless otherwise stated
Book value as of December 31, 2016 3,552
Changes in book value:
Additions 215
Acquisitions 4
Amortization (291)
Impairment losses (22)
Divestments and transfers to assets classified as held for sale (710)
Translation differences (171)
Total changes (975)
Book value as of June 30, 2017 2,577
The additions for 2017 mainly comprise internally generatedassets of EUR 169 million for product development costs (sixmonths ended June 30, 2016: EUR 149 million).
Other current and non-current financial assets
Current financial assets decreased mainly due to redemption ofloans to TPV Technology Limited for the amount of EUR 90million.
As further described in Discontinued operations and other assetsclassified as held for sale, of this document, the Company soldthe majority stake in the combined Lumileds and Automotivebusinesses on June 30, 2017. The Company retained a 19.9%membership interest in Luminescence Coöperatief U.A., a Dutchcooperative with excluded liability (coöperatie met uitgeslotenaansprakelijkheid), which is classified as an available-for-salefinancial asset. The retained investment for the amount of EUR318 million is the main component of other non-current financialassets at June 30, 2017.
Equity
Shareholders’ equityIn June 2017, Philips settled a dividend of EUR 0.80 per commonshare, representing a total value of EUR 742 million includingcosts. Shareholders could elect for a cash dividend or a sharedividend. Approximately 48% of the shareholders elected for ashare dividend, resulting in the issuance of 11,264,163 newcommon shares. The cash dividend involved an amount of EUR384 million (including costs).
As of June 30, 2017, the issued and fully-paid share capitalconsists of 940,909,027 common shares, each share having a parvalue of EUR 0.20.
During the first six months of 2017, a total of 9,208,880 treasuryshares were delivered as a result of restricted share deliveries,performance share deliveries and stock option exercises.
A total of 5,864,526 shares were acquired in connection withPhilips’ Long Term Incentive (LTI) Program through (1) a dailyshare buy-back program (ended in January 2017), (2) a forward
share buy-back program (started in January 2017) and (3) theunwinding of options which were previously acquired to coverLTI commitments. During inception of the forward share buy-back contract in the first quarter of 2017, which involved 3 millionshares, EUR 81 million was deducted from Retained earnings andwas recorded against Short-term liabilities. The first exerciseunder the forward share buy-back contract involving 750,000shares took place in June 2017, resulting in a EUR 20 millionincrease in Retained earnings against a decrease in Treasuryshares. In the first half of 2017, the Company unwound 3,261,914EUR-denominated and 1,206,017 USD-denominated call optionsagainst the transfer of a same number of Royal Philips shares(4,467,931 shares) and an additional EUR 89 million cashpayment to the buyer of the call options.
On June 30, 2017, the total number of treasury shares amountedto 3,863,947, which were purchased at an average price of EUR29.94 per share.
The Company sold 32.167% of its interest in Philips Lighting in twotransactions that occurred in February and April 2017, reducingits remaining interest in this group company to 39.058%. Thispartial divestment transaction had a positive impact onShareholders’ equity of the Company of EUR 331 million. Forfurther details please refer to Interest in entities, of thisdocument.
Non-controlling interestsFor details on changes in Non-controlling interests (which mainlyrelate to transactions in Philips Lighting shares) refer to Interestin entities, of this document.
As of June 30, 2017, non-controlling interests mainly relate toPhilips Lighting N.V. (Non-controlling interest 58.842%) andGeneral Lighting Company (non-controlling interest 49%).
Short-term and long-term debt
At the end of Q2 2017, Philips had total debt of EUR 2,896 million,a decrease of EUR 2,710 million compared to December 31, 2016.Long-term debt was EUR 2,599 million, a decrease of EUR 1,422million, and short-term debt was EUR 297 million, a decrease ofEUR 1,288 million compared to December 31, 2016.
The movement of debt was mainly due to the early redemptionof the 5.750% Notes due 2018 in the aggregate principal amountof USD 1,250 million, together with a currency translation effecton remaining USD bonds. EUR 1,379 million relates to thereclassification of Lighting to Liabilities directly associated withassets held for sale.
At the end of Q2 2017, the majority of the long-term debtconsisted of USD 2,582 million of public bonds with a weightedaverage interest rate of 5.35%.
In January 2017, Philips entered into a USD 1,000 million and EUR300 million credit facility with a consortium of internationalbanks. Under this credit facility Philips drew USD 1,000 million inJanuary 2017. The facility was used for the early redemption ofthe aforementioned 5.750% Notes. In Q2 2017, the drawn amountwas repaid in full and the facility was cancelled.
Quarterly report Q2 2017 33
Effective April 21, 2017, Royal Philips signed a new EUR 1.0 billioncommitted standby revolving credit facility for general corporatepurposes, replacing the former EUR 1.8 billion facility of theCompany. The new facility has a tenor of five years and containstwo 1-year extension options. In line with the previous facility, itdoes not have a material adverse change clause, has no financialcovenants and no credit-rating-related acceleration possibilities.The Company has not drawn on this facility.
Provisions
The decrease in provisions by EUR 1.2 billion was attributable to:
• A decrease of EUR 1.1 billion due to the reclassification ofLighting to Liabilities directly associated with assets held forsale. For more details please refer to Discontinued operationsand other assets classified as held for sale, of this document;
• A decrease in provisions, excluding a restructuring-relatedprovision of EUR 70 million, which includes:• A decrease in litigation provisions of EUR 14 million, mainly
relating to movements in the CRT (Cathode Ray Tube)antitrust litigation. These movements included areclassification to Other liabilities as a result of a settlementon a part of the litigation, which was partially offset by anaddition due to updated information on a part of thelitigation;
• An increase in other provisions of EUR 72 million related toacquisitions.
• A decrease in restructuring-related provisions by EUR 5 million.
Contingent assets and liabilities
Contingent liabilities
Guarantees
Philips’ policy is to provide guarantees and other letters ofsupport only in writing. Philips does not stand by other forms ofsupport. Remaining off-balance-sheet business and credit-related guarantees provided on behalf of third parties andassociates decreased by EUR 12 million during the first six monthsof 2017.
Legal proceedings
The Company and certain of its group companies and formergroup companies are involved as a party in legal proceedings,including regulatory and other governmental proceedings,including discussions on potential remedial actions, relating tosuch matters as competition issues, intellectual property,commercial transactions, product liability, participations andenvironmental pollution. While it is not feasible to predict ordetermine the ultimate outcome of all pending or threatenedlegal proceedings, regulatory and governmental proceedings,the Company is of the opinion that the cases described belowmay have, or have had in the recent past, a significant impact onthe Company’s consolidated financial position, results ofoperations and cash flows.
For information regarding legal proceedings in which theCompany is involved, please refer to the Annual Report 2016.Significant developments regarding legal proceedings that haveoccurred since the publication of the Annual Report 2016 aredescribed below:
Cathode-Ray Tubes (CRT)In the CRT-related civil antitrust litigation pending in the UnitedStates the Company has now reached settlements with allindividual private plaintiffs, resolving all outstanding CRT-relatedcivil antitrust litigation in the United States except for the actionbrought by the state attorney general of Washington. The CRT-related civil antitrust actions reported in other jurisdictions arestill pending.
Patient Care & Monitoring SolutionsThe Company continues to be in advanced discussions onresolving a civil matter with the US Department of Justicerepresenting the US Food and Drug Administration (FDA), arisingfrom past inspections by the FDA in and prior to 2015. Thediscussions focus primarily on the Company’s compliance withthe FDA’s Quality System Regulations in the Company’sEmergency Care and Resuscitation (ECR) business in the UnitedStates. While discussions have not yet concluded, the Companyanticipates that the actions necessary to address the FDA’scompliance concerns will have a meaningful impact on theoperations of its ECR business.
Personal HealthIn December 2013, the European Commission commenced aninvestigation into alleged restrictions of online sales of consumerelectronics products and small domestic appliances. TheCompany was one of several companies involved in theinvestigation. In February 2017, the European Commissioncompleted its preliminary investigation and opened its formalproceedings.
Share-based compensation
Share-based compensation costs were EUR 60 million and EUR46 million in the first six months of 2017 and 2016 respectively.This includes the employee stock purchase plan of 3 million(2016: 3 million), which is not a share-based compensation thataffects equity. Share-based compensation costs exclude the costfor discontinued operations of EUR 28 million.
Performance and restricted shares grantedIn addition, during the first six months of 2017 the Companygranted 2,353,846 performance shares and 1,378,508 restrictedshares. In 2017, Philips Lighting introduced its own LTI plan.
Performance and restricted shares issued and optionsexercisedIn the first six months of 2017 a total of 5,126,534 performanceand 528,226 restricted shares were delivered to employees, and1,790,767 EUR-denominated options and 1,417,071 USD-denominated options were exercised at a weighted averageexercise price of EUR 20.33 and USD 27.17 respectively.
34 Quarterly report Q2 2017
Accelerate! options exercisedUnder the Accelerate! program, in the first six months of 2017 atotal of 228,500 EUR-denominated options and 62,000 USD-denominated options were exercised at an exercise price of EUR15.24 and USD 20.02 respectively.
Fair value of financial assets and liabilities
The estimated fair value of financial instruments has beendetermined by the Company using available market informationand appropriate valuation methods. The estimates presented arenot necessarily indicative of the amounts that will ultimately berealized by the Company upon maturity or disposal. The use ofdifferent market assumptions and/or estimation methods mayhave a material effect on the estimated fair value amounts.
For cash and cash equivalents, current receivables, accountspayable, interest accrual and short-term debt, the carryingamounts approximate fair value because of the short maturity ofthese instruments, and therefore fair value information is notincluded in the table below.
The fair value of Philips’ debt is estimated on the basis of thequoted market prices for certain issues, or on the basis ofdiscounted cash flow analysis based upon market rates plusPhilips’ spread for the particular tenors of the borrowingarrangement. Accrued interest is not included within the carryingamount or estimated fair value of debt.
The following table shows the carrying amounts and fair valuesof financial assets and financial liabilities, including their levels inthe fair value hierarchy. It does not include fair value informationfor financial assets and financial liabilities not measured at fairvalue if the carrying amount is a reasonable approximation of fairvalue.
Philips GroupFair value of financial assets and liabilities in millions of EUR
Balance as of December 31, 2016 Balance as of June 30, 2017
carrying amount estimated fair value carrying amount estimated fair value
Financial assets
Carried at fair value:
Available-for-sale financial assets 172 172 538 538
Securities classified as assets held for sale 1 1 - -
Fair value through profit and loss 27 27 28 28
Derivative financial instruments 160 160 100 100
Financial assets carried at fair value 360 666
Carried at (amortized) cost:
Cash and cash equivalents 2,334 2,220
Loans and receivables:
Loans - current 101 101 - -
Other non-current loans and receivables 134 118
Receivables - current 5,327 3,185
Receivables - non-current 155 129
Held-to-maturity investments 2 1
Financial assets carried at (amortized) costs 8,053 5,653
Financial liabilities
Carried at fair value:
Derivative financial instruments (873) (873) (483) (483)
Financial liabilities carried at fair value (873) (483)
Carried at (amortized) cost:
Accounts payable (2,848) (1,711)
Interest accrual (68) (42)
Debt (Corporate bond and finance lease) (5,095) (5,474) (2,511) (2,914)
Debt (Bank loans, overdrafts, etc.) (511) (384)
Financial liabilities carried at (amortized) costs (8,522) (4,649)
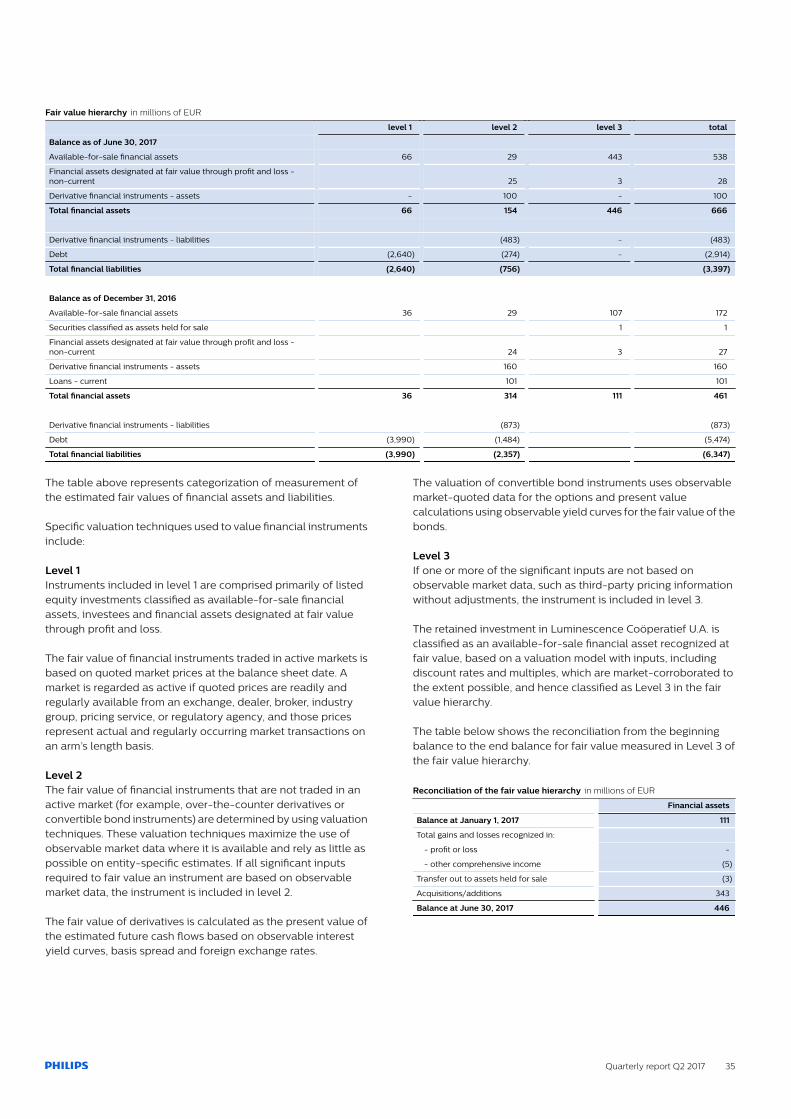
Quarterly report Q2 2017 35
Fair value hierarchy in millions of EUR
level 1 level 2 level 3 total
Balance as of June 30, 2017
Available-for-sale financial assets 66 29 443 538
Financial assets designated at fair value through profit and loss -non-current 25 3 28
Derivative financial instruments - assets - 100 - 100
Total financial assets 66 154 446 666
Derivative financial instruments - liabilities (483) - (483)
Debt (2,640) (274) - (2,914)
Total financial liabilities (2,640) (756) (3,397)
Balance as of December 31, 2016
Available-for-sale financial assets 36 29 107 172
Securities classified as assets held for sale 1 1
Financial assets designated at fair value through profit and loss -non-current 24 3 27
Derivative financial instruments - assets 160 160
Loans - current 101 101
Total financial assets 36 314 111 461
Derivative financial instruments - liabilities (873) (873)
Debt (3,990) (1,484) (5,474)
Total financial liabilities (3,990) (2,357) (6,347)
The table above represents categorization of measurement ofthe estimated fair values of financial assets and liabilities.
Specific valuation techniques used to value financial instrumentsinclude:
Level 1Instruments included in level 1 are comprised primarily of listedequity investments classified as available-for-sale financialassets, investees and financial assets designated at fair valuethrough profit and loss.
The fair value of financial instruments traded in active markets isbased on quoted market prices at the balance sheet date. Amarket is regarded as active if quoted prices are readily andregularly available from an exchange, dealer, broker, industrygroup, pricing service, or regulatory agency, and those pricesrepresent actual and regularly occurring market transactions onan arm’s length basis.
Level 2The fair value of financial instruments that are not traded in anactive market (for example, over-the-counter derivatives orconvertible bond instruments) are determined by using valuationtechniques. These valuation techniques maximize the use ofobservable market data where it is available and rely as little aspossible on entity-specific estimates. If all significant inputsrequired to fair value an instrument are based on observablemarket data, the instrument is included in level 2.
The fair value of derivatives is calculated as the present value ofthe estimated future cash flows based on observable interestyield curves, basis spread and foreign exchange rates.
The valuation of convertible bond instruments uses observablemarket-quoted data for the options and present valuecalculations using observable yield curves for the fair value of thebonds.
Level 3If one or more of the significant inputs are not based onobservable market data, such as third-party pricing informationwithout adjustments, the instrument is included in level 3.
The retained investment in Luminescence Coöperatief U.A. isclassified as an available-for-sale financial asset recognized atfair value, based on a valuation model with inputs, includingdiscount rates and multiples, which are market-corroborated tothe extent possible, and hence classified as Level 3 in the fairvalue hierarchy.
The table below shows the reconciliation from the beginningbalance to the end balance for fair value measured in Level 3 ofthe fair value hierarchy.
Reconciliation of the fair value hierarchy in millions of EUR
Financial assets
Balance at January 1, 2017 111
Total gains and losses recognized in:
- profit or loss -
- other comprehensive income (5)
Transfer out to assets held for sale (3)
Acquisitions/additions 343
Balance at June 30, 2017 446

36 Quarterly report Q2 2017
Subsequent events
Acquisition of RespirTechOn May 22, 2017, Philips announced that it has signed anagreement to acquire Respiratory Technologies, Inc.(RespirTech), a US-based provider of an innovative airwayclearance solution for patients with chronic respiratoryconditions. The transaction is expected to be completed in thecoming months, subject to customary closing conditions.
Acquisition of Electrical Geodesics, IncOn June 22, 2017, Philips announced an agreement to acquireElectrical Geodesics, Inc. (EGI), a US-based medical devicecompany that designs, develops and commercializes a range ofnon-invasive technologies used to monitor and interpret brainactivity. EGI is based in Eugene, Oregon (US) .
The transaction was closed on July 21, 2017. Under the terms ofthe agreement, EGI stockholders received, in cash, 105.4 penceper EGI share, totalling approximately EUR 33 million.
Acquisition of The Spectranetics CorporationOn June 28, 2017, Philips and The Spectranetics Corporation(Spectanetrics), a US-based global leader in vascularintervention and lead management solutions, announced thatthey have entered into a definitive merger agreement. Pursuantto the agreement, Philips commenced a tender offer on July 12,2017 to acquire all of the issued and outstanding shares ofSpectranetics for USD 38.50 per share, to be paid in cash uponcompletion, representing an amount of approximately 1.5 billion.
The transaction is structured as a cash tender offer by Philips forall of the issued and outstanding shares of Spectranetics.Pursuant to the merger agreement, the transaction is subject tocustomary closing conditions, including certain regulatoryclearances in the US and in certain non-US jurisdictions.
Expanded collaboration with Profound Medical Corp.On June 30, 2017, Philips announced that it has entered into anagreement with Profound Medical Corp. (Profound), based inCanada, to deepen the existing collaboration and increase thescale of its MR-guided High Intensity Focused Ultrasoundbusiness. As part of the agreement, Philips will obtain a minorityinterest of approximately 12% based on the issued andoutstanding Profound shares upon completion of thetransaction. The transaction is subject to customary closingconditions, including the relevant regulatory approvals, and isexpected to close in the second half of 2017.
Acquisition of Health & Parenting Ltd.On July 4, 2017, Philips announced that it has acquired Health &Parenting Ltd, a leading UK-based developer of healthcare andfamily-related mobile applications for expectant and newparents.
Acquisition of TomTecOn July 18, 2017, Philips announced that it has signed anagreement to acquire TomTec Imaging Systems GmbH (TomTec),a leading provider of intelligent image-analysis software,especially for diagnostic ultrasound. TomTec is headquartered inMunich, Germany.
Philips US pension fundIn July 2017, Philips made a contribution of USD 250 million tothe Philips US pension fund to further improve the funding ratio.This will further decrease Philips’ interest costs going forward.

http://www.philips.com/investorrelations© 2017 Koninklijke Philips N.V. All rights reserved.