quarterly report pursuant to section 13 … (sept8) final.pdftable of contents 3 calavo growers,...
TRANSCRIPT
Table of Contents
UNITED STATES SECURITIES AND EXCHANGE COMMISSION
WASHINGTON, D.C. 20549
FORM 10-Q
⌧ QUARTERLY REPORT PURSUANT TO SECTION 13 OR 15(d) OF THE SECURITIES EXCHANGE ACT OF 1934
For the quarterly period ended July 31, 2016
OR
" TRANSITION REPORT PURSUANT TO SECTION 13 OR 15(d)
OF THE SECURITIES EXCHANGE ACT OF 1934
Commission file number: 000-33385
CALAVO GROWERS, INC. (Exact name of registrant as specified in its charter)
California 33-0945304 (State of incorporation) (I.R.S. Employer Identification No.)
1141-A Cummings Road
Santa Paula, California 93060 (Address of principal executive offices) (Zip code)
(805) 525-1245
(Registrant's telephone number, including area code) Indicate by check mark whether the registrant (1) has filed all reports required to be filed by Section 13 or 15(d) of the Securities Exchange Act of 1934 during the preceding 12 months (or for such shorter period that the registrant was required to file such reports), and (2) has been subject to such filing requirements for the past 90 days. Yes ⌧ No " Indicate by check mark whether the Registrant has submitted electronically and posted on its corporate web site, if any, every Interactive Data File required to be submitted and posted pursuant to Rule 405 of Regulation S-T (§232.405 of this chapter) during the preceding 12 months (or for such shorter period that the registrant was required to submit and post such files). Yes ⌧ No " Indicate by check mark whether the registrant is a large accelerated filer, an accelerated filer, a non-accelerated filer, or a smaller reporting company. See the definitions of “large accelerated filer,” “accelerated filer,” and “smaller reporting company” in Rule 12b-2 of the Exchange Act (Check one): Large accelerated filer ⌧ Accelerated filer " Non-accelerated filer " Smaller Reporting Company " (Do not check if a smaller reporting company) Indicate by check mark whether the registrant is a shell company (as defined in Rule 12b-2 of the Exchange Act).Yes " No ⌧ Registrant's number of shares of common stock outstanding as of July 31, 2016 was 17,438,408
Table of Contents
2
CAUTIONARY STATEMENT This Quarterly Report on Form 10-Q, including “Management’s Discussion and Analysis of Financial Condition and Results of Operations” in Item 2, contains forward-looking statements that involve risks, uncertainties and assumptions. If the risks or uncertainties ever materialize or the assumptions prove incorrect, the results of Calavo Growers, Inc. and its consolidated subsidiaries (Calavo, the Company, we, us or our) may differ materially from those expressed or implied by such forward-looking statements and assumptions. All statements, other than statements of historical fact, are statements that could be deemed forward-looking statements, including, but not limited to, any projections of revenue, margins, expenses, earnings, earnings per share, tax provisions, cash flows, currency exchange rates, the impact of acquisitions or other financial items; any statements of the plans, strategies and objectives of management for future operations, including execution of restructuring and integration plans; any statements regarding current or future macroeconomic trends or events and the impact of those trends and events on Calavo and its financial performance; any statements regarding pending investigations, claims or disputes; any statements of expectation or belief; and any statements of assumptions underlying any of the foregoing. Risks, uncertainties and assumptions include the impact of macroeconomic trends and events; the competitive pressures faced by Calavo's businesses; the development and transition of new products and services (and the enhancement of existing products and services) to meet customer needs; integration and other risks associated with business combinations; the hiring and retention of key employees; the resolution of pending investigations, claims and disputes; and other risks that are described herein, including, but not limited to, the items discussed in Item 1A, Risk Factors, in our Annual Report on Form 10-K for the fiscal year ended October 31, 2015, and those detailed from time to time in our other filings with the Securities and Exchange Commission. Calavo assumes no obligation and does not intend to update these forward-looking statements.

Table of Contents
3
CALAVO GROWERS, INC.
INDEX
PAGE PART I. FINANCIAL INFORMATION Item 1. Financial Statements (unaudited): Consolidated Condensed Balance Sheets – July 31, 2016 and October 31, 2015 4
Consolidated Condensed Statements of Income – Three Months and Nine Months Ended July 31, 2016 and 2015
5
Consolidated Condensed Statements of Comprehensive Income – Three Months and Nine Months Ended July 31, 2016 and 2015
6
Consolidated Condensed Statements of Cash Flows – Nine Months Ended July 31, 2016 and 2015 7 Notes to Consolidated Condensed Financial Statements 8 Item 2. Management's Discussion and Analysis of Financial Condition and Results of Operations 19 Item 3. Quantitative and Qualitative Disclosures About Market Risk 27 Item 4. Controls and Procedures 27 PART II. OTHER INFORMATION Item 1. Legal Proceedings 27 Item 1A. Risk Factors 28 Item 6. Exhibits 28 Signatures 29
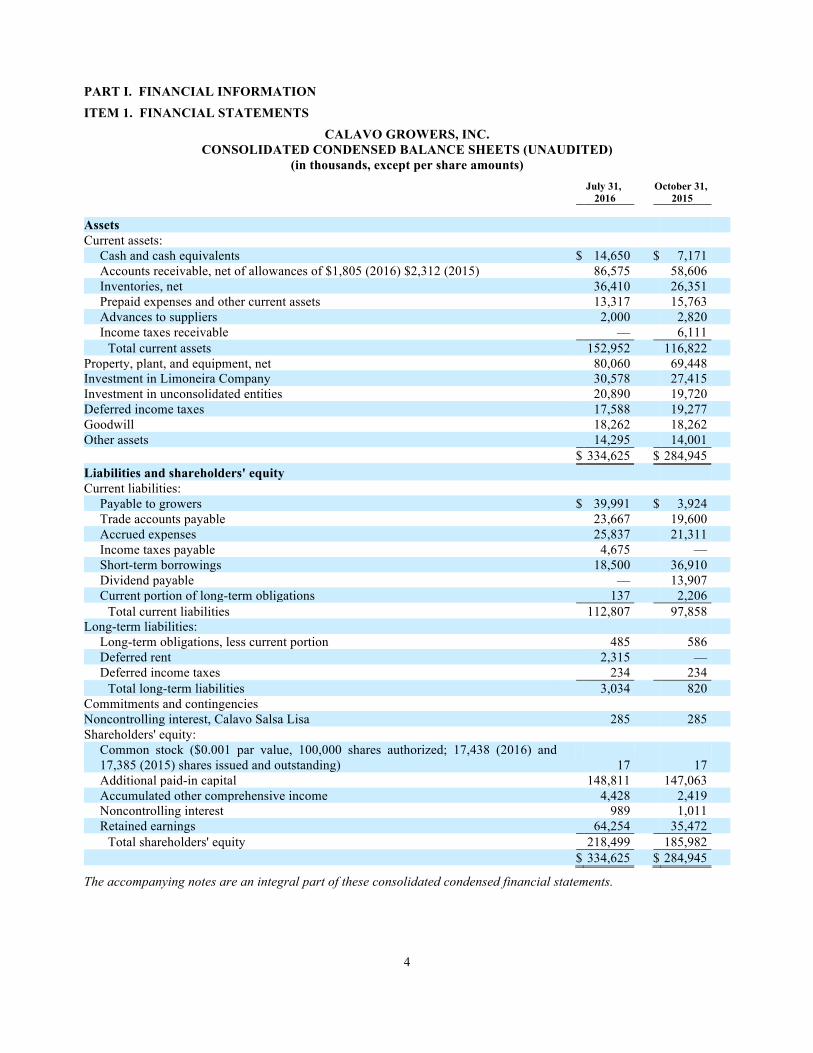
Table of Contents
4
PART I. FINANCIAL INFORMATION
ITEM 1. FINANCIAL STATEMENTS
CALAVO GROWERS, INC. CONSOLIDATED CONDENSED BALANCE SHEETS (UNAUDITED)
(in thousands, except per share amounts)
July 31, October 31, 2016 2015 Assets Current assets:
Cash and cash equivalents $ 14,650 $ 7,171 Accounts receivable, net of allowances of $1,805 (2016) $2,312 (2015) 86,575 58,606 Inventories, net 36,410 26,351 Prepaid expenses and other current assets 13,317 15,763 Advances to suppliers 2,000 2,820 Income taxes receivable — 6,111
Total current assets 152,952 116,822 Property, plant, and equipment, net 80,060 69,448 Investment in Limoneira Company 30,578 27,415 Investment in unconsolidated entities 20,890 19,720 Deferred income taxes 17,588 19,277 Goodwill 18,262 18,262 Other assets 14,295 14,001 $ 334,625 $ 284,945 Liabilities and shareholders' equity Current liabilities:
Payable to growers $ 39,991 $ 3,924 Trade accounts payable 23,667 19,600 Accrued expenses 25,837 21,311 Income taxes payable 4,675 — Short-term borrowings 18,500 36,910 Dividend payable — 13,907 Current portion of long-term obligations 137 2,206
Total current liabilities 112,807 97,858 Long-term liabilities:
Long-term obligations, less current portion 485 586 Deferred rent 2,315 — Deferred income taxes 234 234
Total long-term liabilities 3,034 820 Commitments and contingencies Noncontrolling interest, Calavo Salsa Lisa 285 285 Shareholders' equity:
Common stock ($0.001 par value, 100,000 shares authorized; 17,438 (2016) and 17,385 (2015) shares issued and outstanding) 17 17 Additional paid-in capital 148,811 147,063 Accumulated other comprehensive income 4,428 2,419 Noncontrolling interest 989 1,011 Retained earnings 64,254 35,472
Total shareholders' equity 218,499 185,982 $ 334,625 $ 284,945
The accompanying notes are an integral part of these consolidated condensed financial statements.
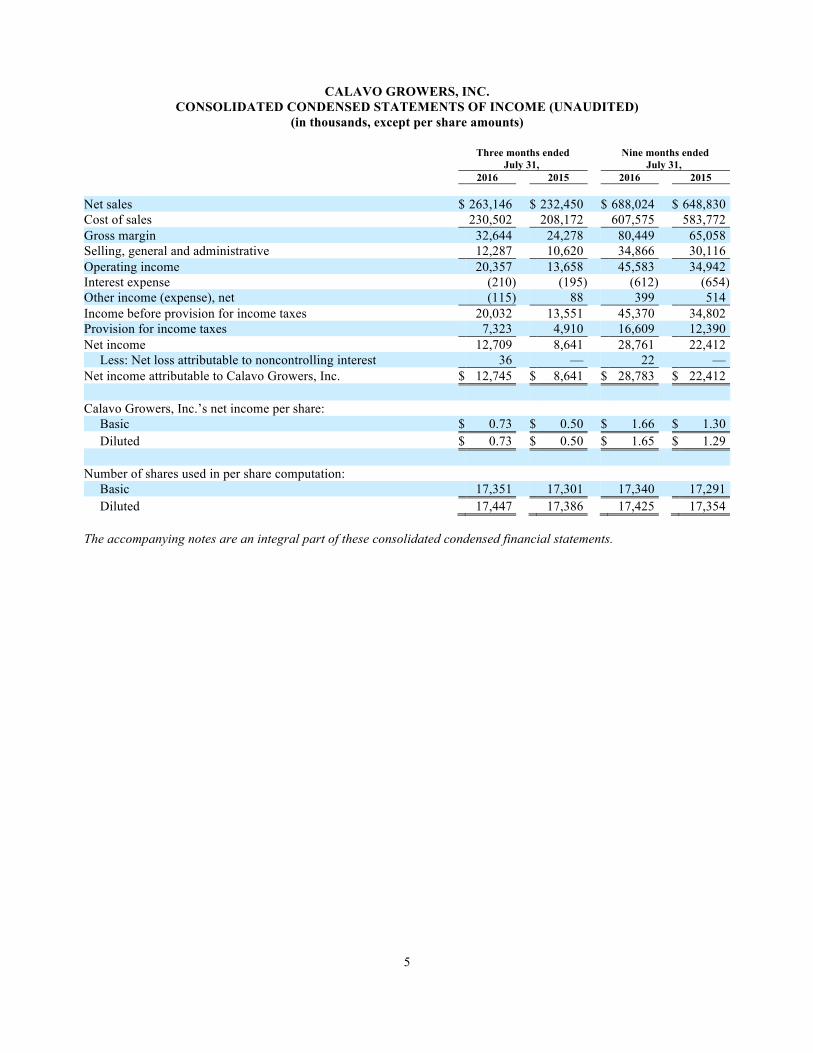
Table of Contents
5
CALAVO GROWERS, INC. CONSOLIDATED CONDENSED STATEMENTS OF INCOME (UNAUDITED)
(in thousands, except per share amounts)
Three months ended Nine months ended July 31, July 31, 2016 2015 2016 2015 Net sales $ 263,146 $ 232,450 $ 688,024 $ 648,830 Cost of sales 230,502 208,172 607,575 583,772 Gross margin 32,644 24,278 80,449 65,058 Selling, general and administrative 12,287 10,620 34,866 30,116 Operating income 20,357 13,658 45,583 34,942 Interest expense (210) (195) (612) (654) Other income (expense), net (115) 88 399 514 Income before provision for income taxes 20,032 13,551 45,370 34,802 Provision for income taxes 7,323 4,910 16,609 12,390 Net income 12,709 8,641 28,761 22,412
Less: Net loss attributable to noncontrolling interest 36 — 22 — Net income attributable to Calavo Growers, Inc. $ 12,745 $ 8,641 $ 28,783 $ 22,412 Calavo Growers, Inc.’s net income per share:
Basic $ 0.73 $ 0.50 $ 1.66 $ 1.30 Diluted $ 0.73 $ 0.50 $ 1.65 $ 1.29
Number of shares used in per share computation:
Basic 17,351 17,301 17,340 17,291 Diluted 17,447 17,386 17,425 17,354
The accompanying notes are an integral part of these consolidated condensed financial statements.
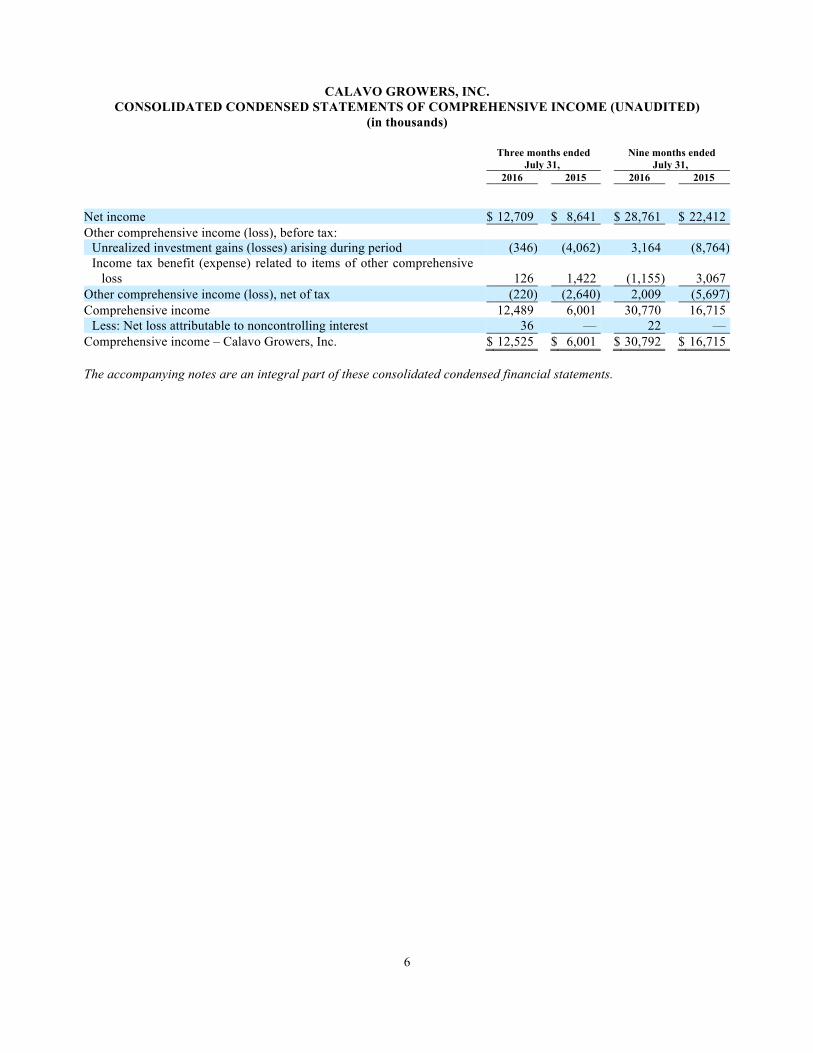
Table of Contents
6
CALAVO GROWERS, INC. CONSOLIDATED CONDENSED STATEMENTS OF COMPREHENSIVE INCOME (UNAUDITED)
(in thousands)
Three months ended Nine months ended July 31, July 31, 2016 2015 2016 2015 Net income $ 12,709 $ 8,641 $ 28,761 $ 22,412 Other comprehensive income (loss), before tax:
Unrealized investment gains (losses) arising during period (346) (4,062) 3,164 (8,764) Income tax benefit (expense) related to items of other comprehensive
loss 126 1,422 (1,155) 3,067 Other comprehensive income (loss), net of tax (220) (2,640) 2,009 (5,697) Comprehensive income 12,489 6,001 30,770 16,715
Less: Net loss attributable to noncontrolling interest 36 — 22 — Comprehensive income – Calavo Growers, Inc. $ 12,525 $ 6,001 $ 30,792 $ 16,715 The accompanying notes are an integral part of these consolidated condensed financial statements.
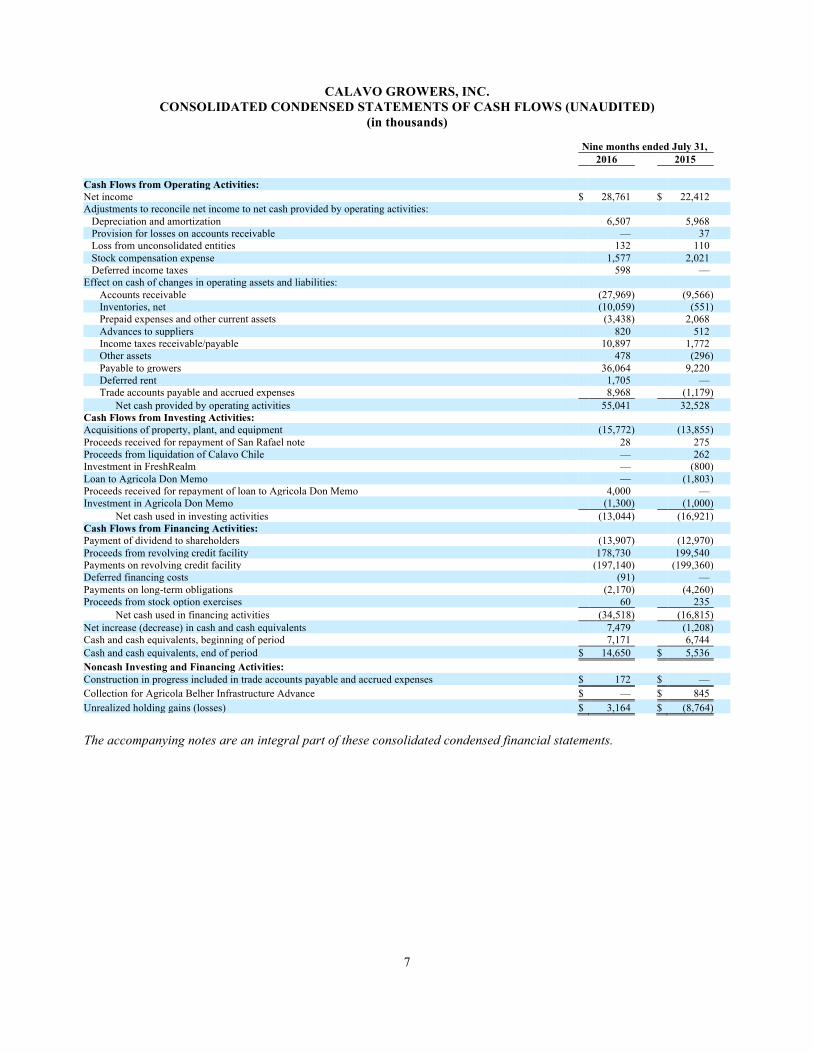
Table of Contents
7
CALAVO GROWERS, INC. CONSOLIDATED CONDENSED STATEMENTS OF CASH FLOWS (UNAUDITED)
(in thousands)
Nine months ended July 31, 2016 2015 Cash Flows from Operating Activities: Net income $ 28,761 $ 22,412 Adjustments to reconcile net income to net cash provided by operating activities:
Depreciation and amortization 6,507 5,968 Provision for losses on accounts receivable — 37 Loss from unconsolidated entities 132 110 Stock compensation expense 1,577 2,021 Deferred income taxes 598 —
Effect on cash of changes in operating assets and liabilities: Accounts receivable (27,969) (9,566) Inventories, net (10,059) (551) Prepaid expenses and other current assets (3,438) 2,068 Advances to suppliers 820 512 Income taxes receivable/payable 10,897 1,772 Other assets 478 (296) Payable to growers 36,064 9,220 Deferred rent 1,705 — Trade accounts payable and accrued expenses 8,968 (1,179)
Net cash provided by operating activities 55,041 32,528 Cash Flows from Investing Activities: Acquisitions of property, plant, and equipment (15,772) (13,855) Proceeds received for repayment of San Rafael note 28 275 Proceeds from liquidation of Calavo Chile — 262 Investment in FreshRealm — (800) Loan to Agricola Don Memo — (1,803) Proceeds received for repayment of loan to Agricola Don Memo 4,000 — Investment in Agricola Don Memo (1,300) (1,000)
Net cash used in investing activities (13,044) (16,921) Cash Flows from Financing Activities: Payment of dividend to shareholders (13,907) (12,970) Proceeds from revolving credit facility 178,730 199,540 Payments on revolving credit facility (197,140) (199,360) Deferred financing costs (91) — Payments on long-term obligations (2,170) (4,260) Proceeds from stock option exercises 60 235
Net cash used in financing activities (34,518) (16,815) Net increase (decrease) in cash and cash equivalents 7,479 (1,208) Cash and cash equivalents, beginning of period 7,171 6,744 Cash and cash equivalents, end of period $ 14,650 $ 5,536 Noncash Investing and Financing Activities: Construction in progress included in trade accounts payable and accrued expenses $ 172 $ — Collection for Agricola Belher Infrastructure Advance $ — $ 845 Unrealized holding gains (losses) $ 3,164 $ (8,764)
The accompanying notes are an integral part of these consolidated condensed financial statements.

Table of Contents
8
CALAVO GROWERS, INC. NOTES TO CONSOLIDATED CONDENSED FINANCIAL STATEMENTS
(UNAUDITED) 1. Description of the business Business
Calavo Growers, Inc. (Calavo, the Company, we, us or our), is a global leader in the avocado industry and an
expanding provider of value-added fresh food. Our expertise in marketing and distributing avocados, prepared avocados, and other perishable foods allows us to deliver a wide array of fresh and prepared food products to food distributors, produce wholesalers, supermarkets, and restaurants on a worldwide basis. We procure avocados principally from California and Mexico. Through our various operating facilities, we (i) sort, pack, and/or ripen avocados, tomatoes and Hawaiian grown papayas, (ii) process and package fresh cut fruit and vegetables, salads, wraps, sandwiches, fresh snacking products and a variety of behind-the-glass deli items and (iii) produce and package guacamole and salsa.
The accompanying unaudited consolidated condensed financial statements have been prepared by the Company in
accordance with accounting principles generally accepted in the United States and with the instructions to Form 10-Q and Article 10 of Regulation S-X of the Securities and Exchange Commission. Accordingly, they do not include all of the information and footnotes required by accounting principles generally accepted in the United States for complete financial statements. In the opinion of management, the accompanying unaudited consolidated condensed financial statements contain all adjustments, consisting of adjustments of a normal recurring nature necessary to present fairly the Company’s financial position, results of operations and cash flows. The results of operations for interim periods are not necessarily indicative of the results that may be expected for a full year. These statements should be read in conjunction with the consolidated financial statements and notes thereto included in the Company’s Annual Report on Form 10-K for the fiscal year ended October 31, 2015. Recently Issued Accounting Standards
In March 2016, the Financial Accounting Standards Board ("FASB") issued an Accounting Standards Update ("ASU"), which simplifies several aspects of the accounting for share-based payment transactions, including the income tax consequences, classification of awards as either equity or liabilities, and classification on the statement of cash flows. This ASU will be effective for us beginning the first day of our 2017 fiscal year. Early adoption is permitted. We are evaluating the impact of adoption of this ASU on our financial condition, result of operations and cash flows, but do not expect the adoption of this ASU to have a significant effect.
In February 2016, the FASB issued an ASU, which requires a dual approach for lessee accounting under which a
lessee would account for leases as finance leases or operating leases. Both finance leases and operating leases will result in the lessee recognizing a right-of use asset and a corresponding lease liability. For finance leases, the lessee would recognize interest expense and amortization of the right-of-use asset, and for operating leases, the lessee would recognize a straight-line total lease expense. The guidance also requires qualitative and specific quantitative disclosures to supplement the amounts recorded in the financial statements so that users can understand more about the nature of an entity’s leasing activities, including significant judgments and changes in judgments. This ASU will be effective for us beginning the first day of our 2019 fiscal year. Early adoption is permitted. We are evaluating the impact of adoption of this ASU on our financial condition, result of operations and cash flows, but do not expect the adoption of this ASU to have a significant effect.
In January 2016, the FASB issued an ASU, which requires equity investments (except those accounted for under the
equity method of accounting) to be measured at fair value with changes in fair value recognized in net income. The guidance is effective for interim and annual periods beginning after December 15, 2017. Early adoption is permitted. We are evaluating the impact of adoption of this ASU on our financial condition, result of operations and cash flows.
In November 2015, the FASB issued an ASU, which amends the existing accounting standards for income taxes. The
amendment required companies to report their deferred tax liabilities and deferred tax assets each as a single non-current

Table of Contents
9
item on their classified balance sheets. The Company elected to adopt the amendments in the first quarter of fiscal year 2016 and applied them prospectively to the current period presented, as permitted by the standard. The adoption of the amendments had no impact on the Company's net earnings or cash flow from operations for any period presented.
In July 2015, the FASB issued an ASU for measuring inventory. The core principal of the guidance is that an entity should measure inventory at the lower of cost and net realizable value. Net realizable value is the estimated selling prices in the ordinary course of business, less reasonably predictable costs of completion, disposal, and transportation. The guidance is effective for us on a prospective basis beginning on the first day of our fiscal 2017 year. Early adoption is permitted. We are evaluating the impact of adoption of this ASU on our financial condition, result of operations and cash flows, but do not expect the adoption of this ASU to have a significant effect.
In May 2014, the FASB amended the existing accounting standards for revenue recognition. The amendments are based on the principle that revenue should be recognized to depict the transfer of promised goods or services to customers in an amount that reflects the consideration to which the entity expects to be entitled in exchange for those goods or services. We are required to adopt the amendments in the first quarter of fiscal 2018. Early adoption is not permitted. The amendments may be applied retrospectively to each prior period presented or retrospectively with the cumulative effect recognized as of the date of initial application. We do not expect the adoption of these amendments to have a material impact on our financial statements. 2. Information regarding our operations in different segments
We report our operations in three different business segments: (1) Fresh products, (2) Calavo Foods, and (3) RFG. These three business segments are presented based on how information is used by our Chief Executive Officer to measure performance and allocate resources. The Fresh products segment includes all operations that involve the distribution of avocados and other fresh produce products. The Calavo Foods segment represents all operations related to the purchase, manufacturing, and distribution of prepared products, including guacamole and salsa. The RFG segment represents all operations related to the manufacturing and distribution of fresh-cut fruit, ready-to-eat vegetables, recipe-ready vegetables and other fresh prepared food products. Selling, general and administrative expenses, as well as other non-operating income/expense items, are evaluated by our Chief Executive Officer in the aggregate. We do not allocate assets, or specifically identify them to, our operating segments. The following table sets forth sales by product category, by segment (in thousands):
Three months ended July 31, 2016 Three months ended July 31, 2015 Fresh Calavo Fresh Calavo products Foods RFG Total products Foods RFG Total Third-party sales: Avocados $ 151,364 $ — $ — $ 151,364 $ 132,165 $ — $ — $ 132,165 Tomatoes 2,581 — — 2,581 1,154 — — 1,154 Papayas 2,614 — — 2,614 2,559 — — 2,559 Other fresh
products 433 — — 433 607 — — 607 Food service — 12,929 — 12,929 — 13,575 — 13,575 Retail and club — 6,056 91,631 97,687 — 6,331 79,927 86,258 Total gross sales 156,992 18,985 91,631 267,608 136,485 19,906 79,927 236,318 Less sales
incentives (863) (2,700) (899) (4,462) (715) (2,421) (732) (3,868) Net sales $ 156,129 $ 16,285 $ 90,732 $ 263,146 $ 135,770 $ 17,485 $ 79,195 $ 232,450

Table of Contents
10
Nine months ended July 31, 2016 Nine months ended July 31, 2015 Fresh Calavo Fresh Calavo products Foods RFG Total products Foods RFG Total Third-party
sales: Avocados $ 354,785 $ — $ — $ 354,785 $ 360,334 $ — $ — $ 360,334 Tomatoes 34,375 — — 34,375 16,813 — — 16,813 Papayas 7,054 — — 7,054 6,977 — — 6,977 Other fresh
products 854 — — 854 2,571 — — 2,571 Food service — 37,998 — 37,998 — 37,223 — 37,223 Retail and club — 16,636 248,176 264,812 — 17,451 218,547 235,998 Total gross sales 397,068 54,634 248,176 699,878 386,695 54,674 218,547 659,916 Less sales
incentives (1,804) (7,508) (2,542) (11,854) (1,423) (7,673) (1,990) (11,086) Net sales $ 395,264 $ 47,126 $ 245,634 $ 688,024 $ 385,272 $ 47,001 $ 216,557 $ 648,830
Fresh Calavo products Foods RFG Total (All amounts are presented in thousands)
Three months ended July 31, 2016 Net sales $ 156,129 $ 16,285 $ 90,732 $ 263,146 Cost of sales 137,845 10,484 82,173 230,502 Gross margin $ 18,284 $ 5,801 $ 8,559 $ 32,644
Three months ended July 31, 2015 Net sales $ 135,770 $ 17,485 $ 79,195 $ 232,450 Cost of sales 126,105 11,415 70,652 208,172 Gross margin $ 9,665 $ 6,070 $ 8,543 $ 24,278
For the three months ended July 31, 2016 and 2015, inter-segment sales and cost of sales of $1.4 million and
$0.6 million between Fresh products and RFG were eliminated. For the three months ended July 31, 2016 and 2015, inter-segment sales and cost of sales of $0.7 million and $0.6 million between Calavo Foods and RFG were eliminated.
Fresh Calavo products Foods RFG Total (All amounts are presented in thousands)
Nine months ended July 31, 2016 Net sales $ 395,264 $ 47,126 $ 245,634 $ 688,024 Cost of sales 352,424 29,228 225,923 607,575 Gross margin $ 42,840 $ 17,898 $ 19,711 $ 80,449
Nine months ended July 31, 2015 Net sales $ 385,272 $ 47,001 $ 216,557 $ 648,830 Cost of sales 355,991 31,725 196,056 583,772 Gross margin $ 29,281 $ 15,276 $ 20,501 $ 65,058
For the nine months ended July 31, 2016 and 2015, inter-segment sales and cost of sales of $2.8 million and
$1.2 million between Fresh products and RFG were eliminated. For the nine months ended July 31, 2016 and 2015, inter-segment sales and cost of sales of $2.0 million and $1.3 million between Calavo Foods and RFG were eliminated.
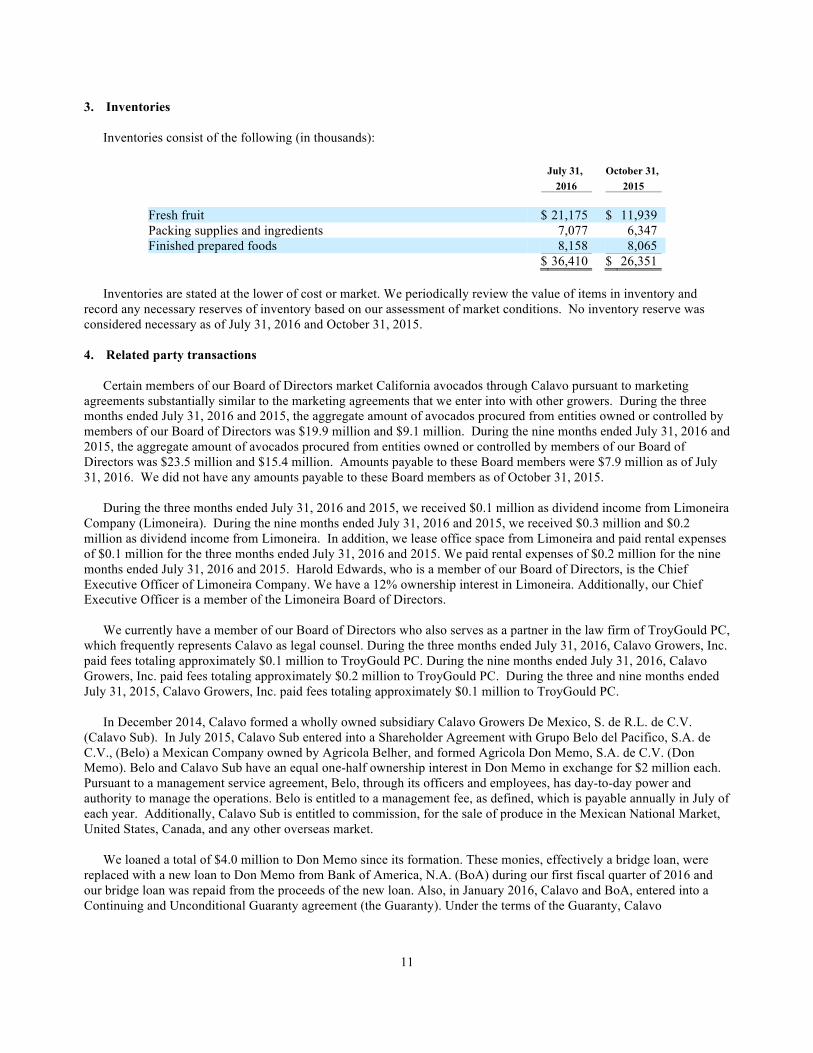
Table of Contents
11
3. Inventories
Inventories consist of the following (in thousands):
July 31, October 31, 2016 2015 Fresh fruit $ 21,175 $ 11,939 Packing supplies and ingredients 7,077 6,347 Finished prepared foods 8,158 8,065 $ 36,410 $ 26,351
Inventories are stated at the lower of cost or market. We periodically review the value of items in inventory and
record any necessary reserves of inventory based on our assessment of market conditions. No inventory reserve was considered necessary as of July 31, 2016 and October 31, 2015. 4. Related party transactions
Certain members of our Board of Directors market California avocados through Calavo pursuant to marketing agreements substantially similar to the marketing agreements that we enter into with other growers. During the three months ended July 31, 2016 and 2015, the aggregate amount of avocados procured from entities owned or controlled by members of our Board of Directors was $19.9 million and $9.1 million. During the nine months ended July 31, 2016 and 2015, the aggregate amount of avocados procured from entities owned or controlled by members of our Board of Directors was $23.5 million and $15.4 million. Amounts payable to these Board members were $7.9 million as of July 31, 2016. We did not have any amounts payable to these Board members as of October 31, 2015.
During the three months ended July 31, 2016 and 2015, we received $0.1 million as dividend income from Limoneira
Company (Limoneira). During the nine months ended July 31, 2016 and 2015, we received $0.3 million and $0.2 million as dividend income from Limoneira. In addition, we lease office space from Limoneira and paid rental expenses of $0.1 million for the three months ended July 31, 2016 and 2015. We paid rental expenses of $0.2 million for the nine months ended July 31, 2016 and 2015. Harold Edwards, who is a member of our Board of Directors, is the Chief Executive Officer of Limoneira Company. We have a 12% ownership interest in Limoneira. Additionally, our Chief Executive Officer is a member of the Limoneira Board of Directors.
We currently have a member of our Board of Directors who also serves as a partner in the law firm of TroyGould PC,
which frequently represents Calavo as legal counsel. During the three months ended July 31, 2016, Calavo Growers, Inc. paid fees totaling approximately $0.1 million to TroyGould PC. During the nine months ended July 31, 2016, Calavo Growers, Inc. paid fees totaling approximately $0.2 million to TroyGould PC. During the three and nine months ended July 31, 2015, Calavo Growers, Inc. paid fees totaling approximately $0.1 million to TroyGould PC.
In December 2014, Calavo formed a wholly owned subsidiary Calavo Growers De Mexico, S. de R.L. de C.V.
(Calavo Sub). In July 2015, Calavo Sub entered into a Shareholder Agreement with Grupo Belo del Pacifico, S.A. de C.V., (Belo) a Mexican Company owned by Agricola Belher, and formed Agricola Don Memo, S.A. de C.V. (Don Memo). Belo and Calavo Sub have an equal one-half ownership interest in Don Memo in exchange for $2 million each. Pursuant to a management service agreement, Belo, through its officers and employees, has day-to-day power and authority to manage the operations. Belo is entitled to a management fee, as defined, which is payable annually in July of each year. Additionally, Calavo Sub is entitled to commission, for the sale of produce in the Mexican National Market, United States, Canada, and any other overseas market.
We loaned a total of $4.0 million to Don Memo since its formation. These monies, effectively a bridge loan, were
replaced with a new loan to Don Memo from Bank of America, N.A. (BoA) during our first fiscal quarter of 2016 and our bridge loan was repaid from the proceeds of the new loan. Also, in January 2016, Calavo and BoA, entered into a Continuing and Unconditional Guaranty agreement (the Guaranty). Under the terms of the Guaranty, Calavo

Table of Contents
12
unconditionally guarantees and promises to pay BoA any and all Indebtedness, as defined therein, of our unconsolidated subsidiary Don Memo to BoA. Belo has also entered into a similar guarantee with BoA. These guarantees relate to a new loan in the amount of $4.5 million loan from BoA to Don Memo that closed in January 2016.
Additionally, in the third quarter of fiscal 2016 we invested an additional $1.3 million into Don Memo. In total we have contributed $3.3 million, representing Calavo Sub’s 50% ownership in Don Memo, which is included as an investment in unconsolidated entities on our balance sheet. We make advances to Don Memo for operating purposes, provide additional advances as shipments are made during the season, and return the proceeds from tomato sales under this program to Don Memo, net of our commission and aforementioned advances. As of July 31, 2016 and October 31, 2015, we advanced $0.9 million and $1.8 million to Don Memo, which is netted with payable to growers. During the three and nine months ended July 31, 2016, we incurred $1.4 million and $3.5 million of expenses to Don Memo pursuant to our consignment agreement.
We had grower advances due from Belher of $2.0 million and $3.0 million as of July 31, 2016 and October 31, 2015.
In addition, we had infrastructure advances due from Belher of $1.8 million as of July 31, 2016 and October 31, 2015. Of these infrastructure advances $1.0 million was recorded as receivable in prepaid and other current assets. The remaining $0.8 million of these infrastructure advances are recorded in other assets. During the three months ended July 31, 2016 and 2015, we incurred $0.5 million and $0.1 million to Belher pursuant to our consignment agreement. During the nine months ended July 31, 2016 and 2015, we incurred $26.0 million and $14.2 million of expenses to Belher pursuant to our consignment agreement.
In August 2015, we entered into Shareholder’s Agreement with various partners and created Avocados de Jalisco,
S.A.P.I. de C.V. (“Avocados de Jalisco”). Avocados de Jalisco is a Mexican corporation created to engage in procuring, packing and selling avocados. This entity is approximately 80% owned by Calavo and was consolidated in our financial statements. Avocados de Jalisco has built a packinghouse located in Jalisco, Mexico and such packinghouse is expected to be operational at the end of the fourth quarter of 2016. As of July 31, 2016 and October 31, 2015, we have made preseason advances of approximately $0.2 million and $0.3 million to various partners of Avocados de Jalisco.
The three previous owners and current executives of RFG have a majority ownership of certain entities that provide various services to RFG. RFG’s California operating facility leases a building from LIG partners, LLC (LIG) pursuant to an operating lease. RFG’s Texas operating facility leases a building from THNC, LLC (THNC) pursuant to an operating lease. Additionally, RFG sells cut produce and purchases raw materials, obtains transportation services, and shares costs for certain utilities with Third Coast Fresh Distribution (Third Coast). LIG, THNC and Third Coast are majority owned by entities owned by three employees of Calavo (former/current executives of RFG). See the following tables for the related party activity and balances for fiscal year 2016 and 2015:
Three months ended July 31, (in thousands) 2016 2015 Rent paid to LIG $ 133 $ 131 Rent paid to THNC, LLC $ 77 $ 76 Sales to Third Coast $ - $ 31 Purchases from Third Coast $ - $ 86
Nine months ended July 31, (in thousands) 2016 2015 Rent paid to LIG $ 395 $ 392 Rent paid to THNC, LLC $ 229 $ 228 Sales to Third Coast $ - $ 270 Purchases from Third Coast $ - $ 203

Table of Contents
13
5. Other assets Other assets consist of the following (in thousands):
July 31, October 31, 2016 2015 Intangibles, net $ 3,660 $ 4,613 Mexican IVA (i.e. value-added) taxes receivable 7,061 5,853 Grower advances 123 346 Loan to Agricola Belher 800 800 Loan to FreshRealm members 315 307 Notes receivable from San Rafael 1,305 1,286 Other 1,031 796 $ 14,295 $ 14,001
Intangible assets consist of the following (in thousands):
July 31, 2016 October 31, 2015 Weighted- Gross Net Gross Net Average Carrying Accum. Book Carrying Accum. Book Useful Life Value Amortization Value Value Amortization Value Customer list/relationships 8.0 years $ 7,640 $ (4,997) $ 2,643 $ 7,640 $ (4,282) $ 3,358 Trade names 8.2 years 2,760 (2,342) 418 2,760 (2,164) 596 Trade secrets/recipes 9.3 years 630 (306) 324 630 (270) 360 Brand name intangibles indefinite 275 — 275 275 — 275 Non-competition agreements 5.0 years 267 (267) — 267 (243) 24 Intangibles, net $ 11,572 $ (7,912) $ 3,660 $ 11,572 $ (6,959) $ 4,613
We anticipate recording amortization expense of approximately $0.3 million for the remainder of fiscal 2016, with $1.1 million for fiscal year 2017 and 2018, $0.7 million for fiscal year 2019, and $0.2 million for years thereafter, through fiscal year 2023.
See Note 11, for additional information related to Mexican IVA taxes.
6. Stock-Based Compensation
In April 2011, our shareholders approved the Calavo Growers, Inc. 2011 Management Incentive Plan (the “2011 Plan”). All directors, officers, employees and consultants (including prospective directors, officers, employees and consultants) of Calavo and its subsidiaries are eligible to receive awards under the 2011 Plan. Up to 1,500,000 shares of common stock may be issued by Calavo under the 2011 Plan.
On January 4, 2016, all 12 of our non-employee directors were granted 1,750 restricted shares each (total of 21,000
shares). These shares have full voting rights and participate in dividends as if unrestricted. The closing price of our stock on such date was $48.46. On January 3, 2017, as long as the directors are still serving on the board, these shares lose their restriction and become non-forfeitable and transferable. These shares were granted pursuant to our 2011 Management Incentive Plan. The total recognized stock-based compensation expense for these grants was $0.3 million for the three months ended July 31, 2016. The total recognized stock-based compensation expense for these grants was $0.6 million for the nine months ended July 31, 2016.
On January 8, 2016, our executive officers were granted a total of 24,582 restricted shares. These shares have full
voting rights and participate in dividends as if unrestricted. The closing price of our stock on such date was $48.68. These shares vest in one-third increments, on an annual basis, beginning January 8, 2017. These shares were granted pursuant to our 2011 Management Incentive Plan. The total recognized stock-based compensation expense for these
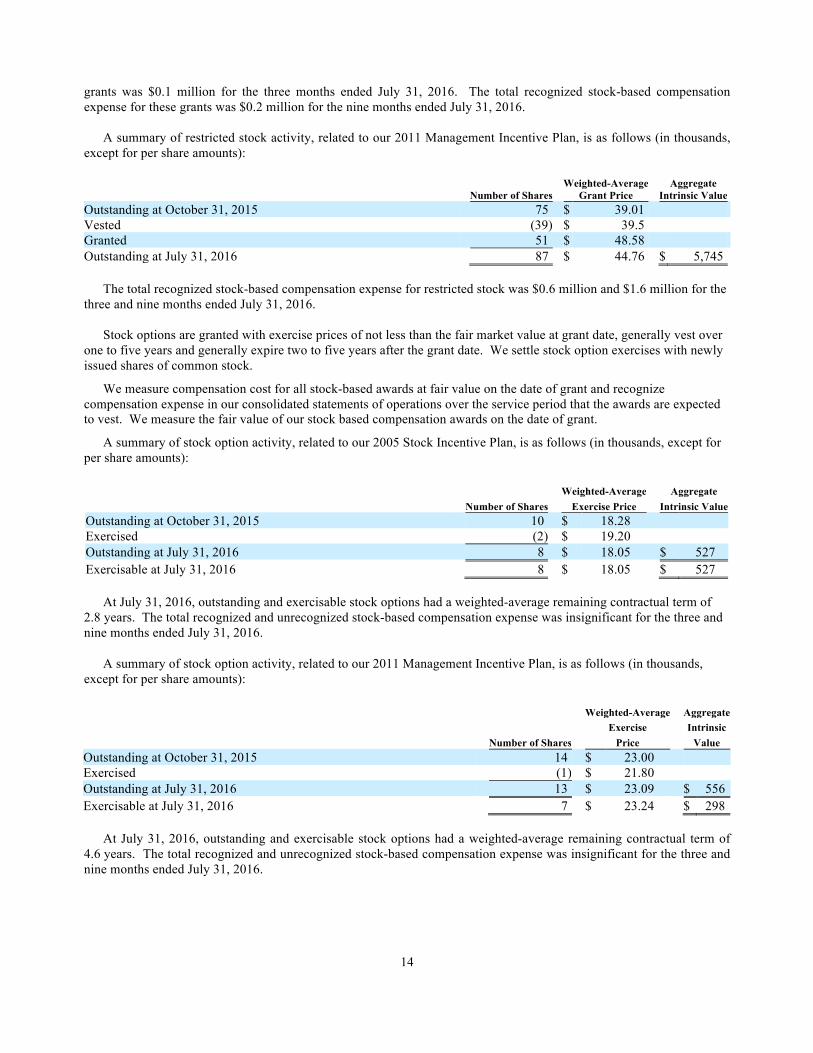
Table of Contents
14
grants was $0.1 million for the three months ended July 31, 2016. The total recognized stock-based compensation expense for these grants was $0.2 million for the nine months ended July 31, 2016.
A summary of restricted stock activity, related to our 2011 Management Incentive Plan, is as follows (in thousands,
except for per share amounts):
Weighted-Average Aggregate Number of Shares Grant Price Intrinsic Value Outstanding at October 31, 2015 75 $ 39.01 Vested (39) $ 39.5 Granted 51 $ 48.58 Outstanding at July 31, 2016 87 $ 44.76 $ 5,745
The total recognized stock-based compensation expense for restricted stock was $0.6 million and $1.6 million for the
three and nine months ended July 31, 2016. Stock options are granted with exercise prices of not less than the fair market value at grant date, generally vest over
one to five years and generally expire two to five years after the grant date. We settle stock option exercises with newly issued shares of common stock.
We measure compensation cost for all stock-based awards at fair value on the date of grant and recognize compensation expense in our consolidated statements of operations over the service period that the awards are expected to vest. We measure the fair value of our stock based compensation awards on the date of grant.
A summary of stock option activity, related to our 2005 Stock Incentive Plan, is as follows (in thousands, except for per share amounts):
Weighted-Average Aggregate Number of Shares Exercise Price Intrinsic Value Outstanding at October 31, 2015 10 $ 18.28 Exercised (2) $ 19.20 Outstanding at July 31, 2016 8 $ 18.05 $ 527 Exercisable at July 31, 2016 8 $ 18.05 $ 527
At July 31, 2016, outstanding and exercisable stock options had a weighted-average remaining contractual term of 2.8 years. The total recognized and unrecognized stock-based compensation expense was insignificant for the three and nine months ended July 31, 2016.
A summary of stock option activity, related to our 2011 Management Incentive Plan, is as follows (in thousands, except for per share amounts):
Weighted-Average Aggregate Exercise Intrinsic Number of Shares Price Value Outstanding at October 31, 2015 14 $ 23.00 Exercised (1) $ 21.80 Outstanding at July 31, 2016 13 $ 23.09 $ 556 Exercisable at July 31, 2016 7 $ 23.24 $ 298
At July 31, 2016, outstanding and exercisable stock options had a weighted-average remaining contractual term of 4.6 years. The total recognized and unrecognized stock-based compensation expense was insignificant for the three and nine months ended July 31, 2016.
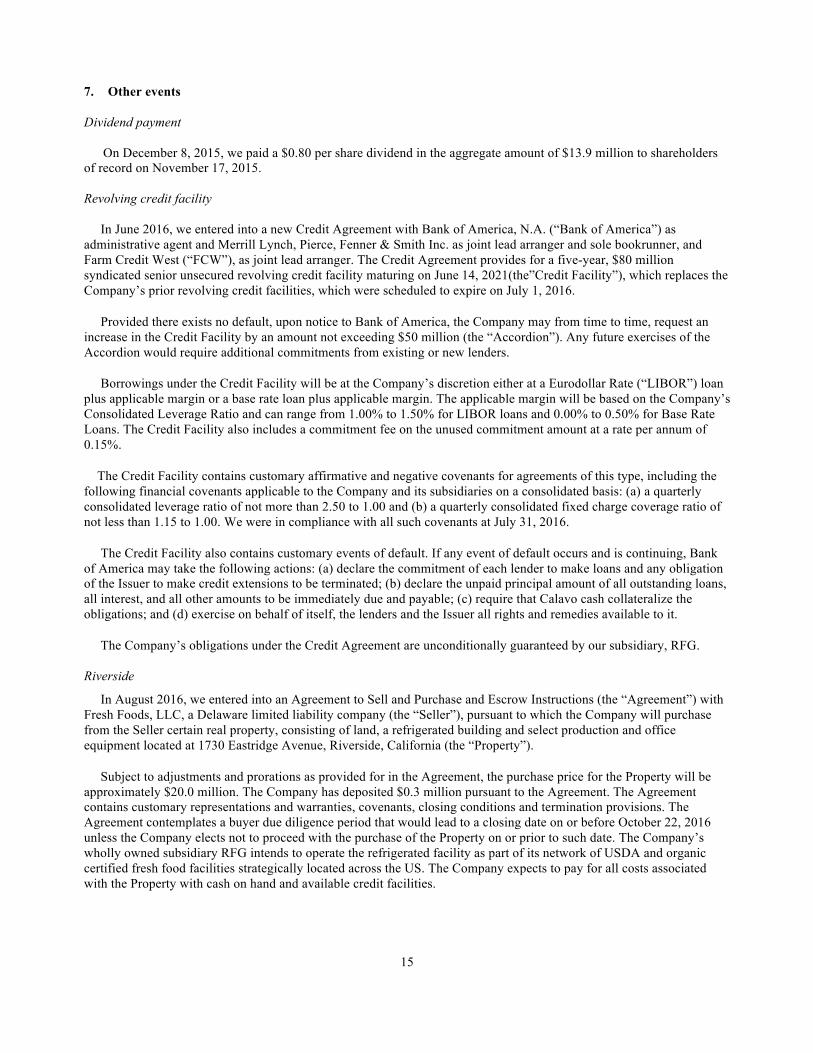
Table of Contents
15
7. Other events Dividend payment
On December 8, 2015, we paid a $0.80 per share dividend in the aggregate amount of $13.9 million to shareholders of record on November 17, 2015. Revolving credit facility In June 2016, we entered into a new Credit Agreement with Bank of America, N.A. (“Bank of America”) as administrative agent and Merrill Lynch, Pierce, Fenner & Smith Inc. as joint lead arranger and sole bookrunner, and Farm Credit West (“FCW”), as joint lead arranger. The Credit Agreement provides for a five-year, $80 million syndicated senior unsecured revolving credit facility maturing on June 14, 2021(the”Credit Facility”), which replaces the Company’s prior revolving credit facilities, which were scheduled to expire on July 1, 2016.
Provided there exists no default, upon notice to Bank of America, the Company may from time to time, request an increase in the Credit Facility by an amount not exceeding $50 million (the “Accordion”). Any future exercises of the Accordion would require additional commitments from existing or new lenders.
Borrowings under the Credit Facility will be at the Company’s discretion either at a Eurodollar Rate (“LIBOR”) loan plus applicable margin or a base rate loan plus applicable margin. The applicable margin will be based on the Company’s Consolidated Leverage Ratio and can range from 1.00% to 1.50% for LIBOR loans and 0.00% to 0.50% for Base Rate Loans. The Credit Facility also includes a commitment fee on the unused commitment amount at a rate per annum of 0.15%.
The Credit Facility contains customary affirmative and negative covenants for agreements of this type, including the following financial covenants applicable to the Company and its subsidiaries on a consolidated basis: (a) a quarterly consolidated leverage ratio of not more than 2.50 to 1.00 and (b) a quarterly consolidated fixed charge coverage ratio of not less than 1.15 to 1.00. We were in compliance with all such covenants at July 31, 2016.
The Credit Facility also contains customary events of default. If any event of default occurs and is continuing, Bank of America may take the following actions: (a) declare the commitment of each lender to make loans and any obligation of the Issuer to make credit extensions to be terminated; (b) declare the unpaid principal amount of all outstanding loans, all interest, and all other amounts to be immediately due and payable; (c) require that Calavo cash collateralize the obligations; and (d) exercise on behalf of itself, the lenders and the Issuer all rights and remedies available to it.
The Company’s obligations under the Credit Agreement are unconditionally guaranteed by our subsidiary, RFG. Riverside
In August 2016, we entered into an Agreement to Sell and Purchase and Escrow Instructions (the “Agreement”) with Fresh Foods, LLC, a Delaware limited liability company (the “Seller”), pursuant to which the Company will purchase from the Seller certain real property, consisting of land, a refrigerated building and select production and office equipment located at 1730 Eastridge Avenue, Riverside, California (the “Property”).
Subject to adjustments and prorations as provided for in the Agreement, the purchase price for the Property will be approximately $20.0 million. The Company has deposited $0.3 million pursuant to the Agreement. The Agreement contains customary representations and warranties, covenants, closing conditions and termination provisions. The Agreement contemplates a buyer due diligence period that would lead to a closing date on or before October 22, 2016 unless the Company elects not to proceed with the purchase of the Property on or prior to such date. The Company’s wholly owned subsidiary RFG intends to operate the refrigerated facility as part of its network of USDA and organic certified fresh food facilities strategically located across the US. The Company expects to pay for all costs associated with the Property with cash on hand and available credit facilities.

Table of Contents
16
Mexico tax audits We conduct business internationally and, as a result, one or more of our subsidiaries files income tax returns in U.S. federal, U.S. state and certain foreign jurisdictions. Accordingly, in the normal course of business, we are subject to examination by taxing authorities, primarily in Mexico and the United States. During our third quarter of fiscal 2016, our wholly-owned subsidiary, Calavo de Mexico (“CDM”), received a written communication from the Ministry of Finance and Administration of the government of the State of Michoacan, Mexico (“MFM”) containing preliminary observations related to a fiscal 2011 tax audit of such subsidiary. MFM’s preliminary observations outline certain proposed adjustments primarily related to intercompany funding, deductions for services from certain vendors/suppliers and Value Added Tax (“VAT”). During our fourth fiscal quarter of 2016, we provided a written rebuttal to MFM’s preliminary observations. Representative of the subsidiary intend to meet and present our rebuttal to representatives of the MFM in the near future. We expect that the MFM will complete their review and issue a final assessment with respect to the fiscal 2011 tax audit no later than approximately February 2017. Additionally, we also received notice from Mexico's Federal Tax Administration Service, Servicio de Administracion Tributaria (SAT), that our wholly-owned Mexican subsidiary, Calavo de Mexico is currently under examination related to fiscal year 2013. Under Mexican law, the SAT has until approximately March 2017 to complete their review. We believe that the ultimate resolution of these matters is unlikely to have a material effect on our consolidated financial position; however, there is still a possibility that an adverse outcome of these matters could have a material effect on our consolidated financial condition. 8. Fair value measurements
A fair value measurement is determined based on the assumptions that a market participant would use in pricing an asset or liability. A three-tiered hierarchy draws distinctions between market participant assumptions based on (i) observable inputs such as quoted prices in active markets (Level 1), (ii) inputs other than quoted prices in active markets that are observable either directly or indirectly (Level 2) and (iii) unobservable inputs that require the Company to use present value and other valuation techniques in the determination of fair value (Level 3).
The following table sets forth our financial assets and liabilities as of July 31, 2016 that are measured on a recurring basis during the period, segregated by level within the fair value hierarchy:
Level 1 Level 2 Level 3 Total (All amounts are presented in thousands) Assets at Fair Value: Investment in Limoneira Company(1) $ 30,578 - - $ 30,578 Total assets at fair value $ 30,578 $ - $ - $ 30,578
(1) The investment in Limoneira Company consists of marketable securities in the Limoneira Company stock. We currently own approximately
12% of Limoneira’s outstanding common stock. These securities are measured at fair value by quoted market prices. Limoneira’s stock price at July 31, 2016 and October 31, 2015 equaled $17.69 per share and $15.86 per share. Unrealized gains and losses are recognized through other comprehensive income. Unrealized investment holding losses arising during the three months ended July 31, 2016 and 2015 was $0.3 million and $4.1 million. Unrealized investment holding gains arising during the nine months ended July 31, 2016 was $3.2 million. Unrealized investment holding losses arising during the nine months ended July 31, 2015 was $8.8 million.
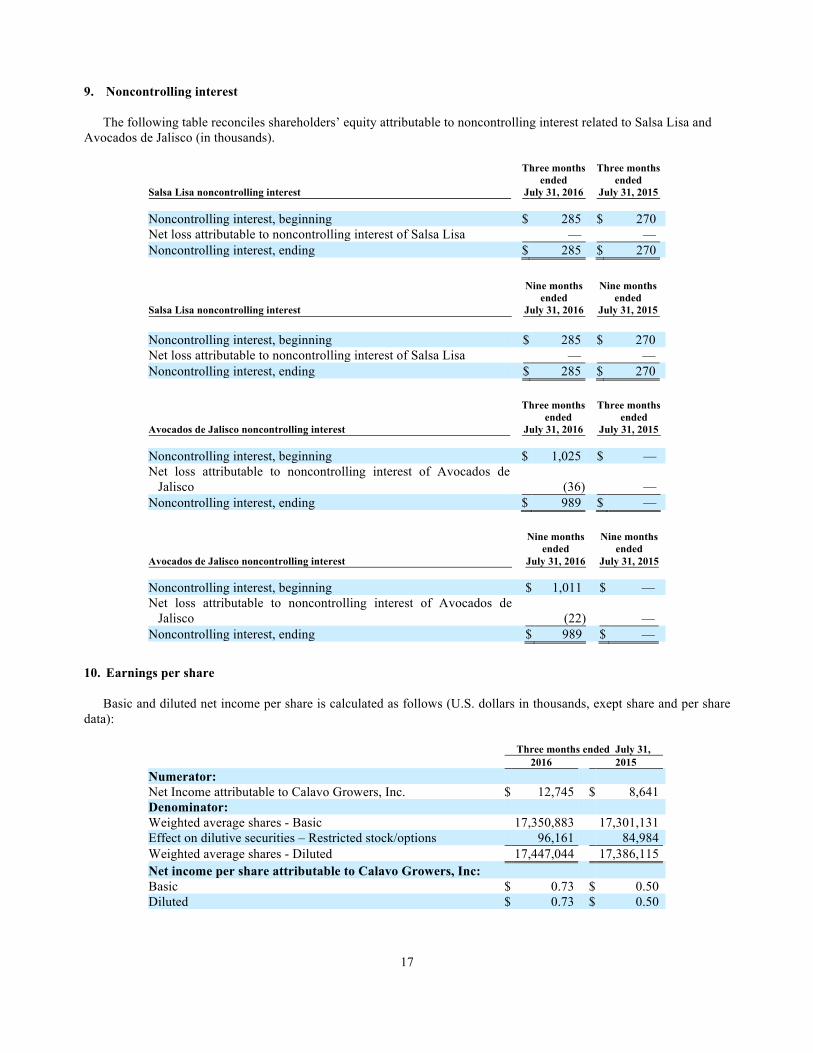
Table of Contents
17
9. Noncontrolling interest
The following table reconciles shareholders’ equity attributable to noncontrolling interest related to Salsa Lisa and Avocados de Jalisco (in thousands).
Three months Three months ended ended
Salsa Lisa noncontrolling interest July 31, 2016 July 31, 2015 Noncontrolling interest, beginning $ 285 $ 270 Net loss attributable to noncontrolling interest of Salsa Lisa — — Noncontrolling interest, ending $ 285 $ 270
Nine months Nine months ended ended
Salsa Lisa noncontrolling interest July 31, 2016 July 31, 2015 Noncontrolling interest, beginning $ 285 $ 270 Net loss attributable to noncontrolling interest of Salsa Lisa — — Noncontrolling interest, ending $ 285 $ 270
Three months Three months ended ended
Avocados de Jalisco noncontrolling interest July 31, 2016 July 31, 2015 Noncontrolling interest, beginning $ 1,025 $ — Net loss attributable to noncontrolling interest of Avocados de
Jalisco (36) — Noncontrolling interest, ending $ 989 $ —
Nine months Nine months ended ended
Avocados de Jalisco noncontrolling interest July 31, 2016 July 31, 2015 Noncontrolling interest, beginning $ 1,011 $ — Net loss attributable to noncontrolling interest of Avocados de
Jalisco (22) — Noncontrolling interest, ending $ 989 $ —
10. Earnings per share
Basic and diluted net income per share is calculated as follows (U.S. dollars in thousands, exept share and per share data):
Three months ended July 31, 2016 2015 Numerator: Net Income attributable to Calavo Growers, Inc. $ 12,745 $ 8,641 Denominator: Weighted average shares - Basic 17,350,883 17,301,131 Effect on dilutive securities – Restricted stock/options 96,161 84,984 Weighted average shares - Diluted 17,447,044 17,386,115 Net income per share attributable to Calavo Growers, Inc: Basic $ 0.73 $ 0.50 Diluted $ 0.73 $ 0.50
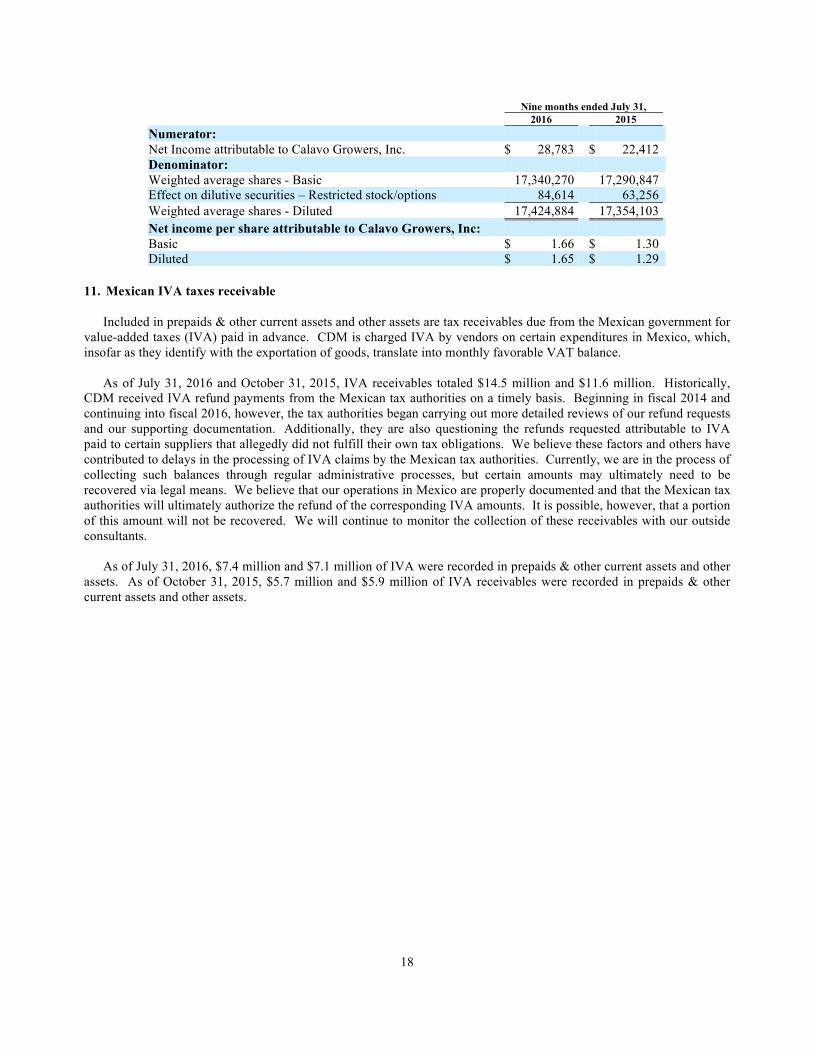
Table of Contents
18
Nine months ended July 31, 2016 2015 Numerator: Net Income attributable to Calavo Growers, Inc. $ 28,783 $ 22,412 Denominator: Weighted average shares - Basic 17,340,270 17,290,847 Effect on dilutive securities – Restricted stock/options 84,614 63,256 Weighted average shares - Diluted 17,424,884 17,354,103 Net income per share attributable to Calavo Growers, Inc: Basic $ 1.66 $ 1.30 Diluted $ 1.65 $ 1.29
11. Mexican IVA taxes receivable
Included in prepaids & other current assets and other assets are tax receivables due from the Mexican government for value-added taxes (IVA) paid in advance. CDM is charged IVA by vendors on certain expenditures in Mexico, which, insofar as they identify with the exportation of goods, translate into monthly favorable VAT balance.
As of July 31, 2016 and October 31, 2015, IVA receivables totaled $14.5 million and $11.6 million. Historically,
CDM received IVA refund payments from the Mexican tax authorities on a timely basis. Beginning in fiscal 2014 and continuing into fiscal 2016, however, the tax authorities began carrying out more detailed reviews of our refund requests and our supporting documentation. Additionally, they are also questioning the refunds requested attributable to IVA paid to certain suppliers that allegedly did not fulfill their own tax obligations. We believe these factors and others have contributed to delays in the processing of IVA claims by the Mexican tax authorities. Currently, we are in the process of collecting such balances through regular administrative processes, but certain amounts may ultimately need to be recovered via legal means. We believe that our operations in Mexico are properly documented and that the Mexican tax authorities will ultimately authorize the refund of the corresponding IVA amounts. It is possible, however, that a portion of this amount will not be recovered. We will continue to monitor the collection of these receivables with our outside consultants.
As of July 31, 2016, $7.4 million and $7.1 million of IVA were recorded in prepaids & other current assets and other assets. As of October 31, 2015, $5.7 million and $5.9 million of IVA receivables were recorded in prepaids & other current assets and other assets.
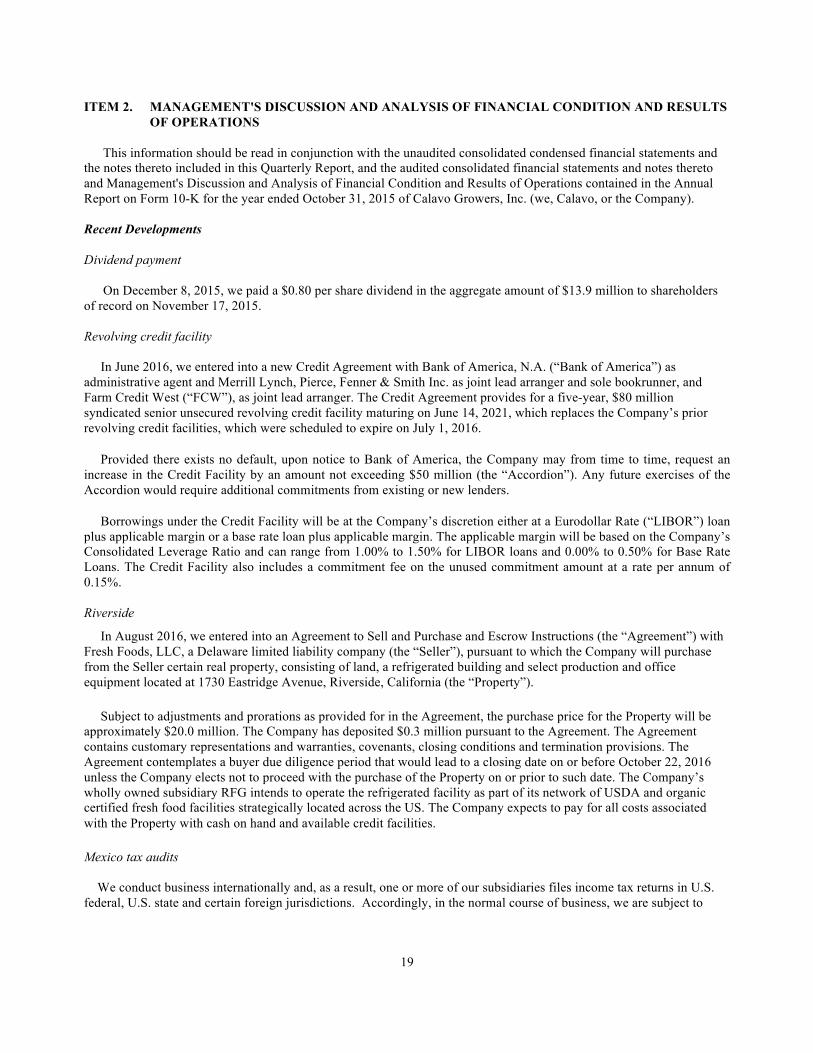
Table of Contents
19
ITEM 2. MANAGEMENT'S DISCUSSION AND ANALYSIS OF FINANCIAL CONDITION AND RESULTS
OF OPERATIONS
This information should be read in conjunction with the unaudited consolidated condensed financial statements and the notes thereto included in this Quarterly Report, and the audited consolidated financial statements and notes thereto and Management's Discussion and Analysis of Financial Condition and Results of Operations contained in the Annual Report on Form 10-K for the year ended October 31, 2015 of Calavo Growers, Inc. (we, Calavo, or the Company). Recent Developments Dividend payment
On December 8, 2015, we paid a $0.80 per share dividend in the aggregate amount of $13.9 million to shareholders of record on November 17, 2015. Revolving credit facility In June 2016, we entered into a new Credit Agreement with Bank of America, N.A. (“Bank of America”) as administrative agent and Merrill Lynch, Pierce, Fenner & Smith Inc. as joint lead arranger and sole bookrunner, and Farm Credit West (“FCW”), as joint lead arranger. The Credit Agreement provides for a five-year, $80 million syndicated senior unsecured revolving credit facility maturing on June 14, 2021, which replaces the Company’s prior revolving credit facilities, which were scheduled to expire on July 1, 2016.
Provided there exists no default, upon notice to Bank of America, the Company may from time to time, request an increase in the Credit Facility by an amount not exceeding $50 million (the “Accordion”). Any future exercises of the Accordion would require additional commitments from existing or new lenders.
Borrowings under the Credit Facility will be at the Company’s discretion either at a Eurodollar Rate (“LIBOR”) loan plus applicable margin or a base rate loan plus applicable margin. The applicable margin will be based on the Company’s Consolidated Leverage Ratio and can range from 1.00% to 1.50% for LIBOR loans and 0.00% to 0.50% for Base Rate Loans. The Credit Facility also includes a commitment fee on the unused commitment amount at a rate per annum of 0.15%. Riverside
In August 2016, we entered into an Agreement to Sell and Purchase and Escrow Instructions (the “Agreement”) with Fresh Foods, LLC, a Delaware limited liability company (the “Seller”), pursuant to which the Company will purchase from the Seller certain real property, consisting of land, a refrigerated building and select production and office equipment located at 1730 Eastridge Avenue, Riverside, California (the “Property”).
Subject to adjustments and prorations as provided for in the Agreement, the purchase price for the Property will be approximately $20.0 million. The Company has deposited $0.3 million pursuant to the Agreement. The Agreement contains customary representations and warranties, covenants, closing conditions and termination provisions. The Agreement contemplates a buyer due diligence period that would lead to a closing date on or before October 22, 2016 unless the Company elects not to proceed with the purchase of the Property on or prior to such date. The Company’s wholly owned subsidiary RFG intends to operate the refrigerated facility as part of its network of USDA and organic certified fresh food facilities strategically located across the US. The Company expects to pay for all costs associated with the Property with cash on hand and available credit facilities.
Mexico tax audits We conduct business internationally and, as a result, one or more of our subsidiaries files income tax returns in U.S. federal, U.S. state and certain foreign jurisdictions. Accordingly, in the normal course of business, we are subject to
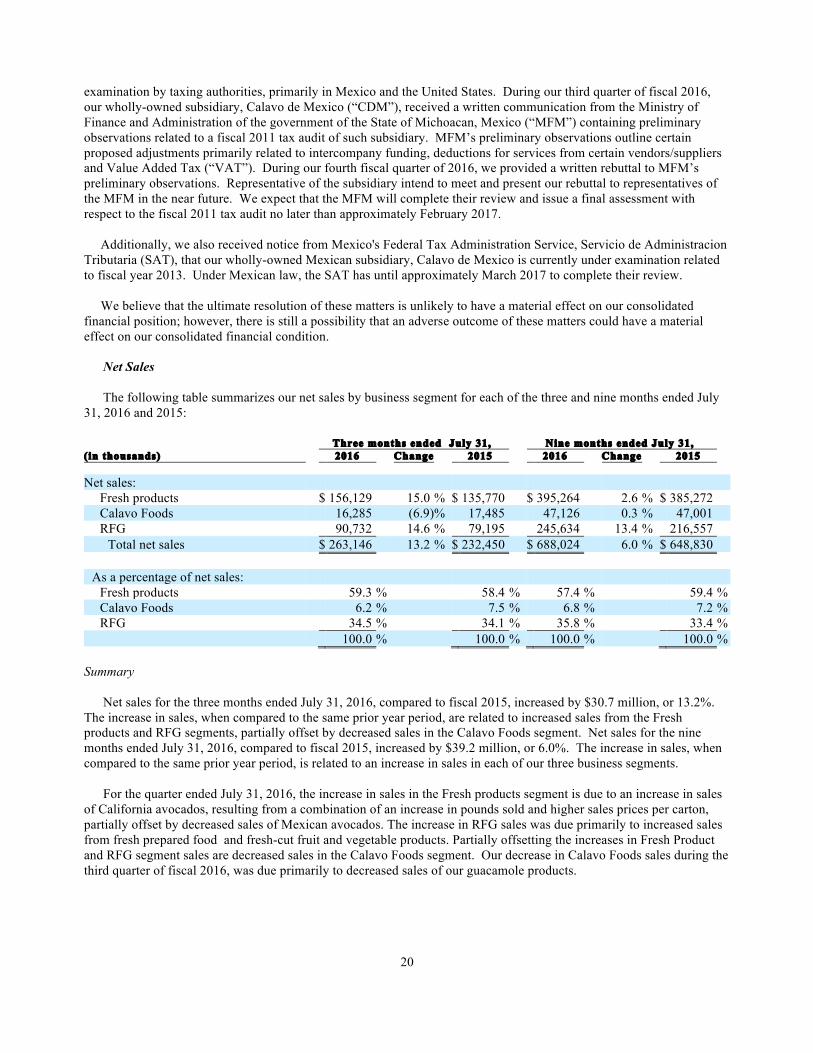
Table of Contents
20
examination by taxing authorities, primarily in Mexico and the United States. During our third quarter of fiscal 2016, our wholly-owned subsidiary, Calavo de Mexico (“CDM”), received a written communication from the Ministry of Finance and Administration of the government of the State of Michoacan, Mexico (“MFM”) containing preliminary observations related to a fiscal 2011 tax audit of such subsidiary. MFM’s preliminary observations outline certain proposed adjustments primarily related to intercompany funding, deductions for services from certain vendors/suppliers and Value Added Tax (“VAT”). During our fourth fiscal quarter of 2016, we provided a written rebuttal to MFM’s preliminary observations. Representative of the subsidiary intend to meet and present our rebuttal to representatives of the MFM in the near future. We expect that the MFM will complete their review and issue a final assessment with respect to the fiscal 2011 tax audit no later than approximately February 2017. Additionally, we also received notice from Mexico's Federal Tax Administration Service, Servicio de Administracion Tributaria (SAT), that our wholly-owned Mexican subsidiary, Calavo de Mexico is currently under examination related to fiscal year 2013. Under Mexican law, the SAT has until approximately March 2017 to complete their review. We believe that the ultimate resolution of these matters is unlikely to have a material effect on our consolidated financial position; however, there is still a possibility that an adverse outcome of these matters could have a material effect on our consolidated financial condition.
Net Sales The following table summarizes our net sales by business segment for each of the three and nine months ended July
31, 2016 and 2015:
Three months ended July 31, Nine months ended July 31, ( in thousands) 2016 Change 2015 2016 Change 2015 Net sales:
Fresh products $ 156,129 15.0 % $ 135,770 $ 395,264 2.6 % $ 385,272 Calavo Foods 16,285 (6.9) % 17,485 47,126 0.3 % 47,001 RFG 90,732 14.6 % 79,195 245,634 13.4 % 216,557
Total net sales $ 263,146 13.2 % $ 232,450 $ 688,024 6.0 % $ 648,830
As a percentage of net sales: Fresh products 59.3 % 58.4 % 57.4 % 59.4 % Calavo Foods 6.2 % 7.5 % 6.8 % 7.2 % RFG 34.5 % 34.1 % 35.8 % 33.4 %
100.0 % 100.0 % 100.0 % 100.0 %
Summary
Net sales for the three months ended July 31, 2016, compared to fiscal 2015, increased by $30.7 million, or 13.2%. The increase in sales, when compared to the same prior year period, are related to increased sales from the Fresh products and RFG segments, partially offset by decreased sales in the Calavo Foods segment. Net sales for the nine months ended July 31, 2016, compared to fiscal 2015, increased by $39.2 million, or 6.0%. The increase in sales, when compared to the same prior year period, is related to an increase in sales in each of our three business segments.
For the quarter ended July 31, 2016, the increase in sales in the Fresh products segment is due to an increase in sales
of California avocados, resulting from a combination of an increase in pounds sold and higher sales prices per carton, partially offset by decreased sales of Mexican avocados. The increase in RFG sales was due primarily to increased sales from fresh prepared food and fresh-cut fruit and vegetable products. Partially offsetting the increases in Fresh Product and RFG segment sales are decreased sales in the Calavo Foods segment. Our decrease in Calavo Foods sales during the third quarter of fiscal 2016, was due primarily to decreased sales of our guacamole products.

Table of Contents
21
For the nine months ended July 31, 2016, our RFG segment had the largest percentage increase in sales, followed by our Fresh products segment, as shown above. The increase in RFG sales was due primarily to increased sales from fresh prepared food and fresh-cut fruit and vegetable products. Our increase in Fresh product sales was due primarily to increased sales of California avocados and tomatoes, partially offset by decreased sales of Mexican avocados.
While the procurement of fresh avocados related to our Fresh products segment is seasonal, our Calavo Foods and RFG segments are generally not as seasonal.
Net sales to third parties by segment exclude value-added services billed by our Uruapan packinghouse and our Uruapan processing plant to the parent company. All intercompany sales are eliminated in our consolidated results of operations.
Fresh products
Third Quarter 2016 vs. Third Quarter 2015 Net sales delivered by the Fresh products business increased by approximately $20.4 million, or 15.0%, for the third
quarter of fiscal 2016, when compared to the same period for fiscal 2015. As discussed above, this increase in Fresh product sales during the third quarter of fiscal 2016 was primarily related to increased sales of California avocados, partially offset by decreased sales of Mexican avocados.
Sales of California sourced avocados increased $49.7 million, or 99.0%, for the third quarter of 2016, when
compared to the same prior year period. The increase in California sourced avocados was primarily due to an increase of 30.3 million pounds of avocados sold, or 79.5%. We attribute most of this increase in volume to the larger California avocado crop in fiscal 2016, compared to the same prior year period. In addition, the average sales price per carton increased approximately 10.9% from the same prior year period, primarily due to a lower supply of avocados in the market from non-California sources.
Sales of tomatoes increased to $2.6 million for the third quarter of fiscal 2016, compared to $1.2 million for the same
period for fiscal 2015. The increase in sales of tomatoes is due to an increase in cartons sold of approximately 0.2 million cartons or 204.9%.
Partially offsetting these increases was a decrease in sales of Mexican sourced avocados, which decreased $26.2
million, or 34.0%, for the third quarter of 2016, when compared to the same prior year period. The decrease in Mexican sourced avocados was primarily due to a decrease in pounds sold of 21.3 million or 36.0%. This decrease in the pounds sold was partially due to a strike by Michoacan growers in the third quarter of fiscal 2016.
Nine Months Ended 2016 vs. Nine Months Ended 2015 Net sales delivered by the Fresh products business increased by approximately $10.0 million, or 2.6%, for the nine
months ended July 31, 2016, when compared to the same period for fiscal 2015. This increase in Fresh product sales during the nine months ended July 31, 2016, was primarily related to increased sales of California avocados and tomatoes, partially offset by decreases in sales of Mexican sourced avocados.
Sales of California sourced avocados increased $36.4 million, or 42.2%, for the nine months ended July 31, 2016,
when compared to the same prior year period. The increase in California sourced avocados was primarily due to an increase of 28.2 million pounds of avocados sold, or 43.1%. We attribute most of this increase in volume to the larger California avocado crop in fiscal 2016, compared to the same prior year period.
Sales of tomatoes increased to $34.4 million for the nine months ended July 31, 2016, compared to $16.8 million for
the same period for fiscal 2015. The increase in sales of tomatoes is due to an increase in cartons sold of approximately 1.0 million cartons or 55.3%. In addition, tomatoes experienced an increase in the sales price per carton of approximately 31.7%, due to a lower availability of tomatoes in the market, primarily resulting from a change in weather patterns.

Table of Contents
22
Partially offsetting these increases was a decrease in sales of Mexican sourced avocados, which decreased $37.8 million, or 14.1%, for the nine months ended July 31, 2016, when compared to the same prior year period. The decrease in Mexican sourced avocados was primarily due to a decrease in the average sales price per carton of approximately 15.8% from the same prior year period. The decrease in the average sales price per carton is primarily due to a higher supply of avocados in the market. Partially offsetting this decrease was an increase in pounds sold of Mexican sourced avocados, which increased approximately 4.5 million pounds or 2.1%.
Overall, we anticipate that the combined total of California and Mexico sourced avocados will decrease in sales
during our fourth fiscal quarter of 2016, compared to the third quarter of 2016. We anticipate that net sales related to Mexican sourced avocados will increase during our fourth fiscal quarter of 2016, as compared to the third fiscal quarter of 2016. We anticipate that sales of Mexican grown avocados will increase in the fourth quarter of fiscal 2016, when compared to the same prior year period, due to higher overall pricing. We anticipate that California avocado sales will experience a seasonal decrease during our fourth fiscal quarter of 2016, as compared to the third quarter of fiscal 2016. We believe that there will be an increase in California avocado volume when compared to the fourth fiscal quarter of 2015. Calavo Foods
Third Quarter 2016 vs. Third Quarter 2015 Sales for Calavo Foods for the quarter ended July 31, 2016, when compared to the same period for fiscal 2015,
decreased $1.2 million, or 6.9%. This decrease is primarily due to a decrease in sales of guacamole products of approximately $1.4 million, or 8.2%, in the third quarter of fiscal year 2016, when compared to the same prior year period. This decrease in our guacamole products is primarily due to an 8.1% decrease in pounds sold, due primarily to a decrease in foodservice sales. Partially offsetting this decrease, is an increase in sales of salsa of approximately $0.2 million or 27.6%. This increase in salsa sales is primarily due to an increase in pounds sold.
Nine Months Ended 2016 vs. Nine Months Ended 2015 Sales for Calavo Foods for the nine months ended July 31, 2016, when compared to the same period for fiscal 2015,
increased $0.1 million, or 0.3%. This increase is primarily due to an increase in sales of salsa products of approximately $1.1 million, or 78.6%, in the nine months ended July 31, 2016, when compared to the same prior year period. The increase in sales of salsa was primarily related to an increase in overall pounds sold. Partially offsetting this increase, was a decrease in sales of guacamole products of approximately $1.0 million, or 2.3%, in the nine months ended July 31, 2016, when compared to the same prior year period. RFG
Third Quarter 2016 vs. Third Quarter 2015
Sales for RFG for the quarter ended July 31, 2016, when compared to the same period for fiscal 2015, increased
$11.5 million, or 14.6%. This increase is due primarily to increased sales from fresh prepared food and fresh-cut fruit and vegetable products. The overall increase in sales is primarily due to an increase in sales volume, which we believe results from an increase in demand for the variety of convenient products that we offer.
Nine Months Ended 2016 vs. Nine Months Ended 2015
Sales for RFG for the nine months ended July 31, 2016, when compared to the same period for fiscal 2015, increased
$29.1 million, or 13.4%. This increase is due primarily to increased sales from fresh prepared food and fresh-cut fruit and vegetable products. The overall increase in sales is primarily due to an increase in sales volume, which we believe results from an increase in demand for the variety of convenient products that we offer.

Table of Contents
23
Gross Margins
The following table summarizes our gross margins and gross margin percentages by business segment for the three and nine months ended July 31, 2016 and 2015:
Three months ended July 31, Nine months ended July 31, 2016 Change 2015 2016 Change 2015 Gross Margins:
Fresh products $ 18,284 89.2 % $ 9,665 $ 42,840 46.3 % $ 29,281 Calavo Foods 5,801 (4.4) % 6,070 17,898 17.2 % 15,276 RFG 8,559 0.2 % 8,543 19,711 (3.9) % 20,501
Total gross margins $ 32,644 34.5 % $ 24,278 $ 80,449 23.7 % $ 65,058
Gross margin percentages: Fresh products 11.7 % 7.1 % 10.8 % 7.6 % Calavo Foods 35.6 % 34.7 % 38.0 % 32.5 % RFG 9.4 % 10.8 % 8.0 % 9.5 % Consolidated 12.4 % 10.4 % 11.7 % 10.0 %
Summary
Our cost of goods sold consists predominantly of fruit costs, packing materials, freight and handling, labor and overhead (including depreciation) associated with preparing food products and other direct expenses pertaining to products sold. Gross margins increased by approximately $8.4 million, or 34.5%, for the third quarter of fiscal 2016, when compared to the same period for fiscal 2015. This increase in our gross margins, when compared to the same prior year periods, is related to increases in gross margins (in dollar terms) across the Fresh products and RFG segments, partially offset by a decrease in gross margin for the Calavo Foods segment. Gross margins increased by approximately $15.4 million, or 23.7%, for the first nine months of fiscal 2016 when compared to the same period for fiscal 2015. This increase in our gross margins, when compared to the same prior year periods, is related to increases in gross margins (in dollar and gross margin percentage terms) across the Fresh products and Calavo Foods segments, partially offset by a decrease in gross margins for RFG. Fresh products
During our three and nine months ended July 31, 2016, as compared to the same prior year period, the increase in
our Fresh products segment gross margin percentage was primarily the result of increased margins for California sourced avocados. For the third quarter of 2016, compared to the same prior year period, the gross margin percentage for California sourced avocados increased from 0.4% in 2015 to 13.8% in 2016. For the third quarter of 2016, compared to the same prior year period, the gross margin percentage for Mexican sourced avocados decreased from 11.4% in 2015 to 8.0% in 2016. For the third quarter of 2016, the increased volume of California sourced avocados lowered per pound production costs, and we were able to manage fruit costs effectively. For the nine months ended July 31, 2016, compared to the same prior year period, the gross margin percentage for California sourced avocados increased from 0.3% in 2015 to 11.4% in 2016. For the nine months ended July 31, 2016, compared to the same prior year period, the gross margin percentage for Mexican sourced avocados increased from 9.7% in 2015 to 10.7% in 2016. For the nine months ended fiscal 2016, we were able to manage fruit cost of California and Mexican sourced avocados effectively. In addition, the U.S. Dollar to Mexican Peso exchange rate continues to strengthen in fiscal 2016. Note that any significant fluctuations in the exchange rate between the U.S. Dollar and the Mexican Peso may have a material impact on future gross margins for our Fresh products segment.
The gross margin and/or gross margin percentage for consignment sales, such as tomatoes, are dependent on the volume of fruit we handle, the average selling prices, and the competitiveness of the returns that we provide to third-party growers/packers. The gross margin we earn is generally based on a commission agreed to with each party, which usually is a percentage of the overall selling price. In the third quarter of fiscal year 2016 we generated gross margins of $0.2 million from consigned tomato sales. This is an improvement of $0.1 million from $0.1 million in the
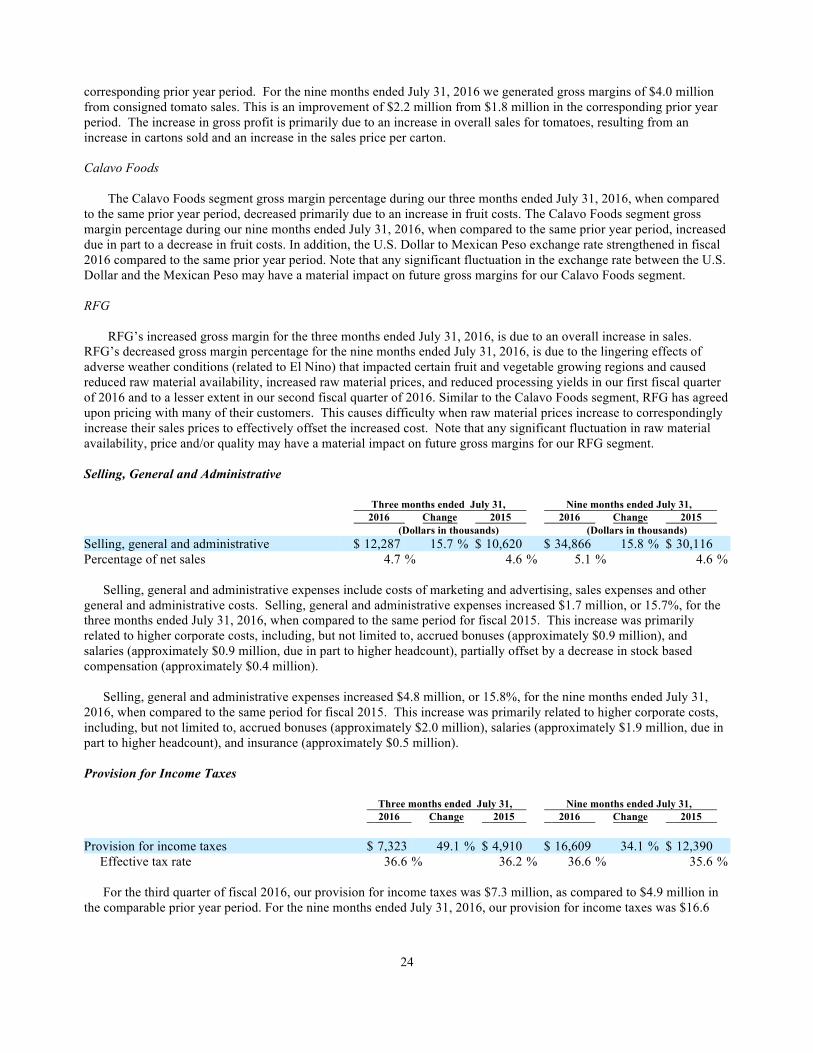
Table of Contents
24
corresponding prior year period. For the nine months ended July 31, 2016 we generated gross margins of $4.0 million from consigned tomato sales. This is an improvement of $2.2 million from $1.8 million in the corresponding prior year period. The increase in gross profit is primarily due to an increase in overall sales for tomatoes, resulting from an increase in cartons sold and an increase in the sales price per carton.
Calavo Foods
The Calavo Foods segment gross margin percentage during our three months ended July 31, 2016, when compared to the same prior year period, decreased primarily due to an increase in fruit costs. The Calavo Foods segment gross margin percentage during our nine months ended July 31, 2016, when compared to the same prior year period, increased due in part to a decrease in fruit costs. In addition, the U.S. Dollar to Mexican Peso exchange rate strengthened in fiscal 2016 compared to the same prior year period. Note that any significant fluctuation in the exchange rate between the U.S. Dollar and the Mexican Peso may have a material impact on future gross margins for our Calavo Foods segment. RFG
RFG’s increased gross margin for the three months ended July 31, 2016, is due to an overall increase in sales.
RFG’s decreased gross margin percentage for the nine months ended July 31, 2016, is due to the lingering effects of adverse weather conditions (related to El Nino) that impacted certain fruit and vegetable growing regions and caused reduced raw material availability, increased raw material prices, and reduced processing yields in our first fiscal quarter of 2016 and to a lesser extent in our second fiscal quarter of 2016. Similar to the Calavo Foods segment, RFG has agreed upon pricing with many of their customers. This causes difficulty when raw material prices increase to correspondingly increase their sales prices to effectively offset the increased cost. Note that any significant fluctuation in raw material availability, price and/or quality may have a material impact on future gross margins for our RFG segment.
Selling, General and Administrative
Three months ended July 31, Nine months ended July 31, 2016 Change 2015 2016 Change 2015 (Dollars in thousands) (Dollars in thousands) Selling, general and administrative $ 12,287 15.7 % $ 10,620 $ 34,866 15.8 % $ 30,116 Percentage of net sales 4.7 % 4.6 % 5.1 % 4.6 %
Selling, general and administrative expenses include costs of marketing and advertising, sales expenses and other general and administrative costs. Selling, general and administrative expenses increased $1.7 million, or 15.7%, for the three months ended July 31, 2016, when compared to the same period for fiscal 2015. This increase was primarily related to higher corporate costs, including, but not limited to, accrued bonuses (approximately $0.9 million), and salaries (approximately $0.9 million, due in part to higher headcount), partially offset by a decrease in stock based compensation (approximately $0.4 million).
Selling, general and administrative expenses increased $4.8 million, or 15.8%, for the nine months ended July 31,
2016, when compared to the same period for fiscal 2015. This increase was primarily related to higher corporate costs, including, but not limited to, accrued bonuses (approximately $2.0 million), salaries (approximately $1.9 million, due in part to higher headcount), and insurance (approximately $0.5 million). Provision for Income Taxes
Three months ended July 31, Nine months ended July 31, 2016 Change 2015 2016 Change 2015 Provision for income taxes $ 7,323 49.1 % $ 4,910 $ 16,609 34.1 % $ 12,390
Effective tax rate 36.6 % 36.2 % 36.6 % 35.6 %
For the third quarter of fiscal 2016, our provision for income taxes was $7.3 million, as compared to $4.9 million in the comparable prior year period. For the nine months ended July 31, 2016, our provision for income taxes was $16.6
Table of Contents
25
million, as compared to $12.4 million in the comparable prior year period. We currently expect our annual effective tax rate to be approximately 36.6% during fiscal 2016. Liquidity and Capital Resources
Cash provided by operating activities was $55.0 million for the nine months ended July 31, 2016, compared to cash provided by operations of $32.5 million for the similar period in fiscal 2015. Operating cash flows for the nine months ended July 31, 2016 reflect our net income of $28.8 million, net increase in non-cash activities (depreciation and amortization, stock compensation expense, deferred income taxes, and income from unconsolidated entities) of $8.8 million and a net increase in the noncash components of our operating capital of approximately $17.4 million.
Our operating capital increase includes an increase in payable to growers of $36.1 million, a net increase in trade
accounts payable and accrued expenses of $9.0 million, a decrease in income tax receivable of $6.2 million, an increase in income tax payable of $4.7 million, an increased in deferred rent of $1.7 million, a decrease in advances to suppliers of $0.8 million and a decrease in other assets of $0.4 million, partially offset by a net increase in accounts receivable of $28.0 million, an increase in inventory of $10.1 million, and an increase in prepaid expenses and other current assets of $3.4 million.
The increase in payable to growers primarily reflects an increase in the volume and value of California fruit delivered
in the month of July 2016, as compared to October 2015. The increase in accounts payable and accrued expenses is primarily related to an increase in our payables related to California avocados. The decrease in income tax receivable and the increase in income taxes payable primarily reflects the tax impact of the current year’s net income. The increase in deferred rent is due to the new lease in Jacksonville Florida. The decrease in advances to suppliers primarily reflects fewer advances made to our related party Agricola Belher related to the receipt of tomatoes in July 2016, compared to October 2015. The increase in our accounts receivable, as of July 31, 2016 when compared to October 31, 2015, primarily reflects higher sales recorded in the month of July 2016, as compared to October 2015. The increase in inventory is primarily related to an increase in the fresh fruit on hand at July 31, 2016 which was primarily driven by an increase in the volume and value of California avocados purchased during July 2016, as compared to October 2015. The net increase in our prepaid assets and other assets is due primarily to an increase in our Mexican IVA tax receivable in fiscal 2016.
Cash used in investing activities was $13.0 million for the nine months ended July 31, 2016, which primarily related to the purchase of $15.7 million of property, plant and equipment items for expansion projects in the RFG and Fresh products segments and an additional investment in Agricola Don Memo of $1.3 million, partially offset by proceeds received from the repayment of the loan to Agricola Don Memo of $4.0 million.
Cash used in financing activities was $34.5 million for the nine months ended July 31, 2016, which related
principally to the payment of our $13.9 million dividend, payments on our credit facilities totaling $18.4 million, payments on long-term obligations of $2.2 million and deferred financing costs of $0.1 million, partially offset by proceeds from the exercise of stock options of $0.1 million.
Our principal sources of liquidity are our existing cash balances, cash generated from operations and amounts
available for borrowing under our existing Credit Facility. Cash and cash equivalents as of July 31, 2016 and October 31, 2015 totaled $14.7 million and $7.2 million. Our working capital at July 31, 2016 was $40.1 million, compared to $19.0 million at October 31, 2015.
We believe that cash flows from operations and the available Credit Facility will be sufficient to satisfy our future
capital expenditures, grower recruitment efforts, working capital and other financing requirements for the next twelve months. We will continue to evaluate grower recruitment opportunities, expanded relationships with retail and club customers, and exclusivity arrangements with food service companies to fuel growth in each of our business segments. We entered into a new unsecured, revolving credit facility with Bank of America as administrative agent and Merrill Lynch, Pierce, Fenner & Smith Inc. as joint lead arranger and sole bookrunner, and Farm Credit West, as joint lead arranger. Under the terms of this agreement, we are advanced funds for both working capital and long-term productive asset purchases. Total credit available under this new agreement is $80 million, and will expire in June 2021. Upon notice to Bank of America, we may from time to time, request an increase in the Credit Facility by an amount not

Table of Contents
26
exceeding $50 million. For our current and past line of credit agreements the weighted-average interest rate was 1.9% and 1.7% at July 31, 2016 and October 31, 2015. Under these credit facilities, we had $18.5 million and $36.9 million outstanding as July 31, 2016 and October 31, 2015.
This new Credit Facility contains customary affirmative and negative covenants for agreements of this type, including the following financial covenants applicable to the Company and its subsidiaries on a consolidated basis: (a) a quarterly consolidated leverage ratio of not more than 2.50 to 1.00 and (b) a quarterly consolidated fixed charge coverage ratio of not less than 1.15 to 1.00. We were in compliance with all such covenants at July 31, 2016. Contractual Obligations
There have been no material changes to our contractual commitments, other than the new credit agreement mentioned above, from those previously disclosed in our Annual Report on Form 10-K for our fiscal year ended October 31, 2015. For a summary of the contractual commitments at October 31, 2015, see Part II, Item 7, in our 2015 Annual Report on Form 10-K. Impact of Recently Issued Accounting Pronouncements
See Note 1 to the consolidated condensed financial statements that are included in this Quarterly Report on Form 10-
Q.

Table of Contents
27
ITEM 3. QUANTITATIVE AND QUALITATIVE DISCLOSURES ABOUT MARKET RISK
Our financial instruments include cash and cash equivalents, accounts receivable, payable to growers, accounts payable, current and long-term borrowings pursuant to our credit facilities with financial institutions, and long-term, fixed-rate obligations. All of our financial instruments are entered into during the normal course of operations and have not been acquired for trading purposes. The table below summarizes interest rate sensitive financial instruments and presents principal cash flows in U.S. dollars, which is our reporting currency, and weighted-average interest rates by expected maturity dates, as of July 31, 2016.
(All amounts in thousands) Expected maturity date July 31, 2016 2017 2018 2019 2020 Thereafter Total Fair Value Assets Cash and cash equivalents (1) $ 14,650 $ — $ — $ — $ — $ — $ 14,650 $ 14,650 Accounts receivable (1) 86,575 — — — — — 86,575 86,575 Liabilities Payable to growers (1) $ 39,991 $ — $ — $ — $ — $ — $ 39,991 $ 39,991 Accounts payable (1) 23,667 — — — — — 23,667 23,667 Current borrowings pursuant to credit facilities (1) 18,500 — — — — — 18,500 18,500 Fixed-rate long-term obligations (2) 137 111 89 92 92 101 622 505
(1) We believe the carrying amounts of cash and cash equivalents, accounts receivable, advances to suppliers, payable to growers, accounts payable,
and current borrowings pursuant to credit facilities approximate their fair value due to the short maturity of these financial instruments. (2) Fixed-rate long-term obligations bear interest rates ranging from 3.5% to 4.3% with a weighted-average interest rate of 4.3%. We believe that
loans with a similar risk profile would currently yield a return of 2.6%. We project the impact of an increase or decrease in interest rates of 100 basis points would result in a change of fair value of approximately $11,000.
We were not a party to any derivative instruments during the fiscal year. It is currently our intent not to use
derivative instruments for speculative or trading purposes. Additionally, we do not use any hedging or forward contracts to offset market volatility.
Our Mexican-based operations transact business primarily in Mexican pesos. Funds are transferred by our corporate
office to Mexico on a weekly basis to satisfy domestic cash needs. We do not currently use derivative instruments to hedge fluctuations in the Mexican peso to U.S. dollar exchange rates. Management does, however, evaluate this opportunity from time to time. Total foreign currency translation losses for the three months ended July 31, 2016 and 2015, net of gains, was $1.0 million and $0.3 million. Total foreign currency translation losses for the nine months ended July 31, 2016 and 2015, net of gains, was $1.1 million and $1.4 million. ITEM 4. CONTROLS AND PROCEDURES
Under the supervision and with the participation of our management, including our principal executive officer and principal financial officer, we conducted an evaluation of our disclosure controls and procedures, as such term is defined in Rule 13a-15(e) under the Securities Exchange Act of 1934, as amended (the “Exchange Act”), as of the end of the period covered by this report. Based on this evaluation, our principal executive officer and our principal financial officer concluded that our disclosure controls and procedures were effective.
There were no changes in the Company’s internal control over financial reporting during the quarter ended July 31, 2016 that have materially affected, or are reasonably likely to materially affect, the Company’s internal control over financial reporting. PART II. OTHER INFORMATION ITEM 1. LEGAL PROCEEDINGS
We are involved in litigation in the ordinary course of business, none of which we believe will have a material adverse impact on our financial position or results of operations.

Table of Contents
28
ITEM 1A. RISK FACTORS
For a discussion of our risk factors, see Part 1, item 1A “Risk Factors” of our Annual Report on Form 10-K for the year ended October 31, 2015. There have been no material changes from the risk factors set forth in such Annual Report on Form 10-K. However, the risks and uncertainties that we face are not limited to those set forth in the 2015 Form 10-K. Additional risks and uncertainties not presently known to us or that we currently believe to be immaterial may also adversely affect our business and the trading price of our common stock. ITEM 6. EXHIBITS
10.1 Agreement to Sell and Purchase and Escrow Instructions with Fresh Foods, LLC, a Delaware limited liability company dated August 3, 2016.
31.1 Certification of Chief Executive Officer Pursuant to 15 U.S.C. § 7241, as Adopted Pursuant to Section 302 of the Sarbanes-Oxley Act of 2002.
31.2 Certification of Principal Financial Officer Pursuant to 15 U.S.C. § 7241, as Adopted Pursuant to Section 302 of the Sarbanes-Oxley Act of 2002.
32.1 Certification by Chief Executive Officer and Chief Financial Officer of Periodic Report Pursuant to 18
U.S.C. Section 1350.
101 The following financial information from the Quarterly Report on Form 10-Q of Calavo Growers, Inc. for the quarter ended July 31, 2016, formatted in XBRL (eXtensible Business Reporting Language): (1) Consolidated Condensed Balance Sheets as of July 31, 2016 and October 31, 2015; (2) Consolidated Condensed Statements of Income for the three and nine months ended July 31, 2016 and 2015; (3) Consolidated Condensed Statements of Comprehensive Income for the three and nine months ended July 31, 2016 and 2015; (4) Consolidated Condensed Statements of Cash Flows for the nine months ended July 31, 2016 and 2015; and (5) Notes to Unaudited Condensed Financial Statements.
Table of Contents
29
SIGNATURES
Pursuant to the requirements of the Securities Exchange Act of 1934, the registrant has duly caused this report to be signed on its behalf by the undersigned, thereunto duly authorized. Calavo Growers, Inc. (Registrant) Date: September 8, 2016 By /s/ Lecil E. Cole Lecil E. Cole Chairman of the Board of Directors, and Chief Executive Officer (Principal Executive Officer) Date: September 8, 2016 By /s/ B. John Lindeman B. John Lindeman Chief Financial Officer and Corporate Secretary (Principal Financial Officer)

Table of Contents
30
INDEX TO EXHIBITS
Exhibit Number Description 10.1 Agreement to Sell and Purchase and Escrow Instructions with Fresh Foods, LLC, a Delaware limited
liability company dated August 3, 2016.
31.1 Certification of Chief Executive Officer Pursuant to 15 U.S.C. § 7241, as Adopted Pursuant to Section 302 of the Sarbanes-Oxley Act of 2002.
31.2 Certification of Principal Financial Officer Pursuant to 15 U.S.C. § 7241, as Adopted Pursuant to Section 302 of the Sarbanes-Oxley Act of 2002.
32.1 Certification by Chief Executive Officer and Chief Financial Officer of Periodic Report Pursuant to 18
U.S.C. Section 1350.
101 The following financial information from the Quarterly Report on Form 10-Q of Calavo Growers, Inc. for the quarter ended July 31, 2016, formatted in XBRL (eXtensible Business Reporting Language): (1) Consolidated Condensed Balance Sheets as of July 31, 2016 and October 31, 2015; (2) Consolidated Condensed Statements of Income for the three and nine months ended July 31, 2016 and 2015; (3) Consolidated Condensed Statements of Comprehensive Income for the three and nine months ended July 31, 2016 and 2015; (4) Consolidated Condensed Statements of Cash Flows for the nine months ended July 31, 2016 and 2015; and (5) Notes to Unaudited Condensed Financial Statements.