quarterly report -...
TRANSCRIPT
ORIGINAL LOGO
NEW VERSION 1
NEW VERSION 2
PM CAPITAL Global Companies FundARSN 092 434 618, APIR Code PMC0100AU
PM CAPITAL Asian Companies FundARSN 130 588 439, APIR Code PMC0002AU
PM CAPITAL Australian Companies FundARSN 092 434 467, APIR Code PMC0101AU
PM CAPITAL Enhanced Yield FundARSN 099 581 558, APIR Code: PMC0103AU
PM CAPITAL Limited ABN 69 083 644 731AFSL 230222
Level 27, 420 George Street Sydney NSW 2000Phone (+612) 8243 0888Fax (+612) 8243 0880Email [email protected] www.pmcapital.com.au
QUARTERLY REPORT
DECEMBER 2014

IMPORTANT INFORMATION This Quarterly Report is issued by PM CAPITAL Limited (ABN 69 083 644 731, AFSL No. 230222) as responsible entity for the:PM CAPITAL Global Companies Fund (ARSN 092 434 618), PM CAPITAL Asian Companies Fund (ARSN 130 588 439), PM CAPITAL Australian Companies Fund (ARSN 092 434 467), andPM CAPITAL Enhanced Yield Fund (ARSN 099 581 558)the ‘Fund’, or collectively the ‘Funds’ as the context requires.
The Quarterly Report contains summary information only to provide an insight into how and why we make our investment decisions. This information is subject to change without notice, and does not constitute advice or a recommendation (including on any specific security or other investment position mentioned herein).
The Quarterly Report does not take into account the objectives, financial situation or needs of any investor which should be considered before investing. Investors should consider a copy of the current Product Disclosure Statement (‘PDS’) which is available from us, and seek their own financial advice prior to making a decision to invest. The PDS explains how the Funds’ Net Asset Value is calculated. Returns are calculated from exit price to exit price (inclusive of the reinvestment of distributions) for the period from inception to 31 December 2014 and represent the combined income and capital return. The investment objective is expressed after the deduction of fees and before taxation. The objective is not a forecast, and is only an indication of what the investment strategy aims to achieve over the medium to long term. While we aim to achieve the objective, the objective and returns may not be achieved and are not guaranteed. Past performance is not a reliable guide to future performance and the capital and income of any investment may go down as well as up due to various factors, including market forces.
The Index for the Global Companies Fund is the MSCI All Country World Net Index in Australian dollars, net dividends reinvested. The Index for the Asian Companies Fund is the MSCI All Country Asia ex Japan Net Index in Australian dollars, net dividends reinvested. See www.msci.com for further information on the MSCI indices. The Index for the Australian Companies Fund is the S&P/ASX 200 Accumulation Index. See www.asx.com.au for further information. The Index for the Enhanced Yield Fund is RBA Cash Rate. See www.rba.gov.au for further information.
© 2015. All rights reserved.
2 | PM CAPITAL Limited
ContentsINVESTMENT OVERVIEW 3
QUARTERLY VIDEOS 3
GLOBAL COMPANIES FUND 4
ASIAN COMPANIES FUND 5
AUSTRALIAN COMPANIES FUND 6
ENHANCED YIELD FUND 7
Investment Overview
Quarterly Videos
3PM CAPITAL Limited |
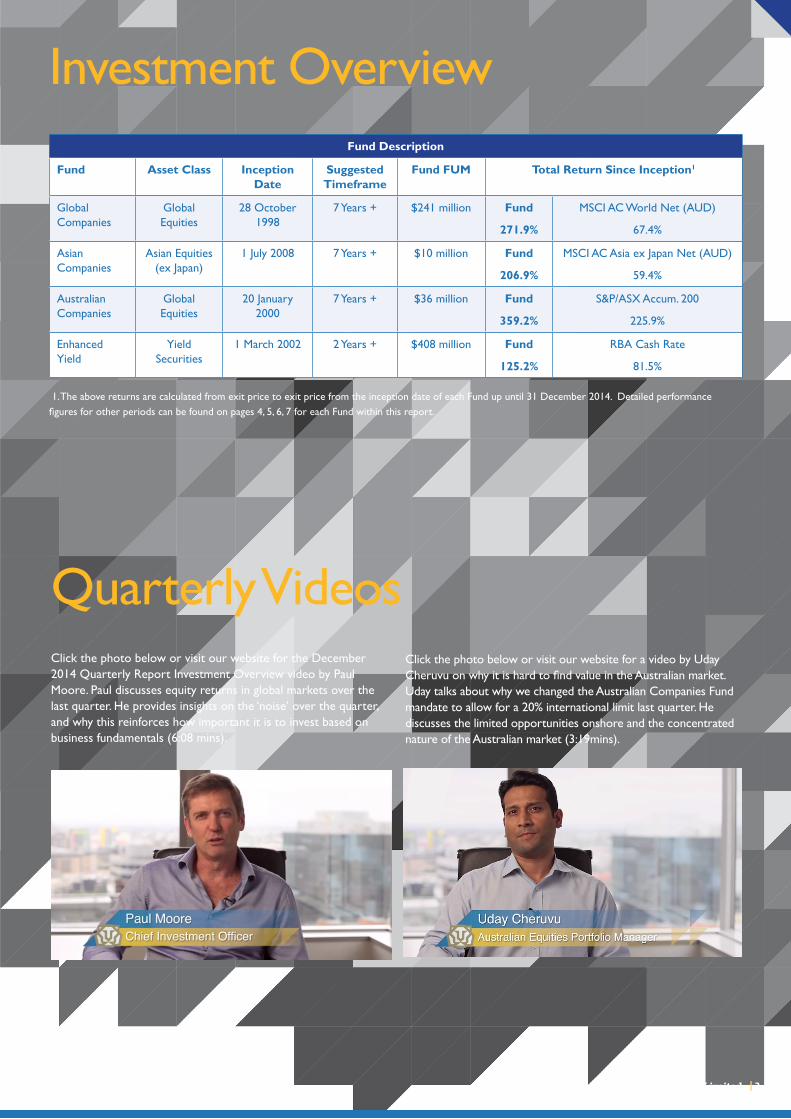
Fund Description
Fund Asset Class Inception Date
Suggested Timeframe
Fund FUM Total Return Since Inception1
Global Companies
Global Equities
28 October 1998
7 Years + $241 million Fund
271.9%
MSCI AC World Net (AUD)
67.4%
Asian Companies
Asian Equities (ex Japan)
1 July 2008 7 Years + $10 million Fund
206.9%
MSCI AC Asia ex Japan Net (AUD)
59.4%
Australian Companies
Global Equities
20 January 2000
7 Years + $36 million Fund
359.2%
S&P/ASX Accum. 200
225.9%
Enhanced Yield
Yield Securities
1 March 2002 2 Years + $408 million Fund
125.2%
RBA Cash Rate
81.5%
1. The above returns are calculated from exit price to exit price from the inception date of each Fund up until 31 December 2014. Detailed performance figures for other periods can be found on pages 4, 5, 6, 7 for each Fund within this report.
Click the photo below or visit our website for the December 2014 Quarterly Report Investment Overview video by Paul Moore. Paul discusses equity returns in global markets over the last quarter. He provides insights on the ‘noise’ over the quarter, and why this reinforces how important it is to invest based on business fundamentals (6:08 mins).
Click the photo below or visit our website for a video by Uday Cheruvu on why it is hard to find value in the Australian market. Uday talks about why we changed the Australian Companies Fund mandate to allow for a 20% international limit last quarter. He discusses the limited opportunities onshore and the concentrated nature of the Australian market (3:19mins).

Global Companies Fund
The Fund had a strong quarter, returning 8.1%. The performance was assisted by the fall in the Australian dollar (AUD) and the rapid share price appreciation across multiple positions, including our US regional banking positions, European beverage names, global stock exchange holdings and payment franchises.
During the quarter the US Fed officially announced an end to its quantitative easing bond-buying program, which created volatility across various asset classes. For example in October the S&P 500 experienced an intra-month peak to trough movement of 10% and subsequently ended the quarter at an all-time high. Oil price was down 68%, iron ore was down 10% and the AUD was down 6%.
This market volatility benefited the Fund, firstly, via our ~100% invested position in the US dollar and secondly, we increased our net equity invested position by 27% during the broad market selloff in October. The Fund ended the quarter at a 101% net equity invested position.
During the quarter we purchased an initial position in two global payment franchises (Visa and MasterCard) and increased our holdings in Pfizer, Realogy Holding, and InterContinental Exchange and a number of Asian gaming consumer related businesses. We exited our position in RE/MAX as it reached our price target after announcing robust earnings.
Oracle, one of our technology holdings rallied significantly this quarter, up 18% after reporting better than expected quarterly earnings. Oracle is the world’s second largest software maker, after Microsoft, and is part of the essential software glue that is enabling the cloud infrastructure to be built out. During the quarter they grew total software license sales at 8% year over year (at constant currency), of which, cloud bookings grew 140% year on year.
Larry Ellison is the founder and largest shareholder in Oracle and continues to be proactive and shareholder focused, as articulated by him in their most recent earnings call, “we are committed to returning value to our shareholders through technical innovation, strategic acquisitions, stock repurchases, prudent use of debt, and the dividend. In terms of acquisitions, we continue to focus on finding the right companies at the right valuations, and both are critically important.” Larry again sums up our overriding view on Oracle’s business and its potential, “the customer, doesn’t want to be integrator of 30 separate applications from 30 separate
vendors.., they don’t want to integrate a lot of different stuff. We have all the stuff pre-integrated. We think we’re in a great position. We’re getting bigger and our growth rates are getting higher. That’s unlike anyone else in the cloud business.”
Visa and MasterCard rallied significantly this quarter, with Visa up 25% after reporting better than expected quarterly earnings. Visa is the world’s largest retail electronic payments network, who are essential middle man enabling the further penetration of electronic payments over cash and cheque. During the quarter they grew total purchase volumes at 10% year over year with US credit card growth of 13%. Over the last five years Visa has grown sales at a low double digit rate, with EBIT margins of 65%, with net cash on its balance sheet. We acquired the business during the October market turmoil at a 17x P/E multiple and believe that significant further penetration remains, as illustrated by the chart, which stands at 35% (ex-China), up from 25% since 2007.
We believe the AUD will continue to weaken as interest rates in the US begin to normalise and we continue to believe that our Fund is well positioned for this normalisation. As commodity industries go into oversupply we expect further price weaknesses, which should further exacerbate the falls in the AUD. Near term volatility in commodities could increase as they have fallen significantly within a short time period, but unless something changes on the supply side we will continue to remain out of the sector, as we have been for the last four years and for the foreseeable future. Volatility may also increase near term as the excess liquidity is drained out of the financial markets, thus entering a stage in the equity market that is best suited to selective stock picking.
Ashley PittardGlobal Portfolio Manager
Portfolio’s Invested Positionon
Long Exposure 107.7%
Short Exposure -6.7%
Net Equity Exposure 101.0%
Debt Securities 17.0%
Cash -18.0%
Total Exposure 100.0%
Investment Performance2
Inception Date
Exit Price
3 Months 6 Months 1 Year 3 Years pa
5 Years pa
Since Inception
pa
Total Return
Global Companies Fund
10/1998 2.0647 8.1% 20.2% 14.4% 35.7% 14.8% 8.5% 271.9%
MSCI AC World Net Index (AUD)
8.0% 14.0% 14.7% 24.5% 12.3% 3.2% 67.4%
2. Returns are calculated from exit price to exit price for the period as stated and represent the combined income and capital return for the Fund. For more details, the PDS provides an explanation of how returns are calculated.
Long Equity Composition
Banks - Lloyds Bank, Barclays, Bank of America 32.8%
Services - Google Inc, CME Group Inc, Comcast 26.2%
Property - Realogy, Howard Hughes, MDC Holdings 18.1%
Beverages - Heineken Holdings, Anheuser-Busch Inbev 10.1%
Diversified Financials - ING Groep 6.8%
Technology - Oracle 3.7%
Other - Turquoise Hill Resources, Pfitzer 10.0%
Total Long Equity Exposure 107.7%
4 | PM CAPITAL Limited
Asian Companies Fund
The Fund’s underlying holdings suffered mixed fortunes during the quarter. Of note were the performances of the two major investment themes, online classifieds and gaming. 51Job, Zhaopin and 104 Corp. all performed strongly after posting solid third quarter results, however the gains achieved by these names were virtually offset by the Fund’s holdings in Donaco International and Macau holdings, MGM China and SJM Holdings.
Donaco continues to be impacted by a slower than anticipated ramp up at their Lao Cai property, which was evident during their AGM update. We view the negative factors causing the slower ramp up as transitory and believe the share price correction is overdone. Macau continues to be impacted by the same factors highlighted in our September 2014 quarterly commentary when we were adding to these names. Given the focus on short term data points in Macau, the potential for near term volatility was always going to be high, although it has been more severe than we anticipated. We continue to believe in the long term opportunity in Macau and think comments from Steve Wynn, Chairman and CEO of Wynn Resorts, during their third quarter conference call sums up the current situation, “everybody is being very conservative at this point over there... I don’t know whether it is a squall or we’re in the rainy season or how long it will last but we are still very very bullish on Macau”.
The continued depreciation of the Australian dollar was again a bright spot and contributed meaningfully to performance.
Our infrastructure holdings, Beijing Capital International Airport (BCIA) and Sinopec Kantons, were both in the news during the quarter.
Final approval for Beijing’s second airport was announced in early December giving the green light for construction to begin in 2015. The project is estimated to cost 80bn RMB (inclusive of infrastructure connecting the airport to the Beijing city) and is scheduled to begin operation in 2020. Of importance to BCIA funding was also announced, which did not include a contribution from the listco, which had been a major overhang for BCIA. This frees up BCIA to further reduce debt and increase their payout ratio going forward.
Long Equity Composition
Internet - Baidu, 51Job Inc., Zhaopin Ltd 19.5%
Gaming - Donaco International, SJM Holdings 17.5%
Consumer - Carlsberg Malaysia, Guinness Anchor 15.4%
Infrastructure - Beijing Capital Int’l Airport 8.7%
Commodities - Turquoise Hill Resources, IRC 6.7%
Healthcare - Mindray Medical 5.8%
Media - Astro Malaysia Holdings 5.5%
Other 5.0%
Cash 15.9%
Total Exposure 100.0%
Investment Performance2
Inception Date
Exit Price
3 Months 6 Months 1 Year 3 Years pa
5 Years pa
Since Inception
pa
Total Return
Asian Companies Fund 07/2008 1.7802 3.9% 11.6% 3.1% 20.1% 10.5% 18.8% 206.9%
MSCI AC Asia ex Japan Net Index (AUD)
7.1% 13.6% 14.6% 18.3% 7.5% 7.4% 59.4%
2. Returns are calculated from exit price to exit price for the period as stated and represent the combined income and capital return for the Fund. For more details, the PDS provides an explanation of how returns are calculated.
Sinopec Kantons provided shareholders with a new year’s gift by announcing the acquisition of gas pipeline assets from its parent company Sinopec. The company will pay 2.6bn RMB for 100% of the Yulin-Jinan gas pipeline and assume 3.5bn RMB of existing debt. While the assets being acquired are less than some analysts had flagged, the transaction remains earnings accretive and completes another milestone towards Sinopec Kantons becoming the major infrastructure owner within the Sinopec Group. The deal values the pipeline assets at 9.7x and 1.7x trailing earnings and book respectively, which we view as attractive given the return profile of the underlying assets and the ability to grow throughput and earnings in the near future. Given the lower consideration we also view the potential for debt funding to be used rather than equity dilution as a positive.
The greater transparency these two announcements provide regarding what were major overhangs should lead to a re-rating of both stocks in 2015.
The quarter was an active one for the Fund with several new positions being added, broadening out the portfolio. We bought back in to Mindray Medical and AAC Technologies, two companies we have held previously. We also initiated a position in Chinese FMCG company Tingyi Holdings, which adds to our Asian consumer company thematic. We have long admired Tingyi from afar. Management has built one of the strongest branded consumer companies in China over the past twenty years, both in terms of distribution presence and brand portfolio. The recent share price correction has provided a good entry price to what we view as one of the best exposures to the growth in Chinese domestic consumption over the coming decades. A softening in the competitive dynamic in the instant noodle category, which had impacted margins over the last two years, declining commodity prices and the impending turnaround in the Pepsi bottling business acquired in 2012 should drive earnings growth.
With the aforementioned portfolio changes the invested position of the Fund was increased to 84% at the end of December.
Kevin BertoliAsian Portfolio Manager
5PM CAPITAL Limited |

Australian Companies Fund
The Fund’s mandate was amended over the last quarter to allow for investments in international stocks, with a limit of 20% net exposure. This amendment provides investors the ability to benefit from investing in high quality international companies, which provide exposure to investment themes and exposures not available to purely domestic investors. This change was implemented due to our continued struggle to find value in the Australian market.
Our investment process in selecting, researching and investing in suitable international investments remains the same as the one we follow to invest in domestic companies. To date the Fund has invested in seven international stocks. In addition, we added to its positions in ANZ and NAB, while initiating new positions in Macquarie Group and Westpac.
Some of the international businesses the Fund has invested in are summarised below:
BB&T Corporation (BBT) – A leading regional retail bank in the US with market leading exposure in the South East and Mid-West states of USA. BBT has a strong deposit book with a Net Interest Margin (NIM) that is in the upper quartile among the regional banks and its long term cost to expense ratio is better than peers. BBT has a surplus capital position and should be able to grow its loan book faster than the market, allowing it to outperform the market in an improving macro environment.
Lloyds Bank (LLOY) – The largest retail bank in the UK. In our opinion, under the current management team Lloyds has become one of the best run retail banks in the world. We believe as legacy issues in relation to its non-core assets and UK banking sector litigation wind down over the next 2 to 3 years, the earnings power of Lloyds’ retail banking operations will improve significantly. With management committed to paying out up to 70% of earnings to investors, we expect Lloyds to outperform global peers.
Bank of Ireland (BIR) – The largest retail bank in Ireland. The Irish economy has seen a major correction in GDP during the GFC and its banking sector was hit with significant loan losses and capital issues. As a result, a number of international banks left Ireland. This has meant that remaining domestic banks in Ireland have increased their market power, and with the Irish economy showing signs of rebounding, these banks are poised to make higher returns. We believe BIR is the best positioned among the
Irish banks to benefit from a period of high ROE.
Intercontinental Exchange (ICE) – An international exchange operator. ICE operates a derivatives exchange and clearing house in Europe and also operates the NYSE in the US. Due to the low interest rate environment since the GFC and low volatility environment over the last 2 years, trading activity on ICE has fallen significantly. We believe the current share price of ICE does not factor in the fact that this trading activity will rebound as the global economy improves and central banks increase interest rates. Being a scale business, we believe ICE’s earnings will improve substantially in such a scenario. In addition, being a vertically integrated business in derivatives, ICE has a near monopoly position in many of the products that are traded on its exchanges. As a result, we believe an investment in ICE has low downside risk, while providing large upside in the medium term.
During the quarter we sold down the Fund’s positions in Qube Logistics after the stock had a strong run post June, and increased our financial positions. We believe the banks provide a better risk reward opportunity than the non-financial sectors currently.
We continue to see downside risk in the commodity sector as a slowdown in the Chinese economy fully washes through to commodity prices. As a result of these views we have been reluctant to add any commodity exposure to the Fund. However, we recognise that we were too quick to close our short positions in our mining services companies (ALS and Skilled Engineering) in August. We closed our short position in these stocks after they fell following their full year earnings releases in August, where they reset their earnings expectations as we had expected. We did not anticipate that these same companies would issue further downgrades in just the next quarter. As a result, these stocks are down further than when we closed our short positions and we view this as a missed opportunity and a reminder about the importance of focussing on fundamentals. Over the long run, stock prices will nearly always follows the fundamentals and patience will be well rewarded.
Uday CheruvuAustralian Portfolio Manager
Portfolio’s Invested Positionon
Long Exposure 94.0%
Short Exposure 0.0%
Net Equity Exposure 94.0%
Debt Securities 23.6%
Cash -17.6%
Total Exposure 100.0%
Investment Performance2
Inception Date
Exit Price
3 Months 6 Months 1 Year 3 Years pa
5 Years pa
Since Inception
pa
Total Return
Australian Companies Fund
01/2000 1.6031 1.2% 3.3% 8.6% 18.6% 8.9% 10.7% 359.2%
S&P / ASX Accumulation 200 Index
3.1% 2.5% 5.6% 15.1% 6.8% 8.2% 225.9%
2. Returns are calculated from exit price to exit price for the period as stated and represent the combined income and capital return for the Fund. For more details, the PDS provides an explanation of how returns are calculated.
Long Equity Composition
Banks - ANZ, NAB, BBT, Lloyds, Bank of Ireland 28.3%
Property - Asia Pacific Data Centre, Devine 23.2%
Consumer - JB Hi-Fi, Heineken Holdings 9.3%
Media - PMP Limited 8.5%
Insurance - QBE Insurance 7.9%
Gaming - Donaco International, SJM Holdings 7.4%
Technology - NEXTDC 6.4%
Other - Intercontinental Exchange Inc 3.0%
Total Long Equity Exposure 94.0%
6 | PM CAPITAL Limited

Enhanced Yield Fund
Av Yield (gross)
Av Spread to RBA (gross)
Cash 46.6% 3.2%* 0.7%*
Corporate Bonds 34.4% 5.1%* 2.6%*
Fixed
Floating
0%
34.4%
Hybrids 15.5% 5.2%* 2.7%*
Fixed
Floating
0%
15.5%
Equity Income Strategies 3.5% 6.4%* 3.9%*
Total Exposure 100.0%
Investment Performance2
Inception Date
Exit Price
3 Months 6 Months 1 Year 3 Years pa
5 Years pa
Since Inception
pa
Total Return
Enhanced Yield Fund 03/2002 1.1107 0.4% 1.2% 3.7% 5.3% 5.5% 6.5% 125.2%
RBA Cash Rate 0.6% 1.3% 2.5% 3.0% 3.6% 4.8% 81.5%
2. Returns are calculated from exit price to exit price for the period as stated and represent the combined income and capital return for the Fund. For more details, the PDS provides an explanation of how returns are calculated.
Credit markets continued their volatile performance from last quarter, as further concerns over Chinese growth, Greek political instability, confusion over the timing and path of US rate rises, falling commodity prices and their impact on the Australian economy, plus one of the strongest quarters of debt issuance in Europe on record, all put doubt in the minds of global credit investors.
Interestingly, much has also been made of the substantial (~50%) fall in the oil price with regard to the demand side of the global economy, however given its current levels we believe that in light of the fact that most developed nations are net oil importers, it should act as a long term positive for global growth.
The Fund returned 0.4% over the quarter v the RBA cash rate return of 0.6%. Whilst slightly behind the RBA cash rate, we are very comfortable with the current positioning of the Fund.
Importantly, we made a considerable number of new and additional investments over the quarter, which we were able to execute on account of the large cash balance we have maintained and have been waiting patiently to invest.
During the quarter we added to our casino sector exposure with a new position being initiated in the senior debt of Wynn Macau at ~Bills +400bp. Wynn owns a highly profitable casino in the main Macau gaming precinct and are about 18 months from completing their second casino on the Cotai strip, which is progressing well. The recent short term volatility in Chinese gambling data provided us with what we think is an ideal entry point here.
Further, we initiated a position in NAB’s new Euro subordinated debt deal which came at ~Bills +230bp, a ~50bp premium to where the equivalent $A notes trade and consistent with our theme of seeking out securities by the same issuer that are mis-priced from market to market. This pricing was also partly a function of the huge corporate supply coming out of Europe, noted earlier.
Additionally, we made an investment in Queensland Motorways (owned by Transurban) new senior secured debt issue at ~Bills +160bp. This investment is predominately secured against the cashflows of Brisbane’s 2 main toll roads which have been in
operation since the 1980’s and thus, have a very stable and mature cashflow profile. This investment was priced at a considerable spread premium to its peers.
We also initiated an investment in the senior secured debt of Las Vegas casino City Centre at ~Bills +400bp. This property is owned and operated by casino giant MGM and is consistent with our firm-wide strategies focussing on the recovery in US property and improving gaming revenues on the Las Vegas strip.
Finally, we also topped up our holdings in Tesco’s secured property debt at ~Bills +425bp, our holding in QBE’s USD Tier 1 debt at ~Bills +425bp, as well as our holdings in Irish REITS Kennedy Wilson (Dublin office property) and Hibernia (regional commercial property) through their discounted rights issues. We believe that these two REITS, once fully invested, will be on yields of 7-9%.
All in all, the above investments represented a collective deployment of over 10% of the Funds’ capital, and a very busy quarter for the team.
Given the likely continuation, in our opinion, of the current volatility across most asset markets, we expect to make further investments in what we believe to be materially mispriced securities in the coming months. In other words, we expect to further increase the Funds’ invested position in the near to medium term.
In the interim, the current credit spread duration on the Fund is ~2.50 years and thus we already have a meaningful exposure to what we believe to be the genuine standout investment opportunities across credit markets. Furthermore, the current average spread across the Fund’s assets is currently very healthy, at almost 200bp over the RBA cash rate.
Jarod Dawson Yield Portfolio Manager
Duration
Interest Rate 0.15 Years*
Average Term to Maturity 2.50 Years* * These numbers are an estimate and should be used as a guide only.
Maturity
0-1 year 57.8%
1-2 years 6.0%
2-3 years 10.3%
3-4 years 0.7%
4 years + 25.2%
Regional
Australia 80.4%
UK 9.0%
US 5.5%
Europe 5.1%
7PM CAPITAL Limited |

ORIGINAL LOGO
NEW VERSION 1
NEW VERSION 2
RESPONSIBLE ENTITYPM CAPITAL Limited ABN 69 083 644 731AFSL 230222
Level 27, 420 George Street Sydney NSW 2000Phone (+612) 8243 0888Fax (+612) 8243 0880Email [email protected] www.pmcapital.com.au
CONTACTRob ThompsonHead of DistributionPhone (+612) 8243 0807Mobile 0434 367 553Email [email protected]
Shane O’ConnorBusiness Development ManagerPhone (+612) 8243 0815Mobile 0424 996 795Email [email protected]