quarterly private health insurance statistics · quarterly private health insurance statistics...
TRANSCRIPT
Quarterly Private Health Insurance Statistics
March 2019 (released 21 May 2019)
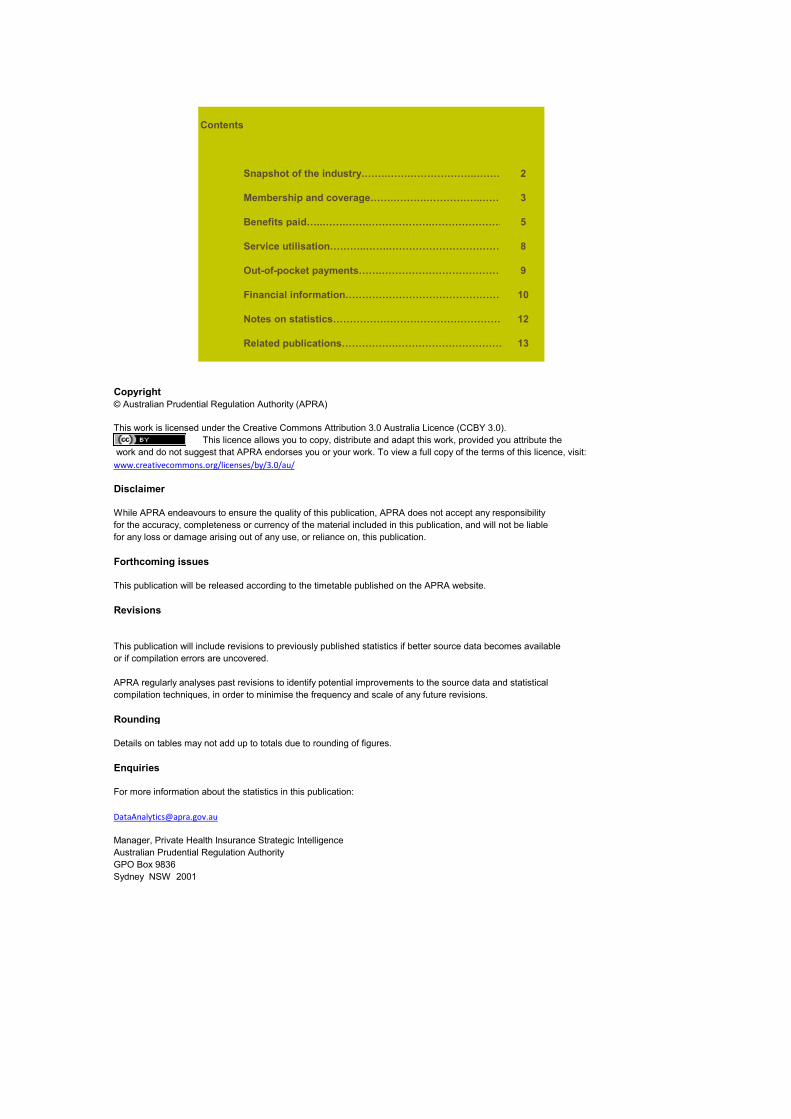
Contents
Snapshot of the industry.…….…….………………..………….2
Membership and coverage…….……….……………..……… 3
Benefits paid…..…….…….……………….………………… 5
Service utilisation………..…….……………………………………8
Out-of-pocket payments…….…………………………………………….9
Financial information…………………………………………………10
Notes on statistics………………………………………………………12
13
Copyright© Australian Prudential Regulation Authority (APRA)
www.creativecommons.org/licenses/by/3.0/au/
Disclaimer
Forthcoming issues
Revisions
Rounding
Enquiries
Australian Prudential Regulation AuthorityGPO Box 9836 Sydney NSW 2001
or if compilation errors are uncovered.
APRA regularly analyses past revisions to identify potential improvements to the source data and statisticalcompilation techniques, in order to minimise the frequency and scale of any future revisions.
Details on tables may not add up to totals due to rounding of figures.
For more information about the statistics in this publication:
for any loss or damage arising out of any use, or reliance on, this publication.
This publication will be released according to the timetable published on the APRA website.
This publication will include revisions to previously published statistics if better source data becomes available
work and do not suggest that APRA endorses you or your work. To view a full copy of the terms of this licence, visit:
Manager, Private Health Insurance Strategic Intelligence
Related publications…………….……………………………………….
This work is licensed under the Creative Commons Attribution 3.0 Australia Licence (CCBY 3.0). This licence allows you to copy, distribute and adapt this work, provided you attribute the
While APRA endeavours to ensure the quality of this publication, APRA does not accept any responsibility for the accuracy, completeness or currency of the material included in this publication, and will not be liable
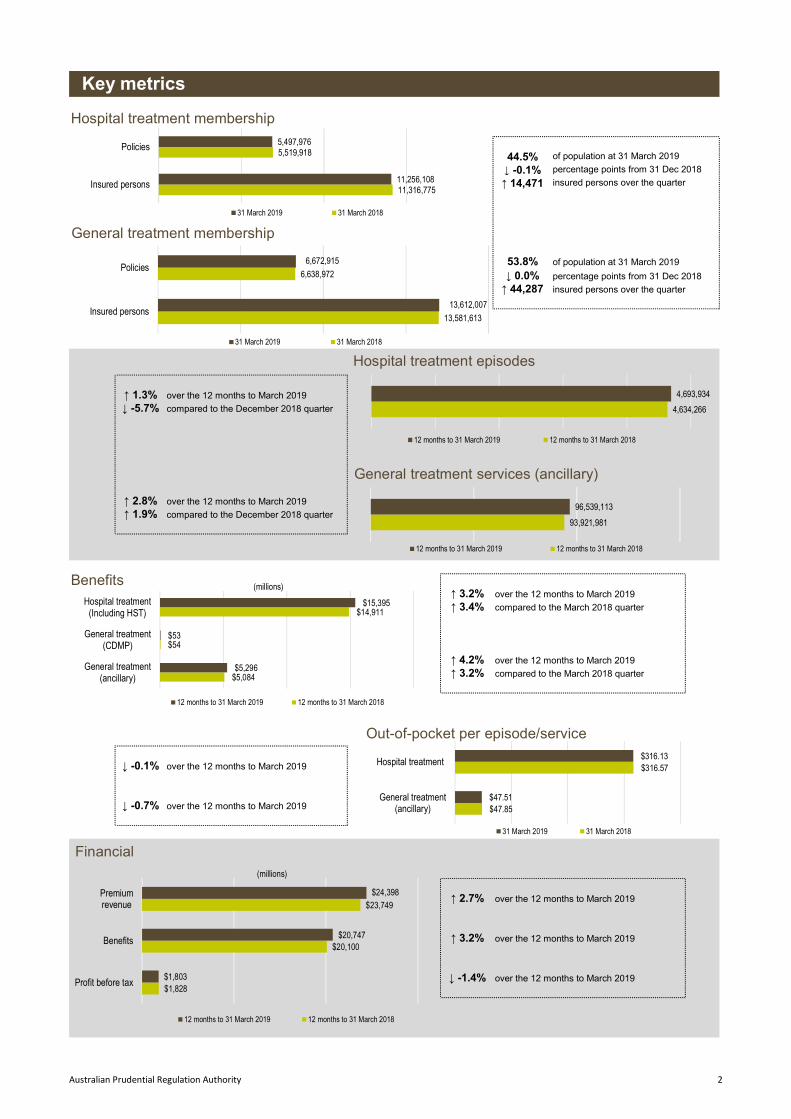
44.5% of population at 31 March 2019
↓ -0.1% percentage points from 31 Dec 2018
↑ 14,471 insured persons over the quarter
53.8% of population at 31 March 2019
↓ 0.0% percentage points from 31 Dec 2018
↑ 44,287 insured persons over the quarter
↑ 1.3% over the 12 months to March 2019
↓ -5.7% compared to the December 2018 quarter
↑ 2.8% over the 12 months to March 2019
↑ 1.9% compared to the December 2018 quarter
↑ 3.2% over the 12 months to March 2019
↑ 3.4% compared to the March 2018 quarter
↑ 4.2% over the 12 months to March 2019
↑ 3.2% compared to the March 2018 quarter
↓ -0.1% over the 12 months to March 2019
↓ -0.7% over the 12 months to March 2019
↑ 2.7% over the 12 months to March 2019
↑ 3.2% over the 12 months to March 2019
↓ -1.4% over the 12 months to March 2019
Key metrics
11,316,775
5,519,918
11,256,108
5,497,976
Insured persons
Policies
Hospital treatment membership
31 March 2019 31 March 2018
13,581,613
6,638,972
13,612,007
6,672,915
Insured persons
Policies
General treatment membership
31 March 2019 31 March 2018
4,634,266
4,693,934
Hospital treatment episodes
12 months to 31 March 2019 12 months to 31 March 2018
93,921,981
96,539,113
General treatment services (ancillary)
12 months to 31 March 2019 12 months to 31 March 2018
$5,084
$54
$14,911
$5,296
$53
$15,395
General treatment(ancillary)
General treatment(CDMP)
Hospital treatment(Including HST)
Benefits
12 months to 31 March 2019 12 months to 31 March 2018
(millions)
$47.85
$316.57
$47.51
$316.13
General treatment(ancillary)
Hospital treatment
Out-of-pocket per episode/service
31 March 2019 31 March 2018
$1,828
$20,100
$23,749
$1,803
$20,747
$24,398
Profit before tax
Benefits
Premiumrevenue
Financial
12 months to 31 March 2019 12 months to 31 March 2018
(millions)
Australian Prudential Regulation Authority 2
Hospital Treatment
Net quarterly change in insured persons
Number of persons insured by ageLifetime health cover
Hospital treatment tables
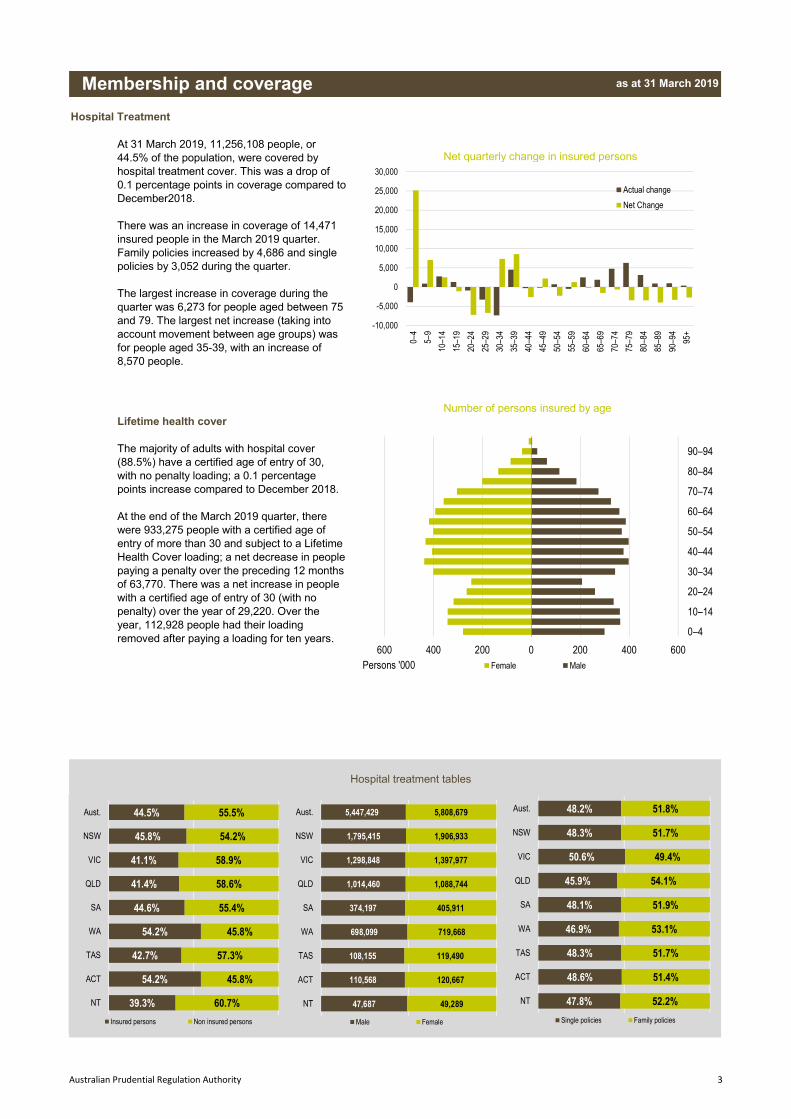
Membership and coverage as at 31 March 2019
At 31 March 2019, 11,256,108 people, or 44.5% of the population, were covered by hospital treatment cover. This was a drop of 0.1 percentage points in coverage compared to December2018. There was an increase in coverage of 14,471 insured people in the March 2019 quarter. Family policies increased by 4,686 and single policies by 3,052 during the quarter.
The largest increase in coverage during the quarter was 6,273 for people aged between 75 and 79. The largest net increase (taking into account movement between age groups) was for people aged 35-39, with an increase of 8,570 people.
The majority of adults with hospital cover (88.5%) have a certified age of entry of 30, with no penalty loading; a 0.1 percentage points increase compared to December 2018.
At the end of the March 2019 quarter, there were 933,275 people with a certified age of entry of more than 30 and subject to a Lifetime Health Cover loading; a net decrease in people paying a penalty over the preceding 12 months of 63,770. There was a net increase in people with a certified age of entry of 30 (with no penalty) over the year of 29,220. Over the year, 112,928 people had their loading removed after paying a loading for ten years.
600 400 200 0 200 400 600
0–4
10–14
20–24
30–34
40–44
50–54
60–64
70–74
80–84
90–94
Persons '000 Female Male
44.5%
45.8%
41.1%
41.4%
44.6%
54.2%
42.7%
54.2%
39.3%
55.5%
54.2%
58.9%
58.6%
55.4%
45.8%
57.3%
45.8%
60.7%
Aust.
NSW
VIC
QLD
SA
WA
TAS
ACT
NT
Insured persons Non insured persons
5,447,429
1,795,415
1,298,848
1,014,460
374,197
698,099
108,155
110,568
47,687
5,808,679
1,906,933
1,397,977
1,088,744
405,911
719,668
119,490
120,667
49,289
Aust.
NSW
VIC
QLD
SA
WA
TAS
ACT
NT
Male Female
48.2%
48.3%
50.6%
45.9%
48.1%
46.9%
48.3%
48.6%
47.8%
51.8%
51.7%
49.4%
54.1%
51.9%
53.1%
51.7%
51.4%
52.2%
Aust.
NSW
VIC
QLD
SA
WA
TAS
ACT
NT
Single policies Family policies
-10,000
-5,000
0
5,000
10,000
15,000
20,000
25,000
30,000
0–4
5–9
10–1
4
15–1
9
20–2
4
25–2
9
30–3
4
35–3
9
40–4
4
45–4
9
50–5
4
55–5
9
60–6
4
65–6
9
70–7
4
75–7
9
80–8
4
85–8
9
90–9
4
95+
Actual change
Net Change
Australian Prudential Regulation Authority 3
General Treatment
Net quarterly change in insured persons (ancillary)
Number of persons insured by age (ancillary)
General treatment tables (ancillary)
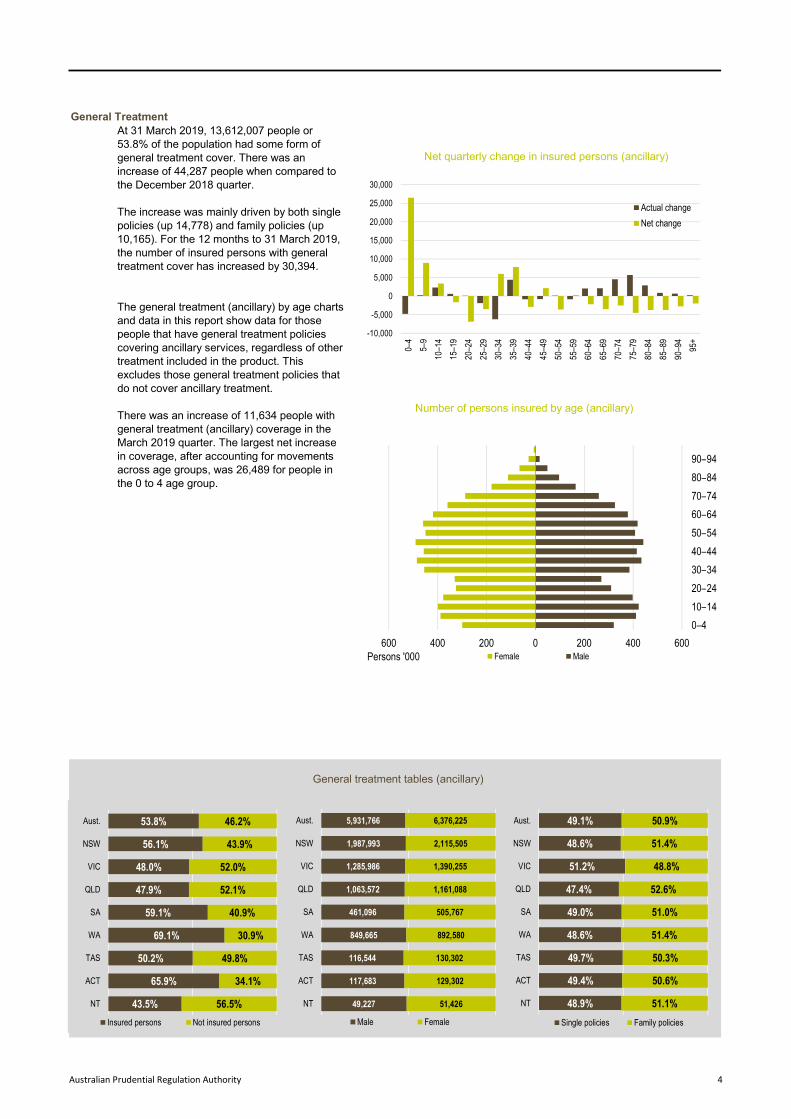
At 31 March 2019, 13,612,007 people or 53.8% of the population had some form of general treatment cover. There was an increase of 44,287 people when compared to the December 2018 quarter.
The increase was mainly driven by both single policies (up 14,778) and family policies (up 10,165). For the 12 months to 31 March 2019, the number of insured persons with general treatment cover has increased by 30,394.
The general treatment (ancillary) by age charts and data in this report show data for those people that have general treatment policies covering ancillary services, regardless of other treatment included in the product. This excludes those general treatment policies that do not cover ancillary treatment.
There was an increase of 11,634 people with general treatment (ancillary) coverage in the March 2019 quarter. The largest net increase in coverage, after accounting for movements across age groups, was 26,489 for people in the 0 to 4 age group.
600 400 200 0 200 400 600
0–4
10–14
20–24
30–34
40–44
50–54
60–64
70–74
80–84
90–94
Persons '000 Female Male
53.8%
56.1%
48.0%
47.9%
59.1%
69.1%
50.2%
65.9%
43.5%
46.2%
43.9%
52.0%
52.1%
40.9%
30.9%
49.8%
34.1%
56.5%
Aust.
NSW
VIC
QLD
SA
WA
TAS
ACT
NT
Insured persons Not insured persons
5,931,766
1,987,993
1,285,986
1,063,572
461,096
849,665
116,544
117,683
49,227
6,376,225
2,115,505
1,390,255
1,161,088
505,767
892,580
130,302
129,302
51,426
Aust.
NSW
VIC
QLD
SA
WA
TAS
ACT
NT
Male Female
49.1%
48.6%
51.2%
47.4%
49.0%
48.6%
49.7%
49.4%
48.9%
50.9%
51.4%
48.8%
52.6%
51.0%
51.4%
50.3%
50.6%
51.1%
Aust.
NSW
VIC
QLD
SA
WA
TAS
ACT
NT
Single policies Family policies
-10,000
-5,000
0
5,000
10,000
15,000
20,000
25,000
30,000
0–4
5–9
10–1
4
15–1
9
20–2
4
25–2
9
30–3
4
35–3
9
40–4
4
45–4
9
50–5
4
55–5
9
60–6
4
65–6
9
70–7
4
75–7
9
80–8
4
85–8
9
90–9
4
95+
Actual change
Net change
Australian Prudential Regulation Authority 4
Hospital treatment
Benefits per episode/service
Hospital Treatment Acute -0.5%Medical -1.5%Prostheses 0.3% Cardiac -1.3% Hip 0.2% Knee 0.7%Total benefits and growth rateHospital -6.6%General 4.2%
Hospital treatment benefits per person
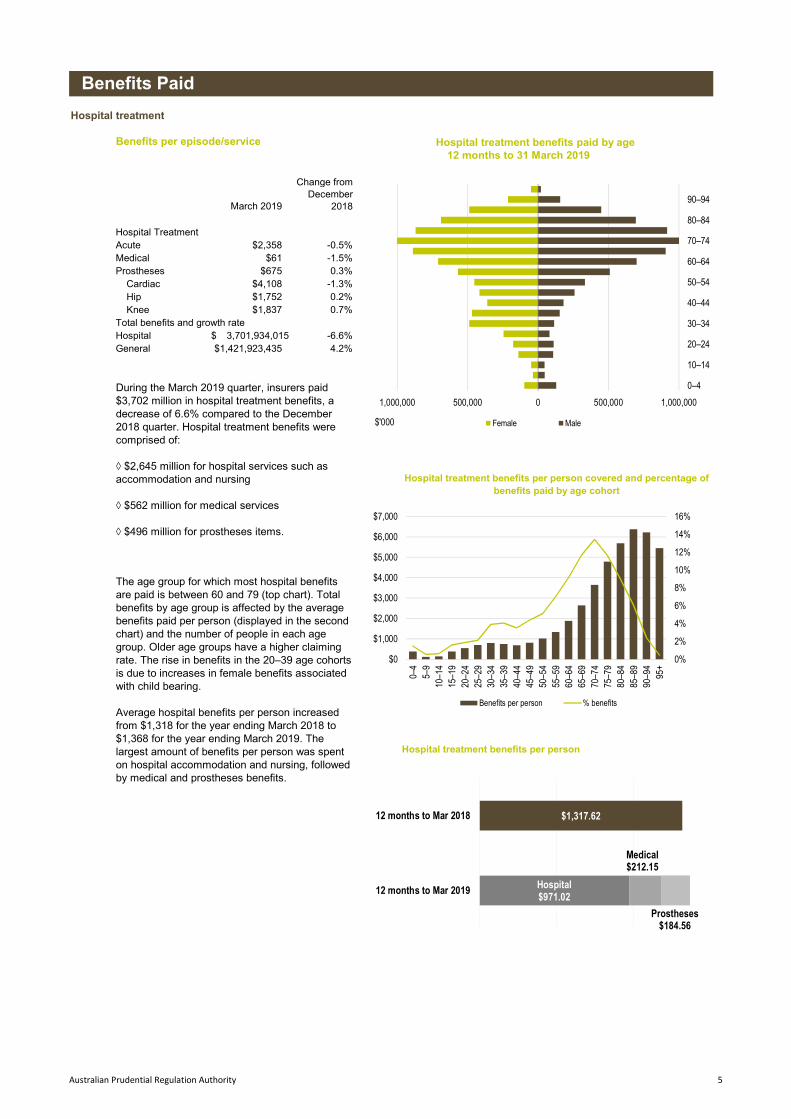
The age group for which most hospital benefits are paid is between 60 and 79 (top chart). Total benefits by age group is affected by the average benefits paid per person (displayed in the second chart) and the number of people in each age group. Older age groups have a higher claiming rate. The rise in benefits in the 20–39 age cohorts is due to increases in female benefits associated with child bearing.
Average hospital benefits per person increased from $1,318 for the year ending March 2018 to $1,368 for the year ending March 2019. The largest amount of benefits per person was spent on hospital accommodation and nursing, followed by medical and prostheses benefits.
$2,358$61
$675$4,108$1,752
3,701,934,015$
$1,837
Hospital treatment benefits per person covered and percentage of benefits paid by age cohort
Hospital treatment benefits paid by age12 months to 31 March 2019
During the March 2019 quarter, insurers paid $3,702 million in hospital treatment benefits, a decrease of 6.6% compared to the December 2018 quarter. Hospital treatment benefits were comprised of:
◊ $2,645 million for hospital services such as accommodation and nursing
◊ $562 million for medical services
◊ $496 million for prostheses items.
Benefits Paid
Change from December
2018
$1,421,923,435
March 2019
1,000,000 500,000 0 500,000 1,000,000
0–4
10–14
20–24
30–34
40–44
50–54
60–64
70–74
80–84
90–94
$'000 Female Male
0%
2%
4%
6%
8%
10%
12%
14%
16%
$0
$1,000
$2,000
$3,000
$4,000
$5,000
$6,000
$7,000
0–4
5–9
10–1
415
–19
20–2
425
–29
30–3
435
–39
40–4
445
–49
50–5
455
–59
60–6
465
–69
70–7
475
–79
80–8
485
–89
90–9
495
+
Benefits per person % benefits
Hospital$971.02
$1,317.62
Medical$212.15
Prostheses$184.56
12 months to Mar 2019
12 months to Mar 2018
Australian Prudential Regulation Authority 5
General treatment
Benefits per service
March 2019
Dental $67 2.6% Chiropractic $34 11.6% Physiotherapy $39 9.0% Optical $77 2.9%
General treatment benefits per person (ancillary)
$412.28
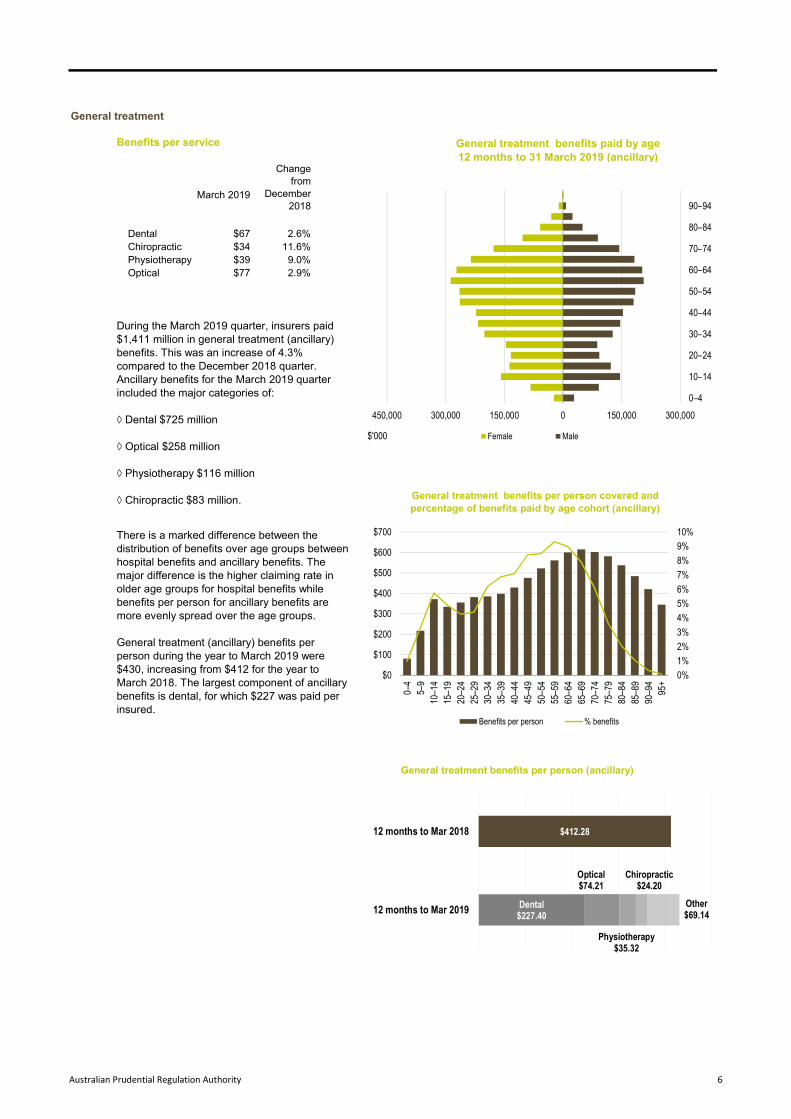
During the March 2019 quarter, insurers paid $1,411 million in general treatment (ancillary) benefits. This was an increase of 4.3% compared to the December 2018 quarter. Ancillary benefits for the March 2019 quarter included the major categories of:
◊ Dental $725 million
◊ Optical $258 million
◊ Physiotherapy $116 million
◊ Chiropractic $83 million.
General treatment benefits paid by age 12 months to 31 March 2019 (ancillary)
General treatment benefits per person covered and percentage of benefits paid by age cohort (ancillary)
There is a marked difference between the distribution of benefits over age groups between hospital benefits and ancillary benefits. The major difference is the higher claiming rate in older age groups for hospital benefits while benefits per person for ancillary benefits are more evenly spread over the age groups.
General treatment (ancillary) benefits per person during the year to March 2019 were $430, increasing from $412 for the year to March 2018. The largest component of ancillary benefits is dental, for which $227 was paid per insured.
Change from
December 2018
450,000 300,000 150,000 0 150,000 300,000
0–4
10–14
20–24
30–34
40–44
50–54
60–64
70–74
80–84
90–94
$'000 Female Male
0%
1%
2%
3%
4%
5%
6%
7%
8%
9%
10%
$0
$100
$200
$300
$400
$500
$600
$700
0–4
5–9
10–1
415
–19
20–2
425
–29
30–3
435
–39
40–4
445
–49
50–5
455
–59
60–6
465
–69
70–7
475
–79
80–8
485
–89
90–9
495
+
Benefits per person % benefits
Dental$227.40
$412.28
Optical$74.21
Physiotherapy$35.32
Chiropractic$24.20
Other$69.1412 months to Mar 2019
12 months to Mar 2018
Australian Prudential Regulation Authority 6
Medical benefits Prostheses benefits
Medical benefits by Speciality group
Benefits paid for prostheses
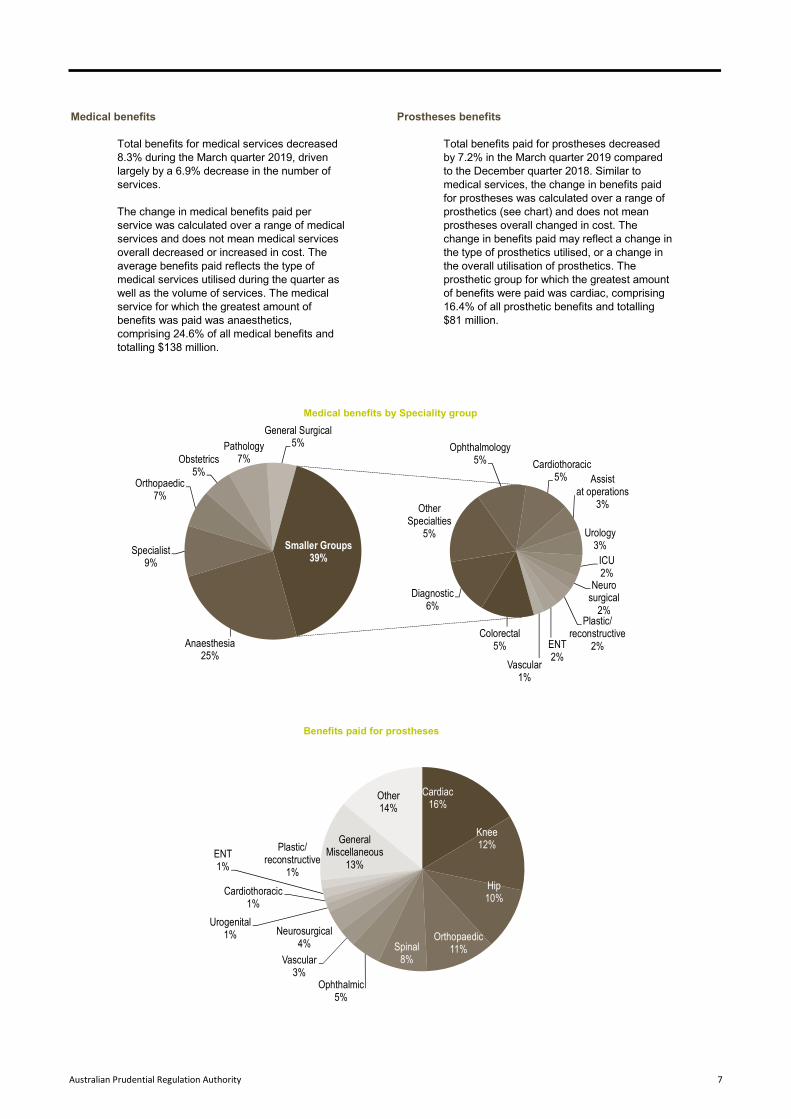
Total benefits paid for prostheses decreased by 7.2% in the March quarter 2019 compared to the December quarter 2018. Similar to medical services, the change in benefits paid for prostheses was calculated over a range of prosthetics (see chart) and does not mean prostheses overall changed in cost. The change in benefits paid may reflect a change in the type of prosthetics utilised, or a change in the overall utilisation of prosthetics. The prosthetic group for which the greatest amount of benefits were paid was cardiac, comprising 16.4% of all prosthetic benefits and totalling $81 million.
Total benefits for medical services decreased 8.3% during the March quarter 2019, driven largely by a 6.9% decrease in the number of services.
The change in medical benefits paid per service was calculated over a range of medical services and does not mean medical services overall decreased or increased in cost. The average benefits paid reflects the type of medical services utilised during the quarter as well as the volume of services. The medical service for which the greatest amount of benefits was paid was anaesthetics, comprising 24.6% of all medical benefits and totalling $138 million.
Anaesthesia25%
Specialist9%
Orthopaedic7%
Obstetrics5%
Pathology7%
General Surgical5%
Colorectal5%
Diagnostic6%
Other Specialties
5%
Ophthalmology5% Cardiothoracic
5% Assist at operations
3%
Urology3%
ICU2%
Neurosurgical
2%Plastic/
reconstructive2%ENT
2%Vascular
1%
Smaller Groups39%
Cardiac16%
Knee12%
Hip10%
Orthopaedic11%Spinal
8%
Ophthalmic5%
Vascular3%
Neurosurgical4%
Urogenital1%
Cardiothoracic1%
ENT1%
Plastic/reconstructive
1%
General Miscellaneous
13%
Other14%
Australian Prudential Regulation Authority 7
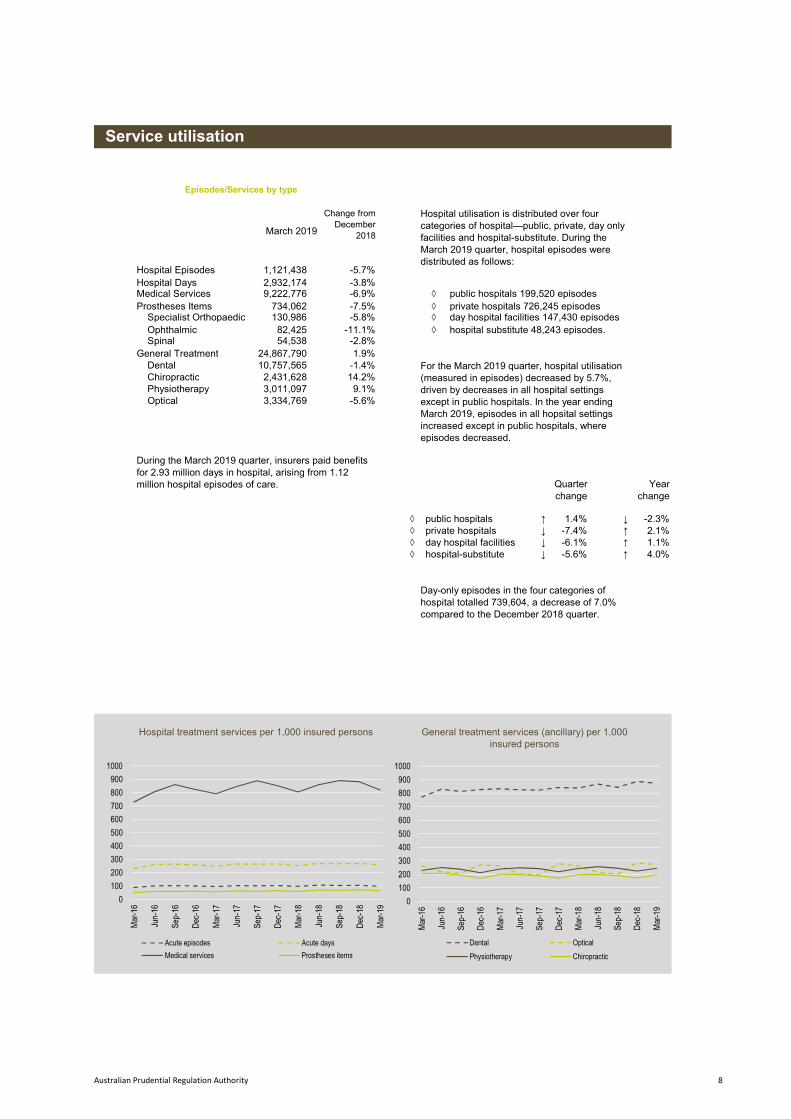
Episodes/Services by type
Hospital Episodes -5.7%Hospital Days -3.8%Medical Services -6.9% ◊ public hospitals 199,520 episodesProstheses Items -7.5% ◊ private hospitals 726,245 episodes Specialist Orthopaedic -5.8% ◊ day hospital facilities 147,430 episodes Ophthalmic -11.1% ◊ hospital substitute 48,243 episodes. Spinal -2.8%General Treatment 1.9% Dental -1.4% Chiropractic 14.2% Physiotherapy 9.1% Optical -5.6%
◊ public hospitals ↑ 1.4% ↓ -2.3% ◊ private hospitals ↓ -7.4% ↑ 2.1% ◊ day hospital facilities ↓ -6.1% ↑ 1.1% ◊ hospital-substitute ↓ -5.6% ↑ 4.0%
Day-only episodes in the four categories of hospital totalled 739,604, a decrease of 7.0% compared to the December 2018 quarter.
Quarter change
Year change
Hospital treatment services per 1,000 insured persons General treatment services (ancillary) per 1,000 insured persons
During the March 2019 quarter, insurers paid benefits for 2.93 million days in hospital, arising from 1.12 million hospital episodes of care.
10,757,5652,431,628
For the March 2019 quarter, hospital utilisation (measured in episodes) decreased by 5.7%, driven by decreases in all hospital settings except in public hospitals. In the year ending March 2019, episodes in all hopsital settings increased except in public hospitals, where episodes decreased.
3,011,0973,334,769
Service utilisation
24,867,790
Change from December
2018
1,121,4382,932,1749,222,776
March 2019
Hospital utilisation is distributed over four categories of hospital—public, private, day only facilities and hospital-substitute. During the March 2019 quarter, hospital episodes were distributed as follows:
734,062130,986
82,42554,538
0
100
200
300
400
500
600
700
800
900
1000
Mar
-16
Jun-
16
Sep-
16
Dec
-16
Mar
-17
Jun-
17
Sep-
17
Dec
-17
Mar
-18
Jun-
18
Sep-
18
Dec
-18
Mar
-19
Acute episodes Acute days
Medical services Prostheses items
0
100
200
300
400
500
600
700
800
900
1000
Mar
-16
Jun-
16
Sep-
16
Dec
-16
Mar
-17
Jun-
17
Sep-
17
Dec
-17
Mar
-18
Jun-
18
Sep-
18
Dec
-18
Mar
-19
Dental Optical
Physiotherapy Chiropractic
Australian Prudential Regulation Authority 8
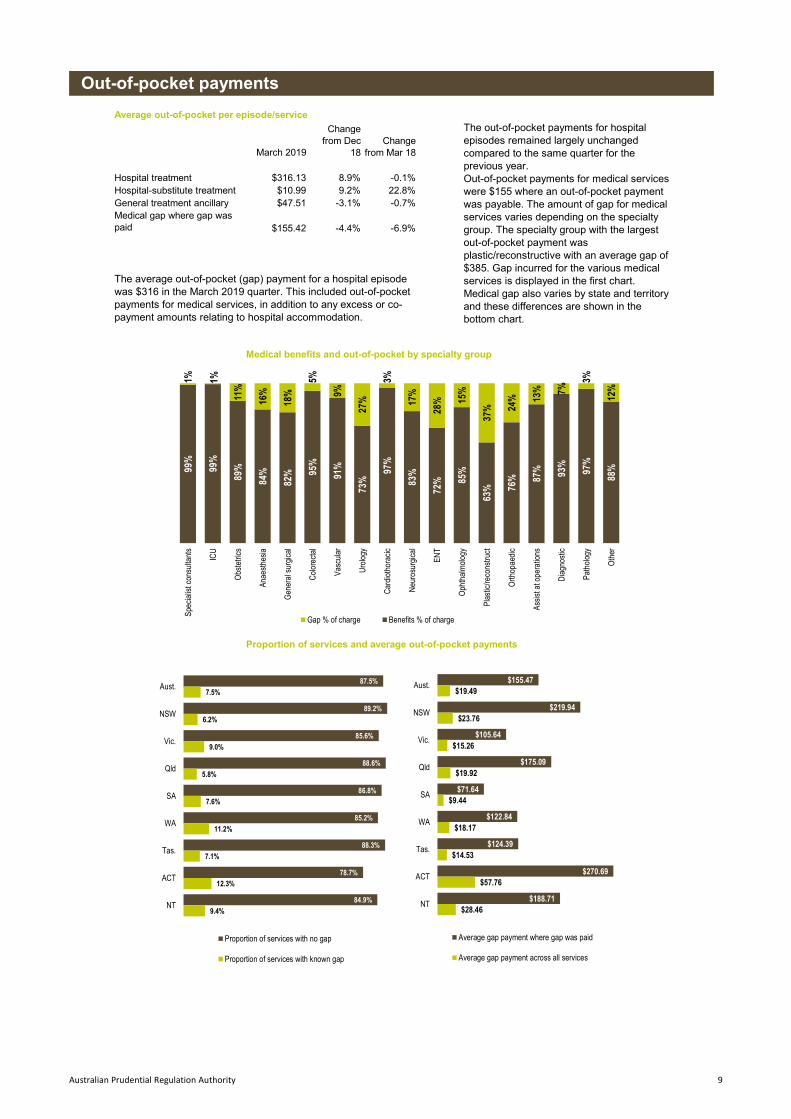
Average out-of-pocket per episode/service
Hospital treatment $316.13 8.9% -0.1%Hospital-substitute treatment $10.99 9.2% 22.8%General treatment ancillary $47.51 -3.1% -0.7%
$155.42 -4.4% -6.9%
Medical benefits and out-of-pocket by specialty group
Proportion of services and average out-of-pocket payments
The average out-of-pocket (gap) payment for a hospital episode was $316 in the March 2019 quarter. This included out-of-pocket payments for medical services, in addition to any excess or co-payment amounts relating to hospital accommodation.
The out-of-pocket payments for hospital episodes remained largely unchanged compared to the same quarter for the previous year.Out-of-pocket payments for medical services were $155 where an out-of-pocket payment was payable. The amount of gap for medical services varies depending on the specialty group. The specialty group with the largest out-of-pocket payment was plastic/reconstructive with an average gap of $385. Gap incurred for the various medical services is displayed in the first chart. Medical gap also varies by state and territory and these differences are shown in the bottom chart.
Out-of-pocket payments
Change from Dec
18Change
from Mar 18
Medical gap where gap was paid
March 2019
99%
99%
89%
84%
82% 95
%
91%
73%
97%
83%
72% 85
%
63% 76
% 87% 93
%
97%
88%
1% 1%
11%
16%
18%
5%
9%
27%
3%
17%
28% 15
%
37% 24
% 13% 7%
3%
12%
Spe
cial
ist c
onsu
ltant
s
ICU
Obs
tetri
cs
Ana
esth
esia
Gen
eral
sur
gica
l
Col
orec
tal
Vas
cula
r
Uro
logy
Car
diot
hora
cic
Neu
rosu
rgic
al
ENT
Oph
thal
mol
ogy
Plas
tic/re
cons
truct
Orth
opae
dic
Ass
ist a
t ope
ratio
ns
Dia
gnos
tic
Pat
holo
gy
Oth
erGap % of charge Benefits % of charge
87.5%
89.2%
85.6%
88.6%
86.8%
85.2%
88.3%
78.7%
84.9%
7.5%
6.2%
9.0%
5.8%
7.6%
11.2%
7.1%
12.3%
9.4%
Aust.
NSW
Vic.
Qld
SA
WA
Tas.
ACT
NT
Proportion of services with no gap
Proportion of services with known gap
$155.47
$219.94
$105.64
$175.09
$71.64
$122.84
$124.39
$270.69
$188.71
$19.49
$23.76
$15.26
$19.92
$9.44
$18.17
$14.53
$57.76
$28.46
Aust.
NSW
Vic.
Qld
SA
WA
Tas.
ACT
NT
Average gap payment where gap was paid
Average gap payment across all services
Australian Prudential Regulation Authority 9
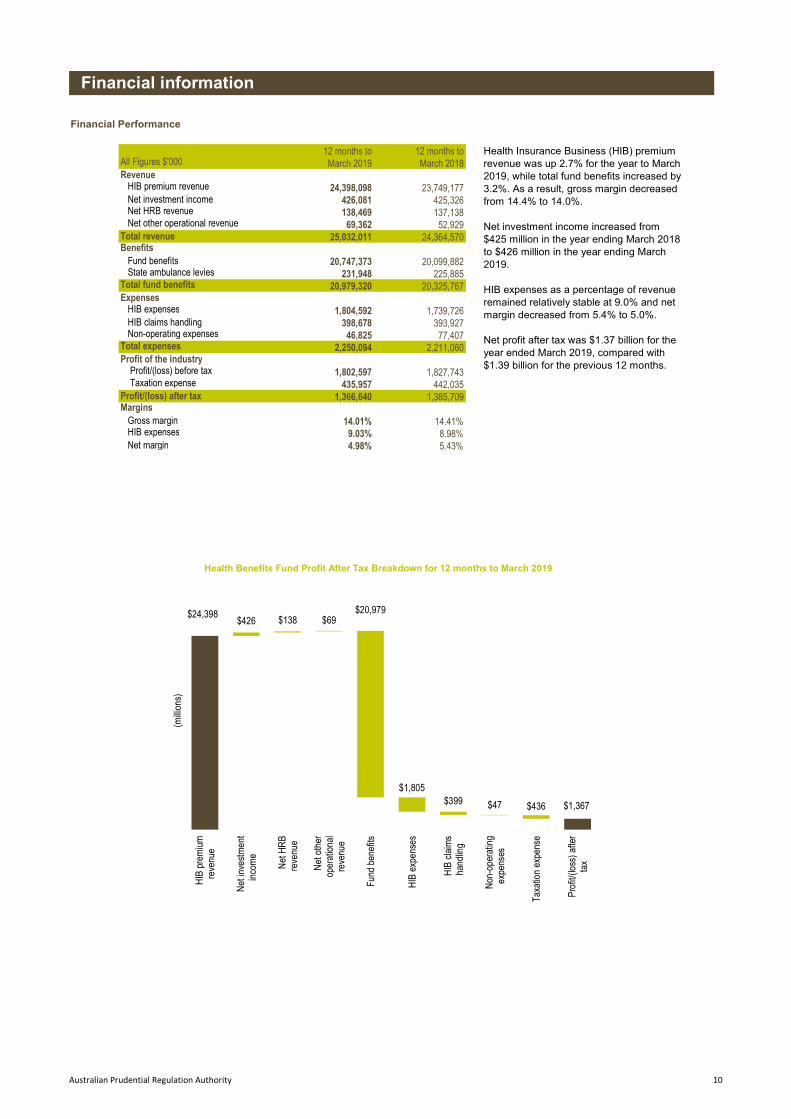
Financial Performance
All Figures $'000Revenue HIB premium revenue Net investment income Net HRB revenue Net other operational revenueTotal revenueBenefits Fund benefits State ambulance leviesTotal fund benefitsExpenses HIB expenses HIB claims handling Non-operating expensesTotal expenses
Profit/(loss) before tax Taxation expenseProfit/(loss) after taxMargins Gross margin HIB expenses Net margin
Health Benefits Fund Profit After Tax Breakdown for 12 months to March 2019
138,469 137,13869,362 52,929
2,250,094
Financial information
12 months toMarch 2019
24,398,098426,081
25,032,011
20,747,373231,948
20,099,882
20,979,320
1,804,592398,67846,825
4.98%
1,802,597435,957
1,366,640
393,927
12 months toMarch 2018
23,749,177425,326
24,364,570
Profit of the industry
Health Insurance Business (HIB) premium revenue was up 2.7% for the year to March 2019, while total fund benefits increased by 3.2%. As a result, gross margin decreased from 14.4% to 14.0%.
Net investment income increased from $425 million in the year ending March 2018 to $426 million in the year ending March 2019.
HIB expenses as a percentage of revenue remained relatively stable at 9.0% and net margin decreased from 5.4% to 5.0%. Net profit after tax was $1.37 billion for the year ended March 2019, compared with $1.39 billion for the previous 12 months.
14.01% 14.41%9.03% 8.98%
5.43%
77,4072,211,060
1,827,743442,035
1,385,709
225,88520,325,767
1,739,726
$24,398
$1,367
$426 $138 $69$20,979
$1,805$399 $47 $436
H
IB p
rem
ium
reve
nue
N
et in
vest
men
tin
com
e
N
et H
RB
reve
nue
N
et o
ther
oper
atio
nal
reve
nue
Fu
nd b
enef
its
H
IB e
xpen
ses
H
IB c
laim
sha
ndlin
g
N
on-o
pera
ting
expe
nses
Taxa
tion
expe
nse
Prof
it/(lo
ss) a
fter
tax
(milli
ons)
Australian Prudential Regulation Authority 10
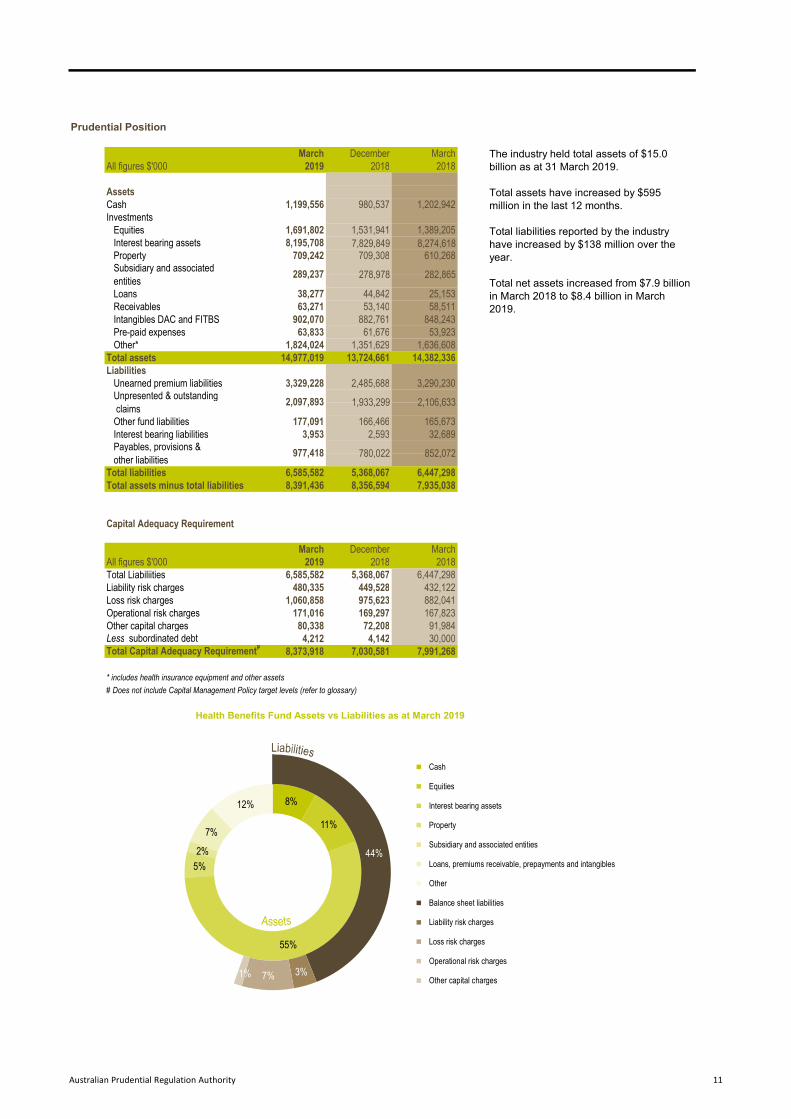
Prudential Position
March December MarchAll figures $'000 2019 2018 2018
AssetsCash 1,199,556 980,537 1,202,942Investments
1,691,802 1,531,941 1,389,2058,195,708 7,829,849 8,274,618
Property 709,242 709,308 610,268
Loans 38,277 44,842 25,153 Receivables 63,271 53,140 58,511 Intangibles DAC and FITBS 902,070 882,761 848,243 Pre-paid expenses 63,833 61,676 53,923 Other* 1,824,024 1,351,629 1,636,608Total assets 14,977,019 13,724,661 14,382,336Liabilities Unearned premium liabilities 3,329,228 2,485,688 3,290,230
Other fund liabilities 177,091 166,466 165,673 Interest bearing liabilities 3,953 2,593 32,689
Total liabilities 6,585,582 5,368,067 6,447,298Total assets minus total liabilities 8,391,436 8,356,594 7,935,038
Capital Adequacy Requirement
March December MarchAll figures $'000 2019 2018 2018Total Liabiliities 6,585,582 5,368,067 6,447,298Liability risk charges 480,335 449,528 432,122Loss risk charges 1,060,858 975,623 882,041Operational risk charges 171,016 169,297 167,823Other capital charges 80,338 72,208 91,984Less subordinated debt 4,212 4,142 30,000Total Capital Adequacy Requirement# 8,373,918 7,030,581 7,991,268
* includes health insurance equipment and other assets
# Does not include Capital Management Policy target levels (refer to glossary)
Health Benefits Fund Assets vs Liabilities as at March 2019
The industry held total assets of $15.0 billion as at 31 March 2019.
Total assets have increased by $595 million in the last 12 months.
Total liabilities reported by the industry have increased by $138 million over the year.
Total net assets increased from $7.9 billion in March 2018 to $8.4 billion in March 2019.
Subsidiary and associated entities
282,865
Unpresented & outstanding claims
2,097,893
Equities
278,978
1,933,299
780,022
289,237
2,106,633
Payables, provisions & other liabilities
977,418 852,072
Interest bearing assets
8%
11%
55%
5%
2%
7%
12%
44%
3%7%1%
Cash
Equities
Interest bearing assets
Property
Subsidiary and associated entities
Loans, premiums receivable, prepayments and intangibles
Other
Balance sheet liabilities
Liability risk charges
Loss risk charges
Operational risk charges
Other capital charges
Australian Prudential Regulation Authority 11

Source of data
On 1 July 2015, supervisory responsibilities were transferred from the Private Health Insurance Administration Council (PHIAC) to APRA under the Private Health Insurance (Prudential Supervision) Act 2015 .
This publication is compiled primarily from regulatory returns submitted to APRA under the Financial Sector (Collection of Data) Act 2001 by authorised Private Health Insurance companies. Prior to 1 July 2015, PHIAC collected data from Private Health Insurers.
The population figures used to calculate coverage are derived from:Australian Bureau of Statistics, Australian Demographic Statistics, ABS cat no. 3101.0, ABS, Canberra.
Notes on statistics
Net change by five year age group is the actual change adjusted for the number of people moving into the cohort and out of the cohort due to ageing. The calculation makes the simplifying assumption that the number of people are evenly distributed over each year within the five year age group.
Lifetime Health Cover is a financial loading (LHC loading) that can be payable in addition to the premium for your private health insurance hospital cover (hospital cover). LHC loadings apply only to hospital cover. The loading is 2% above the base rate for each year over the age of 30 in which the policy holder did not have private health insurance hospital cover. After ten years of paying the loading the loading is removed.
Starting from 1 April 2007, general treatment policies replaced ancillary policies. General treatment policies cover treatment similar to that previously known as ancillary (eg. dental) but can also cover hospital-substitute treatment and Chronic Disease Management Programs.
The Dec 2016 quarterly release of Australian Demographic Statistics contains the most recent estimates of the resident populations (ERP) of Australia and the states and territories based on the results of the 2016 Census of Population and Housing held on 9 August 2016. For more information refer to the publication at the ABS website.
Australian Prudential Regulation Authority 12
Quarterly publications
A number of related quarterly publicatons are available from:https://www.apra.gov.au/publications
These include:
Quarterly Statistics
Membership Statistics
Medical Gap Information
Private Health Insurance Membership and Benefits (formerly PHIAC A)
Prostheses Report
Medical Services Report
Statistical Trends - Quarterly Statistical trends in membership and benefits paid
Annual publications
https://www.apra.gov.au/publications/operations-private-health-insurers-annual-report
APRA will continue to produce an Annual Report on the Operations of the Private Health Insurance Industry. This report contains an industry overview and tables of statistics by individual fund. Current and historical versions are available at:
Related Publications
The Quarterly Statistics are principal release of statistics with summaries for the key financial and membership statistics of the Private Health Insurance industry.
A publication which details by State the number of insured persons for hospital treatment and general treatment and the proportion of the population these persons represent. The tables are shown on both a quarterly and an annual basis and include hospital treatment by age cohort.
A publication on in-hospital medical services. The proportion of services for which there was no gap or known gap and the average gap payment are shown for each state.
A publication detailing by State, the membership and benefits paid by private health insurers for the period. These State reports are available both in PDF format and Excel.
A report providing data on prosthetic benefits paid by private health insurers by major prosthetic category
A report providing data on services, benefits paid and gap payments by MBS Specialty Block Groupings for medical services paid by private health insurers.
These are two separate publications detailing trends since September 1997 in the number of insured persons and benefits paid for hospital and general treatment.
Australian Prudential Regulation Authority 13

AUSTRALIAN PRUDENTIAL REGULATION AUTHORITY 3