quarterly journal, vol. 21, no. 3, september 2002, second
TRANSCRIPT


Office of the Comptroller of the Currency September 2002
Comptroller . . . . . . . . . . . . . . . . . . . . . . . . . . . . . . . . . . . . . . . . . . . . . . . . . . . . . . . . . . . . . . . . . . . . . . . . . . . . . . . John D. Hawke, Jr.
Executive Committee First Senior Deputy Comptroller and Chief Counsel . . . . . . . . . . . . . . . . . . . . . . . . . . . . . . . . . . . . . . . . . . . . . . . Julie L. Williams
Chief of Staff. . . . . . . . . . . . . . . . . . . . . . . . . . . . . . . . . . . . . . . . . . . . . . . . . . . . . . . . . . . . . . . . . . . . . . . . . . . . . . Mark A. Nishan
Senior Deputy Comptroller and Chief National Bank Examiner . . . . . . . . . . . . . . . . . . . . . . . . . . . . . . . . . . . . . . Emory Wayne Rushton
Senior Deputy Comptroller for Large Bank Supervision . . . . . . . . . . . . . . . . . . . . . . . . . . . . . . . . . . . . . . . . . . . . Douglas W. Roeder
Senior Deputy Comptroller for Mid-Size/Community Bank Supervision . . . . . . . . . . . . . . . . . . . . . . . . . . . . . . . Timothy W. Long
Chief Information Officer . . . . . . . . . . . . . . . . . . . . . . . . . . . . . . . . . . . . . . . . . . . . . . . . . . . . . . . . . . . . . . . . . . . . Jackquelyn E. Fletcher
Senior Deputy Comptroller for International and Economic Affairs . . . . . . . . . . . . . . . . . . . . . . . . . . . . . . . . . . . Jonathan L. Fiechter
Senior Deputy Comptroller for Management and Chief Financial Officer . . . . . . . . . . . . . . . . . . . . . . . . . . . . . . Edward J. Hanley
Ombudsman . . . . . . . . . . . . . . . . . . . . . . . . . . . . . . . . . . . . . . . . . . . . . . . . . . . . . . . . . . . . . . . . . . . . . . . . . . . . . . Samuel P. Golden
Senior Deputy Comptroller for Public Affairs (Acting) . . . . . . . . . . . . . . . . . . . . . . . . . . . . . . . . . . . . . . . . . . . . . Mark A. Nishan
Background The Office of the Comptroller of the Currency (OCC) was established in 1863 as a bureau of the Department of the Treasury. The OCC is headed by the Comptroller, who is appointed by the President, with the advice and consent of the Senate, for a five-year term.
The OCC regulates national banks by its power to:
• Examine the banks;
• Approve or deny applications for new charters, branches, capital, or other changes in corporate or banking structure;
• Take supervisory actions against banks that do not conform to laws and regulations or that otherwise engage in unsound banking practices, including removal of officers, negotiation of agreements to change existing banking practices, and issuance of cease and desist orders; and
• Issue rules and regulations concerning banking practices and governing bank lending and investment practices and corporate structure.
The OCC divides the United States into six geographical districts, with each headed by a deputy comptroller.
The OCC is funded through assessments on the assets of national banks, and federal branches and agencies. Under the International Banking Act of 1978, the OCC regulates federal branches and agencies of foreign banks in the United States.
The Comptroller Comptroller John D. Hawke, Jr., has held office as the 28th Comptroller of the Currency since December 8, 1998, after being appointed by President Clinton during a congressional recess. He was confirmed subsequently by the U.S. Senate for a five-year term starting on October 13, 1999. Prior to his appointment Mr. Hawke served for 31/2 years as Under Secretary of the Treasury for Domestic Finance. He oversaw development of policy and legislation on financial institutions, debt management, and capital markets; served as chairman of the Advanced Counterfeit Deterrence Steering Committee; and was a member of the board of the Securities Investor Protection Corporation. Before joining Treasury, he was a senior partner at the
Washington, D.C., law firm of Arnold & Porter, which he joined as an associate in 1962. In 1975 he left to serve as general counsel to the Board of Governors of the Federal Reserve System, returning in 1978. At Arnold & Porter he headed the financial institutions practice. From 1987 to 1995 he was chairman of the firm.
Mr. Hawke has written extensively on the regulation of financial institutions, including Commentaries on Banking Regulation, published in 1985. From 1970 to 1987 he taught courses on federal regulation of banking at Georgetown University Law Center. He has also taught courses on bank acquisitions and serves as chairman of the Board of Advisors of the Morin Center for Banking Law Studies. In 1987 Mr. Hawke served on a committee of inquiry appointed by the Chicago Mercantile Exchange to study the role of futures markets in the October 1987 stock market crash. He was a founding member of the Shadow Financial Regulatory Committee and served on it until joining Treasury.
Mr. Hawke was graduated from Yale University in 1954 with a B.A. in English. From 1955 to 1957 he served on active duty with the U.S. Air Force. After graduating in 1960 from Columbia University School of Law, where he was editor-in-chief of the Columbia Law Review, Mr. Hawke clerked for Judge E. Barrett Prettyman on the U.S. Court of Appeals for the District of Columbia Circuit. From 1961 to 1962 he was counsel to the Select Subcommittee on Education, U.S. House of Representatives.
✸ ✸ ✸ ✸ ✸
The Quarterly Journal is the journal of record for the most significant actions and policies of the Office of the Comptroller of the Currency. It is published four times a year. The Quarterly Journal includes policy statements, decisions on banking structure, selected speeches and congressional testimony, material released in the interpretive letters series, statistical data, and other information of interest to the administration of national banks. Send suggestions or questions to Rebecca Miller, Senior Writer-Editor, Communications Division, Comptroller of the Currency, Washington, DC 20219. Subscriptions are available for $120 a year by writing to Comptroller of the Currency, Attn:Accounts Receivable, MS 4-8, 250 E St., SW, Washington, DC 20219. The Quarterly Journal is on the Web at http://www.occ.treas.gov/qj/qj.htm.

Quarterly Journal
Office of theComptroller of the Currency
John D. Hawke, Jr.
Comptroller of the Currency
The Administrator of National Banks
Volume 21, Number 3 September 2002

Contents
Page
Condition and Performance of Commercial Banks . . . . . . . . . . . . . . . . . . . . . . . . . . . . . . . . . . . . . . . . . . . . . . . . . . . . . 1
Recent Corporate Decisions . . . . . . . . . . . . . . . . . . . . . . . . . . . . . . . . . . . . . . . . . . . . . . . . . . . . . . . . . . . . . . . . . . . . . . . 19
Special Supervision/Fraud and Enforcement Activities . . . . . . . . . . . . . . . . . . . . . . . . . . . . . . . . . . . . . . . . . . . . . . . . . . 21
Appeals Process . . . . . . . . . . . . . . . . . . . . . . . . . . . . . . . . . . . . . . . . . . . . . . . . . . . . . . . . . . . . . . . . . . . . . . . . . . . . . . . . 25
Speeches and Congressional Testimony . . . . . . . . . . . . . . . . . . . . . . . . . . . . . . . . . . . . . . . . . . . . . . . . . . . . . . . . . . . . . . 27
Interpretations—April 1 to June 30, 2002 . . . . . . . . . . . . . . . . . . . . . . . . . . . . . . . . . . . . . . . . . . . . . . . . . . . . . . . . . . . . 49
Mergers—April 1 to June 30, 2002 . . . . . . . . . . . . . . . . . . . . . . . . . . . . . . . . . . . . . . . . . . . . . . . . . . . . . . . . . . . . . . . . . 77
Tables on the Corporate Structure of the National Banking System . . . . . . . . . . . . . . . . . . . . . . . . . . . . . . . . . . . . . . . . 83
Tables on the Financial Performance of National Banks . . . . . . . . . . . . . . . . . . . . . . . . . . . . . . . . . . . . . . . . . . . . . . . . . 99
Index . . . . . . . . . . . . . . . . . . . . . . . . . . . . . . . . . . . . . . . . . . . . . . . . . . . . . . . . . . . . . . . . . . . . . . . . . . . . . . . . . . . . . . . . . 115
Quarterly Journal, Vol. 21, No. 3, September 2002 iii

Condition and Performance of Commercial Banks
Summary
Bank income moved up strongly again during the second quarter, despite weakness in the macro economy, and the continued slide in equity markets. A strong housing market boosted lending and fee income, as low, short-term interest rates and wide spreads between short- and long-term rates kept up net interest income. Return on equity rose again, to an eight-year high. Loan volume rose modestly during the quarter, with nearly all the growth coming in real estate loans made at large banks.
Asset quality continued to decline, with most of the deterioration concentrated in the larger banks. For both small and large banks, commercial and industrial (C&I) loans experienced the greatest deterioration. Loan loss reserves grew year-over-year, but noncurrent loans grew faster, reducing the ratio of loan loss reserves to noncurrent loans.
Key Trends
During the second quarter, net income at national banks grew by 5 percent over the previous quarter and 29 percent year-over-year, as low, short-term interest rates and wide spreads between short- and long-term rates continued to be favorable for net interest income, which rose 14 percent year-over-year. Net interest margins finally fell after four consecutive quarterly increases. Return on equity rose to 15.9 percent, just shy of the all-time highs recorded in 1993 and 1994.
Loan volume rose 3 percent for the quarter, with nearly all of the growth coming in real estate loans made at large banks. Real estate has become increasingly important in loan portfolios, as the inset to Figure 1 indicates. Persistent strength in the housing sector, coupled with slow or no growth in other lending, has pushed real estate to 44 percent of the total loan book of national banks. This total would be even higher were it not for the recent growth in securitization, which has moved many mortgage loans off banks’ loan books.
Real estate lending has added to bank profits in several ways: lending, refinancing fees, and income from securitization. Over the last four quarters, securitization income at national banks increased by more than 30 percent, and the stock of securitized loans grew by 18 percent, three-quarters of which was for 1- to 4-family residential loans.
Figure 1—Real estate is increasingly important for national banks
Percent 25
.
Non-real estate loan growth
Real estate loan growth 20
30
40
50
84 85 87 89 91 93 95 97 99 01
Percent
Real estate share of total loans 20
15
10
5
0
-5
-10
85 86 87 88 89 90 91 92 93 94 95 96 97 98 99 00 01 02
Source: Integrated Banking Information System (OCC)
Table 1—Large national banks now outperform smaller ones
Average quarterly return on equity, national non-specialty banks (percent)
1984Q1–1996Q4
Banks under $1 billion 10.34 12.34
Banks over $1 billion 9.89 14.30
Difference 1.96
1997Q1–2002Q2
–0.45
Source: Integrated Banking Information System (OCC)
Large banks have benefited from their ability to control noninterest expenses. In 1991 for example, salaries represented about the same share of noninterest expense (30.6 percent) at small banks (under $1 billion in assets) as at large banks (over $1 billion in assets). Since then, large banks have been able to reduce this share to 24.2 percent, while small banks have seen it rise to 33.6 percent.
For the last few years, larger banks have had better efficiency ratios (noninterest expense to net operating revenues), and the pattern is becoming more pronounced. Moreover, this efficiency advantage is not limited to a few large banks, but is a general pattern. For example, in the second quarter of 2002, the fraction of banks with an efficiency ratio below 60 percent was 30 percent for banks with less than $100 million in assets, 45 percent for banks with assets between $100 million and $1 billion,
Quarterly Journal, Vol. 21, No. 3, September 2002 1

57 percent for banks with assets between $1 billion and $10 billion, and 77 percent for banks with more than $10 billion in assets.
Large banks have used this advantage in efficiency ratios to gain the edge in earnings. Table 1 shows that between 1984 and 1996, smaller banks (under $1 billion in assets) enjoyed an average return on equity (ROE) 45 points higher than their larger counterparts. Since then, however, while ROE has increased for both small and large banks, large banks have gained more than enough to move ahead of their smaller contemporaries.
Without the recent improvements in large banks’ noninterest expense ratios, return on equity would be much lower than it is today. Figure 2 shows return on equity at national banks, with recessions indicated by the gray bands. From 1998 to the present, the dotted line shows what return on equity would have been if the average ratio of noninterest expense to net operating revenue (the “efficiency ratio”) had remained at the 1984– 2002 average of 63 percent. In this case, ROE would have fallen steadily from 15.0 percent in 1997 to 9.3 in the second quarter of 2002, instead of rising to a near-record 15.9 percent.
Figure 2—Efficiency gains at large national banks contribute to strong return on equity
Percent 18
National bank ROE
ROE with efficiency ratio
at long-term average
16
14
12
10
8
6
4
2
0
-2
72 74 76 78 80 82 84 86 88 90 92 94 96 98 00 02*
ROE: return on equitySource: Integrated Banking Information System (OCC)
In the second quarter, loan loss reserves grew by 14 percent year-over-year, while noncurrent loans grew by 23 percent, reducing the ratio of loan loss reserves to noncurrent loans from 135 percent to 124 percent. Asset quality continued to decline, with most of the deterioration concentrated in the larger banks. The noncurrent loan ratio rose by 5 basis points for small banks, from 0.92 to 0.97, and by 29 basis points for large banks, from 1.38 to 1.67. For both small and large banks,
2 Quarterly Journal, Vol. 21, No. 3, September 2002
commercial and industrial (C&I) loans experienced the greatest deterioration: by 31 basis points for smaller banks, and by 97 basis points for larger banks.
Much of the deterioration in the C&I sector occurred in loans made to companies outside the United States. As the inset to Figure 3 indicates, foreign C&I loans now make up 19 percent of the C&I portfolios of national banks. In the second quarter of 2001, the noncurrent ratios were about equal for domestic and foreign C&I loans: 2.15 percent domestic, compared with 2.03 percent foreign. A year later, the noncurrent ratio had increased to 2.81 percent for domestic loans, but had more than doubled, to 4.19 percent, for foreign loans.
Figure 3—Noncurrent foreign commercial and industrial loans surge
Percent of loans noncurrent at national banksPercent of loans noncurrent at national banks
1999Q2 2000Q2 2001Q2 2002Q2
2002Q2 share of total non-US C&I lending
$107 billion (19%)
5
4
3
2
1
0
Foreign C&I US C&I C&I: commercial and industrial
Source: Integrated Banking Information System (OCC)
Although credit quality held up better at small banks than large banks, this aggregate number conceals important differences among the smaller banks. For example, in the second quarter, more than 8 percent of small banks, but only 2 percent of large banks, recorded noncurrent ratios above 3 percent, compared to the national average of about 1 percent. Similarly, about 15 percent of small banks, but only 7 percent of large banks, showed return on assets below 0.5 percent, compared to a national average of 1.5 percent.
Over the last decade, bank earnings have remained stable and high relative to the historical record, either measured as return on equity or return on assets. At the same time, credit quality, as measured by the nonperforming loan (NPL) ratio, has remained generally sound. Figure 4 shows that return on assets (ROA) rose in the early 1990s at the same time that the NPL ratio fell by two-thirds. Since then, ROA has remained high and relatively stable, while the NPL ratio has stayed low, turning up only during the last year or so. The question for the future is whether

Figure 4—Sustained high return on investment corresponds to long economic expansion and economic environment that may take time to recover from
the downturn of 2001.
banks can maintain this good earnings performance in an
stability of credit quality at national banks
Percent Percent
5 2 Several factors will make it difficult for banks to sustain their record performance in the second half of 2002.
3.75 1.5 Net interest margins turned down in the second quarter after four consecutive quarterly increases, and may not
2.5 1 move back to the record level of the first quarter of 2002. Neither consumers nor commercial customers are likely
1.25
Nonperforming loan ratio (left axis) Return on assets (right axis)
0.5 to add much to loan growth. If past recessions are a guide, credit quality will probably continue to deteriorate.
0 0 Finally, if the housing sector, which sustained the 84 86 88 90 92 94 96 98 00 02
economy during the recession, were to falter, banks would feel the effects in both interest and noninterest income.
Source: Integrated Banking Information System (OCC)
Quarterly Journal, Vol. 21, No. 3, September 2002 3

Key indicators, FDIC-insured national banks Annual 1998–2001, year-to-date through June 30, 2002, second quarter 2001, and second quarter 2002
(Dollar figures in millions)
Preliminary Preliminary 1998 2000 2001 2002YTD 2001Q1 2002Q1
Number of institutions reporting. . . . . . . . . . . . . . 2,456 2,364 2,230 2,137 2,104 2,176 2,104 Total employees (FTEs) . . . . . . . . . . . . . . . . . . . . 974,871 983,186 948,652 966,538 986,626 962,387 986,626
Selected income data ($) Net income . . . . . . . . . . . . . . . . . . . . . . . . . . . . . . $37,608 $42,591 $38,958 $44,339 $27,794 $10,995 $14,152 Net interest income . . . . . . . . . . . . . . . . . . . . . . . . 110,985 114,557 115,905 125,655 70,206 30,611 Provision for loan losses . . . . . . . . . . . . . . . . . . . . 15,242 15,550 20,559 28,999 16,088 6,250 7,662 Noninterest income . . . . . . . . . . . . . . . . . . . . . . . . 81,344 92,647 96,184 99,532 53,077 24,606 26,585 Noninterest expense . . . . . . . . . . . . . . . . . . . . . . . 122,604 125,807 128,535 131,145 66,159 32,223 33,105 Net operating income . . . . . . . . . . . . . . . . . . . . . . 35,549 42,416 40,209 43,112 27,126 10,770 13,646 Cash dividends declared . . . . . . . . . . . . . . . . . . . . 25,414 29,870 32,327 27,739 21,571 7,105 8,158 Net charge-offs to loan and lease reserve . . . . . . . 14,492 14,179 17,241 25,180 15,980 5,551 7,648
Selected condition data ($) Total assets . . . . . . . . . . . . . . . . . . . . . . . . . . . . . . 3,183,385 3,271,262 3,414,442 3,635,533 3,739,495 3,448,286 Total loans and leases . . . . . . . . . . . . . . . . . . . . . . 2,015,585 2,127,927 2,227,069 2,272,756 2,325,538 2,255,767 2,325,538 Reserve for losses . . . . . . . . . . . . . . . . . . . . . . . . . 36,810 37,684 40,021 45,575 47,357 41,368 47,357 Securities. . . . . . . . . . . . . . . . . . . . . . . . . . . . . . . . 516,120 537,315 502,297 576,011 616,249 486,424 616,249 Other real estate owned. . . . . . . . . . . . . . . . . . . . . 1,833 1,572 1,553 1,794 1,864 1,684 1,864 Noncurrent loans and leases . . . . . . . . . . . . . . . . . 19,513 20,818 27,161 34,577 37,834 30,858 37,834 Total deposits . . . . . . . . . . . . . . . . . . . . . . . . . . . . 2,137,946 2,154,272 2,250,464 2,384,462 2,410,803 2,285,648 Domestic deposits . . . . . . . . . . . . . . . . . . . . . . . . . 1,785,856 1,776,126 1,827,126 2,001,301 2,025,600 1,887,371 2,025,600 Equity capital . . . . . . . . . . . . . . . . . . . . . . . . . . . . 274,193 278,011 293,834 340,969 356,019 309,393 356,019 Off-balance-sheet derivatives . . . . . . . . . . . . . . . . 10,953,514 12,077,568 15,502,911 20,291,557 22,731,639 17,322,967 22,731,639
Performance ratios (annualized %) Return on equity . . . . . . . . . . . . . . . . . . . . . . . . . . 14.29 15.57 13.71 13.89 15.87 14.30 16.07 Return on assets . . . . . . . . . . . . . . . . . . . . . . . . . . 1.24 1.35 1.18 1.26 1.51 1.28 1.54 Net interest income to assets. . . . . . . . . . . . . . . . . 3.67 3.63 3.50 3.56 3.81 3.56 3.78 Loss provision to assets . . . . . . . . . . . . . . . . . . . . 0.50 0.49 0.62 0.82 0.87 0.73 0.83 Net operating income to assets . . . . . . . . . . . . . . . 1.18 1.35 1.21 1.22 1.47 1.25 1.48 Noninterest income to assets. . . . . . . . . . . . . . . . . 2.69 2.94 2.91 2.82 2.88 2.86 2.89 Noninterest expense to assets . . . . . . . . . . . . . . . . 4.05 3.99 3.88 3.72 3.59 3.75 3.59 Loss provision to loans and leases . . . . . . . . . . . . 0.79 0.76 0.95 1.28 1.39 1.11 1.32 Net charge-offs to loans and leases. . . . . . . . . . . . 0.75 0.70 0.80 1.11 1.38 0.99 1.32 Loss provision to net charge-offs . . . . . . . . . . . . . 105.12 109.66 119.24 115.16 100.67 112.58 100.18
Performance ratios (%) Percent of institutions unprofitable . . . . . . . . . . . . 5.94 7.06 6.95 7.30 6.70 7.44 6.70 Percent of institutions with earnings gains . . . . . . 61.60 62.14 66.64 56.86 67.87 50.14 68.77 Nonint. income to net operating revenue . . . . . . . 42.29 44.71 45.35 44.20 43.05 44.56 43.31 Nonint. expense to net operating revenue . . . . . . . 63.75 60.72 60.60 58.24 53.66 58.36 53.93
Condition ratios (%) Nonperforming assets to assets . . . . . . . . . . . . . . . 0.68 0.70 0.86 1.02 1.09 0.95 1.09 Noncurrent loans to loans . . . . . . . . . . . . . . . . . . . 0.97 0.98 1.22 1.52 1.63 1.37 1.63 Loss reserve to noncurrent loans. . . . . . . . . . . . . . 188.65 181.02 147.35 131.81 125.17 134.06 125.17 Loss reserve to loans . . . . . . . . . . . . . . . . . . . . . . . 1.83 1.77 1.80 2.01 2.04 1.83 2.04 Equity capital to assets . . . . . . . . . . . . . . . . . . . . . 8.61 8.50 8.61 9.38 9.52 8.97 9.52 Leverage ratio . . . . . . . . . . . . . . . . . . . . . . . . . . . . 7.43 7.49 7.49 7.82 8.04 7.67 8.04 Risk-based capital ratio. . . . . . . . . . . . . . . . . . . . . 11.79 11.71 11.84 12.62 12.81 12.32 12.81 Net loans and leases to assets . . . . . . . . . . . . . . . . 62.16 63.90 64.05 61.26 60.92 64.22 60.92 Securities to assets . . . . . . . . . . . . . . . . . . . . . . . . 16.21 16.43 14.71 15.84 16.48 14.11 16.48 Appreciation in securities (% of par) . . . . . . . . . . 0.82 –2.45 –0.01 0.48 1.39 0.42 1.39 Residential mortgage assets to assets . . . . . . . . . . 20.41 20.60 19.60 22.54 23.19 21.24 23.19 Total deposits to assets . . . . . . . . . . . . . . . . . . . . . 67.16 65.85 65.91 65.59 64.47 66.28 64.47 Core deposits to assets . . . . . . . . . . . . . . . . . . . . . 49.72 47.01 45.61 48.07 47.39 47.01 47.39 Volatile liabilities to assets . . . . . . . . . . . . . . . . . . 31.77 34.81 35.18 31.24 30.76 33.11 30.76
1999
3,739,495
2,410,803
4 Quarterly Journal, Vol. 21, No. 3, September 2002

Loan performance, FDIC-insured national banks Annual 1998–2001, year-to-date through June 30, 2002, second quarter 2001, and second quarter 2002
(Dollar figures in millions)
Preliminary Preliminary 1998 2000 2001 2002YTD 2001Q1 2002Q1
Percent of loans past due 30–89 days Total loans and leases . . . . . . . . . . . . . . . . . . . . . . . 1.27 1.16 1.26 1.38 1.20 1.22 1.20
Loans secured by real estate (RE). . . . . . . . . . . . 1.33 1.22 1.42 1.42 1.06 1.35 1.06 1–4 family residential mortgages . . . . . . . . . . 1.50 1.61 1.95 1.80 1.38 1.78 1.38 Home equity loans . . . . . . . . . . . . . . . . . . . . . 0.97 0.77 1.07 0.98 0.58 0.86 0.58 Multifamily residential mortgages . . . . . . . . . 0.94 0.69 0.59 0.75 0.43 0.53 0.43 Commercial RE loans . . . . . . . . . . . . . . . . . . . 1.02 0.70 0.72 0.86 0.61 0.72 0.61 Construction RE loans . . . . . . . . . . . . . . . . . . 1.82 1.07 1.12 1.28 1.28 1.25 1.28
Commercial and industrial loans . . . . . . . . . . . . 0.81 0.71 0.71 0.95 1.20 0.79 1.20 Loans to individuals . . . . . . . . . . . . . . . . . . . . . . 2.44 2.36 2.40 2.39 1.96 2.15 1.96
Credit cards . . . . . . . . . . . . . . . . . . . . . . . . . . . 2.52 2.53 2.50 2.51 2.37 2.54 2.37 Installment loans and other plans . . . . . . . . . . 2.37 2.24 2.31 2.65 1.88 2.06 1.88
All other loans and leases . . . . . . . . . . . . . . . . . . 0.46 0.50 0.58 0.84 0.63 0.60 0.63
Percent of loans noncurrent Total loans and leases . . . . . . . . . . . . . . . . . . . . . . . 0.97 0.98 1.22 1.52 1.63 1.37 1.63
Loans secured by real estate (RE). . . . . . . . . . . . 0.98 0.87 0.93 1.04 1.06 1.03 1.06 1–4 family residential mortgages . . . . . . . . . . 0.95 0.91 1.06 1.05 1.13 1.12 1.13 Home equity loans . . . . . . . . . . . . . . . . . . . . . 0.41 0.32 0.41 0.42 0.35 0.41 0.35 Multifamily residential mortgages . . . . . . . . . 0.88 0.43 0.55 0.49 0.45 0.47 0.45 Commercial RE loans . . . . . . . . . . . . . . . . . . . 1.01 0.84 0.77 1.03 1.08 0.95 1.08 Construction RE loans . . . . . . . . . . . . . . . . . . 0.80 0.63 0.82 1.15 1.17 0.94 1.17
Commercial and industrial loans . . . . . . . . . . . . 0.86 1.11 1.66 2.44 3.07 2.13 3.07 Loans to individuals . . . . . . . . . . . . . . . . . . . . . . 1.59 1.52 1.46 1.58 1.49 1.42 1.49
Credit cards . . . . . . . . . . . . . . . . . . . . . . . . . . . 2.06 2.00 1.89 2.05 1.95 1.99 1.95 Installment loans and other plans . . . . . . . . . . 1.19 1.16 1.06 1.41 1.28 1.10 1.28
All other loans and leases . . . . . . . . . . . . . . . . . . 0.31 0.40 0.85 1.18 1.04 0.76 1.04
Percent of loans charged-off, net Total loans and leases . . . . . . . . . . . . . . . . . . . . . . . 0.75 0.70 0.80 1.11 1.38 0.99 1.32
Loans secured by real estate (RE). . . . . . . . . . . . 0.05 0.10 0.12 0.26 0.19 0.17 0.17 1–4 family residential mortgages . . . . . . . . . . 0.07 0.14 0.14 0.32 0.18 0.21 0.17 Home equity loans . . . . . . . . . . . . . . . . . . . . . 0.16 0.19 0.23 0.35 0.25 0.18 0.25 Multifamily residential mortgages . . . . . . . . . 0.07 0.02 0.03 0.04 0.07 –0.07 0.11 Commercial RE loans . . . . . . . . . . . . . . . . . . . –0.02 0.03 0.07 0.18 0.17 0.12 0.13 Construction RE loans . . . . . . . . . . . . . . . . . . –0.01 0.03 0.05 0.15 0.16 0.08 0.14
Commercial and industrial loans . . . . . . . . . . . . 0.38 0.54 0.87 1.50 1.78 1.33 1.99 Loans to individuals . . . . . . . . . . . . . . . . . . . . . . 2.92 2.65 2.84 3.14 4.32 2.97 3.61
Credit cards . . . . . . . . . . . . . . . . . . . . . . . . . . . 5.03 4.51 4.43 5.07 7.52 5.15 6.00 Installment loans and other plans . . . . . . . . . . 1.23 1.27 1.54 1.66 1.79 1.37 1.66
All other loans and leases . . . . . . . . . . . . . . . . . . 0.79 0.47 0.48 0.90 0.58 0.36 0.67
Loans outstanding ($) Total loans and leases . . . . . . . . . . . . . . . . . . . . . . . $2,015,585 $2,127,927 $2,227,069 $2,272,756 $2,325,538 $2,255,767
Loans secured by real estate (RE). . . . . . . . . . . . 764,944 853,141 892,140 976,120 1,025,099 935,835 1,025,099 1–4 family residential mortgages . . . . . . . . . . 381,597 433,807 443,002 472,715 483,346 467,577 483,346 Home equity loans . . . . . . . . . . . . . . . . . . . . . 66,091 67,267 82,672 102,094 125,762 88,452 125,762 Multifamily residential mortgages . . . . . . . . . 23,201 26,561 28,026 30,074 33,296 27,724 33,296 Commercial RE loans . . . . . . . . . . . . . . . . . . . 200,469 214,145 221,267 236,472 246,947 225,491 246,947 Construction RE loans . . . . . . . . . . . . . . . . . . 56,261 71,578 76,899 91,482 92,532 86,727 92,532 Farmland loans . . . . . . . . . . . . . . . . . . . . . . . . 10,930 11,957 12,350 12,615 12,891 12,686 12,891 RE loans from foreign offices . . . . . . . . . . . . . 26,396 27,825 27,923 30,668 30,324 27,179 30,324
Commercial and industrial loans . . . . . . . . . . . . 583,903 622,004 646,988 597,228 568,970 631,757 568,970 Loans to individuals . . . . . . . . . . . . . . . . . . . . . . 386,410 348,634 370,363 390,338 423,838 375,796 423,838
Credit cards* . . . . . . . . . . . . . . . . . . . . . . . . . . 176,408 147,179 176,372 166,998 191,196 162,306 191,196 Other revolving credit plans . . . . . . . . . . . . . . NA NA NA 29,259 31,590 21,033 31,590 Installment loans . . . . . . . . . . . . . . . . . . . . . . . 210,003 201,455 193,991 194,082 201,053 192,456 201,053
All other loans and leases . . . . . . . . . . . . . . . . . . 282,367 306,041 319,144 311,001 310,455 313,862 310,455 Less: Unearned income. . . . . . . . . . . . . . . . . . . . 2,039 1,893 1,565 1,931 2,824 1,483 2,824
1999
$2,325,538
*Prior to March 2001, credit cards included “Other revolving credit plans.”
Quarterly Journal, Vol. 21, No. 3, September 2002 5
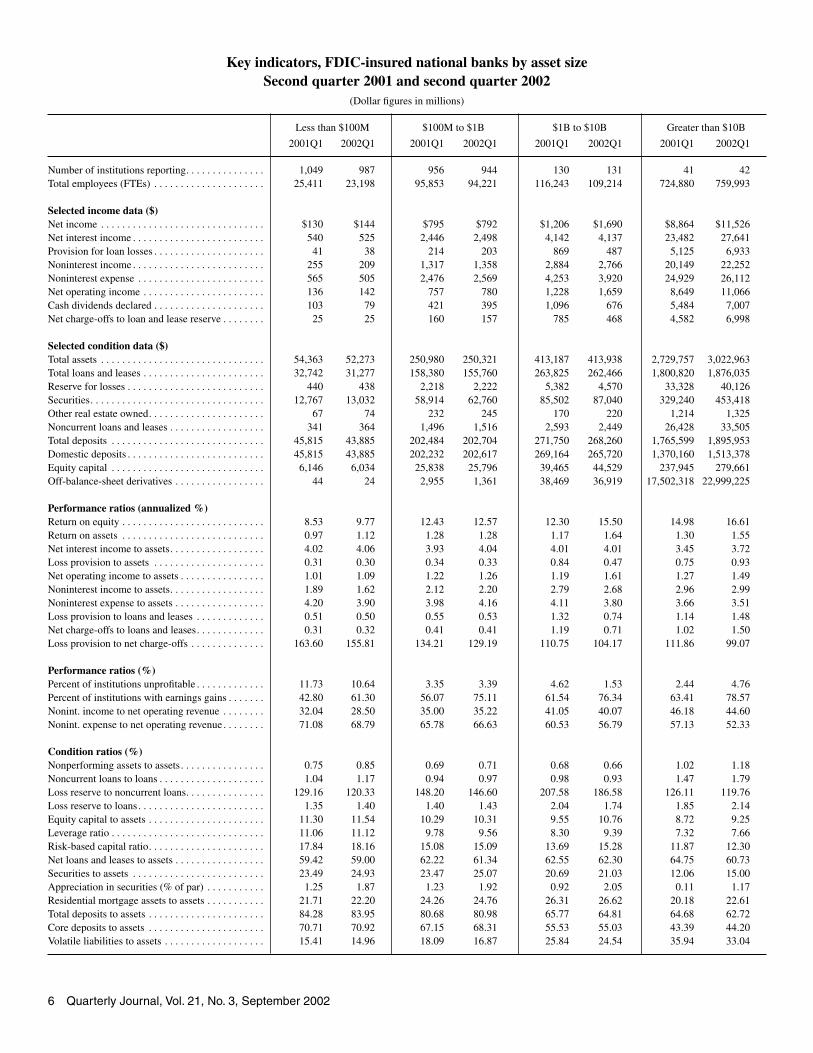
Key indicators, FDIC-insured national banks by asset sizeSecond quarter 2001 and second quarter 2002
(Dollar figures in millions)
Less than $100M $100M to $1B $1B to $10B Greater than $10B
2001Q1 2002Q1 2001Q1 2001Q1 2001Q1 2002Q1
Number of institutions reporting. . . . . . . . . . . . . . . 1,049 987 956 944 130 131 41 42 Total employees (FTEs) . . . . . . . . . . . . . . . . . . . . . 25,411 23,198 95,853 94,221 116,243 109,214 724,880 759,993
Selected income data ($) Net income . . . . . . . . . . . . . . . . . . . . . . . . . . . . . . . $130 $144 $795 $792 $1,206 $1,690 $8,864 $11,526 Net interest income . . . . . . . . . . . . . . . . . . . . . . . . . 540 525 2,446 2,498 4,142 4,137 23,482 27,641 Provision for loan losses . . . . . . . . . . . . . . . . . . . . . 41 38 214 203 869 487 5,125 6,933 Noninterest income . . . . . . . . . . . . . . . . . . . . . . . . . 255 209 1,317 1,358 2,884 2,766 20,149 22,252 Noninterest expense . . . . . . . . . . . . . . . . . . . . . . . . 565 505 2,476 2,569 4,253 3,920 24,929 26,112 Net operating income . . . . . . . . . . . . . . . . . . . . . . . 136 142 757 780 1,228 1,659 8,649 11,066 Cash dividends declared . . . . . . . . . . . . . . . . . . . . . 103 79 421 395 1,096 676 5,484 7,007 Net charge-offs to loan and lease reserve . . . . . . . . 25 25 160 157 785 468 4,582 6,998
Selected condition data ($) Total assets . . . . . . . . . . . . . . . . . . . . . . . . . . . . . . . 54,363 52,273 250,980 250,321 413,187 413,938 2,729,757 Total loans and leases . . . . . . . . . . . . . . . . . . . . . . . 32,742 31,277 158,380 155,760 263,825 262,466 1,800,820 1,876,035 Reserve for losses . . . . . . . . . . . . . . . . . . . . . . . . . . 440 438 2,218 2,222 5,382 4,570 33,328 40,126 Securities. . . . . . . . . . . . . . . . . . . . . . . . . . . . . . . . . 12,767 13,032 58,914 62,760 85,502 87,040 329,240 453,418 Other real estate owned. . . . . . . . . . . . . . . . . . . . . . 67 74 232 245 170 220 1,214 1,325 Noncurrent loans and leases . . . . . . . . . . . . . . . . . . 341 364 1,496 1,516 2,593 2,449 26,428 33,505 Total deposits . . . . . . . . . . . . . . . . . . . . . . . . . . . . . 45,815 43,885 202,484 202,704 271,750 268,260 1,765,599 Domestic deposits . . . . . . . . . . . . . . . . . . . . . . . . . . 45,815 43,885 202,232 202,617 269,164 265,720 1,370,160 1,513,378 Equity capital . . . . . . . . . . . . . . . . . . . . . . . . . . . . . 6,146 6,034 25,838 25,796 39,465 44,529 237,945 279,661 Off-balance-sheet derivatives . . . . . . . . . . . . . . . . . 44 24 2,955 1,361 38,469 36,919 17,502,318 22,999,225
Performance ratios (annualized %) Return on equity . . . . . . . . . . . . . . . . . . . . . . . . . . . 8.53 9.77 12.43 12.57 12.30 15.50 14.98 16.61 Return on assets . . . . . . . . . . . . . . . . . . . . . . . . . . . 0.97 1.12 1.28 1.28 1.17 1.64 1.30 1.55 Net interest income to assets. . . . . . . . . . . . . . . . . . 4.02 4.06 3.93 4.04 4.01 4.01 3.45 3.72 Loss provision to assets . . . . . . . . . . . . . . . . . . . . . 0.31 0.30 0.34 0.33 0.84 0.47 0.75 0.93 Net operating income to assets . . . . . . . . . . . . . . . . 1.01 1.09 1.22 1.26 1.19 1.61 1.27 1.49 Noninterest income to assets. . . . . . . . . . . . . . . . . . 1.89 1.62 2.12 2.20 2.79 2.68 2.96 2.99 Noninterest expense to assets . . . . . . . . . . . . . . . . . 4.20 3.90 3.98 4.16 4.11 3.80 3.66 3.51 Loss provision to loans and leases . . . . . . . . . . . . . 0.51 0.50 0.55 0.53 1.32 0.74 1.14 1.48 Net charge-offs to loans and leases. . . . . . . . . . . . . 0.31 0.32 0.41 0.41 1.19 0.71 1.02 1.50 Loss provision to net charge-offs . . . . . . . . . . . . . . 163.60 155.81 134.21 129.19 110.75 104.17 111.86 99.07
Performance ratios (%) Percent of institutions unprofitable . . . . . . . . . . . . . 11.73 10.64 3.35 3.39 4.62 1.53 2.44 4.76 Percent of institutions with earnings gains . . . . . . . 42.80 61.30 56.07 75.11 61.54 76.34 63.41 78.57 Nonint. income to net operating revenue . . . . . . . . 32.04 28.50 35.00 35.22 41.05 40.07 46.18 44.60 Nonint. expense to net operating revenue . . . . . . . . 71.08 68.79 65.78 66.63 60.53 56.79 57.13 52.33
Condition ratios (%) Nonperforming assets to assets . . . . . . . . . . . . . . . . 0.75 0.85 0.69 0.71 0.68 0.66 1.02 1.18 Noncurrent loans to loans . . . . . . . . . . . . . . . . . . . . 1.04 1.17 0.94 0.97 0.98 0.93 1.47 1.79 Loss reserve to noncurrent loans. . . . . . . . . . . . . . . 129.16 120.33 148.20 146.60 207.58 186.58 126.11 119.76 Loss reserve to loans . . . . . . . . . . . . . . . . . . . . . . . . 1.35 1.40 1.40 1.43 2.04 1.74 1.85 2.14 Equity capital to assets . . . . . . . . . . . . . . . . . . . . . . 11.30 11.54 10.29 10.31 9.55 10.76 8.72 9.25 Leverage ratio . . . . . . . . . . . . . . . . . . . . . . . . . . . . . 11.06 11.12 9.78 9.56 8.30 9.39 7.32 7.66 Risk-based capital ratio. . . . . . . . . . . . . . . . . . . . . . 17.84 18.16 15.08 15.09 13.69 15.28 11.87 12.30 Net loans and leases to assets . . . . . . . . . . . . . . . . . 59.42 59.00 62.22 61.34 62.55 62.30 64.75 60.73 Securities to assets . . . . . . . . . . . . . . . . . . . . . . . . . 23.49 24.93 23.47 25.07 20.69 21.03 12.06 15.00 Appreciation in securities (% of par) . . . . . . . . . . . 1.25 1.87 1.23 1.92 0.92 2.05 0.11 1.17 Residential mortgage assets to assets . . . . . . . . . . . 21.71 22.20 24.26 24.76 26.31 26.62 20.18 22.61 Total deposits to assets . . . . . . . . . . . . . . . . . . . . . . 84.28 83.95 80.68 80.98 65.77 64.81 64.68 62.72 Core deposits to assets . . . . . . . . . . . . . . . . . . . . . . 70.71 70.92 67.15 68.31 55.53 55.03 43.39 44.20 Volatile liabilities to assets . . . . . . . . . . . . . . . . . . . 15.41 14.96 18.09 16.87 25.84 24.54 35.94 33.04
2002Q1 2002Q1
3,022,963
1,895,953
6 Quarterly Journal, Vol. 21, No. 3, September 2002

Loan performance, FDIC-insured national banks by asset sizeSecond quarter 2001 and second quarter 2002
(Dollar figures in millions)
Less than $100M $100M to $1B $1B to $10B Greater than $10B
2001Q1 2001Q1 2002Q1 2001Q1 2002Q1 2001Q1 2002Q1
Percent of loans past due 30–89 days Total loans and leases . . . . . . . . . . . . . . . . . . . . . . . 1.49 1.35 1.28 1.12 1.29 1.09 1.20 1.22
Loans secured by real estate (RE). . . . . . . . . . . . 1.33 1.13 1.01 0.87 0.92 0.84 1.48 1.12 1–4 family residential mortgages . . . . . . . . . . 1.60 1.42 1.26 1.14 0.85 0.98 2.00 1.47 Home equity loans . . . . . . . . . . . . . . . . . . . . . 0.81 0.53 0.68 0.46 0.84 0.54 0.87 0.59 Multifamily residential mortgages . . . . . . . . . 0.64 0.67 0.44 0.41 0.74 0.40 0.49 0.44 Commercial RE loans . . . . . . . . . . . . . . . . . . . 1.06 0.80 0.82 0.68 0.75 0.62 0.68 0.59 Construction RE loans . . . . . . . . . . . . . . . . . . 1.49 1.39 1.07 0.98 1.71 1.17 1.14 1.36
Commercial and industrial loans . . . . . . . . . . . . 1.83 1.72 1.47 1.45 1.53 1.35 0.68 1.17 Loans to individuals . . . . . . . . . . . . . . . . . . . . . . 2.20 2.24 2.44 2.12 2.11 1.72 2.14 1.98
Credit cards . . . . . . . . . . . . . . . . . . . . . . . . . . . 2.66 2.45 5.65 4.40 2.51 1.80 2.46 2.41 Installment loans and other plans . . . . . . . . . . 2.22 2.27 1.87 1.83 1.93 1.81 2.11 1.89
All other loans and leases . . . . . . . . . . . . . . . . . . 0.93 0.92 0.86 0.86 0.87 0.63 0.57 0.61
Percent of loans noncurrent Total loans and leases . . . . . . . . . . . . . . . . . . . . . . . 1.04 1.17 0.94 0.97 0.98 0.93 1.47 1.79
Loans secured by real estate (RE). . . . . . . . . . . . 0.87 1.02 0.81 0.81 0.73 0.76 1.13 1.14 1–4 family residential mortgages . . . . . . . . . . 0.75 0.87 0.70 0.70 0.63 0.71 1.27 1.26 Home equity loans . . . . . . . . . . . . . . . . . . . . . 0.34 0.32 0.36 0.27 0.40 0.38 0.41 0.35 Multifamily residential mortgages . . . . . . . . . 0.39 0.82 0.50 0.52 0.47 0.37 0.47 0.44 Commercial RE loans . . . . . . . . . . . . . . . . . . . 0.96 1.12 0.92 0.94 0.86 0.88 0.99 1.16 Construction RE loans . . . . . . . . . . . . . . . . . . 0.74 0.81 0.97 0.85 0.86 0.94 0.97 1.29
Commercial and industrial loans . . . . . . . . . . . . 1.74 1.89 1.37 1.57 1.44 1.39 2.24 3.34 Loans to individuals . . . . . . . . . . . . . . . . . . . . . . 0.75 0.76 1.02 0.90 1.32 1.10 1.48 1.58
Credit cards . . . . . . . . . . . . . . . . . . . . . . . . . . . 1.45 1.99 3.75 3.78 2.17 1.59 1.92 1.97 Installment loans and other plans . . . . . . . . . . 0.73 0.72 0.50 0.49 0.73 0.80 1.26 1.45
All other loans and leases . . . . . . . . . . . . . . . . . . 1.20 1.32 0.83 1.08 0.60 0.62 0.76 1.07
Percent of loans charged-off, net Total loans and leases . . . . . . . . . . . . . . . . . . . . . . . 0.31 0.32 0.41 0.41 1.19 0.71 1.02 1.50
Loans secured by real estate (RE). . . . . . . . . . . . 0.07 0.09 0.06 0.07 0.16 0.09 0.19 0.20 1–4 family residential mortgages . . . . . . . . . . 0.04 0.09 0.05 0.07 0.35 0.07 0.21 0.20 Home equity loans . . . . . . . . . . . . . . . . . . . . . 0.02 0.15 0.12 0.05 –0.57 0.16 0.27 0.27 Multifamily residential mortgages . . . . . . . . . 0.06 0.23 0.06 0.04 0.00 0.04 –0.12 0.13 Commercial RE loans . . . . . . . . . . . . . . . . . . . 0.14 0.11 0.05 0.07 0.07 0.11 0.15 0.16 Construction RE loans . . . . . . . . . . . . . . . . . . 0.05 0.11 0.08 0.06 0.11 0.07 0.07 0.18
Commercial and industrial loans . . . . . . . . . . . . 0.68 0.82 0.62 0.65 1.34 1.07 1.37 2.17 Loans to individuals . . . . . . . . . . . . . . . . . . . . . . 1.03 0.88 1.80 2.03 3.82 2.25 2.92 3.92
Credit cards . . . . . . . . . . . . . . . . . . . . . . . . . . . 6.24 4.76 7.47 10.85 7.05 3.83 4.72 6.22 Installment loans and other plans . . . . . . . . . . 0.82 0.71 0.70 0.76 1.29 1.03 1.47 1.86
All other loans and leases . . . . . . . . . . . . . . . . . . 0.17 0.15 0.34 0.35 0.35 0.33 0.36 0.71
Loans outstanding ($) Total loans and leases . . . . . . . . . . . . . . . . . . . . . . . $32,742 $31,277 $158,380 $155,760 $263,825 $262,466 $1,800,820
Loans secured by real estate (RE). . . . . . . . . . . . 18,986 18,505 98,991 101,504 137,118 140,417 680,740 764,673 1–4 family residential mortgages . . . . . . . . . . 8,554 8,040 41,115 38,855 62,312 62,598 355,597 373,853 Home equity loans . . . . . . . . . . . . . . . . . . . . . 488 498 4,178 4,741 8,952 9,989 74,834 110,535 Multifamily residential mortgages . . . . . . . . . 420 440 3,460 3,752 4,946 5,468 18,898 23,636 Commercial RE loans . . . . . . . . . . . . . . . . . . . 5,527 5,645 36,057 38,988 42,686 44,075 141,220 158,238 Construction RE loans . . . . . . . . . . . . . . . . . . 1,841 1,698 9,944 10,644 16,167 16,406 58,776 63,785 Farmland loans . . . . . . . . . . . . . . . . . . . . . . . . 2,157 2,184 4,234 4,522 1,897 1,759 4,398 4,426 RE loans from foreign offices . . . . . . . . . . . . . 0 0 3 1 160 123 27,016 30,200
Commercial and industrial loans . . . . . . . . . . . . 5,600 5,163 28,853 27,374 52,014 49,046 545,290 487,387 Loans to individuals . . . . . . . . . . . . . . . . . . . . . . 4,418 3,981 20,891 17,724 55,197 50,829 295,290 351,305
Credit cards* . . . . . . . . . . . . . . . . . . . . . . . . . . 177 167 3,402 2,282 23,786 21,930 134,942 166,817 Other revolving credit plans . . . . . . . . . . . . . . 73 70 427 348 1,776 2,347 18,757 28,825 Installment loans . . . . . . . . . . . . . . . . . . . . . . . 4,167 3,744 17,063 15,094 29,635 26,552 141,591 155,663
All other loans and leases . . . . . . . . . . . . . . . . . . 3,799 3,674 9,851 9,353 19,597 22,263 280,616 275,165 Less: Unearned income. . . . . . . . . . . . . . . . . . . . 61 45 205 194 101 89 1,115 2,496
2002Q1
$1,876,035
Quarterly Journal, Vol. 21, No. 3, September 2002 7

Key indicators, FDIC-insured national banks by regionSecond quarter 2002
(Dollar figures in millions)
All Northeast Central Midwest Southwest West institutions
Number of institutions reporting. . . . . . . . . . . . . . . 234 291 422 433 501 223 2,104 Total employees (FTEs) . . . . . . . . . . . . . . . . . . . . . 296,335 254,656 208,833 64,955 56,997 104,850 986,626
Selected income data ($) Net income . . . . . . . . . . . . . . . . . . . . . . . . . . . . . . . $3,912 $3,643 $3,155 $1,073 $560 $1,808 $14,152 Net interest income . . . . . . . . . . . . . . . . . . . . . . . . . 9,964 8,453 7,675 2,800 1,588 4,320 34,800 Provision for loan losses . . . . . . . . . . . . . . . . . . . . . 3,762 1,010 1,445 718 106 620 7,662 Noninterest income . . . . . . . . . . . . . . . . . . . . . . . . . 10,105 5,903 4,741 2,240 664 2,932 26,585 Noninterest expense . . . . . . . . . . . . . . . . . . . . . . . . 10,390 8,072 6,715 2,699 1,395 3,833 33,105 Net operating income . . . . . . . . . . . . . . . . . . . . . . . 3,901 3,505 2,851 1,066 534 1,790 13,646 Cash dividends declared . . . . . . . . . . . . . . . . . . . . . 1,087 2,230 2,832 429 319 1,260 8,158 Net charge-offs to loan and lease reserve . . . . . . . . 3,619 1,163 1,419 699 76 671 7,648
Selected condition data ($) Total assets . . . . . . . . . . . . . . . . . . . . . . . . . . . . . . . 1,013,578 1,036,730 923,699 227,423 159,037 379,028 3,739,495 Total loans and leases . . . . . . . . . . . . . . . . . . . . . . . 616,780 604,336 600,900 155,499 90,635 257,388 2,325,538 Reserve for losses . . . . . . . . . . . . . . . . . . . . . . . . . . 16,467 9,985 11,452 2,904 1,452 5,097 47,357 Securities. . . . . . . . . . . . . . . . . . . . . . . . . . . . . . . . . 162,388 171,170 172,062 29,832 41,564 39,232 616,249 Other real estate owned. . . . . . . . . . . . . . . . . . . . . . 265 638 550 104 129 178 1,864 Noncurrent loans and leases . . . . . . . . . . . . . . . . . . 14,296 8,250 9,856 1,792 940 2,700 37,834 Total deposits . . . . . . . . . . . . . . . . . . . . . . . . . . . . . 683,942 681,840 555,085 131,916 128,318 229,702 2,410,803 Domestic deposits . . . . . . . . . . . . . . . . . . . . . . . . . . 433,075 617,054 511,699 117,863 127,263 218,645 2,025,600 Equity capital . . . . . . . . . . . . . . . . . . . . . . . . . . . . . 97,185 99,199 77,847 23,887 16,065 41,837 356,019 Off-balance-sheet derivatives . . . . . . . . . . . . . . . . . 7,863,247 12,459,342 1,568,187 7,251 9,170 824,442 22,731,639
Performance ratios (annualized %) Return on equity . . . . . . . . . . . . . . . . . . . . . . . . . . . 16.22 14.82 16.38 18.34 14.26 17.48 16.07 Return on assets . . . . . . . . . . . . . . . . . . . . . . . . . . . 1.57 1.42 1.39 1.90 1.42 1.94 1.54 Net interest income to assets. . . . . . . . . . . . . . . . . . 4.00 3.31 3.38 4.96 4.01 4.62 3.78 Loss provision to assets . . . . . . . . . . . . . . . . . . . . . 1.51 0.39 0.64 1.27 0.27 0.66 0.83 Net operating income to assets . . . . . . . . . . . . . . . . 1.57 1.37 1.26 1.89 1.35 1.92 1.48 Noninterest income to assets. . . . . . . . . . . . . . . . . . 4.05 2.31 2.09 3.97 1.68 3.14 2.89 Noninterest expense to assets . . . . . . . . . . . . . . . . . 4.17 3.16 2.96 4.79 3.53 4.10 3.59 Loss provision to loans and leases . . . . . . . . . . . . . 2.44 0.67 0.96 1.87 0.47 0.98 1.32 Net charge-offs to loans and leases. . . . . . . . . . . . . 2.35 0.77 0.94 1.82 0.34 1.06 1.32 Loss provision to net charge-offs . . . . . . . . . . . . . . 103.96 86.82 101.86 102.71 138.86 92.36 100.18
Performance ratios (%) Percent of institutions unprofitable . . . . . . . . . . . . . 7.26 10.65 4.98 5.08 4.59 12.11 6.70 Percent of institutions with earnings gains . . . . . . . 72.22 70.79 70.62 65.13 68.46 66.82 68.77 Nonint. income to net operating revenue . . . . . . . . 50.35 41.12 38.18 44.44 29.50 40.43 43.31 Nonint. expense to net operating revenue . . . . . . . . 51.77 56.23 54.09 53.56 61.95 52.85 53.93
Condition ratios (%) Nonperforming assets to assets . . . . . . . . . . . . . . . . 1.50 0.86 1.15 0.84 0.67 0.77 1.09 Noncurrent loans to loans . . . . . . . . . . . . . . . . . . . . 2.32 1.37 1.64 1.15 1.04 1.05 1.63 Loss reserve to noncurrent loans. . . . . . . . . . . . . . . 115.18 121.02 116.20 162.05 154.45 188.81 125.17 Loss reserve to loans . . . . . . . . . . . . . . . . . . . . . . . . 2.67 1.65 1.91 1.87 1.60 1.98 2.04 Equity capital to assets . . . . . . . . . . . . . . . . . . . . . . 9.59 9.57 8.43 10.50 10.10 11.04 9.52 Leverage ratio . . . . . . . . . . . . . . . . . . . . . . . . . . . . . 8.30 7.62 7.42 9.38 8.51 8.94 8.04 Risk-based capital ratio. . . . . . . . . . . . . . . . . . . . . . 12.96 12.46 12.24 13.88 14.02 13.71 12.81 Net loans and leases to assets . . . . . . . . . . . . . . . . . 59.23 57.33 63.81 67.10 56.08 66.56 60.92 Securities to assets . . . . . . . . . . . . . . . . . . . . . . . . . 16.02 16.51 18.63 13.12 26.14 10.35 16.48 Appreciation in securities (% of par) . . . . . . . . . . . 1.01 1.18 1.37 2.39 2.12 2.40 1.39 Residential mortgage assets to assets . . . . . . . . . . . 14.05 28.72 26.48 21.55 27.36 23.77 23.19 Total deposits to assets . . . . . . . . . . . . . . . . . . . . . . 67.48 65.77 60.09 58.00 80.68 60.60 64.47 Core deposits to assets . . . . . . . . . . . . . . . . . . . . . . 35.05 53.30 49.32 47.17 67.48 51.17 47.39 Volatile liabilities to assets . . . . . . . . . . . . . . . . . . . 42.45 24.40 28.14 30.14 18.37 28.89 30.76
Southeast
8 Quarterly Journal, Vol. 21, No. 3, September 2002

Loan performance, FDIC-insured national banks by regionSecond quarter 2002
(Dollar figures in millions)
All Northeast Central Midwest Southwest West institutions
Percent of loans past due 30–89 days Total loans and leases . . . . . . . . . . . . . . . . . . . . . . . 1.33 0.90 1.37 1.50 1.11 1.06 1.20
Loans secured by real estate (RE). . . . . . . . . . . . 0.97 0.89 1.46 0.93 0.96 0.82 1.06 1–4 family residential mortgages . . . . . . . . . . 1.21 1.19 2.12 1.03 1.15 0.85 1.38 Home equity loans . . . . . . . . . . . . . . . . . . . . . 0.43 0.58 0.75 0.44 0.44 0.41 0.58 Multifamily residential mortgages . . . . . . . . . 0.27 0.40 0.55 0.27 0.65 0.28 0.43 Commercial RE loans . . . . . . . . . . . . . . . . . . . 0.43 0.50 0.90 0.80 0.66 0.39 0.61 Construction RE loans . . . . . . . . . . . . . . . . . . 0.46 0.71 1.43 1.25 1.33 2.53 1.28
Commercial and industrial loans . . . . . . . . . . . . 1.27 1.04 1.29 1.56 1.20 1.04 1.20 Loans to individuals . . . . . . . . . . . . . . . . . . . . . . 2.16 1.31 1.89 2.26 1.64 1.90 1.96
Credit cards . . . . . . . . . . . . . . . . . . . . . . . . . . . 2.50 2.40 1.95 2.50 0.90 2.00 2.37 Installment loans and other plans . . . . . . . . . . 2.33 1.37 2.04 1.71 1.76 2.02 1.88
All other loans and leases . . . . . . . . . . . . . . . . . . 0.61 0.33 0.80 1.06 0.83 0.58 0.63
Percent of loans noncurrent Total loans and leases . . . . . . . . . . . . . . . . . . . . . . . 2.32 1.37 1.64 1.15 1.04 1.05 1.63
Loans secured by real estate (RE). . . . . . . . . . . . 1.39 0.77 1.55 0.61 0.85 0.57 1.06 1–4 family residential mortgages . . . . . . . . . . 1.58 0.71 2.10 0.43 0.73 0.40 1.13 Home equity loans . . . . . . . . . . . . . . . . . . . . . 0.32 0.25 0.49 0.30 0.51 0.23 0.35 Multifamily residential mortgages . . . . . . . . . 0.34 0.48 0.49 0.28 0.67 0.33 0.45 Commercial RE loans . . . . . . . . . . . . . . . . . . . 0.78 1.02 1.54 1.04 0.93 0.67 1.08 Construction RE loans . . . . . . . . . . . . . . . . . . 0.99 1.18 1.21 0.61 0.91 1.48 1.17
Commercial and industrial loans . . . . . . . . . . . . 3.74 3.27 2.82 1.51 1.60 2.17 3.07 Loans to individuals . . . . . . . . . . . . . . . . . . . . . . 2.26 0.41 0.69 1.68 0.65 1.38 1.49
Credit cards . . . . . . . . . . . . . . . . . . . . . . . . . . . 2.08 1.57 1.40 1.96 0.60 1.75 1.95 Installment loans and other plans . . . . . . . . . . 3.60 0.42 0.61 0.96 0.69 0.58 1.28
All other loans and leases . . . . . . . . . . . . . . . . . . 1.35 0.86 0.90 0.97 1.25 0.77 1.04
Percent of loans charged-off, net Total loans and leases . . . . . . . . . . . . . . . . . . . . . . . 2.35 0.77 0.94 1.82 0.34 1.06 1.32
Loans secured by real estate (RE). . . . . . . . . . . . 0.12 0.11 0.37 0.04 0.09 0.04 0.17 1–4 family residential mortgages . . . . . . . . . . 0.11 0.13 0.38 0.01 0.08 0.04 0.17 Home equity loans . . . . . . . . . . . . . . . . . . . . . 0.04 0.19 0.48 0.00 0.16 0.09 0.25 Multifamily residential mortgages . . . . . . . . . 0.11 0.12 0.15 0.03 0.08 0.00 0.11 Commercial RE loans . . . . . . . . . . . . . . . . . . . 0.00 0.04 0.35 0.11 0.11 0.05 0.13 Construction RE loans . . . . . . . . . . . . . . . . . . 0.12 0.11 0.29 0.20 0.05 –0.08 0.14
Commercial and industrial loans . . . . . . . . . . . . 2.53 2.25 1.60 1.14 0.60 1.42 1.99 Loans to individuals . . . . . . . . . . . . . . . . . . . . . . 5.06 1.01 2.09 4.74 0.89 3.68 3.61
Credit cards . . . . . . . . . . . . . . . . . . . . . . . . . . . 6.31 9.23 5.87 6.38 2.27 4.68 6.00 Installment loans and other plans . . . . . . . . . . 3.06 0.93 1.43 0.41 0.86 1.34 1.66
All other loans and leases . . . . . . . . . . . . . . . . . . 1.06 0.23 0.74 0.21 0.28 0.44 0.67
Loans outstanding ($) Total loans and leases . . . . . . . . . . . . . . . . . . . . . . . $616,780 $604,336 $600,900 $155,499 $90,635 $257,388 $2,325,538
Loans secured by real estate (RE). . . . . . . . . . . . 166,972 321,564 287,270 62,094 50,263 136,935 1,025,099 1–4 family residential mortgages . . . . . . . . . . 69,817 169,497 125,615 35,379 18,969 64,069 483,346 Home equity loans . . . . . . . . . . . . . . . . . . . . . 22,522 35,734 44,801 4,125 1,340 17,240 125,762 Multifamily residential mortgages . . . . . . . . . 3,892 9,574 12,097 1,628 1,728 4,377 33,296 Commercial RE loans . . . . . . . . . . . . . . . . . . . 34,470 74,457 69,487 13,474 18,703 36,354 246,947 Construction RE loans . . . . . . . . . . . . . . . . . . 8,658 26,304 31,712 4,379 7,838 13,641 92,532 Farmland loans . . . . . . . . . . . . . . . . . . . . . . . . 479 2,821 3,543 3,108 1,685 1,254 12,891 RE loans from foreign offices . . . . . . . . . . . . . 27,133 3,176 14 0 0 1 30,324
Commercial and industrial loans . . . . . . . . . . . . 180,395 149,956 143,422 24,255 22,869 48,073 568,970 Loans to individuals . . . . . . . . . . . . . . . . . . . . . . 169,515 59,800 76,891 53,081 12,388 52,164 423,838
Credit cards . . . . . . . . . . . . . . . . . . . . . . . . . . . 102,850 558 11,739 39,038 282 36,728 191,196 Other revolving credit plans . . . . . . . . . . . . . . 19,585 2,878 5,012 853 659 2,602 31,590 Installment loans . . . . . . . . . . . . . . . . . . . . . . . 47,079 56,364 60,140 13,190 11,447 12,833 201,053
All other loans and leases . . . . . . . . . . . . . . . . . . 102,072 73,354 93,406 16,083 5,214 20,326 310,455 Less: Unearned income. . . . . . . . . . . . . . . . . . . . 2,174 338 88 14 99 111 2,824
Southeast
Quarterly Journal, Vol. 21, No. 3, September 2002 9

Key indicators, FDIC-insured commercial banks Annual 1998–2001, year-to-date through June 30, 2002, second quarter 2001, and second quarter 2002
(Dollar figures in millions)
Preliminary Preliminary 1998 2001 2002YTD 2002Q1
Number of institutions reporting. . . . . . . . . . . . . . 8,773 8,579 8,315 8,080 7,966 8,178 7,966 Total employees (FTEs) . . . . . . . . . . . . . . . . . . . . 1,626,978 1,657,602 1,670,861 1,705,135 1,738,770 1,690,443 1,738,770
Selected income data ($) Net income . . . . . . . . . . . . . . . . . . . . . . . . . . . . . . $61,784 $71,543 $71,002 $73,986 $45,305 $19,097 $23,440 Net interest income . . . . . . . . . . . . . . . . . . . . . . . . 182,752 192,141 203,960 215,182 117,624 53,202 58,843 Provision for loan losses . . . . . . . . . . . . . . . . . . . . 22,215 21,817 30,013 43,466 22,432 8,847 10,861 Noninterest income . . . . . . . . . . . . . . . . . . . . . . . . 123,688 144,450 153,453 157,134 84,184 39,050 42,541 Noninterest expense . . . . . . . . . . . . . . . . . . . . . . . 194,131 204,208 216,104 222,347 113,396 55,202 57,035 Net operating income . . . . . . . . . . . . . . . . . . . . . . 59,226 71,308 72,591 71,160 44,102 18,545 22,605 Cash dividends declared . . . . . . . . . . . . . . . . . . . . 41,004 51,936 53,854 54,169 33,901 12,519 14,169 Net charge-offs to loan and lease reserve . . . . . . . 20,740 20,367 24,787 36,552 21,636 7,934 10,561
Selected condition data ($) Total assets . . . . . . . . . . . . . . . . . . . . . . . . . . . . . . 5,442,531 5,735,160 6,244,610 6,569,074 6,749,662 6,360,020 Total loans and leases . . . . . . . . . . . . . . . . . . . . . . 3,238,287 3,491,659 3,819,516 3,895,580 3,971,537 3,859,003 3,971,537 Reserve for losses . . . . . . . . . . . . . . . . . . . . . . . . . 57,262 58,767 64,145 72,413 74,325 65,757 74,325 Securities. . . . . . . . . . . . . . . . . . . . . . . . . . . . . . . . 979,855 1,046,530 1,078,983 1,179,694 1,237,108 1,056,279 Other real estate owned. . . . . . . . . . . . . . . . . . . . . 3,150 2,796 2,912 3,568 3,874 3,204 3,874 Noncurrent loans and leases . . . . . . . . . . . . . . . . . 31,253 33,002 42,942 54,956 58,424 48,684 58,424 Total deposits . . . . . . . . . . . . . . . . . . . . . . . . . . . . 3,681,428 3,831,104 4,179,634 4,391,610 4,448,144 4,244,727 Domestic deposits . . . . . . . . . . . . . . . . . . . . . . . . . 3,109,395 3,175,515 3,472,967 3,762,105 3,807,239 3,562,316 3,807,239 Equity capital . . . . . . . . . . . . . . . . . . . . . . . . . . . . 462,142 479,731 530,721 597,137 623,994 557,102 623,994 Off-balance-sheet derivatives . . . . . . . . . . . . . . . . 33,007,227 34,819,179 40,571,148 45,057,985 50,073,941 47,772,886 50,073,941
Performance ratios (annualized %) Return on equity . . . . . . . . . . . . . . . . . . . . . . . . . . 13.93 15.31 14.02 13.05 14.85 13.83 15.24 Return on assets . . . . . . . . . . . . . . . . . . . . . . . . . . 1.19 1.31 1.19 1.15 1.37 1.21 1.41 Net interest income to assets. . . . . . . . . . . . . . . . . 3.51 3.51 3.41 3.35 3.55 3.36 3.54 Loss provision to assets . . . . . . . . . . . . . . . . . . . . 0.43 0.40 0.50 0.68 0.68 0.56 0.65 Net operating income to assets . . . . . . . . . . . . . . . 1.14 1.30 1.21 1.11 1.33 1.17 1.36 Noninterest income to assets. . . . . . . . . . . . . . . . . 2.37 2.64 2.57 2.44 2.54 2.46 2.56 Noninterest expense to assets . . . . . . . . . . . . . . . . 3.73 3.73 3.61 3.46 3.42 3.48 3.43 Loss provision to loans and leases . . . . . . . . . . . . 0.72 0.66 0.82 1.13 1.14 0.92 1.10 Net charge-offs to loans and leases. . . . . . . . . . . . 0.67 0.61 0.67 0.95 1.10 0.83 1.07 Loss provision to net charge-offs . . . . . . . . . . . . . 104.81 107.11 121.08 118.92 103.68 111.50 102.84
Performance ratios (%) Percent of institutions unprofitable . . . . . . . . . . . . 6.11 7.51 7.34 8.09 6.24 8.20 6.68 Percent of institutions with earnings gains . . . . . . 61.22 62.82 67.34 56.32 68.94 49.36 70.17 Nonint. income to net operating revenue . . . . . . . 40.36 42.92 42.93 42.20 41.71 42.33 41.96 Nonint. expense to net operating revenue . . . . . . . 63.35 60.67 60.46 59.72 56.19 59.84 56.26
Condition ratios (%) Nonperforming assets to assets . . . . . . . . . . . . . . . 0.65 0.63 0.74 0.92 0.96 0.82 0.96 Noncurrent loans to loans . . . . . . . . . . . . . . . . . . . 0.97 0.95 1.12 1.41 1.47 1.26 1.47 Loss reserve to noncurrent loans. . . . . . . . . . . . . . 183.22 178.07 149.38 131.77 127.22 135.07 127.22 Loss reserve to loans . . . . . . . . . . . . . . . . . . . . . . . 1.77 1.68 1.68 1.86 1.87 1.70 1.87 Equity capital to assets . . . . . . . . . . . . . . . . . . . . . 8.49 8.36 8.50 9.09 9.24 8.76 9.24 Leverage ratio . . . . . . . . . . . . . . . . . . . . . . . . . . . . 7.54 7.79 7.70 7.79 8.00 7.73 8.00 Risk-based capital ratio. . . . . . . . . . . . . . . . . . . . . 12.23 12.16 12.12 12.72 12.95 12.41 12.95 Net loans and leases to assets . . . . . . . . . . . . . . . . 58.45 59.86 60.14 58.20 57.74 59.64 57.74 Securities to assets . . . . . . . . . . . . . . . . . . . . . . . . 18.00 18.25 17.28 17.96 18.33 16.61 18.33 Appreciation in securities (% of par) . . . . . . . . . . 1.07 –2.31 0.20 0.82 1.65 0.68 1.65 Residential mortgage assets to assets . . . . . . . . . . 20.93 20.78 20.20 21.70 22.02 20.71 22.02 Total deposits to assets . . . . . . . . . . . . . . . . . . . . . 67.64 66.80 66.93 66.85 65.90 66.74 65.90 Core deposits to assets . . . . . . . . . . . . . . . . . . . . . 49.39 46.96 46.39 48.80 48.09 46.88 48.09 Volatile liabilities to assets . . . . . . . . . . . . . . . . . . 31.68 34.94 34.97 31.39 31.54 33.93 31.54
2000 1999 2001Q1
6,749,662
1,237,108
4,448,144
10 Quarterly Journal, Vol. 21, No. 3, September 2002

Loan performance, FDIC-insured commercial banks Annual 1998–2001, year-to-date through June 30, 2002, second quarter 2001, and second quarter 2002
(Dollar figures in millions)
Preliminary Preliminary 1998 1999 2002YTD 2001Q1 2002Q1
Percent of loans past due 30–89 days Total loans and leases . . . . . . . . . . . . . . . . . . . . . . . 1.26 1.14 1.26 1.37 1.17 1.21 1.17
Loans secured by real estate (RE). . . . . . . . . . . . 1.26 1.09 1.26 1.31 1.03 1.19 1.03 1–4 family residential mortgages . . . . . . . . . . 1.44 1.43 1.72 1.67 1.34 1.53 1.34 Home equity loans . . . . . . . . . . . . . . . . . . . . . 0.98 0.75 0.98 0.91 0.57 0.81 0.57 Multifamily residential mortgages . . . . . . . . . 0.86 0.57 0.55 0.69 0.43 0.53 0.43 Commercial RE loans . . . . . . . . . . . . . . . . . . . 0.99 0.69 0.74 0.90 0.72 0.77 0.72 Construction RE loans . . . . . . . . . . . . . . . . . . 1.50 0.98 1.06 1.21 1.03 1.14 1.03
Commercial and industrial loans . . . . . . . . . . . . 0.88 0.79 0.83 1.02 1.13 0.93 1.13 Loans to individuals . . . . . . . . . . . . . . . . . . . . . . 2.43 2.33 2.47 2.47 2.05 2.19 2.05
Credit cards . . . . . . . . . . . . . . . . . . . . . . . . . . . 2.58 2.59 2.66 2.69 2.55 2.61 2.55 Installment loans and other plans . . . . . . . . . . 2.33 2.18 2.34 2.56 1.92 2.08 1.92
All other loans and leases . . . . . . . . . . . . . . . . . . 0.51 0.54 0.65 0.84 0.62 0.65 0.62
Percent of loans noncurrent Total loans and leases . . . . . . . . . . . . . . . . . . . . . . . 0.97 0.95 1.12 1.41 1.47 1.26 1.47
Loans secured by real estate (RE). . . . . . . . . . . . 0.91 0.79 0.81 0.96 0.95 0.91 0.95 1–4 family residential mortgages . . . . . . . . . . 0.88 0.82 0.90 0.96 1.00 0.96 1.00 Home equity loans . . . . . . . . . . . . . . . . . . . . . 0.42 0.33 0.37 0.39 0.32 0.40 0.32 Multifamily residential mortgages . . . . . . . . . 0.83 0.41 0.44 0.43 0.38 0.42 0.38 Commercial RE loans . . . . . . . . . . . . . . . . . . . 0.95 0.77 0.72 0.96 0.97 0.87 0.97 Construction RE loans . . . . . . . . . . . . . . . . . . 0.81 0.67 0.76 1.06 1.08 0.90 1.08
Commercial and industrial loans . . . . . . . . . . . . 0.99 1.18 1.66 2.41 2.87 2.03 2.87 Loans to individuals . . . . . . . . . . . . . . . . . . . . . . 1.52 1.42 1.41 1.49 1.40 1.37 1.40
Credit cards . . . . . . . . . . . . . . . . . . . . . . . . . . . 2.22 2.05 2.01 2.12 2.02 2.07 2.02 Installment loans and other plans . . . . . . . . . . 1.06 1.04 0.98 1.22 1.13 1.03 1.13
All other loans and leases . . . . . . . . . . . . . . . . . . 0.34 0.39 0.69 0.96 0.89 0.76 0.89
Percent of loans charged-off, net Total loans and leases . . . . . . . . . . . . . . . . . . . . . . . 0.67 0.61 0.67 0.95 1.10 0.83 1.07
Loans secured by real estate (RE). . . . . . . . . . . . 0.05 0.08 0.09 0.19 0.15 0.13 0.14 1–4 family residential mortgages . . . . . . . . . . 0.07 0.11 0.11 0.22 0.14 0.16 0.15 Home equity loans . . . . . . . . . . . . . . . . . . . . . 0.14 0.15 0.18 0.27 0.20 0.16 0.20 Multifamily residential mortgages . . . . . . . . . 0.05 0.02 0.03 0.04 0.06 0.01 0.07 Commercial RE loans . . . . . . . . . . . . . . . . . . . 0.00 0.03 0.05 0.14 0.14 0.10 0.12 Construction RE loans . . . . . . . . . . . . . . . . . . 0.01 0.04 0.05 0.14 0.12 0.08 0.11
Commercial and industrial loans . . . . . . . . . . . . 0.42 0.58 0.81 1.43 1.60 1.20 1.76 Loans to individuals . . . . . . . . . . . . . . . . . . . . . . 2.69 2.32 2.43 2.72 3.49 2.56 3.05
Credit cards . . . . . . . . . . . . . . . . . . . . . . . . . . . 5.19 4.45 4.39 5.14 7.05 5.11 5.98 Installment loans and other plans . . . . . . . . . . 1.04 1.04 1.18 1.28 1.36 1.08 1.26
All other loans and leases . . . . . . . . . . . . . . . . . . 0.78 0.51 0.46 0.82 0.52 0.34 0.59
Loans outstanding ($) Total loans and leases . . . . . . . . . . . . . . . . . . . . . . . $3,238,287 $3,491,659 $3,819,516 $3,895,580 $3,971,537 $3,859,003
Loans secured by real estate (RE). . . . . . . . . . . . 1,345,589 1,510,342 1,673,325 1,802,309 1,886,961 1,736,990 1,886,961 1–4 family residential mortgages . . . . . . . . . . 668,706 737,110 790,030 811,982 824,572 808,330 824,572 Home equity loans . . . . . . . . . . . . . . . . . . . . . 96,647 102,339 127,694 154,303 188,315 135,476 188,315 Multifamily residential mortgages . . . . . . . . . 43,242 53,168 60,406 64,136 69,381 60,488 69,381 Commercial RE loans . . . . . . . . . . . . . . . . . . . 370,544 417,633 466,453 506,581 532,653 478,185 532,653 Construction RE loans . . . . . . . . . . . . . . . . . . 106,719 135,632 162,613 193,082 198,640 184,666 198,640 Farmland loans . . . . . . . . . . . . . . . . . . . . . . . . 29,096 31,902 34,096 35,530 36,989 35,140 36,989 RE loans from foreign offices . . . . . . . . . . . . . 30,635 32,558 32,033 36,695 36,411 34,705 36,411
Commercial and industrial loans . . . . . . . . . . . . 898,556 969,257 1,051,992 983,516 938,726 1,027,834 938,726 Loans to individuals . . . . . . . . . . . . . . . . . . . . . . 570,863 558,424 606,663 631,563 662,454 610,682 662,454
Credit cards* . . . . . . . . . . . . . . . . . . . . . . . . . . 228,781 212,051 249,372 232,818 250,395 226,296 250,395 Other revolving credit plans . . . . . . . . . . . . . . NA NA NA 34,327 36,822 25,679 36,822 Installment loans . . . . . . . . . . . . . . . . . . . . . . . 342,081 346,373 357,291 364,418 375,237 358,707 375,237 All other loans and leases . . . . . . . . . . . . . . . . 427,397 457,309 490,448 481,302 487,225 486,265 487,225
Less: Unearned income. . . . . . . . . . . . . . . . . . . . 4,117 3,673 2,912 3,110 3,830 2,768 3,830
2001 2000
$3,971,537
*Prior to March 2001, credit cards included Other revolving credit plans.
Quarterly Journal, Vol. 21, No. 3, September 2002 11

Key indicators, FDIC-insured commercial banks by asset sizeSecond quarter 2001 and second quarter 2002
(Dollar figures in millions)
Less than $100M $100M to $1B $1B to $10B Greater than $10B
2001Q1 2002Q1 2001Q1 2001Q1 2001Q1 2002Q1
Number of institutions reporting. . . . . . . . . . . . . . . 4,685 4,374 3,101 3,194 313 320 79 78 Total employees (FTEs) . . . . . . . . . . . . . . . . . . . . . 96,010 88,815 294,518 298,544 253,437 253,232 1,046,478 1,098,179
Selected income data ($) Net income . . . . . . . . . . . . . . . . . . . . . . . . . . . . . . . $537 $595 $2,421 $2,669 $2,864 $3,407 $13,276 $16,769 Net interest income . . . . . . . . . . . . . . . . . . . . . . . . . 2,203 2,190 7,776 8,431 8,778 9,029 34,444 39,194 Provision for loan losses . . . . . . . . . . . . . . . . . . . . . 161 160 647 730 1,590 1,180 6,450 8,791 Noninterest income . . . . . . . . . . . . . . . . . . . . . . . . . 610 620 3,073 3,111 5,330 5,356 30,037 33,454 Noninterest expense . . . . . . . . . . . . . . . . . . . . . . . . 1,953 1,897 6,887 7,150 8,312 8,188 38,051 39,801 Net operating income . . . . . . . . . . . . . . . . . . . . . . . 532 585 2,347 2,629 2,742 3,348 12,925 16,044 Cash dividends declared . . . . . . . . . . . . . . . . . . . . . 339 309 1,238 1,157 2,802 1,960 8,141 10,743 Net charge-offs to loan and lease reserve . . . . . . . . 92 106 477 525 1,362 1,141 6,003 8,788
Selected condition data ($) Total assets . . . . . . . . . . . . . . . . . . . . . . . . . . . . . . . 227,949 219,576 789,809 831,484 899,643 935,170 4,442,620 Total loans and leases . . . . . . . . . . . . . . . . . . . . . . . 141,372 136,003 516,396 542,724 574,496 579,407 2,626,738 2,713,404 Reserve for losses . . . . . . . . . . . . . . . . . . . . . . . . . . 1,974 1,953 7,338 7,894 10,820 10,463 45,625 54,016 Securities. . . . . . . . . . . . . . . . . . . . . . . . . . . . . . . . . 52,552 53,517 173,563 191,411 193,988 220,934 636,176 Other real estate owned. . . . . . . . . . . . . . . . . . . . . . 269 324 782 1,008 450 652 1,703 1,890 Noncurrent loans and leases . . . . . . . . . . . . . . . . . . 1,526 1,587 4,664 5,218 6,044 6,039 36,450 45,579 Total deposits . . . . . . . . . . . . . . . . . . . . . . . . . . . . . 192,498 185,233 644,366 677,652 624,200 638,576 2,783,663 Domestic deposits . . . . . . . . . . . . . . . . . . . . . . . . . . 192,497 185,233 642,640 676,317 610,955 627,811 2,116,223 2,317,878 Equity capital . . . . . . . . . . . . . . . . . . . . . . . . . . . . . 25,380 24,426 77,397 82,370 85,428 96,251 368,898 420,947 Off-balance-sheet derivatives . . . . . . . . . . . . . . . . . 103 61 6,479 4,781 71,781 82,083 48,134,526 50,490,897
Performance ratios (annualized %) Return on equity . . . . . . . . . . . . . . . . . . . . . . . . . . . 8.51 9.92 12.65 13.29 13.58 14.44 14.50 16.10 Return on assets . . . . . . . . . . . . . . . . . . . . . . . . . . . 0.95 1.09 1.24 1.30 1.28 1.47 1.20 1.43 Net interest income to assets. . . . . . . . . . . . . . . . . . 3.91 4.03 3.98 4.11 3.91 3.90 3.11 3.35 Loss provision to assets . . . . . . . . . . . . . . . . . . . . . 0.28 0.29 0.33 0.36 0.71 0.51 0.58 0.75 Net operating income to assets . . . . . . . . . . . . . . . . 0.94 1.08 1.20 1.28 1.22 1.45 1.17 1.37 Noninterest income to assets. . . . . . . . . . . . . . . . . . 1.08 1.14 1.57 1.52 2.38 2.31 2.71 2.86 Noninterest expense to assets . . . . . . . . . . . . . . . . . 3.47 3.49 3.52 3.49 3.71 3.53 3.43 3.40 Loss provision to loans and leases . . . . . . . . . . . . . 0.46 0.48 0.51 0.55 1.11 0.82 0.98 1.30 Net charge-offs to loans and leases. . . . . . . . . . . . . 0.27 0.32 0.37 0.39 0.95 0.79 0.91 1.30 Loss provision to net charge-offs . . . . . . . . . . . . . . 173.66 150.42 135.62 139.13 116.76 103.38 107.44 100.03
Performance ratios (%) Percent of institutions unprofitable . . . . . . . . . . . . . 11.91 9.85 3.22 2.76 3.51 3.44 2.53 2.56 Percent of institutions with earnings gains . . . . . . . 43.37 65.75 56.59 75.77 64.22 73.44 62.03 75.64 Nonint. income to net operating revenue . . . . . . . . 21.68 22.07 28.33 26.95 37.78 37.23 46.58 46.05 Nonint. expense to net operating revenue . . . . . . . . 69.43 67.52 63.47 61.94 58.92 56.92 59.01 54.79
Condition ratios (%) Nonperforming assets to assets . . . . . . . . . . . . . . . . 0.79 0.88 0.69 0.75 0.73 0.73 0.87 1.04 Noncurrent loans to loans . . . . . . . . . . . . . . . . . . . . 1.08 1.17 0.90 0.96 1.05 1.04 1.39 1.68 Loss reserve to noncurrent loans. . . . . . . . . . . . . . . 129.33 123.08 157.35 151.26 179.02 173.24 125.17 118.51 Loss reserve to loans . . . . . . . . . . . . . . . . . . . . . . . . 1.40 1.44 1.42 1.45 1.88 1.81 1.74 1.99 Equity capital to assets . . . . . . . . . . . . . . . . . . . . . . 11.13 11.12 9.80 9.91 9.50 10.29 8.30 8.84 Leverage ratio . . . . . . . . . . . . . . . . . . . . . . . . . . . . . 10.86 10.72 9.35 9.33 8.45 9.06 7.13 7.42 Risk-based capital ratio. . . . . . . . . . . . . . . . . . . . . . 17.13 16.99 14.19 14.24 13.17 14.37 11.80 12.33 Net loans and leases to assets . . . . . . . . . . . . . . . . . 61.15 61.05 64.45 64.32 62.66 60.84 58.10 55.83 Securities to assets . . . . . . . . . . . . . . . . . . . . . . . . . 23.05 24.37 21.98 23.02 21.56 23.63 14.32 16.19 Appreciation in securities (% of par) . . . . . . . . . . . 1.29 1.86 1.24 1.93 0.81 1.80 0.44 1.53 Residential mortgage assets to assets . . . . . . . . . . . 21.27 21.64 23.56 23.75 25.53 26.09 19.19 20.93 Total deposits to assets . . . . . . . . . . . . . . . . . . . . . . 84.45 84.36 81.59 81.50 69.38 68.28 62.66 61.86 Core deposits to assets . . . . . . . . . . . . . . . . . . . . . . 70.94 71.32 67.64 67.99 55.55 55.43 40.20 42.11 Volatile liabilities to assets . . . . . . . . . . . . . . . . . . . 15.18 14.79 18.13 17.54 26.86 25.65 39.13 35.91
2002Q1 2002Q1
4,763,431
771,246
2,946,683
12 Quarterly Journal, Vol. 21, No. 3, September 2002

Loan performance, FDIC-insured commercial banks by asset sizeSecond quarter 2001 and second quarter 2002
(Dollar figures in millions)
Less than $100M $100M to $1B $1B to $10B Greater than $10B
2001Q1 2001Q1 2002Q1 2001Q1 2002Q1 2001Q1 2002Q1
Percent of loans past due 30–89 days Total loans and leases . . . . . . . . . . . . . . . . . . . . . . . 1.60 1.48 1.29 1.14 1.26 1.14 1.16 1.17
Loans secured by real estate (RE). . . . . . . . . . . . 1.44 1.30 1.08 0.92 0.92 0.87 1.30 1.09 1–4 family residential mortgages . . . . . . . . . . 1.77 1.66 1.35 1.24 0.96 1.03 1.70 1.41 Home equity loans . . . . . . . . . . . . . . . . . . . . . 0.96 0.75 0.79 0.53 0.87 0.55 0.81 0.57 Multifamily residential mortgages . . . . . . . . . 0.58 0.66 0.61 0.45 0.75 0.46 0.43 0.40 Commercial RE loans . . . . . . . . . . . . . . . . . . . 1.22 0.96 0.86 0.73 0.72 0.77 0.71 0.66 Construction RE loans . . . . . . . . . . . . . . . . . . 1.37 1.38 1.20 0.91 1.32 0.94 1.02 1.10
Commercial and industrial loans . . . . . . . . . . . . 1.89 1.81 1.51 1.38 1.44 1.35 0.74 1.04 Loans to individuals . . . . . . . . . . . . . . . . . . . . . . 2.51 2.43 2.29 2.23 2.22 1.97 2.15 2.03
Credit cards . . . . . . . . . . . . . . . . . . . . . . . . . . . 2.69 2.36 5.25 5.32 2.71 2.46 2.48 2.49 Installment loans and other plans . . . . . . . . . . 2.55 2.48 1.95 1.92 2.01 1.81 2.09 1.90
All other loans and leases . . . . . . . . . . . . . . . . . . 0.95 0.97 0.90 0.97 0.93 0.69 0.60 0.57
Percent of loans noncurrent Total loans and leases . . . . . . . . . . . . . . . . . . . . . . . 1.08 1.17 0.90 0.96 1.05 1.04 1.39 1.68
Loans secured by real estate (RE). . . . . . . . . . . . 0.93 1.00 0.77 0.83 0.79 0.83 0.99 1.02 1–4 family residential mortgages . . . . . . . . . . 0.81 0.87 0.69 0.74 0.77 0.81 1.09 1.11 Home equity loans . . . . . . . . . . . . . . . . . . . . . 0.32 0.30 0.37 0.28 0.42 0.33 0.41 0.32 Multifamily residential mortgages . . . . . . . . . 0.58 0.65 0.44 0.48 0.45 0.28 0.39 0.38 Commercial RE loans . . . . . . . . . . . . . . . . . . . 1.04 1.11 0.80 0.91 0.83 0.86 0.91 1.05 Construction RE loans . . . . . . . . . . . . . . . . . . 0.89 0.98 0.92 0.99 0.91 1.12 0.88 1.11
Commercial and industrial loans . . . . . . . . . . . . 1.66 1.82 1.35 1.43 1.63 1.75 2.19 3.28 Loans to individuals . . . . . . . . . . . . . . . . . . . . . . 0.93 0.94 0.91 0.83 1.21 1.01 1.49 1.55
Credit cards . . . . . . . . . . . . . . . . . . . . . . . . . . . 2.06 1.43 3.26 3.07 2.20 1.74 2.00 2.03 Installment loans and other plans . . . . . . . . . . 0.91 0.94 0.60 0.58 0.64 0.65 1.23 1.35
All other loans and leases . . . . . . . . . . . . . . . . . . 1.11 1.31 1.00 1.26 0.89 0.82 0.71 0.85
Percent of loans charged-off, net Total loans and leases . . . . . . . . . . . . . . . . . . . . . . . 0.27 0.32 0.37 0.39 0.95 0.79 0.91 1.30
Loans secured by real estate (RE). . . . . . . . . . . . 0.05 0.09 0.06 0.08 0.12 0.13 0.16 0.17 1–4 family residential mortgages . . . . . . . . . . 0.05 0.09 0.07 0.08 0.21 0.09 0.17 0.18 Home equity loans . . . . . . . . . . . . . . . . . . . . . 0.10 0.05 0.09 0.04 –0.21 0.13 0.24 0.23 Multifamily residential mortgages . . . . . . . . . 0.01 0.06 0.04 0.02 0.05 0.10 –0.01 0.08 Commercial RE loans . . . . . . . . . . . . . . . . . . . 0.07 0.12 0.05 0.08 0.08 0.18 0.13 0.12 Construction RE loans . . . . . . . . . . . . . . . . . . 0.03 0.17 0.06 0.09 0.13 0.10 0.07 0.12
Commercial and industrial loans . . . . . . . . . . . . 0.59 0.80 0.72 0.78 1.24 1.38 1.27 1.98 Loans to individuals . . . . . . . . . . . . . . . . . . . . . . 0.83 0.88 1.56 1.79 3.27 2.48 2.60 3.37
Credit cards . . . . . . . . . . . . . . . . . . . . . . . . . . . 4.06 4.05 7.29 9.80 6.80 5.19 4.65 6.00 Installment loans and other plans . . . . . . . . . . 0.73 0.79 0.78 0.82 1.11 1.00 1.16 1.42
All other loans and leases . . . . . . . . . . . . . . . . . . 0.23 0.16 0.37 0.43 0.51 0.45 0.33 0.64
Loans outstanding ($) Total loans and leases . . . . . . . . . . . . . . . . . . . . . . . $141,372 $136,003 $516,396 $542,724 $574,496 $579,407 $2,626,738
Loans secured by real estate (RE). . . . . . . . . . . . 81,480 80,584 335,349 365,261 312,569 329,401 1,007,593 1,111,715 1–4 family residential mortgages . . . . . . . . . . 36,382 34,258 129,892 128,122 127,828 126,427 514,229 535,766 Home equity loans . . . . . . . . . . . . . . . . . . . . . 2,145 2,362 14,206 17,214 18,508 21,862 100,618 146,877 Multifamily residential mortgages . . . . . . . . . 1,797 1,857 11,233 12,965 12,631 14,795 34,827 39,764 Commercial RE loans . . . . . . . . . . . . . . . . . . . 23,114 24,322 126,200 145,503 107,758 119,154 221,113 243,674 Construction RE loans . . . . . . . . . . . . . . . . . . 7,659 7,393 39,906 45,849 41,251 42,493 95,851 102,905 Farmland loans . . . . . . . . . . . . . . . . . . . . . . . . 10,384 10,392 13,873 15,575 4,258 4,175 6,625 6,847 RE loans from foreign offices . . . . . . . . . . . . . 0 0 39 33 336 495 34,330 35,883
Commercial and industrial loans . . . . . . . . . . . . 24,650 23,112 93,739 94,850 126,089 115,850 783,355 704,915 Loans to individuals . . . . . . . . . . . . . . . . . . . . . . 18,317 16,344 60,323 55,076 101,145 96,107 430,897 494,926
Credit cards* . . . . . . . . . . . . . . . . . . . . . . . . . . 541 452 7,311 5,990 38,106 34,070 180,338 209,883 Other revolving credit plans . . . . . . . . . . . . . . 305 316 1,740 1,570 2,911 3,952 20,722 30,985 Installment loans . . . . . . . . . . . . . . . . . . . . . . . 17,470 15,577 51,272 47,517 60,127 58,085 229,837 254,058
All other loans and leases . . . . . . . . . . . . . . . . . . 17,107 16,093 27,641 28,123 35,284 38,553 406,233 404,457 Less: Unearned income. . . . . . . . . . . . . . . . . . . . 181 131 656 586 590 504 1,340 2,609
2002Q1
$2,713,404
Quarterly Journal, Vol. 21, No. 3, September 2002 13

Key indicators, FDIC-insured commercial banks by regionSecond quarter 2002
(Dollar figures in millions)
All Northeast Central Midwest Southwest West institutions
Number of institutions reporting. . . . . . . . . . . . . . . 634 1,371 1,708 2,074 1,315 864 7,966 Total employees (FTEs) . . . . . . . . . . . . . . . . . . . . . 540,694 460,906 330,785 117,303 106,777 182,305 1,738,770
Selected income data ($) Net income . . . . . . . . . . . . . . . . . . . . . . . . . . . . . . . $7,178 $5,845 $4,722 $1,573 $961 $3,161 $23,440 Net interest income . . . . . . . . . . . . . . . . . . . . . . . . . 17,528 14,311 11,648 4,314 2,847 8,196 58,843 Provision for loan losses . . . . . . . . . . . . . . . . . . . . . 4,961 1,713 1,831 878 214 1,264 10,861 Noninterest income . . . . . . . . . . . . . . . . . . . . . . . . . 18,284 9,514 6,635 2,586 1,056 4,465 42,541 Noninterest expense . . . . . . . . . . . . . . . . . . . . . . . . 20,557 13,716 10,036 3,759 2,411 6,556 57,035 Net operating income . . . . . . . . . . . . . . . . . . . . . . . 7,000 5,641 4,380 1,555 929 3,100 22,605 Cash dividends declared . . . . . . . . . . . . . . . . . . . . . 3,188 3,970 3,791 654 490 2,075 14,169 Net charge-offs to loan and lease reserve . . . . . . . . 4,840 1,743 1,720 844 146 1,268 10,561
Selected condition data ($) Total assets . . . . . . . . . . . . . . . . . . . . . . . . . . . . . . . 2,323,272 1,658,571 1,378,966 376,962 280,085 731,805 Total loans and leases . . . . . . . . . . . . . . . . . . . . . . . 1,157,081 1,024,151 896,653 257,281 163,856 472,514 3,971,537 Reserve for losses . . . . . . . . . . . . . . . . . . . . . . . . . . 26,074 16,148 15,725 4,551 2,470 9,358 74,325 Securities. . . . . . . . . . . . . . . . . . . . . . . . . . . . . . . . . 403,771 298,925 267,241 62,886 74,084 130,200 1,237,108 Other real estate owned. . . . . . . . . . . . . . . . . . . . . . 585 1,326 896 297 332 437 3,874 Noncurrent loans and leases . . . . . . . . . . . . . . . . . . 23,467 12,064 13,137 2,857 1,693 5,208 58,424 Total deposits . . . . . . . . . . . . . . . . . . . . . . . . . . . . . 1,457,075 1,126,081 882,048 253,485 227,897 501,558 4,448,144 Domestic deposits . . . . . . . . . . . . . . . . . . . . . . . . . . 985,303 1,046,172 822,084 239,432 226,825 487,423 3,807,239 Equity capital . . . . . . . . . . . . . . . . . . . . . . . . . . . . . 200,767 157,588 119,352 38,873 28,054 79,359 623,994 Off-balance-sheet derivatives . . . . . . . . . . . . . . . . . 34,956,564 12,571,429 1,662,807 9,326 9,936 863,880 50,073,941
Performance ratios (annualized %) Return on equity . . . . . . . . . . . . . . . . . . . . . . . . . . . 14.47 15.04 16.05 16.53 14.03 16.14 15.24 Return on assets . . . . . . . . . . . . . . . . . . . . . . . . . . . 1.26 1.43 1.39 1.68 1.38 1.75 1.41 Net interest income to assets. . . . . . . . . . . . . . . . . . 3.08 3.50 3.43 4.61 4.10 4.53 3.54 Loss provision to assets . . . . . . . . . . . . . . . . . . . . . 0.87 0.42 0.54 0.94 0.31 0.70 0.65 Net operating income to assets . . . . . . . . . . . . . . . . 1.23 1.38 1.29 1.66 1.34 1.71 1.36 Noninterest income to assets. . . . . . . . . . . . . . . . . . 3.22 2.32 1.95 2.77 1.52 2.47 2.56 Noninterest expense to assets . . . . . . . . . . . . . . . . . 3.62 3.35 2.96 4.02 3.47 3.62 3.43 Loss provision to loans and leases . . . . . . . . . . . . . 1.72 0.67 0.82 1.38 0.53 1.09 1.10 Net charge-offs to loans and leases. . . . . . . . . . . . . 1.68 0.69 0.77 1.33 0.36 1.09 1.07 Loss provision to net charge-offs . . . . . . . . . . . . . . 102.50 98.29 106.48 104.07 146.61 99.62 102.84
Performance ratios (%) Percent of institutions unprofitable . . . . . . . . . . . . . 9.78 9.26 4.98 4.97 4.94 10.42 6.68 Percent of institutions with earnings gains . . . . . . . 72.24 75.64 71.84 67.45 68.37 65.97 70.17 Nonint. income to net operating revenue . . . . . . . . 51.06 39.93 36.29 37.48 27.06 35.27 41.96 Nonint. expense to net operating revenue . . . . . . . . 57.40 57.57 54.89 54.47 61.79 51.78 56.26
Condition ratios (%) Nonperforming assets to assets . . . . . . . . . . . . . . . . 1.12 0.81 1.04 0.84 0.73 0.78 0.96 Noncurrent loans to loans . . . . . . . . . . . . . . . . . . . . 2.03 1.18 1.47 1.11 1.03 1.10 1.47 Loss reserve to noncurrent loans. . . . . . . . . . . . . . . 111.11 133.85 119.70 159.30 145.90 179.68 127.22 Loss reserve to loans . . . . . . . . . . . . . . . . . . . . . . . . 2.25 1.58 1.75 1.77 1.51 1.98 1.87 Equity capital to assets . . . . . . . . . . . . . . . . . . . . . . 8.64 9.50 8.66 10.31 10.02 10.84 9.24 Leverage ratio . . . . . . . . . . . . . . . . . . . . . . . . . . . . . 7.48 7.93 7.81 9.39 8.79 9.15 8.00 Risk-based capital ratio. . . . . . . . . . . . . . . . . . . . . . 12.98 12.48 12.42 13.90 14.37 14.02 12.95 Net loans and leases to assets . . . . . . . . . . . . . . . . . 48.68 60.78 63.88 67.04 57.62 63.29 57.74 Securities to assets . . . . . . . . . . . . . . . . . . . . . . . . . 17.38 18.02 19.38 16.68 26.45 17.79 18.33 Appreciation in securities (% of par) . . . . . . . . . . . 1.18 2.14 1.52 2.16 2.01 1.85 1.65 Residential mortgage assets to assets . . . . . . . . . . . 15.97 27.13 25.61 20.88 26.23 21.80 22.02 Total deposits to assets . . . . . . . . . . . . . . . . . . . . . . 62.72 67.89 63.96 67.24 81.37 68.54 65.90 Core deposits to assets . . . . . . . . . . . . . . . . . . . . . . 34.06 55.15 52.00 56.59 67.18 57.58 48.09 Volatile liabilities to assets . . . . . . . . . . . . . . . . . . . 44.90 23.43 27.19 23.72 19.21 24.40 31.54
Southeast
6,749,662
14 Quarterly Journal, Vol. 21, No. 3, September 2002

Loan performance, FDIC-insured commercial banks by regionSecond quarter 2002
(Dollar figures in millions)
All Northeast Central Midwest Southwest West institutions
Percent of loans past due 30–89 days Total loans and leases . . . . . . . . . . . . . . . . . . . . . . . 1.24 0.99 1.28 1.45 1.16 1.04 1.17
Loans secured by real estate (RE). . . . . . . . . . . . 1.07 0.91 1.30 0.98 0.99 0.78 1.03 1–4 family residential mortgages . . . . . . . . . . 1.26 1.26 1.83 1.13 1.25 0.91 1.34 Home equity loans . . . . . . . . . . . . . . . . . . . . . 0.46 0.54 0.68 0.57 0.48 0.52 0.57 Multifamily residential mortgages . . . . . . . . . 0.24 0.50 0.63 0.42 0.63 0.22 0.43 Commercial RE loans . . . . . . . . . . . . . . . . . . . 0.76 0.62 0.92 0.84 0.77 0.48 0.72 Construction RE loans . . . . . . . . . . . . . . . . . . 0.67 0.65 1.31 1.14 1.08 1.61 1.03
Commercial and industrial loans . . . . . . . . . . . . 1.03 1.01 1.26 1.55 1.27 1.18 1.13 Loans to individuals . . . . . . . . . . . . . . . . . . . . . . 2.24 1.85 1.81 2.45 1.81 1.79 2.05
Credit cards . . . . . . . . . . . . . . . . . . . . . . . . . . . 2.66 3.48 1.94 2.83 1.42 1.95 2.55 Installment loans and other plans . . . . . . . . . . 2.19 1.67 1.92 1.82 1.89 1.74 1.92
All other loans and leases . . . . . . . . . . . . . . . . . . 0.54 0.36 0.79 1.05 0.91 0.63 0.62
Percent of loans noncurrent Total loans and leases . . . . . . . . . . . . . . . . . . . . . . . 2.03 1.18 1.47 1.11 1.03 1.10 1.47
Loans secured by real estate (RE). . . . . . . . . . . . 1.09 0.76 1.32 0.73 0.88 0.64 0.95 1–4 family residential mortgages . . . . . . . . . . 1.10 0.76 1.70 0.55 0.79 0.42 1.00 Home equity loans . . . . . . . . . . . . . . . . . . . . . 0.27 0.26 0.43 0.32 0.43 0.27 0.32 Multifamily residential mortgages . . . . . . . . . 0.29 0.37 0.50 0.38 0.78 0.22 0.38 Commercial RE loans . . . . . . . . . . . . . . . . . . . 0.94 0.88 1.31 0.92 0.93 0.72 0.97 Construction RE loans . . . . . . . . . . . . . . . . . . 1.03 0.96 1.27 0.94 0.82 1.26 1.08
Commercial and industrial loans . . . . . . . . . . . . 3.83 2.63 2.47 1.46 1.50 2.27 2.87 Loans to individuals . . . . . . . . . . . . . . . . . . . . . . 2.05 0.76 0.66 1.61 0.69 1.21 1.40
Credit cards . . . . . . . . . . . . . . . . . . . . . . . . . . . 2.23 1.86 1.39 2.04 0.86 1.70 2.02 Installment loans and other plans . . . . . . . . . . 2.21 0.61 0.59 0.86 0.71 0.44 1.13
All other loans and leases . . . . . . . . . . . . . . . . . . 0.88 0.78 0.85 1.11 1.45 1.05 0.89
Percent of loans charged-off, net Total loans and leases . . . . . . . . . . . . . . . . . . . . . . . 1.68 0.69 0.77 1.33 0.36 1.09 1.07
Loans secured by real estate (RE). . . . . . . . . . . . 0.08 0.11 0.29 0.08 0.11 0.07 0.14 1–4 family residential mortgages . . . . . . . . . . 0.09 0.13 0.32 0.03 0.10 0.04 0.15 Home equity loans . . . . . . . . . . . . . . . . . . . . . 0.04 0.17 0.38 0.08 0.16 0.07 0.20 Multifamily residential mortgages . . . . . . . . . 0.10 0.08 0.10 –0.02 0.09 0.00 0.07 Commercial RE loans . . . . . . . . . . . . . . . . . . . –0.01 0.07 0.28 0.15 0.14 0.12 0.12 Construction RE loans . . . . . . . . . . . . . . . . . . 0.09 0.09 0.21 0.24 0.07 0.00 0.11
Commercial and industrial loans . . . . . . . . . . . . 2.15 1.85 1.33 0.93 0.65 1.98 1.76 Loans to individuals . . . . . . . . . . . . . . . . . . . . . . 4.01 1.43 1.76 4.50 0.91 3.40 3.05
Credit cards . . . . . . . . . . . . . . . . . . . . . . . . . . . 6.46 4.60 5.63 6.76 3.08 4.74 5.98 Installment loans and other plans . . . . . . . . . . 1.76 0.95 1.19 0.45 0.85 1.17 1.26
All other loans and leases . . . . . . . . . . . . . . . . . . 0.76 0.28 0.70 0.26 0.39 0.52 0.59
Loans outstanding ($) Total loans and leases . . . . . . . . . . . . . . . . . . . . . . . $1,157,081 $1,024,151 $896,653 $257,281 $163,856 $472,514 $3,971,537
Loans secured by real estate (RE). . . . . . . . . . . . 376,801 579,327 454,826 121,179 94,457 260,370 1,886,961 1–4 family residential mortgages . . . . . . . . . . 181,255 261,587 190,458 56,289 34,636 100,348 824,572 Home equity loans . . . . . . . . . . . . . . . . . . . . . 37,507 58,839 60,892 6,059 1,729 23,289 188,315 Multifamily residential mortgages . . . . . . . . . 15,615 17,235 19,102 3,441 2,866 11,121 69,381 Commercial RE loans . . . . . . . . . . . . . . . . . . . 87,322 160,990 125,576 33,100 36,398 89,267 532,653 Construction RE loans . . . . . . . . . . . . . . . . . . 20,990 70,397 49,658 10,781 14,673 32,140 198,640 Farmland loans . . . . . . . . . . . . . . . . . . . . . . . . 1,339 7,103 9,079 11,509 4,155 3,804 36,989 RE loans from foreign offices . . . . . . . . . . . . . 32,772 3,176 62 0 0 401 36,411
Commercial and industrial loans . . . . . . . . . . . . 316,986 226,968 218,730 42,474 37,551 96,017 938,726 Loans to individuals . . . . . . . . . . . . . . . . . . . . . . 266,371 122,883 102,159 63,575 22,032 85,434 662,454
Credit cards . . . . . . . . . . . . . . . . . . . . . . . . . . . 125,522 16,466 13,262 41,399 609 53,137 250,395 Other revolving credit plans . . . . . . . . . . . . . . 21,049 4,475 5,586 1,004 764 3,943 36,822 Installment loans . . . . . . . . . . . . . . . . . . . . . . . 119,801 101,942 83,310 21,172 20,659 28,354 375,237
All other loans and leases . . . . . . . . . . . . . . . . . . 199,343 95,568 121,113 30,094 9,986 31,121 487,225 Less: Unearned income. . . . . . . . . . . . . . . . . . . . 2,420 595 175 41 171 429 3,830
Southeast
Quarterly Journal, Vol. 21, No. 3, September 2002 15

Glossary
Data Sources
Data are from the Federal Financial Institutions Examination Council (FFIEC) Reports of Condition and Income (call reports) submitted by all FDIC-insured, national-chartered and state-chartered commercial banks and trust companies in the United States and its territories. Uninsured banks, savings banks, savings associations, and U.S. branches and agencies of foreign banks are excluded from these tables. All data are collected and presented based on the location of each reporting institution’s main office. Reported data may include assets and liabilities located outside of the reporting institution’s home state.
The data are stored on and retrieved from the OCC’s Integrated Banking Information System (IBIS), which is obtained from the FDIC’s Research Information System (RIS) database.
Computation Methodology
For performance ratios constructed by dividing an income statement (flow) item by a balance sheet (stock) item, the income item for the period was annualized (multiplied by the number of periods in a year) and divided by the average balance sheet item for the period (beginning-of-period amount plus end-of-period amount plus any interim periods, divided by the total number of periods). For “pooling-of-interest” mergers, prior period(s) balance sheet items of “acquired” institution(s) are included in balance sheet averages because the year-to-date income reported by the “acquirer” includes the year-to-date results of “acquired” institutions. No adjustments are made for “purchase accounting” mergers because the year-to-date income reported by the “acquirer” does not include the prior-to-merger results of “acquired” institutions.
Definitions
Commercial real estate loans—loans secured by nonfarm nonresidential properties.
Construction real estate loans—includes loans for all property types under construction, as well as loans for land acquisition and development.
Core deposits—the sum of transaction deposits plus savings deposits plus small time deposits (under $100,000).
IBIS—OCC’s Integrated Banking Information System.
Leverage ratio—Tier 1 capital divided by adjusted tangible total assets.
Loans to individuals—includes outstanding credit card balances and other secured and unsecured installment loans.
Net charge-offs to loan and lease reserve—total loans and leases charged off (removed from balance sheet because of uncollectibility), less amounts recovered on loans and leases previously charged off.
Net loans and leases to assets—total loans and leases net of the reserve for losses.
Net operating income—income excluding discretionary transactions such as gains (or losses) on the sale of investment securities and extraordinary items. Income taxes subtracted from operating income have been adjusted to exclude the portion applicable to securities gains (or losses).
Net operating revenue—the sum of net interest income plus noninterest income.
Noncurrent loans and leases—the sum of loans and leases 90 days or more past due plus loans and leases in nonaccrual status.
Nonperforming assets—the sum of noncurrent loans and leases plus noncurrent debt securities and other assets plus other real estate owned.
Number of institutions reporting—the number of institutions that actually filed a financial report.
Off-balance-sheet derivatives—the notional value of futures and forwards, swaps, and options contracts; beginning March 31, 1995, new reporting detail permits the exclusion of spot foreign exchange contracts. For March 31, 1984 through December 31, 1985, only foreign exchange futures and forwards contracts were reported; beginning March 31, 1986, interest rate swaps contracts were reported; beginning March 31, 1990, banks began to report interest rate and other futures and forwards contracts, foreign exchange and other swaps contracts, and all types of option contracts.
16 Quarterly Journal, Vol. 21, No. 3, September 2002

Other real estate owned—primarily foreclosed property. Direct and indirect investments in real estate ventures are excluded. The amount is reflected net of valuation allowances.
Percent of institutions unprofitable—the percent of institutions with negative net income for the respective period.
Percent of institutions with earnings gains—the percent of institutions that increased their net income (or decreased their losses) compared to the same period a year earlier.
Reserve for losses—the sum of the allowance for loan and lease losses plus the allocated transfer risk reserve.
Residential mortgage assets—the sum of 1 4 family residential mortgages plus mortgage-backed securities.
Return on assets (ROA)—net income (including gains or losses on securities and extraordinary items) as a percentage of average total assets.
Return on equity (ROE)—net income (including gains or losses on securities and extraordinary items) as a percentage of average total equity capital.
Risk-based capital ratio—total capital divided by risk weighted assets.
Risk-weighted assets—assets adjusted for risk-based capital definitions which include on-balance-sheet as well as off-balance-sheet items multiplied by risk weights that range from zero to 100 percent.
Securities—excludes securities held in trading accounts. Effective March 31, 1994 with the full implementation of Financial Accounting Standard (FAS) 115, securities classified by banks as “held-to-maturity” are reported at their amortized cost, and securities classified a “available-for-sale” are reported at their current fair (market) values.
Securities gains (losses)—net pre-tax realized gains (losses) on held-to-maturity and available-for-sale securities.
Total capital—the sum of Tier 1 and Tier 2 capital. Tier 1 capital consists of common equity capital plus noncumulative perpetual preferred stock plus minority interest in consolidated subsidiaries less goodwill and other ineligible intangible assets. Tier 2 capital consists of subordinated debt plus intermediate-term preferred stock plus cumulative long-term preferred stock plus a portion of a bank’s allowance for loan and lease losses. The amount of eligible intangibles (including mortgage servicing rights) included in Tier 1 capital and the amount of the allowance included in Tier 2 capital are limited in accordance with supervisory capital regulations.
Volatile liabilities—the sum of large-denomination time deposits plus foreign-office deposits plus federal funds purchased plus securities sold under agreements to repurchase plus other borrowings. Beginning March 31, 1994, new reporting detail permits the exclusion of other borrowed money with original maturity of more than one year; previously, all other borrowed money was included. Also beginning March 31, 1994, the newly reported “trading liabilities less revaluation losses on assets held in trading accounts” is included.
Quarterly Journal, Vol. 21, No. 3, September 2002 17

Recent Corporate Decisions
The OCC publishes monthly, in its publication Interpretations and Actions, corporate decisions that represent a new or changed policy, or present issues of general interest to the public or the banking industry. In addition, summaries of selected corporate decisions appear in each issue of the Quarterly Journal. In the second quarter of 2002, the following corporate decisions were of particular importance because they were precedent-setting or otherwise represented issues of importance. The OCC’s decision documents for these decisions may be found in Interpretations and Actions using the decision number at the end of each summary.
Mergers
On June 26, 2002, the OCC granted conditional approval for Household Bank (SB), N.A. (“HBSB”), Las Vegas, Nevada, to merge Household Bank (Nevada), N.A., Las Vegas, Nevada, into HBSB under 12 USC 215a and 1828(c). The conditional approval also included permission to purchase assets of Beneficial National Bank, U.S.A., New Castle, Delaware, and transfer ownership of the HBSB affiliate to Household Finance Company under 12 CFR 5.33. The approval requires HBSB to enter into an Operating Agreement with the OCC. [Conditional Approval Letter No. 537]
During the quarter, the OCC granted approval of four applications to undertake reorganizations pursuant to 12 USC 215a-2 and 12 CFR 7.2000(a). This recently enacted amendment to 12 USC 215 provides a streamlined process for national banks to effect holding company reorganizations through an exchange of the bank’s stock for cash or securities of a bank holding company.
Also during the quarter, the OCC granted approval of two applications for national banks to merge with nonbank subsidiaries or affiliates pursuant to 12 USC 215a-3. This recently enacted amendment to 12 USC 215 expressly authorizes such mergers. This section was adopted to facilitate the ability of banking organizations to effect corporate restructuring between national banks and their subsidiaries and affiliates in the most efficient way possible, while preserving regulatory oversight by requiring OCC approval.
Operating Subsidiaries
On June 21, 2002, the OCC granted conditional approval for Citibank USA, N.A., to acquire three subsidiaries from a nonbank affiliate. The companies consist of two auto clubs, one of which has a subsidiary in Mexico, that operate and administer typical emergency roadside assistance and provide limited travel services through programs with auto rental companies, auto manufacturers, and a traditional retail member fee-based auto club. The third company is a credit card registration/notification company. The approval contained conditions relating to obtaining third-party insurance to cover the potential excess of costs over revenues in the retail member auto club program, and providing annual operational data for the retail member auto club permitting the OCC to determine whether divestiture may be required if its operation and administration is no longer convenient and useful. [Conditional Approval Letter No. 535]
On June 28, 2002, the OCC granted approval for Extraco Bank, N.A., Waco, Texas, to expand the activities of an operating subsidiary of the bank. We granted approval for the operating subsidiary to provide customers with advice and consultation on the technology (including installation and maintenance) used to access its banking services. The advisory and consulting services are limited to technology processing advice and consultation for the type of banking, financial, and economic data that the bank would be permitted to process on behalf of its customers discussed under 12 CFR 7.5006. [Corporate Decision No. 2002-11]
Quarterly Journal, Vol. 21, No. 2, June 2002 19

Special Supervision/Fraud and Enforcement Activities The Special Supervision/Fraud division of the Mid-Size/ Figure 1—Problem national bank Community Bank Supervision department supervises the historical trend lineresolution of critical problem banks through rehabilitation 400or orderly failure management, monitors the supervision of nondelegated problem banks, coordinates fraud/white collar crime examinations, provides training, disseminates 300information, and supports OCC supervisory objectives as an advisor and liaison to OCC management and field staff on emerging problem bank and fraud/white collar 200
crime related issues. Fraud experts are located throughout the United States representing each of the OCC’s district offices, and they also provide support to the OCC’s largest 100
supervised banks.
This section includes information on problem national 0
banks, national bank failures, and enforcement actions. Source: Special SupervisionData on problem banks and bank failures is provided by OCC’s Special Supervision/Fraud division and the FDIC’s Department of Resolutions in Washington. Information Figure 2—Total bank failures
on enforcement actions is provided by the Enforcement compared to OCC failures
326 315
329
33 18 19 21
13 16 21 26
368 373
313
55
133
253
250and Compliance division (E&C) of the law department. The latter is principally responsible for presenting and litigating administrative actions on the OCC’s behalf 200
against banks requiring special supervision. 150
Problem National Banks and National Bank Failures 100
Problem banks represented approximately 1 percent of 50the national bank population as of June 30, 2002. The volume of problem banks, those with a CAMELS rating
0of 4 or 5, is now increasing. The CAMELS rating is the composite bank rating based on examiner assessment of capital, asset quality, management, earnings, liquidity,
Source: FDIC Department of Resolution
and sensitivity to market risk. The total number of 4 and 5 rated banks is 26, up from 21 at December 31, 2001 remedies range from advice and moral suasion to informal and 16 at June 30, 2001. Levels haven’t been this high and formal enforcement actions. These mechanisms are since 1995. Additionally, the volume of banks rated 3 is designed to achieve expeditious corrective and remedial also increasing. These banks total 105 at June 30, 2002 action to return the bank to a safe and sound condition.compared to 92 at year-end 2001. This increasing volume of problem banks reflects current economic conditions. The OCC takes enforcement actions against national Three national bank failures occurred during the first half banks, individuals affiliated with national banks, and of 2002 out of a total of eight commercial bank failures. agents and servicing companies that provide data
184
200 206
168
124 122
13 6 1 3 8 7 4 8 3 1 2 0 3 2 3
42
138
110
23 34
44
95
83
61 48
6 0 2
processing and other services to national banks. The Enforcement Actions OCC’s informal enforcement actions against banks
include commitment letters and memorandums of The OCC has a number of remedies with which to carry understanding (MOUs). Informal enforcement actions out its supervisory responsibilities. When it identifies are meant to handle less serious supervisory problems safety and soundness or compliance problems, these identified by the OCC in its supervision of national banks.
1986
1987
1988
1989
1990
1991
1992
1993
1994
1995
1996
1997
1998
1999
2000
2001
6/30/0
2
1986
1987
1988
1989
1990
1991
1992
1993
1994
1995
1996
1997
1998
1999
2000
2001
6/30/0
2
Quarterly Journal, Vol. 21, No. 3, September 2002 21

22 Quarterly Journal, Vol. 21, No. 3, September 2002
Failure to comply with informal enforcement actions will provide strong evidence of the need for the OCC to take formal enforcement action. The charts below show total numbers of the various types of enforcement actions completed by the OCC against national banks in the last several years. Year-2000 (Y2K) related actions taken in 1999 are noted in parentheses.
The most common types of formal enforcement actions issued by the OCC against national banks over the past several years have been formal agreements and cease-and-desist orders. Formal agreements are documents signed by a national bank’s board of directors and the OCC in which specific corrective and remedial measures
4
10
21
16
2
18
39*
0
10
20
30
40
50
1996 1997 1998 1999 2000 2001 to 6/02
Figure 3—Commitment letters
Source: OCC Supervisory Monitoring System (SMS) and Examiner View (EV). Note that SMS totals for previous years’ completed enforcement actions may be adjusted to reflect revised aggregates.
*6 of which are for year-2000 problems
Figure 4—Memorandums of understanding
2
9
31
20
16
18
31*
0
5
10
15
20
25
30
35
1996 1997 1998 1999 2000 2001 to 6/02
Source: SMS & EV. Note that SMS totals for previous years’ completed enforcement actions may be adjusted to reflect revised aggregates.
*6 of which are for year-2000 problem
15
22
34
44
21
6
35*
0
10
20
30
40
50
1996 1997 1998 1999 2000 2001 to 6/02
Figure 5—Formal agreements
Source: SMS & EV. Note that SMS totals for previous years’ completed enforcement actions may be adjusted to reflect revised aggregates.
*2 of which are for year-2000 problems
Figure 6—Cease-and-desist orders against banks
Source: SMS & EV. Note that SMS totals for previous years’ completed enforcement actions may be adjusted to reflect revised aggregates.
*1 of which is for year-2000 problems
2
5
8
12 12 1211*
0
5
10
15
1996 1997 1998 1999 2000 2001 to 6/02
are enumerated as necessary to return the bank to a safe and sound condition. Cease-and-desist orders (C&Ds), sometimes issued as consent orders, are similar in content to formal agreements, but may be enforced either through assessment of civil money penalties (CMPs) or by an action for injunctive relief in federal district court. The OCC may also initiate the safety and soundness order process under 12 CFR 30, which begins when the OCC issues a notice of deficiency. The notice of deficiency notifies the affected bank that it needs to submit a plan for bringing its operations into compliance with safety and soundness standards. The OCC issued no CMPs against national banks from January 1, 2002, to June 30, 2002, nor issued any notices of deficiency.

The most common enforcement actions against individuals are civil money penalties (CMPs), personal C&Ds, and removal and prohibition orders. CMPs are authorized for violations of laws, rules, regulations, formal written agreements, final orders, conditions imposed in writing, and under certain circumstances, unsafe or unsound banking practices and breaches of fiduciary duty. Personal C&Ds may be used to restrict individuals’ activities and to order payment of restitution. Removal and prohibition actions, which are used in the most serious cases, result in lifetime bans from the banking industry.
Recent Enforcement Cases
In January 2002, the OCC assessed a civil money penalty of $10 million against one of the federal branches of the
Figure 7—Civil money penalties against individuals
50
40
30
20
10
0 1996 1997 1998 1999 2000 2001 to 6/02
20
30
44
29
12
23
37
Source: SMS & EV. Note that SMS totals for previous years’ completed enforcement actions may be adjusted to reflect revised aggregates
Figure 8—Cease-and-desist orders against individuals
25
20
15
10
5
0 1996 1997 1998 1999 2000 2001 to 6/02
17
21
12
17 16
1
9
Source: SMS. Note that SMS totals for previous years’ completed enforcement actions may be adjusted to reflect revised aggregates.
Bank of China located in New York City. At the same time, the bank also consented to pay another $10 million penalty to its home-country regulator, the People’s Bank of China, which cooperated with the OCC in the investigation. After a lengthy investigation, the OCC uncovered a series of questionable transactions at the branch, extending back several years. The transactions resulted in significant losses to the New York branch and included several that showed preferential treatment to certain customers of the New York branch who had personal relationships with some members of the New York branch’s prior management. In addition to the penalty, the OCC also issued a consent order to the bank, which covered the New York branch where the transactions occurred, the bank’s other branch in New York, and its branch in Los Angeles. The consent order required numerous remedial measures and imposed restrictions to prevent recurrence of these actions. The bank’s current management, which has cooperated with the investigation, has also removed officers suspected of misconduct, uncovered and reported acts of misconduct to the two regulatory agencies, and required the U.S. branches to implement several action plans over the past 18 months to correct actions of prior management.
In January 2002, the OCC issued supervisory letters and letters of reprimand to several officers and directors of a national bank in Florida. The bank, which was placed into receivership in the same month, had failed to comply with several provisions of a cease and desist order that the OCC had issued in September 2000. The directors were charged with causing the bank to violate the order and to file materially inaccurate Reports of Condition, in violation of 12 USC 161.
Figure 9—Removal and prohibition orders
50
40
30
20
10
0 1996 1997 1998 1999 2000 2001 to 6/02
41
32 36
21
8
17
28
Source: SMS. Note that SMS totals for previous years’ completed enforcement actions may be adjusted to reflect revised aggregates.
Quarterly Journal, Vol. 21, No. 3, September 2002 23

In January 2002, the OCC issued a prohibition order with the consent of the former senior loan officer of a national bank in California. The loan officer improperly released the guarantee supporting a bank loan within a day or two of when the loan was originated. He then falsely reported to the bank and to the OCC that the guarantee was still in place. The bank did not discover his actions until it after had advanced additional funds to the borrower. The bank lost approximately $3 million on the loan.
In February 2002, the OCC issued a prohibition order and assessed a $4,000 civil money penalty with the consent of a former senior portfolio manager at a national bank in Utah. The portfolio manager purchased unsuitably risky and volatile securities for several asset management accounts, cross-sold some of these securities between accounts to hide losses, and misstated the value of the securities on the bank’s pricing sheet and on monthly statements to clients. The bank ultimately reimbursed various harmed investors for approximately $650,000 in resulting losses.
In February 2002, the OCC issued a prohibition and restitution order to the former president of a national bank in Texas. The former president, who consented to the order, agreed to pay $100,000 in restitution. The former president caused the bank to violate its legal lending limit under 12 USC 84, violated 12 CFR 32, and made and concealed several nominee loans and overdrafts that contributed to the bank’s failure.
In February 2002, the OCC received a favorable decision from the administrative law judge (ALJ) who presided over a challenge to a now-dismissed OCC enforcement action. The challenge, brought under the Equal Access to Justice Act (EAJA), alleged that the OCC lacked a good-faith basis for the civil money penalty action it brought last year against the former president and compliance officer of a national bank in Missouri. Subsequent to commencing the action, the OCC dropped the case on the motion of OCC Enforcement counsel. The administrative law judge hearing the EAJA challenge held that the OCC was substantially justified in issuing the Notice of Assessment of a Civil Money Penalty and, therefore, the plaintiff was not entitled to relief under the EAJA. The ALJ’s recommended decision was adopted by the Comptroller and the plaintiff has appealed the Comptroller’s decision to the DC Circuit Court. The appellate court has yet not ruled on the appeal.
In March 2002, the OCC issued a prohibition order and assessed a civil money penalty of $100,000 with the consent of a former senior vice president and loan officer of a national bank in Louisiana. While at the bank, the
officer originated at least three fictitious loans, and then used the proceeds of the loans for his personal benefit.
In March 2002, the OCC assessed civil money penalties against two former officers of an operating subsidiary of a national bank in California. The former officers consented to pay the penalties, $10,000 and $3,000, respectively, for their role in causing the subsidiary to employ one of the officers, despite his prior felony conviction.
In April 2002, the OCC entered into a formal agreement with a national bank in Arizona in connection with its credit card lending program. The bank suffered from numerous unsafe or unsound practices in its risk management and underwriting policies, as well as its management information systems and accounting.
In May 2002, the OCC entered into a cease-and-desist order with a CEBA credit card bank. The order included provisions that require the bank to correct its record-keeping and affiliate transaction deficiencies and to go out of business by December 31, 2002. In addition, the bank’s ultimate parent established a $120 million escrow account for the defeasance of the bank’s deposits and a $78 million letter of credit to cover the risk associated with the funding of credit card receivables for the bank’s merchant parent. The merchant affiliates also agreed to amend their contracts to ensure that the bank did not fund the credit card remittances until and unless it received payment from the merchant affiliates. The consent order also required the bank to establish a $15 million liquidity reserve deposit.
Fast Track Enforcement Cases
The OCC continued its Fast Track Enforcement Program, initiated in 1996, which ensures that bank insiders who have engaged in criminal acts in banks, but who are not being criminally prosecuted, are prohibited from working in the banking industry. As part of the Fast Track Enforcement Program, E&C secured four consent prohibition orders against institution-affiliated parties in the first half of 2002. Some of these orders also incorporated restitution payments to the appropriate banks for losses incurred. In addition, E&C sent out ten notifications to former bank employees who were convicted of crimes that federal law prohibits them from working again in a federally insured depository institution.
As a typical example of a Fast Track case, the OCC issued a prohibition order in April 2002 against a former branch manager of a national bank in New Jersey. The branch manager defrauded the bank and agreed to the OCC’s prohibition order, which was handled through the OCC’s Fast Track program.
24 Quarterly Journal, Vol. 21, No. 3, September 2002

Appeals Process
Appeal Composite and CAMELSI enforcement action has been taken. In such circumstances, the OCC’s ombudsman, without engaging in additional fact-
Component Ratings finding, applies relevant OCC policies and standards to the existing facts to determine whether the agency’s conclusions
Background are consistent with those policies and standards.
A bank operating under a formal agreement appealed the The bank’s correspondence explained that their appeal composite rating and each of the CAMELSI component was not requesting the ombudsman’s involvement with ratings (capital, asset quality, management, earnings, supervisory decisions pertaining to compliance with the liquidity, sensitivity to market risk, and information existing formal enforcement action or any subsequent technology), 3/3343233, respectively. Additionally, the bank decisions to pursue additional enforcement actions.expressed a desire to appeal many of the conclusions in the report of examination (report) that supported the ratings. The ombudsman conducted a comprehensive review of
the information submitted by the bank and documentation The directors and management also expressed concern from the supervisory office. The review included meetings with the lack of objectivity in the report and an alleged with members of the bank’s board of directors, senior
bias by the supervisory office in their assessment of the management team, and legal counsel. The ombudsman also bank’s condition. Additionally, there was a concern over met with members of the supervisory office. The ombudsman the difficult communications between the supervisory review focused on whether there was adequate support for office and bank management. Management and the the assigned ratings and whether the ratings reflected the board were explicit in stressing that they endeavored to condition of the bank at the time of the examination. work through their disagreements with the supervisory office over a number of years. Their decision to file Conclusion an appeal after the most recent examination was made after concluding that third party intervention by the The ombudsman determined that the assigned composite ombudsman was the only way to restore balance to the and CAMELSI component ratings were appropriate at the supervisory process. Finally, the appeal requested the time of the examination. The report of examination also ombudsman facilitate a change in supervisory office. appropriately addressed the need to strengthen the bank’s
risk management systems. However, the ombudsman Discussion identified several instances where the report lacked
proper balance. The wording and tone of the report was The OCC Bulletin 2002-9, “National Bank Appeals too harsh and did not give recognition for the bank’s Process: Guidance for Bankers,” February 25, 2002, positive actions. Further, the report did not consider the (bulletin), makes clear that banks cannot seek ombudsman unique aspects of the bank’s operating environment. review of agency decisions for which banks are provided Given the length of time since the onsite examination, the with an appeal mechanism by statute or OCC regulation, ombudsman decided a new examination was needed as or where the decision is subject to judicial review. These opposed to rewriting the report. include agency decisions to pursue formal enforcement action or recommended decisions following formal or The ombudsman held discussions with the district informal adjudications pursuant to the Administrative deputy comptroller to encourage measures that would Procedures Act, 5 USC 701 et seq., agency actions that ensure appropriate balance during the next examination, are subject to judicial review, and decisions made to recognizing the unique aspects of the bank’s operating disapprove directors and senior executive officers pursuant environment. Bank management was encouraged to to Section 914 of the Financial Institutions Reform, aggressively direct their attention and efforts toward Recovery and Enforcement Act of 1989, 12 USC 1831i. institutionalizing a culture that is reflective of strong
risk management systems and internal control processes While the bulletin does not allow appeals of the underlying throughout the bank. Such an effort would yield huge facts of an enforcement action, it does permit material dividends internally as well as eliminating the basis of supervisory determinations to be appealed even when an most of the prior OCC criticisms and recommendations.
Quarterly Journal, Vol. 21, No. 3, September 2002 25

Speeches and Congressional Testimony Page
Of the Comptroller of the Currency
Remarks by John D. Hawke, Jr., Comptroller of the Currency, before the Consumer Bankers Association, on the benefits of financial literacy programs, Arlington, Virginia, April 8, 2002 . . . . . . . . . . . . . . . . . . . . . . . . . . . . . . 29
Statement of John D. Hawke, Jr., Comptroller of the Currency, before the U.S. Senate Committee on Banking, Housing, and Urban Affairs, on ending inequitable treatment of national banks, Washington, D.C., April 23, 2002 . . . . . . . . . . . . . . . . . . . . . . . . . . . . . . . . . . . . . . . . . . . . . . . . . . . . . . . . . . . . . . . . . . . 33
Remarks by John D. Hawke, Jr., Comptroller of the Currency, before the 38th Annual Conference on Bank Structure and Competition, on the growing consensus that the fee disparity problem must be fixed, Chicago, Illinois, May 9, 2002 . . . . . . . . . . . . . . . . . . . . . . . . . . . . . . . . . . . . . . . . . . . . . . . . . . . . . . . . . 38
Of the First Senior Deputy Comptroller and Chief Counsel
Remarks by Julie L. Williams, First Senior Deputy Comptroller and Chief Counsel, before the Local Initiatives Support Corporation annual staff conference, on the beneficial relationships between banks and community development corporations, Cleveland, Ohio, April 10, 2002 . . . . . . . . . . . . . . . . . . . . . . . . . . . . 44
Quarterly Journal, Vol. 21, No. 3, September 2002 27

Remarks by John D. Hawke, Jr., Comptroller of the Currency, before the Consumer Bankers Association, on the benefits of financial literacy programs, Arlington, Virginia, April 8, 2002
Financial Literacy: A Key to New Banking Markets
It’s a pleasure to join you at your annual Community Reinvestment Act conference—another opportunity for CBA to reaffirm its standing as one of the premier banking organizations in this country. A large share of the credit for your success goes to Joe Belew, who over the years has led with intelligence, conviction, and style.
One of the most important of your products is your survey of the industry’s financial literacy efforts. When it was first released last summer, the survey confirmed what many of us already knew: that thousands of Americans have been smarter financial consumers—and more successful participants in the economy—because they attended educational programs developed, financed, and carried out by banks across the country.
This year’s survey reflects an even more impressive variety of bank-sponsored programs: credit counseling, small business development, in-school tutoring, foreclosure prevention, and more. Of the banks surveyed—a group that represented almost 60 percent of the industry’s total assets—nearly all said that they contributed to the war on financial illiteracy in some way, with more than half serving as primary sponsors of the programs in which they participated.
Clearly, bank-sponsored financial education programs have not only benefited the people who have enrolled in them, they’ve also earned respect and good will for the industry.
Yet when you think about it, the wonder is not that financial institutions have been so busy and active in promoting financial literacy, it’s that there are still banks out there that aren’t involved.
There are certainly plenty of reasons for public-spirited bankers to become involved in the effort to promote financial literacy. Evidence confirms that people who have been through well-designed and well-executed financial education programs are more likely to make sound economic choices for themselves and their families.
They’re more likely to own their own homes and to keep them, with all of the social and economic advantages
that go with homeownership. They’re more likely to accumulate assets and less likely to be burdened by excessive debt. As Treasury Secretary Paul H. O’Neill recently said, “Ownership, independence, and access to wealth should not be the privilege of a few. They should be the hope of every American. Financial literacy is an essential tool to make that hope a reality.”
Studies also tell us that financial education is an indispensable element of any strategy to combat the rise of predatory lending. I don’t need to tell you that abusive lending has become a serious public policy concern—and a serious concern for the financial services industry.
Although those who engage in predatory practices are relatively few in number—and only rarely include regulated depository institutions—they’ve done real harm to the reputation of all financial institutions. It’s therefore very much in the industry’s interests to assist in efforts to oust the bad actors.
One of the best ways we’ve found to do that is through education, with programs that focus on the most common victims of predatory lending—particularly the poor, the elderly, and minority groups—programs that provide information on predatory practices and on non-predatory financial options. I was encouraged to see that more than half of the respondents in the current CBA survey reported addressing predatory lending issues in their financial literacy programs.
The predatory lending problem illustrates what I think is a point of surpassing importance: altruism that’s reinforced by self-interest is most likely to produce results. And I believe that banks have a strong self-interest in promoting financial literacy.
High among the reasons why banks serve themselves when they serve others through participation in financial literacy efforts are regulatory considerations, and particularly CRA considerations.
We and other financial regulators give CRA credit for financial literacy programs in assessing your record of serving the needs of low- and moderate-income individuals. Banks’ participation in these programs may receive consideration under the CRA regulations.
Quarterly Journal, Vol. 21, No. 3, September 2002 29

For example, the Interagency Q&As offer a long list of activities that would qualify for consideration under the CRA service test. The list includes such things as:
• providing technical assistance on financial matters to small businesses;
• providing credit counseling, home buyer and home maintenance counseling, financial planning or other financial services education to promote community development; and
• establishing school savings programs and developing or teaching financial education curricula for low- and moderate-income individuals.
Regarding the investment test, the Interagency Q&As note that when financial institutions make investments in or grants to non-profit organizations that provide counseling for credit, home-ownership, home maintenance, and other financial services education, such investments will qualify for CRA consideration.
Clearly, financial literacy activities can play a big part in any financial institution’s overall CRA strategy. And we know that some of our largest institutions already play such a role.
But banks should not get involved in the financial literacy crusade merely as a matter of public spirit or regulatory obligation. They should do it because it makes good business sense—because a financially literate public is the natural market for bank products and services.
It’s now well known that there’s a large pool of unbanked Americans—people who may use the banking system for a casual transaction or two, or maybe not at all. By definition, they don’t have a savings or checking account, and they rely on nonbank financial providers when they need to cash a check or buy a money order. According to some estimates, this group may constitute up to ten percent of all American households.
Then there are the underbanked, as I call them—millions of people who may have a bank account, but who rely to a greater or lesser extent on high-cost, short-term credit provided by nonbank lenders, often in the form of payday loans.
There are significant differences between these two groups. But they also have a lot in common. Both generally pay more than they should have to for financial services in a fully competitive market. Both would benefit
from more comprehensive banking relationships. And for both, financial literacy programs may hold the key to getting there.
Let me emphasize again that for banks, this should be a matter of enlightened self-interest. This a lucrative market that we’re talking about. Overall, those who serve the unbanked and the underbanked do exceedingly well at it. In 2000, Americans cashed 180 million checks at 11,000 check-cashing outlets, generating fees of $1.5 billion. And the payday loan industry has been booming. Today up to 10,000 outlets nationwide make payday loans—and earn fees that may total as much as $2.2 billion.
While many will say that fees for these services are unreasonably high, bankers in this country can’t afford to ignore the number of consumers using these services. They clearly demonstrate a market opportunity.
Is it realistic to think that bankers can gain a bigger share of this promising market? Clearly, it won’t be easy. The nonbank providers that currently control the market possess a number of advantages—not the least of which is public acceptance.
Check cashers and payday lenders have attracted customers for a reason—or for a host of reasons. They keep longer hours than banks. They tend to be more conveniently located. They speak their customers’ languages. They don’t ask for a lot of intrusive paperwork. They frequently offer more of the retail products and services these customers need than banks do—including money orders, wire transfers, and bill payments, as well as short-term, low-denomination loans.
They’re set up to work fast—a fact of paramount importance to many payday borrowers, who are usually impatient for their money and won’t wait days or weeks for a loan to be approved. In short, they’re more user-friendly. And nonbank providers can often claim—correctly—that their services cost no more—and sometimes less—than the same services provided by banks—that is, when those services are even available at banks.
Yet banks have some significant competitive advantages that should position them to be far greater rivals than they are for these fringe providers. Banks alone have access to the payments system. They alone can hold transaction balances. They alone have deposit insurance coverage and access to the discount window. They alone are eligible to accept direct deposits. And they alone can offer banking services in conjunction with a variety of other services.
30 Quarterly Journal, Vol. 21, No. 3, September 2002
Add the many intangible benefits that banking relationships offer—institutional advice and support, opportunities to build formal credit histories, and so on—and you have a powerful set of reasons for banks to go after this business.
Of course, banks have enjoyed these advantages for years. Yet that hasn’t prevented the estrangement of millions of Americans from the banking system. So the problem becomes one of ensuring that these advantages are understood by—and made accessible to—the individuals who would benefit from them.
The answer—or part of it—lies in something that is relatively new. I have long suggested that technology is an essential component of any viable strategy to extend the benefits of banking to the underbanked. I’m pleased to see that this view is beginning to take hold both among consumer advocates and among bankers themselves.
For example, last week a large national bank introduced a no-frills, “checkless” account that gives customers unlimited access to their funds through the bank’s automated teller machine (ATM) network and eliminates the need to cash payroll checks.
This is one of those cases where government has led effectively by example. Consider the case of the ETA— the Electronic Transfer Account—that was developed by the Treasury Department when I was Under Secretary for Domestic Finance. ETAs are now being offered by hundreds of banks around the country—including the six largest—and have already drawn thousands of previously unbanked Americans into the banking system. More than 26,000 ETA accounts have been opened since the program began. To be sure, that’s not an earth-shaking number. But it’s a good start.
When we developed the ETA model, we had two principal goals in mind. First, it was designed to facilitate the transition—mandated by law—from paper to electronic delivery of federal payments. Obviously, people can’t receive electronic payments unless they have a bank account to do so.
The transition to electronic direct deposit was expected to save the government tens of millions of dollars—as indeed it has done. Over the past decade, in fact, the government has saved more than $2 billion by converting from paper checks to electronic payments.
But we also hoped and expected that the ETA—a cheap, no-frills, utilitarian account—would serve as a model
for financial institutions seeking to establish or expand a foothold in the unbanked market.
Taking advantage of their ability to batch remittances, some banks are beginning to develop electronic accounts that combine direct deposit with debit card access and bill payment options. Such accounts are proving attractive to individuals accustomed to spending several dollars per month for money orders or electronic bill payments. Because such accounts largely dispense with paper, they can be offered at low cost—lower in many cases than the customer would pay for the same set of services at a nonbank outlet.
But it’s not only their competitive pricing that makes such accounts attractive to those who would otherwise be dealing with a nonbank. They provide a safe and cheap repository for funds. No more lost or stolen checks; no more hassles to cash a payment check; no more risk of carrying around a wad of cash and becoming a target for predators. The paycheck goes directly into the bank account, and with a debit card the customer can draw funds as she needs them, at an ATM or at point of sale. And if the bank has been innovative, the customer may even be able to make basic payments from the account by electronic transfer, either without cost or at a cost far less than a money order.
For the bank there are also important benefits: no processing of paper checks, no risk of overdrafts, the opportunity to establish new customer relationships that may be developed into something more.
For example, if such customers need small loans, for a car or appliance purchases—or even payday-type credit—a direct deposit account, which already enjoys cost advantages over a paper-based account, offers the possibility of prearranged electronic debits, significantly reducing not only the processing cost, but the bank’s risk of default, as well. And they are favorably considered in a bank’s CRA evaluation.
Banks are also taking the initiative to address the short-term borrowing needs of their customers, and here again, technology can be a big part of the solution.
In one noteworthy development, a prominent national bank has begun to offer a product that provides access to low-cost cash advances for direct deposit customers. Funds can be obtained directly from the bank’s ATM network or by speaking to a telephone agent who will transfer the funds into the customer’s account. The bank has also automated the underwriting process, cutting costs for both parties to the transaction and virtually eliminating
Quarterly Journal, Vol. 21, No. 3, September 2002 31

the waiting period for established customers—a matter of considerable importance, as we’ve seen, for the emergency borrower.
Let me commend those of you who have added such innovative products to your offerings—and challenge those of you who haven’t done so to think of even better ways of delivering these services.
But despite what Emerson said, it’s not enough to build a better mousetrap; the world has to know about it before anyone will beat a path to your door. You have to give people a reason to break old patterns and habits; you have to let them know that they do have better options. And that brings me back to the importance of financial literacy.
A quick cautionary note is in order here. There can be a fine line between education and marketing, and it’s a line that should be heeded in an educational setting. But this is an instance in which the facts—plain and uninflated—are on your side. Bank products and services—and the value of banking relationships—should sell themselves to informed consumers.
Coupled with innovative, technology-based approaches to product delivery, I believe that educational outreach holds tremendous potential for reducing the ranks of the underbanked. The potential rewards—for the economy and the banking system—certainly make the effort worthwhile.
It’s not an effort we expect the industry to undertake on its own, of course. As with technology, we in government are leading by example, and we’re working in partnership with others to promote the cause of financial literacy. I’m proud to report that the Treasury Department and its bureaus—especially the OCC—have been extremely active in this effort.
OCC has published resource guides and advisories to banks and others in search of ideas about where to obtain financial education and about how to help. We participate
in the National Forum to Promote Low-Income Savings, an effort directed by the Consumer Federation of America to increase the savings rate in local communities. The OCC is one of only four federal agencies to have a formal partnership with the National Academy Foundation, a nonprofit organization dedicated to preparing young people for careers in the fields of finance, travel and tourism, and information technology.
And, of course, we work closely with banks, individually and through organizations like CBA, encouraging them to expand the scope and quality of their financial literacy activities.
Indeed, I believe it says something about our success in regard to numbers—numbers of banks participating and number of clients served, for example—that we’re turning more to the question of program quality. Success in the financial literacy area cannot be measured simply in terms of raw statistics. We have to develop qualitative measures of our programs’ effectiveness. We must set standards and measure outcomes where appropriate. I’m encouraged to see that many banks are engaging their community-based partners and other independent parties to evaluate the effectiveness of their programs.
Let me close by once again commending CBA and the banking industry for your important work in reaching out to the unbanked, the underbanked, and those in need of more and better information about their financial options. But we can’t stop here, because the truth is that your work—our work—has just begun. There are millions more who remain outside the banking system—and outside the mainstream of our economy. We will never achieve our full potential as a nation as long as that’s the case. And the banking industry will miss out on opportunities to serve, to grow, and to profit.
Reach out because it is the right thing to do; reach out because the American people need you. But do it most of all because it’s good business. After all, doing good by doing well is the American way.
32 Quarterly Journal, Vol. 21, No. 3, September 2002

Statement of John D. Hawke, Jr., Comptroller of the Currency, before the U.S. Senate Committee on Banking, Housing, and Urban Affairs, on ending inequitable treatment of national banks, Washington, D.C., April 23, 2002
Statement required by 12 USC 250: The views expressed herein are those of the Office of the Comptroller of the Currency and do not necessarily represent the views of the President.
Introduction
Chairman Sarbanes, Senator Gramm, and members of the committee, I am pleased to have this opportunity to present the views of the Office of the Comptroller of the Currency (OCC) on deposit insurance reform. As the current and most recent past chairmen of the Federal Deposit Insurance Corporation (FDIC) have noted—and as I strongly agree—the system of federal deposit insurance adopted by the Congress in the early 1930s has served this nation well for the greater part of a century. No massive overhaul of the system is required to ensure that it will continue to contribute to financial confidence and stability in the twenty-first century.
Nonetheless, the efforts so far undertaken to address the weaknesses in the system uncovered during the banking and thrift crises of the late 1980s and early 1990s have not been entirely adequate to the task. Indeed, the legislation adopted in response to those crises has actually constrained the FDIC from taking sensible and necessary actions. This is particularly the case with respect to the FDIC’s ability to price deposit insurance in a way that reflects the risks posed by different depository institutions, and to the funds’ ability to absorb material losses over the business cycle without causing sharp increases in premiums. Failure to address these issues in the current financial environment poses the danger that the next major domestic financial crisis will be exacerbated rather than ameliorated by the federal deposit insurance system.
Current legislative proposals in the House and Senate to reform deposit insurance address most, albeit not all, of the issues raised by the FDIC staff in its excellent and wide-ranging Options Paper released in August 2000. Among these issues are (1) how much discretion the FDIC should have to set premiums reflecting the risks posed by individual institutions to the insurance funds; (2) whether strict limits on the size of the insurance funds result in excessive volatility of deposit insurance premiums; (3) whether the deposit insurance coverage limit should be increased and/or indexed to changes in the price level; and (4) whether the
Bank Insurance Fund (BIF) should be merged with the Savings Association Insurance Fund (SAIF).
In summary, the OCC recommends that (1) the FDIC be provided with the authority to implement a risk-based premium system for all banks; (2) the current fixed designated reserve ratio (DRR) be replaced with a range to allow the FDIC more flexibility in administering the deposit insurance premium structure; (3) coverage limits on deposits should not be increased; and (4) the BIF and SAIF should be merged.
We believe that deposit insurance reform also provides an opportunity to strengthen our supervisory structure by eliminating a distortion and unfairness in the current system of funding bank supervision. Currently, a portion of the earnings on the insurance funds, which state and national banks paid into, is diverted to fund the federal supervision of only one class of institutions, state banks supervised by the FDIC. The FDIC has elected not to pass those costs on to the banks they supervise. As a consequence, state nonmember banks pay only a small percentage of the costs of their supervision. In contrast, national banks pay over $400 million each year to cover the full costs of their supervision by the OCC. Ending this anomaly is not just a matter of fairness to national banks. It is a necessary component of allocating the costs and benefits of deposit insurance in an equitable and efficient manner among insured banks. For that reason, in addition to our views on the issues addressed by the legislative proposals to reform deposit insurance, my testimony today will include our suggestion for remedying the inequity that exists in the funding of supervision.
Eliminating Constraints on Risk-Based Pricing
The ability of the FDIC to set premiums for deposit insurance that reflect the risks posed by individual institutions to the insurance funds is one of the most important issues in the deposit insurance reform debate. The banking and thrift crises of the 1980s revealed the weaknesses of a flat-rate deposit insurance system in which the great majority of sound, prudently managed institutions subsidize the risks assumed by a few institutions. The Congress responded to this glaring deficiency by enacting the Federal Deposit Insurance
Quarterly Journal, Vol. 21, No. 3, September 2002 33

Corporation Improvement Act (FDICIA) of 1991, which required the FDIC to establish a risk-based system of deposit insurance premiums, thereby bringing the pricing of deposit insurance more in line with the practices of private insurance companies. The FDIC’s initial efforts to implement such a system made meaningful, actuarially based distinctions among institutions based on the risk each institution posed to the insurance funds, but fell short of creating a well-differentiated structure.
Unfortunately, the Deposit Insurance Fund Act (DIFA) of 1996 diminished the FDIC’s discretion to maintain, let alone improve, the risk-based structure of deposit insurance premiums. DIFA effectively prohibited the FDIC from charging a positive premium to any institution in the 1A category—that is, well-capitalized institutions with composite CAMELS ratings of 1 or 2—whenever the reserves of the deposit insurance funds are at or above the designated reserve ratio (DRR) of 1.25 percent of insured deposits. As a result, at December 31, 2001, 92.5 percent of all insured banks fell into that category, and therefore pay nothing for their deposit insurance—even though their risk of loss may be far above zero. Thus, today many institutions—some of which have never paid any deposit insurance premiums—receive a valuable government service free, and very well-managed institutions in effect subsidize riskier, less well-managed institutions. Moreover, quite apart from the risk that a specific bank might present, banks are not required to pay even a minimum “user” fee for the governmentally provided benefit represented by the deposit insurance system—a benefit without which, as a practical matter, no bank could engage in the business of taking deposits from the public.
Aside from the obvious inequity to institutions that contributed heavily to recapitalize the funds after the losses of the 1980s and 1990s, a system in which the vast majority of institutions pays no insurance premium forgoes one of the major benefits of a risk-based pricing system—creating an incentive for good management by rewarding institutions that pose a low risk to the insurance funds. A mandated zero premium precludes the FDIC from charging different premiums to banks with different risks within the 1A category, despite the fact that within the 1A category there are banks that pose very different risks to the funds.1
1 In its August 2000, deposit insurance reform Options Paper, the FDIC reported that “the 5-year failure rate for CAMELS 2-rated institutions since 1984 was more than two-and-a-half times the failure rate for 1-rated institutions” (p. 13). As shown in chart 1 on page 12, the five-year failure rate for CAMELS 1-rated institutions (commercial and savings banks) was 0.7 percent, while that for CAMELS 2-rated institutions was 1.8 percent (www.fdic.gov/deposit/insurance/initiative/Options_080700m.pdf).
Whenever the reserve ratio of the BIF falls below 1.25 percent, however, FDICIA requires the FDIC to charge an assessment rate to all banks high enough to bring it back to the DRR within one year. If that is not feasible, the FDIC must impose an assessment rate of at least 23 basis points. This sharp rise in premiums, or “cliff effect,” would hit banks the hardest when they are most vulnerable to earnings pressure. To avoid creating this procyclical volatility in deposit insurance premiums, it would be preferable to offset losses to the funds through more gradual changes in premiums based on the level of the insurance fund relative to the FDIC’s assessment of current risk in the banking system. In short, we believe that as risks in the banking system change relative to the level of the insurance funds, the FDIC should have the authority to adjust premiums on all banks.
Increasing Coverage Limits
The question of deposit insurance coverage limits is a challenging one, in part because it is extremely easy for depositors to obtain full insurance of deposits in virtually unlimited amounts through multiple accounts. Along with most academic economists and other bank regulators, we are convinced that the sharp increase in the deposit insurance limit from $40,000 to $100,000 in 1980—at a time when the thrift industry was virtually insolvent—was a serious public policy mistake that increased moral hazard and contributed to the weakening of market discipline that exacerbated the banking and thrift crises of the 1980s and 1990s. By encouraging speculative behavior, it ultimately increased losses to the deposit insurance funds and taxpayers.
Proponents of an increase in coverage assert that it would ease liquidity pressures on small community banks and better enable small banks to compete with large institutions for deposits. None of these assertions, however, is supported by substantial evidence.
First, we see no compelling evidence that increased coverage levels would offer depositors substantial benefits. Anyone who wants to use insured bank deposits as a means of holding their wealth can do so today virtually without limits, subject only to the minor inconvenience of having to open accounts at multiple banks. Despite the ability of depositors to achieve almost unlimited coverage at banks, money market mutual funds, which have some of the same features as bank transactions accounts and generally offer higher returns than bank deposits, today hold over $2 trillion. Because these funds could easily be placed in insured accounts, these facts suggest that many depositors are not concerned about the
34 Quarterly Journal, Vol. 21, No. 3, September 2002

additional risk involved in holding their liquid funds in uninsured form and that households are comfortable with the status quo.
Second, it is not at all clear that increasing deposit insurance coverage would result in an increase in the deposits of the banking system. One effect could be to cause a shift in deposits among banks. It is far from clear that any such redistribution of existing deposits would favor community banks. Depositors who multiply insurance coverage today by using multiple banks might consolidate their deposits in a single institution if coverage were raised, but there is no way of determining which institutions would be the ultimate beneficiaries when the switching process ended. Moreover, it is quite possible that larger, more aggressive institutions might use the expanded coverage to offer even more extensive governmentally protected investment vehicles to wealthy customers. That could cause an even greater shift of deposits away from community banks and increase the liquidity pressures felt by some.
For many of the same reasons that we object to an increase in the general insurance limit, we are also concerned about proposals to use the federal deposit insurance system to favor particular classes of depositors such as municipal depositors. For instance, at year-end 2001, commercial banks had $162 billion in municipal deposits. The FDIC estimated in 1999 that less than one-third of municipal deposits was insured. Applying that 1999 ratio to the 2001 total suggests that nearly $115 billion of municipal deposits at banks are uninsured. A significant increase in the insurance limit for municipal deposits, therefore, would undoubtedly raise the level of insured deposits and put pressure on the DRR. In addition, an increase in insured coverage could spur riskier lending because banks would no longer be required to collateralize the municipal deposits with low-risk securities.
Merger of the BIF and the SAIF
One of the least controversial issues of deposit insurance reform is the merger of the BIF and the SAIF. The financial conditions of thrifts and banks have converged in recent years, as have the reserve ratios of the two funds, removing one of the primary objections to a merger of the funds. As of the fourth quarter of 2001, the reserve ratio of the BIF was 1.26 percent, while that of the SAIF was 1.37 percent. The reserve ratio of a combined fund would have been 1.29 percent as of the same date. As is described in greater detail below, many institutions now hold some deposits insured by each fund. But under the current structure, BIF and SAIF deposit insurance premiums could differ
significantly depending on the relative performance of the two funds, raising the possibility that institutions with similar risks could pay very different insurance premiums. This would unfairly penalize low-risk institutions insured by the fund charging the higher premiums.
Despite the tendency for the activities of the banking and thrift industries to converge in recent years, substantial differences remain in their portfolio composition. For example, residential mortgage loans constitute 51 percent of the assets of insured savings institutions but only 15 percent of the assets of insured commercial banks. Largely because of these differences, merger of the two funds would result in significant diversification of risks.
A related development affecting the potential for diversification is industry consolidation, which has led to an increased concentration of insured deposits in a relatively few institutions and increased the risks to the deposit insurance funds. According to the FDIC staff, the three largest SAIF-insured institutions held over 15 percent of SAIF-insured deposits in 2001, while the corresponding share of the top three BIF-insured banks was over 13 percent. Merging the funds would reduce these concentrations, and thereby the risk that the failure of a few large institutions could seriously impair the insurance fund.
Further, there is significant overlap in the types of institutions insured by the two funds. As of March 2001, 874 banks and thrifts were members of one fund but also held deposits insured by the other fund, and BIF-member institutions held 41 percent of SAIF-insured deposits. Finally, merger of the BIF and the SAIF would undoubtedly result in operational savings as the two funds were combined into one.
Increased Flexibility for the Deposit Insurance Funds
The OCC supports giving the FDIC the authority to establish a range for the DRR to replace the present arbitrary fixed DRR of 1.25 percent. The FDIC should have the authority to set the range based on its assessment of the overall level of risk in the banking system. We also believe that in establishing the range the FDIC should provide notice and an opportunity for the public to comment on the proposed range. Adoption of a range and elimination of the 23 basis point “cliff effect” would allow the FDIC more flexibility in administering the premium structure and would minimize the likelihood of sharp increases in premiums during economic downturns when banks can least afford them.
Quarterly Journal, Vol. 21, No. 3, September 2002 35

When the funds exceed the upper boundary of the DRR range set by the FDIC, the FDIC should be authorized to pay rebates or grant credits against future premiums. To ensure that rebates or credits to insured institutions are equitable, the FDIC should have the authority to assess the nature of the institutions’ claims on the funds. Institutions that have paid little or no insurance premiums to the funds have far less of a claim on rebates or credits than those that contributed to building up the funds.
While such rebates or credits seem reasonable on their face, there are two obvious principles that should be observed in determining their size and allocation. First, a system of rebates and credits should not undermine the risk-based premium system. Institutions that paid high insurance premiums because they posed a higher risk to the funds should not receive larger rebates than less risky institutions of the same size. The fact that these high-risk institutions did not fail during that period does not alter the fact that they subjected the funds to greater than average risks.
The second principle is that the payment of rebates and credits should not have the unintended consequence of exacerbating the disparity in supervisory fees that now exists between state and nationally chartered banks. Today, the FDIC charges the insurance funds for its costs of supervising state-chartered institutions. National banks, in contrast, pay the full cost of their supervision despite the fact that they have contributed almost 55 percent of the amount in the BIF. For example, in 2001, in addition to $400 million in assessments that national banks paid to the OCC for their own supervision, national banks can be viewed as contributing 55 percent, or about $273 million, of the $525 million that the FDIC spent on state nonmember bank supervision. Failure to take this into account in fashioning a rebate program would be unconscionable.
Fee Disparity
State banks, on average, pay only modest assessments to state regulators, which represent about 20 percent of the total costs of state bank supervision. Far and away the largest component of state bank supervision is that provided by their federal regulators—the Federal Reserve, in the case of state banks that are members of the Federal Reserve, and the FDIC, in the case of nonmember state banks. In 2001, the Federal Reserve and FDIC together spent over $900 million on state bank supervision. None of this was recovered directly from the banks they supervise. The FDIC absorbs the cost of its supervisory and regulatory activities through charging the BIF and SAIF, while the Federal Reserve uses its interest earnings
to absorb its supervisory and regulatory costs. Neither the Federal Reserve nor the FDIC assesses state banks for their costs in providing exactly the same supervisory functions as the OCC provides for—and assesses— national banks. As a result of this subsidy provided by the Federal Reserve and the FDIC, there is a continuing incentive for national banks to convert to state charters. Indeed, state supervisors aggressively proselytize for such conversions, heavily exploiting fee disparity as a major part of their sales pitch.
It should be emphasized that fee disparity has no relationship to the relative efficiency of national and state bank supervision. It is entirely a consequence of the fact that state banks are not charged for the major portion of their supervision costs—that provided by their federal regulators. Indeed, the OCC has a strong externally imposed incentive to run its operations efficiently, for if it fails to do so, and must turn to its banks to pick up additional costs, it runs the risk of causing increased conversions of banks from national charters to state charters. Still, the effectiveness of supervision can suffer, and serious inequities can result, when unavoidable pressures on supervisors’ budgets are created. For example, during the wave of large bank failures in the late 1980s and 1990s—a period of stress in the banking system that had not been seen since the Great Depression—significant resource demands were placed on bank supervisors in responding to severe problems in the banking system. Yet just as these demands were being felt, the banking system was under severe earnings pressure.
At the OCC this meant significant increases in direct assessments on national banks—14 percent in 1989, another 11 percent in 1991, and 30 percent in 1992. While there were reductions in assessments in subsequent years, one conclusion is inescapable: the OCC assessment mechanism works procyclically in times of stress in the banking system. At the Federal Reserve and the FDIC, similar cost increases were easily absorbed—at the FDIC out of insurance funds and at the Federal Reserve out of revenues that otherwise would have been paid over to the Treasury Department. In other words, the OCC faces the threat of reduced supervisory resources at the very time they are most likely to be needed. National banks face a higher burden of supervisory costs at the very time they are facing a troubled economy. Just as the need to address the 23 basis point “cliff effect” has gained attention, so also should the procyclical distortions raised by the present system of funding supervision.
The question, of course, is what to do about this disparity. Proposals to level the playing field by requiring the
36 Quarterly Journal, Vol. 21, No. 3, September 2002

Federal Reserve and the FDIC to impose new fees on state banks have been dead on arrival in Congress. We believe it is necessary to come up with a new method of funding bank supervision—a method that will strengthen both the state and the federal supervisory processes and ensure that all supervisors have adequate, predictable resources available to carry out effective supervisory programs without imposing additional fees on state banks.
Solution
There are a number of alternative approaches to solving this problem that one might consider, and we believe that now is the ideal time to do so, as the whole topic of the role of deposit insurance is being reexamined. An idea that we think has considerable appeal would draw on the earnings of the FDIC’s insurance funds to cover the costs of both state and national bank supervision. Today, with the level of the combined funds at about $42 billion and generating earnings of around $2.5 billion per year, there are considerably more funds available to defray the costs of FDIC, OCC, and state supervision than those agencies today spend in total. Working together, and using the present costs of supervision as a baseline, state and federal supervisors could develop a nondiscretionary allocation formula that would reflect not only the breadth of responsibilities of the agencies, but the condition, risk profile, size, and operating environment of the banks they supervise. All agencies would remain free to impose supplemental assessments if they chose, but competitive pressures would presumably work to keep these charges at a minimum.
This arrangement would offer some meaningful advantages. First, it would remedy the inequity to national
banks that exists today, resulting from the fact that the FDIC funds the supervision of only one class of banks, state nonmember banks, out of the earnings of the deposit insurance funds, to which all banks have contributed. As I mentioned earlier, we estimate that national banks have accounted for more than half of the contributions to the Bank Insurance Fund.
Another major advantage to a system under which the OCC and the state supervisory agencies would be funded out of the earnings on the insurance funds is that it would reinvigorate the dual banking system. It would create a regulatory system under which banks choose their charters on the basis of factors such as regulatory philosophy, access, and the perceived quality of supervision. The result would be competition based on characteristics of supervisors that are relevant to maintaining a safe and sound banking system.
Conclusion
The OCC supports a merger of the BIF and the SAIF and proposals to eliminate the current constraints on deposit insurance premiums. We favor elimination of the current fixed DRR (designated reserve ratio) and its replacement with a range that would allow the FDIC more flexibility in administering the deposit insurance premium structure. We oppose an increase in deposit insurance coverage limits at this time. Finally, as the entire role of deposit insurance is being subjected to scrutiny by policymakers and legislators, it is an opportune time to address the distortions and unfairness in the current system of funding bank supervision that I have highlighted in my testimony today.
Quarterly Journal, Vol. 21, No. 3, September 2002 37
Remarks by John D. Hawke, Jr., Comptroller of the Currency, before the 38th Annual Conference on Bank Structure and Competition, on the growing consensus that fee disparity problem must be fixed, Chicago, Illinois, May 9, 2002
The independence of bank supervision is not likely to find its way on to the list of America’s great contributions to popular government. But given what we increasingly know about the vital role that independent supervision plays in maintaining financial stability, it may be time for a new list. The importance of supervisory independence— and what we must do to keep U.S. supervision effective and independent—are the subjects I’d like to discuss with you this afternoon.
Certainly the subject has a long history. In 1829, when New York State legislators created the nation’s first truly professional bank supervisory agency, they took steps to ensure that it would be able to operate free of political influences and pressures. So did the legislators who created the national banking system in the 1860s. They created the Office of the Comptroller of the Currency as a “separate bureau” within the Treasury Department. They provided the Comptroller with a five-year term and protections against premature removal from office. The first bill that passed Congress forbade the Comptroller’s removal except with the approval of the Senate—an extraordinary requirement. But in amended legislation, that “advice and consent” requirement was dropped— not because of second thoughts about the importance of protecting the Comptroller’s independence, but in recognition of the practical difficulty of reassembling a recessed Senate—in those days, the Senate was not in virtually continuous session, as it is today—to deal with a Comptroller whose conduct merited removal. Indeed, the Senate recognized “the force of the argument that [the Comptroller] ought to be in a great degree independent.”
Congress even contemplated moving the OCC to New York or Philadelphia, so the Comptroller would not have to contend with the bleating and pleading of the lobbyist crowd. And the founders of the national banking system expressed their commitment to supervisory independence when they chose to fund the examination of national banks from fees and assessments on the banks themselves, rather than entangling the OCC’s performance of bank supervision in the political give-and-take of the federal budget and appropriations process.
The legislative debate on the National Bank Act of 1864 may have been brief, but supervisory independence—and
how best to safeguard it—was central to it. And the authors of that legislation took great pride in the success they believed they had achieved in promoting it.
It’s important to note, moreover, that the independence of supervision is not simply an interesting bit of historical trivia. It has been reinforced repeatedly by Congress, even up to recent years. Within the past decade, for example, Congress has passed additional measures forbidding the Treasury Department from intervening in any matter or proceeding before the OCC, or from delaying or preventing the issuance of any rule or regulation by the OCC, and it has expressly permitted the agency to submit legislative recommendations and testimony to Congress without prior approval or review in the Executive Branch.
It’s also important to note that this is not an issue of purely domestic relevance. Experience in other countries, where the tradition of supervisory independence may be weak or nonexistent, reminds us that there’s a steep price to be paid when supervisors are unable or unwilling to conduct their business independently.
Indeed, the absence of supervisory independence has been implicated in almost every national financial crisis the world has recently seen. In Argentina, South Korea, Thailand, Japan, Turkey, and Indonesia, bank supervisors were unable to operate with the independence their responsibilities demanded. In each case, supervisors became instruments of government or central bank policies that subordinated the safety and soundness of financial institutions to other goals. In each case, banks were permitted—or even encouraged—to make loans in defiance of good credit practices in order to promote certain policy objectives, such as protecting inefficient industries. Moreover, in each case, the result was the same: supervision was discredited; the condition of the banking system deteriorated; the national economy suffered; and the process of recovery was seriously impeded by a crippled banking system. Some countries are still struggling with the consequences of such ill-advised supervisory policies.
These experiences help explain why, when the Basel Committee on Banking Supervision adopted its core principles for effective supervision in 1997, “operational
38 Quarterly Journal, Vol. 21, No. 3, September 2002

independence and adequate resources” headed the list. And the experiences of other countries remind us of the importance of vigilance in defending supervisory independence here at home.
Supervisory independence in this country has also seen its share of challenges. During the Great Depression of the 1930s, for example, there was strong sentiment that federal bank supervisors should align themselves behind the monetary and macroeconomic policies of the Treasury Department and the Federal Reserve. Many people thought that the Comptroller of the Currency should encourage national banks to make loans to good borrowers and bad borrowers alike, and to look the other way as credit quality deteriorated. This view was frequently expressed in terms of countercyclicality—that bank examiners ought to promote the cause of growth and easy credit when the economy was in a slump and enforce credit restraint when the economy was in danger of overheating.
Fortunately, the firewalls erected by Congress in the 1860s and buttressed over the years thereafter held strong during the banking crisis of the Great Depression. The OCC was able to continue supervising national banks objectively and independently, and the banking system subsequently regained its strength.
That experience was not lost on a generation of bank supervisors, who came away convinced that combining monetary policy and supervision would undermine both. For people like J.L. Robertson, who served as a bank supervisor for 30 years, first as a deputy comptroller of the currency and then as a governor of the Federal Reserve System, it became an article of faith that “bank examiners should never be obliged to switch from rose-colored glasses to black ones, and bank and forth again, in an effort to implement the monetary policy of the moment.”
However, the notion that federal bank examiners might be pressed into service of some larger political or economic agenda lived on—and it lives on today, after a fashion. For evidence one need look no further than the introduction to our own conference program, where, sure enough, you’ll find the question whether “regulation and supervision [should] attempt to smooth the business cycle” on the list of current supervisory issues.
I believe it’s a matter of considerable significance, however, that while we may still debate the idea of using bank supervision as a macroeconomic tool in forums like this one, the question has essentially been laid to rest in government circles. Indeed, it has never come up in any official discussion in which I have participated,
either as Under Secretary of the Treasury for Domestic Finance or as Comptroller of the Currency. The statutory constraints that limit the ability of Treasury to become involved in matters at the OCC have been well understood and scrupulously respected during my experience in the Department. As a practical matter, I believe, the principle of operational independence for bank supervisors in this country is no longer open to question.
There’s another dimension of supervisory independence— independence from the institutions we supervise. In this regard, the chartering and regulatory choices available to U.S. banks—the dual banking system and the tripartite division of federal regulatory responsibility—create certain tensions. The problem was highlighted over 30 years ago by Federal Reserve Chairman Arthur Burns, who decried what he saw as a dangerous “competition in laxity,” not only between state and national bank supervisors, but among the various federal regulators as well, each having an incentive to pursue supervisory and regulatory strategies that would attract constituents to their particular jurisdictions.
In the game of regulatory competition, a gain to one supervisor usually means a loss to another, with varying consequences. While it is true, for example, that a wholesale exodus of banks away from the national charter could decimate the OCC, a threat equally if not more imposing might face the Federal Reserve System if there were to be a wholesale exodus away from state member status. In such an event the Federal Reserve Banks—already facing competitive pressures in other aspects of their operations—could face the need to downsize significantly their role in supervision. Not only would this have implications for the Fed’s monetary policy and discount window functions, but, as the Reserve Banks were forced to shrink and become less substantial participants in the financial system, it would have implications for an important foundation stone of the Fed’s independence.
We have been willing for many years, in the name of federalism, to accept whatever implications the mere existence of the dual banking system might have for supervisory independence, and I am a supporter of the dual system. But there is an aspect of the dual system—the way in which the costs of supervision are allocated—that presents an even greater threat to the independence of bank supervisors than dual banking in and of itself—a threat that has disproportionately serious implications for the OCC.
No one would ever accuse the United States of not taking literally the Basel principle that bank supervisors should
Quarterly Journal, Vol. 21, No. 3, September 2002 39

have adequate resources at their disposal. In 2001, the total of supervisory expenditures in this country amounted to nearly two billion dollars—a substantial sum by any standard. That covers the supervisory expenses of the OCC (for national banks), the Federal Reserve (for bank holding companies and state member banks), and FDIC (for state nonmembers), as well as the expenses of the 50 state banking authorities.
It’s how we raise and allocate that vast sum that introduces irrationality into our system, that potentially undermines its safety and soundness, and that destabilizes our dual banking system. There’s nothing terribly complicated about it. National banks must bear the entire cost of their supervision, in the form of assessments paid to the OCC. State banks, by contrast, receive the federal portion of their supervision—far and away the largest component of state bank supervision—at no cost.
To be sure, state banks pay relatively modest fees to their state supervisors, reflecting the comparatively modest role that many states play in the supervision of federally insured state banks, compared to the pervasive roles played by the Fed and the FDIC. As a consequence, national banks pay on average two and a quarter times more in supervisory fees than do state banks. While national banks fully shoulder their costs of supervision, state banks pay only about 22 percent of the costs of their supervision.
That’s not all. National banks actually subsidize the supervision of their state-chartered competitors. The FDIC draws on the insurance fund to cover the expenses of supervising state nonmember banks, yet 55 percent of the balance in the fund reflects insurance premiums paid by national banks. Thus, 55 percent of the subsidy that the FDIC affords state banks by absorbing their cost of supervision is, in effect, provided by national banks. A similar subsidy is delivered by the Federal Reserve to state member banks, since the costs of Fed supervision are not passed on to the banks they supervise. In this case, however, it is taxpayers that bear the cost of the subsidy, since the funds that the Federal Reserve draws on to absorb the costs of supervision would otherwise be returned to the Treasury.
Operating in tandem, the freedom that banks have to choose a state or national charter and to choose their federal regulator, and the disparity in the allocation of the costs of supervision caused by the federal subsidization of state banks, create a system in which financial institutions have a potential influence in their relationships with their supervisors.
This influence can be exercised overtly or tacitly—and, I hasten to say, it is not an influence that may be directed only at the OCC. Fee disparity simply becomes a cost factor for banks to weigh in the balance. If a bank feels “oppressed” by the OCC to the point that the combined cost of the higher fees and the supervisory “oppression” outweigh the advantages of the national charter, the bank has an incentive to convert. By the same token, if a state bank feels “oppressed,” either because state law or its federal regulator limits its flexibility to conduct its business in the manner it desires, the incremental cost of higher assessments might be outweighed by the appeal of the national charter.
Fee disparity can have a particularly insidious impact on the OCC, however, because, unlike our self-funded sister agencies, we must tax our bankers to maintain our agency. Thus, to the extent fee disparity encourages conversions to state charter, there is a direct impact on the OCC’s budget. In times of severe stress in the economy, this impact could have serious consequences. As a deteriorating economy translated into increased problems for banks, supervisors would be confronted with the need to expand their resources to cope with worsening conditions. At the OCC this would likely create a need for increased assessments—with a commensurate increase in the financial burden on national banks. Those national banks in the best condition, facing the prospect of larger assessments needed to deal with problem institutions, would thus have a strong incentive to convert to the subsidized state charter, leaving a diminishing number of national banks to bear the costs of an increasing OCC workload. And of course such conversions do not change at all the systemic costs of supervision, since the agencies assuming jurisdiction must pick up the costs of expanding their own supervisory resources to deal with the converted banks. Conversions thus simply transfer those costs from the national banks to either taxpayers generally or to all insured banks. The implications for the independence of the OCC in such a scenario are self-evident, I believe.
I’m encouraged to see that there’s a growing understanding of these issues, and a consensus that the problems I’ve been discussing are problems that must be fixed. The question, of course, is how we should do that. Any solution we propose must meet several basic criteria. First and foremost, it should protect and preserve the independence of bank supervisors. It must also make our system of supervisory funding fairer, more secure, and more predictable. National banks should not be forced to subsidize their state-chartered competitors and taxpayers should not be expected to defray the cost of supervising one favored class of banks, as is now the case with state
40 Quarterly Journal, Vol. 21, No. 3, September 2002

member banks that receive free supervision from the Federal Reserve.
Both state supervisors and the OCC must be freed from the uncertainty that currently surrounds their funding. At present, we are subject not only to fluctuations in the economy, but to changes in the structure of the banking system. Declining on-balance sheet assets mean declining revenues. And industry consolidation means an increasing reliance on a shrinking number of institutions. In half the states, a single bank accounts for 25 percent or more of the asset base on which state supervisors assess fees. The loss of such a large bank, through either failure or conversion, could have a crippling effect on a state supervisor’s ability to provide quality supervision. Of course, the OCC could find itself in the same fix.
One suggestion made recently was that the OCC’s funding concerns should be addressed through the use of appropriated funds. But if this means subjecting the supervision of national banks to the budget and appropriations process, it would clearly be a step in the wrong direction.
As I described earlier, since the very inception of the national banking system Congress has scrupulously insulated bank supervision from the political process— just as it has the formulation and execution of monetary policy. Injecting political considerations into supervision through the appropriations process would clearly run the risk of bringing to bear pressures that could undermine the objectivity and integrity of the critically important work that supervisors perform, and would make the direction and strength of supervision subject to the varying priorities of partisan politics. That would be no more desirable in the area of bank supervision than in respect of monetary policy.
Certainly, if there were any serious case for subjecting bank supervision to the kind of political oversight involved in the budget and appropriations process—and I see none whatsoever—it would be impossible to rationalize treating only national banks in this fashion, while leaving federal supervision of state banks to be self-funded through the use of the Federal Reserve’s earnings and the FDIC insurance fund, with no outside oversight whatsoever.
Of course, the funding of supervision could be rationalized in the context of legislation reforming the entire structure of federal supervision of financial institutions—a challenge that has repeatedly been taken up over the past three or four decades. Experience in the United Kingdom and other
countries that have altered their supervisory structures suggests that serious structural change is not an impossible goal. Nonetheless, past efforts in the United States have foundered for at least four reasons:
• First, the states have always felt that if there were a monolithic federal regulator for all banks, the attractiveness of the state charter would diminish. Now state banks can choose between the Fed and the FDIC as their federal regulator, or they can choose to go to a national charter. Those options would be lost under any proposal that sought to unify supervision.
• Second, a key element of past proposals has generally been to take the Fed out of bank supervision. This aspect of restructuring has had to confront two major objections: the explicit objection that removing the Fed from supervision would deprive it of a “window into the banking system,” and thus impair its effectiveness in implementing monetary policy; and the implicit objection that taking the Fed out of supervision would decimate the Reserve Banks and thus undermine an important pillar of the Fed’s independence.
• Third, there has never been any appreciable public constituency for such change. The banking industry and other interest groups have learned to live with—and take advantage of—the existing system, and they have not been anxious to change things. One does not even hear a clamor from public interest or consumer groups for such change.
• Finally, as illogical as it might be, the present system works pretty well, and enhanced cooperation and coordination in recent years has made it work even better.
While the challenge of addressing the funding problem in the context of regulatory restructuring is a formidable one, there are alternative approaches that should be considered—measured steps targeted to the problem that would avoid the difficulties presented by more far-reaching proposals to dismantle and reassemble the current supervisory structure.
I have proposed that we replace the system under which the OCC and state supervisors fund themselves through direct assessments, with a system that would draw on the earnings of the insurance fund. Such an approach would have multiple advantages:
• First, it would be supremely logical. After all, protection of the insurance fund is a major purpose of
Quarterly Journal, Vol. 21, No. 3, September 2002 41

bank supervision. Charging the costs of supervision to the fund would place supervision on a sounder and fairer footing, relieving national banks of the unique and discriminatory burden of directly funding the costs of their own supervision—and of the grossly unfair burden of subsidizing the cost of supervision of their state bank competitors.
• Second, it would promote the equitable and efficient allocation of the costs and benefits of deposit insurance, and ensure that all supervisors have the resources necessary to provide effective bank supervision, regardless of changes in the economy or the structure of the banking system.
• Finally, it would revitalize the dual banking system by eliminating the distorting effects of a selective subsidy, while retaining the element of charter choice that has long been its hallmark.
Under our proposal, federal and state agencies would jointly formulate an allocation formula initially calibrated to provide the OCC and state agencies with resources equivalent to their current levels. This “baseline” allocation would be adjusted annually under the formula to take account of changes in the composition and condition of each agency’s constituent banks, so that allocations from the fund would be automatic and nondiscretionary. The great benefit of this proposal is that it would significantly reduce, if not eliminate, reliance on the federal subsidy to state banks as a major determinant of charter choice. Banks would then make charter decisions based on such considerations as the quality of supervision and the suitability of the charter for their business objectives—a far healthier environment for the dual banking system than at present. It would provide the basis for restoration of salutary competition among the regulators—a “competition in excellence,” that would restore the focus to the qualitative aspects of charter choice, rather than competition based on subsidized pricing.
There are some who believe that the national charter is so far superior to the state charter that an equitable allocation of the costs of supervision would result in a massive outflow of banks from state systems, and on this ground they oppose our suggested solution. But while I bow to no one in my enthusiasm for the national charter, the state charter has significant attributes of its own. Many states have been very innovative in granting powers to their banks that national banks do not yet have, and many states have adopted “wild card” laws that allow their banks to exercise many powers permissible for national banks.
No comparable “reverse wild card” law affords reciprocal benefits for national banks. In the area of interstate branching, state supervisors have been very resourceful in reducing the burdens of duplicative regulation on banks operating in multiple states, and Congress has enacted “equalization” provisions giving state banks with interstate branches many of the benefits that national banks have in that connection.
Whatever one’s view might be of the relative merits of the two charters, however, I think it’s fair to say that the state charter is not in such a state of decrepitude that it needs almost a billion dollars a year in federal subsidies to shore it up—particularly subsidies that are delivered not pursuant to congressional mandate, but through the discretionary decisions of those federal regulators who have a self-interest in maintaining these banks as their constituents. If, indeed, an elimination of these subsidies would result in a major outflow of state banks to the national charter, we should all be alarmed, and we should focus on more fundamental concerns about state systems. Similarly, maintenance of a subsidy that is intended to protect the role of the Federal Reserve Banks in supervision diverts attention from what may be more significant structural issues in the Federal Reserve System. If there is reason to have such concerns, we should address them more forthrightly, and we should not obscure them with subsidy practices that have the purpose or effect of maintaining a particular regulatory share of market.
But I do not for a minute think that elimination of the subsidy would cause an exodus of state banks. Supervisory costs are naturally a concern for all banks, but I don’t believe that major banking organizations make their charter choice simply on the basis of supervisory fees. I see no reason, to put a somewhat finer point on it, why the Federal Reserve should be concerned that its perfectly legitimate interest in being meaningfully involved with the banking system would be undermined if the discriminatory cost burden now borne by national banks were eliminated.
When we began to talk about the fee disparity issue in public nearly two years ago, it was the target of a fair amount of derision. Predictably, those who derided it most were many of the same people who were benefiting most from the subsidies I’ve been discussing.
Now I think it’s widely acknowledged that we do need to revisit the way we fund bank supervision. But the changes needn’t—and shouldn’t—be radical ones. Ungainly though it is, our system of supervision has been
42 Quarterly Journal, Vol. 21, No. 3, September 2002

too successful to scuttle. Indeed, our goal should be to I believe that the proposal I have sketched today meets strengthen our supervisory system by preserving and that standard. I commend it to your attention—and look enhancing independence. forward to continuing the dialogue well under way with
everyone who has a stake in the issue.
Quarterly Journal, Vol. 21, No. 3, September 2002 43

Remarks by Julie L. Williams, First Senior Deputy Comptroller and Chief Counsel, before the Local Initiatives Support Corporation annual staff conference, on the beneficial relationships between banks and community development corporations, Cleveland, Ohio, April 10, 2002
Thank you very much for inviting me to address Local Initiatives Support Corporation’s (LISC’s) national staff conference. I am honored to be here and I am delighted to have the opportunity to talk about the important role of community development corporations today, particularly the mutually beneficial relationships being forged between banks and community development corporations (CDCs). LISC has been instrumental in structuring many of these relationships, which hold great promise for economic revitalization of communities across the country. And I particularly want to congratulate all of you here today for the enormously important—and sometimes unrecognized—work that each of you do to foster community revitalization. You give hope to individuals who have been left on the shore of our economic mainstream.
Also, before I begin, I want to again thank Michael Rubinger, Buzz Roberts, and Oramenta Newsome for organizing a fascinating community development tour for Comptroller of the Currency Jerry Hawke, myself, and other OCC staff in Washington, D.C., in October 2000. On many occasions after that, we have reflected on, and spoken about, what we learned during that tour.
I don’t have to tell you that LISC has long been a leader in the community development field. If only for its national scope and for the resources it brings to bear, LISC exerts much influence over the efforts of numerous community development corporations—CDCs—operating at the local level. But even more than these formidable assets, LISC’s professional standards, expertise, and its day-to-day operating policies and practices are examples that local CDCs emulate and rely upon.
I thought it would be timely to discuss three topics with you today. First, since I am, after all, a bank regulator, I will review some perspectives on the mutually beneficial relationships that banks have developed with CDCs. Second, I will discuss some of the challenges we see CDCs facing in their relationships with banks, especially with regard to performance measures for the industry. Finally, I’ll offer some thoughts about the new initiatives that CDCs and banks may be able to develop, such as through the New Markets Tax Credit Program.
Bank and CDC Partnerships
Over the past several years, we have seen a significant increase in the level of bank involvement with CDCs. The National Community Capital Association reports that bank investments as a proportion of CDFI-borrowed capital dollars more than doubled from 12 percent to 25 percent between 1994 and 2000. We at the OCC haveseen large increases in bank investments under our Part 24 community development investment authority, which allows national banks to make equity investments in CDCs, community development projects, and other public welfare activities. National banks made more than $5 billion of Part 24 investments since 1995, almost 10 times more than the amount invested during the previous 30 years since Part 24 was established.
Much of this growth has occurred through bank investments in Low Income Housing Tax Credit projects with nonprofit sponsors, such as those planned and assisted by many of you here today. LISC has an impressive track record in this area, having raised some $3 billion in Housing Tax Credit investments—over three quarters of which has come from banks.
Banks have found that these types of investments and their relationships with CDCs can dramatically further their own ability to provide a presence in targeted segments of their markets, especially segments in which banks are underrepresented. Working with CDCs, banks find lending opportunities in these areas and bring needed capital to small business expansion, affordable housing development, and social services facilities. CDCs can help evaluate the repayment ability of the borrowers and also leverage bank investments with public and philanthropic funding in order to assemble the funding mix needed for these projects. Because of their mission, CDCs provide the resources and personnel to do the necessary work to make these projects work. In fact, CDCs often bring “the deal” to the bank.
In 2000, the OCC issued the results of a survey aimed at determining the practices that contribute to banks’community development success in the housing and small business sectors. We found that community development
44 Quarterly Journal, Vol. 21, No. 3, September 2002

efforts are most likely to succeed when they are supported by multi-pronged partnerships of local governments, community organizations, philanthropic and religious groups, businesses, and other relevant stakeholders in the community.
Driving factors for bank participation exist when a CDC partner does an effective job of screening deals to bring good ones to the table, and when the CDC works with potential borrowers to devise business plans and credit proposals that meet banks’ underwriting requirements. This helps banks reduce transaction costs and allows the bank to deploy its own personnel and resources in the most effective manner.
Our study also found that CDCs often play a key role, not only as project managers, but also as intermediaries and facilitators, making them valuable partners for banks. For example, many CDCs provide basic financial literacy education that can help the unbanked build relationships with traditional financial institutions. CDCs have been particularly effective at tailoring these educational programs to the needs and interests of specific groups within their communities. CDCs also provide pre- and post-purchase counseling for homebuyers. This counseling may be the best way to minimize default risk, or, quite simply, keep people in their homes. CDCs provide similar counseling to entrepreneurs who have taken out loans to start or expand a small business.
In addition to the project management role which CDCs play in many affordable housing developments financed by Low-Income Housing Tax Credits, CDCs increasingly also provide a range of social services for residents including day care, after-school programs, and job training resources. These services help enable residents of these developments to find an affordable place to live and provide support mechanisms to help them find ways to increase their income. This can increase the likelihood for success of affordable multifamily developments in certain markets.
Of course, the ability of CDCs to pull together complex financing packages, with funding from a number of third-party sources, is legendary. This skill is especially appreciated by small and mid-size banks that may have less experience with the complexities of community development financing. And even the largest banks recognize the benefit of the specialized expertise that CDCs can bring to structuring the multi-part financing packages that some projects require. As a result of this technical financing knowledge, CDCs can find new opportunities for banks to participate in projects, either
as lenders or investors, that banks would not have been able to arrange on their own. By designing innovative financing structures, CDCs are able to involve banks in funding projects such as shopping centers, charter schools, small business incubators, or commercial office space. Banks are able to participate in capacities that make sense for them from a business and community reinvestment perspective, local community development needs are served, and, by improving the local environment and economy, banks may gain new customers and new markets.
Challenges in a Changing Economic Landscape
Yet, today the community development industry faces important challenges that arise from changes in the broader environment in which they operate. Among these changes are the shrinking and consolidation of the banking industry. Many CDCs have come to depend a great deal on banks for operating funding as well as for loans and investments, but its seems inevitable that in the future CDCs will have fewer banks to rely on for funding. Moreover, in economic downturns, as profit margins are squeezed, at least some of those remaining banks will be forced to trim their community development grant budgets. These factors bear directly on the future health of the CDC industry.
On the other hand, the federal government is changing its funding strategies in ways that favor continuing support for CDCs. Federal set-asides for nonprofits in HOME (HOME Investment Partnerships Program) funding and Low-Income Housing Tax Credits, for example, provide critical operating and project support to CDCs. And the New Markets Tax Credit is likely to spur the development of more Community Development Entities. Indeed, the authorizing legislation calls for their creation. But none of these federal programs is designed to be the sole source of funding for CDCs. All leverage private money, which frequently comes from banks. This leads to some thoughts on factors that banks are likely to view as significant as they evaluate potential CDC relationships.
Evaluating CDCs
In a landscape where there may be fewer private sector investors to turn to, the CDCs with the soundest fundamental elements are the ones most likely to survive and to continue developing fruitful community development partnerships. Quantifying the soundness of a particular CDC is already an exercise many banks undertake when evaluating their CDC partnerships. As the supervisor of national banks that lend to and invest
Quarterly Journal, Vol. 21, No. 3, September 2002 45

in these entities, we have an interest in mechanisms and initiatives that enhance the performance of CDCs and enable banks to evaluate CDCs’ performance.
The primary mission of my agency, the OCC, is to ensure a safe, sound, and competitive banking system that supports the citizens, communities, and economy of the United States. There are many facets of what bank supervision encompasses, but at its core, effective oversight of banks has to rely in large measure on the ability of banks themselves to establish effective systems for monitoring the risks and returns associated with their various lines of business. For example, we mandate that banks develop systems to monitor the quality of their loans. So, regardless of the line of business—from traditional lending to the most sophisticated capital markets activities—we make it clear to the banks we supervise that they must have systems and controls in place, appropriate to the size and complexity of their business, that enable them to monitor, measure and manage their activities.
The ground rules are no different for banks’ partnerships with CDCs. Banks need information to be able to monitor, measure, and manage their loans to and investments in CDCs. Loans should be repaid, investments should generate returns, and grants should improve conditions in the markets in which the bank operates. We ask our banks to perform due diligence on all their investments, including ones in CDCs, because we want our banks to achieve successful results in their community development activities, just as in their other endeavors.
Banks can assess potential partnerships with CDCs more easily when the CDCs themselves have already instituted performance standards and measures. I recognize that measuring results is a challenge in many industries, and this is particularly true for CDCs. The traditional measures of dollars invested and units of housing built provide some sense of a CDC’s capacity, but further measures are needed for investors to assess, for example, how well CDCs manage themselves and how their work affects the quality of life in their communities. Banks need to know that sound fundamentals back their business decisions—and investments in CDCs are not an exception to that rule. When you consider that a Housing Tax Credit investment normally remains on the bank’s books for 15 years, banks need to be confident that their CDC partners have the staying power to manage the asset through to maturity.
It is those CDCs who have sound fundamental operating procedures, who have proven themselves to be insightful
managers of their internal organizations as well as their external products and services, that will be sought out by banks. So, what are some of the “sound fundamental elements” that intermediaries such as LISC can help promote?
• Demonstrable results. Measurable outcomes and careful tracking allow CDC boards and management to make decisions about which programs to pursue and what changes to make, and it allows them to assess the success of the CDC’s overall efforts. These same measures help successful CDCs communicate their accomplishments to their financial institution partners, funders, policymakers, and to the public at large. This is particularly important to banks and thrifts, which must demonstrate to their regulators how CDC activities they have financed serve the needs of communities within their assessment areas under CRA. CDCs that are able to assemble geographic, income, and demographic data regarding the beneficiaries of their activities can provide bank partners with the information that bank regulators need to review as part of CRA compliance examinations. To the extent that this helps banks document their CRA performance, the more likely that CDCs that can provide such information will be sought after by additional banking industry partners.
• Sound financial management. On the most basic level, CDCs must have accurate and timely financial information and effective financial management systems that will allow boards of directors and management to make sound, well-informed decisions. CDCs manage important, often scarce, resources in low-income communities. Careful stewardship of these resources is a public trust.
• Talented staff. The effectiveness of CDCs depends in great part on their staffs. Many talented people who come to the community development field do so because they are committed to the mission of CDCs. Planning for the succession of these talented and accomplished people ought to be high on the priority lists of CDCs and their boards of directors.
• Watchful, thoughtful boards of directors. Whether it be a bank or CDC, organizations involved with the complexities of community and real estate development need boards of directors embodying a diversity of talent and points of view—and enough relevant expertise to effectively serve their function as overseers of the organization’s management. And while continuity among board members provides needed stability to
46 Quarterly Journal, Vol. 21, No. 3, September 2002

such an organization, continuity must be leavened with periodic infusions of new blood to bring in new energy and new ideas.
• Operational integrity. CDC managers and directors owe duties of care and loyalty to the organization they serve—just as do managers and directors of banks. This means they must undertake their functions with care and diligence and execute their duties with undivided loyalty to the interests of their organization. In practice, CDCs should have written policies, which are carefully monitored, covering potential trouble areas such as conflicts of interest, board member compensation, and hiring or contracting with relatives. These policies help to ensure that the organization is not inappropriately used by the employees or directors as a source of private gain. Failure to comply with duties of care and loyalty can result in unfavorable consequences ranging from negative news reports, to financial penalties under recently enacted tax laws, and could even jeopardize an organization’s federal tax exemption. The good name and reputation of any nonprofit organization is a priceless asset, on which its future may hinge. It should be safeguarded with the same vigor as the organization’s financial assets.
A challenge facing the CDC industry is for more CDCs to systematically incorporate the fundamentals I have just described in their planning and operations. In this regard, the work of the National Community Development Initiative (NCDI) to promote capacity building and accountability within the CDC industry has advanced the industry significantly. As you know, NCDI combines the funding of corporations, foundations, and the Department of Housing and Urban Development and channels these monies to LISC and the Enterprise Foundation to leverage CDC activities at the local level. LISC makes these funds available through its Operating Support Collaboratives, which provide financial support for capacity building, strategy development, technical assistance, and training. The Operating Support Collaboratives also help the CDCs identify organizational strengths and weaknesses, and the receipt of these monies are usually made contingent upon the CDC’s achievement of mutually agreed-upon performance objectives.
In 1998, the Urban Institute studied the activities of CDCs in the 23 cities participating in the NCDI and found CDC capacity growing strongly by a number of measures. Capacity is important to investors because it enables CDCs to have a greater impact, thereby generating greater return on their investments. The number of CDCs capable of producing more than 10 housing units per year grew
from 104 in 1991 to 184 in 1997. The study also found that the NCDI helped produce a 45 percent increase in the number of “top tier” CDCs with consistent production records, strong internal management, and diverse funding sources.
The Urban Institute cited the clear articulation of performance standards as a key driver of the NCDI’s success. Naturally, performance standards backed by a track record of results create a degree of comfort for banking partners and their regulators. NCDI and LISC’s Operating Support Collaboratives do not automatically fund every CDC nor allow the funding to be seen as an entitlement. Funding is not renewed to organizations that do not show progress in meeting standards, and disbursement of funds can be held until CDCs are able to show progress in key areas. Because of the program’s effectiveness, LISC and Enterprise have been able to raise more than $350 million from foundations, banks, corporations, and the federal government under the National Community Development Initiative over the past 11 years.
I understand that through LISC’s capacity-building work with the Operating Support Collaboratives, you have developed a new CDC performance assessment tool— CapMap—a capacity mapping approach that is being rolled-out at this conference. CapMap has been designed to help CDCs create and track measures of success and also plan for growth based on their operating capabilities. I am particularly intrigued by the prospects for this tool that would allow for a more consistent set of criteria to be used in assessing capacity of CDCs across the country on critical success factors. CapMap will be a true success if it can help a CDC more clearly chart its current stage of organizational capacity and what milestones it must achieve to realistically undertake further growth.
New Initiatives
So what does the future hold for the continued relationships between banks and CDCs? I am probably preaching to the choir when I say that I believe the next frontier lies in the extension of the successful partnerships we have seen in using housing tax credits to ones that will use the New Markets Tax Credit. You can successfully build homes and apartments in distressed communities, but if you are not able to change the surrounding neighborhood, your efforts will have fallen short.
As the Low Income Housing Tax Credit addressed the equity gap needed to develop affordable housing, we hope the New Markets Tax Credit will encourage capital to flow
Quarterly Journal, Vol. 21, No. 3, September 2002 47

to businesses and other ventures in low-income areas. The New Markets Tax Credit will provide $15 billion over the next six years to promote investment in low-income areas, by allocating tax credits in support of for-profit enterprise development in low-income communities. Over the life of a seven-year investment, investors will be able to realize a tax credit equal to 39 percent of the amount that they have invested. To be eligible for an allocation of tax credits, an entity must obtain certification as a Community Development Entity (CDE) from the Department of the Treasury’s CDFI Fund. The certification process entails providing a clear explanation of its business plan for making investments in targeted communities. By increasing their capital base, this tax credit will enable CDEs to lend and invest more, to attract additional outside capital, and to bring even more private-sector engagement to their market-priming activities.
The CDFI Fund has reported that it hopes to determine the awarding of allocations by the close of this calendar year. From our initial discussions with banks, many intend to be
investors in New Markets Tax Credits. I hope to see LISC and its affiliates as active users of this new investment tool.
Conclusion
Today I’ve discussed the types of productive partnerships that CDCs and banks have established, shared some thoughts on challenges facing the CDC industry in order to continue its effectiveness in the years ahead, and I’ve described the potential that the New Markets Tax Credits provide. While most of the work that will determine continued success will occur at the individual CDC level, intermediaries such as LISC are playing a crucial role in maximizing the impact of bank/CDC partnerships in our communities. Your work is important not only through funding CDCs, but also by your efforts providing information and promoting best practices that are building a solid base for success for CDCs in the future.
Thank you, and I truly look forward to seeing more of the fruits of your good work.
48 Quarterly Journal, Vol. 21, No. 3, September 2002

Interpretations—April 1 to June 30, 2002
Page
Interpretive Letters . . . . . . . . . . . . . . . . . . . . . . . . . . . . . . . . . . . . . . . . . . . . . . . . . . . . . . . . . . . . . . . . . . . . . . . . . 49
Laws Letter No. Page
12 USC 24(7) . . . . . . . . . . . . . . . . . . . . . . . . . . . . . . . . . . . . . . . . . . . . . . . . . . . . . . . . . . . . . . . . . . . . . . . . 931 54
. . . . . . . . . . . . . . . . . . . . . . . . . . . . . . . . . . . . . . . . . . . . . . . . . . . . . . . . . . . . . . . . . . . . . . . . 932 55
. . . . . . . . . . . . . . . . . . . . . . . . . . . . . . . . . . . . . . . . . . . . . . . . . . . . . . . . . . . . . . . . . . . . . . . . 933 58
. . . . . . . . . . . . . . . . . . . . . . . . . . . . . . . . . . . . . . . . . . . . . . . . . . . . . . . . . . . . . . . . . . . . . . . . 934 62
. . . . . . . . . . . . . . . . . . . . . . . . . . . . . . . . . . . . . . . . . . . . . . . . . . . . . . . . . . . . . . . . . . . . . . . . 935 65
. . . . . . . . . . . . . . . . . . . . . . . . . . . . . . . . . . . . . . . . . . . . . . . . . . . . . . . . . . . . . . . . . . . . . . . . 937 69
Regulations
12 CFR 1 . . . . . . . . . . . . . . . . . . . . . . . . . . . . . . . . . . . . . . . . . . . . . . . . . . . . . . . . . . . . . . . . . . . . . . . . . . . . 930 51
12 CFR 7.4002(a) and (b) . . . . . . . . . . . . . . . . . . . . . . . . . . . . . . . . . . . . . . . . . . . . . . . . . . . . . . . . . . . . . . . 932 55
. . . . . . . . . . . . . . . . . . . . . . . . . . . . . . . . . . . . . . . . . . . . . . . . . . . . . . . . . . . . . . . 933 58
. . . . . . . . . . . . . . . . . . . . . . . . . . . . . . . . . . . . . . . . . . . . . . . . . . . . . . . . . . . . . . . 934 62
12 CFR 9.18 . . . . . . . . . . . . . . . . . . . . . . . . . . . . . . . . . . . . . . . . . . . . . . . . . . . . . . . . . . . . . . . . . . . . . . . . . 936 67
Subjects
Permissibility of purchasing bonds convertible into equity . . . . . . . . . . . . . . . . . . . . . . . . . . . . . . . . . . . . . 930 51
Permissibility of investing in perpetual preferred stock . . . . . . . . . . . . . . . . . . . . . . . . . . . . . . . . . . . . . . . 931 54
Permissibility of non-relationship customer check cashing fees . . . . . . . . . . . . . . . . . . . . . . . . . . . . . . . . . 932 55
Permissibility of non-accountholder check cashing fees . . . . . . . . . . . . . . . . . . . . . . . . . . . . . . . . . . . . . . . 933 58
Permissibility of non-accountholder check cashing fees . . . . . . . . . . . . . . . . . . . . . . . . . . . . . . . . . . . . . . . 934 62
Permissibility of holding securities for hedging purposes . . . . . . . . . . . . . . . . . . . . . . . . . . . . . . . . . . . . . . 935 65
Permissibility of operations of a collective investment fund . . . . . . . . . . . . . . . . . . . . . . . . . . . . . . . . . . . . 936 67
Permissibility of engaging in financial intermediation transactions . . . . . . . . . . . . . . . . . . . . . . . . . . . . . . . 937 69
Quarterly Journal, Vol. 21, No. 3, September 2002 49

Interpretive Letters
930—March 11, 2002
12 CFR 1
Subject: Legal Permissibility of Purchasing Bonds Convertible into Equity
Dear [ ]:
This letter addresses whether the [State1] federal branch of [ ] (bank) legally purchased bonds convertible into equity. The purchase of the bonds was legally permissible under its Part 1 investment authority if the analysis the branch undertook at the time supported its conclusion that the bonds were the credit equivalent of investment grade and marketable, or if at the time it purchased the bonds, it underwrote them as loans in accordance with the standards of OCC Banking Circular 181.1 In either case, the branch’s examiner-in-charge (EIC) or the appropriate supervisory office must find the branch’s conclusion or analysis to be sufficient, as documented by the branch prior to the purchase.
I. Background
In September 2000, the bank and its [State1] and [State2] federal branches (the branches) engaged in three interrelated transactions: the purchase of bonds convertible into equity, an interest rate swap, and the sale of a call option on the bonds (collectively, the “transactions”). This letter focuses on the bond purchase made by the [State1] branch (branch).
A. The Transactions
The transactions comprise a callable asset swap. An asset swap is a synthetic structure that enables an investor to purchase a fixed rate bond and hedge the interest rate risk by swapping the fixed rate payments for floating rate payments using an interest rate swap. The swap converts the asset yield on the bonds from fixed to floating. The
1 The OCC requires banks to implement “satisfactory controls” over loans, including: [1] written lending policies and procedures governing those transactions; [2] an independent analysis of credit quality by the purchasing bank; [3] agreement by the obligor to make full credit information available to the selling bank; [4] agreement by the selling bank to provide available information on the obligor to the purchaser; and [5] written documentation of recourse arrangements outlining the rights and obligations of each party. OCC Banking Circular No. 181 (Rev.) (August 2, 1984) (BC–181).
sale of the call option enhances the yield. The asset swap is “callable” where, as here, the investor sells call options on the bond and the exercise of the options terminate the swap.
The callable asset swap is described in detail below.
(1) The Bonds
[SPV], a Special Purpose Vehicle, issued $550 million in seven-year Eurobonds, convertible after 12 months, at the option of the purchaser, into 8.708 million shares of [Co] stock (“[SPV] bonds”). The [SPV] bonds are Eurodollar bonds quoted daily in the market. The convertible [SPV] bonds bear a coupon rate of 4.75 percent. [Co2] wholly owns [SPV] and guarantees the outstanding principal and accrued interest on the bonds. The bank and the branches purchased $15 million of [SPV] bonds. The [SPV] bonds have embedded call options that give [SPV] the right to call the bonds. The bonds are not rated.
(2) The Interest Rate Swap
Simultaneously with the purchase of the [SPV] bonds, the bank and its branches entered into an interest rate swap with [Co3]. Under the interest rate swap, the bank and the branches pay [Co3] the fixed rate of 4.75 percent, the coupon rate of the bonds, semiannually. In return, [Co3] agreed to pay the bank a floating rate of LIBOR2
plus a spread of 165 basis points, quarterly. The swap terminates in seven years or when the [SPV] bonds are called by [SPV], or upon [Co3]’s exercise of call options it purchased from the bank and the branches (described below). The bank and the branches secured their obligations under the swap by pledging the [SPV] bonds to [Co3].
(3) The Call Options
The bank and the branches, in connection with the purchase of the [SPV] bonds and the interest rate swap, each sold a seven-year call option on the bonds to [Co3]. [Co3]’s exercise of the options entitles [Co3] to purchase all the [SPV] bonds purchased by the bank and its branches at a predetermined “strike price.” If the [SPV] bonds are called, exchanged or redeemed under the terms of the bonds, [Co3] is deemed to have exercised its call options and the swap terminates. Under the options’ terms,
2 “LIBOR” refers to the London Inter Bank Offered Rate, an interest rate that major international banks charge each other for large loans of dollars outside of the United States.
Quarterly Journal, Vol. 21, No. 3, September 2002 51

the bank and its branches are prohibited from converting the [SPV] bonds into [Co] stock while the transactions remain outstanding.
B. Analysis of the Transactions
As discussed in section II of this letter, a national bank may purchase debt securities as investment securities if the bonds are the credit equivalent of investment grade and marketable. The EIC must be satisfied that the information contained in the credit file demonstrates, at the time of the bond’s purchase, appropriate support for the branch to treat the bonds as the credit equivalent of investment grade and marketable.
Here, the bank and the branch analyzed the [SPV] bonds in connection with the interest rate asset swap and call option, prior to the purchase of the bonds.3 The bank and the branch approved the bond purchase based on [Co2]’s (the guarantor’s) bond guarantee,4 financial strength, and good market reputation and the convertibility of the [SPV] bonds into [Co] stock. Based on their financial review, the bank and the branches assigned the transactions an internal rating of 3, equivalent to a long term debt rating of “A,” prior to the purchase of the bonds. The bonds were also quoted daily in the market.
II. Applicable Law
A. Permissible Purchases of Debt Securities
National banks may purchase “investment securities” for their own account in an amount that generally may not exceed 10 percent of the bank’s capital and surplus.5
“Investment securities” are “marketable obligations, evidencing the indebtedness of any person, copartnership, association, or corporation in the form of bonds, notes and/or debentures, commonly known as ‘investment securities.’” An “investment security” is “a marketable
3 The bonds are not rated or registered under the federal securities laws. The bank and the branches considered the transactions as “parts of one single transaction.” Although the bank and the branches did a formal credit analysis on the issuer, they did not assign a credit rating on the bonds separate and apart from the interest rate swap they entered into with, and the call options they sold to, [Co3]. As a general matter, however, debt securities should be assigned their own separate rating.
4 [Co2] provides an irrevocable, unconditional, and unsubordinated guarantee for all amounts payable under the bonds.
5 12 USC 24(Seventh). The investment limitations in 12 CFR Part 1 based on the capital stock and surplus of a national bank, when applied to a federal branch or agency, refer to the dollar equivalent of the capital stock and surplus of the foreign bank, and all the business of the foreign bank and federal branches is aggregated in determining compliance with the limitation. See 12 USC 3102(b).
debt obligation that is not predominantly speculative in nature.”6
To qualify as a Type III security, a bond must be rated investment grade or, if not rated, the credit equivalent of investment grade, and marketable.7 “Investment grade” means a security that is rated in one of the four highest rating categories by two or more nationally recognized statistical rating organizations (NRSROs) or by one NRSRO if the security is rated only by one NRSRO.8 A security is the credit equivalent of a security rated investment grade if the bank, after a sufficient analysis, reaches that determination.9 A debt security is “marketable” if it can be sold with reasonable promptness at a price that corresponds reasonably to its fair value.10
A national bank may purchase a debt security as an investment security, even if the security does not qualify as a Type III security, based on the bank’s reliable estimates that the obligor will be able to satisfy its obligations under that security.11 If so, the “reliable estimates” provision allows a bank to invest in a below-investment-grade security or one not determined to be the credit equivalent of investment grade, if the bank satisfies itself that the securities may be sold with reasonable promptness at a price that corresponds reasonably to their fair value.12
National banks may purchase securities under the “reliable estimates” standard in an aggregate amount no greater than 5 percent of their capital and surplus.13 This limit applies against all securities in their portfolios acquired on the basis of reliable estimates, rather than on a per-issuer basis.14
Banks purchasing securities permitted under Part 1 must adhere to safe and sound banking practices and consider, as appropriate, interest rate, credit, liquidity, price, foreign exchange, transaction, compliance, strategic, and reputation risk the purchases present.15 Any investments must be appropriate for national banks.16
6 12 CFR 1.2(e). A security is not predominantly speculative in nature if it is rated investment grade. When a security is not rated, the security must be the credit equivalent of a security rated investment grade. Id.
7 See 12 CFR 1.2(e) and (f)(2). 8 See 12 CFR 1.2(d) and (h). 9 See OCC Interpretive Letter No. 912 (July 3, 2001), reprinted in [Current
Transfer Binder] Fed. Banking L. Rep. (CCH) ¶ 81–437. 10 See 12 CFR 1.2(f)(4). 11 See 12 CFR 1.3(i)(1). 12 Id. 13 See 12 CFR 1.3(i)(2).14 Id.15 See 12 CFR 1.5(a).16 Id.
52 Quarterly Journal, Vol. 21, No. 3, September 2002

Alternatively, a national bank may purchase and hold debt securities, including below-investment-grade securities, as loans under its general lending powers, consistent with safety and soundness considerations.17 National banks that purchase debt securities under their lending authority must comply with the lending limit restrictions in 12 USC 8418 and generally may not purchase them in an amount exceeding 15 percent of the bank’s capital and surplus.19
Bank purchasers also must adhere to the prudential standards of BC-181, to the extent applicable, including the requirement that they perform an independent credit analysis of the loans to satisfy themselves that the credits meet their own credit standards.20
III. Discussion
A. Determination of Credit Equivalent of Investment Grade and Marketable
To qualify as a Type III security, a bond must be rated investment grade or, if not rated, the credit equivalent of investment grade and marketable. The [SPV] bonds are not rated. Accordingly, the bank and its branches could only purchase the [SPV] bonds as Type III securities, subject to a 10 percent limitation, if, at the time of purchase, they determined the bonds were the credit equivalent of investment grade and marketable. The branch’s EIC or supervisory office must find the branch’s conclusion or analysis to be sufficient, as documented by the branch at the time of purchase. The subsequent sale of call options on the bonds by the bank and the branches would not affect a determination that the bonds were marketable.
17 See OCC Interpretive Letter No. 834 (July 8, 1998), reprinted in [1998 Transfer Binder] Fed. Banking L. Rep. (CCH) ¶ 81–288; OCC Interpretive Letter No. 833 (July 8, 1998), reprinted in [1998 Transfer Binder] Fed. Banking L. Rep. (CCH) ¶ 81–287; OCC Interpretive Letter No. 600 (July 31, 1992), reprinted in [1992–1993 Transfer Binder] Fed. Banking L. Rep. (CCH) ¶ 83,427; OCC Interpretive Letter No. 579 (March 24, 1992), reprinted in [1991–1992 Transfer Binder] Fed. Banking L. Rep. (CCH) ¶ 83,349; OCC Interpretive Letter No. 182 (March 10, 1981), reprinted in [1981–1982 Transfer Binder] Fed. Banking L. Rep. (CCH) ¶ 85,263.
18 The lending limits in 12 USC 84 based on the capital stock and surplus of a national bank, when applied to a federal branch or agency, refers to the dollar equivalent of the capital stock and surplus of the foreign bank, and all the business of the foreign bank and federal branches is aggregated in determining compliance with the limitation. See 12 USC 3102(b).
19 See OCC Interpretive Letter No. 834, supra; OCC Interpretive Letter No. 833, supra; OCC Interpretive Letter No. 579, supra.
20 See OCC Interpretive Letter No. 663 (June 8, 1995), reprinted in [1994– 1995 Transfer Binder] Fed. Banking L. Rep. (CCH) ¶ 83,611; OCC Interpretive Letter No. 579, supra.
B. The Debt Securities’ Conversion Feature is not Prohibited by Part 1
National banks generally may not purchase investment securities that are convertible into equity at the option of the issuer.21 However, a national bank may acquire convertible debt securities, provided that it disposes of the securities before the date the conversion option comes into effect.22 A national bank also may purchase debt securities convertible to equity securities at the bank’s option where the bank does not exercise the conversion feature.23
The branch would not be prohibited from holding the [SPV] bonds on the basis of the conversion feature because the conversion feature is in its control. Moreover, because the branch is prohibited from converting the bonds into equities under the callable asset swap, the convertibility of the bonds is not at issue.
C. The Bonds May be Purchased as Loans
The branch may rely on its lending authority to hold the bonds if it underwrote them as loans at the time of purchase, in accordance with the standards of BC-181. The branch’s EIC or appropriate supervisory office must find the branch’s conclusion or analysis under those standards to be sufficient, as documented by the branch at the time of purchase.
21 See 12 CFR 1.6.
22 OCC Interpretive Letter No. 359 (April 9, 1986), reprinted in [1985–1987 Transfer Binder] CCH ¶ 85,529; OCC Investment Securities Letter No. 55 (August 5, 1991), reprinted in [1991–1992 Transfer Binder] CCH ¶ 83,328.
23 If an option is not exercised, there is no conversion and no resultant equity holdings. The OCC similarly has permitted national banks to own real estate as principal in various contexts, notwithstanding the general prohibition in 12 USC 29 against banks owning real property. OCC Corporate Decision No. 99-07 (March 26, 1999) (ownership of real property interests as incidental to permitted financing transactions); OCC Conditional Approval Order No. 295 and OCC Corporate Decision No. 98-17 (March 23, 1998) (same); OCC Interpretive Letter No. 806 (October 17, 1997), reprinted in [1997–1998 Transfer Binder] Fed. Banking L. Rep. (CCH) ¶ 81,253 (ownership of real property in a net lease transaction that is a loan substitute for Islamic customer); 12 CFR 1.100(b) (municipal leases). In addition, the OCC has permitted national banks to own various types of personal property in order to engage in lease-financing activities. See 12 CFR 23.20; see also, Letter from Robert Herman, Deputy Comptroller (October 4, 1994) (unpublished) (ownership of an interest in trust that purchased hydrocarbon producer payments in connection with financing transaction). In all these contexts, the prohibitions otherwise applicable to ownership of these assets by a national bank as principal are not applicable because owning the asset is deemed necessary for the national bank to engage in a permissible banking activity or transaction.
Quarterly Journal, Vol. 21, No. 3, September 2002 53

IV. Conclusion
The branch’s purchase of the bonds was legally permissible under its Part 1 investment authority if the analysis the branch undertook at the time supported its conclusion that the bonds were the credit equivalent of investment grade and marketable, or if at the time it purchased the bonds, it underwrote them as loans in accordance with the standards of BC-181. In either case, the branch’s EIC or the appropriate supervisory office must find the branch’s conclusion or analysis to be sufficient, as documented by the branch at the time of purchase. The branch must clearly document in its credit files the authority it relies on to make debt acquisitions at the time of purchase.
I trust the foregoing is responsive to your inquiry. If you have additional questions, please do not hesitate to contact Tena M. Alexander, Special Counsel, Securities and Corporate Practices Division at (202) 874-5210.
Julie L. Williams First Senior Deputy Comptroller and Chief Counsel
931—March 15, 2002
12 USC 24(7)
Re: Purchases of Perpetual Preferred Stock by [ ] (Bank)
Dear [ ]:
This responds to the bank’s request that the OCC determine whether a national bank may hold two issues of perpetual preferred stock as investment securities under 12 CFR Part 1. For the reasons described below, we conclude that a national bank may invest in perpetual preferred stock issued by the Federal National Mortgage Association (“Fannie Mae”) and by the Federal Home Loan Mortgage Corporation (“Freddie Mac”) without limit, subject to safety and soundness considerations.
I. Background
The bank is interested in holding Fannie Mae and Freddie Mac perpetual preferred stock. Both securities are rated A or better by two nationally recognized statistical rating organizations (NRSROs). Both issuers may declare dividends quarterly, out of funds legally available. The holders of both issues do not participate or share in the profits of the issuers. Rather, their return is limited to
stated dividends. Both securities are noncumulative. If the issuers do not declare a dividend in a quarter, holders do not have a right to receive that quarter’s dividend in the future. Both issues are redeemable by their issuers, starting in 2006, at $50 per share plus accrued dividends for the quarter. Both preferred issues are senior to the issuers’ common stock. The issuers may not declare a dividend on common stock in a particular quarter without first paying a dividend on the preferred stock. In the event of a dissolution or liquidation, holders of both issues will receive out of assets available for distribution up to $50 per share plus a pro-rata share of the dividend for the quarter before any distributions to common shareholders. The preferred shares are nonvoting, except that Fannie Mae preferred shareholders may vote on limited matters regarding preferred stock.
II. Discussion
The plain language of section 24(Seventh) authorizes national banks to purchase and hold preferred stock of Freddie Mac and Fannie Mae without quantitative limits.
Section 24(Seventh) permits national banks to hold “mortgages, obligations, or other securities which are or ever have been sold by [Freddie Mac] pursuant to section 305 or section 306 of the Federal Home Loan Mortgage Corporation Act” (emphasis added).1 Section 306(g) of the Federal Home Loan Mortgage Corporation Act empowers Freddie Mac to issue “preferred stock on such terms and conditions as the board of directors shall prescribe.”2
Freddie Mac preferred stock is a “security”3 that national banks may hold under section 24(Seventh).
Section 24(Seventh) also authorizes banks to purchase and hold Fannie Mae perpetual preferred stock. Section 24(Seventh) permits national banks to hold “obligations, participations, or other instruments of or issued by” Fannie Mae. Since the term “instrument” is commonly defined to include securities,4 we believe this language affords a basis for national banks to purchase and hold Fannie Mae perpetual preferred stock.
Section 24(Seventh) generally restricts national banks’ dealing, underwriting, purchasing, and selling securities.
1 Indeed, the OCC previously relied on this same language in section 24(Seventh) in concluding that national banks may purchase and hold preferred stock of Freddie Mac. OCC Interpretive Letter No. 577, reprinted in [1991– 1992 Transfer Binder] Fed. Banking Law. Rep. (CCH) ¶ 83,347 (April 6, 1992).
2 12 USC 1455(f). 3 OCC Interpretive Letter No. 577, supra. 4 Black’s Law Dictionary, 5th ed. (West 1979).
54 Quarterly Journal, Vol. 21, No. 3, September 2002

Section 24(Seventh) exempts Freddie Mac “securities” and Fannie Mae “instruments” from these restrictions. Thus, banks’ holdings of Freddie Mac and Fannie Mae preferred securities are not subject to quantitative limits, other than safety and soundness considerations. Examples of the prudential controls the OCC would expect to see in a bank investing in these instruments include: implementation of appropriate diversification principles, adoption of concentration limits on the securities of any one issuer, and consideration of the impact on the bank’s overall interest rate and liquidity risk profiles.
III. Conclusion
Accordingly, a national bank may invest in perpetual preferred stock issued by Fannie Mae and by Freddie Mac. This investment is not subject to quantitative limits on the amount of such stock that the bank may hold, but the amount is subject to safety and soundness considerations, including the prudential controls noted above. If you have any questions, please contact me at (202) 874-5210.
Nancy Worth CounselSecurities and Corporate Practices Division
932—August 17, 2001
12 USC 24(7)
12 CFR 7.4002(a) and (b)
Subject: [ ] Non-Relationship Customer Check Cashing Fees
Dear [ ]:
This responds to your letter of July 12, 2001, in which you explain that [ ] (the bank) proposes to commence charging a non-accountholder (“non-relationship customer”)1 a convenience fee for using a bank teller to cash an “on us check,” which is a check drawn upon the account of one of the bank’s customers. The bank intends to apply this convenience fee with respect to checks drawn
1 The bank defines “non-relationship customers” as customers that do not have a mortgage, credit card, other loan, checking account, savings account, or certificate of deposit account with the bank or a loan or other account with an affiliate or subsidiary of the bank.
on business accounts. This convenience fee is essentially compensating the bank for making cash immediately available to the payee. Otherwise, the payee would have to wait for the check to clear through the payment system.
You request the concurrence of this office that the bank is authorized to charge this fee under section 24(Seventh) of the National Bank Act (12 USC 24(Seventh)) and 12 CFR 7.4002(a).2 Based on our review of your letter and supporting materials submitted and the relevant procedural considerations set forth in 12 CFR 7.4002(b), we agree that the bank is authorized to charge this convenience fee, in its discretion, pursuant to section 24(Seventh) and section 7.4002(a).3
National Bank Charges and Fees Are Authorized Under 12 USC 24(Seventh) and 12 CFR 7.4002
Section 24(Seventh) authorizes a national bank to engage in activities that are part of, or incidental to, the business of banking4 as well as to engage in certain specified activities listed in the statute. “[N]egotiating . . . drafts” is one of the activities specified in section 24(Seventh). A bank’s authority to provide products or services to its customers necessarily encompasses the ability to charge a fee for the product or service.5
This ability to charge a fee for the bank’s services is expressly reaffirmed in 12 CFR 7.4002(a), which provides:
2 We note that the authority of the bank and other national banks to charge particular fees is not conditioned on obtaining an individual confirming opinion, since national banks are authorized to charge non-interest fees and charges as an inherent element of their authority to conduct the business of banking.
3 Your letter noted that the State of Texas has recently enacted legislation that takes effect on September 1, 2001, and that would require banks located in Texas to cash checks drawn on one of the institution’s accounts without charging any fee. You have not requested our opinion, and we accordingly express no view, about whether the Texas law you describe or any similar state law would apply to national banks.
4 The powers clause of section 24(Seventh) provides that a national bank may “exercise by its board of directors or duly authorized officers or agents, subject to law, all such incidental powers as shall be necessary to carry on the business of banking . . .” 12 USC′ 24(Seventh). See NationsBank v. Variable Annuity Life Ins. Corp., 513 U.S. 251 (1995) (the “business of banking” is not limited to the list of powers enumerated in section 24(Seventh)).
5 Cf. Franklin National Bank v. New York, 347 U.S. 373, 377 (1954) (stating, in the context of bank advertising, “We cannot believe that the incidental powers granted to national banks should be construed so narrowly as to preclude the use of advertising in any branch of their authorized business”).
Quarterly Journal, Vol. 21, No. 3, September 2002 55

(a) Authority to impose charges and fees. A national bank may charge its customers non-interest charges and fees, including deposit account service charges.6
The bank’s authority in this, as in all other, areas must be exercised in a manner that is consistent with safe and sound banking practices. Paragraph (b) of section 7.40027
sets out the factors that the bank should consider to ensure that its process for setting its fees and charges is consistent with safety and soundness:
(b) Considerations. (1) All charges and fees should be arrived at by each bank on a competitive basis and not on the basis of any agreement, arrangement, undertaking, understanding, or discussion with other banks or their officers.
(2) The establishment of non-interest charges and fees, their amounts, and the method of calculating them are business decisions to be made by each bank, in its discretion, according to sound banking judgment and safe and sound banking principles. A national bank establishes non-interest charges and fees in accordance with safe and sound banking principles if the bank employs a decision-making process through which it considers the following factors, among others:
(i) The cost incurred by the bank in providing the service;
(ii) The deterrence of misuse by customers of banking services;
(iii) The enhancement of the competitive position of the bank in accordance with the bank’s business plan and marketing strategy; and
(iv) The maintenance of the safety and soundness of the institution.
If a bank uses a decisionmaking process that takes these factors into consideration, then there is no supervisory impediment to the bank exercising its discretionary
6 12 CFR 7.4002(a). As used in section 7.4002(a), “customer” simply means any party that obtains a product or service from the bank. The OCC recently adopted amendments to section 7.4002 to eliminate certain ambiguities in the text of the regulation. See 66 Fed. Reg. 34784 (July 2, 2001). As indicated in the preamble to the final rule, however, these amendments do not affect the substance of the regulation or the way it operates. Id. at 34787. Citations to section 7.4002 in this letter are to the regulation as revised. The revisions took effect on August 1, 2001.
7 12 CFR 7.4002(b).
authority to charge non-interest fees and charges—such as the non-relationship customer check cashing fees at issue here—pursuant to section 7.4002(a).
The Bank’s Consideration of the Section 7.4002(b) Factors
The bank has provided analysis and supporting documentation demonstrating that it has considered each of the four factors listed in section 7.4002(b)(2)(i)–(iv). The materials provided, for which the bank requests confidential treatment,8 include information on various costs incurred by the bank in cashing checks for non-relationship customers. These include the bank’s current losses attributable to non-relationship customer check-cashing, the number of non-relationship checks cashed annually, and the cost per check to process them. The bank notes that in many instances, these costs are projected to increase. The bank has concluded that its proposed non-relationship customer check cashing fee is necessary to help defray these costs.
The bank also has concluded that the convenience fee will help deter misuse because it will reduce check-based fraud. In particular, the bank expects that the fee will serve as an incentive for non-relationship customers to use other payment channels. The bank has described several programs directed toward non-relationship customers that it offers, or is developing, as alternatives to the use by these customers of tellers to cash checks over the counter. These include electronic accounts for cashing federal payments and access to direct deposit payments, which reduce the opportunity for check-based fraud. You have represented that the bank also intends to give written notices to non-relationship customers standing in line to cash payroll checks that they may avoid the proposed fee entirely—and receive the full face value of a check drawn on the bank—by opening an account at the bank or another institution or by electing to use the alternative payment methods offered by the bank.
The bank’s submission discusses how charging non-relationship customers this convenience fee relates to its overall business strategy. The bank has provided analysis of the impact that non-relationship check cashing has on the service that the bank provides its account holders. The bank’s submission demonstrates that non-relationship
8 The bank’s submission includes information that the bank believes to be exempt from disclosure under the Freedom of Information Act (FOIA). 12 USC 552(b). The FOIA exempts matters constituting “trade secrets and commercial or financial information obtained from a person and privileged and confidential.”
56 Quarterly Journal, Vol. 21, No. 3, September 2002

check cashing, by increasing costs associated with fraud losses and increasing the waiting time in teller lines, has the potential to affect negatively the quality of service the bank provides to its accountholders. The bank’s submission shows that deterrence of this potential negative effect was a factor considered by the bank in proposing its non-relationship check cashing fee.
In discussing how the fees would enhance the competitive position of the bank, the bank notes as a threshold matter that superior convenience for its accountholders is a “key competitive ingredient” for the bank. The bank then discusses the impact that these fees will have on the bank’s ability to provide superior convenience, through physical and alternative service delivery channels, for both its relationship customers and non-relationship customers. The bank asserts that the proposed non-relationship check cashing fee will promote greater convenience for its customers by allowing the bank to reduce delays in customer service and develop and implement advanced fraud protection systems best suited for the risk of check cashing. Moreover, the bank believes that the fee will enhance its competitive position by creating an incentive for non-accountholders and accountholders to use delivery channels for their banking services that are less costly than the bank’s physical banking centers. The bank notes that its proposed fee approximates what a non-relationship customer may pay to use an automated teller machine and is less expensive than what many of its competitors charge for cashing a check presented by a non-accountholder.
Finally, the bank provided analysis on the impact that the fees it charges to access its services have on the bank’s safety and soundness, particularly the bank’s ability to control costs and increasing exposure to fraud losses. The bank has attempted to avoid misunderstandings with its customers (which could present, among other things, reputation risk to the bank) by disclosing in its deposit agreement that the bank “may” charge a convenience fee for cashing on us checks. The bank also will send a notice to affected customers, 30 days before such a fee goes into effect in a particular state, that the fee will, in fact, be charged.
In addition, as part of its consideration of the safety and soundness implications of initiating a non-relationship customer check cashing convenience fee, the bank analyzed whether the proposed fee would constitute a “wrongful dishonor” of a check or impair the check’s negotiability under the Uniform Commercial Code (UCC).
According to the analysis furnished by the bank, whether a customer could challenge the non-relationship check
cashing fee as a wrongful dishonor depends on the terms of the deposit agreement between the bank and the customer. Menicocci v. Archer National Bank of Chicago, 67 Ill. App.3d 388, 391 (1st Dist. 1978) (the terms of a bank’s relationship with its customer is governed by the terms of the deposit contract). The deposit agreement for the business accounts to which the bank’s proposed non-relationship check cashing fee would apply provides:
You agree that we may impose additional requirements we deem necessary or desirable on a payee or other holder who presents for cashing an item drawn on your account which is otherwise properly payable, and if that person fails or refuses to satisfy such requirements, our refusal to cash the item will not be considered wrongful. You agree that, subject to applicable law, such requirements may include (but are not necessarily limited to) physical and/or documentary identification, check cashing fees, and requirements that such items may be cashed only at specified locations.
Thus, because the bank’s deposit agreement clearly provides for check cashing fees, the bank has concluded that the application of the proposed non-relationship customer check cashing fee would not constitute a wrongful dishonor of a check under the UCC.9
The bank also asserts that the application of the proposed non-relationship customer check cashing fee would not impair the negotiability of a check presented for payment. Section 3–104 of the Uniform Commercial Code defines a negotiable instrument as:
. . . an unconditional promise to pay or order to pay a fixed amount of money, with or without interest or other charges described in the promise or order, if it:
(1) is payable to bearer or to order at the time it is issued or first comes into possession of a holder;
(2) is payable on demand or at a definite time; and
(3) does not state any other undertaking or instruction by the person promising or ordering payment to do any act in addition to the payment on money. . . .
The bank asserts that a non-relationship customer check cashing fee does not alter a check’s negotiabilty because
9 Cf. Your Style Publication, Inc. v. Mid Town Bank & Trust Co., 501 N.E.2d 805, 810 (Ill. Ct. App. 1986) (defendant banks exceeded their contractual authority because depositor agreements did not clearly provide for check cashing fees and banks’ customers would have no reason to believe that their own checks would be subjected to this fee).
Quarterly Journal, Vol. 21, No. 3, September 2002 57

the check does not contain on its face an express condition to payment and the fee is not assessed for negotiation of the check. A check is an unconditional promise to pay unless an express condition to payment appears on the face of the check:10
One of the essentials of a negotiable check is that it be payable without condition. This means that a statement must not appear on the check that it is subject to any other order, promise, or condition. There must be no additional order or promise on the check itself; it must merely be an order on a bank for the payment of a sum of money.
Henry J. Bailey and Richard B. Hagedorn, Brady on Bank Checks, ¶2.04 (2000)
As explained in the bank’s submission, when a bank charges a non-relationship customer check cashing fee, there is no reference to the fee on the face of the check. The fee only applies to over-the-counter check cashings by a non-customer, and is not assessed when the check is deposited or negotiated to another holder. The holder of the check has many choices about how to negotiate the check, and over-the-counter cashing is the only choice under which the fee is assessed. Therefore, the bank concludes that the fee is not assessed for negotiation and does not affect the unconditional nature of the promise to pay.
The bank’s conclusion is supported by Sexton v. PNC Bank, N.A., 43 UCC Rep.2d 341 (Pa. Ct. Com. Pl. 2000), in which the court found that a similar check cashing fee does not affect the negotiability of checks. In that case, the court found that the fee—
is not assessed upon the negotiation of a check; it is merely a charge collected by the Bank in exchange for the service of turning a check into cash. A non-customer who deposits a check drawn on PNC into his or her account at another financial institution will receive the full face amount of the check. The same non-customer may also (assuming an agreeable recipient) endorse the check over to another person, who will then receive its full face value upon depositing the check into his (or her) own account, whether at PNC or elsewhere.
10 Section 3–106 of the UCC provides that:
. . . a promise or order is unconditional unless it states
(i) an express condition to payment,
(ii) that the promise or order is subject to or governed by another writing, or
(iii) that rights or obligations with respect to the promise or order are stated in another writing.
Id. at 341. The court went on to conclude:
Section 3–104 further provides that an order that is payable on demand and drawn on a bank, and that complies with provisions (2) and (3) [thereof] is both a check and a negotiable instrument. Because PNC’s $3.00 fee neither alters the payable-on-demand character of checks presented for cashing, nor constitutes an undertaking or instruction by the drawer over and above the promise to pay, the fee does not impair the negotiability of those checks, and its imposition does not violate the law.
Id. at 341.11
Conclusion
We therefore conclude that the bank is authorized, under 12 USC 24(Seventh) and 12 CFR 7.4002(a), to charge the non-relationship customer check cashing convenience fee and that the bank’s process for considering the establishment of the fee is consistent with the considerations required by section 7.4002(b).
Julie L. Williams First Senior Deputy Comptroller and Chief Counsel
933—August 17, 2001
12 USC 24(7)
12 CFR 7.4002(a) and (b)
Subject: Request for Concurrence that [ ] is Authorized to Charge Fees to Cash Checks Drawn on the Bank for Non-Accountholders
Dear [ ]:
This responds to your letter of July 31, 2001, in which you request the concurrence of this office that [ ], a national banking association with its main office in
11 See also Hayes v. First Commerce Corp., 763 S.2d 733, 43 UCC Rep.2d 335 (La. Ct. App. 2000), in which the court rejected a claim that a check cashing convenience fee constituted misappropriation, finding that the payee had voluntarily chosen to do business with the payor bank and that there is nothing illegal about charging a check cashing fee. In discussing the Hayes and Sexton, Barkley Clark, a leading commentator on negotiable instruments and bank deposits, stated, “We think both the Louisiana and Pennsylvania decisions hit the target in the middle.” Barkley Clark, Clark’s Bank Deposits and Payments Monthly, Vol. 9, No. 8 (February 2001).
58 Quarterly Journal, Vol. 21, No. 3, September 2002

[City, State], and with branch offices in [State 1, State 2], and [State 3] (“the bank”), is authorized, pursuant to 12 USC 24(Seventh) and 12 CFR 7.4002, to charge non-accountholders convenience fees to cash checks drawn on the bank (“on-us checks”).1 The bank’s deposit agreements reserve the right to charge this convenience fee with respect to checks drawn on any deposit accounts. This fee is essentially compensating the bank for making cash immediately available to the payee. Otherwise, the payee would have to wait for the check to clear through the payment system. Based on our review of your letter and supporting materials submitted and the relevant procedural considerations set forth in 12 CFR 7.4002(b), we agree that the bank is authorized to charge this convenience fee, in its discretion, pursuant to section 24(Seventh) and section 7.4002(a).2
National Bank Charges and Fees Are Authorized Under 12 USC 24(Seventh) and 12 CFR 7.4002
Section 24(Seventh) authorizes a national bank to engage in activities that are part of, or incidental to, the business of banking3 as well as to engage in certain specified activities listed in the statute. “[N]egotiating . . . drafts” is one of the activities specified in section 24(Seventh). A bank’s authority to provide products or services to its customers necessarily encompasses the ability to charge a fee for the product or service.4
This ability to charge a fee for the bank’s services is expressly reaffirmed in 12 CFR 7.4002(a), which provides:
1 We note that the authority of the bank and other national banks to charge particular fees is not conditioned on obtaining an individual confirming opinion, since national banks are authorized to charge non-interest fees and charges as an inherent element of their authority to conduct the business of banking.
2 Your letter noted that the State of Texas has recently enacted legislation that takes effect on September 1, 2001, and that would require banks located in Texas to cash checks drawn on one of the institution’s accounts without charging any fee. You have not requested our opinion, and we accordingly express no view, about whether the Texas law you describe or any similar state law would apply to national banks.
3 The powers clause of section 24(Seventh) provides that a national bank may “exercise by its board of directors or duly authorized officers or agents, subject to law, all such incidental powers as shall be necessary to carry on the business of banking. . . .” 12 USC ′24(Seventh). See NationsBank v. Variable Annuity Life Ins. Corp., 513 U.S. 251 (1995) (the “business of banking” is not limited to the list of powers enumerated in section 24(Seventh)).
4 Cf. Franklin National Bank v. New York, 347 U.S. 373, 377 (1954) (stating, in the context of bank advertising, “We cannot believe that the incidental powers granted to national banks should be construed so narrowly as to preclude the use of advertising in any branch of their authorized business”).
(a) Authority to impose charges and fees. A national bank may charge its customers non-interest charges and fees, including deposit account service charges.5
The bank’s authority in this, as in all other, areas must be exercised in a manner that is consistent with safe and sound banking practices. Paragraph (b) of section 7.40026
sets out the factors that the bank should consider to ensure that its process for setting its fees and charges is consistent with safety and soundness:
(b) Considerations. (1) All charges and fees should be arrived at by each bank on a competitive basis and not on the basis of any agreement, arrangement, undertaking, understanding, or discussion with other banks or their officers.
(2) The establishment of non-interest charges and fees, their amounts, and the method of calculating them are business decisions to be made by each bank, in its discretion, according to sound banking judgment and safe and sound banking principles. A national bank establishes non-interest charges and fees in accordance with safe and sound banking principles if the bank employs a decision-making process through which it considers the following factors, among others:
(i) The cost incurred by the bank in providing the service;
(ii) The deterrence of misuse by customers of banking services;
(iii) The enhancement of the competitive position of the bank in accordance with the bank’s business plan and marketing strategy; and
(iv) The maintenance of the safety and soundness of the institution.
If a bank uses a decision-making process that takes these factors into consideration, then there is no supervisory impediment to the bank exercising its discretionary
5 12 CFR 7.4002(a). As used in section 7.4002(a), “customer” simply means any party that obtains a product or service from the bank. The OCC recently adopted amendments to section 7.4002 to eliminate certain ambiguities in the text of the regulation. See 66 Fed. Reg. 34784 (July 2, 2001). As indicated in the preamble to the final rule, however, these amendments do not affect the substance of the regulation or the way it operates. Id. at 34787. Citations to section 7.4002 in this letter are to the regulation as revised. The revisions took effect on August 1, 2001.
6 12 CFR 7.4002(b).
Quarterly Journal, Vol. 21, No. 3, September 2002 59
authority to charge non-interest fees and charges—such as the on-us check cashing fees at issue here—pursuant to section 7.4002(a).
The Bank’s Consideration of the Section 7.4002(b) Factors
The bank has provided analysis and supporting documentation demonstrating that it has considered each of the four factors listed in section 7.4002(b)(2)(i)–(iv). The materials provided, for which the bank has claimed confidential treatment,7 include information on various costs incurred by the bank in cashing on-us checks. These include personnel, processing, auditing, and overhead expenses as well as losses attributable to on-us check cashing. The bank notes that it can charge accountholders monthly service fees to cover their use of the bank’s check cashing services but the only way to charge nonaccountholders for their use of such services is to charge a transaction fee at the teller window. The bank states that the only alternatives would be to provide nonaccountholders such services at a loss or to increase the service fees paid by accountholders and thereby require them to subsidize non-accountholders.
The bank demonstrates that it faces significantly greater risks—through the practices of drawing checks on insufficient funds and check fraud—in cashing on-us checks for non-accountholders than in accepting such checks for deposit or in paying them upon presentation through the payment system. As the United States District Court for the Northern District of Illinois recently explained (in dismissing a claim that the bank’s on-us check cashing fee violated the anti-tying provisions of the Bank Holding Company Act):
When a non-customer presents a check to be cashed by the drawee bank, the non-customer expects immediate payment in cash. Cash payments are final in the strictest sense. These final transactions pose substantial risk to banks, such as the possibility of overdraft, forgery or fraud. Should one of these occur, the bank is left with no recourse after a final cash transaction.8
In contrast, when holders of on-us checks deposit the checks in their bank accounts and the checks are cleared
7 The bank’s submission includes information that the bank believes to be exempt from disclosure under the Freedom of Information Act (FOIA). 12 USC 552(b). The FOIA exempts matters constituting “trade secrets and commercial or financial information obtained from a person and privileged and confidential.”
8 Batten v. Bank One, N.A., 2000 WL 1364408 (N.D. Ill. Sept. 15, 2000).
and paid through the payment system, the banks have protections against these risks and can delay or revoke payment.9 When a bank cashes an on-us check over the counter for a non-accountholder, these protections do not apply. The bank has concluded that its convenience fee is necessary to defray the costs and offset the risks associated with on-us check cashing.10
The bank has also concluded that the fee will help deter misuse because it will reduce check-based fraud. In particular, the bank expects that the fee will serve as an incentive for non-accountholders to deposit checks in their bank accounts or, if they do not have bank accounts, to open one either at the bank or elsewhere. The bank’s tellers frequently inform people who are cashing payroll checks that they may avoid the proposed fee entirely by opening an account at the bank. We encourage the bank to continue this practice as widely as is practicable.
The bank’s submission discusses how charging the fees relates to its overall business strategy. By charging these fees, the bank hopes to shorten teller lines and thereby provide accountholders better service and ensure that its accountholders are not required to subsidize check cashing services for non-accountholders. By doing so, the bank believes its competitive position will be enhanced.
Finally, the bank has provided analysis on the impact that the fees have on the bank’s safety and soundness, particularly the bank’s ability to recover its costs and cover its risks in providing non-accountholders this service. The fee also serves as an incentive to nonaccountholders to present checks for payment through the payment system, which, as discussed above, helps protect the bank from forgery, fraud, and overdrafts. The bank has attempted to avoid misunderstandings with its customers (which could present, among other things, reputation risk to the bank) by disclosing in its deposit agreement that the bank “may charge a person who cashes your check a fee if that person is not a deposit or loan (excluding credit cards) customer of the bank or another [ ] company.”
9 When a check is presented through the payment system, a bank has the right under the Uniform Commercial Code (UCC) to defer deciding whether to make final payment, or to return the item unpaid, until the banking day following the day of presentment. See UCC 4–104(a)(10), 4–301(a), 4–301(b), and 4–402(c). Under Regulation CC, a bank need not make funds deposited by means of an on-us check available for withdrawal until the following banking day. 12 CFR 229.10(c)(vi).
10 See also Batten v. Bank One, N.A., 2000 WL at— (“Bank One’s practice [of charging non-accountholders a fee for this service] offsets these risks . . . [by generating] funds to cover any losses due to forgery or fraud.”).
60 Quarterly Journal, Vol. 21, No. 3, September 2002

In addition, as part of its consideration of the safety and soundness implications of initiating an on-us check cashing convenience fee, the bank analyzed whether the proposed fee would constitute a “wrongful dishonor” of a check or impair its negotiability under the Uniform Commercial Code (UCC).
According to the analysis furnished by the bank, whether a customer could challenge the on-us check cashing fee as a wrongful dishonor depends on the terms of the deposit agreement between the bank and the customer. Menicocci v. Archer National Bank of Chicago, 67 Ill. App.3d 388, 391 (1st Dist. 1978) (the terms of a bank’s relationship with its customer is governed by the terms of the deposit contract). As noted above, the deposit agreement for the accounts to which the bank’s on-us check cashing fee applies includes a provision that the bank “may charge a person who cashes your check a fee if that person is not a deposit or loan (excluding credit cards) customer of the bank or another [ ] company.” Thus, because the bank’s deposit agreement clearly provides for check cashing fees, the bank has concluded that the application of the on-us check cashing fee would not constitute a wrongful dishonor of a check under the UCC.11
The bank also asserts that the application of the on-us check cashing fee would not impair the negotiability of a check presented for payment. Section 3–104 of the Uniform Commercial Code defines a negotiable instrument as:
. . . an unconditional promise to pay or order to pay a fixed amount of money, with or without interest or other charges described in the promise or order, if it:
(1) is payable to bearer or to order at the time it is issued or first comes into possession of a holder;
(2) is payable on demand or at a definite time; and
(3) does not state any other undertaking or instruction by the person promising or ordering payment to do any act in addition to the payment on money. . . .
The bank asserts that an on-us check cashing fee does not alter a check’s negotiability because the check does not contain on its face an express condition to payment
11 Cf. Your Style Publication, Inc. v. Mid Town Bank & Trust Co., 501 N.E.2d 805, 810 (Ill. Ct. App. 1986) (defendant banks exceeded their contractual authority because depositor agreements did not clearly provide for check cashing fees and banks’ customers would have no reason to believe that their own checks would be subjected to this fee).
and the fee is not assessed for negotiation of the check. A check is an unconditional promise to pay unless an express condition to payment appears on the face of the check:12
One of the essentials of a negotiable check is that it be payable without condition. This means that a statement must not appear on the check that it is subject to any other order, promise, or condition. There must be no additional order or promise on the check itself; it must merely be an order on a bank for the payment of a sum of money.
Henry J. Bailey and Richard B. Hagedorn, Brady on Bank Checks, ¶2.04 (2000).
As explained in the bank’s submission, when a bank charges an on-us check cashing fee, there is no reference to the fee on the face of the check. The fee only applies to over-the-counter check cashings by a non-customer, and is not assessed when the check is deposited or negotiated to another holder. The holder of the check has many choices about how to negotiate the check, and over-the-counter cashing is the only choice under which the fee is assessed. Therefore, the bank concludes that the fee is not assessed for negotiation and does not affect the unconditional nature of the promise to pay.
The bank’s conclusion is supported by Sexton v. PNC Bank, N.A., 43 UCC Rep.2d 341 (Pa. Ct. Com. Pl. 2000), in which the court found that an on-us check cashing fee does not affect the negotiability of checks. In that case, the court found that the fee—
is not assessed upon the negotiation of a check; it is merely a charge collected by the bank in exchange for the service of turning a check into cash. A non-customer who deposits a check drawn on PNC into his or her account at another financial institution will receive the full face amount of the check. The same non-customer may also (assuming an agreeable recipient) endorse the check over to another person, who will then receive its full face value upon depositing the check into his (or her) own account, whether at PNC or elsewhere.
12 Section 3–106 of the UCC provides that:
. . . a promise or order is unconditional unless it states
(i) an express condition to payment,
(ii) that the promise or order is subject to or governed by another writing, or
(iii) that rights or obligations with respect to the promise or order are stated in another writing.
Quarterly Journal, Vol. 21, No. 3, September 2002 61

Id. at 341. The court went on to conclude:
Section 3–104 further provides that an order that is payable on demand and drawn on a bank, and that complies with provisions (2) and (3) [thereof] is both a check and a negotiable instrument. Because PNC’s $3.00 fee neither alters the payable-on-demand character of checks presented for cashing, nor constitutes an undertaking or instruction by the drawer over and above the promise to pay, the fee does not impair the negotiability of those checks, and its imposition does not violate the law.
Id. at 341.13
Conclusion
We therefore conclude that the bank is authorized, under 12 USC 24(Seventh) and 12 CFR 7.4002(a), to charge the convenience fee and that the bank’s process for considering the establishment of the fee is consistent with the considerations required by section 7.4002(b).
Julie L. Williams First Senior Deputy Comptroller and Chief Counsel
934—August 20, 2001
12 USC 24(7)
12 CFR 7.4002(a) and (b)
Subject: Request for Concurrence that [ ] is Authorized to Charge Fees to Cash Checks Drawn on the Bank for Non-Accountholders
Dear [ ]:
This responds to your letter of August 16, 2001, in which you request the concurrence of this office that [ ] (“the
13 See also Hayes v. First Commerce Corp., 763 S.2d 733, 43 UCC Rep.2d 335 (La. Ct. App. 2000), in which the court rejected a claim that an on-us check cashing fee constituted misappropriation, finding that the payee had voluntarily chosen to do business with the payor bank, and that there is nothing illegal about charging a check cashing fee. In discussing the Hayes and Sexton, Barkley Clark, a leading commentator on negotiable instruments and bank deposits, stated, “We think both the Louisiana and Pennsylvania decisions hit the target in the middle.” Barkley Clark, Clark’s Bank Deposits and Payments Monthly, Vol. 9, No. 8 (February 2001).
bank”) is authorized, pursuant to 12 USC 24(Seventh) and 12 CFR 7.4002, to charge non-accountholders fees to cash checks drawn on the bank (“on-us checks”).1 The bank’s deposit agreements reserve the right to charge a convenience fee with respect to checks drawn on all deposit accounts at the bank. This convenience fee is essentially compensating the bank for making cash immediately available to the payee. Otherwise, the payee would have to wait for the check to clear through the payment system. Based on our review of your letter and supporting materials submitted and the relevant procedural considerations set forth in 12 CFR 7.4002(b), we agree that the bank is authorized to charge this convenience fee, in its discretion, pursuant to section 24(Seventh) and section 7.4002(a).2
National Bank Charges and Fees Are Authorized Under 12 USC 24(Seventh) and 12 CFR 7.4002
Section 24(Seventh) authorizes a national bank to engage in activities that are part of, or incidental to, the business of banking3 as well as to engage in certain specified activities listed in the statute. “[N]egotiating . . . drafts” is one of the activities specified in section 24(Seventh). A bank’s authority to provide products or services to its customers necessarily encompasses the ability to charge a fee for the product or service.4
This ability to charge a fee for the bank’s services is expressly reaffirmed in 12 CFR 7.4002(a), which provides:
1 We note that the authority of the bank and other national banks to charge particular fees is not conditioned on obtaining an individual confirming opinion, since national banks are authorized to charge non-interest fees and charges as an inherent element of their authority to conduct the business of banking.
2 We note that the State of Texas has recently enacted legislation that takes effect on September 1, 2001, and that would require banks located in Texas to cash checks drawn on one of the institution’s accounts without charging any fee. You have not requested our opinion, and we accordingly express no view, about whether the Texas law you describe or any similar state law would apply to national banks.
3 The powers clause of section 24(Seventh) provides that a national bank may “exercise by its board of directors or duly authorized officers or agents, subject to law, all such incidental powers as shall be necessary to carry on the business of banking. . . .” 12 USC 24(Seventh). See NationsBank v. Variable Annuity Life Ins. Corp., 513 U.S. 251 (1995) (the “business of banking” is not limited to the list of powers enumerated in section 24(Seventh)).
4 Cf. Franklin National Bank v. New York, 347 U.S. 373, 377 (1954) (stating, in the context of bank advertising, “We cannot believe that the incidental powers granted to national banks should be construed so narrowly as to preclude the use of advertising in any branch of their authorized business”).
62 Quarterly Journal, Vol. 21, No. 3, September 2002

(a) Authority to impose charges and fees. A national bank may charge its customers non-interest charges and fees, including deposit account service charges.5
The bank’s authority in this, as in all other, areas must be exercised in a manner that is consistent with safe and sound banking practices. Paragraph (b) of section 7.40026
sets out the factors that the bank should consider to ensure that its process for setting its fees and charges is consistent with safety and soundness:
(b) Considerations. (1) All charges and fees should be arrived at by each bank on a competitive basis and not on the basis of any agreement, arrangement, undertaking, understanding, or discussion with other banks or their officers.
(2) The establishment of non-interest charges and fees, their amounts, and the method of calculating them are business decisions to be made by each bank, in its discretion, according to sound banking judgment and safe and sound banking principles. A national bank establishes non-interest charges and fees in accordance with safe and sound banking principles if the bank employs a decision-making process through which it considers the following factors, among others:
(i) The cost incurred by the bank in providing the service;
(ii) The deterrence of misuse by customers of banking services;
(iii) The enhancement of the competitive position of the bank in accordance with the bank’s business plan and marketing strategy; and
(iv) The maintenance of the safety and soundness of the institution.
If a bank uses a decisionmaking process that takes these factors into consideration, then there is no supervisory impediment to the bank exercising its discretionary
5 12 CFR 7.4002(a). As used in section 7.4002(a), “customer” simply means any party that obtains a product or service from the bank. The OCC recently adopted amendments to section 7.4002 to eliminate certain ambiguities in the text of the regulation. See 66 Fed. Reg. 34784 (July 2, 2001). As indicated in the preamble to the final rule, however, these amendments do not affect the substance of the regulation or the way it operates. Id. at 34787. Citations to section 7.4002 in this letter are to the regulation as revised. The revisions took effect on August 1, 2001.
6 12 CFR 7.4002(b).
authority to charge non-interest fees and charges such as the on-us check cashing fees at issue here pursuant to section 7.4002(a).
The Bank’s Consideration of the Section 7.4002(b) Factors
The bank has provided analysis and supporting documentation demonstrating that it has considered each of the four factors listed in section 7.4002(b)(2)(i)– (iv). The bank’s submission, for which the bank requests confidential treatment,7 explains that prior to implementing the fee program, it formed a task force, including a marketing representative and various levels of management from those areas that would be affected by the fee (e.g., community banking presidents, a district manager, and a business banking manager). As part of its evaluation, the task force considered the various costs incurred by the bank in cashing on-us checks.
The bank’s submission states that the task force considered teller services in evaluating the costs incurred in cashing on-us checks. On paydays, the teller lines in many of the bank’s branches are heavily impacted by the employees of the bank’s commercial customers who want to cash their payroll checks. According to the bank’s submission, the task force believes that this activity negatively affects the ability of those offices to serve their deposit customers expeditiously. The task force therefore concluded that the bank’s convenience fee is necessary to offset the negative effects on its services for accountholders that result from on-us check cashing.
The bank’s submission also explains that its task force concluded that the fee will help deter misuse because it will serve as an incentive for non-accountholders to deposit checks in their bank accounts or, if they do not have bank accounts, to open one either at the bank or elsewhere. The bank provides notices to nonaccountholders, through brochures and lobby posters printed in English and Spanish, that they may avoid the fee by opening an account with the bank.
The bank also states that the task force discussed how charging convenience fees relates to its overall business strategy. The task force considered the practices of other financial institutions regarding the imposition of this type
7 The bank’s submission includes information that the bank believes to be exempt from disclosure under the Freedom of Information Act (FOIA). 12 USC 552(b). The FOIA exempts matters constituting “trade secrets and commercial or financial information obtained from a person and privileged and confidential.”
Quarterly Journal, Vol. 21, No. 3, September 2002 63

of fee and reviewed the fees charged by persons primarily engaged in the check cashing business. The task force concluded that the bank should establish its fees at the low end of that market in order to remain competitive.
Finally, the task force evaluated the impact that the fees have on the bank’s safety and soundness. In order to assess possible reputational and litigation risks, the task force considered both the results of internal focus groups (conducted to help gauge the likely reactions of the persons impacted by the fee and the appropriate responses to those risks) and the experiences of an affiliate that had previously implemented a similar fee. The bank has attempted to avoid misunderstandings with its customers (which could present, among other things, reputation risk to the bank) by disclosing in its deposit agreement that the bank “may charge a fee to the person presenting the check. . . .” The bank also sends letters to affected customers in advance of implementing the fee program.
In addition, the bank has analyzed the legal risks (which could raise safety and soundness concerns) arising from whether the proposed fee would constitute a “wrongful dishonor” of a check or impair its negotiability under the Uniform Commercial Code (UCC).
According to the analysis furnished by the bank, whether a customer could challenge the convenience fee as a wrongful dishonor depends on the terms of the deposit agreement between the bank and the customer. Menicocci v. Archer National Bank of Chicago, 67 Ill. App.3d 388, 391 (1st Dist. 1978) (the terms of a bank’s relationship with its customer is governed by the terms of the deposit contract). The deposit agreement for the accounts to which the bank’s fee applies includes a provision that “[i]f a check drawn against your account is presented over the counter for payment by a person who is not a deposit customer of the bank, the bank may charge a fee to the person presenting the check as a condition for payment for the check.” Thus, because the bank’s deposit agreement clearly provides for check-cashing fees, the bank concluded that the application of the fee would not constitute a wrongful dishonor of a check under the UCC.8
The bank asserts that a convenience fee does not alter a check’s negotiability, because the check does not contain on its face an express condition to payment and the fee is
8 Cf. Your Style Publication, Inc. v. Mid Town Bank & Trust Co., 501 N.E.2d 805, 810 (Ill. Ct. App. 1986) (defendant banks exceeded their contractual authority because depositor agreements did not clearly provide for check cashing fees and banks’ customers would have no reason to believe that their own checks would be subjected to this fee).
not assessed for negotiation of the check. A check is an unconditional promise to pay unless an express condition to payment appears on the face of the check:9
One of the essentials of a negotiable check is that it be payable without condition. This means that a statement must not appear on the check that it is subject to any other order, promise, or condition. There must be no additional order or promise on the check itself; it must merely be an order on a bank for the payment of a sum of money.
Henry J. Bailey and Richard B. Hagedorn, Brady on Bank Checks, ¶2.04 (2000).
As explained in the bank’s submission, when a bank charges a fee for cashing an on-us check, there is no reference to the fee on the face of the check. The fee only applies to over-the-counter check cashings by a non-customer and is not assessed when the check is deposited or negotiated to another holder. The holder of the check has many choices about how to negotiate the check, and over-the-counter cashing is the only choice under which the fee is assessed. Therefore, the bank concludes that the fee is not assessed for negotiation and does not affect the unconditional nature of the promise to pay.
The bank’s conclusion is supported by Sexton v. PNC Bank, N.A., 43 UCC Rep.2d 341 (Pa. Ct. Com. Pl. 2000), in which the court found that a convenience fee for cashing an on-us check does not affect the negotiability of checks. In that case, the court found that the fee
is not assessed upon the negotiation of a check; it is merely a charge collected by the bank in exchange for the service of turning a check into cash. A non-customer who deposits a check drawn on PNC into his or her account at another financial institution will receive the full face amount of the check. The same non-customer may also (assuming an agreeable recipient) endorse the check over to another person, who will then receive its full face value upon depositing the check into his (or her) own account, whether at PNC or elsewhere.
9 Section 3–106 of the UCC provides that:
. . . a promise or order is unconditional unless it states
(i) an express condition to payment,
(ii) that the promise or order is subject to or governed by another writing, or
(iii) that rights or obligations with respect to the promise or order are stated in another writing.
64 Quarterly Journal, Vol. 21, No. 3, September 2002

Id. at 341. The court went on to conclude:
Section 3–104 further provides that an order that is payable on demand and drawn on a bank, and that complies with provisions (2) and (3) [thereof], is both a check and a negotiable instrument. Because PNC’s $3.00 fee neither alters the payable-on-demand character of checks presented for cashing, nor constitutes an undertaking or instruction by the drawer over and above the promise to pay, the fee does not impair the negotiability of those checks, and its imposition does not violate the law.
Id. at 341.10
Conclusion
We therefore conclude that the bank is authorized, under 12 USC 24(Seventh) and 12 CFR 7.4002(a), to charge the convenience fee and that the bank’s process for considering the establishment of the fee is consistent with the considerations required by section 7.4002(b).
Julie L. Williams First Senior Deputy Comptroller and Chief Counsel
935—May 14, 2002
12 USC 24(7)
Subject: Holding Securities for Hedging Purposes
Dear [ ]:
This letter confirms oral advice provided by OCC legal and supervisory staff concerning the program established by [ ] (the bank) to hedge risks arising from bank permissible, customer-driven derivative transactions. You asked whether the bank can short equities under its hedging program and if the 5 percent limit applies to voting but not nonvoting stock. You also questioned how
10 See also Hayes v. First Commerce Corp., 763 S.2d 733, 43 UCC Rep.2d 335 (La. Ct. App. 2000), in which the court rejected a claim that an on-us check cashing fee constituted misappropriation, finding that the payee had voluntarily chosen to do business with the payor bank, and that there is nothing illegal about charging a check cashing fee. In discussing the Hayes and Sexton, Barkley Clark, a leading commentator on negotiable instruments and bank deposits, stated, “We think both the Louisiana and Pennsylvania decisions hit the target in the middle.” Barkley Clark, Clark’s Bank Deposits and Payments Monthly, Vol. 9, No. 8 (February 2001).
the bank may settle and terminate its hedges and whether the bank can cross-hedge. You also asked whether the standards applicable to equity hedges apply to commodity and below-investment-grade debt hedges. Our responses are set forth below.
I. Background
The OCC has determined that it is legally permissible for a national bank to purchase and hold equity securities that banks do not generally have authority to purchase to hedge customer-driven, bank permissible equity derivative transactions.1 A national bank may hold these securities to hedge bank permissible equity derivative transactions if the activities comply with the standards set forth below, which include obtaining the approval of its examiner-in-charge (EIC). Before establishing an equity hedging program, a national bank must provide written documentation to its EIC that evidences compliance with the following standards, and obtain the EIC’s approval. The documentation should establish to the satisfaction of the EIC that:
• the bank will hold the securities solely to hedge risks arising from bank permissible derivative transactions originated by customers for the customers’ valid and independent business purposes;
• the bank will not hold the securities for speculative purposes;
• the securities will offer a cost-effective means to hedge risks arising from permissible banking activities;
• the bank will not take anticipatory, or maintain residual, positions in the securities except as necessary for the orderly establishment or unwinding of a hedging position;
• the bank will not acquire equity securities for hedging purposes that constitute more than 5 percent of a class of securities of any issuer; and
• the bank has an appropriate risk management process in place, satisfactory to the EIC, for its hedging activities.
Your EIC has approved the bank’s hedging program under these standards.
1 See OCC Interpretive Letter No. 892 (September 13, 2000), reprinted in [2000–2001 Transfer Binder] Fed. Banking Law Rep. (CCH) ¶ 81–411.
Quarterly Journal, Vol. 21, No. 3, September 2002 65

II. Discussion
You have asked a number of questions concerning the bank’s hedging program. Our responses to your questions are described below.
A. Shorting Equities
You asked if the bank may short equities for hedging purposes under the EIC’s approval of its hedging program. The answer is yes. National banks may hedge risks arising from bank permissible equity derivative transactions with either long or short positions in an equity or basket of equities. A national bank can protect itself against changes in the value of the security underlying an equity derivative transaction by taking an offsetting (long or short, as appropriate) position in that equity. So, for example, a national bank may hedge changes in certain equity derivative transactions through delta hedging.2 Delta is a hedge ratio banks calculate to determine the amount of equity it must be long or short, so that for small changes in the price of an equity, the bank’s equity hedge position and its equity derivative contract with a customer will change by equal, and offsetting, amounts.3 The objective of delta hedging is to have the change in the value of the equity hedge offset the change in value of the customer derivative transaction.
B. Nonvoting Corporate Stock
You inquired whether the 5 percent limit applies to nonvoting corporate stock. The OCC has applied the 5 percent limit only to each separate class of voting shares of a company. A national bank may not acquire securities that, in the aggregate, result in the bank’s control of more than 5 percent of the outstanding shares of any class of a company’s voting securities. The OCC evaluates a particular bank’s hedging program under the criteria described in this letter in order to determine whether the 5 percent limit should also apply to a class of nonvoting securities.
C. Cash- and Physically Settled Hedges
You questioned whether the OCC’s approval for hedging permissible equity derivative transactions with equity securities allows the bank to both cash- and physically
2 Delta hedging typically involves equity options. See United Stated General Accounting Office (GAO), Equity Hedging: OCC Needs to Establish Policy on Publishing Interpretive Decisions, GAO-01-945 (August 2001) at 4, 26.
3 See Id.
settle its equity derivative transactions. A national bank with an EIC-approved hedging program may execute cash- and physically settled equity derivative transactions.4
D. Hedging Residual Positions
You asked whether the bank may hedge the risks arising from a hedge that remain when a counterparty terminates the underlying hedged transaction. A bank must prudently manage the risk in its equity derivative program and may, in the event of an unforeseen termination of a hedged transaction, hedge exposures from the remaining hedge. We believe that if a national bank holds equities to hedge a bank permissible equity derivative transaction, and a counterparty terminates the initial transaction, the bank must dispose of the equity holdings immediately, except as necessary for the orderly unwinding of the hedge position.5 During any time required to dispose of the equity holdings, a national bank may enter into an appropriate offsetting equity derivative transaction to hedge the bank’s initial hedge transaction, i.e., a reverse hedge. The reverse hedge should terminate as close in time as possible to the disposal of the equity holdings.
E. Physical Commodity Transactions
You inquired whether the standards for examiner review and approval of national bank equity hedge programs apply to commodity hedge programs. No, the standards set forth in OCC Interpretive Letter No. 892 apply to security, but not commodity, hedges. The OCC’s process for permitting national banks to hold commodities to hedge derivative transactions is set forth in a number of precedents separate from OCC Interpretive Letter No. 892.6 Banking Circular 277, for example, describes how national banks may hold commodities as hedges.7 The analysis governing commodity holdings as hedges is similar in several respects to that underlying the OCC’s approval for hedging permissible equity derivative transactions. In both cases, the OCC made clear that
4 The OCC has previously recognized that a national bank may hedge equity derivative transactions with cash-settled hedges. See OCC Interpretive Letter No. 652 (September 13, 1994), reprinted in [1994 Transfer Binder] Fed. Banking L. Rep. (CCH) ¶ 83,600.
5 See OCC Interpretive Letter No. 892, supra.
6 See OCC Interpretive Letter No. 684 (August 4, 1995), reprinted in [1993– 1994 Transfer Binder] Fed. Banking L. Rep. (CCH) ¶ 83,632; OCC Interpretive Letter No. 632 (June 30, 1993), reprinted in [1993–1994 Transfer Binder] Fed. Banking L. Rep. (CCH) ¶ 83,516.
7 See OCC Banking Circular 277 (October 27, 1993) (BC–277). See also OCC Comptroller’s Handbook, “Risk Management of Financial Derivatives” (January 1997 [print version; rev. for Web only, October 2001, available at http: //www.occ.treas.gov/handbook/deriv.pdf]).
66 Quarterly Journal, Vol. 21, No. 3, September 2002

national banks should not engage in these activities without the prior approval of the OCC. The ability of banks to hold commodities and equities as hedges depends on the existence of customer-driven, bank-permissible derivative transactions. Also, the bank must have acceptable risk monitoring systems to handle the activities in a safe and sound manner. Conversely, commodity hedges differ materially from equity hedges, and therefore the process for engaging in these transactions is different. For example, holding commodities as hedges pose storage (e.g., storage tanks, pipelines), transportation (e.g., tankers, barges, pipelines), environmental (e.g., pollution, fumigation, leakage, contamination), and insurance risks (e.g., damage to persons and property, contract breach, spillage) not associated with the physical possession of equities.
F. Cross-Hedges
You questioned whether the bank can hedge equity derivatives with cross-hedges. In limited circumstances, a national bank can cross-hedge its equity derivatives where consistent with the bank’s OCC approved hedging risk management process. Generally, an equity hedge is used to protect a position in a security by the purchase or sale of the security. Cross-hedging is the use of one security or a basket of securities to hedge the risk arising from a transaction involving another, different security. A cross-hedge is based on the premise that, although certain securities are not the same, the securities are similar and their price movements strongly correlate. Sometimes cross-hedges are used when securities have similar characteristics and there is a deeper, more liquid market for securities other than the security underlying the transaction to be hedged. In some circumstances, cross-hedging may be the most effective risk management tool available to a national bank, enabling it to operate more efficiently, compete more effectively with entities that engage in similar hedging strategies, offer customers the least costly and most attractive products and services, and operate prudently.8 Bank management must be able to justify its cross-hedge, i.e., that the instrument used for cross-hedging provides a reasonable substitute for the security exposure arising from the derivative being hedged. Examiners evaluating the reasonableness of a cross-hedge consider the accuracy of the cross-hedge, its cost-effectiveness, and its liquidity in the market in comparison to the security involved in the initial transaction.
8 See OCC Interpretive Letter No. 892, supra.
G. Below-Investment-Grade Bond Hedges
You asked whether the bank may hedge risks arising from permissible derivative activities using bonds that are rated below investment grade. A national bank may hold long or short positions in equity or below-investment-grade debt securities to hedge bank-permissible derivative transactions, if the activities comply with OCC standards and the bank obtains the approval of its EIC. The standards set forth in OCC Interpretive Letter No. 892 that apply to hedging with equity securities also apply to hedging with below-investment-grade debt securities. Because a bank’s EIC must approve a bank’s use of below-investment-grade debt securities for hedging purposes, and such hedging programs must have an appropriate risk management process in place satisfactory to the EIC, the EIC may impose a prudential limit on such holdings. Accordingly, a national bank can use below-investment-grade bonds to hedge the risks arising from permissible derivative transactions if in accordance with its EIC-approved hedging program.
We understand that your EIC has addressed the above issues with the bank. If you have additional questions, please do not hesitate to contact Donald N. Lamson, assistant director, or Tena M. Alexander, special counsel, Securities and Corporate Practices Division at (202) 874-5210.
Julie L. Williams First Senior Deputy Comptroller and Chief Counsel
936—May 22, 2002
12 CFR 9.18
Re: Proposed Creation of the [ ] Fund
Dear [ ]:
This letter confirms our February 13, 2002, teleconference and responds to your letter dated March 5, 2002, regarding the establishment by [ ] (bank), as trustee, of the [ ] (fund). You have inquired whether the OCC would object to an aspect of the fund’s operations under the OCC’s rules governing collective investment funds at 12 CFR 9.18. Specifically, you have inquired whether the bank, as trustee, may allow participant withdrawals from the fund at the sole discretion of the bank, or when a participant becomes ineligible to continue as a participant in the fund. Based on your representations, and for the
Quarterly Journal, Vol. 21, No. 3, September 2002 67

reasons described below, the OCC does not object to this aspect of the fund’s operations under the OCC’s rules governing collective investment funds at 12 CFR 9.18.1
I. Proposal
The bank seeks to establish the fund for the collective investment of money contributed to the fund by the bank in its capacity as trustee of certain tax-exempt charitable trusts. The bank is forming the fund in order to enable several small trusts for which it serves as trustee to invest in private equity limited partnerships (PELP). However, the trusts cannot invest in the PELP directly because an appropriate private equity investment for these trusts would not satisfy the minimum investment requirement of the limited partnership. The fund will pool the investments of several tax-exempt trusts that are “qualified purchasers,”2 allowing the fund to satisfy the minimum requirement of the limited partnership.
Under the bank’s proposal, fund participants will be unable to make discretionary withdrawals from the fund.3
Sections 6.2(a), (b), (c), and (e) of the Declaration of Trust provide:
(a) Unless otherwise limited hereunder, the decision on when to allow, the form of, and the timing of all fund withdrawals shall be within the sole discretion of the trustee;
(b) Participants will not have the right to withdraw from the fund at any particular time or interval;
(c) At the time of the creation of a fund, the trustee does not anticipate allowing any withdrawals from the fund prior to the termination and liquidation of the [private equity investments] of the fund; and
1 We limit our no-objection to the bank’s proposal to allow participant withdrawals from the fund at the sole discretion of the bank, or when a participant becomes ineligible to continue as a participant in the fund. We offer no views on whether other aspects of the fund’s operations comply with the provisions of 12 CFR 9.18 or with applicable fiduciary law.
2 While the Investment Company Act of 1940 (“1940 Act”) is not applicable to the bank’s proposal, the bank represents that if the 1940 Act were applicable to the bank’s proposal, the tax-exempt trusts for which the bank is trustee would meet the definition of “qualified purchasers” under section 2(a)(51) of the 1940 Act.
3 The bank represents that it will provide appropriate disclosures to the board of directors or the trustee(s) of the beneficiaries of each fund participant with respect to the nature of the fund’s investments and capital calls, and that fund participants will not have the right to withdraw from the fund at any particular time or time interval.
(e) Upon the occurrence of an event that renders a participant ineligible to continue as a participant in the fund,4 within one year of such event the trustee shall redeem such participant’s units in the fund, in kind, with a proportionate share of the [private equity investments] and the other assets of the fund; subject, however, to any liens for incurred and unpaid capital contributions, debts, fees and expenses.
You represented during our February 13, 2002, teleconference that the fund will be valued semi-annually on April 1 and October 1. The bank will use the valuation reports provided by the PELP’s general partner to determine the fund’s fair value. To comply with 12 CFR 9.18(b)(4)(ii), and as provided in section 5.3(f) of the Declaration of Trust, the bank will determine whether the valuation provided by the PELP’s general partner represents the fair value of the fund’s assets as of the date of the valuation.
II. Discussion
The OCC’s regulation governing collective investment funds does not mandate the frequency of admissions and withdrawals from collective investment funds. The regulation requires that the written plan governing the administration of the collective investment fund include appropriate provisions related to the terms and conditions governing the admission and withdrawal of participating accounts.5
In addition, the regulation provides that admissions and withdrawals may only be “on the basis of the valuation described in paragraph (b)(4).” Section 9.18(b)(4), in turn, provides in part that,
A bank administering a collective investment fund shall determine the value of the fund’s assets at least once every three months. However, in the case of a fund described in paragraph (a)(2) of this section that is invested primarily in real estate or other assets that are not readily marketable, the bank shall determine the value of the fund’s assets at least once a year. 6
4 The bank represents that the only way a participant would cease to be eligible to continue as a participant in the fund would be if the bank was removed, for cause, as trustee of the participating account.
5 The regulation also provides that certain funds may require a prior notice period of up to one year for withdrawals. 12 CFR 9.18(b)(5)(iii).
6 12 CFR 9.18(b)(4)(i). Section 9.18(b)(4) also establishes the method of valuation. In general, bank trustees are required to value fund assets at market value as of the date set for valuation, unless the bank cannot readily ascertain market value, in which case the bank shall use a fair value determined in good faith. See 12 CFR 9.18(b)(4)(ii)(A). Different valuation methods apply to short-term investment funds. See 12 CFR 9.18(b)(4)(ii)(B).
68 Quarterly Journal, Vol. 21, No. 3, September 2002

These provisions require that bank trustees use the valuation derived under section 9.18(b)(4) to determine the amount participants are entitled to when they are admitted to or withdraw from a fund. It does not mandate the frequency of admissions and withdrawals.7 National banks and institutions that must comply with this regulation to receive favorable tax treatment should have valid reasons for limiting admissions and withdrawals, however. In addition, the admissions and withdrawal policies must be consistent with fiduciary duties.
In this case, the bank does not anticipate allowing any withdrawals from the fund prior to the termination and liquidation of the underlying trust investments because the fund might fail to satisfy the minimum investment requirement of the PELP if the fund permitted discretionary withdrawals from the fund. In addition, you represent that the bank will limit admissions to, and withdrawals from, the fund, because the fund’s private equity investments will be in limited partnerships that will be illiquid over their projected 10- to 15-year business cycles. Specifically, the limited partnership interests are not transferable without the permission of the general partner. You have also represented that the amount of the investment that each participating trust will make in the fund will not impair the liquidity of the participating trusts. The fund is designed as, and will be used as, only one part of an overall investment strategy for the participating trusts.
Based on your representations and consistent with applicable law, the bank may permit a participant to withdraw from the fund solely at the bank’s discretion, or when a participant becomes ineligible to continue as a participant in the fund.8
I trust this is responsive to your inquiry. Please do not hesitate to contact me if you have any questions.
Asa L. Chamberlayne CounselSecurities and Corporate Practices Division
7 OCC Trust Interpretive Letters interpreting the prior version of 12 CFR 9.18 concluded that admissions and withdrawals must occur as frequently as valuations. See e.g., Trust Interpretive Letter No. 13 (February 14, 1986). Upon closer examination of the regulation, however, we have concluded that the regulation does not mandate the frequency of admissions and withdrawals. See OCC Interpretive Letter No. 920 (December 6, 2001).
8 See footnote 4, supra.
937—June 27, 2002
12 USC 24(7)
Re: Authority of a National Bank to Engage in Financial Intermediation Transactions
Dear [ ]:
This responds to your request that the Office of the Comptroller of the Currency (OCC) confirm the opinion of [ ] (the bank) that it is permissible for the bank to engage in financial intermediation transactions, where the payments between parties are based on the price of electricity.1 For the reasons discussed below and subject to the limitations described herein, we believe that the proposed transactions are permissible for the bank.
I. Background
The bank currently engages in a variety of financial intermediation transactions involving exchanges of payments based on interest rates, and the value of equities and commodities. The bank’s financial intermediation derivative transactions involve a wide range of energy-related commodities, including petroleum, natural gas, and other hydrocarbon products. These transactions provide risk management tools to meet customers’ financial needs. For example, oil and gas derivatives offer users and producers protection against increases and decreases in the price of oil or gas.
The bank proposes to add transactions based on the price of electricity to its existing financial intermediation derivatives business. Similar to its existing financial intermediation derivatives business involving energy commodities, the electricity derivative business will be a customer-driven rather than a proprietary trading business. The bank’s electricity financial intermediation activities will involve exchanges of payments, similar to other financial intermediary transactions presently engaged in by the bank. The transactions will be cash-settled and the bank will not physically receive or deliver electricity.
The transactions in which the bank proposes to engage will enable customers to meet legitimate financial and
1 For the purposes of this letter, the term “electricity derivative transactions” includes cash-settled electricity-linked transactions of every type—including derivative products such as futures, forwards, options, swaps, caps, floors, and collars, and options thereon—in which a portion of the return (including interest and/or principal and/or payment streams) is linked to the price of electricity.
Quarterly Journal, Vol. 21, No. 3, September 2002 69

risk management needs. Representative examples of these transactions described below, include swaps, options, and forwards contracts. The bank represents that each of these cash-settled transactions is used by market participants (including generators, industrial consumers, and marketers) in their management of price risks in a competitive and deregulated environment.2
Example 1: An electricity producer has contracts to provide electricity to manufacturers at market prices over the next two years. The electricity producer wants to receive fixed payments for electricity it produces over that period and obtain protection against price declines.
To eliminate electricity price risk, the producer enters into a cash-settled, electricity derivative swap with the bank. Under the swap, the producer pays the bank the floating market price for a notional amount of electricity over the next two years, and receives a fixed price for the same notional amount of electricity. Alternatively, the producer may achieve the same result through a series of cash-settled forward transactions with the bank. Under the cash-settled, forward transactions, the producer pays the bank the market value of a specified notional amount of electricity at a future date, and receives a fixed price for the same notional amount of electricity.
Example 2: An industrial consumer of electricity wants to fix its cost of electricity over the next two years and protect itself against price increases. The consumer enters into a cash-settled, electricity swap with the bank. Under the swap, the consumer
2 In support of the bank’s representation, it references the discussion in the Primer on Electricity Futures and Other Derivatives (U.S. Department of Energy-funded study by the Environmental Energy Technologies Division of the University of California Ernest Orlando Lawrence Berkeley National Laboratory, January 1998) (referred to as the “Electricity Derivatives Primer”) of all three of these instruments and their use in electricity markets, as follows. Swaps enable a customer (either a generator or an end-user) to lock in a specific price for the electricity in question, and can be tailored to meet the needs of the buyer and the seller (e.g., delivery points, time periods, etc.). Generators and end-users use both put-options (“floors”) and call-options (“caps”)—or a combination of puts and calls (“collars”)—to ensure a particular price range for the electricity in question. Under a forward contract, one party is obligated to buy, and the other to sell, a specified quantity of electricity at a fixed price on a given date in the future. At the maturity of a forward contract, the seller will deliver the electricity and the buyer will pay the purchase price. If, at that time, the market price of the electricity is higher than the price specified in the contract, then the buyer will have protected itself from price volatility. Conversely, if the market price is lower than the contract price, then the seller will have benefited from the terms of the contract. The “Electricity Derivatives Primer” emphasizes (at 43) that “[t]hese types of instruments work well because they can be tailored to the unique circumstances of generators, end users, and marketers.”
pays the bank a fixed price for a notional amount of electricity over the next two years, and receives the floating market price for the same notional amount of electricity. Alternatively, the consumer may achieve the same result through a series of cash-settled forward transactions with the bank. Under the forward transactions, the customer pays a fixed price for a notional amount of electricity, and the customer receives the market value of the same notional amount of electricity at a future date.
Example 3: An electricity consumer determines it will meet earnings projections only if the cost of a notional amount of electricity is $30 or lower. The consumer wants protection against prices rising over $30 and wants to retain the benefits of prices declining below $30. To achieve this protection, the consumer enters into a cash-settled cap option with the bank that entitles the consumer, for a fee, to receive the difference between $30 and a higher market price for electricity.
As the bank’s book of electricity derivative transactions increases, much of the market risk exposures from transactions with customers may offset each other. Consequently, the bank will not need to hedge each transaction individually. It will manage market risks on a “portfolio basis,” and hedge the resulting net risk exposures. There will normally be some residual market risk that is left unhedged, which will be subject to risk management limits as discussed below. However, this risk will be de minimis relative to the bank’s earnings and capital and will be consistent with a customer-driven business strategy. The bank’s hedges will include cash-settled electricity swaps, forwards, and options.
The bank represents that deregulation dramatically changed the operation of the power markets. For wholesale market participants, the price of power is a market rate variable that presents a risk profile analogous to that of interest rates, natural gas prices or equity prices. If left unmanaged, power prices can introduce volatility into a customer’s earnings. Moreover, as deregulation proceeds, the variety of customers exposed to power prices will broaden. At present, power generators and distributors face substantial electricity price risks. Institutional and corporate consumers (such as chemical companies, refineries, and heavy manufacturers) are also exposed. The bank has well-established relationships with these types of customers.
The bank’s proposed financial intermediary initiative relates exclusively to wholesale energy and power markets, and does not in any way relate to a business
70 Quarterly Journal, Vol. 21, No. 3, September 2002

with retail clients or to actual power procurement. Furthermore, because the bank proposes to solely engage in cash-settled electricity derivative transactions, the bank represents it will not be required to register as a power marketer with, or otherwise become subject to the supervision or jurisdiction of, the Federal Energy Regulatory Commission or any regional transmission or other organization which operates as a power exchange or power pool. And, as previously stated, the bank will not receive or deliver actual power as a result of any cash-settled electricity derivative transaction that it enters.
The bank believes that financial intermediation activities based on the price of electricity are a natural extension of the bank’s existing financial intermediation activities involving energy commodities. The bank states that energy derivative customers have requested that the bank offer electricity derivative transactions for many years. The bank’s electricity derivatives business will provide the bank’s customers risk management tools in substantively the same manner as the bank provides such tools in connection with its existing petroleum, natural gas, and related derivatives business. Essentially, the bank will offer electricity derivative transactions to customers as an additional means for them to meet their legitimate financial and risk management needs.
The bank has expertise in conducting cash-settled energy commodity derivative transactions. Consistent with this expertise, the bank has well-established policies, procedures, and controls that it applies to its commodity derivatives businesses. For example, the bank: (i) hedges the price risk arising from cash-settled commodity derivatives on a portfolio basis and values transactions using data sets and models implemented in accordance with bank standards; (ii) records credit exposure against customer credit limits; (iii) documents cash-settled customer transactions using the ISDA Master Agreement, with appropriate confirmations; and (iv) uses operations systems that permit booking and settlement of cash-settled commodity derivative transactions. The bank represents that it will conduct the proposed activities in customer-driven, cash-settled electricity derivatives consistent with the same policies, procedures, and controls it applies to its existing energy commodity derivatives business (“Electricity Derivative Product Controls”).
The bank commits that it will not commence its new cash-settled electricity derivatives business without first putting in place and implementing all necessary policies, procedures, and controls (including the “Electricity Derivative Product Controls”) to assure that (i) its electricity derivative business is customer-driven, cash-
settled, and meets all required regulatory standards for conducting a customer-driven derivative business, and (ii) the bank has in place all appropriate mechanisms to identify, monitor, limit, and control the risks inherent in conducting this business so that it complies with all applicable OCC guidance and requirements.3
The bank specifically acknowledges that, as contemplated by the OCC “Derivatives” handbook booklet and BC-277, an effective risk management process includes appropriate oversight and supervision, managerial and staff expertise, comprehensive policies and operating procedures, risk identification, measurement and management information systems, and effective risk control functions that oversee and ensure the continuing appropriateness of the risk management process. To manage the risks in its proposed cash-settled electricity derivatives business, the bank represents it will implement those policies, procedures, and controls set forth in OCC guidance, e.g., OCC “Derivatives” handbook booklet and BC-277, to assure the ongoing function and maintenance of an effective risk management process. In implementing those policies, procedures, and controls, the bank commits to conducting a full evaluation of (i) pricing, hedging (including portfolio hedging), processing, recordkeeping, documentation, accounting, “back office,” and risk management; (ii) the development of adequate knowledge, staff, oversight management, and technology (including contingency planning) to accommodate the activity; (iii) the implementation of appropriate controls (including the “Electricity Derivative Product Controls” discussed above); (iv) the establishment, implementation, and monitoring of appropriate risk management limits with respect to various types of risks—such as market risk, credit risk, and liquidity risk—associated with a customer-driven, cash-settled derivatives activity;4 and (v) Compliance Department training of personnel and development of a supervisory framework designed to ensure compliance with policies and procedures, including trading practices. Such a framework will strictly prohibit
3 See, e.g., OCC Comptroller’s Handbook, “Risk Management of Financial Derivatives” (January 1997 [print version; rev. for Web only, October 2001, available at http://www.occ.treas.gov/handbook/deriv.pdf]) (referred to as the OCC “Derivatives” handbook booklet); OCC Banking Circular No. 277 (October 27, 1993), reprinted in CCH Fed. Banking L. Rep. ¶ 62–152 (BC– 277); OCC Bulletin 94–31 (May 10, 1994), reprinted in CCH Fed. Banking L. Rep. ¶ 62–152.
4 For example, in the context of market and related risks of electricity derivatives, the bank will specifically address such matters as price volatility and concentration of market participants on a geographic and power exchange/power pool/individual customer basis. In the context of options, it will specifically address all of those characteristics identified in the OCC “Derivatives” handbook booklet (e.g., at 20–21 and Appendix B) as primary component measures of option sensitivity.
Quarterly Journal, Vol. 21, No. 3, September 2002 71

manipulative practices of any kind, including patterns of trading related to so-called “round tripping” of electricity derivatives transactions.5 Risk control, operations, accounting, legal, compliance, audit, and senior and line management will all be involved in assuring that the risks undertaken by the bank are comparable to, and are addressed in ways comparable to those applicable to, the bank’s existing energy-based derivative products and business.
The bank further commits that: [1] it will not engage in any electricity derivatives transactions that might physically settle without the OCC’s permission, [2] any trading in derivatives will be limited to cash-settled derivatives and done primarily to hedge residual open positions arising from customer transactions, and [3] its electricity derivative business will be customer driven; it will not be operated as a proprietary trading business. Transactions in electricity markets will permit the bank to manage and hedge, within well-controlled limits, the risks arising from valid, customer-driven, derivative transactions.
II. Discussion
In our opinion, the bank may establish a customer-driven, cash-settled electricity derivative business and hedge risks arising from these permissible banking activities, provided the bank has established an appropriate risk measurement and management process for its electricity derivative and hedging activities. This process is necessary for the bank to achieve its customer risk management objectives in a safe and sound manner and, thus, must be established before the OCC can determine that the proposed activities are permissible as part of the business of banking.
A. Financial Intermediation Transactions Involving Commodities are Authorized as Part of the Business of Banking
The OCC has previously concluded in a variety of contexts that national banks may engage in customer-driven, cash-settled financial intermediation transactions they are authorized to conduct as part of the business
5 For example, the head of the electricity derivatives desk will be provided with a “supervisory checklist” that describes the responsibilities of the position in monitoring transactions for market manipulation, including round-tripping. This individual will receive daily position and activity reports to review and monitor consistent with the best practices policy. The bank’s Compliance Division will also receive and review on a daily basis, position and activity reports and, on a quarterly basis, will test the appropriateness of derivative transactions and hedges and review documentary support. Bank employees involved in this business will be subject to applicable “Standards of Professional Conduct” and be required to attend annual compliance training.
of banking under 12 USC 24(Seventh). The OCC has recognized, for example, that commodity and commodity index derivatives are a modern form of traditional financial intermediation functions performed by banks and, based in part on that lineage, has concluded that national banks may make payments to, or receive payments from, customers under commodity derivative contracts in the event of a gain or loss in a metal or energy product or index thereon. These derivative transactions thus have been recognized as permissible for national banks as a financial intermediation activity.6
In these arrangements, national banks act as financial intermediaries between customers that want to manage risks resulting from the variations in the price of a particular commodity or commodity index. Customers do not deal directly with one another, but instead make payments to the intermediary bank.7 Under these authorities, the OCC has determined that national banks may engage in matched and unmatched commodity price index swaps and manage and warehouse them on a portfolio basis and originate, trade, and make markets in certain swap products and in other derivative instruments such as futures and options.8
Based on similar reasoning, the OCC has permitted national banks to engage in various commodity-linked transactions involving oil, gas, other hydrocarbons, and metals.9 “Commodity-linked transactions” include making
6 See OCC No-Objection Letter No. 90–1 (February 16, 1990), reprinted in [1989–1990 Transfer Binder] Fed. Banking L. Rep. ¶ 83,095 (“Unmatched Commodity Swap Letter”); OCC No-Objection Letter No. 87–5 (July 20, 1987), reprinted in [1988–1989 Transfer Binder] Fed. Banking L. Rep. (CCH) ¶ 84,034 (“Matched Commodity Swap Letter”). The Unmatched Commodity Swap Letter and the Matched Commodity Swap Letter predate NationsBank of North Carolina v. Variable Annuity Life Insurance Co., 513 U.S. 251 (1995) and characterized the commodity price index swaps as a financial intermediary activity incidental to a bank’s express power to engage in deposit and lending activities under 12 USC 24(Seventh). The OCC has since concluded that swap and funds intermediation activities are part of the business of banking. See OCC Interpretive Letter No. 892 (September 13, 2000), reprinted in [2000–2001 Transfer Binder] Fed. Banking L. Rep. (CCH) ¶ 81–411; OCC Letter from Ellen Broadman, director, Securities and Corporate Practices Division, OCC, to Barbara Moheit, regional counsel, FDIC (October 20, 1998) (unpublished) (“Broadman Letter”).
7 In the event of a customer default on a commodity swap, the bank makes payments in place of a defaulting customer’s obligation. The bank’s payment is an advance of funds for which the defaulting customer is obligated to reimburse the bank or is an exercise of a national bank’s authority to make loans.
8 OCC Letter from Jimmy F. Barton, deputy comptroller, Multinational Banking, to Carl Howard, associate general counsel, Citibank, N.A. (May 13, 1992) (unpublished); Unmatched Commodity Swap Letter, supra; Matched Commodity Swap Letter, supra.
9 See, e.g., OCC Interpretive Letter No. 684 (August 4, 1995), reprinted in [1993–1994 Transfer Binder] Fed. Banking L. Rep. (CCH) ¶ 83,632; OCC Letter from Robert Herman, Deputy Comptroller (October 4, 1994) (unpublished); OCC Interpretive Letter No. 632 (June 30, 1993), reprinted in [1993–1994 Transfer Binder] Fed. Banking L. Rep. (CCH) ¶ 83,516.
72 Quarterly Journal, Vol. 21, No. 3, September 2002

loans, taking deposits, and issuing debt instruments having terms related to commodity prices, sales, or indices, or measured in relation to the future; and entering into swaps, forwards, and other transactions relating to commodity prices and indices, or any combination thereof, in order to assist customers of the bank in managing their financial exposures.10 National banks may also originate, trade, and make markets in swap contracts and related derivative products, including cash-settled commodity swaps, caps, collars, floors, swaptions, captions, and other option-like products, based on their deposit taking, lending, and financial intermediation authority.11
Moreover, Congress has recognized the authority of national banks to engage in commodity derivative transactions. Under the Gramm–Leach–Bliley Act,12
banks may offer “identified banking products” without registration under the Securities Exchange Act of 1934,13
subject to banking law requirements and supervision. “Identified banking products” include certain swap agreements, defined as “any individually negotiated contract, agreement, warrant, note or option that is based, in whole or in part, on the value of, any interest in, or any quantitative measure or the occurrence of any event relating to, one or more commodities,14 securities, currencies, interest or other rates, indices, or other assets.”15 The GLBA conference report further observes that these products are among the “activities in which banks have traditionally engaged.”16 Congress’ recognition that banks engage in commodity derivative transactions and exemption of these activities from certain securities regulations is consistent with the OCC’s longstanding position that national banks have the authority to engage in customer-driven, cash-settled commodity derivative transactions, subject to safety and soundness considerations.
10 OCC Interpretive Letter No. 632, supra. 11 OCC Letter from Horace Sneed, Senior Attorney, LASD, (March 2, 1992)
(unpublished) (“Commodity Swap Portfolio Letter”). 12 Pub. L. No. 106–102 (1990) (effective May 12, 2001) (GLBA). 13 15 USC 78a et seq. 14 The Commodity Futures Trading Commission has recognized that entities
engage in derivative instruments on various commodities, including crude oil, refined oil products, natural gas, metals, and electricity (emphasis added). See, e.g., 2000 CFTC Ltr. LEXIS 248 (December 4, 2000).
15 (emphasis added). See P.L. 106–102, 113 Stat. 1338 (1999), sections 201, 202, 206.
16 H.R. Rep. No. 106–434 at 163 (1999) (Summary of Title II in Managers’ Statement).
B. The Bank’s Proposed Cash-Settled Electricity Derivative Business is Functionally Equivalent to other Bank Permissible Commodity Derivative Transactions
Electricity derivative transactions are a natural extension of the bank’s existing energy derivative products, e.g., petroleum, natural gas, and other hydrocarbon derivative products. Electricity swaps, forwards and options are the operational, structural, and functional equivalents of commodity derivative transactions the OCC has previously determined are permissible for national banks. Customer-driven, cash-settled commodity swaps, forwards, and options, whether based on metals or energy, including electricity, are privately negotiated contracts between the parties to the transactions. As such, the terms of the swaps, forwards, and options may be individually tailored to the specific risk sensitivities of customers, e.g., limiting exposure to price fluctuations and market uncertainties. And, by entering into a swap, forward, or option contract, the parties agree to make payments based on the performance of a particular commodity or commodity index, whether the commodity at issue is an energy product, such as petroleum, natural gas, a hydrocarbon or electricity, or metal, such as aluminum, lead, nickel, tin, zinc cobalt, iridium, and rhodium.
All of these contracts involve exchanges of payments akin to those that a bank makes and receives in connection with its role as a financial intermediary. Cash-settled electricity swaps are agreements between two counterparties that allow them to exchange fixed or floating payments based on a notional amount of electricity. Banks’ authority to enter into cash-settled swaps is well established.17
17 In the 1980s the OCC opined on the permissibility of national banks engaging in interest rate, currency, and commodity price index swaps and caps. See Matched Commodity Swap Letter; OCC Interpretive Letter No. 462 (December 19, 1988), reprinted in [1988–1989 Transfer Binder] Fed. Banking L. Rep. (CCH) ¶ 85,686; OCC Letter from J. Michael Shepherd, senior deputy comptroller, Corporate and Economic Programs (July 7, 1988) (unpublished). Then, in the 1990s, the OCC recognized that national banks may advise, structure, arrange, and execute transactions, as agent or principal, in connection with interest rate, basis rate, currency, currency coupon, and cash-settled commodity and equity swaps; swaptions, captions, and other option-like products; forward rate agreements, rate locks and spread locks, as well as similar products that national banks are permitted to originate and trade in and in which they may make markets. See OCC Interpretive Letter No. 725 (May 10, 1996), reprinted in [1995–1996 Transfer Binder] Fed. Banking L. Rep. (CCH) ¶ 81,040; OCC Interpretive Letter No. 652 (September 13, 1994), reprinted in [1994 Transfer Binder] Fed. Banking L. Rep. (CCH) ¶ 83,600; OCC Letter from Jimmy F. Barton, deputy comptroller, Multinational Banking, to Carl Howard, associate general counsel, Citibank, N.A. (May 13, 1992) (unpublished); Commodity Swap Portfolio Letter; Unmatched Commodity Swap Letter, supra.
Quarterly Journal, Vol. 21, No. 3, September 2002 73

Similar exchanges of payments may be achieved using forwards or options. For example, cash-settled electricity and other swaps are basically portfolios of cash-settled forwards. Each forward embedded in a swap transaction is an agreement to exchange payments based on a fixed or floating price at a certain future date. To illustrate, an electricity swap might consist of an exchange of payments based on a notional amount of electricity every month for the next five years. The instrument is a swap because the parties exchange the net of two offsetting payment streams, once a month. The swap is nothing more than a series of 60 separate forward contracts (12 months × 5 years). Although forward contracts may provide for physical delivery, cash-settled forwards are functionally equivalent to cash-settled swaps and permissible under banks’ deposit, lending and financial intermediary authorities.
Cash-settled options are similar to those cash-settled contracts, and thus permissible for national banks, in that options permit the holder to decide to execute a transaction in the future with the seller at a price determined today. Cash-settled options also are similar to cash-settled swaps and forwards in that two options—a cap and a floor—can replicate the cash flow of swap transactions. The same legal reasoning that allows national banks to engage in cash-settled electricity swaps applies to cash-settled forwards and options. Expansion of the bank’s existing commodity derivatives business to include cash-settled electricity-linked transactions will not effect any substantive change in the type or nature of the activity conducted, but only in their underlying basis (i.e., the particular commodity in question).
Finally, GLBA supports the permissibility of national banks entering into cash-settled electricity transactions, by not limiting the types of commodity derivative transactions exempt from registration under the 1934 [Securities Exchange] Act. Of course, for any commodity derivative transaction to be permissible for national banks, it must be permissible under national banking law, which requires, as discussed below, the bank to have appropriate risk measurement and management processes in place to conduct the activity.
As described in Section I, the bank’s proposal to engage in customer-driven, cash-settled electricity derivative business is intended to build on the bank’s existing client product offerings in petroleum, natural gas, and other energy-related financial instruments, and to provide to customers sophisticated risk management tools directly related to the accommodation of customer needs. Bank customers seek a creditworthy, sophisticated, and focused
counterparty to assist them in meeting their electricity price management needs and to act as an intermediary in derivative transactions on their behalf. The bank’s entry into the electricity derivatives business will provide customers a new, high credit quality counterparty for these transactions that is a trusted and known quantity to them and has significant experience, knowledge, and expertise. The bank’s ability to engage in a customer-driven, cash-settled, electricity derivative business will also benefit the bank’s customers by reducing customers’ financial risks associated with fluctuations in the prices of commodities.18
In addition, the bank will benefit from an electricity derivative business that enables it to diversify, expand its customer base, and increase revenues. The bank’s proposed cash-settled electricity derivative business will pose risks similar to those inherent in other types of cash-settled electricity derivatives transactions with which it is already familiar and for which it has demonstrated the ability to successfully manage, e.g., counterparty, price, basis, liquidity, credit, and compliance risks.
C. Hedging Risks Arising from Bank Permissible Commodity Derivative Activities Is Integral to Those Permissible Activities
The OCC has long recognized that using derivatives to hedge against the risks associated with bank permissible activities is an integral part of those permissible banking activities.19 Indeed, the OCC has determined that national banks may hedge bank permissible commodity derivative transactions with other commodity derivatives, such as futures, and swaps and options, and other over-the-counter (OTC) instruments, when conducted in a safe and sound manner as provided in OCC guidance.20 Hence, as with other commodity derivatives, national banks may hedge bank permissible electricity derivative transactions with
18 See, e.g., Unmatched Commodity Swap Letter.
19 Through hedging activities, national banks serve in a financial intermediation capacity. Longstanding OCC precedent recognizes the authority of national banks to act as financial intermediaries, engaging in permissible derivative transactions and assuming offsetting positions or hedges. In so doing, the bank protects itself against risks arising from established, permissible banking activities. As a result of hedging, a bank becomes an intermediary, by interposing itself between customers initiating bank permissible derivative transactions and those providing offsetting returns. Thus, because hedging is an integral part of financial intermediation services, the activity is permissible for national banks. OCC Interpretive Letter No. 896 (August 21, 2000), reprinted in [2000–2001 Transfer Binder] Fed. Banking L. Rep. (CCH) ¶ 81–415; Broadman Letter, supra.
20 OCC Interpretive Letter No. 684, supra; OCC Interpretive Letter No. 683 (July 28, 1995), reprinted in [1994–1995 Transfer Binder] Fed. Banking L. Rep. (CCH) ¶ 83,631; OCC Interpretive Letter No. 632, supra; Commodity Swap Portfolio Letter, supra.
74 Quarterly Journal, Vol. 21, No. 3, September 2002

electricity futures, and swaps and options and OTC derivative instruments. Further, the OCC has specifically endorsed the hedging of commodity transactions on a transaction-by-transaction or portfolio basis.21 The principles that the OCC has articulated in hedging commodity derivatives and related contexts are equally applicable to hedging customer-driven, cash-settled electricity derivative transactions.22
D. The Customer-Driven, Cash-Settled Electricity Derivative Transactions and Hedges Must Be Conducted in a Safe and Sound Manner
Engaging in customer-driven, cash-settled derivative transactions and hedges does not automatically qualify the activity as part of the business of banking. The nature of the electricity derivative activity proposed requires sophisticated risk measurement and management capacities on the part of a bank and qualified personnel, in order for the activity to actually function as described and to operate in a safe and sound manner. Thus, in order for the OCC to conclude that this proposed activity is permissible for the bank as “part of the business of banking” the bank must demonstrate to the satisfaction of the OCC that the bank has established an appropriate risk measurement and management process for its electricity derivative activity. As detailed further in the OCC “Derivatives” handbook booklet and BC-277, an effective risk measurement and management process includes board supervision, managerial and staff expertise, comprehensive policies and operating procedures, risk identification and measurement, and management information systems, as well as an effective risk control function that oversees and ensures the appropriateness of the risk management process.
21 See, e.g., Swap Portfolio Letter, supra; Unmatched Commodity Swap Letter, supra; Matched Commodity Swap Letter, supra.
22 Indeed, the Federal Reserve Board, in recognizing that “[b]anking organizations have developed a number of commodity . . . linked transactions . . . including commodity-indexed deposits, loans, debt issues, and derivative products, such as forwards, options, and swaps,” has noted that banks enter “into exchange-traded commodity or stock index futures and options in order to hedge the exposure inherent in these transactions.” (emphasis added). 12 CFR 208.128 (repealed so as to broaden the authority of state member banks to engage in derivative transactions without prior Federal Reserve Board approval; See 62 Fed. Reg. 15272, 15276 (Mar. 31, 1997) (discussing proposed repeal of section 208.128); see also 63 Fed. Reg. 37630 (July 13, 1998)). The OCC recognizes the similarity of different financial instruments, stating, for example, that “[d]espite their difference in form, options, futures and options on futures serve a similar function: enabling banks and investors to hedge against risk of . . . price changes relating to the underlying instruments.” OCC Interpretive Letter No. 896, supra. In the equity context, the OCC “Derivatives” handbook booklet makes clear (at 71) that banks that enter into swap transactions may hedge these transactions with “futures contracts, options, and similar over-the-counter instruments.” See also note 3 above.
In addition to a risk management program, the bank’s process must include an independent compliance monitoring program to ensure ongoing compliance with the specific commitments made by the bank, including its commitment to conduct its financial intermediation activities in electricity as a customer-driven, and non-proprietary trading business.23 The bank must have an adequate and effective compliance monitoring program that includes policies, training, independent surveillance, and well-defined exception approval and reporting procedures.
The OCC will make these determinations though the bank’s examiner-in-charge (EIC), and the bank may not commence the proposed activities unless and until its EIC has concluded that the foregoing standards are met.
III. Conclusion
The bank may conduct the proposed customer-driven, cash-settled electricity derivative business and hedge risks arising from these permissible banking activities as an extension of its existing energy-related commodities derivatives business, provided the bank has established, to the satisfaction of its EIC, an appropriate risk measurement and management process for its electricity derivative and hedging activities.
Julie L. Williams First Senior Deputy Comptroller and Chief Counsel
23 The OCC has long considered safety and soundness issues when determining whether an activity is part of, or incidental to the business of banking. See e.g., OCC Interpretive Letter No. 892, supra (national bank may engage in equity hedging activities only if it has an appropriate risk management process in place); OCC Banking Bulletin 96–5 (September 20, 1996) (replaced by OCC Bulletin 2000–23 (July 20, 2000)) (national bank’s purchase of life insurance is incidental to banking if it is convenient or useful in connection with the conduct of the bank’s business and consistent with safe and sound banking practices); OCC Interpretive Letter No. 684, supra (commodity hedging is a permissible banking activity provided the activity is conducted in accordance with safe and sound banking practices); Decision of the Office of the Comptroller of the Currency on the Request by Chase Manhattan Bank, N.A. to Offer the Chase Market Index Investment Deposit Account (August 8, 1988) (national banks have the authority to establish the amount of the payments to be made and received under their deposit and loan contracts and may determine the amount of those payments by reference to any index or standard as long as the bank complies with safe and sound banking principles and, in the case of loans, with state usury laws); OCC Interpretive Letter No. 376 (October 22, 1986) reprinted in [1985–1986 Transfer Binder] Fed. Banking L. Rep. (CCH) ¶ 85,600 (indemnification from losses resulting from participation in the bank’s fiduciary securities lending program is a permissible incidental activity provided the indemnification is consistent with OCC guidance and safety and soundness); OCC Interpretive Letter No. 274 (December 2, 1983) reprinted in [1983–1984 Transfer Binder] Fed. Banking L. Rep. (CCH) ¶ 85,438 (a national bank’s authority to lease its office space provides the authority for it to establish appropriate lease terms if consistent with safe and sound banking practices).
Quarterly Journal, Vol. 21, No. 3, September 2002 75

Mergers—April 1 to June 30, 2002
Page
Nonaffiliated mergers (mergers consummated involving two or more nonaffiliated operating banks) . . . . . . . . . . . . . . . 79
Affiliated mergers (mergers consummated involving affiliated operating banks) . . . . . . . . . . . . . . . . . . . . . . . . . . . . . . . 80
Affiliated mergers—thrift (mergers consummated involving affiliated national banks and savings and loan associations) . . . . . . . . . . . . . . . . . . . . . . . . . . . . . . . . . . . . . . . . . . . . . . . . . . . . . . . . . . . . . . . . . . . . . . . . . . . . . . 82
Quarterly Journal, Vol. 21, No. 3, September 2002 77

Mergers—April 1 to June 30, 2002
Most transactions in this section do not have accompanying decisions. In those cases, the OCC reviewed the competitive effects of the proposals by using its standard procedures for determining whether the transaction has minimal or no adverse competitive effects. The OCC found the proposals
satisfied its criteria for transactions that clearly had no or minimal adverse competitive effects. In addition, the Attorney General either filed no report on the proposed transaction or found that the proposal would not have a significantly adverse effect on competition.
Nonaffiliated mergers (mergers consummated involving two or more nonaffiliated operating banks), from April 1 to June 30, 2002
Title and location (charter number) Total assets
California Union Bank of California, National Association, San Francisco (021541) . . . . . . . . . . . . . . . . . . . . . . . . . . . . . . . . . . . . . . . . . . . . . . . 35,591,168,000
and First Western Bank, Simi Valley, California . . . . . . . . . . . . . . . . . . . . . . . . . . . . . . . . . . . . . . . . . . . . . . . . . . . . . . . . . . . . . . . . . . 208,216,000 merged on May 13, 2002 under the title of Union Bank of California, National Association, San Francisco (021541) . . . . . . . . . . 35,799,384,000
Georgia First National Bank of Griffin, Griffin (015572) . . . . . . . . . . . . . . . . . . . . . . . . . . . . . . . . . . . . . . . . . . . . . . . . . . . . . . . . . . . . . . . . . . . 248,038,000
and American Community Bank of Georgia, McDonough, Georgia . . . . . . . . . . . . . . . . . . . . . . . . . . . . . . . . . . . . . . . . . . . . . . . . . . 59,017,000 merged on May 31, 2002 under the title of First National Bank of Griffin, Griffin (015572) . . . . . . . . . . . . . . . . . . . . . . . . . . . . . . 307,055,000
New York Bath National Bank, Bath (010235) . . . . . . . . . . . . . . . . . . . . . . . . . . . . . . . . . . . . . . . . . . . . . . . . . . . . . . . . . . . . . . . . . . . . . . . . . . . . . 357,004,000
and Bank of Avoca, Avoca, New York . . . . . . . . . . . . . . . . . . . . . . . . . . . . . . . . . . . . . . . . . . . . . . . . . . . . . . . . . . . . . . . . . . . . . . . . . 18,413,000 merged on May 1, 2002 under the title of Bath National Bank, Bath (010235) . . . . . . . . . . . . . . . . . . . . . . . . . . . . . . . . . . . . . . . . . . 297,000,000
The National Bank of Florida, Florida (013825) . . . . . . . . . . . . . . . . . . . . . . . . . . . . . . . . . . . . . . . . . . . . . . . . . . . . . . . . . . . . . . . . . . . 100,364,000 and Provident Interim Bank, Montebello, New York . . . . . . . . . . . . . . . . . . . . . . . . . . . . . . . . . . . . . . . . . . . . . . . . . . . . . . . . . . . . . . 1,000
merged on April 23, 2002 under the title of The National Bank of Florida, Florida (013825) . . . . . . . . . . . . . . . . . . . . . . . . . . . . . . 100,364,000
Texas Independence Bank, National Association, Houston (018076) . . . . . . . . . . . . . . . . . . . . . . . . . . . . . . . . . . . . . . . . . . . . . . . . . . . . . . . . 106,927,000
and Regions Interim Bank, Birmingham, Alabama . . . . . . . . . . . . . . . . . . . . . . . . . . . . . . . . . . . . . . . . . . . . . . . . . . . . . . . . . . . . . . . 1,000 merged on May 16, 2002 under the title of Independence Bank, National Association, Houston (018076) . . . . . . . . . . . . . . . . . . . 106,927,000
Quarterly Journal, Vol. 21, No. 3, September 2002 79

Affiliated mergers (mergers consummated involving affiliated banks), from April 1 to June 30, 2002
Title and location (charter number) Total assets
Arizona BNC National Bank of Arizona, Tempe (024224) . . . . . . . . . . . . . . . . . . . . . . . . . . . . . . . . . . . . . . . . . . . . . . . . . . . . . . . . . . . . . . . . .
and BNC National Bank, Minneapolis, Minnesota (022973) . . . . . . . . . . . . . . . . . . . . . . . . . . . . . . . . . . . . . . . . . . . . . . . . . . . . . . . 573,163,000 merged on April 8, 2002 under the title of BNC National Bank, Tempe (024224) . . . . . . . . . . . . . . . . . . . . . . . . . . . . . . . . . . . . . . . 584,286,000
14,728,000
Colorado The First National Bank of Longmont, Longmont (011253) . . . . . . . . . . . . . . . . . . . . . . . . . . . . . . . . . . . . . . . . . . . . . . . . . . . . . . . . . 308,064,000
and First State Bank of Fort Collins, Fort Collins, Colorado . . . . . . . . . . . . . . . . . . . . . . . . . . . . . . . . . . . . . . . . . . . . . . . . . . . . . . . 97,529,000 merged on June 21, 2002 under the title of The First National Bank of Longmont, Longmont (011253) . . . . . . . . . . . . . . . . . . . . 405,593,000
Illinois MB Financial Bank, National Association, Chicago (013684) . . . . . . . . . . . . . . . . . . . . . . . . . . . . . . . . . . . . . . . . . . . . . . . . . . . . . . . . 60,000
and The First National Bank of Lincolnwood, Lincolnwood, Illinois (014752) . . . . . . . . . . . . . . . . . . . . . . . . . . . . . . . . . . . . . . . . 239,562,000 and MB Financial Bank, National Association, Chicago, Illinois (013684) . . . . . . . . . . . . . . . . . . . . . . . . . . . . . . . . . . . . . . . . . . . 3,080,603,000
merged on April 5, 2002 under the title of MB Financial Bank, National Association, Chicago (013684) . . . . . . . . . . . . . . . . . . . . 3,320,165,000
Bank One, National Association, Chicago (000008) . . . . . . . . . . . . . . . . . . . . . . . . . . . . . . . . . . . . . . . . . . . . . . . . . . . . . . . . . . . . . . . 161,022,572,000 and Bank One, Michigan, Detroit, Michigan . . . . . . . . . . . . . . . . . . . . . . . . . . . . . . . . . . . . . . . . . . . . . . . . . . . . . . . . . . . . . . . . . . . 20,825,649,000
merged on June 21, 2002 under the title of Bank One, National Association, Chicago (000008) . . . . . . . . . . . . . . . . . . . . . . . . . . . 181,848,221,000
Kansas TeamBank, National Association, Paola (003350) . . . . . . . . . . . . . . . . . . . . . . . . . . . . . . . . . . . . . . . . . . . . . . . . . . . . . . . . . . . . . . . . . 371,820,000
and Community Bank, Chapman, Kansas . . . . . . . . . . . . . . . . . . . . . . . . . . . . . . . . . . . . . . . . . . . . . . . . . . . . . . . . . . . . . . . . . . . . . 55,186,000 merged on June 21, 2002 under the title of TeamBank, National Association, Paola (003350) . . . . . . . . . . . . . . . . . . . . . . . . . . . . . 427,006,000
Horizon National Bank, Leawood (023748) . . . . . . . . . . . . . . . . . . . . . . . . . . . . . . . . . . . . . . . . . . . . . . . . . . . . . . . . . . . . . . . . . . . . . . 107,385,000 and Winterset State Bank, Harrisonville, Missouri . . . . . . . . . . . . . . . . . . . . . . . . . . . . . . . . . . . . . . . . . . . . . . . . . . . . . . . . . . . . . . . 36,520,000
merged on June 26, 2002 under the title of Horizon National Bank, Leawood (023748) . . . . . . . . . . . . . . . . . . . . . . . . . . . . . . . . . . 143,905,000
Minnesota Signal Bank National Association, Eagan (023582) . . . . . . . . . . . . . . . . . . . . . . . . . . . . . . . . . . . . . . . . . . . . . . . . . . . . . . . . . . . . . . . . 719,454,000
and Associated Bank Minnesota, Minneapolis, Minnesota . . . . . . . . . . . . . . . . . . . . . . . . . . . . . . . . . . . . . . . . . . . . . . . . . . . . . . . . 719,299,000 and Signal Bank South National Association, Red Wing, Minnesota (007307) . . . . . . . . . . . . . . . . . . . . . . . . . . . . . . . . . . . . . . . . . 339,588,000
merged on June 14, 2002 under the title of Associated Bank Minnesota National Association, Minneapolis (023582) . . . . . . . . . 1,778,341,000
Nebraska Cornerstone Bank, National Association, York (002683) . . . . . . . . . . . . . . . . . . . . . . . . . . . . . . . . . . . . . . . . . . . . . . . . . . . . . . . . . . . . 296,013,000
and Citizens State Bank, Polk, Nebraska . . . . . . . . . . . . . . . . . . . . . . . . . . . . . . . . . . . . . . . . . . . . . . . . . . . . . . . . . . . . . . . . . . . . . . 10,374,000 merged on April 4, 2002 under the title of Cornerstone Bank, National Association, York (002683) . . . . . . . . . . . . . . . . . . . . . . . . 306,387,000
New Jersey Valley National Bank, Passaic (015790) . . . . . . . . . . . . . . . . . . . . . . . . . . . . . . . . . . . . . . . . . . . . . . . . . . . . . . . . . . . . . . . . . . . . . . . . . 7,956,604,000
and VNB DEL, Inc., Wayne, New Jersey . . . . . . . . . . . . . . . . . . . . . . . . . . . . . . . . . . . . . . . . . . . . . . . . . . . . . . . . . . . . . . . . . . . . . 1,000 merged on December 26, 2001 under the title of Valley National Bank, Passaic (015790) . . . . . . . . . . . . . . . . . . . . . . . . . . . . . . . . 7,956,604,000
New Mexico Wells Fargo Bank New Mexico, National Association, Albuquerque (006187) . . . . . . . . . . . . . . . . . . . . . . . . . . . . . . . . . . . . . . . . . . . 4,467,817,000
and Bank of Santa Fe, National Association, Santa Fe, New Mexico (024317) . . . . . . . . . . . . . . . . . . . . . . . . . . . . . . . . . . . . . . . . 160,669,000 merged on June 15, 2002 under the title of Wells Fargo Bank New Mexico, National Association, Albuquerque (006187) . . . . . 4,645,991,000
North Carolina First Union National Bank, Charlotte (000001) . . . . . . . . . . . . . . . . . . . . . . . . . . . . . . . . . . . . . . . . . . . . . . . . . . . . . . . . . . . . . . . . . . . 232,195,000,000
and Wachovia Bank, National Association, Winston-Salem, North Carolina (001559) . . . . . . . . . . . . . . . . . . . . . . . . . . . . . . . . . . . 73,264,000,000 merged on April 1, 2002 under the title of Wachovia Bank, National Association, Charlotte (000001) . . . . . . . . . . . . . . . . . . . . . . 303,659,000,000
80 Quarterly Journal, Vol. 21, No. 3, September 2002

Affiliated mergers (continued) Title and location (charter number) Total assets
Ohio Charter One Bank, National Association, Cleveland (024340) . . . . . . . . . . . . . . . . . . . . . . . . . . . . . . . . . . . . . . . . . . . . . . . . . . . . . . . . 38,432,256,000
and Charter One Commercial, Albany, New York . . . . . . . . . . . . . . . . . . . . . . . . . . . . . . . . . . . . . . . . . . . . . . . . . . . . . . . . . . . . . . . . 316,836,000 merged on May 16, 2002 under the title of Charter One Bank, National Association, Cleveland (024340) . . . . . . . . . . . . . . . . . . . 38,809,538,000
Oklahoma Shamrock Bank, National Association, Coalgate (012529) . . . . . . . . . . . . . . . . . . . . . . . . . . . . . . . . . . . . . . . . . . . . . . . . . . . . . . . . . . . 42,480,000
and Shamrock Bank, National Association, Mountain View, Oklahoma (005656) . . . . . . . . . . . . . . . . . . . . . . . . . . . . . . . . . . . . . . . 27,330,000 merged on March 22, 2002 under the title of Shamrock Bank, National Association, Coalgate (012529) . . . . . . . . . . . . . . . . . . . . . 69,810,000
Tennessee First National Bank of Pulaski, Pulaski (014619) . . . . . . . . . . . . . . . . . . . . . . . . . . . . . . . . . . . . . . . . . . . . . . . . . . . . . . . . . . . . . . . . . . 341,142,000
and Bank of Belfast, Belfast, Tennessee . . . . . . . . . . . . . . . . . . . . . . . . . . . . . . . . . . . . . . . . . . . . . . . . . . . . . . . . . . . . . . . . . . . . . . . . 22,314,000 merged on April 12, 2002 under the title of First National Bank of Pulaski, Pulaski (014619) . . . . . . . . . . . . . . . . . . . . . . . . . . . . . 363,456,000
Texas Wells Fargo Bank Texas, National Association, San Antonio (014208) . . . . . . . . . . . . . . . . . . . . . . . . . . . . . . . . . . . . . . . . . . . . . . . . . . 21,131,093,000
and The First National Bank of Texas, Decatur, Texas (013623) . . . . . . . . . . . . . . . . . . . . . . . . . . . . . . . . . . . . . . . . . . . . . . . . . . . . . 390,720,000 and First State Bank of Texas, Denton, Texas . . . . . . . . . . . . . . . . . . . . . . . . . . . . . . . . . . . . . . . . . . . . . . . . . . . . . . . . . . . . . . . . . . . . 2,160,328,000
merged on June 15, 2002 under the title of Wells Fargo Bank Texas, National Association, San Antonio (014208) . . . . . . . . . . . . . 23,913,786,000
Virginia Salem Bank and Trust, National Association, Salem (021516) . . . . . . . . . . . . . . . . . . . . . . . . . . . . . . . . . . . . . . . . . . . . . . . . . . . . . . . . 252,007,000
and FNB—Southwest, National Association, Roanoke, Virginia (024274) . . . . . . . . . . . . . . . . . . . . . . . . . . . . . . . . . . . . . . . . . . . . . 88,429,000 merged on May 6, 2002 under the title of FNB Salem Bank & Trust, National Association, Salem (021516) . . . . . . . . . . . . . . . . . . 340,436,000
Wisconsin Associated Trust Company, National Association, Milwaukee (023250) . . . . . . . . . . . . . . . . . . . . . . . . . . . . . . . . . . . . . . . . . . . . . . . . 21,182,000
and Signal Trust Company National Association, Eagan, Minnesota (023624) . . . . . . . . . . . . . . . . . . . . . . . . . . . . . . . . . . . . . . . . . . 1,971,000 merged on April 1, 2002 under the title of Associated Trust Company, National Association, Milwaukee (023250) . . . . . . . . . . . . 23,153,000
Quarterly Journal, Vol. 21, No. 3, September 2002 81

Affiliated mergers—thrift (mergers consummated involving affiliated national banks and savings and loan associations), from April 1 to June 30, 2002
Title and location (charter number) Total assets
Ohio First National Bank, Orrville (013742) . . . . . . . . . . . . . . . . . . . . . . . . . . . . . . . . . . . . . . . . . . . . . . . . . . . . . . . . . . . . . . . . . . . . . . . . . . . 198,309,000
and Peoples Federal Savings & Loan Association of Massillon, Massillon, Ohio . . . . . . . . . . . . . . . . . . . . . . . . . . . . . . . . . . . . . . . . 108,840,000 merged on April 3, 2002 under the title of First National Bank, Orrville (013742) . . . . . . . . . . . . . . . . . . . . . . . . . . . . . . . . . . . . . . . 297,834,000
Peoples Bank, National Association, Marietta (005552) . . . . . . . . . . . . . . . . . . . . . . . . . . . . . . . . . . . . . . . . . . . . . . . . . . . . . . . . . . . . . 1,198,581,000 and The Guernsey Bank, FSB, Cambridge, Ohio . . . . . . . . . . . . . . . . . . . . . . . . . . . . . . . . . . . . . . . . . . . . . . . . . . . . . . . . . . . . . . . . . 110,000,000
merged on June 15, 2002 under the title of Peoples Bank, National Association, Marietta (005552) . . . . . . . . . . . . . . . . . . . . . . . . . 1,308,581,000
Tennessee Union Planters Bank, National Association, Memphis (013349) . . . . . . . . . . . . . . . . . . . . . . . . . . . . . . . . . . . . . . . . . . . . . . . . . . . . . . . 32,257,447,000
and Jefferson Heritage Bank, Denton, Texas . . . . . . . . . . . . . . . . . . . . . . . . . . . . . . . . . . . . . . . . . . . . . . . . . . . . . . . . . . . . . . . . . . . . 451,406,000 merged on June 21, 2002 under the title of Union Planters Bank, National Association, Memphis (013349) . . . . . . . . . . . . . . . . . . 32,708,853,000
82 Quarterly Journal, Vol. 21, No. 3, September 2002

Tables on the Corporate Structure of the National Banking System
Page
Changes in the corporate structure of the national banking system, by state, January 1 to June 30, 2002 . . . . . . . . . . . . 85
Applications for new, full-service national bank charters, approved and denied, by state, January 1 to June 30, 2002 . . 86
New, full-service national bank charters issued, January 1 to June 30, 2002. . . . . . . . . . . . . . . . . . . . . . . . . . . . . . . . . . . 87
New, limited-purpose national bank charters issued, January 1 to June 30, 2002 . . . . . . . . . . . . . . . . . . . . . . . . . . . . . . . 88
State-chartered banks converted to full-service national banks, January 1 to June 30, 2002 . . . . . . . . . . . . . . . . . . . . . . . 89
State-chartered banks converted to limited-purpose national banks, January 1 to June 30, 2002 . . . . . . . . . . . . . . . . . . . 90
Nonbanking institutions converted to full-service national banks, January 1 to June 30, 2002 . . . . . . . . . . . . . . . . . . . . . 91
Nonbanking institutions converted to limited-purpose national banks, January 1 to June 30, 2002 . . . . . . . . . . . . . . . . . 92
Applications for national bank charters, by state and charter type, January 1 to June 30, 2002 . . . . . . . . . . . . . . . . . . . . 93
Failed national bank paid out by the FDIC, January 1 to June 30, 2002 . . . . . . . . . . . . . . . . . . . . . . . . . . . . . . . . . . . . . . 94
National banks merged out of the national banking system, January 1 to June 30, 2002 . . . . . . . . . . . . . . . . . . . . . . . . . 95
National banks converted out of the national banking system, January 1 to June 30, 2002. . . . . . . . . . . . . . . . . . . . . . . . 96
Federal branches and agencies of foreign banks in operation, January 1 to June 30, 2002 . . . . . . . . . . . . . . . . . . . . . . . . 97
Quarterly Journal, Vol. 21, No. 3, September 2002 83

Changes in the corporate structure of the national banking system, by state, January 1 to June 30, 2002
12 USC 214
In operation Organized Converted to Merged with In operation January 1, and open Voluntary non-national non-national June 30,
2002 business Merged liquidations Payouts institutions institutions 2002
Alabama . . . . . . . . . . . . . . . . . 23 0 0 0 0 1 0 22 Alaska . . . . . . . . . . . . . . . . . . . 4 0 0 0 0 0 0 4 Arizona . . . . . . . . . . . . . . . . . . 18 1 2 0 1 0 0 16 Arkansas . . . . . . . . . . . . . . . . . 42 1 0 0 0 0 0 43 California . . . . . . . . . . . . . . . . 92 3 4 0 0 1 1 89 Colorado . . . . . . . . . . . . . . . . . 55 1 2 0 0 0 1 53 Connecticut . . . . . . . . . . . . . . . 10 1 0 0 0 0 0 11 Delaware . . . . . . . . . . . . . . . . . 22 0 1 0 0 0 1 20 District of Columbia . . . . . . . . 5 0 0 0 0 0 0 5 Florida . . . . . . . . . . . . . . . . . . . 80 0 0 0 2 2 0 76 Georgia . . . . . . . . . . . . . . . . . . 60 6 3 0 0 0 0 63 Hawaii . . . . . . . . . . . . . . . . . . . 1 0 0 0 0 0 0 1 Idaho . . . . . . . . . . . . . . . . . . . . 2 0 0 0 0 0 0 2 Illinois . . . . . . . . . . . . . . . . . . . 186 0 3 0 0 0 1 182 Indiana. . . . . . . . . . . . . . . . . . . 36 0 0 0 0 1 0 35 Iowa. . . . . . . . . . . . . . . . . . . . . 48 3 0 0 0 0 0 51 Kansas . . . . . . . . . . . . . . . . . . . 105 0 0 0 0 0 0 105 Kentucky . . . . . . . . . . . . . . . . . 54 0 1 0 0 0 0 53 Louisiana. . . . . . . . . . . . . . . . . 17 0 0 0 0 0 0 17 Maine . . . . . . . . . . . . . . . . . . . 7 0 0 0 0 0 0 7 Maryland . . . . . . . . . . . . . . . . . 13 0 0 0 0 1 0 12 Massachusetts . . . . . . . . . . . . . 23 2 1 0 0 0 0 24 Michigan . . . . . . . . . . . . . . . . . 28 1 0 0 0 0 0 29 Minnesota . . . . . . . . . . . . . . . . 130 3 4 0 0 0 1 128 Mississippi . . . . . . . . . . . . . . . 20 0 0 0 0 0 0 20 Missouri . . . . . . . . . . . . . . . . . 46 2 0 0 0 0 0 48 Montana . . . . . . . . . . . . . . . . . 18 0 2 0 0 0 0 16 Nebraska . . . . . . . . . . . . . . . . . 79 1 1 0 0 0 2 77 Nevada . . . . . . . . . . . . . . . . . . 8 0 0 0 0 0 0 8 New Hampshire . . . . . . . . . . . 7 0 1 0 0 0 0 6 New Jersey . . . . . . . . . . . . . . . 24 2 1 0 0 0 0 26 New Mexico . . . . . . . . . . . . . . 15 1 1 0 0 0 0 15 New York. . . . . . . . . . . . . . . . . 62 1 2 0 0 0 1 59 North Carolina . . . . . . . . . . . . 8 0 1 0 0 0 0 7 North Dakota. . . . . . . . . . . . . . 15 0 0 0 0 0 0 15 Ohio. . . . . . . . . . . . . . . . . . . . . 92 2 1 0 0 0 2 91 Oklahoma . . . . . . . . . . . . . . . . 99 0 1 0 0 2 0 96 Oregon. . . . . . . . . . . . . . . . . . . 4 0 0 0 0 0 0 4 Pennsylvania . . . . . . . . . . . . . . 86 1 1 0 0 0 2 84 Rhode Island . . . . . . . . . . . . . . 4 0 0 0 0 0 0 5 South Carolina . . . . . . . . . . . . 25 0 0 0 0 0 0 25 South Dakota. . . . . . . . . . . . . . 20 1 0 0 0 0 0 21 Tennessee . . . . . . . . . . . . . . . . 28 0 0 0 0 0 0 28 Texas . . . . . . . . . . . . . . . . . . . . 346 4 1 0 0 4 5 340 Utah. . . . . . . . . . . . . . . . . . . . . 7 0 0 0 0 0 0 7 Vermont. . . . . . . . . . . . . . . . . . 12 0 4 0 0 0 0 8 Virginia . . . . . . . . . . . . . . . . . . 38 0 2 0 0 0 0 36 Washington . . . . . . . . . . . . . . . 17 1 1 0 0 0 1 16 West Virginia. . . . . . . . . . . . . . 24 0 0 0 0 1 1 22 Wisconsin . . . . . . . . . . . . . . . . 52 0 0 0 0 1 0 51 Wyoming. . . . . . . . . . . . . . . . . 20 0 0 0 0 0 0 20
United States: . . . . . . . . . . . . . 2,238 38 41 0 3 14 19 2,199
for
Notes: The column “organized and opened for business” includes all state banks converted to national banks as well as newly formed national banks. The column titled “merged” includes all mergers, consolidations, and purchases and assumptions of branches in which the resulting institution is a nationally chartered bank. Also included in this column are immediate FDIC-assisted “merger” transactions in which the resulting institution is a nationally chartered bank. The column titled “voluntary liquidations” includes only straight liquidations of national banks. No liquidation pursuant to a purchase and assumption transaction is included in this total. Liquidations resulting from purchases and assumptions are included in the “merged” column. The column titled “payouts” includes failed national banks in which the FDIC is named receiver and no other depository institution is named as successor. The column titled “merged with non-national institutions” includes all mergers, consolidations, and purchases and assumptions of branches in which the resulting institution is a non-national institution. Also included in this column are immediate FDIC-assisted “merger” transactions in which the resulting institution is a non-national institution.
Quarterly Journal, Vol. 21, No. 3, September 2002 85

Applications for new, full-service national bank charters, approved and denied, by state, January 1 to June 30, 2002
Title and location Approved
Arizona Community Bank of Arizona, National Association, Wickenburg . . . . . . . . . . . . . . . . . . . . . . . . . . . . . . . . . . . . . . . January 3, 2002
California Landmark National Bank, Solana Beach . . . . . . . . . . . . . . . . . . . . . . . . . . . . . . . . . . . . . . . . . . . . . . . . . . . . . . . . . . February 25, 2002 Orange County Business Bank, National Association, Newport Beach . . . . . . . . . . . . . . . . . . . . . . . . . . . . . . . . . . . April 29, 2002 Pacific Commerce Bank, National Association, Los Angeles . . . . . . . . . . . . . . . . . . . . . . . . . . . . . . . . . . . . . . . . . . April 29, 2002
Florida Infinity Bank, National Association, West Palm Beach . . . . . . . . . . . . . . . . . . . . . . . . . . . . . . . . . . . . . . . . . . . . . . . May 21, 2002
Iowa United Bank & Trust National Association, Marshalltown . . . . . . . . . . . . . . . . . . . . . . . . . . . . . . . . . . . . . . . . . . . . March 20, 2002
Kansas First Commerce Bank, National Association, Marysville . . . . . . . . . . . . . . . . . . . . . . . . . . . . . . . . . . . . . . . . . . . . . June 5, 2002
Kentucky First National Bank of Lexington, Lexington . . . . . . . . . . . . . . . . . . . . . . . . . . . . . . . . . . . . . . . . . . . . . . . . . . . . . . . May 17, 2002
Missouri Community National Bank, Monett . . . . . . . . . . . . . . . . . . . . . . . . . . . . . . . . . . . . . . . . . . . . . . . . . . . . . . . . . . . . . . June 12, 2002
New Jersey Grand Bank, National Association, Hamilton. . . . . . . . . . . . . . . . . . . . . . . . . . . . . . . . . . . . . . . . . . . . . . . . . . . . . . . January 22, 2002
South Carolina Carolina National Bank and Trust Company, Columbia . . . . . . . . . . . . . . . . . . . . . . . . . . . . . . . . . . . . . . . . . . . . . . March 28, 2002
Texas Community National Bank, Bellaire. . . . . . . . . . . . . . . . . . . . . . . . . . . . . . . . . . . . . . . . . . . . . . . . . . . . . . . . . . . . . . January 14, 2002 Worthington National Bank, Arlington. . . . . . . . . . . . . . . . . . . . . . . . . . . . . . . . . . . . . . . . . . . . . . . . . . . . . . . . . . . . May 14, 2002
Virginia Bank of Louisa, National Association, Louisa . . . . . . . . . . . . . . . . . . . . . . . . . . . . . . . . . . . . . . . . . . . . . . . . . . . . . . March 15, 2002 Citizens National Bank, Windsor . . . . . . . . . . . . . . . . . . . . . . . . . . . . . . . . . . . . . . . . . . . . . . . . . . . . . . . . . . . . . . . . January 18, 2002
California LaSalle Interim Bank National Association, San Diego . . . . . . . . . . . . . . . . . . . . . . . . . . . . . . . . . . . . . . . . . . . . . . . January 15, 2002
Minnesota Securian Trust Company, National Association, St. Paul . . . . . . . . . . . . . . . . . . . . . . . . . . . . . . . . . . . . . . . . . . . . . . January 9, 2002
Denied
86 Quarterly Journal, Vol. 21, No. 3, September 2002

New, full-service national bank charters issued, January 1 to June 30, 2002
Title and location Charter number Date opened
Arizona Community Bank of Arizona, National Association, Wickenburg . . . . . . . . . . . . . . . . . . . . . . . . . . . . . . . . . . . . . . . 024320 January 29, 2002
California Pacific Capital Bank, National Association, Santa Barbara . . . . . . . . . . . . . . . . . . . . . . . . . . . . . . . . . . . . . . . . . . . . 024319 March 29, 2002 Granite Community Bank, National Association, Granite Bay . . . . . . . . . . . . . . . . . . . . . . . . . . . . . . . . . . . . . . . . . 024289 June 4, 2002
Colorado Southern Colorado National Bank, Pueblo . . . . . . . . . . . . . . . . . . . . . . . . . . . . . . . . . . . . . . . . . . . . . . . . . . . . . . . . . 024253 March 1, 2002
Georgia First National Bank West Metro, Dallas . . . . . . . . . . . . . . . . . . . . . . . . . . . . . . . . . . . . . . . . . . . . . . . . . . . . . . . . . . . 024261 March 25, 2002 First Southern National Bank, Statesboro. . . . . . . . . . . . . . . . . . . . . . . . . . . . . . . . . . . . . . . . . . . . . . . . . . . . . . . . . . 024254 February 5, 2002 The National Bank of Gainesville, Gainesville . . . . . . . . . . . . . . . . . . . . . . . . . . . . . . . . . . . . . . . . . . . . . . . . . . . . . 024169 March 25, 2002 SouthBank, National Association, Woodstock . . . . . . . . . . . . . . . . . . . . . . . . . . . . . . . . . . . . . . . . . . . . . . . . . . . . . . 024152 May 20, 2002
Iowa United Bank & Trust National Association, Marshalltown . . . . . . . . . . . . . . . . . . . . . . . . . . . . . . . . . . . . . . . . . . . . 024346 June 17, 2002
Massachusetts Leader Bank, National Association, Arlington . . . . . . . . . . . . . . . . . . . . . . . . . . . . . . . . . . . . . . . . . . . . . . . . . . . . . . 024131 May 8, 2002
Nebraska Citizens National Bank in Loup City, Loup City . . . . . . . . . . . . . . . . . . . . . . . . . . . . . . . . . . . . . . . . . . . . . . . . . . . . 024280 January 28, 2002
New Jersey Grand Bank, National Association, Hamilton. . . . . . . . . . . . . . . . . . . . . . . . . . . . . . . . . . . . . . . . . . . . . . . . . . . . . . . 024268 March 1, 2002
New Mexico Bank of Santa Fe, National Association, Santa Fe . . . . . . . . . . . . . . . . . . . . . . . . . . . . . . . . . . . . . . . . . . . . . . . . . . . 024317 January 21, 2002
Ohio Signature Bank, National Association, Toledo . . . . . . . . . . . . . . . . . . . . . . . . . . . . . . . . . . . . . . . . . . . . . . . . . . . . . . 024264 April 2, 2002
Texas Community National Bank, Bellaire. . . . . . . . . . . . . . . . . . . . . . . . . . . . . . . . . . . . . . . . . . . . . . . . . . . . . . . . . . . . . . 024303 June 17, 2002 The Right Bank For Texas, National Association, Houston . . . . . . . . . . . . . . . . . . . . . . . . . . . . . . . . . . . . . . . . . . . . 024263 May 13, 2002
Washington Eastside Commercial Bank, National Association, Bellevue . . . . . . . . . . . . . . . . . . . . . . . . . . . . . . . . . . . . . . . . . . . 024180 April 3, 2002
Quarterly Journal, Vol. 21, No. 3, September 2002 87

New, limited-purpose national bank charters issued, January 1 to June 30, 2002
Title and location Charter number Date opened
California LaSalle Interim Bank National Association, San Diego . . . . . . . . . . . . . . . . . . . . . . . . . . . . . . . . . . . . . . . . . . . . . . . 024330 January 31, 2002
Georgia U.S. Bank Trust National Association, Atlanta. . . . . . . . . . . . . . . . . . . . . . . . . . . . . . . . . . . . . . . . . . . . . . . . . . . . . . 024315 January 10, 2002
Massachusetts Family Capital Trust Company, National Association, Boston . . . . . . . . . . . . . . . . . . . . . . . . . . . . . . . . . . . . . . . . . 024130 March 1, 2002
Minnesota Securian Trust Company, National Association, St. Paul . . . . . . . . . . . . . . . . . . . . . . . . . . . . . . . . . . . . . . . . . . . . . . 024310 February 22, 2002
Missouri Country Club Trust Company, National Association, Kansas City . . . . . . . . . . . . . . . . . . . . . . . . . . . . . . . . . . . . . . 024290 March 8, 2002
New Jersey Alger National Trust Company, Morristown . . . . . . . . . . . . . . . . . . . . . . . . . . . . . . . . . . . . . . . . . . . . . . . . . . . . . . . 024231 January 28, 2002
Pennsylvania First National Trust Company, Hermitage . . . . . . . . . . . . . . . . . . . . . . . . . . . . . . . . . . . . . . . . . . . . . . . . . . . . . . . . . 024283 January 18, 2002
88 Quarterly Journal, Vol. 21, No. 3, September 2002

State-chartered banks converted to full-service national banks, January 1 to June 30, 2002
Title and location (charter number) Effective date Total assets
Arkansas First National Bank (024333)
conversion of First Bank of Montgomery County, Mt. Ida . . . . . . . . . . . . . . . . . . . . . . . . . . . . . . . . . . . . . . . . . . . April 1, 2002 77,601,000
Iowa Western Bank & Trust National Association (024328)
conversion of Western Bank & Trust, Moville . . . . . . . . . . . . . . . . . . . . . . . . . . . . . . . . . . . . . . . . . . . . . . . . . . . . . January 1, 2002 58,620,000
First National Bank Midwest conversion of Iowa Trust & Savings Bank, Oskaloosa (024267) . . . . . . . . . . . . . . . . . . . . . . . . . . . . . . . . . . . . . . . January 22, 2002 98,498,000
Minnesota Merchants Bank, National Association (024302)
conversion of Hampton Bank, Hampton. . . . . . . . . . . . . . . . . . . . . . . . . . . . . . . . . . . . . . . . . . . . . . . . . . . . . . . . . . February 1, 2002 94,512,000
Merchants Bank, National Association (024301) conversion of La Crescent State Bank, La Crescent . . . . . . . . . . . . . . . . . . . . . . . . . . . . . . . . . . . . . . . . . . . . . . . . . February 1, 2002 42,439,000
Missouri UMB Bank, Warsaw, National Association (024273)
conversion of UMB Bank, Warsaw, Warsaw . . . . . . . . . . . . . . . . . . . . . . . . . . . . . . . . . . . . . . . . . . . . . . . . . . . . . . January 29, 2002 73,298,000
Texas Friona State Bank, National Association (024321)
conversion of Friona State Bank, Friona. . . . . . . . . . . . . . . . . . . . . . . . . . . . . . . . . . . . . . . . . . . . . . . . . . . . . . . . . . January 31, 2002 79,303,000
Quarterly Journal, Vol. 21, No. 3, September 2002 89

State-chartered banks converted to limited-purpose national banks, January 1 to June 30, 2002
Title and location (charter number) Effective date Total assets
Connecticut Phoenix National Trust Company (024247)
conversion of Phoenix Charter Oak Trust Company, Hartford . . . . . . . . . . . . . . . . . . . . . . . . . . . . . . . . . . . . . . . . . January 9, 2002 21,011,800,000
Georgia Synovus Trust Company, National Association (024350)
conversion of Synovus Trust Company, Columbus . . . . . . . . . . . . . . . . . . . . . . . . . . . . . . . . . . . . . . . . . . . . . . . . . June 1, 2002 16,125,000
Michigan CB Wealth Management, National Association (024305)
conversion of Citizens Bank, Flint . . . . . . . . . . . . . . . . . . . . . . . . . . . . . . . . . . . . . . . . . . . . . . . . . . . . . . . . . . . . . . March 1, 2002 2,600,000
South Dakota Citibank USA, National Association (024281)
conversion of Hurley State Bank, Sioux Falls . . . . . . . . . . . . . . . . . . . . . . . . . . . . . . . . . . . . . . . . . . . . . . . . . . . . . January 3, 2002 323,200,000
Texas Legacy Trust Company, National Association (024338)
conversion of Legacy Trust Company, Houston . . . . . . . . . . . . . . . . . . . . . . . . . . . . . . . . . . . . . . . . . . . . . . . . . . . . March 29, 2002 835,000,000
90 Quarterly Journal, Vol. 21, No. 3, September 2002

Nonbanking institutions converted to full-service national banks, January 1 to June 30, 2002
Title and location (charter number) Effective date Total assets
Ohio Charter One Bank, National Association (024340)
conversion of Charter One Bank, F.S.B., Cleveland . . . . . . . . . . . . . . . . . . . . . . . . . . . . . . . . . . . . . . . . . . . . . . . . . May 7, 2002 37,178,142,000
Quarterly Journal, Vol. 21, No. 3, September 2002 91

Nonbanking institutions converted to limited-purpose national banks, January 1 to June 30, 2002
Title and location (charter number) Effective date Total assets
New York UBS PaineWebber Trust Company, National Association (024286)
conversion of UBS PaineWebber Trust Company, New York. . . . . . . . . . . . . . . . . . . . . . . . . . . . . . . . . . . . . . . . . . January 31, 2002 5,387,000
92 Quarterly Journal, Vol. 21, No. 3, September 2002
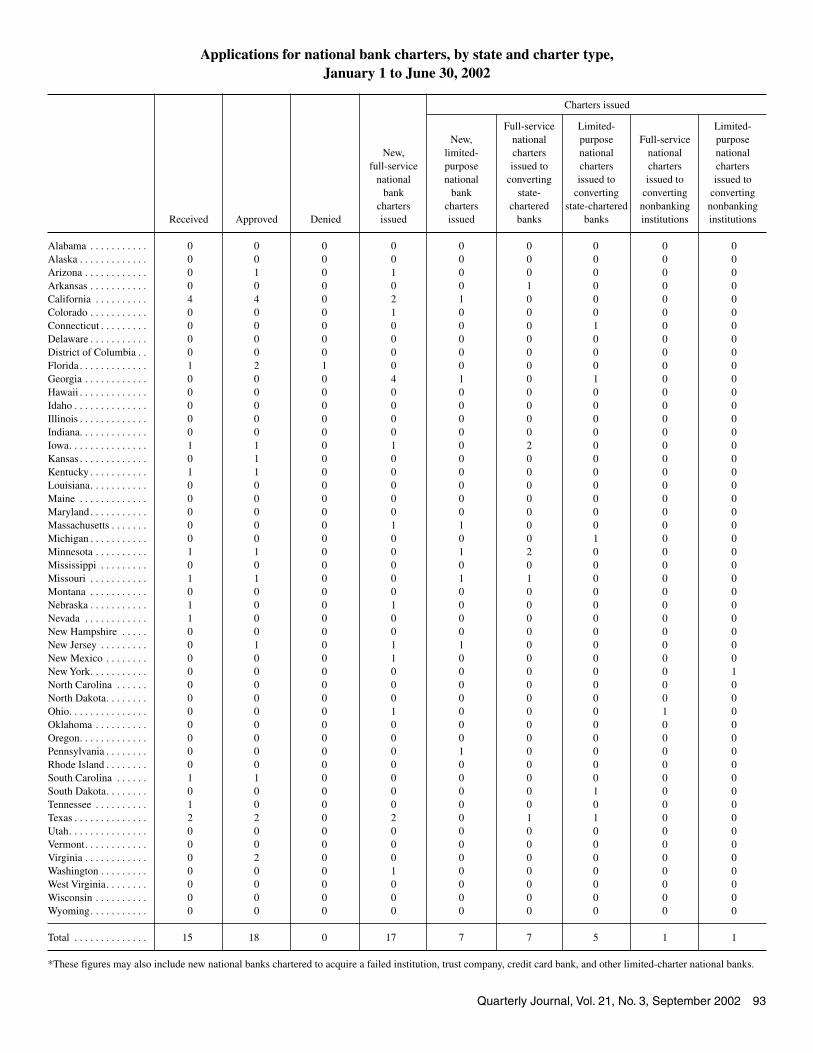
Applications for national bank charters, by state and charter type, January 1 to June 30, 2002
Charters issued
Full-service Limited-New, national purpose Full-service purpose
New, limited- charters national national national full-service purpose issued to charters charters charters
national national converting issued to issued to issued to bank state- converting converting converting
charters chartered state-chartered nonbanking nonbanking Received ved Denied issued issued banks banks institutions institutions
Alabama . . . . . . . . . . . 0 0 0 0 0 0 0 0 0 Alaska . . . . . . . . . . . . . 0 0 0 0 0 0 0 0 0 Arizona . . . . . . . . . . . . 0 1 0 1 0 0 0 0 0 Arkansas . . . . . . . . . . . 0 0 0 0 0 1 0 0 0 California . . . . . . . . . . 4 4 0 2 1 0 0 0 0 Colorado . . . . . . . . . . . 0 0 0 1 0 0 0 0 0 Connecticut . . . . . . . . . 0 0 0 0 0 0 1 0 0 Delaware . . . . . . . . . . . 0 0 0 0 0 0 0 0 0 District of Columbia . . 0 0 0 0 0 0 0 0 0 Florida . . . . . . . . . . . . . 1 2 1 0 0 0 0 0 0 Georgia . . . . . . . . . . . . 0 0 0 4 1 0 1 0 0 Hawaii . . . . . . . . . . . . . 0 0 0 0 0 0 0 0 0 Idaho . . . . . . . . . . . . . . 0 0 0 0 0 0 0 0 0 Illinois . . . . . . . . . . . . . 0 0 0 0 0 0 0 0 0 Indiana. . . . . . . . . . . . . 0 0 0 0 0 0 0 0 0 Iowa. . . . . . . . . . . . . . . 1 1 0 1 0 2 0 0 0 Kansas . . . . . . . . . . . . . 0 1 0 0 0 0 0 0 0 Kentucky . . . . . . . . . . . 1 1 0 0 0 0 0 0 0 Louisiana. . . . . . . . . . . 0 0 0 0 0 0 0 0 0 Maine . . . . . . . . . . . . . 0 0 0 0 0 0 0 0 0 Maryland . . . . . . . . . . . 0 0 0 0 0 0 0 0 0 Massachusetts . . . . . . . 0 0 0 1 1 0 0 0 0 Michigan . . . . . . . . . . . 0 0 0 0 0 0 1 0 0 Minnesota . . . . . . . . . . 1 1 0 0 1 2 0 0 0 Mississippi . . . . . . . . . 0 0 0 0 0 0 0 0 0 Missouri . . . . . . . . . . . 1 1 0 0 1 1 0 0 0 Montana . . . . . . . . . . . 0 0 0 0 0 0 0 0 0 Nebraska . . . . . . . . . . . 1 0 0 1 0 0 0 0 0 Nevada . . . . . . . . . . . . 1 0 0 0 0 0 0 0 0 New Hampshire . . . . . 0 0 0 0 0 0 0 0 0 New Jersey . . . . . . . . . 0 1 0 1 1 0 0 0 0 New Mexico . . . . . . . . 0 0 0 1 0 0 0 0 0 New York. . . . . . . . . . . 0 0 0 0 0 0 0 0 1 North Carolina . . . . . . 0 0 0 0 0 0 0 0 0 North Dakota. . . . . . . . 0 0 0 0 0 0 0 0 0 Ohio. . . . . . . . . . . . . . . 0 0 0 1 0 0 0 1 0 Oklahoma . . . . . . . . . . 0 0 0 0 0 0 0 0 0 Oregon. . . . . . . . . . . . . 0 0 0 0 0 0 0 0 0 Pennsylvania . . . . . . . . 0 0 0 0 1 0 0 0 0 Rhode Island . . . . . . . . 0 0 0 0 0 0 0 0 0 South Carolina . . . . . . 1 1 0 0 0 0 0 0 0 South Dakota. . . . . . . . 0 0 0 0 0 0 1 0 0 Tennessee . . . . . . . . . . 1 0 0 0 0 0 0 0 0 Texas . . . . . . . . . . . . . . 2 2 0 2 0 1 1 0 0 Utah. . . . . . . . . . . . . . . 0 0 0 0 0 0 0 0 0 Vermont. . . . . . . . . . . . 0 0 0 0 0 0 0 0 0 Virginia . . . . . . . . . . . . 0 2 0 0 0 0 0 0 0 Washington . . . . . . . . . 0 0 0 1 0 0 0 0 0 West Virginia. . . . . . . . 0 0 0 0 0 0 0 0 0 Wisconsin . . . . . . . . . . 0 0 0 0 0 0 0 0 0 Wyoming. . . . . . . . . . . 0 0 0 0 0 0 0 0 0
Total . . . . . . . . . . . . . . 15 18 0 17 7 7 5 1 1
Limited-
bank charters
Appro
*These figures may also include new national banks chartered to acquire a failed institution, trust company, credit card bank, and other limited-charter national banks.
Quarterly Journal, Vol. 21, No. 3, September 2002 93

Failed national bank paid out by the Federal Deposit Insurance Corporation, January 1 to June 30, 2002
Title and location (charter number) Charter number Effective date
Arizona NextBank, National Association, Phoenix . . . . . . . . . . . . . . . . . . . . . . . . . . . . . . . . . . . . . . . . . . . . . . . . . . . . . . . . . . 016595 February 7, 2002
Florida Net First National Bank, Boca Raton . . . . . . . . . . . . . . . . . . . . . . . . . . . . . . . . . . . . . . . . . . . . . . . . . . . . . . . . . . . . . . 020923 March 1, 2002 Hamilton Bank, National Association, Miami . . . . . . . . . . . . . . . . . . . . . . . . . . . . . . . . . . . . . . . . . . . . . . . . . . . . . . . 017675 January 11, 2002
94 Quarterly Journal, Vol. 21, No. 3, September 2002

National banks merged out of the national banking system, January 1 to June 30, 2002
Title and location Charter number Effective date
California Pacific Century Bank, National Association, Encino . . . . . . . . . . . . . . . . . . . . . . . . . . . . . . . . . . . . . . . . . . . . . . . . . . 018152 December 28, 2001
Colorado The Berthoud National Bank, Berthoud . . . . . . . . . . . . . . . . . . . . . . . . . . . . . . . . . . . . . . . . . . . . . . . . . . . . . . . . . . . . 007995 December 31, 2001
Delaware Sun National Bank, Delaware, Wilmington . . . . . . . . . . . . . . . . . . . . . . . . . . . . . . . . . . . . . . . . . . . . . . . . . . . . . . . . . 023728 November 16, 2001
Illinois PlainsBank of Illinois, National Association, Des Plaines . . . . . . . . . . . . . . . . . . . . . . . . . . . . . . . . . . . . . . . . . . . . . . 014820 January 15, 2002
Minnesota The First National Bank of Bovey, Bovey . . . . . . . . . . . . . . . . . . . . . . . . . . . . . . . . . . . . . . . . . . . . . . . . . . . . . . . . . . 011054 January 2, 2002
Nebraska First Western Bank, National Association, Atkinson . . . . . . . . . . . . . . . . . . . . . . . . . . . . . . . . . . . . . . . . . . . . . . . . . . 006489 March 1, 2002 Marquette Bank Nebraska, National Association, O’Neill . . . . . . . . . . . . . . . . . . . . . . . . . . . . . . . . . . . . . . . . . . . . . . 003424 March 1, 2002
New York The National Bank of Florida, Florida . . . . . . . . . . . . . . . . . . . . . . . . . . . . . . . . . . . . . . . . . . . . . . . . . . . . . . . . . . . . . 013825 April 23, 2002
Ohio The Citizens Banking Company, Sandusky . . . . . . . . . . . . . . . . . . . . . . . . . . . . . . . . . . . . . . . . . . . . . . . . . . . . . . . . . 011275 April 1, 2002 Wheeling National Bank, St. Clairsville. . . . . . . . . . . . . . . . . . . . . . . . . . . . . . . . . . . . . . . . . . . . . . . . . . . . . . . . . . . . 016696 March 1, 2002
Pennsylvania The Second National Bank of Masontown, Masontown . . . . . . . . . . . . . . . . . . . . . . . . . . . . . . . . . . . . . . . . . . . . . . . 014333 January 31, 2002 Community Banks, National Association, Millersburg . . . . . . . . . . . . . . . . . . . . . . . . . . . . . . . . . . . . . . . . . . . . . . . . 002252 December 31, 2001
Texas First Mercantile Bank, National Association, Dallas . . . . . . . . . . . . . . . . . . . . . . . . . . . . . . . . . . . . . . . . . . . . . . . . . . 023466 March 28, 2002 NBC Bank, National Association, Eagle Pass . . . . . . . . . . . . . . . . . . . . . . . . . . . . . . . . . . . . . . . . . . . . . . . . . . . . . . . 004490 December 31, 2001 Independence Bank, National Association, Houston . . . . . . . . . . . . . . . . . . . . . . . . . . . . . . . . . . . . . . . . . . . . . . . . . . 018076 May 17, 2002 Texas Guaranty Bank, National Association, Houston . . . . . . . . . . . . . . . . . . . . . . . . . . . . . . . . . . . . . . . . . . . . . . . . . 018421 May 8, 2002 The First National Bank of Shamrock, Shamrock . . . . . . . . . . . . . . . . . . . . . . . . . . . . . . . . . . . . . . . . . . . . . . . . . . . . 007306 March 29, 2002
Washington AmericanWest Bank, National Association, Ephrata . . . . . . . . . . . . . . . . . . . . . . . . . . . . . . . . . . . . . . . . . . . . . . . . . . 021728 December 3, 2001
West Virginia The South Branch Valley National Bank, Moorefield . . . . . . . . . . . . . . . . . . . . . . . . . . . . . . . . . . . . . . . . . . . . . . . . . 003029 January 18, 2002
Quarterly Journal, Vol. 21, No. 3, September 2002 95

National banks converted out of the national banking system, January 1 to June 30, 2002
Title and location (charter number) Effective date Total assets
Alabama The First National Bank, Brewton (015797) . . . . . . . . . . . . . . . . . . . . . . . . . . . . . . . . . . . . . . . . . . . . . . . . . . . . . . . . December 31, 2001 112,258,000
California Six Rivers National Bank, Eureka (021925). . . . . . . . . . . . . . . . . . . . . . . . . . . . . . . . . . . . . . . . . . . . . . . . . . . . . . . . . January 2, 2002 199,535,000
Florida The First National Bank of the Florida Keys, Marathon (016641). . . . . . . . . . . . . . . . . . . . . . . . . . . . . . . . . . . . . . . . January 28, 2002 223,380,000 Gulf Coast National Bank, Naples (022798) . . . . . . . . . . . . . . . . . . . . . . . . . . . . . . . . . . . . . . . . . . . . . . . . . . . . . . . . January 28, 2002 354,097,000
Indiana Peoples National Bank, Washington (003842) . . . . . . . . . . . . . . . . . . . . . . . . . . . . . . . . . . . . . . . . . . . . . . . . . . . . . . . March 5, 2002 189,695,000
Maryland The National Bank of Rising Sun, Rising Sun (002481) . . . . . . . . . . . . . . . . . . . . . . . . . . . . . . . . . . . . . . . . . . . . . . . June 14, 2002 102,000,000
Oklahoma Interbank, National Association, Elk City (009959). . . . . . . . . . . . . . . . . . . . . . . . . . . . . . . . . . . . . . . . . . . . . . . . . . . December 26, 2001 108,337,000 Territory National Bank, Muskogee (006511) . . . . . . . . . . . . . . . . . . . . . . . . . . . . . . . . . . . . . . . . . . . . . . . . . . . . . . . May 15, 2002 8,400,000
Texas First Community Bank, National Association, Alice (017619) . . . . . . . . . . . . . . . . . . . . . . . . . . . . . . . . . . . . . . . . . . June 15, 2002 84,700,000 First Citizens Bank, National Association, Dallas (023050) . . . . . . . . . . . . . . . . . . . . . . . . . . . . . . . . . . . . . . . . . . . . April 30, 2002 38,000,000 Riverbend Bank, National Association, Fort Worth (020193) . . . . . . . . . . . . . . . . . . . . . . . . . . . . . . . . . . . . . . . . . . . April 1, 2002 36,583,000 Rio National Bank, McAllen (018554). . . . . . . . . . . . . . . . . . . . . . . . . . . . . . . . . . . . . . . . . . . . . . . . . . . . . . . . . . . . . June 3, 2002 41,239,000
West Virginia United National Bank, Parkersburg (001427). . . . . . . . . . . . . . . . . . . . . . . . . . . . . . . . . . . . . . . . . . . . . . . . . . . . . . . . March 23, 2002 3,462,529,000
Wisconsin Peoples National Bank, Hayward (012644) . . . . . . . . . . . . . . . . . . . . . . . . . . . . . . . . . . . . . . . . . . . . . . . . . . . . . . . . . June 14, 2002 166,413,000
96 Quarterly Journal, Vol. 21, No. 3, September 2002

Federal branches and agencies of foreign banks in operation, January 1 to June 30, 2002
In operation Opened Closed In operation January 1, 2002 January 1–June 30, 2002 January 1–June 30, 2002 June 30, 2002
Federal branches California . . . . . . . . . . . . . . . . . . . . . . . . . . . . . . . . . 1 0 0 1 Connecticut . . . . . . . . . . . . . . . . . . . . . . . . . . . . . . . . 1 0 0 1 District of Columbia . . . . . . . . . . . . . . . . . . . . . . . . . 1 0 0 1 New York. . . . . . . . . . . . . . . . . . . . . . . . . . . . . . . . . . 36 0 0 36 Washington . . . . . . . . . . . . . . . . . . . . . . . . . . . . . . . . 1 0 0 1
Limited federal branches California . . . . . . . . . . . . . . . . . . . . . . . . . . . . . . . . . 7 0 0 7 District of Columbia . . . . . . . . . . . . . . . . . . . . . . . . . 1 0 0 1 New York. . . . . . . . . . . . . . . . . . . . . . . . . . . . . . . . . . 3 0 0 3
Federal agency Illinois . . . . . . . . . . . . . . . . . . . . . . . . . . . . . . . . . . . . 1 0 0 1
Total United States . . . . . . . . . . . . . . . . . . . . . . . . . . . 52 0 52 0
Quarterly Journal, Vol. 21, No. 3, September 2002 97

Tables on the Financial Performance of National BanksPage
Assets, liabilities, and capital accounts of national banks, June 30, 2001 and June 30, 2002 . . . . . . . . . . . . . . . . . . . . . 101
Quarterly income and expenses of national banks, second quarter 2001 and second quarter 2002 . . . . . . . . . . . . . . . . . 102
Year-to-date income and expenses of national banks, through June 30, 2001 and through June 30, 2002 . . . . . . . . . . . 103
Assets of national banks by asset size, June 30, 2002 . . . . . . . . . . . . . . . . . . . . . . . . . . . . . . . . . . . . . . . . . . . . . . . . . . . 104
Past-due and nonaccrual loans and leases of national banks by asset size, June 30, 2002. . . . . . . . . . . . . . . . . . . . . . . . 105
Liabilities of national banks by asset size, June 30, 2002 . . . . . . . . . . . . . . . . . . . . . . . . . . . . . . . . . . . . . . . . . . . . . . . . 106
Off-balance-sheet items of national banks by asset size, June 30, 2002 . . . . . . . . . . . . . . . . . . . . . . . . . . . . . . . . . . . . . 107
Quarterly income and expenses of national banks by asset size, second quarter 2002 . . . . . . . . . . . . . . . . . . . . . . . . . . 108
Year-to-date income and expenses of national banks by asset size, through June 30, 2002 . . . . . . . . . . . . . . . . . . . . . . 109
Quarterly net loan and lease losses of national banks by asset size, second quarter 2002 . . . . . . . . . . . . . . . . . . . . . . . . 110
Year-to-date net loan and lease losses of national banks by asset size, through June 30, 2002 . . . . . . . . . . . . . . . . . . . . 111
Number of national banks by state and asset size, June 30, 2002 . . . . . . . . . . . . . . . . . . . . . . . . . . . . . . . . . . . . . . . . . . 112
Total assets of national banks by state and asset size, June 30, 2002 . . . . . . . . . . . . . . . . . . . . . . . . . . . . . . . . . . . . . . . . 113
Quarterly Journal, Vol. 21, No. 3, September 2002 99

Assets, liabilities, and capital accounts of national banks June 30, 2001 and June 30, 2002
(Dollar figures in millions)
Change June 30, 2001– June 30, 2002
June 30, 2001 June 30, 2002 fully consolidated
Consolidated foreign and foreign and
domestic domestic Amount Percent
Number of institutions . . . . . . . . . . . . . . . . . . . . . . . . . . . . . . . . 2,176 (72) (3.31)
Total assets . . . . . . . . . . . . . . . . . . . . . . . . . . . . . . . . . . . . . . . . . . $3,448,286 $291,209 8.45
Cash and balances due from depositories. . . . . . . . . . . . . . . 192,355 596 0.31 Noninterest-bearing balances, currency and coin . . . . . . . . . 150,396 142,702 (7,694) (5.12) Interest bearing balances. . . . . . . . . . . . . . . . . . . . . . . . . . . . 41,958 50,249 8,290 19.76
Securities . . . . . . . . . . . . . . . . . . . . . . . . . . . . . . . . . . . . . . . . . 486,424 129,825 26.69 Held-to-maturity securities, amortized cost . . . . . . . . . . . . . 27,397 26,170 (1,227) (4.48) Available-for-sale securities, fair value . . . . . . . . . . . . . . . . . 459,027 590,079 131,052 28.55
Federal funds sold and securities purchased . . . . . . . . . . . . 139,854 6,520 4.66 Net loans and leases . . . . . . . . . . . . . . . . . . . . . . . . . . . . . . . . 2,214,399 63,782 2.88
Total loans and leases . . . . . . . . . . . . . . . . . . . . . . . . . . . . . . 2,255,767 2,325,538 69,771 3.09 Loans and leases, gross . . . . . . . . . . . . . . . . . . . . . . . . . . . 2,257,250 2,328,362 71,112 3.15 Less: Unearned income. . . . . . . . . . . . . . . . . . . . . . . . . . . 1,483 2,824 1,341 90.48
Less: Reserve for losses . . . . . . . . . . . . . . . . . . . . . . . . . . . . 41,368 47,357 5,989 14.48 Assets held in trading account . . . . . . . . . . . . . . . . . . . . . . . . 115,604 37.86 Other real estate owned . . . . . . . . . . . . . . . . . . . . . . . . . . . . . 1,684 179 10.66 Intangible assets . . . . . . . . . . . . . . . . . . . . . . . . . . . . . . . . . . . 72,051 17,767 24.66 All other assets. . . . . . . . . . . . . . . . . . . . . . . . . . . . . . . . . . . . . 225,916 12.73
Total liabilities and equity capital . . . . . . . . . . . . . . . . . . . . . . . 3,448,286 291,209 8.45
Deposits in domestic offices . . . . . . . . . . . . . . . . . . . . . . . . . . . 1,887,371 2,025,600 138,229 7.32 Deposits in foreign offices . . . . . . . . . . . . . . . . . . . . . . . . . . . . 398,277 385,203 (13,075) (3.28)
Total deposits . . . . . . . . . . . . . . . . . . . . . . . . . . . . . . . . . . . . . . . . 2,285,648 125,154 5.48 Noninterest-bearing deposits . . . . . . . . . . . . . . . . . . . . . . . . . . 446,110 490,412 44,302 9.93 Interest-bearing deposits . . . . . . . . . . . . . . . . . . . . . . . . . . . . . . 1,839,539 1,920,391 80,852 4.40
Federal funds purchased and securities sold . . . . . . . . . . . . . . 242,413 7.10 Other borrowed money . . . . . . . . . . . . . . . . . . . . . . . . . . . . . . . 349,769 7.81 Trading liabilities less revaluation losses . . . . . . . . . . . . . . . . . 22,120 23.17 Subordinated notes and debentures . . . . . . . . . . . . . . . . . . . . . 64,681 4.20 All other liabilities . . . . . . . . . . . . . . . . . . . . . . . . . . . . . . . . . . . 174,262 38.48
Trading liabilities revaluation losses. . . . . . . . . . . . . . . . . . . . . 51,490 76,560 25,070 48.69 Other . . . . . . . . . . . . . . . . . . . . . . . . . . . . . . . . . . . . . . . . . . . . . 122,772 164,761 41,989 34.20
Total equity capital . . . . . . . . . . . . . . . . . . . . . . . . . . . . . . . . . . . 309,393 15.07 Perpetual preferred stock . . . . . . . . . . . . . . . . . . . . . . . . . . . . . 586 2,698 2,112 NM Common stock . . . . . . . . . . . . . . . . . . . . . . . . . . . . . . . . . . . . . 13,265 12,941 (324) (2.44) Surplus . . . . . . . . . . . . . . . . . . . . . . . . . . . . . . . . . . . . . . . . . . . 162,242 194,451 32,209 19.85 Retained earnings and other comprehensive income . . . . . . . . 133,911 150,445 16,534 12.35 Other equity capital components . . . . . . . . . . . . . . . . . . . . . . . (32) (38) (6) NM
Consolidated
2,104
$3,739,495
192,951
616,249
146,374 2,278,181
43,773 159,377 1,864
89,817 28,766 254,682
3,739,495
2,410,803
17,219 259,632 27,305 377,073 5,126 27,246 2,720 67,401
67,059 241,321
46,626 356,019
NM indicates calculated percent change is not meaningful.
Quarterly Journal, Vol. 21, No. 3, September 2002 101

Quarterly income and expenses of national banks Second quarter 2001 and second quarter 2002
(Dollar figures in millions)
Change Second quarter 2001–
Second quarter Second quarter second quarter 2002 2001 fully consolidated
Consolidated foreign and foreign and
domestic domestic Amount Percent
Number of institutions . . . . . . . . . . . . . . . . . . . . . . . . . . . . . . . . . . 2,176 (72) (3.31)
Net income . . . . . . . . . . . . . . . . . . . . . . . . . . . . . . . . . . . . . . . . . . . . $10,995 $3,157 28.72
Net interest income . . . . . . . . . . . . . . . . . . . . . . . . . . . . . . . . . . . 30,611 4,190 13.69 Total interest income . . . . . . . . . . . . . . . . . . . . . . . . . . . . . . . . . 58,079 51,951 (6,128) (10.55)
On loans . . . . . . . . . . . . . . . . . . . . . . . . . . . . . . . . . . . . . . . . 44,895 39,729 (5,165) (11.51) From lease financing receivables . . . . . . . . . . . . . . . . . . . . . 1,940 1,832 (108) (5.57) On balances due from depositories . . . . . . . . . . . . . . . . . . . . 704 455 (248) (35.29) On securities . . . . . . . . . . . . . . . . . . . . . . . . . . . . . . . . . . . . . 7,679 7,939 260 3.39 From assets held in trading account . . . . . . . . . . . . . . . . . . . 991 923 (68) (6.85) On federal funds sold and securities repurchased. . . . . . . . . 1,562 745 (817) (52.31)
Less: Interest expense . . . . . . . . . . . . . . . . . . . . . . . . . . . . . . . . 27,469 17,150 (10,318) (37.56) On deposits . . . . . . . . . . . . . . . . . . . . . . . . . . . . . . . . . . . . . . 18,540 11,570 (6,969) (37.59) Of federal funds purchased and securities sold. . . . . . . . . . . 2,737 1,339 (1,397) (51.06) On demand notes and other borrowed money* . . . . . . . . . . 5,201 3,415 (1,786) (34.34) On subordinated notes and debentures . . . . . . . . . . . . . . . . . 991 826 (165) (16.67)
Less: Provision for losses . . . . . . . . . . . . . . . . . . . . . . . . . . . . . . 6,250 1,412 Noninterest income . . . . . . . . . . . . . . . . . . . . . . . . . . . . . . . . . . . 24,606 1,979 8.04
From fiduciary activities . . . . . . . . . . . . . . . . . . . . . . . . . . . . . . 2,248 2,259 11 0.48 Service charges on deposits . . . . . . . . . . . . . . . . . . . . . . . . . . . 4,401 4,878 477 10.84 Trading revenue. . . . . . . . . . . . . . . . . . . . . . . . . . . . . . . . . . . . . 1,551 2,140 589 37.97
From interest rate exposures . . . . . . . . . . . . . . . . . . . . . . . . . 530 725 195 36.67 From foreign exchange exposures . . . . . . . . . . . . . . . . . . . . 882 957 74 8.40 From equity security and index exposures . . . . . . . . . . . . . . 59 270 211 NM From commodity and other exposures . . . . . . . . . . . . . . . . . 76 191 115 NM
Investment banking brokerage fees. . . . . . . . . . . . . . . . . . . . . . 1,194 1,217 23 1.89 Venture capital revenue . . . . . . . . . . . . . . . . . . . . . . . . . . . . . . . 126 24 (102) NM Net servicing fees . . . . . . . . . . . . . . . . . . . . . . . . . . . . . . . . . . . 2,667 2,611 (56) (2.10) Net securitization income . . . . . . . . . . . . . . . . . . . . . . . . . . . . . 2,747 3,606 859 31.27 Insurance commissions and fees . . . . . . . . . . . . . . . . . . . . . . . . 341 500 158 46.37 Net gains on asset sales. . . . . . . . . . . . . . . . . . . . . . . . . . . . . . . 866 810 (56) (6.45) Sales of loans and leases . . . . . . . . . . . . . . . . . . . . . . . . . . . . . . 692 780 88 12.74 Sales of other real estate owned . . . . . . . . . . . . . . . . . . . . . . . . (5) 25 30 NM Sales of other assets(excluding securities) . . . . . . . . . . . . . . . . 179 4 (174) NM Other noninterest income . . . . . . . . . . . . . . . . . . . . . . . . . . . . . 8,464 8,623 160 1.89
Gains/losses on securities . . . . . . . . . . . . . . . . . . . . . . . . . . . . . . 480 53 10.94 Less: Noninterest expense . . . . . . . . . . . . . . . . . . . . . . . . . . . . . 32,223 883 2.74
Salaries and employee benefits . . . . . . . . . . . . . . . . . . . . . . . . . 12,782 13,532 750 5.87 Of premises and fixed assets . . . . . . . . . . . . . . . . . . . . . . . . . . . 3,868 3,906 38 0.97 Other noninterest expense. . . . . . . . . . . . . . . . . . . . . . . . . . . . . 14,129 14,650 521 3.69
Less: Taxes on income before extraordinary items . . . . . . . . . 6,130 1,024 Income/loss from extraordinary items, net of income taxes . . (99) 255 NM
Memoranda: Net operating income . . . . . . . . . . . . . . . . . . . . . . . . . . . . . . . . . . . . 10,770 13,646 2,876 26.70 Income before taxes and extraordinary items . . . . . . . . . . . . . . . . . . 17,224 21,151 3,927 22.80 Income net of taxes before extraordinary items . . . . . . . . . . . . . . . . 11,093 13,996 2,903 26.17 Cash dividends declared . . . . . . . . . . . . . . . . . . . . . . . . . . . . . . . . . . 7,105 8,158 1,053 14.82 Net charge-offs to loan and lease reserve . . . . . . . . . . . . . . . . . . . . . 5,551 7,648 2,096 37.76
Charge-offs to loan and lease reserve . . . . . . . . . . . . . . . . . . . . . . 6,630 8,984 2,354 35.50 Less: Recoveries credited to loan and lease reserve . . . . . . . . . . . 1,079 1,337 258 23.87
2002
Consolidated
2,104
$14,152
34,800
7,662 22.59 26,585
532 33,105
7,155 16.71 156
*Includes mortgage indebtednessNM indicates calculated percent change is not meaningful.
102 Quarterly Journal, Vol. 21, No. 3, September 2002

Year-to-date income and expenses of national banks Through June 30, 2001 and through June 30, 2002
(Dollar figures in millions)
Change June 30, 2001– June 30, 2002
June 30, 2001 June 30, 2002 fully consolidated
Consolidated foreign and foreign and
domestic domestic Amount Percent
Number of institutions . . . . . . . . . . . . . . . . . . . . . . . . . . . . . . . . 2,176 (72) (3.31)
Net income . . . . . . . . . . . . . . . . . . . . . . . . . . . . . . . . . . . . . . . . . . $22,345 $5,449 24.39
Net interest income . . . . . . . . . . . . . . . . . . . . . . . . . . . . . . . . . 60,179 10,027 16.66 Total interest income . . . . . . . . . . . . . . . . . . . . . . . . . . . . . . . 118,988 103,533 (15,454) (12.99)
On loans . . . . . . . . . . . . . . . . . . . . . . . . . . . . . . . . . . . . . . 92,135 79,544 (12,591) (13.67) From lease financing receivables . . . . . . . . . . . . . . . . . . . 3,962 3,667 (295) (7.45) On balances due from depositories . . . . . . . . . . . . . . . . . . 1,523 937 (586) (38.48) On securities . . . . . . . . . . . . . . . . . . . . . . . . . . . . . . . . . . . 15,671 15,536 (134) (0.86) From assets held in trading account . . . . . . . . . . . . . . . . . 1,949 1,672 (277) (14.24) On federal funds sold and securities repurchased. . . . . . . 3,242 1,497 (1,745) (53.83)
Less: Interest expense . . . . . . . . . . . . . . . . . . . . . . . . . . . . . . 58,809 33,328 (25,481) (43.33) On deposits . . . . . . . . . . . . . . . . . . . . . . . . . . . . . . . . . . . . 39,294 22,396 (16,898) (43.00) Of federal funds purchased and securities sold. . . . . . . . . 6,018 2,674 (3,344) (55.57) On demand notes and other borrowed money* . . . . . . . . 11,397 6,631 (4,766) (41.82) On subordinated notes and debentures . . . . . . . . . . . . . . . 2,099 1,627 (472) (22.50)
Less: Provision for losses . . . . . . . . . . . . . . . . . . . . . . . . . . . . 11,566 4,522 39.10 Noninterest income . . . . . . . . . . . . . . . . . . . . . . . . . . . . . . . . . 49,575 3,503 7.07
From fiduciary activities . . . . . . . . . . . . . . . . . . . . . . . . . . . . 4,512 4,461 (52) (1.14) Service charges on deposits . . . . . . . . . . . . . . . . . . . . . . . . . 8,378 9,475 1,097 13.09 Trading revenue. . . . . . . . . . . . . . . . . . . . . . . . . . . . . . . . . . . 3,701 3,820 119 3.21
From interest rate exposures . . . . . . . . . . . . . . . . . . . . . . . 1,610 1,342 (268) (16.64) From foreign exchange exposures . . . . . . . . . . . . . . . . . . 1,709 1,737 28 1.62 From equity security and index exposures . . . . . . . . . . . . 246 522 275 NM From commodity and other exposures . . . . . . . . . . . . . . . 133 221 88 66.28
Investment banking brokerage fees. . . . . . . . . . . . . . . . . . . . 2,337 2,432 95 4.08 Venture capital revenue . . . . . . . . . . . . . . . . . . . . . . . . . . . . . 75 193 117 NM Net servicing fees . . . . . . . . . . . . . . . . . . . . . . . . . . . . . . . . . 5,210 5,540 330 6.33 Net securitization income . . . . . . . . . . . . . . . . . . . . . . . . . . . 5,353 7,178 1,825 34.08 Insurance commissions and fees . . . . . . . . . . . . . . . . . . . . . . 774 966 192 24.82 Net gains on asset sales. . . . . . . . . . . . . . . . . . . . . . . . . . . . . 2,395 2,017 (378) (15.79) Sales of loans and leases . . . . . . . . . . . . . . . . . . . . . . . . . . . . 1,259 2,069 810 64.28 Sales of other real estate owned . . . . . . . . . . . . . . . . . . . . . . (9) 15 24 NM Sales of other assets (excluding securities). . . . . . . . . . . . . . 1,145 (67) (1,211) NM Other noninterest income . . . . . . . . . . . . . . . . . . . . . . . . . . . 16,838 16,995 158 0.94
Gains/losses on securities . . . . . . . . . . . . . . . . . . . . . . . . . . . . 945 (55) (5.85) Less: Noninterest expense . . . . . . . . . . . . . . . . . . . . . . . . . . . 64,232 1,927 3.00
Salaries and employee benefits . . . . . . . . . . . . . . . . . . . . . . . 25,356 27,374 2,018 7.96 Of premises and fixed assets . . . . . . . . . . . . . . . . . . . . . . . . . 7,710 7,792 82 1.06 Other noninterest expense. . . . . . . . . . . . . . . . . . . . . . . . . . . 28,481 29,072 590 2.07
Less: Taxes on income before extraordinary items . . . . . . . 12,190 2,019 16.56 Income/loss from extraordinary items, net of income taxes . . (366) 443 NM
Memoranda: Net operating income . . . . . . . . . . . . . . . . . . . . . . . . . . . . . . . . . . 22,078 27,126 5,048 22.87 Income before taxes and extraordinary items . . . . . . . . . . . . . . . . 34,901 41,926 7,024 20.13 Income net of taxes before extraordinary items . . . . . . . . . . . . . . 22,711 27,717 5,006 22.04 Cash dividends declared . . . . . . . . . . . . . . . . . . . . . . . . . . . . . . . . 14,051 21,571 7,519 53.51 Net charge-offs to loan and lease reserve . . . . . . . . . . . . . . . . . . . 10,336 15,980 5,644 54.61
Charge-offs to loan and lease reserve . . . . . . . . . . . . . . . . . . . . 12,395 18,568 6,173 49.80 Less: Recoveries credited to loan and lease reserve . . . . . . . . . 2,059 2,587 529 25.67
Consolidated
2,104
$27,794
70,206
16,088 53,077
890 66,159
14,209 77
*Includes mortgage indebtednessNM indicates calculated percent change is not meaningful.
Quarterly Journal, Vol. 21, No. 3, September 2002 103

Assets of national banks by asset sizeJune 30, 2002
(Dollar figures in millions)
National banks Memoranda:
All Less than $100 $1 billion Greater All national $100 million to to $10 than $10 commercial banks $1 billion billion banks
Number of institutions reporting. . . . . . . . . . . . . . . . . . . . . . . . . 2,104 944 131 42
Total assets . . . . . . . . . . . . . . . . . . . . . . . . . . . . . . . . . . . . . . . . . . . $3,739,495 $250,321 $413,938 $6,749,662
Cash and balances due from . . . . . . . . . . . . . . . . . . . . . . . . . . 192,951 11,615 21,552 156,717 362,158 Securities . . . . . . . . . . . . . . . . . . . . . . . . . . . . . . . . . . . . . . . . . . 616,249 62,760 87,040 453,418 1,237,108 Federal funds sold and securities purchased . . . . . . . . . . . . . 146,374 9,056 17,578 116,929 321,497 Net loans and leases . . . . . . . . . . . . . . . . . . . . . . . . . . . . . . . . . 2,278,181 153,538 257,896 3,897,212
Total loans and leases . . . . . . . . . . . . . . . . . . . . . . . . . . . . . . . 2,325,538 31,277 155,760 262,466 1,876,035 Loans and leases, gross . . . . . . . . . . . . . . . . . . . . . . . . . . . . 2,328,362 31,322 155,954 262,555 1,878,531 3,975,367 Less: Unearned income. . . . . . . . . . . . . . . . . . . . . . . . . . . . 2,824 45 194 89 2,496 3,830
Less: Reserve for losses . . . . . . . . . . . . . . . . . . . . . . . . . . . . . 47,357 438 2,222 4,570 40,126 74,325 Assets held in trading account . . . . . . . . . . . . . . . . . . . . . . . . . 159,377 66 866 158,439 380,525 Other real estate owned . . . . . . . . . . . . . . . . . . . . . . . . . . . . . . 1,864 245 220 3,874 Intangible assets . . . . . . . . . . . . . . . . . . . . . . . . . . . . . . . . . . . . 89,817 1,845 6,385 129,568 All other assets . . . . . . . . . . . . . . . . . . . . . . . . . . . . . . . . . . . . . 254,682 11,197 22,401 218,822 417,719
Gross loans and leases by type: Loans secured by real estate . . . . . . . . . . . . . . . . . . . . . . . . . . 1,025,099 101,504 140,417 764,673 1,886,961
1–4 family residential mortgages . . . . . . . . . . . . . . . . . . . . . . 483,346 8,040 38,855 62,598 373,853 824,572 Home equity loans . . . . . . . . . . . . . . . . . . . . . . . . . . . . . . . . . 125,762 498 4,741 9,989 110,535 188,315 Multifamily residential mortgages . . . . . . . . . . . . . . . . . . . . . 33,296 440 3,752 5,468 23,636 69,381 Commercial RE loans . . . . . . . . . . . . . . . . . . . . . . . . . . . . . . . 246,947 5,645 38,988 44,075 158,238 532,653 Construction RE loans . . . . . . . . . . . . . . . . . . . . . . . . . . . . . . 92,532 1,698 10,644 16,406 63,785 198,640 Farmland loans . . . . . . . . . . . . . . . . . . . . . . . . . . . . . . . . . . . . 12,891 2,184 4,522 1,759 4,426 36,989 RE loans from foreign offices . . . . . . . . . . . . . . . . . . . . . . . . . 30,324 0 1 123 30,200 36,411
Commercial and industrial loans . . . . . . . . . . . . . . . . . . . . . . 568,970 27,374 49,046 487,387 938,726 Loans to individuals . . . . . . . . . . . . . . . . . . . . . . . . . . . . . . . . . 423,838 17,724 50,829 351,305 662,454
Credit cards* . . . . . . . . . . . . . . . . . . . . . . . . . . . . . . . . . . . . . . 191,196 167 2,282 21,930 166,817 250,395 Other revolving credit plans . . . . . . . . . . . . . . . . . . . . . . . . . . 31,590 70 348 2,347 28,825 36,822 Installment loans . . . . . . . . . . . . . . . . . . . . . . . . . . . . . . . . . . . 201,053 3,744 15,094 26,552 155,663 375,237
All other loans and leases . . . . . . . . . . . . . . . . . . . . . . . . . . . . . 310,455 9,353 22,263 275,165 487,225
Securities by type: U.S. Treasury securities . . . . . . . . . . . . . . . . . . . . . . . . . . . . . . 17,643 2,653 4,046 51,946 Mortgage-backed securities . . . . . . . . . . . . . . . . . . . . . . . . . . . 384,019 23,125 47,603 309,725 661,372
Pass-through securities . . . . . . . . . . . . . . . . . . . . . . . . . . . . . . 286,717 2,537 14,170 27,894 242,116 438,140 Collateralized mortgage obligations . . . . . . . . . . . . . . . . . . . . 97,302 1,030 8,955 19,708 67,609 223,233
Other securities . . . . . . . . . . . . . . . . . . . . . . . . . . . . . . . . . . . . . 169,638 36,668 32,121 92,086 426,834 Other U.S. government securities . . . . . . . . . . . . . . . . . . . . . . 60,641 6,095 21,003 14,336 19,208 210,525 State and local government securities . . . . . . . . . . . . . . . . . . . 43,982 2,098 10,976 9,061 21,846 98,269 Other debt securities . . . . . . . . . . . . . . . . . . . . . . . . . . . . . . . . 56,169 414 3,368 7,221 45,166 97,776 Equity securities . . . . . . . . . . . . . . . . . . . . . . . . . . . . . . . . . . . 8,846 158 1,321 1,503 5,865 20,264
Memoranda: Agricultural production loans . . . . . . . . . . . . . . . . . . . . . . . . . . . . . 20,029 3,131 5,308 2,986 8,604 47,647 Pledged securities . . . . . . . . . . . . . . . . . . . . . . . . . . . . . . . . . . . . . . 283,636 5,012 27,652 39,611 211,361 Book value of securities . . . . . . . . . . . . . . . . . . . . . . . . . . . . . . . . . 608,334 12,839 61,783 85,459 448,253 1,218,927
Available-for-sale securities . . . . . . . . . . . . . . . . . . . . . . . . . . . . 582,164 10,595 52,671 76,824 442,075 1,122,677 Held-to-maturity securities . . . . . . . . . . . . . . . . . . . . . . . . . . . . . 26,170 2,244 9,113 8,635 6,178 96,250
Market value of securities . . . . . . . . . . . . . . . . . . . . . . . . . . . . . . . . 616,769 13,079 62,970 87,212 453,509 1,239,099 Available-for-sale securities . . . . . . . . . . . . . . . . . . . . . . . . . . . . 590,079 10,787 53,647 78,405 447,240 1,140,858 Held-to-maturity securities . . . . . . . . . . . . . . . . . . . . . . . . . . . . . 26,691 2,292 9,323 8,807 6,269 98,241
million billion
987 7,966
$52,273 $3,022,963
3,066 13,032 2,812
30,839 1,835,909 3,971,537
6 74 1,325
181 81,406 2,263
18,505
5,163 3,981
3,674
678 10,266 3,567
8,764
591,456
*Prior to March 2001, also included “Other revolving credit plans.”
104 Quarterly Journal, Vol. 21, No. 3, September 2002

Past-due and nonaccrual loans and leases of national banks by asset sizeJune 30, 2002
(Dollar figures in millions)
National banks Memoranda:
All Less than $100 $1 billion Greater All national $100 million to to $10 than $10 commercial banks $1 billion billion banks
Number of institutions reporting. . . . . . . . . . . . . . . . . . . . . . . . . 2,104 944 131 42 7,966
Loans and leases past due 30–89 days. . . . . . . . . . . . . . . . . . . . . $27,948 $1,740 $22,925 $46,528
Loans secured by real estate . . . . . . . . . . . . . . . . . . . . . . . . . . 10,852 885 19,369 1–4 family residential mortgages . . . . . . . . . . . . . . . . . . . . . . 6,656 114 443 614 5,484 11,038 Home equity loans . . . . . . . . . . . . . . . . . . . . . . . . . . . . . . . . . 735 3 22 54 656 1,070 Multifamily residential mortgages . . . . . . . . . . . . . . . . . . . . . 143 3 16 22 103 300 Commercial RE loans . . . . . . . . . . . . . . . . . . . . . . . . . . . . . . . 1,516 45 264 272 935 3,811 Construction RE loans . . . . . . . . . . . . . . . . . . . . . . . . . . . . . . 1,185 24 104 192 866 2,045 Farmland loans . . . . . . . . . . . . . . . . . . . . . . . . . . . . . . . . . . . . 141 21 36 29 55 373 RE loans from foreign offices . . . . . . . . . . . . . . . . . . . . . . . . . 476 0 0 0 476 733
Commercial and industrial loans . . . . . . . . . . . . . . . . . . . . . . 6,846 398 663 5,697 10,587 Loans to individuals . . . . . . . . . . . . . . . . . . . . . . . . . . . . . . . . . 8,305 377 876 6,963 13,575
Credit cards . . . . . . . . . . . . . . . . . . . . . . . . . . . . . . . . . . . . . . . 4,523 4 100 395 4,023 6,387 Installment loans and other plans . . . . . . . . . . . . . . . . . . . . . . 3,782 85 276 480 2,940 7,188
All other loans and leases . . . . . . . . . . . . . . . . . . . . . . . . . . . . 1,945 80 141 1,690 2,996
Loans and leases past due 90+ days . . . . . . . . . . . . . . . . . . . . . . 8,589 373 815 13,246
Loans secured by real estate . . . . . . . . . . . . . . . . . . . . . . . . . . 2,982 179 194 2,550 4,574 1–4 family residential mortgages . . . . . . . . . . . . . . . . . . . . . . 2,382 32 90 119 2,141 3,208 Home equity loans . . . . . . . . . . . . . . . . . . . . . . . . . . . . . . . . . 106 1 3 9 93 164 Multifamily residential mortgages . . . . . . . . . . . . . . . . . . . . . 28 0 2 4 21 60 Commercial RE loans . . . . . . . . . . . . . . . . . . . . . . . . . . . . . . . 220 13 49 41 118 612 Construction RE loans . . . . . . . . . . . . . . . . . . . . . . . . . . . . . . 162 3 18 14 126 323 Farmland loans . . . . . . . . . . . . . . . . . . . . . . . . . . . . . . . . . . . . 44 10 16 7 10 155 RE loans from foreign offices . . . . . . . . . . . . . . . . . . . . . . . . . 41 0 0 0 41 51
Commercial and industrial loans . . . . . . . . . . . . . . . . . . . . . . 852 23 85 1,600 Loans to individuals . . . . . . . . . . . . . . . . . . . . . . . . . . . . . . . . . 4,427 79 474 3,859 6,539
Credit cards . . . . . . . . . . . . . . . . . . . . . . . . . . . . . . . . . . . . . . . 3,298 3 42 313 2,940 4,324 Installment loans and other plans . . . . . . . . . . . . . . . . . . . . . . 1,130 12 38 161 919 2,215
All other loans and leases . . . . . . . . . . . . . . . . . . . . . . . . . . . . . 328 29 23 264 533
Nonaccrual loans and leases . . . . . . . . . . . . . . . . . . . . . . . . . . . . 29,156 1,143 26,126 45,034
Loans secured by real estate . . . . . . . . . . . . . . . . . . . . . . . . . . 7,841 645 876 13,354 1–4 family residential mortgages . . . . . . . . . . . . . . . . . . . . . . 3,099 38 182 323 2,556 5,007 Home equity loans . . . . . . . . . . . . . . . . . . . . . . . . . . . . . . . . . 332 1 9 29 293 439 Multifamily residential mortgages . . . . . . . . . . . . . . . . . . . . . 120 3 17 16 83 206 Commercial RE loans . . . . . . . . . . . . . . . . . . . . . . . . . . . . . . . 2,437 50 318 346 1,723 4,554 Construction RE loans . . . . . . . . . . . . . . . . . . . . . . . . . . . . . . 918 10 72 140 695 1,822 Farmland loans . . . . . . . . . . . . . . . . . . . . . . . . . . . . . . . . . . . . 188 26 47 22 93 426 RE loans from foreign offices . . . . . . . . . . . . . . . . . . . . . . . . . 747 0 0 0 747 901
Commercial and industrial loans . . . . . . . . . . . . . . . . . . . . . . 16,632 345 555 15,657 25,303 Loans to individuals . . . . . . . . . . . . . . . . . . . . . . . . . . . . . . . . . 1,871 81 86 1,689 2,732
Credit cards . . . . . . . . . . . . . . . . . . . . . . . . . . . . . . . . . . . . . . . 426 0 45 35 346 725 Installment loans and other plans . . . . . . . . . . . . . . . . . . . . . . 1,445 15 36 51 1,343 2,007
All other loans and leases . . . . . . . . . . . . . . . . . . . . . . . . . . . . . 2,901 72 116 2,677 3,789
million billion
987
$421 $2,862
210 8,575 1,183
89 89
34
110 7,291
59
618 126 15
12
254 1,633
129 6,190
74 15
36
Quarterly Journal, Vol. 21, No. 3, September 2002 105

Liabilities of national banks by asset sizeJune 30, 2002
(Dollar figures in millions)
National banks Memoranda:
All Less than $100 $1 billion Greater All national $100 million to to $10 than $10 commercial banks $1 billion billion banks
Number of institutions reporting. . . . . . . . . . . . . . . . . . . . . . . . . 2,104 944 131 42 7,966
Total liabilities and equity capital . . . . . . . . . . . . . . . . . . . . . . . . 3,739,495 250,321 413,938 3,022,963 6,749,656
Deposits in domestic offices . . . . . . . . . . . . . . . . . . . . . . . . . . 2,025,600 43,885 202,617 265,720 1,513,378 3,807,239 Deposits in foreign offices . . . . . . . . . . . . . . . . . . . . . . . . . . . 385,203 0 88 2,540 382,575 640,905
Total deposits . . . . . . . . . . . . . . . . . . . . . . . . . . . . . . . . . . . . . . . 2,410,803 202,704 268,260 1,895,953 4,448,144 Noninterest bearing . . . . . . . . . . . . . . . . . . . . . . . . . . . . . . . . . 490,412 7,105 31,726 46,165 405,416 826,577 Interest bearing . . . . . . . . . . . . . . . . . . . . . . . . . . . . . . . . . . . . 1,920,391 36,780 170,978 222,095 1,490,537
Federal funds purchased and securities sold . . . . . . . . . . . . . 259,632 6,187 40,483 212,432 523,164 Other borrowed funds . . . . . . . . . . . . . . . . . . . . . . . . . . . . . . . 377,073 12,299 46,995 316,389 586,945 Trading liabilities less revaluation losses . . . . . . . . . . . . . . . . 27,246 0 216 27,030 80,953 Subordinated notes and debentures . . . . . . . . . . . . . . . . . . . . 67,401 183 2,825 64,390 93,716 All other liabilities . . . . . . . . . . . . . . . . . . . . . . . . . . . . . . . . . . 241,321 3,152 10,631 227,108 392,741 Equity capital . . . . . . . . . . . . . . . . . . . . . . . . . . . . . . . . . . . . . . 356,019 25,796 44,529 279,661 623,994
Total deposits by depositor: Individuals and corporations . . . . . . . . . . . . . . . . . . . . . . . . . . . . 1,881,050 27,677 141,873 213,369 1,498,130 U.S., state, and local governments . . . . . . . . . . . . . . . . . . . . . . . 101,174 3,739 15,195 16,701 65,539 200,871 Depositories in the U.S. . . . . . . . . . . . . . . . . . . . . . . . . . . . . . . . 75,280 670 2,132 3,282 69,196 100,762 Foreign banks and governments . . . . . . . . . . . . . . . . . . . . . . . . . 60975.776 2 65 1,171 59,737 127,507
Domestic deposits by depositor: Individuals and corporations . . . . . . . . . . . . . . . . . . . . . . . . . . . . 1600404.783 27,677 141,865 211,463 1,219,399 U.S., state, and local governments . . . . . . . . . . . . . . . . . . . . . . . 101,174 3,739 15,195 16,701 65,539 200,871 Depositories in the U.S. . . . . . . . . . . . . . . . . . . . . . . . . . . . . . . . 27,682 670 2,092 3,281 21,639 47,612 Foreign banks and governments . . . . . . . . . . . . . . . . . . . . . . . . . 4,454 2 25 546 3,881 9,873
Foreign deposits by depositor: Individuals and corporations . . . . . . . . . . . . . . . . . . . . . . . . . . . . 280644.81 0 8 1,906 278,731 469,565 Depositories in the U.S. . . . . . . . . . . . . . . . . . . . . . . . . . . . . . . . 47597.594 0 40 0 47,558 53,150 Foreign banks and governments . . . . . . . . . . . . . . . . . . . . . . . . . 56,522 0 40 626 55,856 117,634
Deposits in domestic offices by type: Transaction deposits . . . . . . . . . . . . . . . . . . . . . . . . . . . . . . . . . 351,124 49,103 40,225 248,476 654,429
Demand deposits . . . . . . . . . . . . . . . . . . . . . . . . . . . . . . . . . . . 285,487 7,031 28,195 32,356 217,905 497,688 Savings deposits . . . . . . . . . . . . . . . . . . . . . . . . . . . . . . . . . . . . 1,070,656 65,782 134,279 860,831 1,867,618
Money market deposit accounts . . . . . . . . . . . . . . . . . . . . . . . 782123.899 5,431 38,517 92,801 645,375 1,331,551 Other savings deposits . . . . . . . . . . . . . . . . . . . . . . . . . . . . . . 288531.794 4,333 27,265 41,478 215,456 536,067
Time deposits . . . . . . . . . . . . . . . . . . . . . . . . . . . . . . . . . . . . . . 603,820 87,732 91,216 404,072 1,285,178 Small time deposits . . . . . . . . . . . . . . . . . . . . . . . . . . . . . . . . . 350,183 13,989 56,106 53,305 226,783 724,082 Large time deposits . . . . . . . . . . . . . . . . . . . . . . . . . . . . . . . . . 253,638 6,811 31,626 37,912 177,289 561,096
million billion
987
52,273
43,885
3,621,321 530
1,391 0 3
431 6,034
3,464,424
2,994,859
13,321
9,764
20,800
106 Quarterly Journal, Vol. 21, No. 3, September 2002

Off-balance-sheet items of national banks by asset sizeJune 30, 2002
(Dollar figures in millions)
National banks Memoranda:
All Less than $100 $1 billion Greater All national $100 million to to $10 than $10 commercial banks $1 billion billion banks
Number of institutions reporting. . . . . . . . . . . . . . . . . . . . . . . . . 2,104 944 131 42 7,966
Unused commitments . . . . . . . . . . . . . . . . . . . . . . . . . . . . . . . . . . $3,783,926 $439,068 $358,534 $2,907,120 $5,185,964 Home equity lines . . . . . . . . . . . . . . . . . . . . . . . . . . . . . . . . . . . . 160,583 359 4,261 10,274 145,689 228,433 Credit card lines . . . . . . . . . . . . . . . . . . . . . . . . . . . . . . . . . . . . . 2,532,552 74,956 411,057 294,485 1,752,054 Commercial RE, construction and land . . . . . . . . . . . . . . . . . . . 79,131 983 7,312 13,197 57,639 157,616 All other unused commitments . . . . . . . . . . . . . . . . . . . . . . . . . . 1,011,660 2,906 16,439 40,577 951,738 1,571,327
Letters of credit: Standby letters of credit . . . . . . . . . . . . . . . . . . . . . . . . . . . . . . 156,586 1,480 149,618 261,522
Financial letters of credit . . . . . . . . . . . . . . . . . . . . . . . . . . . . 126,531 83 909 3,991 121,548 215,842 Performance letters of credit . . . . . . . . . . . . . . . . . . . . . . . . . . 30,055 41 572 1,372 28,070 45,681
Commercial letters of credit. . . . . . . . . . . . . . . . . . . . . . . . . . . 16,975 399 496 16,052 25,352
Securities lent . . . . . . . . . . . . . . . . . . . . . . . . . . . . . . . . . . . . . . . . 111,388 94 8,950 102,317 585,050
Spot foreign exchange contracts . . . . . . . . . . . . . . . . . . . . . . . . . 305,890 0 473 305,417 503,881
Credit derivatives (notional value) Reporting bank is the guarantor . . . . . . . . . . . . . . . . . . . . . . . . . 93,092 0 25 0 93,067 255,902 Reporting bank is the beneficiary . . . . . . . . . . . . . . . . . . . . . . . . 112,097 0 50 0 112,047 236,361
Derivative contracts (notional value) . . . . . . . . . . . . . . . . . . . . . 22,731,639 1,361 36,446 22,693,808 50,073,941 Futures and forward contracts. . . . . . . . . . . . . . . . . . . . . . . . . . . 5,621,547 13 266 1,299 5,619,969 10,268,896
Interest rate contracts . . . . . . . . . . . . . . . . . . . . . . . . . . . . . . . 3,445,531 13 226 951 3,444,341 6,458,169 Foreign exchange contracts. . . . . . . . . . . . . . . . . . . . . . . . . . . 2,068,566 0 40 349 2,068,177 3,619,960 All other futures and forwards . . . . . . . . . . . . . . . . . . . . . . . . 107,451 0 0 0 107,451 190,767
Option contracts . . . . . . . . . . . . . . . . . . . . . . . . . . . . . . . . . . . . . 4,670,257 6 214 11,502 4,658,535 10,242,271 Interest rate contracts . . . . . . . . . . . . . . . . . . . . . . . . . . . . . . . 3,954,455 6 202 11,022 3,943,224 8,469,778 Foreign exchange contracts. . . . . . . . . . . . . . . . . . . . . . . . . . . 537,751 0 0 372 537,379 1,014,028 All other options . . . . . . . . . . . . . . . . . . . . . . . . . . . . . . . . . . . 178,051 0 12 108 177,931 758,464
Swaps . . . . . . . . . . . . . . . . . . . . . . . . . . . . . . . . . . . . . . . . . . . . . 12,234,646 5 805 23,644 12,210,191 Interest rate contracts . . . . . . . . . . . . . . . . . . . . . . . . . . . . . . . 11,681,546 5 799 19,272 11,661,470 27,767,692 Foreign exchange contracts. . . . . . . . . . . . . . . . . . . . . . . . . . . 502,140 0 2 4,144 497,994 1,175,626 All other swaps . . . . . . . . . . . . . . . . . . . . . . . . . . . . . . . . . . . . 50,960 0 4 229 50,727 127,194
Memoranda: Derivatives by purpose Contracts held for trading . . . . . . . . . . . . . . . . . . . . . . . . . . . . . . 20,913,376 0 38 7,689 20,905,650 47,543,881 Contracts not held for trading . . . . . . . . . . . . . . . . . . . . . . . . . . . 1,613,075 24 1,248 28,757 1,583,045 2,037,796
Memoranda: Derivatives by position Held for trading—positive fair value . . . . . . . . . . . . . . . . . . . . . 308,398 0 0 123 308,275 740,384 Held for trading—negative fair value . . . . . . . . . . . . . . . . . . . . . 301,790 0 0 115 301,675 726,583 Not for trading—positive fair value . . . . . . . . . . . . . . . . . . . . . . 17,330 0 5 375 16,949 25,519 Not for trading—negative fair value . . . . . . . . . . . . . . . . . . . . . . 11,774 0 26 243 11,506 16,704
million billion
987
$79,204
3,228,588
124 5,364
29
27
0
24
29,070,511
Quarterly Journal, Vol. 21, No. 3, September 2002 107

Quarterly income and expenses of national banks by asset sizeSecond quarter 2002
(Dollar figures in millions)
National banks Memoranda:
All Less than $100 $1 billion Greater All national $100 million to to $10 than $10 commercial banks $1 billion billion banks
Number of institutions reporting. . . . . . . . . . . . . . . . . . . . . . . . . 2,104 944 131 42 7,966
Net income . . . . . . . . . . . . . . . . . . . . . . . . . . . . . . . . . . . . . . . . . . . $14,152 $792 $11,526 $23,440
Net interest income . . . . . . . . . . . . . . . . . . . . . . . . . . . . . . . . . . 34,800 2,498 27,641 58,843 Total interest income . . . . . . . . . . . . . . . . . . . . . . . . . . . . . . . . 51,951 795 3,775 6,018 41,362 90,405
On loans . . . . . . . . . . . . . . . . . . . . . . . . . . . . . . . . . . . . . . . 39,729 607 2,889 4,663 31,570 66,769 From lease financing receivables . . . . . . . . . . . . . . . . . . . . 1,832 3 22 67 1,740 2,643 On balances due from depositories . . . . . . . . . . . . . . . . . . . 455 7 14 24 411 912 On securities . . . . . . . . . . . . . . . . . . . . . . . . . . . . . . . . . . . . 7,939 162 791 1,114 5,872 15,482 From assets held in trading account . . . . . . . . . . . . . . . . . . 923 0 1 11 912 2,372 On fed. funds sold & securities repurchased . . . . . . . . . . . 745 12 41 92 600 1,575
Less: Interest expense . . . . . . . . . . . . . . . . . . . . . . . . . . . . . . . 17,150 270 1,278 1,881 13,721 31,562 On deposits . . . . . . . . . . . . . . . . . . . . . . . . . . . . . . . . . . . . . 11,570 252 1,112 1,241 8,965 21,570 Of federal funds purchased & securities sold . . . . . . . . . . . 1,339 2 31 203 1,103 2,713 On demand notes & other borrowed money* . . . . . . . . . . . 3,415 15 131 401 2,868 6,179 On subordinated notes and debentures . . . . . . . . . . . . . . . . 826 0 3 38 785 1,100
Less: Provision for losses . . . . . . . . . . . . . . . . . . . . . . . . . . . . . 7,662 203 487 6,933 10,861 Noninterest income . . . . . . . . . . . . . . . . . . . . . . . . . . . . . . . . . . 26,585 1,358 22,252 42,541
From fiduciary activities . . . . . . . . . . . . . . . . . . . . . . . . . . . . . 2,259 10 160 371 1,718 5,381 Service charges on deposits . . . . . . . . . . . . . . . . . . . . . . . . . . 4,878 62 296 434 4,086 7,468 Trading revenue . . . . . . . . . . . . . . . . . . . . . . . . . . . . . . . . . . . 2,140 0 (2) 11 2,131 3,366
From interest rate exposures . . . . . . . . . . . . . . . . . . . . . . . . 725 0 2 1 722 1,559 From foreign exchange exposures . . . . . . . . . . . . . . . . . . . 957 0 0 1 955 1,346 From equity security and index exposures . . . . . . . . . . . . . 270 0 0 7 263 490 From commodity and other exposures . . . . . . . . . . . . . . . . 191 0 0 0 191 (26)
Investment banking brokerage fees. . . . . . . . . . . . . . . . . . . . . 1,217 1 17 63 1,136 2,397 Venture capital revenue . . . . . . . . . . . . . . . . . . . . . . . . . . . . . . 24 (0) (0) (0) 25 (83) Net servicing fees . . . . . . . . . . . . . . . . . . . . . . . . . . . . . . . . . . 2,611 51 75 313 2,172 3,363 Net securitization income . . . . . . . . . . . . . . . . . . . . . . . . . . . . 3,606 2 76 301 3,227 4,648 Insurance commissions and fees . . . . . . . . . . . . . . . . . . . . . . . 500 7 20 41 432 894 Net gains on asset sales. . . . . . . . . . . . . . . . . . . . . . . . . . . . . . 810 6 71 101 631 1,453 Sales of loans and leases . . . . . . . . . . . . . . . . . . . . . . . . . . . . . 780 7 67 158 548 1,378 Sales of other real estate owned . . . . . . . . . . . . . . . . . . . . . . . 25 0 1 2 23 27 Sales of other assets(excluding securities) . . . . . . . . . . . . . . . 4 (0) 4 (59) 60 48 Other noninterest income . . . . . . . . . . . . . . . . . . . . . . . . . . . . 8,623 70 645 1,132 6,777 13,737
Gains/losses on securities . . . . . . . . . . . . . . . . . . . . . . . . . . . . . 532 16 45 1,008 Less: Noninterest expense . . . . . . . . . . . . . . . . . . . . . . . . . . . . 33,105 2,569 26,112 57,035
Salaries and employee benefits . . . . . . . . . . . . . . . . . . . . . . . . 13,532 247 1,079 1,418 10,787 24,660 Of premises and fixed assets . . . . . . . . . . . . . . . . . . . . . . . . . . 3,906 62 299 393 3,152 7,172 Other noninterest expense. . . . . . . . . . . . . . . . . . . . . . . . . . . . 14,650 193 1,169 2,011 11,276 23,968
Less: Taxes on income before extraord. items . . . . . . . . . . . . 7,155 308 851 5,947 11,216 Income/loss from extraord. items, net of taxes . . . . . . . . . . . . 77 (4) 0 81 39
Memoranda: Net operating income . . . . . . . . . . . . . . . . . . . . . . . . . . . . . . . . . . . 13,646 142 780 1,659 11,066 22,605 Income before taxes and extraordinary items . . . . . . . . . . . . . . . . . 21,151 194 1,099 2,540 17,317 34,497 Income net of taxes before extraordinary items . . . . . . . . . . . . . . . 13,996 144 792 1,690 11,370 23,281 Cash dividends declared . . . . . . . . . . . . . . . . . . . . . . . . . . . . . . . . . 8,158 79 395 676 7,007 14,169 Net loan and lease losses. . . . . . . . . . . . . . . . . . . . . . . . . . . . . . . . . 7,648 25 157 468 6,998 10,561
Charge-offs to loan and lease reserve . . . . . . . . . . . . . . . . . . . . . 8,984 34 202 591 8,158 12,494 Less: Recoveries credited to loan & lease resv. . . . . . . . . . . . . . 1,337 10 44 123 1,160 1,933
million billion
987
$144 $1,690
525 4,137
38 209 2,766
3 468 505 3,920
49 0
* Includes mortgage indebtedness
108 Quarterly Journal, Vol. 21, No. 3, September 2002
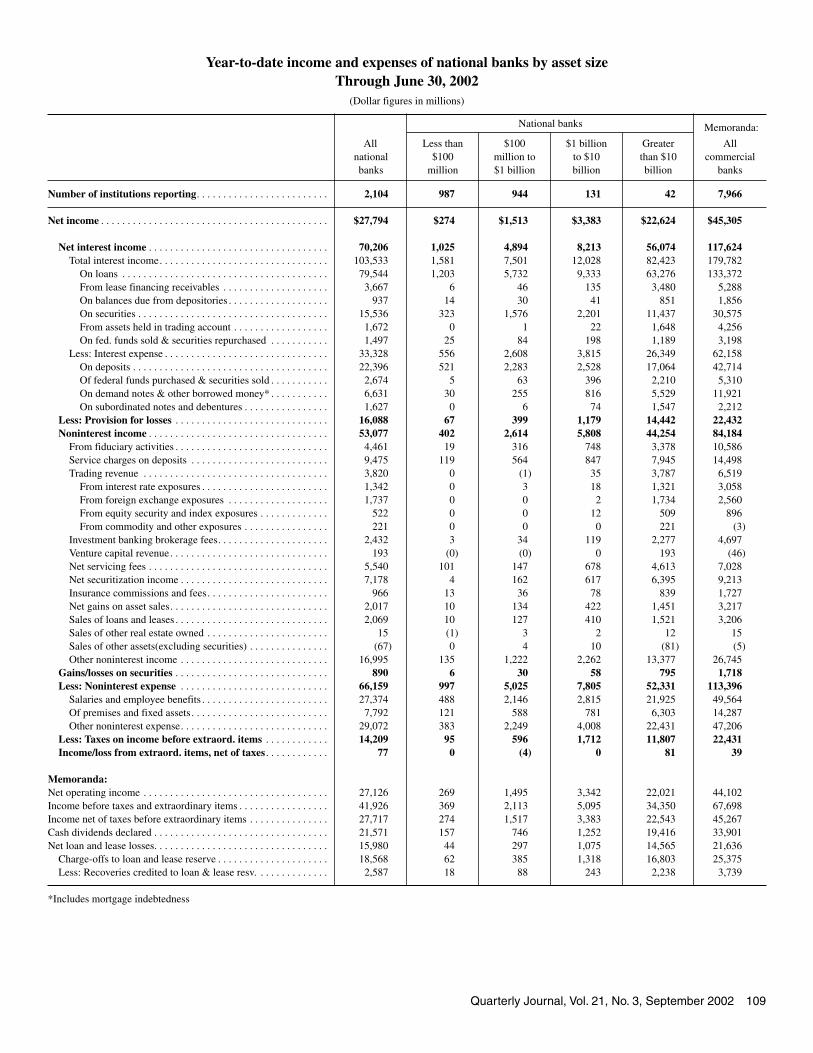
Year-to-date income and expenses of national banks by asset sizeThrough June 30, 2002
(Dollar figures in millions)
National banks Memoranda:
All Less than $100 $1 billion Greater All national $100 million to to $10 than $10 commercial banks $1 billion billion banks
Number of institutions reporting. . . . . . . . . . . . . . . . . . . . . . . . . 2,104 987 42 7,966
Net income . . . . . . . . . . . . . . . . . . . . . . . . . . . . . . . . . . . . . . . . . . . $27,794 $274 $22,624 $45,305
Net interest income . . . . . . . . . . . . . . . . . . . . . . . . . . . . . . . . . . 70,206 1,025 56,074 117,624 Total interest income . . . . . . . . . . . . . . . . . . . . . . . . . . . . . . . . 103,533 1,581 7,501 12,028 82,423 179,782
On loans . . . . . . . . . . . . . . . . . . . . . . . . . . . . . . . . . . . . . . . 79,544 1,203 5,732 9,333 63,276 133,372 From lease financing receivables . . . . . . . . . . . . . . . . . . . . 3,667 6 46 135 3,480 5,288 On balances due from depositories . . . . . . . . . . . . . . . . . . . 937 14 30 41 851 1,856 On securities . . . . . . . . . . . . . . . . . . . . . . . . . . . . . . . . . . . . 15,536 323 1,576 2,201 11,437 30,575 From assets held in trading account . . . . . . . . . . . . . . . . . . 1,672 0 1 22 1,648 4,256 On fed. funds sold & securities repurchased . . . . . . . . . . . 1,497 25 84 198 1,189 3,198
Less: Interest expense . . . . . . . . . . . . . . . . . . . . . . . . . . . . . . . 33,328 556 2,608 3,815 26,349 62,158 On deposits . . . . . . . . . . . . . . . . . . . . . . . . . . . . . . . . . . . . . 22,396 521 2,283 2,528 17,064 42,714 Of federal funds purchased & securities sold . . . . . . . . . . . 2,674 5 63 396 2,210 5,310 On demand notes & other borrowed money* . . . . . . . . . . . 6,631 30 255 816 5,529 11,921 On subordinated notes and debentures . . . . . . . . . . . . . . . . 1,627 0 6 74 1,547 2,212
Less: Provision for losses . . . . . . . . . . . . . . . . . . . . . . . . . . . . . 16,088 399 1,179 14,442 22,432 Noninterest income . . . . . . . . . . . . . . . . . . . . . . . . . . . . . . . . . . 53,077 402 44,254 84,184
From fiduciary activities . . . . . . . . . . . . . . . . . . . . . . . . . . . . . 4,461 19 316 748 3,378 10,586 Service charges on deposits . . . . . . . . . . . . . . . . . . . . . . . . . . 9,475 119 564 847 7,945 14,498 Trading revenue . . . . . . . . . . . . . . . . . . . . . . . . . . . . . . . . . . . 3,820 0 (1) 35 3,787 6,519
From interest rate exposures . . . . . . . . . . . . . . . . . . . . . . . . 1,342 0 3 18 1,321 3,058 From foreign exchange exposures . . . . . . . . . . . . . . . . . . . 1,737 0 0 2 1,734 2,560 From equity security and index exposures . . . . . . . . . . . . . 522 0 0 12 509 896 From commodity and other exposures . . . . . . . . . . . . . . . . 221 0 0 0 221 (3)
Investment banking brokerage fees. . . . . . . . . . . . . . . . . . . . . 2,432 3 34 119 2,277 4,697 Venture capital revenue . . . . . . . . . . . . . . . . . . . . . . . . . . . . . . 193 (0) (0) 0 193 (46) Net servicing fees . . . . . . . . . . . . . . . . . . . . . . . . . . . . . . . . . . 5,540 101 147 678 4,613 7,028 Net securitization income . . . . . . . . . . . . . . . . . . . . . . . . . . . . 7,178 4 162 617 6,395 9,213 Insurance commissions and fees . . . . . . . . . . . . . . . . . . . . . . . 966 13 36 78 839 1,727 Net gains on asset sales. . . . . . . . . . . . . . . . . . . . . . . . . . . . . . 2,017 10 134 422 1,451 3,217 Sales of loans and leases . . . . . . . . . . . . . . . . . . . . . . . . . . . . . 2,069 10 127 410 1,521 3,206 Sales of other real estate owned . . . . . . . . . . . . . . . . . . . . . . . 15 (1) 3 2 12 15 Sales of other assets(excluding securities) . . . . . . . . . . . . . . . (67) 0 4 10 (81) (5) Other noninterest income . . . . . . . . . . . . . . . . . . . . . . . . . . . . 16,995 135 1,222 2,262 13,377 26,745
Gains/losses on securities . . . . . . . . . . . . . . . . . . . . . . . . . . . . . 890 6 795 1,718 Less: Noninterest expense . . . . . . . . . . . . . . . . . . . . . . . . . . . . 66,159 997 52,331 113,396
Salaries and employee benefits . . . . . . . . . . . . . . . . . . . . . . . . 27,374 488 2,146 2,815 21,925 49,564 Of premises and fixed assets . . . . . . . . . . . . . . . . . . . . . . . . . . 7,792 121 588 781 6,303 14,287 Other noninterest expense. . . . . . . . . . . . . . . . . . . . . . . . . . . . 29,072 383 2,249 4,008 22,431 47,206
Less: Taxes on income before extraord. items . . . . . . . . . . . . 14,209 596 1,712 11,807 22,431 Income/loss from extraord. items, net of taxes . . . . . . . . . . . . 77 0 81 39
Memoranda: Net operating income . . . . . . . . . . . . . . . . . . . . . . . . . . . . . . . . . . . 27,126 269 1,495 3,342 22,021 44,102 Income before taxes and extraordinary items . . . . . . . . . . . . . . . . . 41,926 369 2,113 5,095 34,350 67,698 Income net of taxes before extraordinary items . . . . . . . . . . . . . . . 27,717 274 1,517 3,383 22,543 45,267 Cash dividends declared . . . . . . . . . . . . . . . . . . . . . . . . . . . . . . . . . 21,571 157 746 1,252 19,416 33,901 Net loan and lease losses. . . . . . . . . . . . . . . . . . . . . . . . . . . . . . . . . 15,980 44 297 1,075 14,565 21,636
Charge-offs to loan and lease reserve . . . . . . . . . . . . . . . . . . . . . 18,568 62 385 1,318 16,803 25,375 Less: Recoveries credited to loan & lease resv. . . . . . . . . . . . . . 2,587 18 88 243 2,238 3,739
million billion
131 944
$3,383 $1,513
8,213 4,894
67 5,808 2,614
58 30 7,805 5,025
95 0 (4)
*Includes mortgage indebtedness
Quarterly Journal, Vol. 21, No. 3, September 2002 109

Quarterly net loan and lease losses of national banks by asset sizeSecond quarter 2002
(Dollar figures in millions)
National banks Memoranda:
All Less than $100 $1 billion Greater All national $100 million to to $10 than $10 commercial banks $1 billion billion banks
Number of institutions reporting. . . . . . . . . . . . . . . . . . . . . . . . . 2,104 944 131 42 7,966
Net charge-offs to loan and lease reserve . . . . . . . . . . . . . . . . . . $7,648 $468 $6,998 $10,561
Loans secured by real estate . . . . . . . . . . . . . . . . . . . . . . . . . . 430 31 378 650 1–4 family residential mortgages . . . . . . . . . . . . . . . . . . . . . . 203 2 7 11 183 299 Home equity loans . . . . . . . . . . . . . . . . . . . . . . . . . . . . . . . . . 74 0 1 4 69 89 Multifamily residential mortgages . . . . . . . . . . . . . . . . . . . . . 9 0 0 1 8 12 Commercial RE loans . . . . . . . . . . . . . . . . . . . . . . . . . . . . . . . 82 1 7 11 63 163 Construction RE loans . . . . . . . . . . . . . . . . . . . . . . . . . . . . . . 33 0 2 3 29 55 Farmland loans . . . . . . . . . . . . . . . . . . . . . . . . . . . . . . . . . . . . 3 0 1 1 2 6 RE loans from foreign offices . . . . . . . . . . . . . . . . . . . . . . . . . 0 0 0 0 0 0
Commercial and industrial loans . . . . . . . . . . . . . . . . . . . . . . 2,904 44 132 2,718 4,184 Loans to individuals . . . . . . . . . . . . . . . . . . . . . . . . . . . . . . . . . 3,799 286 3,415 5,013
Credit cards . . . . . . . . . . . . . . . . . . . . . . . . . . . . . . . . . . . . . . . 2,838 2 60 212 2,564 3,722 Installment loans and other plans . . . . . . . . . . . . . . . . . . . . . . 961 7 29 74 851 1,291
All other loans and leases . . . . . . . . . . . . . . . . . . . . . . . . . . . . . 514 8 18 486 713
Charge-offs to loan and lease reserve . . . . . . . . . . . . . . . . . . . . . 8,984 591 8,158 12,494
Loans secured by real estate . . . . . . . . . . . . . . . . . . . . . . . . . . 515 41 446 810 1–4 family residential mortgages . . . . . . . . . . . . . . . . . . . . . . 230 2 9 14 205 349 Home equity loans . . . . . . . . . . . . . . . . . . . . . . . . . . . . . . . . . 85 0 1 5 79 105 Multifamily residential mortgages . . . . . . . . . . . . . . . . . . . . . 10 0 1 1 9 16 Commercial RE loans . . . . . . . . . . . . . . . . . . . . . . . . . . . . . . . 108 2 9 15 82 223 Construction RE loans . . . . . . . . . . . . . . . . . . . . . . . . . . . . . . 44 0 2 5 37 72 Farmland loans . . . . . . . . . . . . . . . . . . . . . . . . . . . . . . . . . . . . 5 0 1 1 2 10 RE loans from foreign offices . . . . . . . . . . . . . . . . . . . . . . . . . 32 0 0 1 31 34
Commercial and industrial loans . . . . . . . . . . . . . . . . . . . . . . 3,355 55 163 3,123 4,791 Loans to individuals . . . . . . . . . . . . . . . . . . . . . . . . . . . . . . . . . 4,501 362 4,013 6,031
Credit cards . . . . . . . . . . . . . . . . . . . . . . . . . . . . . . . . . . . . . . . 3,228 2 70 254 2,902 4,282 Installment loans and other plans . . . . . . . . . . . . . . . . . . . . . . 1,274 10 44 108 1,111 1,749
All other loans and leases . . . . . . . . . . . . . . . . . . . . . . . . . . . . . 613 24 576 861
Recoveries credited to loan and lease reserve . . . . . . . . . . . . . . 1,337 44 123 1,160 1,933
Loans secured by real estate . . . . . . . . . . . . . . . . . . . . . . . . . . 85 6 10 68 160 1–4 family residential mortgages . . . . . . . . . . . . . . . . . . . . . . 27 1 2 2 22 50 Home equity loans . . . . . . . . . . . . . . . . . . . . . . . . . . . . . . . . . 11 (0) 0 1 10 16 Multifamily residential mortgages . . . . . . . . . . . . . . . . . . . . . 1 0 0 0 1 4 Commercial RE loans . . . . . . . . . . . . . . . . . . . . . . . . . . . . . . . 26 0 2 3 20 60 Construction RE loans . . . . . . . . . . . . . . . . . . . . . . . . . . . . . . 11 0 0 2 8 17 Farmland loans . . . . . . . . . . . . . . . . . . . . . . . . . . . . . . . . . . . . 1 0 0 1 0 4 RE loans from foreign offices . . . . . . . . . . . . . . . . . . . . . . . . . 7 0 0 0 7 8
Commercial and industrial loans . . . . . . . . . . . . . . . . . . . . . . 451 32 405 607 Loans to individuals . . . . . . . . . . . . . . . . . . . . . . . . . . . . . . . . . 702 76 597 1,018
Credit cards . . . . . . . . . . . . . . . . . . . . . . . . . . . . . . . . . . . . . . . 390 0 10 42 338 560 Installment loans and other plans . . . . . . . . . . . . . . . . . . . . . . 312 4 15 34 259 458
All other loans and leases . . . . . . . . . . . . . . . . . . . . . . . . . . . . . 100 3 5 89 148
million billion
987
$157 $25
16 4
10 89 9
1
202 34
22 5
13 114 13
11 3
10
1
11 3 25 4
2
110 Quarterly Journal, Vol. 21, No. 3, September 2002
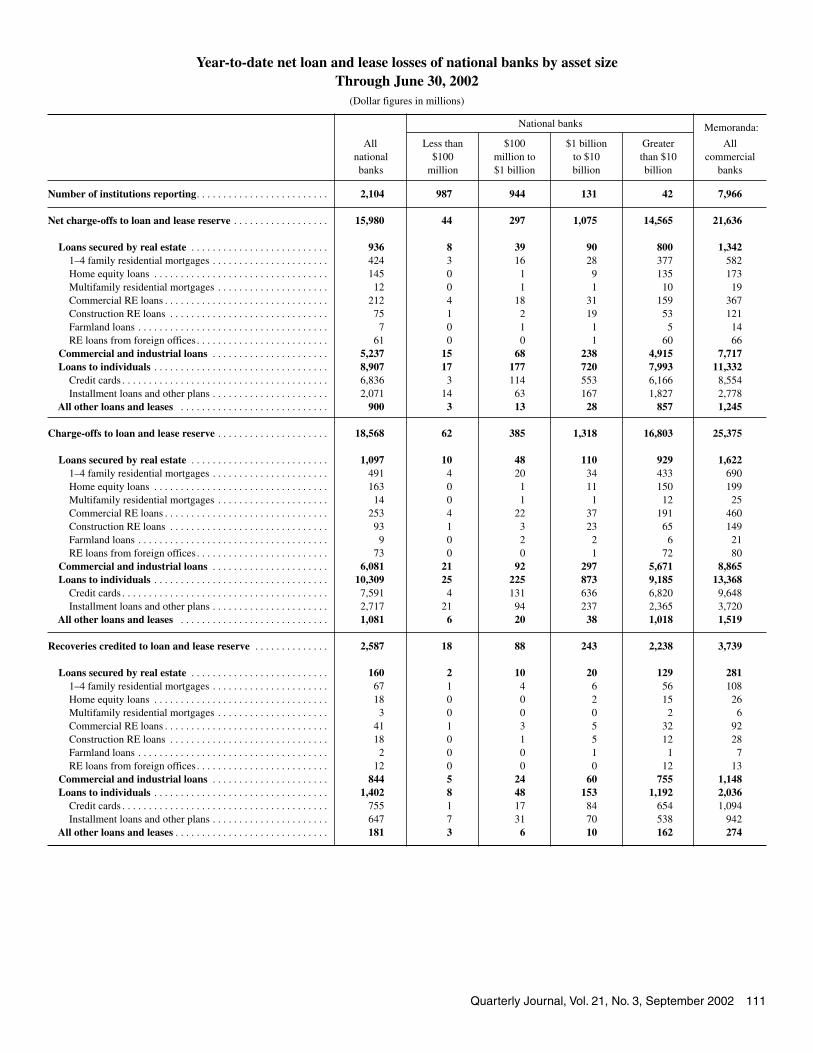
Year-to-date net loan and lease losses of national banks by asset sizeThrough June 30, 2002
(Dollar figures in millions)
National banks Memoranda:
All Less than $100 $1 billion Greater All national $100 million to to $10 than $10 commercial banks $1 billion billion banks
Number of institutions reporting. . . . . . . . . . . . . . . . . . . . . . . . . 2,104 944 131 42 7,966
Net charge-offs to loan and lease reserve . . . . . . . . . . . . . . . . . . 15,980 1,075 14,565 21,636
Loans secured by real estate . . . . . . . . . . . . . . . . . . . . . . . . . . 936 90 800 1,342 1–4 family residential mortgages . . . . . . . . . . . . . . . . . . . . . . 424 3 16 28 377 582 Home equity loans . . . . . . . . . . . . . . . . . . . . . . . . . . . . . . . . . 145 0 1 9 135 173 Multifamily residential mortgages . . . . . . . . . . . . . . . . . . . . . 12 0 1 1 10 19 Commercial RE loans . . . . . . . . . . . . . . . . . . . . . . . . . . . . . . . 212 4 18 31 159 367 Construction RE loans . . . . . . . . . . . . . . . . . . . . . . . . . . . . . . 75 1 2 19 53 121 Farmland loans . . . . . . . . . . . . . . . . . . . . . . . . . . . . . . . . . . . . 7 0 1 1 5 14 RE loans from foreign offices . . . . . . . . . . . . . . . . . . . . . . . . . 61 0 0 1 60 66
Commercial and industrial loans . . . . . . . . . . . . . . . . . . . . . . 5,237 68 238 4,915 7,717 Loans to individuals . . . . . . . . . . . . . . . . . . . . . . . . . . . . . . . . . 8,907 720 7,993 11,332
Credit cards . . . . . . . . . . . . . . . . . . . . . . . . . . . . . . . . . . . . . . . 6,836 3 114 553 6,166 8,554 Installment loans and other plans . . . . . . . . . . . . . . . . . . . . . . 2,071 14 63 167 1,827 2,778
All other loans and leases . . . . . . . . . . . . . . . . . . . . . . . . . . . . 900 28 857 1,245
Charge-offs to loan and lease reserve . . . . . . . . . . . . . . . . . . . . . 18,568 1,318 16,803 25,375
Loans secured by real estate . . . . . . . . . . . . . . . . . . . . . . . . . . 1,097 48 110 929 1,622 1–4 family residential mortgages . . . . . . . . . . . . . . . . . . . . . . 491 4 20 34 433 690 Home equity loans . . . . . . . . . . . . . . . . . . . . . . . . . . . . . . . . . 163 0 1 11 150 199 Multifamily residential mortgages . . . . . . . . . . . . . . . . . . . . . 14 0 1 1 12 25 Commercial RE loans . . . . . . . . . . . . . . . . . . . . . . . . . . . . . . . 253 4 22 37 191 460 Construction RE loans . . . . . . . . . . . . . . . . . . . . . . . . . . . . . . 93 1 3 23 65 149 Farmland loans . . . . . . . . . . . . . . . . . . . . . . . . . . . . . . . . . . . . 9 0 2 2 6 21 RE loans from foreign offices . . . . . . . . . . . . . . . . . . . . . . . . . 73 0 0 1 72 80
Commercial and industrial loans . . . . . . . . . . . . . . . . . . . . . . 6,081 92 297 5,671 8,865 Loans to individuals . . . . . . . . . . . . . . . . . . . . . . . . . . . . . . . . . 10,309 873 9,185 13,368
Credit cards . . . . . . . . . . . . . . . . . . . . . . . . . . . . . . . . . . . . . . . 7,591 4 131 636 6,820 9,648 Installment loans and other plans . . . . . . . . . . . . . . . . . . . . . . 2,717 21 94 237 2,365 3,720
All other loans and leases . . . . . . . . . . . . . . . . . . . . . . . . . . . . 1,081 38 1,018 1,519
Recoveries credited to loan and lease reserve . . . . . . . . . . . . . . 2,587 88 243 2,238 3,739
Loans secured by real estate . . . . . . . . . . . . . . . . . . . . . . . . . . 160 20 129 281 1–4 family residential mortgages . . . . . . . . . . . . . . . . . . . . . . 67 1 4 6 56 108 Home equity loans . . . . . . . . . . . . . . . . . . . . . . . . . . . . . . . . . 18 0 0 2 15 26 Multifamily residential mortgages . . . . . . . . . . . . . . . . . . . . . 3 0 0 0 2 6 Commercial RE loans . . . . . . . . . . . . . . . . . . . . . . . . . . . . . . . 41 1 3 5 32 92 Construction RE loans . . . . . . . . . . . . . . . . . . . . . . . . . . . . . . 18 0 1 5 12 28 Farmland loans . . . . . . . . . . . . . . . . . . . . . . . . . . . . . . . . . . . . 2 0 0 1 1 7 RE loans from foreign offices . . . . . . . . . . . . . . . . . . . . . . . . . 12 0 0 0 12 13
Commercial and industrial loans . . . . . . . . . . . . . . . . . . . . . . 844 60 755 1,148 Loans to individuals . . . . . . . . . . . . . . . . . . . . . . . . . . . . . . . . . 1,402 153 1,192 2,036
Credit cards . . . . . . . . . . . . . . . . . . . . . . . . . . . . . . . . . . . . . . . 755 1 17 84 654 1,094 Installment loans and other plans . . . . . . . . . . . . . . . . . . . . . . 647 7 31 70 538 942
All other loans and leases . . . . . . . . . . . . . . . . . . . . . . . . . . . . . 181 6 10 162 274
million billion
987
297 44
39 8
15 177 17
13 3
385 62
10
21 225 25
20 6
18
10 2
24 5 48 8
3
Quarterly Journal, Vol. 21, No. 3, September 2002 111

Number of national banks by state and asset size June 30, 2002
National banks Memoranda:
All Less than $100 $1 billion Greater All national $100 million to to $10 than $10 commercial banks $1 billion billion banks
All institutions . . . . . . . . . . . . . . . . . . . . . . . . . . . . . . . . . . . . . . . . 2,104 987 42
Alabama . . . . . . . . . . . . . . . . . . . . . . . . . . . . . . . . . . . . . . . . . . . 22 13 8 1 0 153 Alaska . . . . . . . . . . . . . . . . . . . . . . . . . . . . . . . . . . . . . . . . . . . . . 3 1 0 2 0 6 Arizona . . . . . . . . . . . . . . . . . . . . . . . . . . . . . . . . . . . . . . . . . . . . 16 6 5 3 2 40 Arkansas . . . . . . . . . . . . . . . . . . . . . . . . . . . . . . . . . . . . . . . . . . . 41 12 28 1 0 170 California . . . . . . . . . . . . . . . . . . . . . . . . . . . . . . . . . . . . . . . . . . 81 34 37 7 3 288 Colorado . . . . . . . . . . . . . . . . . . . . . . . . . . . . . . . . . . . . . . . . . . . 52 26 22 3 1 175 Connecticut . . . . . . . . . . . . . . . . . . . . . . . . . . . . . . . . . . . . . . . . . 8 1 7 0 0 25 Delaware . . . . . . . . . . . . . . . . . . . . . . . . . . . . . . . . . . . . . . . . . . . 14 2 7 2 3 31 District of Columbia . . . . . . . . . . . . . . . . . . . . . . . . . . . . . . . . . . 4 2 2 0 0 4 Florida . . . . . . . . . . . . . . . . . . . . . . . . . . . . . . . . . . . . . . . . . . . . . 72 24 40 8 0 259 Georgia . . . . . . . . . . . . . . . . . . . . . . . . . . . . . . . . . . . . . . . . . . . . 62 31 28 3 0 324 Hawaii . . . . . . . . . . . . . . . . . . . . . . . . . . . . . . . . . . . . . . . . . . . . . 1 0 1 0 0 7 Idaho . . . . . . . . . . . . . . . . . . . . . . . . . . . . . . . . . . . . . . . . . . . . . . 1 0 1 0 0 17 Illinois . . . . . . . . . . . . . . . . . . . . . . . . . . . . . . . . . . . . . . . . . . . . . 177 73 92 8 4 686 Indiana. . . . . . . . . . . . . . . . . . . . . . . . . . . . . . . . . . . . . . . . . . . . . 32 8 16 6 2 154 Iowa. . . . . . . . . . . . . . . . . . . . . . . . . . . . . . . . . . . . . . . . . . . . . . . 49 28 19 2 0 414 Kansas . . . . . . . . . . . . . . . . . . . . . . . . . . . . . . . . . . . . . . . . . . . . . 104 73 28 3 0 368 Kentucky . . . . . . . . . . . . . . . . . . . . . . . . . . . . . . . . . . . . . . . . . . . 51 23 25 3 0 227 Louisiana. . . . . . . . . . . . . . . . . . . . . . . . . . . . . . . . . . . . . . . . . . . 16 6 8 1 1 142 Maine . . . . . . . . . . . . . . . . . . . . . . . . . . . . . . . . . . . . . . . . . . . . . 6 1 4 0 1 15 Maryland . . . . . . . . . . . . . . . . . . . . . . . . . . . . . . . . . . . . . . . . . . . 11 3 8 0 0 72 Massachusetts . . . . . . . . . . . . . . . . . . . . . . . . . . . . . . . . . . . . . . . 13 5 7 1 0 41 Michigan . . . . . . . . . . . . . . . . . . . . . . . . . . . . . . . . . . . . . . . . . . . 27 10 16 0 1 161 Minnesota . . . . . . . . . . . . . . . . . . . . . . . . . . . . . . . . . . . . . . . . . . 123 79 39 3 2 472 Mississippi . . . . . . . . . . . . . . . . . . . . . . . . . . . . . . . . . . . . . . . . . 20 8 10 2 0 98 Missouri . . . . . . . . . . . . . . . . . . . . . . . . . . . . . . . . . . . . . . . . . . . 46 24 18 3 1 350 Montana . . . . . . . . . . . . . . . . . . . . . . . . . . . . . . . . . . . . . . . . . . . 16 13 2 1 0 80 Nebraska . . . . . . . . . . . . . . . . . . . . . . . . . . . . . . . . . . . . . . . . . . . 77 54 21 2 0 273 Nevada . . . . . . . . . . . . . . . . . . . . . . . . . . . . . . . . . . . . . . . . . . . . 8 1 3 4 0 35 New Hampshire . . . . . . . . . . . . . . . . . . . . . . . . . . . . . . . . . . . . . 5 2 2 0 1 14 New Jersey . . . . . . . . . . . . . . . . . . . . . . . . . . . . . . . . . . . . . . . . . 24 2 15 7 0 82 New Mexico . . . . . . . . . . . . . . . . . . . . . . . . . . . . . . . . . . . . . . . . 15 6 6 3 0 52 New York. . . . . . . . . . . . . . . . . . . . . . . . . . . . . . . . . . . . . . . . . . . 57 10 39 7 1 137 North Carolina . . . . . . . . . . . . . . . . . . . . . . . . . . . . . . . . . . . . . . 7 0 5 0 2 72 North Dakota. . . . . . . . . . . . . . . . . . . . . . . . . . . . . . . . . . . . . . . . 15 6 6 3 0 104 Ohio. . . . . . . . . . . . . . . . . . . . . . . . . . . . . . . . . . . . . . . . . . . . . . . 87 36 37 7 7 201 Oklahoma . . . . . . . . . . . . . . . . . . . . . . . . . . . . . . . . . . . . . . . . . . 94 55 35 4 0 276 Oregon. . . . . . . . . . . . . . . . . . . . . . . . . . . . . . . . . . . . . . . . . . . . . 3 0 2 1 0 32 Pennsylvania . . . . . . . . . . . . . . . . . . . . . . . . . . . . . . . . . . . . . . . . 80 21 49 7 3 177 Rhode Island . . . . . . . . . . . . . . . . . . . . . . . . . . . . . . . . . . . . . . . . 4 2 0 1 1 7 South Carolina . . . . . . . . . . . . . . . . . . . . . . . . . . . . . . . . . . . . . . 25 13 11 1 0 77 South Dakota. . . . . . . . . . . . . . . . . . . . . . . . . . . . . . . . . . . . . . . . 19 8 8 2 1 93 Tennessee . . . . . . . . . . . . . . . . . . . . . . . . . . . . . . . . . . . . . . . . . . 28 6 19 0 3 190 Texas . . . . . . . . . . . . . . . . . . . . . . . . . . . . . . . . . . . . . . . . . . . . . . 335 202 123 9 1 675 Utah. . . . . . . . . . . . . . . . . . . . . . . . . . . . . . . . . . . . . . . . . . . . . . . 7 2 3 1 1 56 Vermont. . . . . . . . . . . . . . . . . . . . . . . . . . . . . . . . . . . . . . . . . . . . 8 2 6 0 0 15 Virginia . . . . . . . . . . . . . . . . . . . . . . . . . . . . . . . . . . . . . . . . . . . . 34 5 26 3 0 128 Washington . . . . . . . . . . . . . . . . . . . . . . . . . . . . . . . . . . . . . . . . . 15 11 4 0 0 79 West Virginia. . . . . . . . . . . . . . . . . . . . . . . . . . . . . . . . . . . . . . . . 21 9 10 2 0 70 Wisconsin . . . . . . . . . . . . . . . . . . . . . . . . . . . . . . . . . . . . . . . . . . 48 19 26 3 0 279 Wyoming. . . . . . . . . . . . . . . . . . . . . . . . . . . . . . . . . . . . . . . . . . . 20 9 10 1 0 45 U.S. territories . . . . . . . . . . . . . . . . . . . . . . . . . . . . . . . . . . . . . . 0 0 0 0 0 18
million billion
131 944 7,966
112 Quarterly Journal, Vol. 21, No. 3, September 2002

Total assets of national banks by state and asset sizeJune 30, 2002
(Dollar figures in millions)
National banks Memoranda:
All Less than $100 $1 billion Greater All national $100 million to to $10 than $10 commercial banks $1 billion billion banks
All institutions . . . . . . . . . . . . . . . . . . . . . . . . . . . . . . . . . . . . . . . . $3,739,495 $250,321 $413,938 $3,022,963 $6,749,662
Alabama . . . . . . . . . . . . . . . . . . . . . . . . . . . . . . . . . . . . . . . . . . . 3,953 815 1,921 1,216 0 191,856 Alaska . . . . . . . . . . . . . . . . . . . . . . . . . . . . . . . . . . . . . . . . . . . . . 5,302 60 0 5,242 0 6,369 Arizona . . . . . . . . . . . . . . . . . . . . . . . . . . . . . . . . . . . . . . . . . . . . 41,280 170 1,853 5,584 33,673 43,803 Arkansas . . . . . . . . . . . . . . . . . . . . . . . . . . . . . . . . . . . . . . . . . . . 8,488 732 6,746 1,010 0 30,635 California . . . . . . . . . . . . . . . . . . . . . . . . . . . . . . . . . . . . . . . . . . 225,929 1,796 12,480 17,431 194,222 Colorado . . . . . . . . . . . . . . . . . . . . . . . . . . . . . . . . . . . . . . . . . . . 30,535 1,272 5,076 6,117 18,071 51,376 Connecticut . . . . . . . . . . . . . . . . . . . . . . . . . . . . . . . . . . . . . . . . . 1,614 91 1,524 0 0 3,649 Delaware . . . . . . . . . . . . . . . . . . . . . . . . . . . . . . . . . . . . . . . . . . . 98,585 68 1,518 4,484 92,516 140,322 District of Columbia . . . . . . . . . . . . . . . . . . . . . . . . . . . . . . . . . . 463 95 368 0 0 463 Florida . . . . . . . . . . . . . . . . . . . . . . . . . . . . . . . . . . . . . . . . . . . . . 28,824 1,689 10,091 17,045 0 66,963 Georgia . . . . . . . . . . . . . . . . . . . . . . . . . . . . . . . . . . . . . . . . . . . . 18,734 1,698 5,558 11,478 0 169,825 Hawaii . . . . . . . . . . . . . . . . . . . . . . . . . . . . . . . . . . . . . . . . . . . . . 356 0 356 0 0 22,887 Idaho . . . . . . . . . . . . . . . . . . . . . . . . . . . . . . . . . . . . . . . . . . . . . . 258 0 258 0 0 3,021 Illinois . . . . . . . . . . . . . . . . . . . . . . . . . . . . . . . . . . . . . . . . . . . . . 323,114 3,912 22,887 20,521 275,794 Indiana. . . . . . . . . . . . . . . . . . . . . . . . . . . . . . . . . . . . . . . . . . . . . 72,326 445 6,718 19,314 45,849 Iowa. . . . . . . . . . . . . . . . . . . . . . . . . . . . . . . . . . . . . . . . . . . . . . . 14,992 1,510 4,943 8,538 0 46,444 Kansas . . . . . . . . . . . . . . . . . . . . . . . . . . . . . . . . . . . . . . . . . . . . . 16,127 3,670 7,812 4,645 0 37,226 Kentucky . . . . . . . . . . . . . . . . . . . . . . . . . . . . . . . . . . . . . . . . . . . 22,806 1,498 5,054 16,255 0 54,707 Louisiana. . . . . . . . . . . . . . . . . . . . . . . . . . . . . . . . . . . . . . . . . . . 25,045 329 1,569 6,925 16,222 42,662 Maine . . . . . . . . . . . . . . . . . . . . . . . . . . . . . . . . . . . . . . . . . . . . . 23,316 39 2,036 0 21,241 25,395 Maryland . . . . . . . . . . . . . . . . . . . . . . . . . . . . . . . . . . . . . . . . . . . 2,530 169 2,361 0 0 48,655 Massachusetts . . . . . . . . . . . . . . . . . . . . . . . . . . . . . . . . . . . . . . . 3,402 261 1,691 1,449 0 121,324 Michigan . . . . . . . . . . . . . . . . . . . . . . . . . . . . . . . . . . . . . . . . . . . 47,254 437 4,554 0 42,263 145,152 Minnesota . . . . . . . . . . . . . . . . . . . . . . . . . . . . . . . . . . . . . . . . . . 84,212 4,138 8,941 5,286 65,847 107,538 Mississippi . . . . . . . . . . . . . . . . . . . . . . . . . . . . . . . . . . . . . . . . . 10,392 449 2,208 7,736 0 36,347 Missouri . . . . . . . . . . . . . . . . . . . . . . . . . . . . . . . . . . . . . . . . . . . 26,330 1,345 4,733 9,953 10,300 70,242 Montana . . . . . . . . . . . . . . . . . . . . . . . . . . . . . . . . . . . . . . . . . . . 2,623 570 511 1,543 0 12,996 Nebraska . . . . . . . . . . . . . . . . . . . . . . . . . . . . . . . . . . . . . . . . . . . 16,203 2,496 4,921 8,785 0 30,689 Nevada . . . . . . . . . . . . . . . . . . . . . . . . . . . . . . . . . . . . . . . . . . . . 25,492 43 952 24,496 0 39,424 New Hampshire . . . . . . . . . . . . . . . . . . . . . . . . . . . . . . . . . . . . . 16,316 63 397 0 15,857 18,805 New Jersey . . . . . . . . . . . . . . . . . . . . . . . . . . . . . . . . . . . . . . . . . 34,655 120 4,762 29,773 0 77,172 New Mexico . . . . . . . . . . . . . . . . . . . . . . . . . . . . . . . . . . . . . . . . 10,847 373 2,032 8,442 0 15,373 New York. . . . . . . . . . . . . . . . . . . . . . . . . . . . . . . . . . . . . . . . . . . 517,875 655 12,120 18,027 487,074 North Carolina . . . . . . . . . . . . . . . . . . . . . . . . . . . . . . . . . . . . . . 865,292 0 1,531 0 863,761 968,673 North Dakota. . . . . . . . . . . . . . . . . . . . . . . . . . . . . . . . . . . . . . . . 11,791 282 1,758 9,751 0 18,158 Ohio. . . . . . . . . . . . . . . . . . . . . . . . . . . . . . . . . . . . . . . . . . . . . . . 437,548 1,875 10,785 18,459 406,428 Oklahoma . . . . . . . . . . . . . . . . . . . . . . . . . . . . . . . . . . . . . . . . . . 26,376 2,856 7,350 16,170 0 44,903 Oregon. . . . . . . . . . . . . . . . . . . . . . . . . . . . . . . . . . . . . . . . . . . . . 9,768 0 467 9,301 0 18,140 Pennsylvania . . . . . . . . . . . . . . . . . . . . . . . . . . . . . . . . . . . . . . . . 129,355 1,254 15,576 14,615 97,909 189,853 Rhode Island . . . . . . . . . . . . . . . . . . . . . . . . . . . . . . . . . . . . . . . . 184,130 24 0 6,086 178,020 194,966 South Carolina . . . . . . . . . . . . . . . . . . . . . . . . . . . . . . . . . . . . . . 6,037 766 2,905 2,367 0 27,409 South Dakota. . . . . . . . . . . . . . . . . . . . . . . . . . . . . . . . . . . . . . . . 57,768 247 2,793 12,778 41,950 66,666 Tennessee . . . . . . . . . . . . . . . . . . . . . . . . . . . . . . . . . . . . . . . . . . 79,086 453 6,599 0 72,033 101,965 Texas . . . . . . . . . . . . . . . . . . . . . . . . . . . . . . . . . . . . . . . . . . . . . . 88,281 10,478 30,906 23,522 23,374 Utah. . . . . . . . . . . . . . . . . . . . . . . . . . . . . . . . . . . . . . . . . . . . . . . 31,143 67 802 9,716 20,558 126,909 Vermont. . . . . . . . . . . . . . . . . . . . . . . . . . . . . . . . . . . . . . . . . . . . 1,335 106 1,229 0 0 5,678 Virginia . . . . . . . . . . . . . . . . . . . . . . . . . . . . . . . . . . . . . . . . . . . . 17,706 243 7,139 10,324 0 76,822 Washington . . . . . . . . . . . . . . . . . . . . . . . . . . . . . . . . . . . . . . . . . 1,927 592 1,335 0 0 22,952 West Virginia. . . . . . . . . . . . . . . . . . . . . . . . . . . . . . . . . . . . . . . . 6,707 505 2,093 4,109 0 18,712 Wisconsin . . . . . . . . . . . . . . . . . . . . . . . . . . . . . . . . . . . . . . . . . . 20,651 1,137 6,362 13,153 0 84,836 Wyoming. . . . . . . . . . . . . . . . . . . . . . . . . . . . . . . . . . . . . . . . . . . 4,415 382 1,739 2,294 0 6,843 U.S. territories. . . . . . . . . . . . . . . . . . . . . . . . . . . . . . . . . . . . . . . 0 0 0 0 0 65,085
million billion
$52,273
376,187
462,730 110,961
1,432,805
520,581
146,512
Quarterly Journal, Vol. 21, No. 3, September 2002 113

Index
Affiliated mergers:For quarter, 80
Affiliated mergers—thrift:For quarter, 82
Appeals process, 25Applications for national bank charters,
by state and charter type, 93Applications for new, full-service national bank
charters, approved and denied, by state (corporate structure table), 86
Assets, liabilities, and capital accounts of national banks (financial table), 101
Assets of national banks by asset size (financial table), 104Assets, total, of national banks by state and asset size
(financial table), 113
Changes in the corporate structure of the national banking system, by state (corporate structure table), 85
Commercial banks:Condition and performance of, 1Number of commercial banks by state, 112Off-balance-sheet items, 107Past-due and nonaccrual loans and leases, 105Quarterly income and expenses, 102, 108Quarterly net loan and lease losses, 110Total assets, 104Total assets by state, 113Total liabilities, 106Year-to-date income and expenses, 109Year-to-date net loan and lease losses, 111
Condition and performance of commercial banks, 1Congressional testimony, speeches and, 27Corporate decisions, recent, 19Corporate structure of the national banking system,
tables on the, 83
Decisions, recent corporate, 19
Enforcement activities, special supervision/fraud and, 21
Failed national bank paid out by the FDIC (corporate structure table), 94
Federal branches and agencies of foreign banks in operation (corporate structure table), 97
Financial performance of national banks, tables on the, 99
Hawke, John D., Jr., Comptroller of the Currency:Biography, inside front coverSpeeches and congressional testimony, 27
Interpretations, 49Interpretive letters:
Interpretive Letter No. 930: Permissibility of purchasing bonds convertible into equity, 51
Interpretive Letter No. 931: Permissibility of investing in perpetual preferred stock, 54
Interpretive Letter No. 932: Permissibility of non-relationship customer check cashing fees, 55
Interpretive Letter No. 933: Permissibility of non-accountholder check cashing fees, 58
Interpretive Letter No. 934: Permissibility of non-accountholder check cashing fees, 62
Interpretive Letter No. 935: Permissibility of holding securities for hedging purposes, 65
Interpretive Letter No. 936: Permissibility of operations of a collective investment fund, 67
Interpretive Letter No. 937: Permissibility of engaging in financial intermediation transactions, 69
Key indicators, FDIC-insured commercial banks (condition tables):
Annual 1998–2001, year-to-date through quarter, 10By asset size, 12By region, 14
Key indicators, FDIC-insured national banks (condition tables):
Annual 1998–2001, year-to-date through quarter, 4By asset size, 6By region, 8
Liabilities of national banks by asset size (financial table), 106
Loan performance, FDIC-insured commercial banks (condition tables):
Annual 1998–2001, year-to-date through quarter, 11By asset size, 13By region, 15
Loan performance, FDIC-insured national banks (condition tables):
Annual 1998–2001, year-to-date through quarter, 5By asset size, 7By region, 9
Quarterly Journal, Vol. 21, No. 3, September 2002 115

Mergers:Affiliated, (involving affiliated operating banks),
for quarter, 80Affiliated, —thrift (involving affiliated national
banks and savings and loan associations), for quarter, 82
Nonaffiliated, (involving two or more nonaffiliated operating banks), for quarter, 79
National banks converted out of the national banking system (corporate structure table), 96
National banks merged out of the national banking system (corporate structure table), 95
New, full-service national bank charters issued (corporate structure table), 87
New, limited-purpose national bank charters issued (corporate structure table), 88
Nonaffiliated mergers:For quarter, 79
Nonbanking institutions converted to full-service national banks (corporate structure table), 91
Nonbanking institutions converted to limited-purposenational banks (corporate structure table), 92
Number of national banks by state and asset size (financial table), 112
Off-balance-sheet items of national banks by asset size (financial table), 107
Office of the Comptroller of the Currency:Interpretations, 49Speeches and congressional testimony, 27
Past-due and nonaccrual loans and leases of national banks by asset size (financial table), 105
Quarterly income and expenses of national banks by asset size (financial table), 108
Quarterly income and expenses of national banks (financial table), 102
Quarterly net loan and lease losses of national banks by asset size (financial table), 110
Recent corporate decisions, 19
Special supervision/fraud and enforcement activities, 21 Speeches and congressional testimony:
Of John D. Hawke Jr., Comptroller of the Currency:On the benefits of financial literacy programs, 29On ending inequitable treatment of
national banks, 33On the growing consensus that the fee disparity
problem must be fixed, 38Of Julie L. Williams, First Senior Deputy
Comptroller and Chief Counsel:On the beneficial relationships between banks
and community development corporations, 44
State-chartered banks converted to full-service national banks (corporate structure table), 89
State-chartered banks converted to limited-purpose national banks (corporate structure table), 90
Tables on the corporate structure of the national banking system, 83
Tables on the financial performance of national banks, 99Testimony, congressional, speeches and, 27Total assets of national banks by state and asset size
(financial table), 113
Williams, Julie L., First Senior Deputy Comptroller and Chief Counsel:
Speech, 44
Year-to-date income and expenses of national banks by asset size (financial table), 109
Year-to-date income and expenses of national banks (financial table), 103
Year-to-date net loan and lease losses of national banks by asset size (financial table), 111
12 USC 24(7) (interpretive letters), 54, 55, 58, 62, 65, 69
12 CFR 1 (interpretive letter), 5112 CFR 7.4002(a) and (b) (interpretive letters), 55, 58,
62, 6712 CFR 9.18 (interpretive letter), 67
116 Quarterly Journal, Vol. 21, No. 3, September 2002

Northeastern District New York District Office 1114 Avenue of the AmericasSuite 3900New York, NY 10036–7780
(212) 819–9860
Midwestern District
Kansas City District Office 2345 Grand BoulevardSuite 700Kansas City, MO 64108–2683
(816) 556–1800
Southwestern District Dallas District Office 1600 Lincoln Plaza, Suite 1600 500 North Akard Street Dallas, TX 75201–3394
(214) 720–0656
Southeastern District
Atlanta District Office Marquis One Tower, Suite 600 245 Peachtree Center Ave., NE Atlanta, GA 30303–1223
(404) 659–8855
Headquarters
Washington Office 250 E Street, SW Washington, DC 20219–0001
(202) 874–5000
Central District Chicago District Office One Financial Place, Suite 2700 440 South LaSalle Street Chicago, IL 60605–1073
(312) 360–8800
Western District
San Francisco District Office 50 Fremont StreetSuite 3900San Francisco, CA 94105–2292
(415) 545–5900
For more information on the Office of the Comptroller of the Currency, contact:
OCC Public Information Room, Communications Division, Washington, DC 20219 fax (202) 874–4448****e-mail [email protected]