quarterly energy prices - gov.uk · 2018-06-27 · electricity and gas customers in the domestic...
TRANSCRIPT

QUARTERLY ENERGY PRICES
June 2018

Contents
CONTACT POINTS __________________________________________________________ 3
Section 1 – Introduction _______________________________________________________ 4
Section 2 – Domestic Prices ____________________________________________________ 7
Retail price of fuels for the domestic sector ______________________________________ 7
Domestic electricity and gas bills ______________________________________________ 10
Domestic energy bills based on actual consumption _______________________________ 12
Payment methods _________________________________________________________ 12
Regional variation of payment methods - Electricity _______________________________ 15
Regional variation of payment methods - Gas ____________________________________ 16
Domestic energy competition _________________________________________________ 17
Variation in energy competition between payment methods _________________________ 19
Regional competition - Electricity ______________________________________________ 20
Regional competition - Gas __________________________________________________ 21
Fixed Tariffs ______________________________________________________________ 22
Variation in tariff type between payment methods _________________________________ 24
Regional variation of fixed tariff proportion - Electricity _____________________________ 25
Regional variation of fixed tariff proportion - Gas __________________________________ 26
Transfer statistics __________________________________________________________ 27
Expenditure on Energy 28
Section 3 – Non-domestic Prices ________________________________________________ 30
Energy prices in the manufacturing sector _______________________________________ 31
Average prices of fuels purchased by the major UK power producers _________________ 33
Fuel price indices for the industrial sector _______________________________________ 35
Gas and electricity prices for the non-domestic sector in the UK ______________________ 36
Section 4 – Oil and Petroleum Product Prices ______________________________________ 38
Retail prices of petroleum products ____________________________________________ 38
Crude oil prices ___________________________________________________________ 41
Section 5 – International Comparisons ____________________________________________ 43
Unleaded petrol and Diesel prices _____________________________________________ 44
Industrial gas and electricity prices ____________________________________________ 46
Domestic electricity and gas prices ____________________________________________ 48
List of charts ________________________________________________________________ 52

3
CONTACT POINTS
This publication, including historical data, is available on the internet at www.gov.uk/government/collections/quarterly-energy-prices
Please direct any suggestions about changes to the content or scope of this publication to Lilian Oluwakuyide ([email protected]).
Quarterly Energy Prices is prepared by the Energy Prices Analysis team in BEIS.
Household Energy Prices Lilian Oluwakuyide 0300 068 8491 [email protected]
Industrial Energy Prices and Petrol Prices Anwar Annut 0300 068 5060 [email protected] International Energy Prices Novica Petrovic 0300 068 5057 [email protected]
More information on BEIS energy publications is available on the BEIS website www.gov.uk/government/organisations/department-for-business-energy-and-industrial-strategy/about/statistics
Other Useful websites Ofgem www.ofgem.gov.uk/DEFRA www.gov.uk/government/organisations/department-
for-environment-food-rural-affairs HM Revenue and Customs www.gov.uk/government/organisations/hm-revenue-
customsInternational Energy Agency www.iea.orgEurostat www.ec.europa.eu/eurostat/ UK Petroleum Industry Association www.ukpia.com
This is a National Statistics publication
The United Kingdom Statistics Authority has designated these statistics as National Statistics, in accordance with the Statistics and Registration Service Act 2007 and signifying compliance with the UK Statistics Authority: Code of Practice for Official Statistics. Designation can be broadly interpreted to mean that the statistics: • meet identified user needs • are well explained and readily accessible • are produced according to sound methods, and • are managed impartially and objectively in the public interest Once statistics have been designated as National Statistics it is a statutory requirement that the Code of Practice shall continue to be observed.
FOR EXPLANATORY NOTES, PLEASE SEE INSIDE THE BACK COVER

4
Section 1 – Introduction
The Quarterly Energy Prices (QEP) publication was first published in June 2001. Tables are available as Excel files at www.gov.uk/government/organisations/department-for-business-energy-and-industrial-strategy/about/statistics. Monthly updates on domestic energy price indices and the prices of petroleum products are posted at the same address, as are any tables affected by changes in the GDP deflator.
In this issue there are provisional Q1 2018 and final annual 2017 prices for industrial consumers and major power producers. There is also a comparison of the International Energy Agency (IEA) prices with those in the UK for 2017. The unleaded petrol and diesel prices are provisional for June 2018 and final for 2017, whilst the international unleaded petrol and diesel prices are for May 2018. Also included in the edition are the domestic average annual bills based on actual consumption and temperature adjusted consumption (Tables 2.2.5 and 2.3.5). These will be next updated in July.
The next issue will be published online on 27th September 2018 and will present customer number changes. Additionally, final Q1 2018 energy prices for the manufacturing sector, industrial and domestic fuel price indices, and the price of fuels for major power producers will be published. The petroleum product prices table will have provisional unleaded petrol and diesel prices for September 2018, and there will be international petrol and diesel prices for August 2018.
Data in the tables are mainly in cash prices. However, price comparisons (unless otherwise stated) refer to movements in data in real terms. These are prices from which the effects of inflation, as measured by the Gross Domestic Product (GDP) market prices deflator, have been removed. The GDP deflator provides an index of inflation in the whole economy and therefore is applicable consistently to domestic and industrial prices.
For most fuels there are differences in the prices paid by smaller consumers, typically households, and those paid by larger consumers, usually those in the industrial sector. Indeed, there are also differences in prices between large and small industrial users. In a competitive energy market, larger consumers can negotiate lower prices. A household’s energy demands may be more variable through the day and year (and therefore higher in peak price times) than those of industrial customers who use energy for continuous processes or can load manage. For these reasons the tables show prices separately for domestic and industrial consumers. Although no prices are given for commercial consumers, prices for the domestic sector should be fairly close to those for smaller commercial consumers and industrial prices should provide a reasonable proxy for larger customers in the commercial sector.
The source of all data is the Department for Business, Energy and Industrial Strategy (BEIS) unless otherwise stated.
Please note: the hyperlinks to tables within this document will open the most recently published version of a table. If you require a previously published version of any table please contact Lilian Oluwakuyide, ([email protected] Tel: 0300 068 8491).
5
The main points in this edition are presented below:
Domestic The price paid for all domestic fuels in real terms has risen by 4.8 per cent in the year to
Q1 2018. Between Q1 2017 and Q1 2018, real terms prices including VAT for domestic electricity increased by 9.5 per cent but domestic gas prices fell slightly by 0.7 per cent.
The average standard electricity bill in 2017, across all payment types has increased by £33 (5.7 per cent) since 2016, from £586 to £619. However, the average 2017 gas bill across all payment types has decreased by £20 (3.1 per cent), from £650 to £630. These bills are based on standard consumptions of 3,800kWh per year for electricity and 15,000kWh per year for gas.
The average combined bill for prepayment fell by £84, from £1,334 in 2016 to £1,250 in 2017, making credit the most expensive method of payment at £1,363. Direct debit is still the cheapest method of payment, with a combined bill of £1,209, £41 cheaper than prepayment.
Average energy bills based on variable consumption - for actual annual consumption, combined energy bills fell by 3.1% in cash terms (£1,112 in 2017) and fell by 5.1% in real terms (£990 in 2017 (2010 prices)). For temperature adjusted consumption, energy bills fell by 0.6% in cash terms (to £1,168 in 2017) and fell by 2.6% in real terms (to £1,040 in 2017 (2010 prices)).
The number of transfers made within the domestic electricity market decreased by 3.3 per cent between Q1 2017 and Q1 2018, with an estimated 1,190,000 electricity transfers being made in Q1 2018. Since Q1 2017, gas transfers have increased by 5.5 per cent to 975,000 transfers in Q1 2018. These transfers represent around 4.2 per cent for both electricity and gas customers in the domestic market.
Industrial Between Q1 2017 and Q1 2018, average industrial prices in real terms, including the
Climate Change Levy (CCL), rose by 5.4 per cent for gas, by 6.4 per cent for electricity and by 26 per cent for coal. Industrial prices for heavy fuel oil (not subject to CCL) fell by 6.4 per cent.
Between Q1 2017 and Q1 2018, the price of gas used for electricity generation increased by 7.7 per cent in cash terms whilst that for coal decreased by 4.2 per cent.
Oil and petroleum product prices The price of petrol in mid-June 2018 was 127.9 pence per litre which was 11 per cent
higher than that of a year ago, whilst diesel at 132.0 pence per litre was 12 per cent higher compared to a year ago. The petrol price in mid-June 2018 was 14 pence (9.7 per cent) lower than the peak in April 2012 whilst the diesel price was around 16 pence (11 per cent) lower.
The price of crude oil purchased by UK refineries in May 2018 was 50 per cent higher than that a year ago. The price in May 2018 at around $76 per barrel was 6.9 per cent higher than the previous month though remained considerably below the prices seen in

6
the period between February 2011 and August 2014 when prices were above $100 per barrel.
International In May 2018 the UK price for petrol at the pump was the fifth lowest in the EU15 at 124.7
pence per litre, whilst the UK price for diesel was the third highest in the EU15 at 128.3 pence per litre.
For July to December 2017, UK industrial electricity prices for medium consumers including taxes were the third highest in the EU15, whilst industrial gas prices for medium consumers including taxes were the lowest in the EU15.
For July to December 2017, UK domestic electricity prices for medium consumers including taxes were the sixth lowest in the EU15, whilst domestic gas prices for medium consumers including taxes were the second lowest in the EU15.
Non-Domestic Prices
7
Section 2 – Domestic Prices
Highlights
The price paid for all domestic fuels in real terms has risen by 4.8 per cent in the year to Q1 2018. Between Q1 2017 and Q1 2018, real terms prices including VAT for domestic electricity increased by 9.5 per cent but domestic gas prices fell slightly by 0.7 per cent.
Based on standard consumptions of 3,800kWh per year for electricity and 15,000kWh per year for gas, the average standard electricity bill in 2017, across all payment types has increased by £33 (5.7 per cent) since 2016, from £586 to £619. However, the average 2017 gas bill across all payment types has decreased by £20 (3.1 per cent), from £650 to £630. This has resulted in average combined bills increasing by £13.
However, for actual annual consumption levels, the average bill fell by £35 (3.1%) in cash terms to £1,112 in 2017. This was due to the £13 rise in bills being more than offset by a fall in average consumption.
The average combined bill for prepayment fell by £84, from £1,334 in 2016 to £1,250 in 2017, making credit the most expensive method of payment at £1,363. Direct debit is still the cheapest method of payment, with a combined bill of £1,209, £41 cheaper than prepayment.
The number of transfers made within the domestic electricity market decreased by 3.3 per cent between Q1 2017 and Q1 2018, with an estimated 1,190,000 electricity transfers being made in Q1 2018. Since Q1 2017, gas transfers have increased by 5.5 per cent to 975,000 transfers in Q1 2018. These transfers represent around 4.2 per cent for both electricity and gas customers in the domestic market.

Non-Domestic Prices
8
Retail price of fuels for the domestic sector
Chart 2.1 Real terms fuel price indices in the domestic sector(1) - quarterly
Source: ONS, Consumer prices index
(1) Data in real terms, adjusted for inflation using the GDP (market prices) deflator.
In terms of domestic fuel price indices, the price for all domestic fuels in real terms has risen by 4.8 per cent in Q1 2018 compared to Q1 2017. As shown in Chart 2.1, in real terms, domestic electricity increased by 9.5 per cent in Q1 2018 compared to the previous year while gas prices have remained broadly level since Q1 2017. Over this same period in real terms liquid fuels rose by 13 per cent but motor fuel and oil prices fell slightly by 0.3 per cent. The price of solid fuels increased slightly in real terms by 0.9 per cent between Q1 2017 and Q1 2018.
20
40
60
80
100
120
140
Q1 2016 Q2 2016 Q3 2016 Q4 2016 Q1 2017 Q2 2017 Q3 2017 Q4 2017 Q1 2018
Inde
x 20
10=
100
Gas
Electricity
Liquid fuels

Non-Domestic Prices
9
Chart 2.2 Real terms fuel price indices in the domestic sector(1) - annual
Source: ONS, Consumer prices index - (1)
Data in real terms, adjusted for inflation using the GDP (market prices) deflator.
Reference and link to tables:
Table 2.1.1: Consumer prices index: fuel components in the UK
Table 2.1.2: Consumer prices index: fuel components in the UK relative to GDP deflator
Table 2.1.3: Consumer prices index: fuel components, monthly figures
UK wholesale gas prices have been increasing since the early 2000’s, due to upward pressure on prices in Europe and the decline in the UK Continental Shelf gas production, however wholesale gas prices have fallen back since the start of 2014 but in 2017 prices rose by 31 per cent. Electricity prices have generally been on a rising trend. With gas an important part of the UK generation mix, and also as a result of higher coal prices, wholesale electricity prices have been rising from unsustainably low levels, and also due to the introduction of the EU Emissions Trading scheme in 2005.
Liquid fuel (heating oil) prices typically follow crude oil prices. Apart from a sharp fall in 2009, between 2003 and 2012 liquid fuel prices increased strongly in real terms. Since 2013 prices have fallen but more so between 2014 and 2016. In 2017, liquid fuel prices rose by 22 per cent in real terms. Motor fuel prices similarly follow crude oil prices, but vary according to changes in the duty payable on petrol and diesel, and to the rate of VAT.

Non-Domestic Prices
10
Domestic electricity and gas bills
BEIS estimates for bills are based on fixed annual consumption levels of 15,000kWh for gas and 3,800kWh for electricity, to allow comparisons over time of the effects of actual price changes, whilst excluding any change in consumption. Actual average domestic consumption of both gas and electricity varies from year to year due to changes in weather and energy efficiency improvements. From the March 2018 edition of Quarterly Energy Prices, BEIS had introduced bills based on actual annual consumption and temperature adjusted consumption. See Tables 2.2.5 and 2.3.51.
The majority of the major six domestic energy suppliers announced increases to their gas prices in early 2017. All of the major six domestic energy suppliers announced price rises for electricity customers between December 2016 and August 2017, with the majority of these announcements in February and March 2017. Overall, the average announced increase for electricity prices was around 14 per cent and 3 per cent for gas prices.
Table 1 – Change in average annual bills 2017 compared to 20162
2016 2017 Change Percentage Change
Standard Electricity £586 £619 £33 5.7%
Gas £650 £630 -£20 -3.1%
Combined £1,236 £1,249 £13 1.1%
The average energy bills in 2017 were higher than in 2016; this was mainly due to price increases for electricity implemented in mid-2017. Helping to offset increases in energy prices was the implementation of the Prepayment Cap3, which saw average annual bills for Prepayment customers fall by £84 from £1,334 in 2016 to £1,250 in 2017. Furthermore, the proportion of customers on a fixed tariff has increased between 2016 and 2017, with fixed tariffs offering the cheapest average energy bills compared to variable tariffs (a saving of around £200 – see Table 6). Chart 2.3 shows the average standard domestic energy bills, in cash terms. Combined gas and electricity bills have increased by £13 (1.1 per cent) between 2016 and 2017 (to £1,249). Average standard electricity bills in 2017 increased by £33 (to £619). Average gas bills decreased by £20 (to £630) compared with 2016, which has offset some of the rise in average electricity bills. With the exception of a 3.0 per cent fall in 2010, combined bills increased each year between 2002 and 2014. Between 2014 and 2016 combined bills have decreased, however in 2017 they have started to increase again and are now 7.1 per cent lower than their peak in 2014 in cash terms (11 per cent lower in real terms). The £12 electricity rebate received by customers in Great Britain in 2014 and 2015 was not provided in 2016 or 2017.
1 https://www.gov.uk/government/collections/domestic-energy-prices 2 Standard electricity and gas bills may not add up exactly to the combined bill as they have been calculated on non-
rounded figures 3 For more information on the Prepayment Cap, see: https://www.ofgem.gov.uk/gas/retail-market/market-review-and-reform/implementation-cma-remedies/prepayment-meter-
price-cap

Non-Domestic Prices
11
Chart 2.3 Average standard electricity and gas bills
Reference and link to tables:
Table 2.2.1: Average annual domestic electricity bills, by home and non-home supplier
Table 2.3.1: Average annual domestic gas bills, by home and non-home supplier
619
630
£0
£200
£400
£600
£800
£1,000
£1,200
£1,400
2007 2008 2009 2010 2011 2012 2013 2014 2015 2016 2017
Co
mb
ined
ave
rag
e b
ill (
£s)
Gas
StandardElectricity

Non-Domestic Prices
12
Domestic energy bills based on actual consumption
From March 2018 onwards, BEIS will be publishing bills based on actual and temperature adjusted consumption alongside BEIS estimates of 3,800kWh for electricity and 15,000kWh for gas. These adjusted figures include actual consumption and temperature adjusted consumption. More detailed tables can be found in Tables 2.2.5 and 2.3.5.
Table 2 – Change in average bills based on average actual consumption in 2017 compared to 20164
2016 2017 Change Percentage Change
Standard Electricity £555 £565 £10 1.9%
Gas £593 £547 -£46 -7.8%
Combined £1,148 £1,112 -£36 3.1%
Table 3 – Change in average bills based on temperature adjusted in consumption 2017 compared to 20165
2016 2017 Change Percentage Change
Standard Electricity £559 £574 £15 2.7%
Gas £616 £594 -£22 -3.6%
Combined £1,175 £1,168 -£7 -0.6%
Average bills based on actual consumption fell by £36 (3.1%) in cash terms to £1,112 in 2017. The fall in average electricity and gas consumption between 2016 and 2017 contributes around £49 to this fall, comprising of £23 for electricity and £26 for gas. Furthermore, the reduction in gas prices contributes a further £19 to this fall. However, the rise in electricity prices averaged an additional £33 per household, which offset some of the impact of the reduction in consumption and in gas prices.
4 Standard electricity and gas bills may not add up exactly to the combined bill as they have been calculated on non-
rounded figures 5 Standard electricity and gas bills may not add up exactly to the combined bill as they have been calculated on non-
rounded figures
Non-Domestic Prices
13
Payment methods
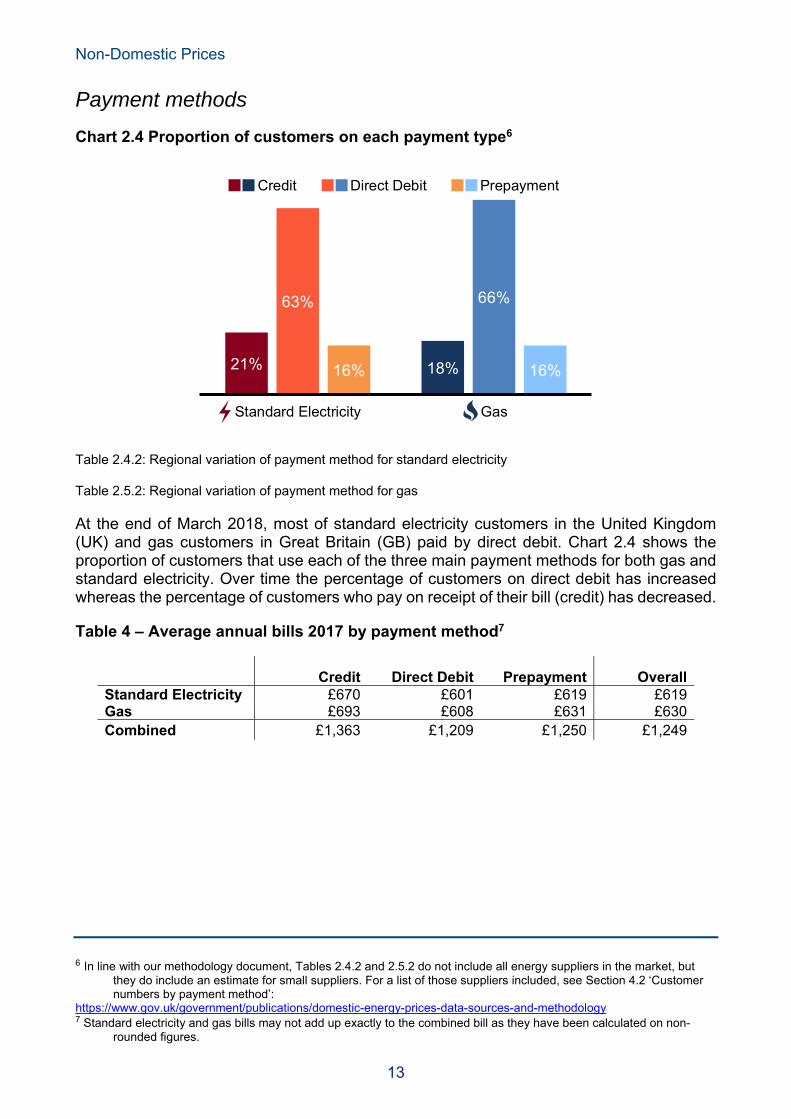
Chart 2.4 Proportion of customers on each payment type6
Table 2.4.2: Regional variation of payment method for standard electricity
Table 2.5.2: Regional variation of payment method for gas
At the end of March 2018, most of standard electricity customers in the United Kingdom (UK) and gas customers in Great Britain (GB) paid by direct debit. Chart 2.4 shows the proportion of customers that use each of the three main payment methods for both gas and standard electricity. Over time the percentage of customers on direct debit has increased whereas the percentage of customers who pay on receipt of their bill (credit) has decreased.
Table 4 – Average annual bills 2017 by payment method7
Credit Direct Debit Prepayment OverallStandard Electricity £670 £601 £619 £619Gas £693 £608 £631 £630Combined £1,363 £1,209 £1,250 £1,249
6 In line with our methodology document, Tables 2.4.2 and 2.5.2 do not include all energy suppliers in the market, but
they do include an estimate for small suppliers. For a list of those suppliers included, see Section 4.2 ‘Customer numbers by payment method’:
https://www.gov.uk/government/publications/domestic-energy-prices-data-sources-and-methodology 7 Standard electricity and gas bills may not add up exactly to the combined bill as they have been calculated on non-
rounded figures.
21% 18%
63% 66%
16% 16%
Standard Electricity Gas
Credit Direct Debit Prepayment

Non-Domestic Prices
14
Chart 2.5 Average annual bills on each payment type, 2017
Reference and link to tables:
Table 2.2.1: Average annual domestic electricity bills, by home and non-home supplier
Table 2.3.1: Average annual domestic gas bills, by home and non-home supplier
In 2017 the average annual bill8 was cheapest for customers paying by direct debit, with an average bill of £601 for standard electricity customers in the UK and £608 for gas customers in GB, as shown in Chart 2.5. Combined bills, based on BEIS consumption levels, were around £154 cheaper on direct debit compared to those on credit, but only around £41 cheaper than prepayment.
8 Based on a fixed consumption of 15,000kWh for gas and 3,800kWh for electricity
£670 £693£601 £608£619 £631
Standard Electricity Gas
Credit Direct Debit Prepayment

Non-Domestic Prices
15
Regional variation of payment methods - Electricity
Chart 2.6 Regional payment methods for Standard electricity
Reference and link to tables:
Table 2.4.2: Regional variation of payment method for standard electricity
The proportion of customers by the different payment methods varies by region. In Q1 2018, for standard electricity, direct debit was the most popular payment method in all regions. Northern Ireland, however, has a broadly similar proportion of customers who pay by prepayment, 38 per cent, as who pay by direct debit, 45 per cent. As Chart 2.6 shows, the Southern region has the highest proportion of customers paying by direct debit, at 71 per cent. The London region has the highest percentage of credit customers, with 31 per cent using this payment method and just 49 per cent using direct debit, which was the second lowest rate in the UK.
0%
10%
20%
30%
40%
50%
60%
70%
80%
90%
100%
Pe
rce
nta
ge
(%
) Prepayment
Credit
Direct debit
Non-Domestic Prices
16
Regional variation of payment methods - Gas
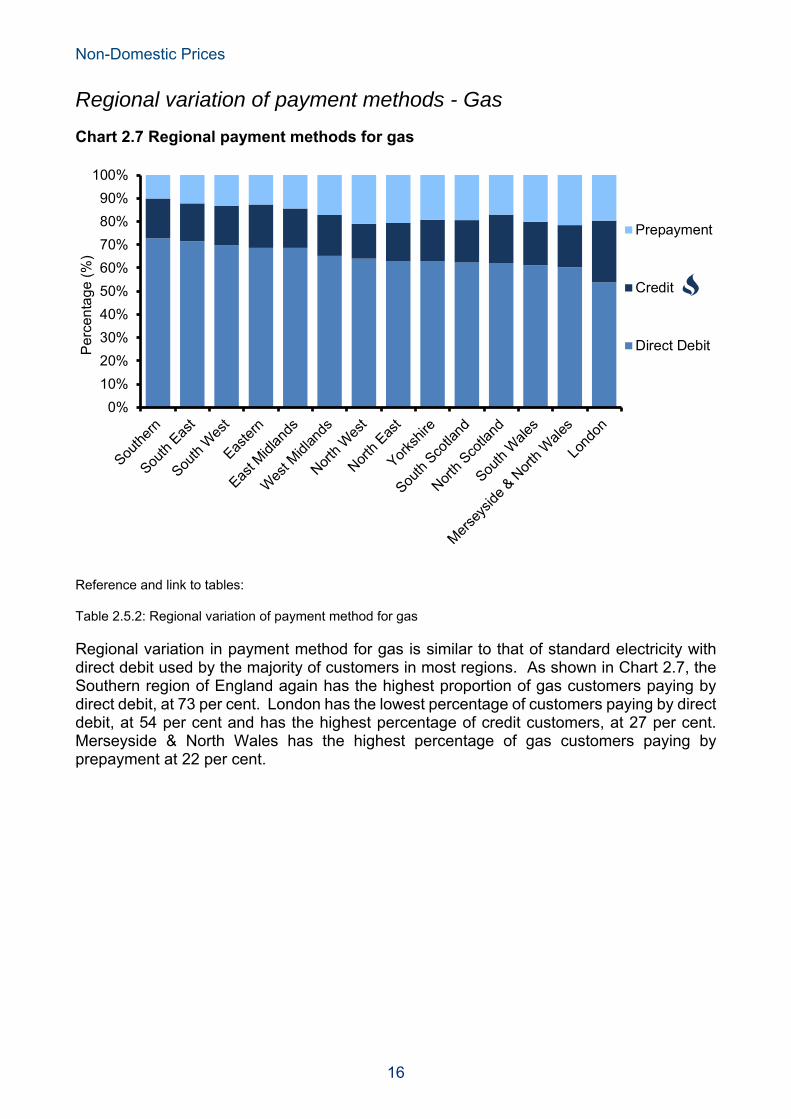
Chart 2.7 Regional payment methods for gas
Reference and link to tables:
Table 2.5.2: Regional variation of payment method for gas
Regional variation in payment method for gas is similar to that of standard electricity with direct debit used by the majority of customers in most regions. As shown in Chart 2.7, the Southern region of England again has the highest proportion of gas customers paying by direct debit, at 73 per cent. London has the lowest percentage of customers paying by direct debit, at 54 per cent and has the highest percentage of credit customers, at 27 per cent. Merseyside & North Wales has the highest percentage of gas customers paying by prepayment at 22 per cent.
0%
10%
20%
30%
40%
50%
60%
70%
80%
90%
100%
Pe
rce
nta
ge
(%
)
Prepayment
Credit
Direct Debit

Non-Domestic Prices
17
Domestic energy competition
Chart 2.8 Proportion of customers with their original home supplier for electricity and gas in GB
Reference and link to tables:
Table 2.4.1: Percentage of domestic electricity customers by region by supplier type
Table 2.5.1: Percentage of domestic gas customers by region by supplier type
Prior to the privatisation of the GB energy market, all energy customers were supplied by their regional electricity and gas boards. With privatisation these boards became the commercial home suppliers for each region to which all customers in that region belonged before the market opened up to competition. The first trial in competitive gas supply started in April 1996 in South West England, with all customers able to choose their gas supplier by May 1998. Competition in domestic electricity supply began on 14 September 1998 with 750,000 consumers in four areas, and was gradually extended to all consumers in Great Britain by 24 May 1999. In Northern Ireland the market is now open to competition, after being monopolistic for many years, although two suppliers still currently supply the vast majority of the market. Gas is still not yet widely available in Northern Ireland, although the number of customers with access to the gas grid is increasing.
At the end of March 2018, BEIS estimates that 18.2 million (71 per cent) domestic electricity9 customers and 16.3 million (70 per cent) domestic gas customers in Great Britain10 had transferred away from their original home supplier, the firm who had supplied that region before the energy market opened to competition (see chart 2.8).
9 Includes both standard electricity and Economy 7 electricity. 10 Competition is still limited in scope for domestic customers in Northern Ireland, and so this country has been excluded
from this analysis.
29% 30%
71% 70%
Electricity Gas
Home Non-Home

Non-Domestic Prices
18
Chart 2.9 Average annual Standard Electricity and Gas bills for home and non-home suppliers in GB, 2017
Reference and link to tables:
Table 2.2.1: Average annual domestic electricity bills, by home and non-home supplier
Table 2.3.1: Average annual domestic gas bills, by home and non-home supplier
As can be seen in Table 5, the average annual bill based on fixed consumption11 for gas and standard electricity is lower for customers with non-home suppliers, with the average bill for customers with home suppliers around £84 more expensive. As seen in Chart 2.9, of this £84, standard electricity contributes around £45 of the difference between home and non-home suppliers, with gas contributing around £39.
11 15,000kWh for gas and 3,800kWh for electricity
£652 £656£607 £617
Standard Electricity Gas
Home Non-Home

Non-Domestic Prices
19
Variation in energy competition between payment methods
Table 5 – Average annual bills by payment method and supplier type for 201712
Link to tables:
Table 2.2.1: Average annual domestic electricity bills, by home and non-home supplier
Table 2.3.1: Average annual domestic gas bills, by home and non-home supplier
For electricity, prepayment customers were most likely to have switched supplier, with 75 per cent of electricity customers and 68 per cent of gas customers no longer with their home supplier. Credit customers were the least likely to have switched, with 63 per cent of electricity customers and 56 per cent of gas customers supplied by a non-home supplier. To note, these figures account for BEIS’ estimate for small suppliers in the market.
Average annual bills are generally cheaper for customers with a non-home supplier compared to those with their original home suppliers. With both types of suppliers combined, direct debit was the cheapest payment method. A detailed breakdown of the average annual bills for gas and standard electricity for each payment method split by home and non-home supplier for 2017 is shown in the table below. Tables 2.2.1 and 2.3.1 in the annex contain data going back to 1996.
12 Standard electricity and gas bills may not add up exactly to the combined bill as they have been calculated on non-
rounded figures.
Credit Direct Debit Prepayment Overall
Home Non-
Home Home Non-
Home Home Non-
Home Home Non-
Home Standard Electricity £697 £654 £635 £590 £626 £616 £652 £607Gas £695 £692 £641 £595 £639 £628 £656 £617Total £1,392 £1,346 £1,276 £1,185 £1,265 £1,244 £1,308 £1,224

Non-Domestic Prices
20
Regional competition - Electricity
Chart 2.10 Proportion of electricity customers with a non-home supplier
Reference and link to tables:
Table 2.4.1: Percentage of domestic electricity customers by region by supplier type
Since the March 2017 edition of QEP, BEIS has published adjusted figures for regional proportions with a non-home supplier. This is to account for the fact that BEIS’ survey coverage is primarily of larger energy suppliers with a home region, so in the past have underestimated the proportion of customers who had moved away from their home supplier. Since March 2018, breakdowns by payment type are also adjusted to account for the smaller energy companies, which is a result of surveying a larger proportion of the energy market.
Overall, at the end of March 2018, customers in North Scotland were the least likely to have moved, with around 63 per cent still with their home supplier, whereas customers in the West Midlands were most likely to have moved with only around 20 per cent with their home supplier (see Chart 2.10).
0
10
20
30
40
50
60
70
80
90
Pe
rce
nta
ge
(%
)
Regionalaverage
GB average

Non-Domestic Prices
21
Regional competition - Gas
Chart 2.11 Proportion of gas customers with a non-home supplier
Reference and link to tables:
Table 2.5.1: Percentage of domestic gas customers by region by supplier type
As with electricity, Chart 2.11 and Tables 2.5 contain estimated data for small suppliers.
At the end of March 2018, customers in London and Merseyside & North Wales region were the least likely to have moved gas supplier, with around 39 per cent still with their home supplier, whereas customers in South Wales and the North East were the most likely to have moved with only around 25 per cent remaining with their home supplier.
0
10
20
30
40
50
60
70
80
Pe
rce
nta
ge
(%
)
Regionalaverage
GB average
Non-Domestic Prices
22
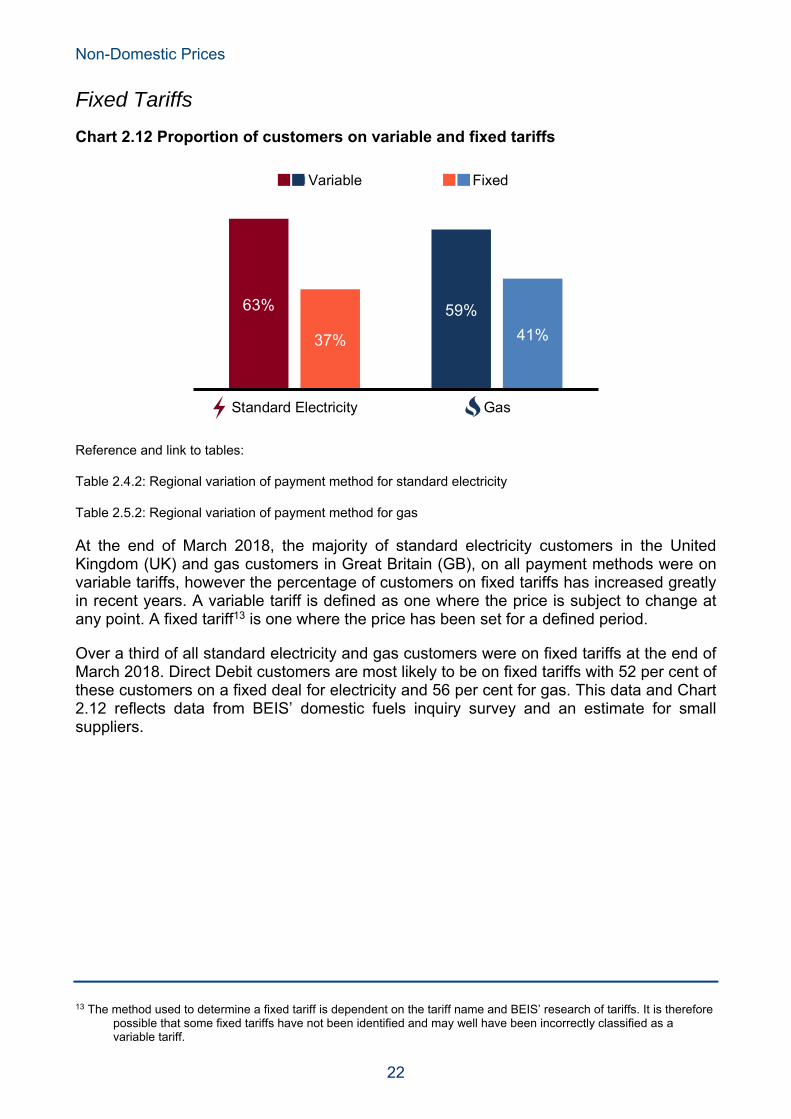
Fixed Tariffs
Chart 2.12 Proportion of customers on variable and fixed tariffs
Reference and link to tables:
Table 2.4.2: Regional variation of payment method for standard electricity
Table 2.5.2: Regional variation of payment method for gas
At the end of March 2018, the majority of standard electricity customers in the United Kingdom (UK) and gas customers in Great Britain (GB), on all payment methods were on variable tariffs, however the percentage of customers on fixed tariffs has increased greatly in recent years. A variable tariff is defined as one where the price is subject to change at any point. A fixed tariff13 is one where the price has been set for a defined period.
Over a third of all standard electricity and gas customers were on fixed tariffs at the end of March 2018. Direct Debit customers are most likely to be on fixed tariffs with 52 per cent of these customers on a fixed deal for electricity and 56 per cent for gas. This data and Chart 2.12 reflects data from BEIS’ domestic fuels inquiry survey and an estimate for small suppliers.
13 The method used to determine a fixed tariff is dependent on the tariff name and BEIS’ research of tariffs. It is therefore
possible that some fixed tariffs have not been identified and may well have been incorrectly classified as a variable tariff.
63% 59%
37% 41%
Standard Electricity Gas
Variable Fixed
Non-Domestic Prices
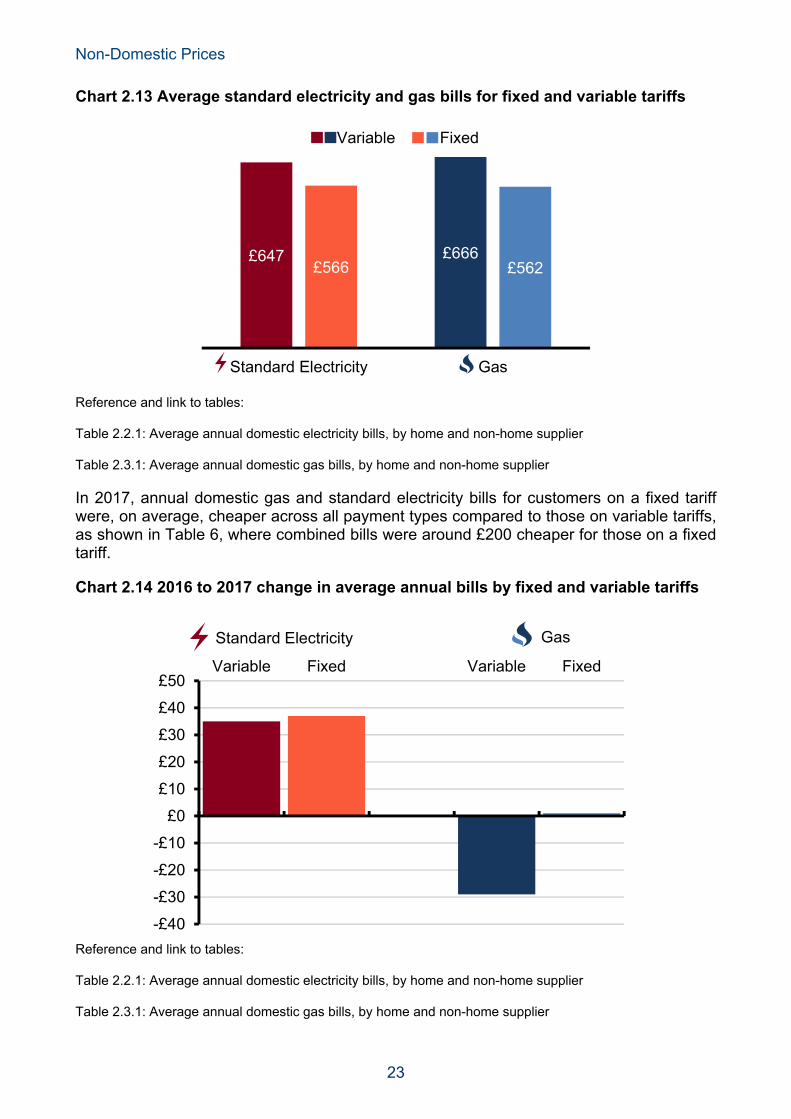
23
Chart 2.13 Average standard electricity and gas bills for fixed and variable tariffs
Reference and link to tables:
Table 2.2.1: Average annual domestic electricity bills, by home and non-home supplier
Table 2.3.1: Average annual domestic gas bills, by home and non-home supplier
In 2017, annual domestic gas and standard electricity bills for customers on a fixed tariff were, on average, cheaper across all payment types compared to those on variable tariffs, as shown in Table 6, where combined bills were around £200 cheaper for those on a fixed tariff.
Chart 2.14 2016 to 2017 change in average annual bills by fixed and variable tariffs
Reference and link to tables:
Table 2.2.1: Average annual domestic electricity bills, by home and non-home supplier
Table 2.3.1: Average annual domestic gas bills, by home and non-home supplier
£647 £666£566 £562
Standard Electricity Gas
Variable Fixed
-£40
-£30
-£20
-£10
£0
£10
£20
£30
£40
£50Variable Fixed Variable Fixed
Standard Electricity Gas

Non-Domestic Prices
24
Between 2016 and 2017, standard electricity bills increased by a similar margin of £35 and £37 for variable and fixed tariffs respectively, whereas gas bills remained static for fixed tariffs, and decreased for variable tariffs by £29.
Variation in tariff type between payment methods
Table 6 – Average annual bills by payment method and tariff type14
Direct debit customers were far more likely to be on a fixed tariff than customers paying by other methods, with 51 per cent of standard electricity and gas customers on a fixed tariff. Credit customers were the second most likely to have switched, with 17 per cent and 20 per cent of standard electricity and gas customers having switched. Prepayment customers were the least likely to be on a fixed tariff, with only 4 per cent of standard electricity and gas customers on a fixed tariff. As can be seen in Table 6, average fixed tariff bills were cheaper than variable tariff bills across all payment types. The difference was greatest when paying by direct debit, with fixed tariff bills being £82 and £110 lower for standard electricity and gas, respectively. Equivalent savings for customers paying by credit were £65 and £61 for standard electricity and gas respectively. The difference between fixed and variable tariff bills was lower for those paying by prepayment for electricity (by £25) but more expensive for gas (by £3). BEIS data suggest that for variable tariffs, prepayment customers are paying around £51 less than direct debit customers in 2017, compared to prepayment customers on variable tariffs paying around £69 more than direct debit customers in 2016.
14 Standard electricity and gas bills may not add up exactly to the combined bill as they have been calculated on non-
rounded figures.
Credit Direct Debit Prepayment Overall Variable Fixed Variable Fixed Variable Fixed Variable Fixed Standard Electricity £680 £615 £641 £559 £620 £595 £647 £566Gas £704 £643 £661 £551 £631 £634 £666 £562Total £1,384 £1,258 £1,302 £1,100 £1,251 £1,229 £1,313 £1,128

Non-Domestic Prices
25
Regional variation of fixed tariff proportions – Electricity
Chart 2.15 Proportion of standard electricity customers on a fixed tariff15
Reference and link to tables:
Table 2.4.2: Regional variation of payment method for standard electricity
The proportion of customers on fixed tariffs, across all payment types, varies by region. The North East had the highest proportion of customers on fixed tariffs at 42 per cent. London had the lowest proportion of customers on fixed tariffs across all regions in Great Britain at 25 per cent.
15 Northern Ireland has been excluded from this analysis as BEIS survey coverage of the region is not as
comprehensive, and so the figures were potentially unrepresentative.
0
10
20
30
40
50
Pe
rce
nta
ge
(%
)
Regionalaverage
GB average
Non-Domestic Prices
26
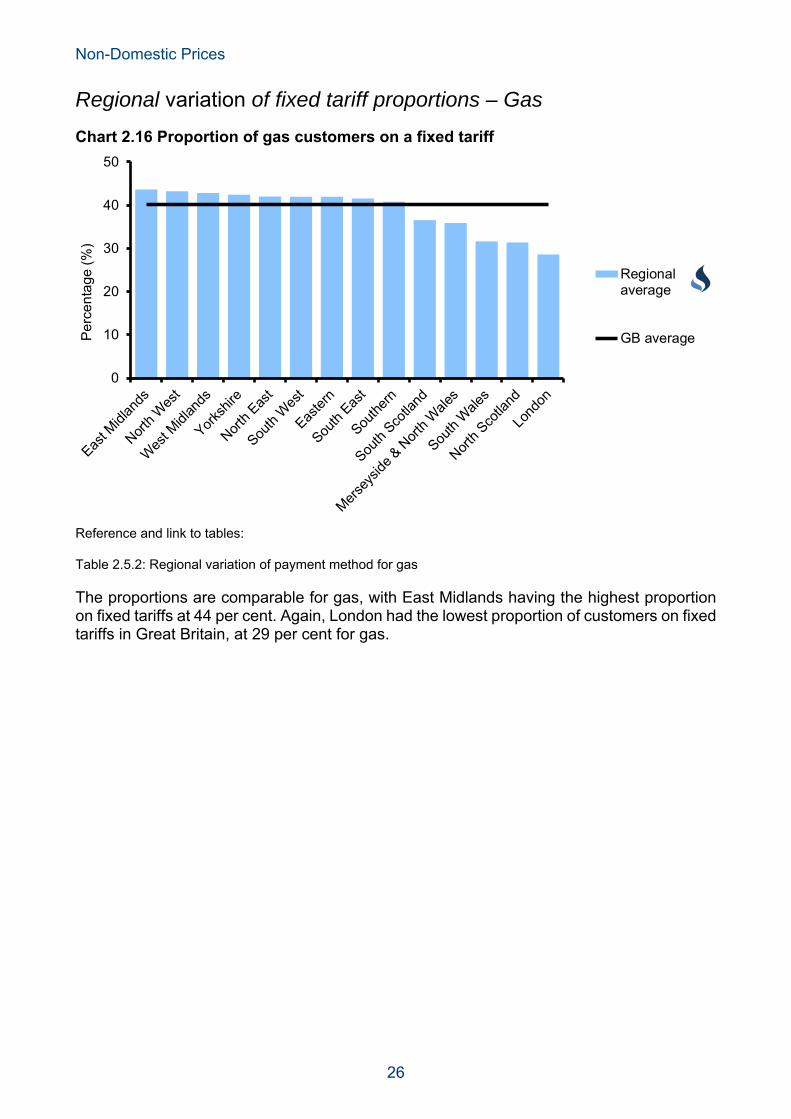
Regional variation of fixed tariff proportions – Gas
Chart 2.16 Proportion of gas customers on a fixed tariff
Reference and link to tables:
Table 2.5.2: Regional variation of payment method for gas
The proportions are comparable for gas, with East Midlands having the highest proportion on fixed tariffs at 44 per cent. Again, London had the lowest proportion of customers on fixed tariffs in Great Britain, at 29 per cent for gas.
0
10
20
30
40
50
Pe
rce
nta
ge (
%)
Regionalaverage
GB average
Non-Domestic Prices
27
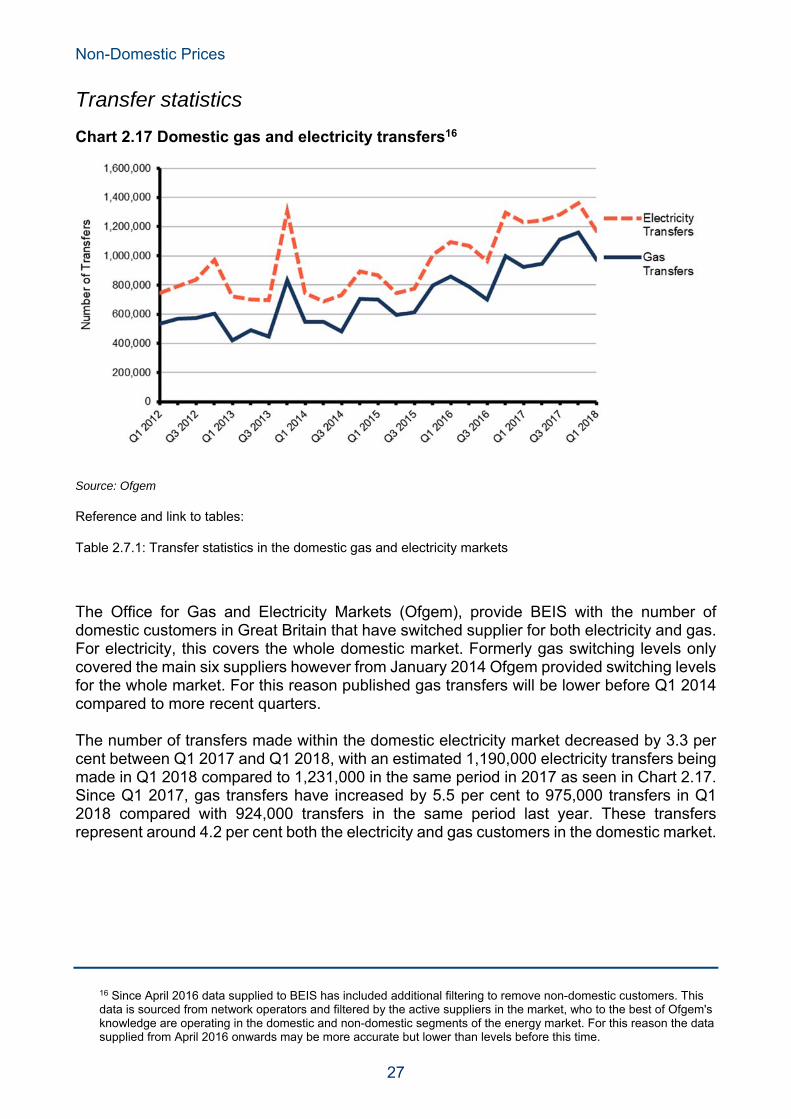
Transfer statistics
Chart 2.17 Domestic gas and electricity transfers16
Source: Ofgem
Reference and link to tables:
Table 2.7.1: Transfer statistics in the domestic gas and electricity markets
The Office for Gas and Electricity Markets (Ofgem), provide BEIS with the number of domestic customers in Great Britain that have switched supplier for both electricity and gas. For electricity, this covers the whole domestic market. Formerly gas switching levels only covered the main six suppliers however from January 2014 Ofgem provided switching levels for the whole market. For this reason published gas transfers will be lower before Q1 2014 compared to more recent quarters. The number of transfers made within the domestic electricity market decreased by 3.3 per cent between Q1 2017 and Q1 2018, with an estimated 1,190,000 electricity transfers being made in Q1 2018 compared to 1,231,000 in the same period in 2017 as seen in Chart 2.17. Since Q1 2017, gas transfers have increased by 5.5 per cent to 975,000 transfers in Q1 2018 compared with 924,000 transfers in the same period last year. These transfers represent around 4.2 per cent both the electricity and gas customers in the domestic market.
16 Since April 2016 data supplied to BEIS has included additional filtering to remove non-domestic customers. This data is sourced from network operators and filtered by the active suppliers in the market, who to the best of Ofgem's knowledge are operating in the domestic and non-domestic segments of the energy market. For this reason the data supplied from April 2016 onwards may be more accurate but lower than levels before this time.

Non-Domestic Prices
28
Expenditure on energy
In 2017, the total expenditure on energy increased by 5.0 per cent. This increase was mainly due to the increase in expenditure on electricity following the price increases seen in 2017. Around half of energy expenditure, is accounted for by spending on vehicle fuels and lubricants as seen in chart 18 below.
Chart 18: Energy expenditure by fuel type
Source: ONS, Consumer trends
Reference and link to tables:
Table 2.6.1: Total household expenditure on energy
The proportion of total expenditure spent on energy is higher for those in the lower income deciles. This can be seen in chart 19 below. Almost 9 per cent of expenditure was spent on energy for the lowest income decile compared to just 2.6 per cent for those in the highest income decile.

Non-Domestic Prices
29
Chart 19: Proportion of expenditure spent on fuel and power by income decile
This trend continues for other household costs such as food and housing. Expenditure on petrol and oil however shows that the highest income deciles spent more compared to those on the lowest income deciles.
Proportion of total expenditure spent on each area by income decile, 2016/17
Reference and link to tables:
Table 2.6.2: Average expenditure each week on fuel per consuming household
Per cent1st 2nd 3rd 4th 5th 6th 7th 8th 9th 10th Average
Fuel and power 8.6 7.5 6.0 5.0 4.3 4.0 3.5 3.4 3.0 2.6 4.0Housing 18.9 19.4 19.1 17.2 18.7 17.9 18.1 16.2 16.2 16.4 17.3Food 16.7 17.1 17.5 16.5 15.6 15.7 15.5 15.3 15.3 13.1 15.3Petrol and oil 2.6 3.1 3.4 3.6 4.0 4.1 4.0 4.3 4.0 3.3 3.7

Non-Domestic Prices
30
Section 3 – Non-domestic Prices
Highlights
Between Q1 2017 and Q1 2018, average industrial prices in real terms, including the Climate Change Levy (CCL), rose by 5.4 per cent for gas, by 26 per cent for coal and by 6.4 per cent for electricity. Industrial prices for heavy fuel oil (not subject to CCL) fell by 6.4 per cent.
Between Q1 2017 and Q1 2018, the price of gas used for electricity generation increased by 7.7 per cent in cash terms while that for coal decreased by 4.1 per cent.
Notes
Prices presented in this section vary depending on the sectoral coverage (e.g. manufacturing industry, all industry, or non-domestic consumers) and consumption levels. Prices of fuels may move to different degrees, or even in different directions, depending on the sectors and/or consumption size bands being compared. Changes in prices may also vary depending on the time period used, i.e. changes in annual average prices may be different to changes in prices between quarters a year apart.
Additionally, average prices in tables 3.1.1 to 3.1.4, which cover the manufacturing industry, tend to be weighted more towards the prices paid by large consumers, whereas in tables 3.4.1 and 3.4.2, which cover all non-domestic consumers, average prices tend to be weighted more towards smaller consumers. Larger consumers may be more dependent on wholesale spot prices, and therefore more vulnerable to price spikes, whereas smaller consumers tend to be on more stable contracts. These factors help to explain the differences between prices.
The price indices in table 3.3.1 aim to be reflective of all industrial users.
Non-Domestic Prices
31
Energy prices in the manufacturing sector
Prices of fuels for the manufacturing sector, excluding CCL, for various size bands of consumers are presented in tables 3.1.1 to 3.1.4. These prices tend to vary by consumption, reflecting the bargaining position of the larger users and factors such as length of contracts and the relative impact of crude oil prices on fuel prices.
Prices of most fuels broadly follow the prices of crude oil which, aside from a significant fall in 2009, was on an upward trend between 2002 and 2012. Prices of crude oil have since been on the decline with a sharp fall in 2015 compared to 2014 of 47 per cent. In 2016, prices fell by a further 16 per cent on the previous year to around 44 $/barrel but with OPEC agreement in 2017 to reduce supply till the end of March 2018, crude oil prices rose by 23 per cent in 2017.
On a quarterly basis crude oil prices in Q1 2016 were at their lowest in cash terms since Q1 2004 but in Q4 2016 prices rose by 16 per cent on a year earlier and by 9.3 per cent on the previous quarter as OPEC announced cuts to supply in November 2016. Crude oil prices rose by 7.9 per cent on the previous quarter in Q1 2017 but fell by 7.1 per cent in Q2 2017. However in Q3 2017 prices rose by 3.0 per cent on the previous quarter and were 13 per cent higher than a year ago. In Q4 2017 the message from OPEC and a Russia led group of oil producers to extend production cut till the end of 2018, in addition to an outage of the Forties Pipeline System, saw prices of crude oil increase by 19 per cent on the previous quarter. In Q1 2018 crude oil prices rose for the third consecutive quarter by a further 9.1 per cent to $67, marking the highest level seen since Q4 2014, and were 24 per cent higher compared to the same period in the previous year.
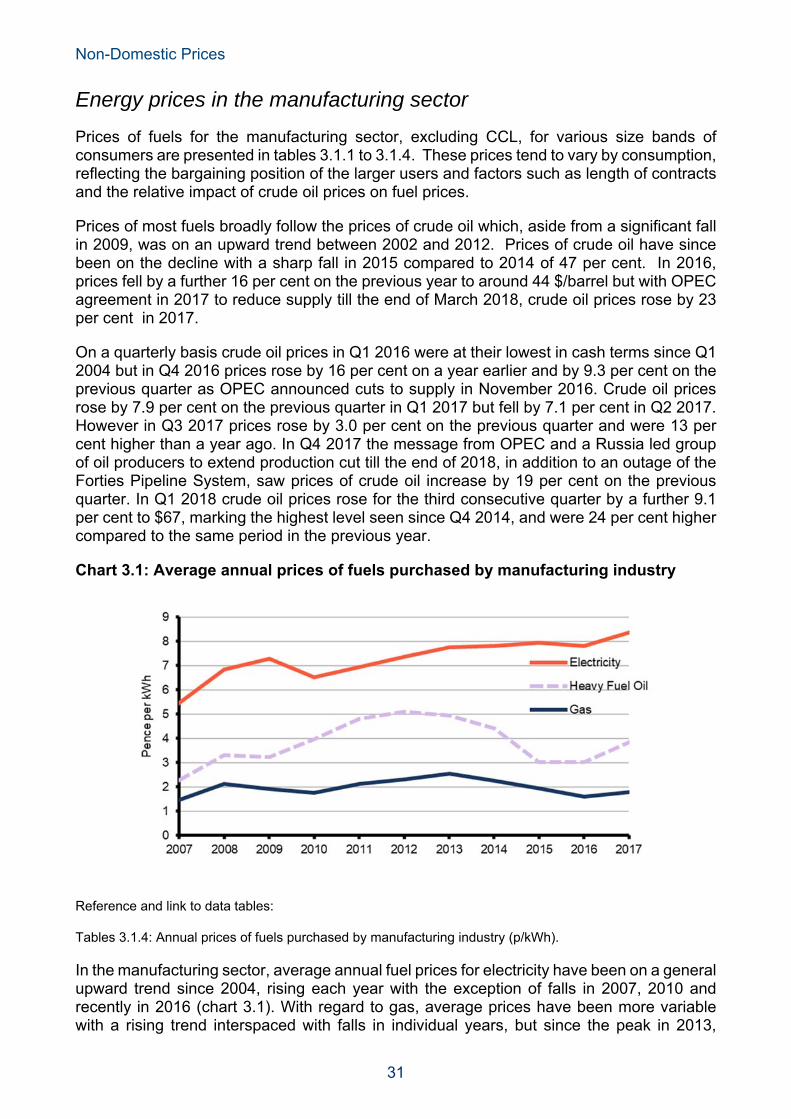
Chart 3.1: Average annual prices of fuels purchased by manufacturing industry
Reference and link to data tables:
Tables 3.1.4: Annual prices of fuels purchased by manufacturing industry (p/kWh).
In the manufacturing sector, average annual fuel prices for electricity have been on a general upward trend since 2004, rising each year with the exception of falls in 2007, 2010 and recently in 2016 (chart 3.1). With regard to gas, average prices have been more variable with a rising trend interspaced with falls in individual years, but since the peak in 2013,

Non-Domestic Prices
32
average gas prices have fallen by 30 per cent. For heavy fuel oil and gas oil, with the exception of 2009, prices increased each year between 2005 and 2012. Since then, prices for both fuels have decreased with stronger falls in 2015. In 2017, there was a 26 per cent increase in the average heavy fuel oil prices and an 18 per cent increase in the average gas oil prices. Coal prices increased each year between 2004 and 2013 with the exceptions of 2006 and 2009, but since the peak in 2013 coal prices have declined and in 2017 were 19 per cent lower than this peak.
Data for 2017 show that over the past five years (2012 to 2017) average industrial electricity prices have risen by 14 per cent (5.0 per cent in real terms) and compared to the previous year average industrial electricity prices have increased by 7.0 per cent (4.8 per cent in real terms). Over the same five-year period average industrial gas prices have decreased by 23 per cent (29 per cent in real terms) but increased by 11 per cent (9.1 per cent in real terms) over the previous year.
Chart 3.2 Manufacturing industry price movements by size of consumer(1)
(1) Percentage price movement between Q1 2017 and Q1 2018 for heavy fuel oil (HFO), electricity and gas, in cash terms excluding Climate Change Levy (CCL)
References and links to data tables:
Table 3.1.1: Quarterly prices of fuels purchased by manufacturing industry (original units) Table 3.1.2: Quarterly prices of fuels purchased by manufacturing industry (p/kWh) Table 3.1.3: Annual prices of fuels purchased by manufacturing industry (original units) Table 3.1.4: Annual prices of fuels purchased by manufacturing industry (p/kWh) Recent price movements by size band are shown in Chart 3.2. Compared to the previous year, heavy fuel oil consumers in the manufacturing industry in Q1 2018 have seen prices decrease by an average of 5.1 per cent in cash terms. Over the same period, prices paid by electricity consumers, in cash terms excluding CCL, rose by an average of 5.6 per cent. Gas
Non-Domestic Prices
33
consumers have seen prices, in cash terms excluding CCL, increase by an average of 6.5 per cent.
Average prices of fuels purchased by the major UK power producers
Average purchase costs of fuels used to generate electricity are presented in table 3.2.1. Generation costs are also affected by non-fuel costs such as transportation costs, and by the efficiency with which fuel is converted into electricity in different types of power station. Therefore comparing the fuel input costs in common units does not necessarily explain the full costs involved.
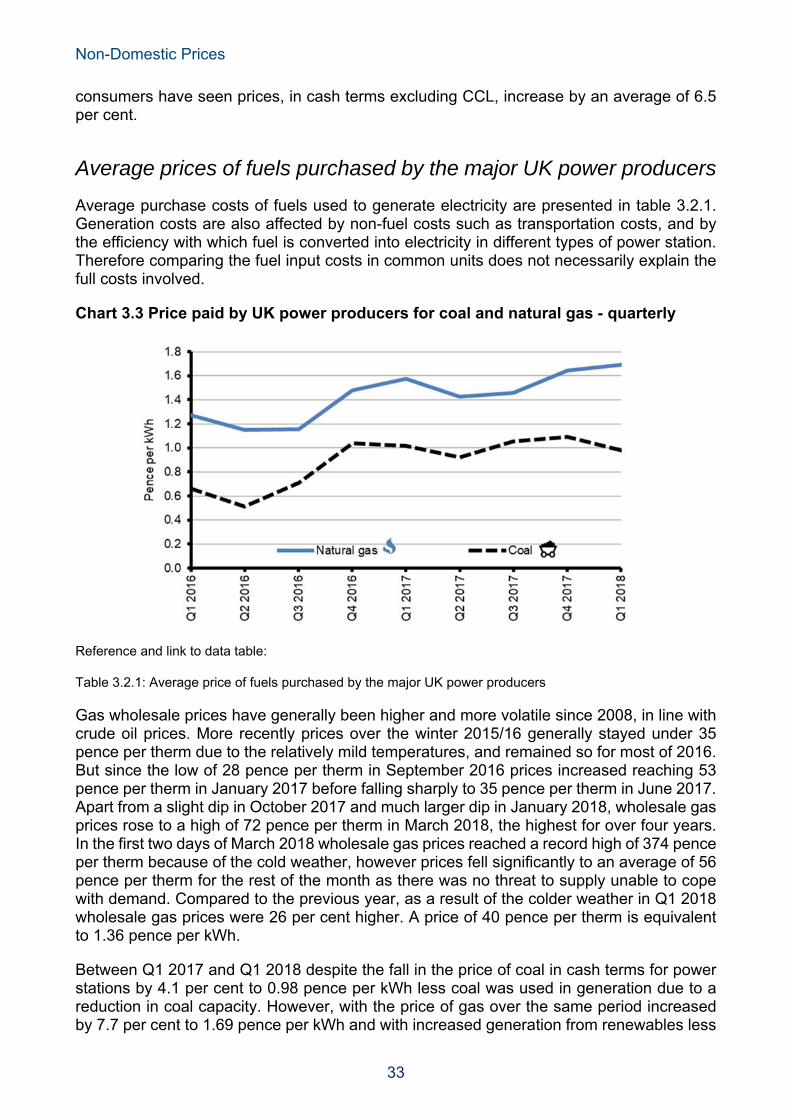
Chart 3.3 Price paid by UK power producers for coal and natural gas - quarterly
Reference and link to data table:
Table 3.2.1: Average price of fuels purchased by the major UK power producers
Gas wholesale prices have generally been higher and more volatile since 2008, in line with crude oil prices. More recently prices over the winter 2015/16 generally stayed under 35 pence per therm due to the relatively mild temperatures, and remained so for most of 2016. But since the low of 28 pence per therm in September 2016 prices increased reaching 53 pence per therm in January 2017 before falling sharply to 35 pence per therm in June 2017. Apart from a slight dip in October 2017 and much larger dip in January 2018, wholesale gas prices rose to a high of 72 pence per therm in March 2018, the highest for over four years. In the first two days of March 2018 wholesale gas prices reached a record high of 374 pence per therm because of the cold weather, however prices fell significantly to an average of 56 pence per therm for the rest of the month as there was no threat to supply unable to cope with demand. Compared to the previous year, as a result of the colder weather in Q1 2018 wholesale gas prices were 26 per cent higher. A price of 40 pence per therm is equivalent to 1.36 pence per kWh.
Between Q1 2017 and Q1 2018 despite the fall in the price of coal in cash terms for power stations by 4.1 per cent to 0.98 pence per kWh less coal was used in generation due to a reduction in coal capacity. However, with the price of gas over the same period increased by 7.7 per cent to 1.69 pence per kWh and with increased generation from renewables less
Non-Domestic Prices
34
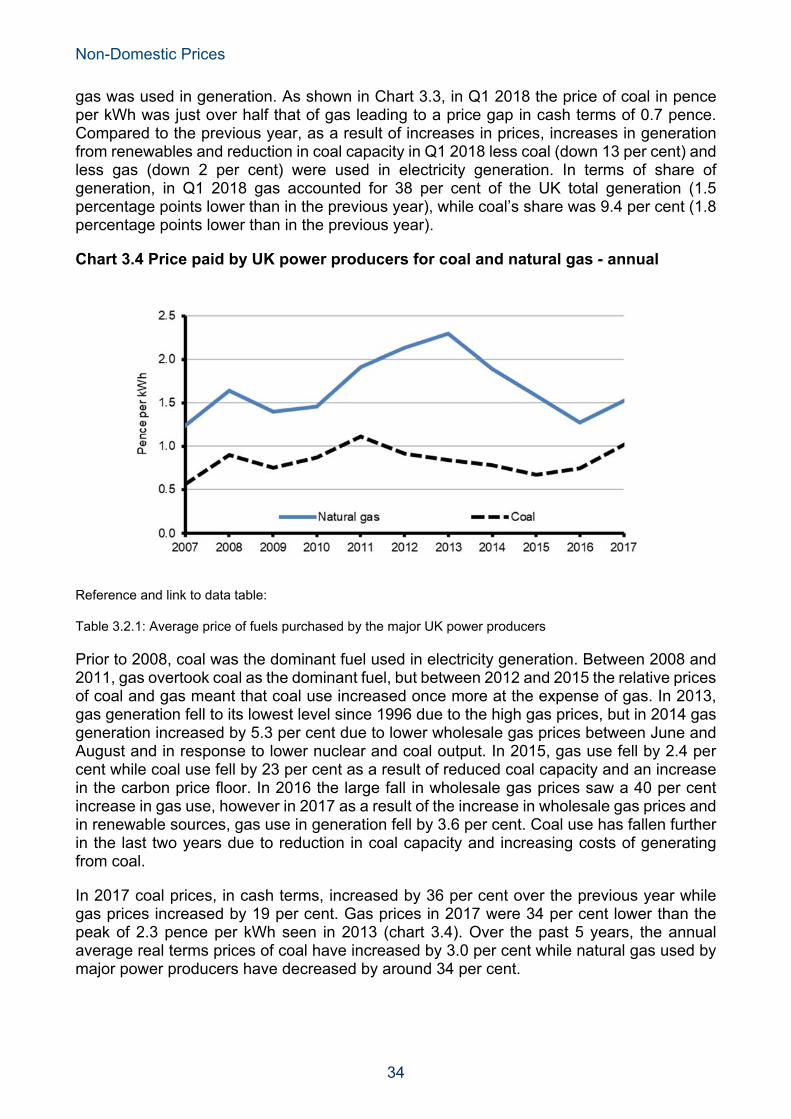
gas was used in generation. As shown in Chart 3.3, in Q1 2018 the price of coal in pence per kWh was just over half that of gas leading to a price gap in cash terms of 0.7 pence. Compared to the previous year, as a result of increases in prices, increases in generation from renewables and reduction in coal capacity in Q1 2018 less coal (down 13 per cent) and less gas (down 2 per cent) were used in electricity generation. In terms of share of generation, in Q1 2018 gas accounted for 38 per cent of the UK total generation (1.5 percentage points lower than in the previous year), while coal’s share was 9.4 per cent (1.8 percentage points lower than in the previous year).
Chart 3.4 Price paid by UK power producers for coal and natural gas - annual
Reference and link to data table:
Table 3.2.1: Average price of fuels purchased by the major UK power producers
Prior to 2008, coal was the dominant fuel used in electricity generation. Between 2008 and 2011, gas overtook coal as the dominant fuel, but between 2012 and 2015 the relative prices of coal and gas meant that coal use increased once more at the expense of gas. In 2013, gas generation fell to its lowest level since 1996 due to the high gas prices, but in 2014 gas generation increased by 5.3 per cent due to lower wholesale gas prices between June and August and in response to lower nuclear and coal output. In 2015, gas use fell by 2.4 per cent while coal use fell by 23 per cent as a result of reduced coal capacity and an increase in the carbon price floor. In 2016 the large fall in wholesale gas prices saw a 40 per cent increase in gas use, however in 2017 as a result of the increase in wholesale gas prices and in renewable sources, gas use in generation fell by 3.6 per cent. Coal use has fallen further in the last two years due to reduction in coal capacity and increasing costs of generating from coal.
In 2017 coal prices, in cash terms, increased by 36 per cent over the previous year while gas prices increased by 19 per cent. Gas prices in 2017 were 34 per cent lower than the peak of 2.3 pence per kWh seen in 2013 (chart 3.4). Over the past 5 years, the annual average real terms prices of coal have increased by 3.0 per cent while natural gas used by major power producers have decreased by around 34 per cent.
Non-Domestic Prices
35
Fuel price indices for the industrial sector
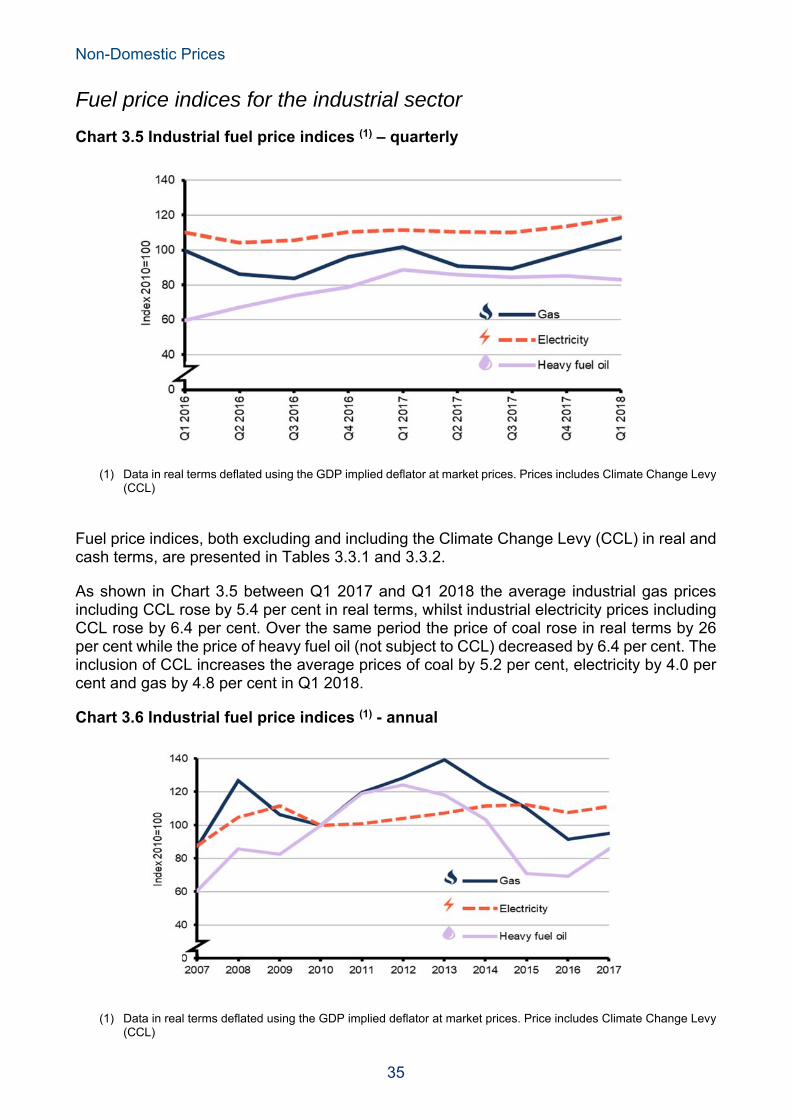
Chart 3.5 Industrial fuel price indices (1) – quarterly
(1) Data in real terms deflated using the GDP implied deflator at market prices. Prices includes Climate Change Levy (CCL)
Fuel price indices, both excluding and including the Climate Change Levy (CCL) in real and cash terms, are presented in Tables 3.3.1 and 3.3.2.
As shown in Chart 3.5 between Q1 2017 and Q1 2018 the average industrial gas prices including CCL rose by 5.4 per cent in real terms, whilst industrial electricity prices including CCL rose by 6.4 per cent. Over the same period the price of coal rose in real terms by 26 per cent while the price of heavy fuel oil (not subject to CCL) decreased by 6.4 per cent. The inclusion of CCL increases the average prices of coal by 5.2 per cent, electricity by 4.0 per cent and gas by 4.8 per cent in Q1 2018.
Chart 3.6 Industrial fuel price indices (1) - annual
(1) Data in real terms deflated using the GDP implied deflator at market prices. Price includes Climate Change Levy (CCL)
Non-Domestic Prices
36
References and links to data tables:
Table 3.3.1 and 3.3.2: Fuel price indices for the industrial sector
Prices in real terms (including CCL) for all fuels generally stayed below the 1990 levels until 2005. Between 2003 and 2013, total fuel prices followed an upward trend, with some of the largest annual increases occurring between 2005 and 2008. In most recent years, prices have been on the decline but in 2017 total fuel prices in real terms (including CCL) were 5.9 per cent higher than in the previous year, though they were 9.9 per cent below the peak in 2013.
The average price of heavy fuel oil over the five years to 2017 decreased by 31 per cent in real terms but has increased by 24 per cent compared to the previous year. The annual average price of gas, including CCL, fell by 26 per cent in real terms over the past five years, but increased by 4.0 per cent on the previous year. However, the average price of electricity, including CCL, has risen by 6.8 per cent in real terms over the past five years, and by 3.5 per cent on the previous year.
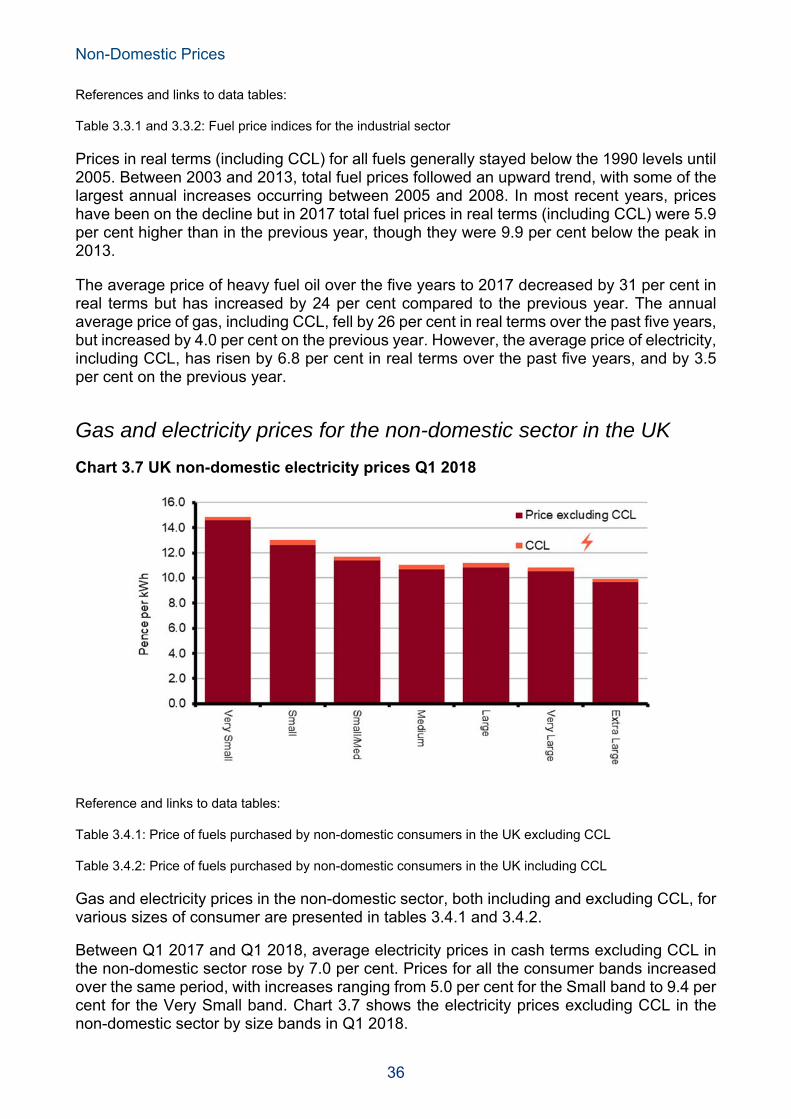
Gas and electricity prices for the non-domestic sector in the UK
Chart 3.7 UK non-domestic electricity prices Q1 2018
Reference and links to data tables:
Table 3.4.1: Price of fuels purchased by non-domestic consumers in the UK excluding CCL
Table 3.4.2: Price of fuels purchased by non-domestic consumers in the UK including CCL
Gas and electricity prices in the non-domestic sector, both including and excluding CCL, for various sizes of consumer are presented in tables 3.4.1 and 3.4.2.
Between Q1 2017 and Q1 2018, average electricity prices in cash terms excluding CCL in the non-domestic sector rose by 7.0 per cent. Prices for all the consumer bands increased over the same period, with increases ranging from 5.0 per cent for the Small band to 9.4 per cent for the Very Small band. Chart 3.7 shows the electricity prices excluding CCL in the non-domestic sector by size bands in Q1 2018.
Non-Domestic Prices
37
Average electricity prices, including CCL, increased every quarter from the second quarter of 2004 until the fourth quarter of 2008, with the exception of the second quarter of 2007. Prices then decreased until the third quarter of 2011 but have since been on a general upward trend. In Q1 2018 the average prices of electricity, including CCL was 6.4 per cent higher than in the previous year. The inclusion of CCL increased the average price of electricity by 3.2 per cent and by 1.6 per cent to 8.3 per cent for the various bands.
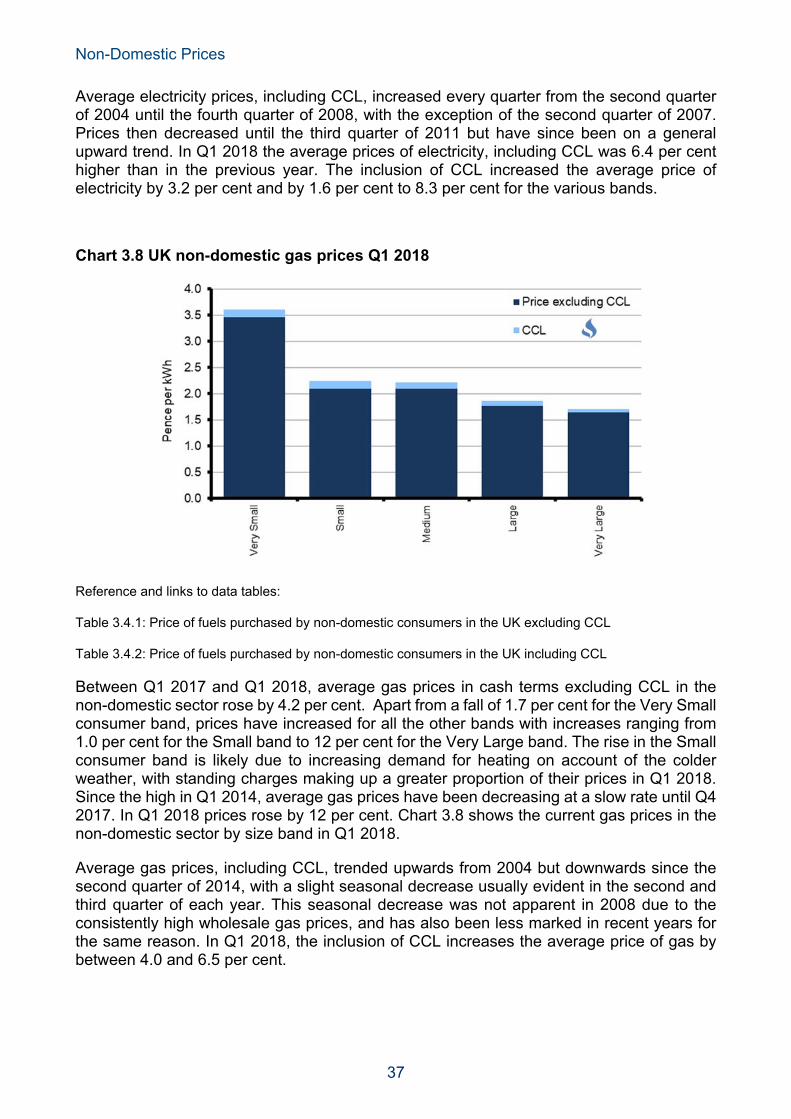
Chart 3.8 UK non-domestic gas prices Q1 2018
Reference and links to data tables:
Table 3.4.1: Price of fuels purchased by non-domestic consumers in the UK excluding CCL
Table 3.4.2: Price of fuels purchased by non-domestic consumers in the UK including CCL
Between Q1 2017 and Q1 2018, average gas prices in cash terms excluding CCL in the non-domestic sector rose by 4.2 per cent. Apart from a fall of 1.7 per cent for the Very Small consumer band, prices have increased for all the other bands with increases ranging from 1.0 per cent for the Small band to 12 per cent for the Very Large band. The rise in the Small consumer band is likely due to increasing demand for heating on account of the colder weather, with standing charges making up a greater proportion of their prices in Q1 2018. Since the high in Q1 2014, average gas prices have been decreasing at a slow rate until Q4 2017. In Q1 2018 prices rose by 12 per cent. Chart 3.8 shows the current gas prices in the non-domestic sector by size band in Q1 2018.
Average gas prices, including CCL, trended upwards from 2004 but downwards since the second quarter of 2014, with a slight seasonal decrease usually evident in the second and third quarter of each year. This seasonal decrease was not apparent in 2008 due to the consistently high wholesale gas prices, and has also been less marked in recent years for the same reason. In Q1 2018, the inclusion of CCL increases the average price of gas by between 4.0 and 6.5 per cent.

Oil and Petroleum product prices
38
Section 4 – Oil and Petroleum Product Prices
Highlights
The price of petrol in June 2018 was 127.9 pence per litre which was 11 per cent higher than that of a year ago, whilst diesel at 132.0 pence per litre was 12 per cent higher compared to a year ago. Prices for both unleaded and diesel in June 2018 were the highest for over three years. The petrol price in June 2018 was around 14 pence (9.7 per cent) lower than the peak in April 2012, whilst the diesel price was 16 pence (11 per cent) lower.
The price of crude oil purchased by UK refineries in May 2018 was 50 per cent higher than a year ago and 60 per cent higher than the low seen in June 2017.
Retail prices of petroleum products
Chart 4.1 Retail prices of motor spirits - Monthly
Reference and link to data table:
Table 4.1.1: Typical monthly retail prices of petroleum products and a crude oil index
Prices of petroleum products, including road fuels, are presented in Tables 4.1.1 to 4.1.3. Prices of unleaded petrol (ULSP) and diesel (ULSD) reached new highs in April 2012, mainly due to the cost of crude oil. Relative to those peaks, the petrol price in June 2018 was 14 pence lower whilst the diesel price was 16 pence lower. Prices of petroleum products are also affected by duty rate changes, as listed in Annex C, and by changes in the general rate of VAT.

Oil and Petroleum product prices
39
Chart 4.1 shows that, in June 2018, a litre of ULSP was on average 127.9 pence; which was 3.3 pence per litre higher than the previous month and 12.4 pence per litre (11 per cent) higher than a year ago. The diesel price was 132.0 pence per litre which was 3.7 pence per litre higher than the previous month, and 14.4 pence per litre (12 per cent) higher than a year ago. Prices for both unleaded and diesel in June 2018 were the highest for over three years.
Chart 4.2 Retail prices of motor spirits - annual
Reference and link to data table:
Table 4.1.2: Average annual retail price of petroleum products and a crude oil index
Annual 2017 prices of ULSP and ULSD were lower than the record highs of 2012 by 13 per cent and 15 per cent respectively, as shown in Chart 4.2. The differential between ULSP and ULSD in 2017 was 2.6 pence per litre, a rise of 1.3 pence per litre on 2016. Motor fuel prices increased at a steady rate from the Gulf crisis in 1990/91 to 2000, mainly as a result of duty changes. Since 2000, prices have followed oil prices, increasing strongly in 2008, falling back in 2009, and then increasing strongly once more in 2010 and 2011 before broadly levelling off in 2012 and 2013. Prices fell in 2014 and more sharply in 2015 though less so in 2016 but in 2017 prices rose along with the prices of crude acquired at refineries.

Oil and Petroleum product prices
40
Chart 4.3 Component price of unleaded petrol, June 2018
(1) Basic price is the price excluding VAT and duty
Reference and link to data table:
Table 4.1.1: Typical monthly retail prices of petroleum products and a crude oil index
Relative to the peak in April 2012, the price of unleaded petrol, excluding tax and duty, in June 2018 is 19 per cent lower and the price of diesel, excluding tax and duty, is 20 per cent lower. Chart 4.3 shows the components of the retail price of petrol in June 2018 when the basic price was 48.65 pence per litre, duty at 57.95 pence per litre, and VAT at 20 per cent (21.32 pence per litre). Chart 4.4 Retail prices of heating oil (1)
(1) Heating oil is standard grade burning oil (SGBO)
References and link to data tables:
Table 4.1.1: Typical monthly retail prices of petroleum products and a crude oil index

Oil and Petroleum product prices
41
Comparisons on how the UK petrol and diesel prices fare with the other European countries can be found in chapter 5.
Retail prices of heating oil such as standard grade burning oil (SGBO), and gas oil are more directly influenced by the price of crude oil rather than other petroleum products due to lower rates of duty and VAT.
The price of SGBO in May 2018 was 23 per cent lower than the peak in February 2013. The price of gas oil in May 2018 was 19 per cent lower than in April 2012, which was the highest level on record which started in 1989. In May 2018 the price of SGBO was 13 per cent higher than a year ago (Chart 4.4) similarly, as with gas oil.
Crude oil prices
Movements in the price of crude oil affect the prices of various domestic and industrial fuels, as well as petroleum products. A price index for crude oil is available in Tables 4.1.1 and 4.1.2 for comparison against the prices of petroleum products. Over the years, prices of crude oil have changed for a variety of reasons, such as: oil shortages (1973); over-supply and weak demand (1998); hurricanes (2005); the global recession (2008-9); and geopolitical tensions (2008 onwards). Since the low in January 2016 of $32 per barrel, oil prices rose to $48 in the first six months of 2016 before levelling off at around $46 per barrel over the next five months to November. At their 171th meeting in Vienna on the 30th November 2016, OPEC agreed to reduce output by 1.8m barrels per day (bpd) to 32.5m bpd from January 2017 for at least six months with the expectation that non-OPEC members would reduce their production by 0.6m bpd. As a result of this announcement oil prices jumped to over $50 per barrel and remained so till May 2017. At meetings in 2017, OPEC and other oil producers agreed an extension of their supply cuts. Prices dipped to $47 per barrel in June 2017 but have since been on the increase reaching $77 in May 2018. The recent increases in prices have been driven by geopolitical tensions, threats of new sanctions on Iran by the US and a decline in Venezuela's production. At their meeting on 22nd June 2018 (174th) in Vienna OPEC and non-OPEC countries agreed to increase production cut by a recommended 1m bpd.

Oil and Petroleum product prices
42
Chart 4.5 Index (1) of crude oil prices
(1) The index represents the average price paid by refineries for the month and is calculated in sterling on a cost, insurance, freight (cif) basis, see Annex A.
Reference and link to data table: Table 4.1.1: Typical monthly retail prices of petroleum products and a crude oil index
Chart 4.5 shows the price index of crude oil acquired by UK refineries. In May 2018 the price was 43 per cent higher than that of a year ago but 30 per cent below that in March 2012, which was the highest level since our record began in 1991. The annual price index for 2017 was 29 per cent higher than 2016 and 40 per cent lower than the high of 2012. Over the past five years (May 2013 to May 2018) the average index price of crude oil acquired by refineries has decreased by around 17 per cent.
43
Section 5 – International Comparisons
Highlights
In May 2018 the UK price for petrol at the pump was the fifth lowest in the EU15 at 124.7 pence per litre, whilst the UK price for diesel was the third highest in the EU15 at 128.3 pence per litre.
For July to December 2017, UK industrial electricity prices for medium consumers including taxes were the third highest in the EU15, whilst industrial gas prices for medium consumers including taxes were the lowest in the EU15.
For July to December 2017, UK domestic electricity prices for medium consumers including taxes were the sixth lowest in the EU15, whilst domestic gas prices for medium consumers including taxes were the second lowest in the EU15.
Notes
International prices vary for many reasons including differences in indigenous resources and market structures, varying exchange rates and inflation rates (for instance, the pound depreciated against the euro by around 3.7 per cent between the second half of 2016 and the second half of 2017).

44
Unleaded petrol and Diesel prices
Premium unleaded petrol prices
Chart 5.1 Premium unleaded petrol prices, May 2018
Source: European Commission Oil Bulletin
Reference and link to tables:
Table 5.1.1: Premium unleaded petrol prices in the EU
Chart 5.1 shows that the average UK unleaded petrol prices, including taxes, in May 2018 were the fifth lowest in the EU15 at 124.7 pence per litre when presented in a common currency basis. The lowest price was in Luxembourg at 111.0 pence per litre while the highest price was in the Netherlands at 146.9 pence per litre.
Average UK petrol prices, excluding taxes, in May 2018 were the lowest within the EU15 at 45.9 pence per litre. The highest price in the EU15 was in Denmark at 61.4 pence per litre.

45
Diesel prices
Chart 5.2 Diesel prices, May 2018
Source: European Commission Oil
Reference and link to tables:
Table 5.2.1: Diesel prices in the EU
Chart 5.2 shows that average UK diesel prices, including taxes, in May 2018 were the third highest within the EU15 at 128.3 pence per litre when presented in a common currency basis. The lowest price was in Luxembourg at 97.9 pence per litre, while the highest price was in the Sweden at 134.1 pence per litre.
The high UK diesel price is partly due to the taxes levied, which accounted for 62 per cent of the total price in May 2018, compared to the lowest tax proportion of 45 per cent in Luxembourg. Average UK diesel prices, excluding taxes, in May 2018 were the lowest in the EU15 at 49.0 pence per litre. The highest price was that in Sweden at 68.1 pence per litre.
Luxembourg
Spain
Austria
Germany
Ireland
Portugal
Finland
Netherlands
Greece
Denmark
Belgium
France
UK
Italy
Sweden
0 20 40 60 80 100 120 140Pence (p/litre)

46
Industrial gas and electricity prices
The methodology for estimating the UK excluding tax prices within the Eurostat15 tables has changed. Under the new methodology, since 2015 together with the climate change levy (CCL), other environmental taxes and social levies are also excluded from the including taxes and levies prices. These methodology changes apply to both industrial and domestic gas and electricity prices.
Prices for gas and electricity in this section will vary depending on the periodicity (6-monthly or annual) and consumption (by band size or an overall average) of the tables. In general, the 6-monthly Eurostat EU 28 tables have more timely data and reflect changes on a shorter timescale; however, for comparisons including non-EU countries the annual IEA tables are more suitable.
Rankings may differ between the IEA and Eurostat tables. The charts (shown in colour) include actual data available at the time of publication. The black line on the charts represents the EU15 median which is produced using the data from all available countries.
Industrial electricity prices
Chart 5.3 Industrial electricity prices
Prices are for medium consumers in the EU15 for July - December 2017. Medium consumers are defined as having an annual consumption of 2,000 - 19,999 MWh per annum. Source: Eurostat Statistics in Focus Electricity prices for EU Industry, July - December 2017. 15 Eurostat website: http://ec.europa.eu/eurostat/data/database
Sweden
Finland
Luxembourg
France
Netherlands
Austria
Spain
Belgium
Denmark
Greece
Ireland
Portugal
UKGermany
Italy
0 2 4 6 8 10 12
Pence per kWh
47
Average UK industrial electricity prices including taxes for medium consumers for the period July to December 2017 were third highest in the EU15 and were 30 per cent above the EU15 median of 8.1 pence per kWh. The UK price for medium consumers excluding taxes and levies was the highest in the EU15 and was 41 per cent above the estimated median price of 5.8 pence per kWh. Chart 5.3 shows the prices for the EU15 nations for the period July to December 2017.
The average industrial electricity price including taxes for medium consumers rose in all EU15 countries on the same period in 2016 except in Belgium and Italy, where prices fell by 3.5 per cent and 4.2 per cent respectively. The average increase in the EU15 was 5.0 per cent. The largest increase was in Luxembourg by 26 per cent. The price increase in the UK was 4.4 per cent. Reference and link to tables: Table 5.4.1: Average industrial electricity prices in the EU In 2017, average UK industrial electricity prices, including taxes, were the sixth highest in the IEA, fourth highest in the G7, and was 28 per cent above the IEA median price. UK industrial electricity prices were 82 per cent higher than in the US. The UK price increased by 2.2 per cent between 2016 and 2017. Reference and link to tables:
Table 5.3.1: Industrial electricity prices in the IEA including and excluding taxes
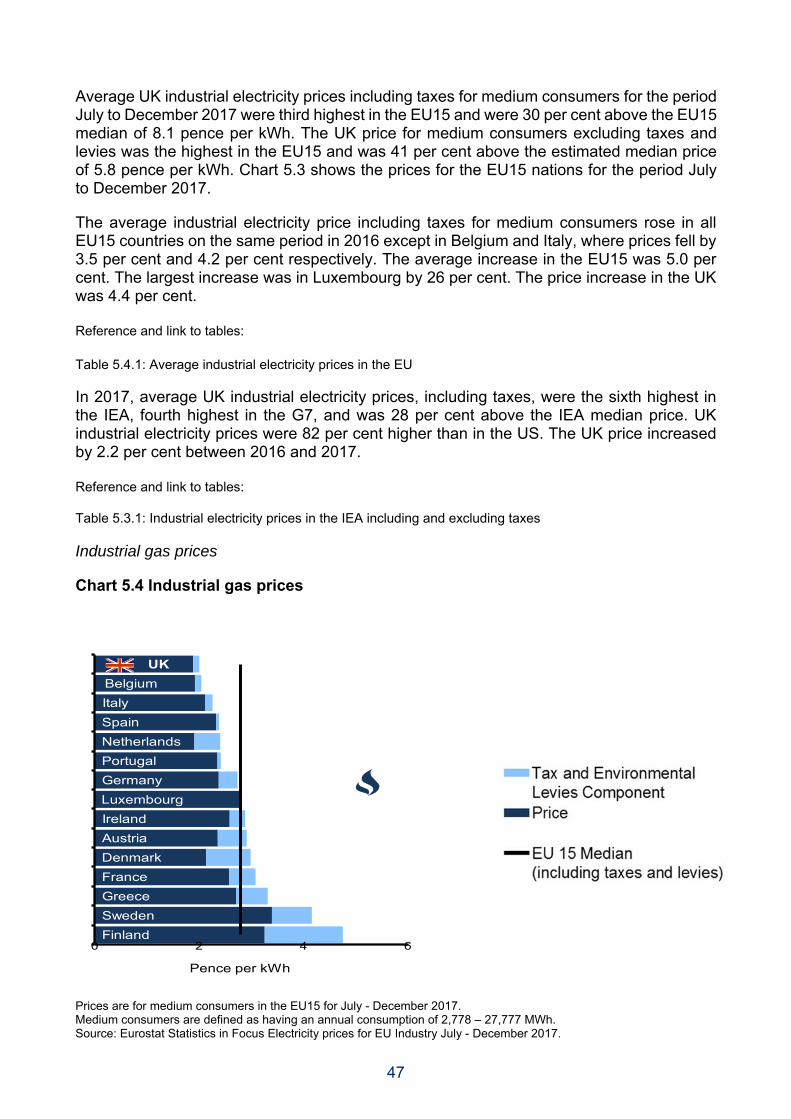
Industrial gas prices
Chart 5.4 Industrial gas prices
Prices are for medium consumers in the EU15 for July - December 2017. Medium consumers are defined as having an annual consumption of 2,778 – 27,777 MWh. Source: Eurostat Statistics in Focus Electricity prices for EU Industry July - December 2017.
UK
Belgium
Italy
Spain
Netherlands
Portugal
Germany
Luxembourg
Ireland
Austria
Denmark
France
Greece
Sweden
Finland0 2 4 6
Pence per kWh

48
Average UK industrial gas prices for the period July to December 2017, including taxes, for medium consumers were the lowest in the EU15 and were 29 per cent below the median price of 2.8 pence per kWh. The UK prices excluding taxes and levies for the medium consumers were 1.9 pence per kWh; which was 20 per cent below EU15 median. Chart 5.4 shows the prices for EU15 nations for the period July to December 2017.
The average industrial gas price including taxes in the UK for medium consumers fell by 6.5 per cent on the same period in 2016. Price changes in the rest of the EU ranged between -7.7 and +36.5 per cent.
Reference and link to tables:
Table 5.8.1: Average industrial gas prices in the EU
In 2017, average UK industrial gas prices, including taxes where not refunded, were the seventh lowest in the IEA, third lowest in the G7, and were 13 per cent below the IEA median. UK industrial gas prices were 84 per cent higher than in the US.
Reference and link to tables:
Table 5.7.1: Industrial gas prices in the IEA including and excluding taxes
Domestic electricity and gas prices
As with industrial prices, the methodology for calculating the domestic prices excluding VAT and charges has changed. Any levies relating to environmental costs are excluded from the prices along with the VAT.
Domestic electricity prices
The average UK domestic electricity price including taxes for medium consumers for July to December 2017 was the sixth lowest in the EU15 and was 6.9 per cent below the EU15 median price of 17.8 pence per kWh. The UK price excluding taxes and levies was the fifth highest in the EU15 and was 10 per cent above the median level of 10.9 pence per kWh. Chart 5.5 shows the prices for EU15 nations for the period July to December 2017.

49
Chart 5.5 Domestic electricity prices
Prices are for medium consumers in the EU15 for July - December 2017. Medium consumers are defined as having an annual consumption of 2,500 - 4,999 kWh per annum. Source: Eurostat Statistics in Focus Electricity prices for EU households, July - December 2017.
The average domestic electricity price including taxes in the UK for medium consumers has risen by 5.3 per cent for the period July 2017 to December 2017 compared to the same period in 2016, while the other EU15 countries had increases of between 1 and 9 per cent except for Greece, Italy, Luxembourg and Spain where prices decreased by a range of 1 per cent and 8 per cent.
Reference and link to tables:
Table 5.6.1: Average domestic electricity prices in the EU
In 2017, average UK domestic electricity prices, including taxes, were the thirteenth highest in the IEA, mid-ranked in the G7 and were 5.4 per cent higher than the IEA median. Compared to the USA, the UK domestic electricity prices were 57 per cent higher.
Reference and link to tables:
Table 5.5.1: Domestic electricity prices in the IEA including and excluding taxes.
Netherlands
Finland
Luxembourg
Greece
FranceUK
Austria
Sweden
Italy
Spain
Portugal
Ireland
Belgium
Denmark
Germany
0 5 10 15 20 25 30
Pence per kWh

50
Domestic gas prices
Average UK domestic gas prices for the period July to December 2017, including taxes, for medium consumers 2017 were the second lowest in the EU15 and were 31 per cent below the median of 6.2 pence per kWh. The UK price excluding taxes was the fifth lowest in the EU15 and was 15 per cent lower than the median price of 4.6 pence per kWh. Chart 5.6 shows the prices for EU15 nations where data is available for the period July to December 2017.
Chart 5.6 Domestic gas prices
Prices are for medium consumers in the EU15 for July - December 2017. Medium consumers are defined as having an annual consumption of 5,557 – 55,556 kWh per annum. Finland does not provide data to Eurostat for this series. Source: Eurostat Statistics in Focus Electricity prices for EU households, July - December 2017
The average domestic gas price including taxes in the UK for medium consumers fell by 0.7 per cent on the same period in 2016. Prices in the rest of the EU15 increased, with an average increase of 5.2 per cent in the EU15 overall except in Germany, Ireland and Luxembourg where prices all fell by around 1 per cent.
Reference and link to tables:
Table 5.10.1: Average domestic gas prices in the EU
Luxembourg
UK
Belgium
Germany
Greece
Ireland
France
Austria
Portugal
Netherlands
Spain
Italy
Denmark
Sweden
0 1 2 3 4 5 6 7 8 9 10 11 12Pence per kWh

51
In 2017, average UK domestic gas prices, including taxes where not refunded, were the eighth lowest in the IEA, third lowest in the G7, and were 27 per cent lower than the IEA median. Compared to the USA, the UK domestic gas prices were 33 per cent higher.
Reference and link to tables:
Table 5.9.1: Domestic gas prices in the EU15 and G7 countries including and excluding taxes
52
List of Charts
Chart 2.1 Fuel price indices in the domestic sector in real terms – quarterly Chart 2.2 Fuel price indices in the domestic sector in real terms – annual Chart 2.3 Average standard electricity and gas bills Chart 2.4 Proportion of customers on each payment type Chart 2.5 Average bills on each payment type Chart 2.6 Regional payment methods for standard electricity Chart 2.7 Regional payment methods for gas Chart 2.8 Proportion of customers with their original home supplier for electricity and gas in GB Chart 2.9 Average standard electricity and gas bills for home, non-home and all suppliers in GB Chart 2.10 Proportion of electricity customers with a non-home supplier Chart 2.11 Proportion of gas customers with a non-home supplier Chart 2.12 Proportion of customers on variable and fixed tariffs Chart 2.13 Average standard electricity and gas bills for fixed and variable tariffs Chart 2.14 Percentage change in average annual bills by fixed and variable tariffs Chart 2.15 Proportion of standard electricity customers on a fixed tariff Chart 2.16 Proportion of gas customers on a fixed tariff Chart 2.17 Domestic gas and electricity transfers Chart 2.18 Energy expenditure by fuel type Chart 2.19 Proportion of expenditure spent on fuel and power by income decile. Chart 3.1 Average annual prices of fuels purchased by manufacturing industry Chart 3.2 Manufacturing industry price movements by size of consumer Chart 3.3 Price paid by UK power producers for coal and natural gas - quarterly Chart 3.4 Price paid by UK power producers for coal and natural gas - annual Chart 3.5 Industrial fuel price indices – quarterly Chart 3.6 Industrial fuel price indices - annual Chart 3.7 UK non-domestic electricity prices Q3 2017 Chart 3.8 UK non-domestic gas prices Q3 2017 Chart 4.1 Retail prices of motor spirits - quarterly Chart 4.2 Retail prices of motor spirits - annual Chart 4.3 Component price of unleaded petrol, September 2017 Chart 4.4 Retail prices of heating oil Chart 4.5 Index of crude oil prices Chart 5.1 Premium unleaded petrol prices, August 2017 Chart 5.2 Diesel prices, August 2017 Chart 5.3 Industrial electricity prices Chart 5.4 Industrial gas prices Chart 5.5 Domestic electricity prices Chart 5.6 Domestic gas prices

© Crown copyright 2018 Department for Business, Energy & Industrial Strategy 1 Victoria Street, London SW1H 0ET www.gov.uk/beis