quarterly economic review of the food and … economic review of the food and beverages industry in...
TRANSCRIPT

agriculture,forestry & fisheries
Quarterly Economic Review of the Food
and Beverages Industry in South Africa
October to December
2016
Volume 3, number 2
DIRECTORATE: AGRO-PROCESSING SUPPORT

i
PREFACE
This Quarterly Economic Review of the Food and Beverage Industry in South Africa: October
to December, 2016 publication is the second quarterly review by the Directorate: Agro-
processing Support to provide an overview of the economic performance of the food and
beverage industry in South Africa. The Food and beverages industry in South Africa is one of
the sub-sectors of agro-processing that plays a dominant role in terms of output and
employment in the agro-processing sector. By adding value to the primary agriculture and
fisheries production, the food and beverages industry stimulates output and job creation in
the primary sector and contributes directly to the food security of the country. In addition, it
played a pivotal role in supplying inputs to the food and beverage service industry,
wholesale and retail sectors.
One of the core businesses of the Directorate: Agro-processing Support is to provide timely
and updated economic information regarding the food and beverages industry to monitor
its performance and provide insight into the effects of economic policies and exogenous
factors on the industry. The main economic indicators reviewed are the changes in prices,
production, capacity utilisation, value of sales, formal employment and trade. An outlook of
the industry for the next quarter is also presented. In addition, some indicators of the food
and beverages service industry, wholesale and retail sectors are reviewed to evaluate the
forward linkages of the food and beverages industry.
Any comments and suggestions on the content of the publication are most welcome.
Victor Thindisa
Director: Agro-processing Support
Pretoria
Disclaimer: The Department of Agriculture, Forestry and Fisheries did everything to ensure the
accuracy of the information reported in this publication. The department will, however, not
be liable for the results of action based on this publication.

ii
CONTENTS
PREFACE ................................................................................................................................................ i
1. INTRODUCTION ........................................................................................................................... 1
2. FOOD PRODUCTS ....................................................................................................................... 1
2.1 PRICE ..................................................................................................................................... 2
2.2 PRODUCTION ...................................................................................................................... 4
2.3 VALUE OF SALES .................................................................................................................. 5
2.4 INCOME FROM FOOD SALES IN THE SERVICE INDUSTRY .......................................... 7
2.5 TRADE .................................................................................................................................... 9
2.6 EMPLOYMENT .................................................................................................................... 19
2.7 OUTLOOK ............................................................................................................................ 20
3. BEVERAGES ................................................................................................................................ 21
3.1 PRICE ................................................................................................................................... 21
3.2 PRODUCTION .................................................................................................................... 22
3.3 VALUE OF SALES ................................................................................................................ 23
3.4 INCOME FROM BAR SALES IN THE SERVICE INDUSTRY ............................................ 24
3.5 TRADE .................................................................................................................................. 25
3.6 EMPLOYMENT .................................................................................................................... 34
3.7 OUTLOOK ............................................................................................................................ 34
4. CONCLUSION ............................................................................................................................ 35
5. REFERENCES ............................................................................................................................... 37
Compiled by: Directorate: Agro-processing Support
Department of Agriculture, Forestry and Fisheries
Sefala Building
503 Belvedere Street, Arcadia, South Africa
All correspondence can be addressed to:
Director: Agro-processing Support
Private Bag X416, Pretoria 0001, South Africa
Tel.: +27 (12) 319 8457
Fax: +27 (12) 319 8093
E-mail: [email protected]
This publication is also available on the internet at: http://www.daff.gov.za

1
1. INTRODUCTION
The global economic activity improved in 2016: Q4, with growth improvement observed in
developed economies. The economic performance, with respect to emerging markets and
developing economies, has remained mixed. China’s growth remained strong, reflecting
continued policy support, while economic activity has slowed in India as a result of the
impact of the currency exchange initiative. Brazil continued with a negative growth
trajectory, leading to a deep recession (IMF, 2017).
During 2016: Q4, the South African economy contracted at an annualised rate of 0,3%,
following a marginal growth of 0,4% in the preceding quarter. The disappointing
performance, amongst other reasons, is attributed to weak consumer demand, acceleration
in consumer price inflation, stagnant formal sector employment, persistent subdued business
and consumer confidence levels that suppressed fixed investment and the adverse effects
of the prolonged drought conditions experienced in many parts of the country (Reserve
Bank, 2017).
During 2016: Q4, the seasonally adjusted physical volume of production of the food and
beverages industry stagnated by 1,4% quarter-to-quarter, however, it decelerated by 0,3%
following a 0,3% contraction previously. Sales for food and beverages moderated by 0,5%
from a 3,0% growth in the last quarter, representing a nominal value increase of R30 826 697
in the current period from R30 658 186 million in 2016: Q3.
The trade deficit of food and beverages expanded by R933,4 million in the current period of
review from a R525,2 million registered in the last quarter.
The employment in the food and beverages and tobacco divisions of the agro-processing
sector rebounded by 3,4% quarter-to-quarter, however, moderated by 7,1% year-on-year.
This represents 244 448 jobs created in the current period as compared to 240 278 jobs
created previously.
This quarterly review assesses the economic performance of the food and beverages
industry, given a moderate global economic growth and a contraction of domestic
economic activities recorded during 2016: Q4.
2. FOOD PRODUCTS
According to the Standard Industrial Classification, the food industry incorporates groups of
products which are categorised into the following four codes:
Code 301 refers to manufacturing, processing and preservation of meat, fish,
vegetables, fruits, oils, and fats
Code 302 refers to manufacturing, processing and preservation of dairy products
Code 303 refers to manufacture of grain mill products, starch products and prepared
animal feeds
Code 304 refers to manufacture of other food products like bread, sugar, chocolate,
pasta, coffee, nuts and spices.
Hence, food products will refer to those primary agricultural and fisheries products that have
undergone some form of change through manufacturing and processing or performed some
value addition activities such as preservation.

2
2.1 PRICE
Consumer Price Index (CPI)1
Table 2.1 below shows the consumer price index of food products during 2016: Q4. The year-
on-year total CPI index of food grew by 6,9% during the period. Similarly, the quarter-to-
quarter CPI increased by 0,9%. During the quarter, most of the items recorded a positive
growth except for oils and fats which declined by 0,3%. On the other hand, the year-on-year
growth of most CPI agro-processed products increased during the current period.
Table 2:1 Consumer price Index of food products
Source: (Stats SA, 2016a)
1 Stats SA defines CPI as a current social and economic indicator that is constructed to measure changes over time
in the general level of prices of consumer goods and services that households acquire, use, or pay for.
Food products
Indices % change between
Weight 2015: Q4 2016: Q3 2016: Q4 2015: Q4
and
2016: Q4
2016: Q3
and
2016: Q4
All items (CPI
Headline)
100 116,4 123,3 124,4 6,9 0,9
Food and non-
alcoholic beverages
15,4 117,5 130,1 132,4 12,7 1,8
Food
14,2 117,7 130,7 133,0 13,0 1,8
Processed
6,8 118,9 131,2 133,4 12,2 1,7
Unprocessed
7,4 116,6 130,3 132,6 13,7 1,8
Bread and cereals 3,5 118,0 138,1 139,9 18,6 1,3
Meat
4,6 115,6 120,4 123,3 6,7 2,4
Fish
0,4 122,5 133,1 135,0 10,2 1,4
Milk, eggs and
cheese
1,7 123,3 134,7 135,7 10,1 0,7
Oils and fats
0,5 112,8 127,0 126,6 12,2 -0,3
Fruit 0,2 104,4 123,6 129,2 23,8 4,5
Vegetables
1,6 116,3 129,5 131,5 13,1 1,5
Sugar, sweets and
deserts
0,6 124,5 148,2 153,2 23,1 3,4
Other food 0,9 88,6 97,6 99,8 12,6 2,3

3
Producer price index (PPI)2
The consumer price index for food products grew by 6% year-on-year and by 1,7% quarter-
to-quarter. The producer price index for meat and meat products, fish and fish products, fruit
and vegetables, food products, (Starch and starch products, animal feeds), bakery and
sugar grew by 6,0%, 4,9%, 2,8%, 1,7%, 1,4%, 0,5% and 0,1%, respectively during the period
under review, while the grain mill products and fats and oils producer price index contracted
by 4,3% and 0,1%, respectively during the period under review. The year-on-year producer
price of the most of agro-processing products grew during the current quarter.
Table 2.2: Producer price index of food products
Source: Stats SA (2016b)
2 OECD defines the producer price index (PPI) as a measure of the change in the prices of goods either as they
leave their place of production or as they enter the production process. The PPI can be used as an economic
indicator of inflation, as an escalator in contracts and as a deflator in the calculation of the national accounts.
Food products
Indices % change between
Weight 2015: Q4 2016:
Q3
2016:
Q4
2015: Q4
and
2016: Q4
2016: Q3
and
2016: Q4
Final manufactured
goods (Headline PPI)
100 120,4 127,3 128,6 6,8 1,0
Food products
26,3 125,3 138,4 140,8 12,4 1,7
Meat and meat
products
4,5 127,2 129,2 136,9 7,6 6,0
Fish and fish products
1,6 135,4 148,9 156,2 15,4 4,9
Fruit and vegetables
2,4 117,6 129,0 132,6 12,8 2,8
Oils and fats
0,5 121,1 134,4 134,2 10,8 -0,1
Dairy products
3,3 122,6 139,0 139,0 13,4 0,0
Grain mill products
1,8 121,0 144,2 138,0 14,0 -4,3
Starch and starch
products, animal feeds
1,6 127,4 140,3 142,3 11,7 1,4
Other food products
0,9 125,7 142,5 143,2 13,9 0,5
Bakery products
6,9 131,8 146,7 147,4 11,8 0,5
Sugar 1,9 114,1 140 ,8 141,0 23,6 0,1

4
Table 2.3 shows import unit values of selected food products. During the current period, the
imported unit values for total food product and grain mill products registered a negative
growth of 5,7% and 14,0%, respectively, while fats and oils grew by 1,2%
Table 2.3: Import unit value index of food products
Source: Stats SA (2016c)
2.2 PRODUCTION
Source: Statistics SA (2016d)
Figure 2.1 presents a physical volume of production for food products division items from
2011: Q4 to 2016: Q4. The quarter-to-quarter physical volume of production of dairy products
decelerated by 2,% from a 1,3% contraction in 2016: Q4, ‘’other food products’’ contracted
by 0,2% as compared to a 1,1% growth previously, grain mill products rebounded by 1,2%
from 1,9% in the last quarter and meat and meat products registered an improved negative
growth of 1,2% from a 2,4% contraction registered in 2016: Q4.
50
60
70
80
90
100
110
120
130
2011: Q
4
2012: Q
1
20
12
: Q
2
2012: Q
3
2012: Q
4
2013: Q
1
2013: Q
2
2013: Q
3
2013: Q
4
2014: Q
1
2014: Q
2
2014: Q
3
2014: Q
4
2015: Q
1
2015: Q
2
2015: Q
3
2015: Q
4
2016: Q
1
2016: Q
2
2016: Q
3
2016: Q
4 In
de
x (
2010 =
100)
Figure 2.1: Seasonally adjusted physical volume of production:
food products
Meat, fish, fruit etc Dairy products
Grain mill products Other food products
Food products
Indices % change between
2015: Q4 2016: Q3 2016: Q4 2016: Q4
and
2016: Q4
2016: Q3
and
2016: Q4
Food (total) 100,8 110,7 104,4 3,6 -5,7
Fats and oils 94,7 100,7 101,9 7,6 1,2
Grain mill products 110,4 125,6 108,0 -2,2 -14,0

5
Production capacity
Table 2.4: Utilisation and reasons for underutilisation of production capacity by large
enterprises: Food products (percentage)
Period Utilisation Reasons for underutilisation
Total
under-
utilisation
Shortage of Insufficient
demand
Other
Raw
materials
Labour
Skilled Semi and
unskilled
2015: Q4 81,7 18,3 1,9 1,1 10,8 10,8 4,5
2016: Q3 83,2 16,8 2,2 1,0 9,7 9,7 3,7
2016: Q4 82,4 17,6 1,8 1,5 9,7 9,7 4,3
Source: Statistics SA (2016e)
The utilisation of production capacity by large enterprises of food products showed a
marginal increase year-on-year and marginal decrease quarter-to-quarter (see Table 2.4).
Insufficient demand and a shortage of semi and unskilled labour were the main reasons for
underutilisation during the current period.
2.3 VALUE OF SALES
Source: Statistics SA (2016d)
Figure 2.2 above shows the seasonally adjusted value of sales for the food products division.
During 2016: Q4, the value of sales for food products moderated by 0,5% as compared to the
3,0% growth registered in the previous quarter. Similarly, the year-on-year value of sales
moderated by 10,7% following a 13,2% previously. The graph illustrates a pattern of sales
performance over a period of five years. It can be seen that value of sales for food products
over the years has been increasing steadily. Figure 2.3 shows the performance of food items
20 000
5 020 000
10 020 000
15 020 000
20 020 000
25 020 000
20
11
: Q
4
2012: Q
1
2012: Q
2
2012: Q
3
2012: Q
4
2013: Q
1
2013: Q
2
2013: Q
3
2013: Q
4
2014: Q
1
2014: Q
2
2014: Q
3
2014: Q
4
2015: Q
1
2015: Q
2
2015: Q
3
2015: Q
4
2016: Q
1
2016: Q
2
2016: Q
3
2016: Q
4
R'm
illio
n
Figure 2.2: Seasonally adjusted value of sales (current prices):
food products

6
under the food products division during the current period. The dairy and ‘’other food
products’’ division moderated by 0,6% and 0,4% as compared to growth of 1,5% and 6,2%,
respectively in the last quarter. However, dairy products moderated by 0,6%, while grain mill
products increased by 1,6% during the period.
Source: Statistics SA (2016d)
Wholesale and retail sales3
The current value of wholesale and retail sales of food, beverages and tobacco are given in
Figure 2.4. During 2016: Q4, the quarter-to-quarter wholesale of food, beverages and
tobacco grew by 11,9% following a growth of 7,0% in the last quarter, however, it moderated
by 6,0% year-on-year. Similarly, the quarter-to-quarter retail sales of food, beverages and
tobacco grew by 24,9%, as compared to a 7,4% growth previously and moderated by 13,8%
year-on-year. As a result, the quarter-to-quarter value of income of wholesale and retail sales
of food, beverages and tobacco increased from R25 754,3 million and R5 765,6 million in the
last quarter to R28 831,0 million and R7 198, 6 million, respectively during the period.
3 Statistics South Africa (Stats SA) conducts a monthly survey covering enterprises in the wholesale and retail trade industry.
The results of the monthly wholesale and retail trade sales survey are used to compile estimates of the gross domestic product (GDP) and its components, which are used in monitoring the state of the economy and formulation of economic policy. These statistics are also used in the analysis of comparative business and industry performance.
50
2 000 050
4 000 050
6 000 050
8 000 050
10 000 050
12 000 050
14 000 050
2011: Q
4
2012: Q
1
2012: Q
2
2012: Q
3
2012: Q
4
2013: Q
1
2013: Q
2
2013: Q
3
20
13
: Q
4
2014: Q
1
2014: Q
2
2014: Q
3
2014: Q
4
2015: Q
1
2015: Q
2
2015: Q
3
2015: Q
4
2016: Q
1
2016: Q
2
2016: Q
3
2016: Q
4
Ind
ex (
2010 =
100)
Figure 2.3: Seasonally adjusted value of sales (current prices):
food products
Meat , fish, fruit etc Dairy products
Grain mill products Other food products

7
Source: Statistics SA (2016f, 2016g)
2.4 INCOME FROM FOOD SALES IN THE SERVICE INDUSTRY6
Figure 2.5 and Figure 2.6 below shows the income from food sales4 in the service industry
which includes food sales in restaurants and coffee shops5, take-away and fast food outlets6
and catering services7. Figure 2.5 indicates that during 2016: Q4, the income from food sales
in the service industry accelerated by 11,7% following 5,6% growth registered in the previous
quarter, however, it moderated by 8,8% year-on-year as compared to 9,0% growth
previously. As a result, the total income increased from R3 892,0 million in the last quarter to
R4 346,8 million in the current period. Figure 2.6 below illustrates the breakdown in total
income growth for service industries, i.e., restaurants and coffee shops8, take-away and fast
food outlets9 and catering services. During the period under review, the restaurants and
coffee shops10, take-away and fast food outlets grew by 16,4% and 12,3% as compared to
the 5,5% and 5,4% respective growth recorded previously. However, catering services
contracted by 1,7% from a 6,4% growth in the last quarter. On the other hand, the year-on-
4 Income from food sales in the service industry refers to income from the sale of meals and non-alcoholic drinks.
5 Restaurants and coffee shops refers to enterprises involved in the sale and provision of meals and drinks, ordered from a
menu, prepared on the premises for immediate consumption and with provided seating. 6 Take-away and fast food outlet refers to enterprises involved in the sale and provision of meals and drinks, ordered from a
menu, prepared on the premises for takeaway purposes in a packaged format, at a stand or in a location, with or without provided seating. 7 Catering services refers to enterprises involved in the sale and supply of meals and drinks prepared on the premises on a
contract basis and brought to other premises chosen by the person ordering them, to be served for immediate consumption to guests or customers. Catering services also include bars, taverns, other drinking places, ice-cream parlours, etc. 8 Restaurants and coffee shops refers to enterprises involved in the sale and provision of meals and drinks, ordered from a
menu, prepared on the premises for immediate consumption and with provided seating. 9 Take-away and fast food outlet refers to enterprises involved in the sale and provision of meals and drinks, ordered from a
menu, prepared on the premises for takeaway purposes in a packaged format, at a stand or in a location, with or without provided seating. 10
Restaurants and coffee shops refers to enterprises involved in the sale and provision of meals and drinks, ordered from a menu, prepared on the premises for immediate consumption and with provided seating.
0
5 000
10 000
15 000
20 000
25 000
30 000
35 000
2011: Q
4
2012: Q
1
2012: Q
2
2012: Q
3
2012: Q
4
2013: Q
1
20
13
: Q
2
2013: Q
3
2013: Q
4
2014: Q
1
2014: Q
2
2014: Q
3
2014: Q
4
20
15
: Q
1
2015: Q
2
2015: Q
3
2015: Q
4
2016: Q
1
2016: Q
2
2016: Q
3
2016: Q
4
R m
illio
n
Figure 2.4: Wholesale and retail trade sales of food, beverages
and tobacco (current prices)
Wholesale Retail

8
year restaurants and coffee shops grew by 11,6%, take-away and fast food outlets
moderated by 9,6% and catering services contracted by 1,2%.
Source: Statistics SA (2016h)
Source: Statistics SA (2016h)
500
1 000
1 500
2 000
2 500
3 000
3 500
4 000
4 500
5 000
20
11
: Q
4
2012: Q
1
2012: Q
2
2012: Q
3
2012: Q
4
2013: Q
1
2013: Q
2
2013: Q
3
2013: Q
4
2014: Q
1
2014: Q
2
2014: Q
3
2014: Q
4
2015: Q
1
2015: Q
2
2015: Q
3
2015: Q
4
2016: Q
1
20
16
: Q
2
2016: Q
3
2016: Q
4
R m
illio
n
Figure 2.5: Income from food sales in the service industry
500
1 000
1 500
2 000
2 500
2011: Q
4
2012: Q
1
2012: Q
2
2012: Q
3
2012: Q
4
2013: Q
1
20
13
: Q
2
2013: Q
3
2013: Q
4
2014: Q
1
2014: Q
2
2014: Q
3
2014: Q
4
2015: Q
1
2015: Q
2
2015: Q
3
2015: Q
4
2016: Q
1
2016: Q
2
20
16
: Q
3
2016: Q
4
R m
illio
n
Figure 2.6: Income from food sales in the service industry
Restaurants and coffee shops Take-away/fast food outlets
Catering services
9
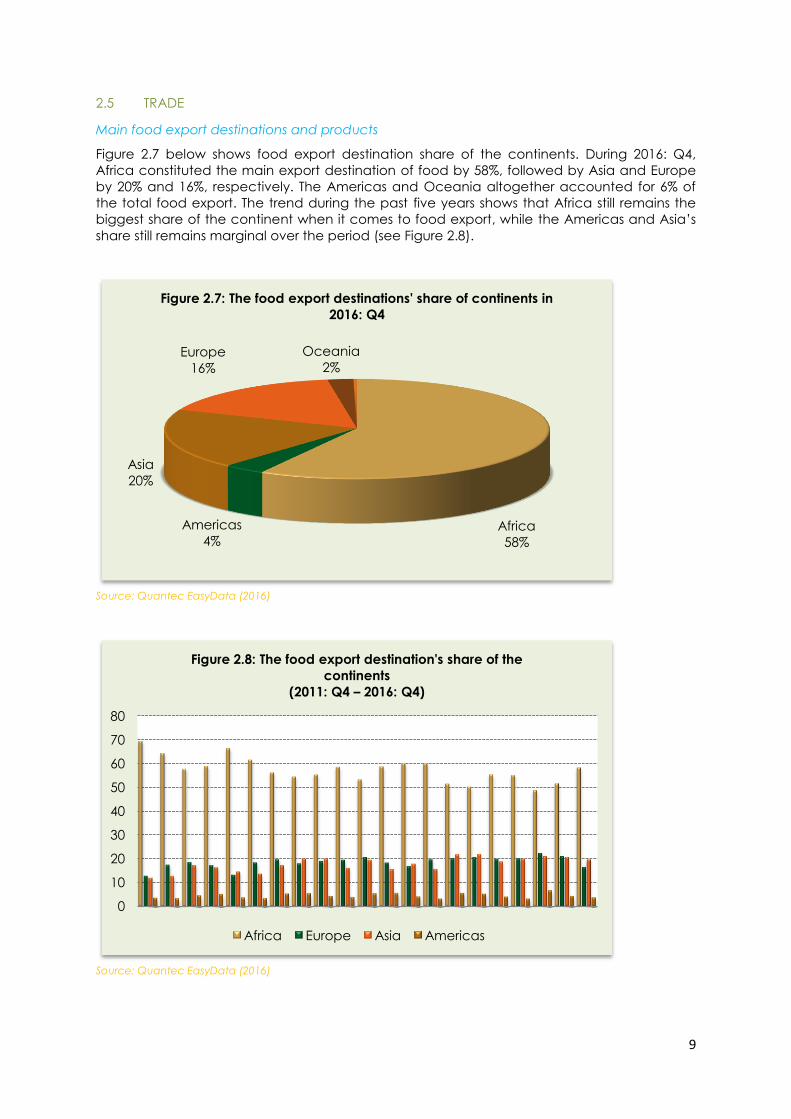
2.5 TRADE
Main food export destinations and products
Figure 2.7 below shows food export destination share of the continents. During 2016: Q4,
Africa constituted the main export destination of food by 58%, followed by Asia and Europe
by 20% and 16%, respectively. The Americas and Oceania altogether accounted for 6% of
the total food export. The trend during the past five years shows that Africa still remains the
biggest share of the continent when it comes to food export, while the Americas and Asia’s
share still remains marginal over the period (see Figure 2.8).
Source: Quantec EasyData (2016)
Source: Quantec EasyData (2016)
Africa
58%
Americas
4%
Asia
20%
Europe
16%
Oceania
2%
Figure 2.7: The food export destinations' share of continents in
2016: Q4
0
10
20
30
40
50
60
70
80
Figure 2.8: The food export destination's share of the
continents
(2011: Q4 – 2016: Q4)
Africa Europe Asia Americas

10
Figure 2.9 shows the food export destinations’ share of the main regions11 in 2016: Q4.
Among the main regions, SACU (Excluding, RSA) (32%), accounted for the highest share of
food export, followed by SADC (Excluding SACU) by 27%. NAFTA, Eastern Asia, South Eastern
Asia, Western Asia and (Australia and New Zealand) accounted for 25% combined of the
total share, while the European Union accounted for 16% of the share during the period.
Source: Quantec EasyData (2016)
Source: Quantec EasyData (2016)
Figure 2.10 above shows the top four countries for food export destinations during 2016: Q4.
During the period under review four African countries, Namibia, Botswana, Mozambique,
11
The main regions which are included in the analysis are the top eight regions: SADC, Western Africa, EU; NAFTA
(North Atlantic Free Trade Area consisting of the USA, Canada and Mexico); Eastern Asia (includes China, Japan,
North Korea, South Korea); Western Asia (mostly Middle East countries); South Central Asia (include India, Pakistan
and Bangladesh) and Australia and New Zealand.
SADC
(excluding
SACU)
27%
SACU
(Excluding
RSA)
32%
NAFTA
3%
Eastern Asia
11%
South-
eastern
Asia
3%
Western
Asia
6%
European
Union
16%
Australia and
New Zealand
2%
Figure 2.9: The food export destinations' share of main regions in
2016: Q4
0
2
4
6
8
10
12
Na
mib
ia
Bo
tsw
an
a
Mo
zam
biq
ue
Zim
ba
bw
e
Leso
tho
Za
mb
ia
Sw
azi
lan
d
Ch
ina
Ho
ng
Ko
ng
Ge
rma
ny
%
Figure 2.10: The share of top ten food export destination
countries in 2016: Q4

11
Zimbabwe, Zambia and Lesotho had the highest share of food export, while from Asia it was
China and Hong Kong, while from Europe, it was Germany. Table 2.5 presents the major
exported food products during 2016: Q4 and Table 2.6 show the year-on-year high and low
export performers of food products during the current quarter of review by comparing the
export values of the present quarter to the same quarter of the previous year (year-on-year).
Table 2.5: Major exported food products in 2016: Q4
HS Code Food product Total amount (R
Million)
HST100630 Semi-milled or wholly milled rice, whether or not polished
or glazed
206,9
HST210410 Soups and broths and preparations 184,6
HST040690 Other cheese 91,71
HST210500 Ice cream and other edible ice, whether or not
containing cocoa
90,9
HST110220 Maize (corn) flour 86,9
HST100640 Broken rice 84,6
HST210320 Tomato ketchup and other tomato sauces 76,8
HST190110 Preparations for infant use, put up for retail sale 52,5
HST190120 Mixes and doughs for the preparation of bakers' wares
of heading
47,6
HST190230 Other pasta 47,1
HST151800 Animal or vegetable fats and oils and their fractions,
boiled, oxidised, dehydrated, sulphurised, blown,
polymerised by heat in vacuum or in inert gas
31,1
HST210330 Mustard flour and meal and prepared mustard 15,0
HST210130 Roasted chicory and other roasted coffee substitutes
and extracts, essences and concentrates thereof
14,2
HST100890 Other cereals 13,6
HST230110 Flours, meals and pellets, of meat or meat offal; greaves 11,5
HST040510 Butter 6,3

12
HST190532: Waffles and wafers 4,6
HST100620 Husked (brown) rice 3,9
HST190220 Stuffed pasta, whether or not cooked or otherwise
prepared
3,6
HST110510 Flour, meal and powder 2,9
HST110520 Flakes, granules and pellets 2,0
HST190300 Tapioca and substitutes therefor prepared from starch,
in the form of flakes, grains, pearls, siftings or in similar
forms.
1,1
HST110814 Manioc (cassava) starch 1,0
HST150410 Fish-liver oils and their fractions 0,7
HST151550 Sesame oil and its fractions 0,6
HST170250 Chemically pure fructose 0,5
HST151530 Castor oil and its fractions 0,2
Source: Quantec EasyData (2016)
Table 2.6: Export performance of food products
HS Code Food product Changes
compared to a
year ago
(R million)
High performers
HST150420
Fats and oils and their fractions of fish, other than liver oils
210 340,3
HST180400
Cocoa butter, fat and oil
3 228,5
HST190300 Tapioca and substitutes therefor prepared from starch, in
the form of flakes, grains, pearls, siftings or in similar forms
88,5
HST151620
Vegetable fats and oils and their fractions
44,9
HST180500 Cocoa powder, not containing added sugar or other
sweetening matter
34,9

13
HST190420 Prepared foods obtained from unroasted cereal flakes or
from mixtures of unroasted cereal flakes and roasted
cereal flakes or swelled cereals
26,9
HST190410 Prepared foods obtained by the swelling or roasting of
cereals or cereal products
25,8
HST210230
Prepared baking powders
20,8
HST151710
Margarine, excluding liquid margarine
19,6
HST180610 Cocoa powder, containing added sugar or other
sweetening matter
16,2
HST210500 Ice cream and other edible ice, whether or not
containing cocoa
13,5
HST190220
Stuffed pasta, whether or not cooked or otherwise
prepared
12,0
HST210410
Soups and broths and preparations therefor
11,5
HST210320
Tomato ketchup and other tomato sauces
9,4
HST110510
Flour, meal and powder
9,4
HST190531
Sweet biscuits
4,9
HST190120 Mixes and doughs for the preparation of bakers' wares of
heading
2,5
HST210310
Soya sauce
2,1
Low performers
HST151800 Animal or vegetable fats and oils and their fractions,
boiled, oxidised, dehydrated, sulphurised, blown,
polymerised by heat in vacuum or in inert gas or otherwise
chemically modified, excluding those of heading inedible
mixtures
-0,4
HST230110
Flours, meals and pellets, of meat or meat offal; greaves
-4,5
HST190532
Waffles and wafers
-6,0
HST210330
Mustard flour and meal and prepared mustard
-18,5
HST170410
Chewing gum, whether or not sugar-coated
-18,7

14
HST190110
Preparations for infant use, put up for retail sale
-22,6
HST151530
Castor oil and its fractions
-50,3
HST151550
Sesame oil and its fractions
-69,2
HST152110
Vegetable waxes
-94,3
HST230320 Beet-pulp, bagasse and other waste of sugar
manufacture
-96,2
Source: Quantec EasyData (2016)
Main source of food imports and imported food products
South Africa’s main source of food import during 2016:Q4 is presented in Figure 2.11. South
Africa imported 38% of its food from Europe, followed by Asia (32%). The share of the
Americas (24%) is also substantial as a source of imports then followed by Africa with a share
of 5%. Oceania’s contribution is very marginal at 1%. Figure 2.12 indicates that during the
past five years, Europe and Asia has become the major source of food imports while Africa is
still below 15%.
Source: Quantec EasyData (2016)
Africa
5%
Americas
24%
Asia
32%
Europe
38%
Oceania
1%
Figure 2.11: The share of continents as a source of food import
in 2016: Q4

15
Source: Quantec EasyData (2016)
As the main trading region, the EU accounts approximately 38% of the total food imports,
followed by South Eastern Asia (23%), South America (21%), Eastern Asia (8%) and NAFTA (3%)
during the period. SACU (Excluding RSA) accounted 4% share during 2016: Q4 (see Figure
2.13).
Source: Quantec EasyData (2016)
0
5
10
15
20
25
30
35
40
45 2011: Q
4
2012: Q
1
2012: Q
2
2012: Q
3
20
12
: Q
4
2013: Q
1
2013: Q
2
2013: Q
3
2013: Q
4
2014: Q
1
2014: Q
2
2014: Q
3
20
14
: Q
4
2015: Q
1
2015: Q
2
2015: Q
3
2015: Q
4
2016: Q
1
2016: Q
2
2016: Q
3
20
16
: Q
4
Figure 2.12: The share of continents as a source of food import
(2011: Q4 – 2016: Q4)
Africa Americas Asia Europe
SACU
(Excluding
RSA)
4%
South America
21% NAFTA
3%
Eastern Asia
8%
Southeast Asia
22%
European
Union
38%
Others
4%
Figure 2.13: The share of regions as sources of food imports in
2016: Q4

16
Source: Quantec EasyData (2016)
The significant share of food imports were sourced from Argentina (14,8%), Indonesia (8,7%),
Spain (10,5%), China (8,7%), Malaysia (8,2%), Brazil (5,4%), Thailand (2,8%), the United
Kingdom (2,8%), Germany (2,4%) and the United States (2,4%)(see Figure 2.14). Table 2.6
presents the major imported food products during 2016: Q4.
Table 2.6: Top 30 imported food products in 2016: Q4
HS Code Food product Total amount (R
million)
HST230400
Oil-cake and other solid residues, whether or not
ground or in the form of pellets, resulting from the
extraction of soya bean oil
672,6
HST230910 Dog or cat food, put up for retail sale
191,3
HST170290
Other, including invert sugar and other sugar and
sugar syrup blends containing in the dry state 50% by
weight of fructose
140,2
HST040630 Processed cheese, not grated or powdered
83,9
HST170410 Chewing gum, whether or not sugar-coated
78,5
HST180400 Cocoa butter, fat and oil
68,1
HST040690 Other cheese
66,4
HST190531 Sweet biscuits
66,4
0
2
4
6
8
10
12
14
16
Arg
en
tin
a
Ind
on
esi
a
Sp
ain
Ch
ina
Ma
laysi
a
Bra
zil
Tha
ilan
d
Un
ite
d K
ing
do
m
Ge
rma
ny
Un
ite
d S
tate
s
%
Figure 2.14: The share of top ten countries as sources of food
import in 2016: Q4

17
HST110100 Wheat or meslin flour
55,3
HST180500 Cocoa powder, not containing added sugar or other
sweetening matte
53,9
HST040410
Whey and modified whey, whether or not
concentrated or containing added sugar or other
sweetening matter
36,4
HST100640 Broken rice
35,5
HST190532 Waffles and wafers
21,2
HST210500 Ice cream and other edible ice, whether or not
containing cocoa
16,0
HST040610 Fresh (unripened or uncured) cheese, including whey
cheese and curd
13,6
HST110812 Maize (corn) starch
10,4
HST210310 Soya sauce
10,3
HST040620 Grated or powdered cheese, of all kinds
9,8
HST210330 Mustard flour and meal and prepared mustard
6,5
HST200990 Mixtures of juices
5,3
HST110520 Flakes, granules and pellets
5,2
HST190540 Rusks, toasted bread and similar toasted products
4,9
HST040640 Blue-veined cheese and other cheese containing
veins produced by Penicillium roqueforti
4,6
HST040310 Yogurt
4,2
HST151000
Other oils and their fractions, obtained solely from
olives, whether or not refined, but not chemically
modified, including blends of these oils or fractions with
oils or fractions of heading.
3,9
HST190510 Crispbread
2,4
HST190300
Tapioca and substitutes, therefor prepared from
starch, in the form of flakes, grains, pearls, siftings or in
similar forms
1,8

18
HST110510 Flour, meal and powder
0,5
HST040510 Butter
0,3
Source: Quantec EasyData (2016)
Source: Quantec EasyData (2016)
During 2016: Q4, quarter-to-quarter exports of food products decelerated by 0,9% following a
contraction of 0,3% previously. However, it moderated by 4,1% year-on-year. On the other
hand, the quarter-to-quarter and year-on-year imports for food products moderated by 5,0%
and 7,9% following an 11,5% and 17,7% growth registered in the last quarter. As a result, the
quarter-to-quarter trade deficit for food products expanded from R2 533,6 million in 2016: Q3
to R3 411,4 million in the current quarter. (see Figure 2.16).
0
2 000
4 000
6 000
8 000
10 000
12 000
14 000
16 000
18 000
2012: Q
4
2013: Q
1
2013: Q
2
2013: Q
3
2013: Q
4
2014: Q
1
2014: Q
2
2014: Q
3
2014: Q
4
2015: Q
1
2015: Q
2
2015: Q
3
2015: Q
4
2016: Q
1
2016: Q
2
2016: Q
3
2016: Q
4
R m
illio
n
Figure 2.15: Quarterly trade balance of food products
Export Import

19
2.6 EMPLOYMENT
Source: Statistics SA (2016i)
Source: Statistics SA (2016i)
Figure 2.17 shows the number of formal employment of the food products division. The year-
on-year, formal employment of meat, fish, fruit, vegetables, oils and fats, grain mill products
and ‘’other food products’ moderated by 4,3%, 3,6% and 7,4% as compared to the growth
of 4,9%, 4,2% and 12,6%, respectively as recorded in the previous quarter. Whereas the year-
on-year for dairy products grew by 0,7% following a 0,2% growth in the last quarter. On the
150 000
160 000
170 000
180 000
190 000
200 000
210 000
2015: Q
2
2015: Q
3
2015: Q
4
2016: Q
1
2016: Q
2
2016: Q
3
2016: Q
4
Figure 2.16: Total number of formal employment: food
products
0 10 000 20 000 30 000 40 000 50 000 60 000 70 000 80 000 90 000
100 000
20
15
: Q
2
2015: Q
3
2015: Q
4
2016: Q
1
2016: Q
2
2016: Q
3
2016: Q
4
Figure 2.17: Number of formal employment: food products
Production, processing and preservation of meat, fish, fruit,
vegetables, oils and fats Dairy products
Grain mill products, starches and starch products and prepared
animal fat Other food products

20
other hand, the quarter-to-quarter, formal employment of food products division rebounded
by 10,6% for meat, fish, fruit, vegetables, oils and fats, grew by 4,1% for dairy products,
moderated by 1,1% for grain mill products and decelerated by 0,1% for other food products.
As a result in the rebound of total food products by 3,7% as compared to a contraction of
0,9% previously, it represented a total number of 7 361 jobs created in the food division under
the period from 1 758 jobs shed in the last quarter.
2.7 OUTLOOK
Table 2.7: Net balance12 of BER manufacturing survey: food products
2016: Q2 2016: Q3 2016: Q4 2017: Q1*
Domestic sales volumes 51 34 24 -6
Export sales volumes 22 37 24 33
Production volumes 30 28 19 -25
Domestic order volumes received 56 35 11 -9
Export order volumes received 14 25 7 21
General business conditions -31 10 -28 -16
Number of factory workers -12 -19 2 -24
Fixed investment -34 -5 -30 -51
Business confidence13 35 62 40
Expected volume of goods imported in
12 months’ time 13 -5 -13
Expected volume of goods exported in
12 months’ time 15 38 28
Expected real investment in machinery
and equipment in 12 months’ time -19 10 -41
12 BER calculates the net balance statistics by subtracting the percentage of the respondents replying “down” from
the percentage replying “up” to a particular question. Respondents are asked to compare the current quarter’s
experience to that of a year ago. A positive net balance implies an improvement (i.e., positive year-on-year growth)
and vice versa. Therefore, the net balance varies from -100 to 100 where -100 is the most negative response; 0 is a
situation of no change and 100 is the most positive response.
13
BER calculates the business confidence index by asking respondents to rate current business conditions as “satisfactory” or “unsatisfactory.” Then the index is derived as a gross percentage of the respondents replying “satisfactory.” A value of 50 is indicative of neutrality, 100 indicative of extreme confidence and 0 of extreme lack of confidence. An index greater than 50 shows the majority of respondents are satisfied with the prevailing economic conditions.

21
2016: Q2 2016: Q3 2016: Q4 2017: Q1*
Expected business conditions in 12
months’ time -16 24 -28
*Expected Source: BER (2016)
A survey by the Bureau for Economic Research (BER) on food manufacturing is presented in
Table 4.5. The survey shows that the year-on-year outlook for 2017: Q1 is negative for most
variables except sales volumes.
3. BEVERAGES
According to SIC classification, beverages are coded 305 and it comprises the following
beverage products:
Distilling, rectifying and blending of spirits; ethyl alcohol production from fermented
materials; manufacture of wine
Manufacture of beer and other malt liquors and malt
Breweries, except sorghum beer breweries
Sorghum beer breweries
Manufacture of malt
Manufacture of soft drinks; production of mineral waters.
3.1 PRICE
Table 3.1 shows the consumer price indices and export unit value of beverages. The year-on-
year and quarter-to-quarter consumer price inflation for alcoholic beverages grew by 6,9%
and 0,9%, respectively in the period under review. The consumer price indices for alcoholic
beverages grew by 0,5% during the quarter. Items that increased under the alcoholic
beverages are spirits and wine, amongst others, which grew by 0,6% and 1,0%, respectively.
Similarly, the non-alcoholic beverages grew by 1,5% during the period. Amongst the items
under the category was hot beverages and cold beverages that grew by 1,5% and 1,3%,
respectively. The table below also depicts the producer price index of beverages which
grew by 2,5% in the current quarter. However, the export unit value of beverages registered
a negative growth of 2,1% in the same period.

22
Table 3.1: Price indices of beverages
Source: Stats SA (2016a, 2016b, 2016
3.2 PRODUCTION
Source: Statistics SA (2016d)
50
60
70
80
90
100
110
120
2010: Q
4
2011: Q
1
2011: Q
2
2011: Q
3
2011: Q
4
2012: Q
1
2012: Q
2
2012: Q
3
2012: Q
4
2013: Q
1
2013: Q
2
2013: Q
3
2013: Q
4
20
14
: Q
1
2014: Q
2
2014: Q
3
2014: Q
4
2015: Q
1
2015: Q
2
2015: Q
3
2015: Q
4
Ind
ex (
2010 =
100)
Figure 3.1: Seasonally adjusted physical volume of production:
beverages
Beverages products
Indices % change between
Weight 2015: Q4 2016: Q3 2016:
Q4
2015: Q4
and
2016: Q4
2016: Q3
and
2016: Q4
Consumer price indices
All items (CPI
headline)
100 116,4 123,3 124,4 6,9 0,9
Alcoholic
beverages
3,9 124,2 130,4 131,0 5,4 0,5
Spirits
0,8 117,0 122,5 123,2 5,3 0,6
Wine
0,7 125,9 132,1 132,2 5,0 0,1
Beer
2,5 119,8 125,7 125,8 5,0 0,1
Non-alcoholic
beverages
1,2 114,0 123,2 124,9 9,5 1,4
Hot beverages
0,3 123,2 141,9 144,1 17,0 1,5
Cold beverages
0,9 110,7 116,3 117,8 6,5 1,3
Producer price index
Beverages
8,5 119,4 125,8 128,9 8,0 2,5
Export unit value
Beverages
135,2 104,9 102,8 100,6 -4,2 -2,1

23
Figure 3.1 presents the seasonally adjusted physical volume of production for beverages.
During 2015: Q4, the volume of production for beverages contracted year-on-year and
quarter-to-quarter by 0,8% and 0,5% in the current quarter, following growths of 0,1% and
1,1%, respectively as recorded in the previous quarter.
Production capacity
Table 3.2: Utilisation and reasons for underutilisation of production capacity by large
enterprises: Beverages division (percentage)
Period Utilisation Reasons for underutilisation
Total
under-
utilisation
Shortage of Insufficient
demand
Other
Raw
materials
Labour
Skilled Semi and
unskilled
2015: Q4 88,3 11,7 1,0 0,8 10,8 7,2 2,6
2016: Q3 85,1 14,9 2,4 1,4 9,7 6,6 4,3
2016: Q4 88,1 11,9 2,1 1,0 9,7 6,3 2,1
Source: Statistics SA (2016e)
Table 3.2 shows that the year-on-year and quarter-to-quarter utilisation capacity grew during
2016: Q4. Insufficient demand and shortage of semi and unskilled labour remained the main
reasons for underutilisation in the period under review.
3.3 VALUE OF SALES
Source: Statistics SA (2016d)
10 000
2 010 000
4 010 000
6 010 000
8 010 000
10 010 000
12 010 000
2011: Q
4
2012: Q
1
20
12
: Q
2
20
12
: Q
3
2012: Q
4
2013: Q
1
2013: Q
2
2013: Q
3
2013: Q
4
2014: Q
1
2014: Q
2
2014: Q
3
2014: Q
4
2015: Q
1
2015: Q
2
2015: Q
3
2015: Q
4
2016: Q
1
2016: Q
2
2016: Q
3
2016: Q
4
R m
illio
n
Figure 3.2: Seasonally adjusted value of sales (current
prices): beverages

24
During 2016: Q4, the seasonal adjusted value of sales of beverages rebounded by 0,6%
quarter-to-quarter following a 0,4% contraction registered in the last quarter. However, it
moderated by 5,5% year-on-year as compared to a 5,6% growth previously. (see Figure 4.6).
Due to the strong linkages between agro-processing and primary agriculture, the growth of
the beverages division during the period can be attributed to the bountiful harvest
experienced by farmers in the current season.
3.4 INCOME FROM BAR SALES IN THE SERVICE INDUSTRY14
Figure 3.3 shows the income from bar sales in the food and beverages service industry in
2016: Q4. During this period, the quarter-to-quarter income from bar sales in the services
industry grew modestly by 11,7% as compared to a 5,6% growth registered previously.
However, it moderated by 8,8% following a 9,0% growth in the last quarter. That resulted in
the total income growth of R 4 346,8 million in the current quarter from R3 892,0 million
registered in 2016: Q3.
Source: Statistics SA (2016h)
14 Income from bar sales refers to income from liquor sales.
500
1 000
1 500
2 000
2 500
3 000
3 500
4 000
4 500
5 000
2011: Q
4
2012: Q
1
2012: Q
2
2012: Q
3
2012: Q
4
2013: Q
1
20
13
: Q
2
2013: Q
3
2013: Q
4
2014: Q
1
2014: Q
2
2014: Q
3
2014: Q
4
2015: Q
1
2015: Q
2
2015: Q
3
2015: Q
4
20
16
: Q
1
2016: Q
2
2016: Q
3
2016: Q
4
R m
illio
n
Figure 3.3: Income from food sales in the service industry

25
Source: Statistics SA (2016h)
Figure 3.4 shows the services performance of the food sales in the services industry. The
services are restaurants and coffee shops, take aways/fast food outlets and catering
services. During the current review period, the restaurants and coffee shops, take aways/fast
food outlets accelerated by 16,4% and 12,3% following growths of 3,5% and 5,4%,
respectively. However, the catering services contracted by 1,7% as compared to a 6,4%
registered in the last quarter. The year-on-year restaurants and coffee shops increased
substantially by 11,6%, take aways/fast food outlets moderated by 9,6% and catering
services contracted by 1,2%.
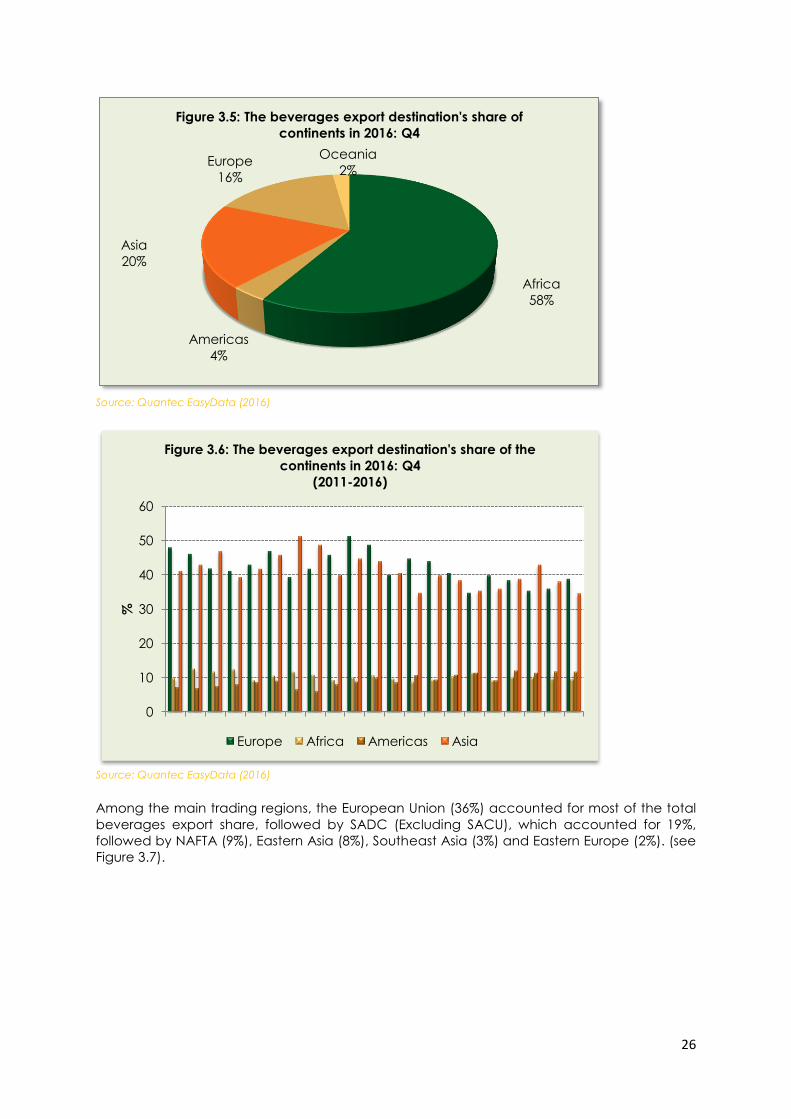
3.5 TRADE
Main export destinations and food products
Figure 3.5 shows during the quarter under review; Africa is by far the largest export
destination for South African beverages. It accounted for 58% of the total export followed by
Asia (20%), Europe (16%), the Americas (4%) and Oceania (2%). The trend of the export
destination’s share during the past five years shows that Africa was the biggest, followed by
Europe and Asia. The Americas and Oceania share were marginal. (see Figure 3.6).
500
1 000
1 500
2 000
2 500
2011: Q
4
2012: Q
1
2012: Q
2
2012: Q
3
2012: Q
4
2013: Q
1
20
13
: Q
2
2013: Q
3
2013: Q
4
2014: Q
1
2014: Q
2
2014: Q
3
2014: Q
4
2015: Q
1
2015: Q
2
2015: Q
3
20
15
: Q
4
2016: Q
1
2016: Q
2
2016: Q
3
2016: Q
4
R m
illio
n
Figure 3.4: Income from food sales in the service industry
Restaurants and coffee shops Take-away/fast food outlets
Catering services
26
Source: Quantec EasyData (2016)
Source: Quantec EasyData (2016)
Among the main trading regions, the European Union (36%) accounted for most of the total
beverages export share, followed by SADC (Excluding SACU), which accounted for 19%,
followed by NAFTA (9%), Eastern Asia (8%), Southeast Asia (3%) and Eastern Europe (2%). (see
Figure 3.7).
Africa
58%
Americas
4%
Asia
20%
Europe
16%
Oceania
2%
Figure 3.5: The beverages export destination's share of
continents in 2016: Q4
0
10
20
30
40
50
60
%
Figure 3.6: The beverages export destination's share of the
continents in 2016: Q4
(2011-2016)
Europe Africa Americas Asia

27
Source: Quantec EasyData (2016)
Source: Quantec EasyData (2016)
Figure 3.8 above shows the top ten countries that South Africa exported beverages to during
2016: Q4. The following are the main countries that constituted a huge share of beverages
export during the quarter: Namibia (9,6%), the United Kingdom (9,1%), Germany (6,9%),
Botswana (5,5%), Mozambique (5,4%), China (4,8%), the United States (4,7%), the Netherlands
(4,4%), Zambia (3,5%) and Canada (3,5%). Figure 3.4 shows high and low export performers
of beverages during 2016: Q4 by comparing the export values of the present quarter to the
same quarter of the previous year (year-on-year).
SADC
(Excluding
SACU)
19%
SACU
(Excluding
RSA)
23%
NAFTA
9%
Eastern Asia
8%
Southeast Asia
3%
Eastern
Europe
2%
European
Union
36%
Figure 3.7: The share of top beverages export destination
regions in 2016: Q4
0
2
4
6
8
10
12
Na
mib
ia
Un
ite
d K
ing
do
m
Ge
rma
ny
Bo
tsw
an
a
Mo
zam
biq
ue
Ch
ina
Un
ite
d S
tate
s
Ne
the
rla
nd
s
Za
mb
ia
Ca
na
da
%
Figure 3.8: The share of top ten beverages export destination
countries in 2016: Q4
28
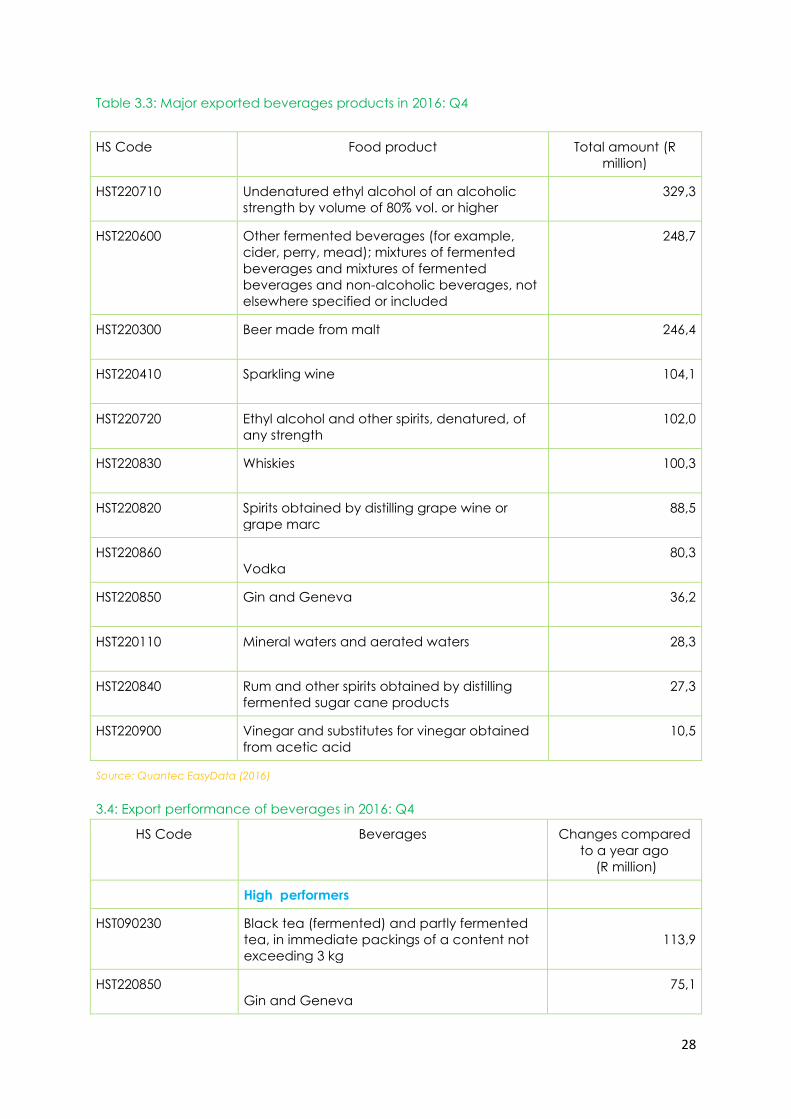
Table 3.3: Major exported beverages products in 2016: Q4
HS Code Food product Total amount (R
million)
HST220710 Undenatured ethyl alcohol of an alcoholic
strength by volume of 80% vol. or higher
329,3
HST220600 Other fermented beverages (for example,
cider, perry, mead); mixtures of fermented
beverages and mixtures of fermented
beverages and non-alcoholic beverages, not
elsewhere specified or included
248,7
HST220300 Beer made from malt 246,4
HST220410 Sparkling wine 104,1
HST220720 Ethyl alcohol and other spirits, denatured, of
any strength
102,0
HST220830 Whiskies 100,3
HST220820 Spirits obtained by distilling grape wine or
grape marc
88,5
HST220860
Vodka
80,3
HST220850 Gin and Geneva 36,2
HST220110 Mineral waters and aerated waters 28,3
HST220840 Rum and other spirits obtained by distilling
fermented sugar cane products
27,3
HST220900 Vinegar and substitutes for vinegar obtained
from acetic acid
10,5
Source: Quantec EasyData (2016)
3.4: Export performance of beverages in 2016: Q4
HS Code Beverages Changes compared
to a year ago
(R million)
High performers
HST090230 Black tea (fermented) and partly fermented
tea, in immediate packings of a content not
exceeding 3 kg
113,9
HST220850
Gin and Geneva
75,1

29
HST220860
Vodka
74,1
HST220840 Rum and other spirits obtained by distilling
fermented sugar cane products
46,2
HST220210 Waters, including mineral waters and aerated
waters, containing added sugar or other
sweetening matter or flavoured
26,1
HST220900 Vinegar and substitutes for vinegar obtained
from acetic acid.
4,9
HST220870
Liqueurs and cordials
1,5
Low performers
HST220710 Undenatured ethyl alcohol of an alcoholic
strength by volume of 80% vol. or higher
-0,3
HST220720 Ethyl alcohol and other spirits, denatured, of
any strength
-0,3
HST090210 Green tea (not fermented) in immediate
packings of a content not exceeding 3 kg
-1,5
HST220820 Spirits obtained by distilling grape wine or
grape marc
-5,9
HST220300 Beer made from malt -6,6
HST220110
Mineral waters and aerated waters
-8,9
HST220830 Whiskies -11,8
HST220600 Other fermented beverages (for example,
cider, perry, mead); mixtures of fermented
beverages and mixtures of fermented
beverages and non-alcoholic beverages, not
elsewhere specified or included
-17,9
HST220410
Sparkling wine
-21,6
HST090240 Other black tea (fermented) and other partly
fermented tea
-44,9
HST090220
Other green tea (not fermented)
-48,9
HST090300
Maté
-88,6
Source: Quantec EasyData (2016)

30
Main imported beverage products and the source
Figure 3.9 illustrates the share of continents as a source of beverage import in 2016: Q4.
Europe, which accounted 69% import share, was the largest source of beverage import
during 2014: Q4, followed by Africa (15%), while the Americas, Asia and Oceania altogether
accounted for 16% of the total beverages import during the period. Figure 3.10 shows that
during the past five years, Europe, followed by Africa, is the key source of beverages imports.
Both continents contributed to an average of 74% of the total beverages imports from 2011-
2016.
Source: Quantec EasyData (2016)
Source: Quantec EasyData (2016)
Africa
15%
Americas
11%
Asia
4% Europe
69%
Oceania
1%
Figure 3.9: The share of continent's as a source of beverages
import in 2016: Q4
0
10
20
30
40
50
60
70
80
90
2011: Q
4
2012: Q
1
20
12
: Q
2
2012: Q
3
2012: Q
4
2013: Q
1
2013: Q
2
20
13
: Q
3
2013: Q
4
2014: Q
1
2014: Q
2
2014: Q
3
2014: Q
4
2015: Q
1
2015: Q
2
2015: Q
3
2015: Q
4
2016: Q
1
2016: Q
2
2016: Q
3
2016: Q
4
Figure 3.10: The beverages import destination's share of the
continents
(2011 – 2016)
Africa Americas Asia Europe

31
Among the top trading regions, the EU (70%) still accounts as the largest share of beverages
import followed by SACU (Excluding SADC) (15%) and NAFTA (6%). Western Asia and SADC
(Excluding SACU) played a minor role as a source of import for beverages; they accounted
for 2% contribution each (see Figure 3.11).
Source: Quantec EasyData (2016)
Source: Quantec EasyData (2016)
SACU
(Excluding
RSA)
15% South America
5%
NAFTA
6%
Western Asia
2%
Western
Europe Rest
2% European
Union
70%
Figure 3.11: The share of top regions as a source of beverages
import in 2016: Q4
0
5
10
15
20
25
30
Un
ite
d K
ing
do
m
Fra
nc
e
Na
mib
ia
Au
stria
Ne
the
rla
nd
s
Ire
lan
d
Arg
en
tin
a
Be
lgiu
m
Me
xic
o
Ge
rma
ny
%
Figure 3.12: The share of top ten countries as a source of
beverages import in 2016: Q4

32
Figure 3.12 shows the share of the top ten countries as a source of beverages import in 2016:
Q4. Five of the top ten countries that contributed to the share of import beverages in the
world are from the European countries: United kingdom (25,%), France (19,1%) the
Netherlands (4,1%), Belgium (3,0%) and Germany (2,8%), while two are from Latin America,
another two from Oceania, Ireland (4,0%) and Austria (4,2%) and Namibia from Africa
(14,0%).
Table 3.5: Main imported beverages in 2016: Q4
HS Code Food product Total amount (R
million)
HST220830
Whiskies
601,1
HST220300
Beer made from malt
349,0
HST220210 Waters, including mineral waters and aerated
waters, containing added sugar or other
sweetening matter or flavoured
231,4
HST220820 Spirits obtained by distilling grape wine or
grape marc 122,1
HST220410
Sparkling wine
106,5
HST090240 Other black tea (fermented) and other partly
fermented tea
99,0
HST220870
Liqueurs and cordials
62,6
HST220860
Vodka
35,0
HST220710 Undenatured ethyl alcohol of an alcoholic
strength by volume of 80% vol. or higher
27,6
HST220600 Other fermented beverages (for example,
cider, perry, mead); mixtures of fermented
beverages and mixtures of fermented
beverages and non-alcoholic beverages, not
elsewhere specified or included.
26,5
HST220850
Gin and Geneva
21,3
HST220840 Rum and other spirits obtained by distilling
fermented sugar cane products
14,8
HST220900 Vinegar and substitutes for vinegar obtained
from acetic acid
9,5
HST220110
Mineral waters and aerated waters
7,9
HST090230 Black tea (fermented) and partly fermented 5,9

33
tea, in immediate packings of a content not
exceeding 3 kg
HST090210 Green tea (not fermented) in immediate
packings of a content not exceeding 3 kg
4,1
HST090220
Other green tea (not fermented)
2,8
Source: Quantec EasyData (2016)
Source: Quantec EasyData (2016)
During 2016: Q4, the quarter-to-quarter exports of beverages rebounded by 7,4% as
compared to a contraction of 1,2% recorded in the previous quarter. However, it inreased
marginally by 2,6% year-on-year. On the other hand, the quarter-to-quarter imports
decelerated by 7,9% following a 33,1% growth in the last quarter and increased marginally
by 5,6% year-on-year. As a result, the trade surplus of the beverages division expanded from
R2 008,4 million in the previous quarter to R2 478,0 million during 2016: Q4 (see Figure 3.13).
0
500
1 000
1 500
2 000
2 500
3 000
3 500
4 000
4 500
5 000
20
12
: Q
4
20
13
: Q
1
20
13
: Q
2
20
13
: Q
3
20
13
: Q
4
20
14
: Q
1
20
14
: Q
2
20
14
: Q
3
20
14
: Q
4
20
15
: Q
1
20
15
: Q
2
20
15
: Q
3
20
15
: Q
4
20
16
: Q
1
20
16
: Q
2
20
16
: Q
3
20
16
: Q
4
R m
illio
n
Figure 3.13: Quarterly trade balance of beverages
Export Import

34
3.6 EMPLOYMENT
Source: Quantec EasyData (2016i)
Figure 3.14 shows the number of formal employment of beverages and tobacco products
industry. The quarter-to-quarter of formal employment of beverages and tobacco products
divisions increased marginally by 1,9% following a growth of 1,5% in the previous quarter.
However, the year-on-year and formal employment of beverage and tobacco products
moderated by 2,6% as compared to a 5,6% growth registered in the preceding quarter. As a
result, the total number of formal employment in beverages and tobacco products industries
increased from 42 783 in the previous quarter to 43 592 in 2016: Q4.
3.7 OUTLOOK
Table 3.6: Net balance of BER manufacturing survey: Beverages
2016: Q2 2016: Q3 2016: Q4 2017: Q1*
Domestic sales volumes 36 91 49 30
Export sales volumes 92 80 -57 -3
Production volumes 83 86 16 31
Domestic order volumes received 35 90 40 57
Export order volumes received 92 67 -42 2
37 000
38 000
39 000
40 000
41 000
42 000
43 000
44 000
45 000
2015: Q
2
2015: Q
3
2015: Q
4
20
16
: Q
1
2016: Q
2
2016: Q
3
2016: Q
4
Figure 3.14: Number of formal employment: beverage and
tobacco products

35
2016: Q2 2016: Q3 2016: Q4 2017: Q1*
General business conditions 9 5 -43 -52
Number of factory workers 7 2 15 19
Fixed investment 2 89 40 16
Business confidence 64 88 44
Expected volume of goods imported in
12 months’ time 40 -68 31
Expected volume of goods exported in
12 months’ time 97 91 48
Expected real investment in machinery
and equipment in 12 months’ time 63 2 30
Expected business conditions in 12
months’ time -26 56 -69
*Expected Source: BER (2016)
The survey of the beverages division by BER shows that the year-on-year outlook for 2017: Q1
is positive for all variables except export volumes and general business conditions.
4. CONCLUSION
The global economic activity has witnessed improvement in 2016: Q4, which was observed in
developed economies. The economic performance with respect to emerging market and
developing economies has remained mixed. However, during 2016: Q4, the South African
economy contracted at an annualised rate of 0,3%, following a marginal growth of 0,4% in
the preceding quarter.
During the period, the share of continents as a source of food exports was largely constituted
by Africa, then Asia and Europe. On the other hand, Europe, followed by Asia and the
Americas, constituted a huge share of continents share of food imports whereas Oceania
and Africa constituted a minimal share.
In terms of beverages, Africa, Asia and Europe contributed a large share of beverages
exports during the period, whereas Europe, followed by Africa then the Americas constituted
a huge share of beverages imported during the period to a total of 95% combined.
During 2016: Q4, the seasonally adjusted physical volume of production of the food and
beverages industry stagnated by 1,4% quarter-to-quarter, however, it decelerated by 2,9%
following a 0,3% contraction previously. Sales for food and beverages moderated by 0,5%
from a 3,0% growth recorded in the last quarter, representing a nominal value increase of
R30 826 697 in the current period from R30 658 186 million in 2016: Q3. Despite the stagnant
growth in physical volume of production, the trade deficit of food and beverages widened
by R933,4 million in the current period of review from a R525,2 million registered in the last
quarter.

36
The employment in the food and beverages and tobacco industry rebounded by 3,4%
quarter-to quarter and moderated by 7,1% year-on-year. This represents 244 448 jobs created
in the current period as compared to 240 278 jobs created previously. This quarterly review
assesses the economic performance of the food and beverages industry, given a moderate
global economic growth and a contraction of domestic economic activities recorded
during 2016: Q4.

37
5. REFERENCES
BER (2016), Manufacturing Survey. Bureau for Economic Research, University of Stellenbosch.
Quantec EasyData (2015), RSA International Trade. Accessed in December 2016.
IMF (2017), Global prospects and policies, April 2017. International Monetary Fund.
Reserve Bank (2017), Quarterly Bulletin, March 2017, South African Reserve Bank.
Statistics SA (2016a), Consumer Price Index, various issues. Statistics South Africa.
Statistics SA (2016b), Producer Price Index, various issues. Statistics South Africa.
Statistics SA (2016c), Export and Import Unit Value Indices, various issues. Statistics South
Africa.
Statistics SA (2016d), Manufacturing: Production and Sales, various issues. Statistics South
Africa.
Statistics SA (2016e), Manufacturing: Utilisation of Production Capacity by Large Enterprises.
Statistics South Africa.
Statistics SA (2016f), Wholesale Trade Sales, various issues, Statistics South Africa.
Statistics SA (2016g), Retail Trade Sales, various issues, Statistics South Africa.
Statistics SA (2016h), Food and Beverages, various issues, Statistics South Africa.
Statistics SA (2016i), Quarterly Employment Statistics, various issues. Statistics South Africa.

38
NOTES
--------------------------------------------------------------------------------------------------------------------------------------
--------------------------------------------------------------------------------------------------------------------------------------
--------------------------------------------------------------------------------------------------------------------------------------
--------------------------------------------------------------------------------------------------------------------------------------
--------------------------------------------------------------------------------------------------------------------------------------
--------------------------------------------------------------------------------------------------------------------------------------
--------------------------------------------------------------------------------------------------------------------------------------
--------------------------------------------------------------------------------------------------------------------------------------
--------------------------------------------------------------------------------------------------------------------------------------
--------------------------------------------------------------------------------------------------------------------------------------
--------------------------------------------------------------------------------------------------------------------------------------
--------------------------------------------------------------------------------------------------------------------------------------
--------------------------------------------------------------------------------------------------------------------------------------
--------------------------------------------------------------------------------------------------------------------------------------
--------------------------------------------------------------------------------------------------------------------------------------
--------------------------------------------------------------------------------------------------------------------------------------
--------------------------------------------------------------------------------------------------------------------------------------
--------------------------------------------------------------------------------------------------------------------------------------
--------------------------------------------------------------------------------------------------------------------------------------
--------------------------------------------------------------------------------------------------------------------------------------
--------------------------------------------------------------------------------------------------------------------------------------
--------------------------------------------------------------------------------------------------------------------------------------
--------------------------------------------------------------------------------------------------------------------------------------
--------------------------------------------------------------------------------------------------------------------------------------
--------------------------------------------------------------------------------------------------------------------------------------
--------------------------------------------------------------------------------------------------------------------------------------
--------------------------------------------------------------------------------------------------------------------------------------
--------------------------------------------------------------------------------------------------------------------------------------
--------------------------------------------------------------------------------------------------------------------------------------
--------------------------------------------------------------------------------------------------------------------------------------
--------------------------------------------------------------------------------------------------------------------------------------
--------------------------------------------------------------------------------------------------------------------------------------
--------------------------------------------------------------------------------------------------------------------------------------
--------------------------------------------------------------------------------------------------------------------------------------
--------------------------------------------------------------------------------------------------------------------------------------
--------------------------------------------------------------------------------------------------------------------------------------
--------------------------------------------------------------------------------------------------------------------------------------
--------------------------------------------------------------------------------------------------------------------------------------
--------------------------------------------------------------------------------------------------------------------------------------
--------------------------------------------------------------------------------------------------------------------------------------
--------------------------------------------------------------------------------------------------------------------------------------
--------------------------------------------------------------------------------------------------------------------------------------