quarterly consumer credit trends: mortgages to first-time ... · have access to home loans...
TRANSCRIPT

CONSUMER FINANCIAL PROTECTION BUREAU | FEBRUARY 2019
QUARTERLY CONSUMER CREDIT TRENDS
Mortgages to First-time Homebuying Servicemembers
1 CONSUMER FINANCIAL PROTECTION BUREAU
This is part of a series of quarterly reports on consumer credit trends produced by the Consumer Financial Protection Bureau using a longitudinal, nationally-representative sample of approximately five million de-identified credit records from one of the three nationwide consumer reporting agencies.∗
∗ Report prepared by Jasper Clarkberg and Patrick Lapid in the Office of Research.

2 CONSUMER FINANCIAL PROTECTION BUREAU
Servicemembers1 have access to home loans guaranteed by the U.S. Department of Veterans Affairs (VA) and offered through private lenders. VA-guaranteed home loans differ from other mortgages in several ways including allowing a purchase with no down payment2 and without mortgage insurance, and providing stronger loan-servicing protections3 than many other mortgages. However, VA-loan borrowers generally pay a loan funding fee and may be required to meet residual-income and other eligibility rules specific to the VA program.4
This Quarterly Consumer Credit Trends report uses the Consumer Financial Protection Bureau’s (Bureau) Consumer Credit Panel (CCP) to describe mortgages to servicemembers who are first-time homebuyers,5 focusing on how their home loan choices have evolved from 2006 to 2016. Prior Bureau work has documented that home purchases were primarily financed with conventional loans during the housing boom, followed by a rise in the share of nonconventional home-purchase mortgages in the years following the collapse of the housing market.6 This report focuses specifically on VA loans and finds a similar increase in the share of VA loans during the housing crisis. This increase persisted through at least 2017, in contrast to a decline in nonconventional loans among non-servicemembers in recent years. This report also looks at differences in servicemembers’ home loan choices by credit score and differences in median loan amounts and short-run delinquency outcomes for servicemembers compared with non-servicemembers.
1 This report uses the term “servicemember” as those who are training for, serving in, or have previously served in the
uniformed services, as defined in 10 U.S.C. § 101(a)(5).
2 “[N]early 90% of VA-backed loans are made with no down payment.” U.S. Department of Veterans Affairs (2018). Available at https://www.va.gov/housing-assistance/home-loans/.
3 These protections range from VA-provided loan counseling and assistance working with loan servicers, to VA’s authority to force a loan servicing transfer or servicing the loan in-house.
4 The funding fee ranges from 1.25 to 3.3 percent for home purchase loans, depending on veteran status, down-payment size, and first or subsequent use of VA loan benefits. The fee is waived for applicants with a service-connected disability. Other details on VA home loan benefits, costs, and eligibility requirements are available at https://www.va.gov/housing-assistance/home-loans/.
5 This report defines “first-time homebuyer” as individuals who open a new home loan anytime between 2006 and 2016, and do not have a prior home loan tradeline on their credit report as of the first quarter of 2006. This is stricter than the definition used by many first-time homebuyer assistance programs, which include anyone who has not owned a home in the previous three years.
6 These observations are based on Home Mortgage Disclosure Act (HMDA) data. “Data Point: 2017 Mortgage Market Activity and Trends”, Consumer Financial Protection Bureau (HMDA Report, 2018), Figure 2. Available at https://www.consumerfinance.gov/data-research/research-reports/cfpb-data-point-mortgage-market-activity-and-trends/.
3 CONSUMER FINANCIAL PROTECTION BUREAU
These developments in home loans and other consumer financial products marketed toward and used by servicemembers are of interest to the Bureau, including its Offices of Research7 and Servicemember Affairs.8 This report is the first description and analysis (to our knowledge) of servicemembers’ mortgage choices, both during and after the housing crisis. Understanding those choices is important to the Bureau’s mission which includes educating and empowering servicemembers to make better informed financial decisions regarding consumer financial products and services and coordinating governmental efforts relating to consumer financial products and services offered to servicemembers and their families. Additionally, understanding the extent to which servicemembers use VA mortgages9 may be of interest to policymakers responsible for the various governmental mortgage programs.
To distinguish credit records for servicemembers from non-servicemembers in the CCP,10 the nationwide consumer reporting agency from whom CCP data are procured matched credit records in the CCP to the Department of Defense’s Servicemembers Civil Relief Act (SCRA) database.11 The nationwide consumer reporting agency then provided two new categories in the Bureau’s CCP from the SCRA database: if an individual ever served in the armed forces after September 1985, and any dates of active duty service between 2008 and 2017.
However, a limitation of the SCRA match to the CCP is that it does not contain information on active duty service before September 1985. As a consequence, the SCRA database will match relatively fewer older consumers in the CCP; credit records matched to older servicemembers will be biased toward those with longer military careers. The share of servicemembers in 2017 in the SCRA-CPP match is five to six percent for age cohorts under age 54 in 2017, but falls to slightly less than four percent for those between 55 and 57, and decreases to an average of a little more than one percent for those 58 or older.
7 Dodd-Frank Wall Street Reform and Consumer Protection Act, Pub. L. No. 111–203 (2010), § 1013(b)(1), codified at
12 U.S.C. § 5493(b)(1).
8 The Office of Servicemember Affairs is responsible for consumer financial protection initiatives focused on servicemembers and their families. See 12 U.S.C. § 5493(e).
9 VA home loan eligibility is dependent on minimum service requirements, available at https://www.va.gov/housing-assistance/home-loans/eligibility/.
10 The Bureau’s CCP is a 1-in-48 sample of de-identified consumer credit profiles. The data contain detailed information on the balances and payment status of loans and other debts held by consumers in the panel.
11 50 U.S.C. §§ 3901-4043. The SCRA provides financial and housing protections to servicemembers on and ordered to active duty. General information about the SCRA can be found at https://www.justice.gov/servicemembers/financial-and-housing-rights. Servicemembers and firms can use the SCRA database to certify active duty status. The SCRA database can be accessed at https://scra.dmdc.osd.mil/

4 CONSUMER FINANCIAL PROTECTION BUREAU
This report uses CCP quarterly archives from 2005 to 2017. Applying a cutoff of age 54 in 2017, all new homebuyers born on or after 1963 are included in the analysis. Sample individuals are therefore 42 years old or younger in 2005 (the first year for which quarterly CCP data are available for this report) and at most 45 years old in 2008 (the first year the SCRA-CCP match includes information on active-duty service).
Further, this report’s analysis is focused on servicemember and non-servicemember first-time homebuyers who take out a loan between 2006 and 2016: consumers whose credit record does not show any extant or preexisting mortgage as of the time they first appear in the CCP.12 The analysis further compares servicemembers who take out a home loan while on active-duty service to non-serving veterans, from 2008 onward.13 Lastly, this report focuses on three predominant categories of mortgages as identified in credit records:14 VA; other government-backed home loans, primarily Federal Housing Administration (FHA)-insured mortgages as well as loan programs administered by the U.S. Department of Agriculture (USDA);15 and conventional mortgages including those sold to one of the government-sponsored enterprises (e.g., Fannie Mae and Freddie Mac), those sold through private label securities, and those held on the balance sheet of the lender.
12 This report uses credit records starting in 2005; these records include terminated home loans back to 1998. A
misclassified borrower using these records would have to have taken out and terminated a mortgage before 1998, when they would have been 35 years old or younger.
13 This report uses the term “veteran” as a servicemember discharged or separated from active-duty service. Active-duty service is recorded in the CCP only from 2008 onward.
14 VA and other home loans can be distinguished in the CCP based on information on the account type. The National Mortgage Database, constructed jointly by the Federal Housing Finance Agency and the Bureau, merges administrative data on VA loans to similar de-identified credit-record data and finds very close alignment of the account-type information from the credit record data with matches to VA data.
15 USDA loan programs include those administered by USDA’s Farm Service Agency and Rural Housing Service. These loans are small in number and are included with FHA mortgages in the figures below, with the label “FHA/USDA”.

5 CONSUMER FINANCIAL PROTECTION BUREAU
TABLE 1: NEW HOME LOAN SHARES TO FIRST-TIME HOMEBUYERS AGES 42 OR YOUNGER, INCLUDING SERVICEMEMBER AND ACTIVE-DUTY SHARES, IN PERCENTAGE POINTS
(1) Time period
(2) First-time homebuyer share of all
new home loans
(3) Servicemember share of all first-time
homebuyers (in column 2)
(4) Active-duty share of all first-time homebuying
servicemembers (in column 3)
2006–2007 16 7.3 N/A
2008–2011 (housing crisis)
13 7.3 37
2012–2016 14 7.5 32
Table 1 shows that the servicemember and active-duty shares of first-time homebuyers have stayed relatively constant during the 2006–2016 study period. The share of all new mortgages in the CCP—that is, both purchases and refinances—that went to first-time homebuyers was 16 percent during 2006 and 2007, and decreased to 13 to 14 percent from 2008 to 2016 (Table 1, column 2). The servicemember share of all home loans to first-time homebuyers, shown in column 3, varied little across all time periods at just over seven percent. The servicemember share of first-time homebuyers is slightly higher than the five to six percent servicemember share of consumers in the CCP. About one-third of these first-time homebuying servicemembers took out their home loan while on active duty.16
16 Active-duty status for servicemembers is only known in the CCP from 2008 onward.

6 CONSUMER FINANCIAL PROTECTION BUREAU
FIGURE 1: HOME LOAN SHARES AMONG FIRST-TIME HOMEBUYERS AGES 42 OR YOUNGER, BY SERVICEMEMBER STATUS AND LOAN TYPE, 2006-2016, YEARLY
As noted in the Bureau’s HMDA Report and from other sources, there was a sharp drop in the share of new conventional mortgage originations after 2007, 17 and this report’s analysis of the CCP parallels those findings. Figure 1 shows that, for servicemembers (left panel), there was a large increase in the share of VA loans and a relatively smaller increase in the FHA/USDA share. About 30 percent of loans to first-time homebuying servicemembers were VA loans before 2007, and this share increased sharply to 63 percent by 2009, then rose more gradually to 78 percent in 2016. Conventional home loan use was widespread among servicemembers before 2008, but the conventional-loan share fell to about 13 percent of first-time homebuying servicemembers by 2016. A small share of servicemembers during this period used FHA/USDA loans for their first home; the share of FHA/USDA loans to servicemembers peaked in 2008 at 21 percent and then fell back to 10 percent by 2016.
Among non-servicemembers (right panel of Figure 1), conventional home loans made up almost 90 percent of new home purchases before 2008. By 2009 the conventional share of loans to non-servicemembers fell to 41 percent, with FHA/USDA loans making up the majority share of non-servicemember mortgages from 2009 to 2011. From 2013 onward, the FHA/USDA share hovered below 40 percent. During this period, a small fraction of non-servicemembers also
17 Supra n. 6; see, e.g., the U.S. Census Bureau’s Survey of Construction, “Houses Sold by Type of Financing”;
available at https://www.census.gov/construction/nrs/pdf/soldfinca.pdf
7 CONSUMER FINANCIAL PROTECTION BUREAU
participated in VA loans, either as a joint buyer with a servicemember co-borrower, or as a surviving spouse of a servicemember.
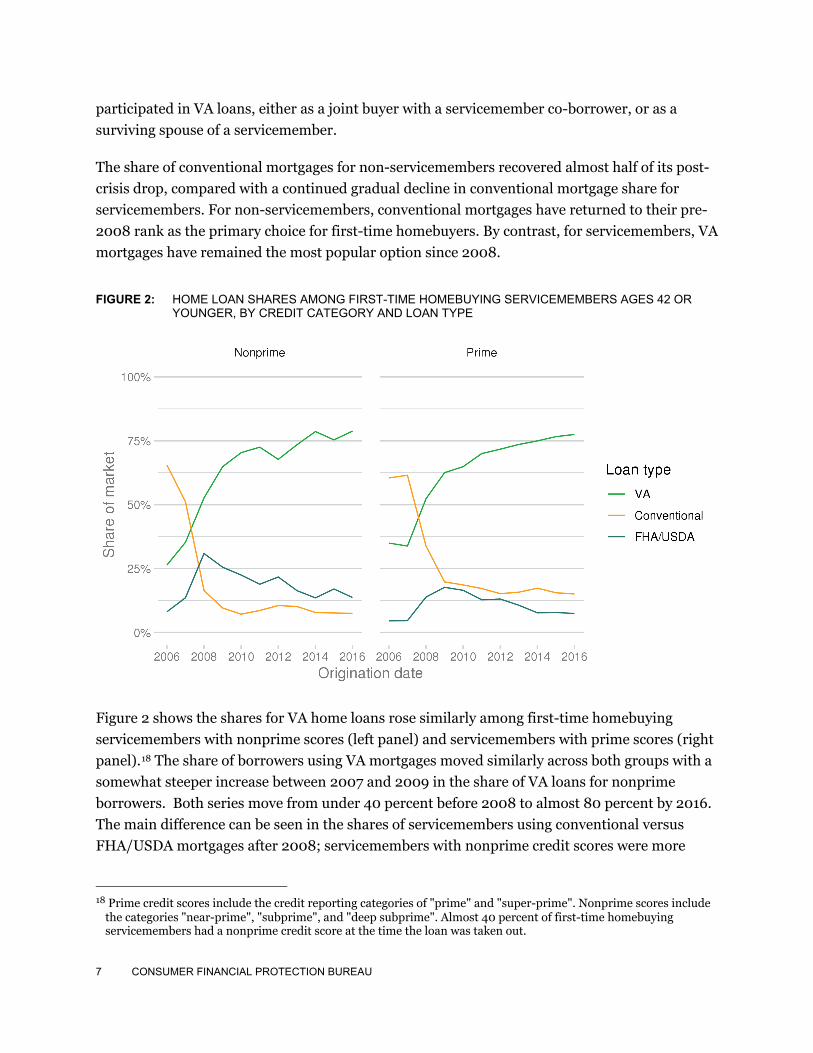
The share of conventional mortgages for non-servicemembers recovered almost half of its post-crisis drop, compared with a continued gradual decline in conventional mortgage share for servicemembers. For non-servicemembers, conventional mortgages have returned to their pre-2008 rank as the primary choice for first-time homebuyers. By contrast, for servicemembers, VA mortgages have remained the most popular option since 2008.
FIGURE 2: HOME LOAN SHARES AMONG FIRST-TIME HOMEBUYING SERVICEMEMBERS AGES 42 OR YOUNGER, BY CREDIT CATEGORY AND LOAN TYPE
Figure 2 shows the shares for VA home loans rose similarly among first-time homebuying servicemembers with nonprime scores (left panel) and servicemembers with prime scores (right panel).18 The share of borrowers using VA mortgages moved similarly across both groups with a somewhat steeper increase between 2007 and 2009 in the share of VA loans for nonprime borrowers. Both series move from under 40 percent before 2008 to almost 80 percent by 2016. The main difference can be seen in the shares of servicemembers using conventional versus FHA/USDA mortgages after 2008; servicemembers with nonprime credit scores were more
18 Prime credit scores include the credit reporting categories of "prime" and "super-prime". Nonprime scores include
the categories "near-prime", "subprime", and "deep subprime". Almost 40 percent of first-time homebuying servicemembers had a nonprime credit score at the time the loan was taken out.
8 CONSUMER FINANCIAL PROTECTION BUREAU
likely to use a FHA/USDA versus conventional mortgage from 2008 onward; the reverse is true for servicemembers with prime credit scores.
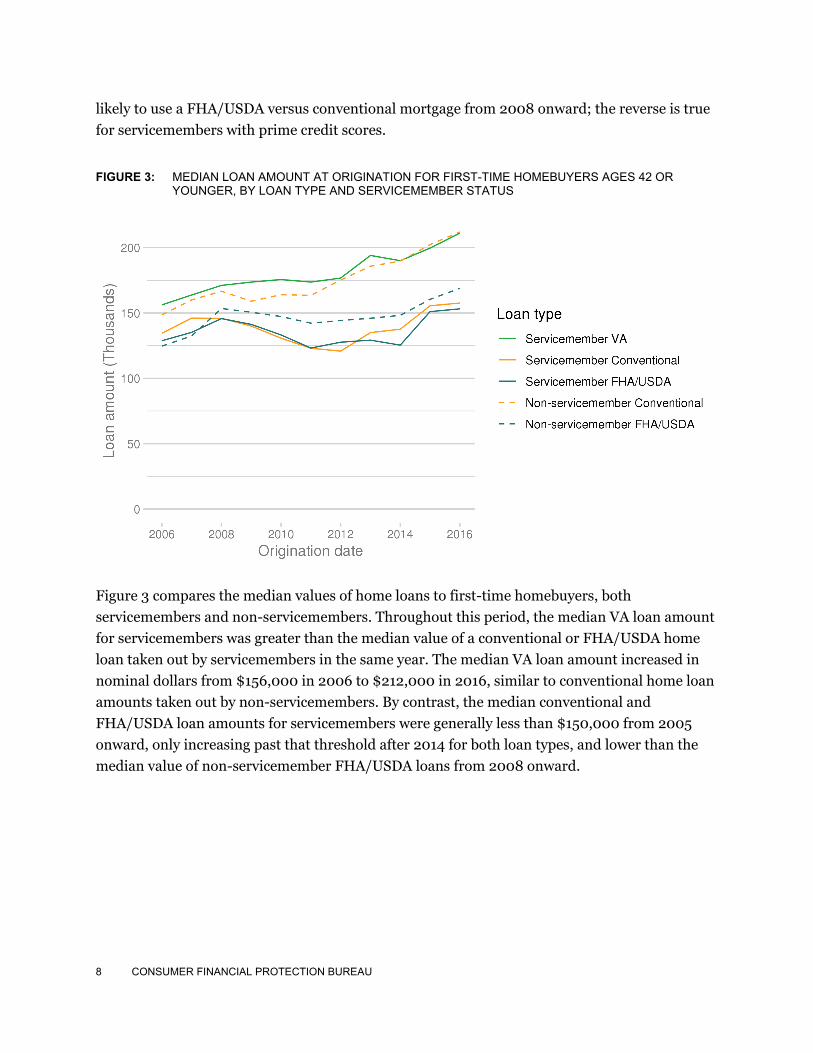
FIGURE 3: MEDIAN LOAN AMOUNT AT ORIGINATION FOR FIRST-TIME HOMEBUYERS AGES 42 OR YOUNGER, BY LOAN TYPE AND SERVICEMEMBER STATUS
Figure 3 compares the median values of home loans to first-time homebuyers, both servicemembers and non-servicemembers. Throughout this period, the median VA loan amount for servicemembers was greater than the median value of a conventional or FHA/USDA home loan taken out by servicemembers in the same year. The median VA loan amount increased in nominal dollars from $156,000 in 2006 to $212,000 in 2016, similar to conventional home loan amounts taken out by non-servicemembers. By contrast, the median conventional and FHA/USDA loan amounts for servicemembers were generally less than $150,000 from 2005 onward, only increasing past that threshold after 2014 for both loan types, and lower than the median value of non-servicemember FHA/USDA loans from 2008 onward.

9 CONSUMER FINANCIAL PROTECTION BUREAU
FIGURE 4: DELINQUENCIES IN THE FIRST 12 MONTHS AFTER ORIGINATION FOR FIRST-TIME HOMEBUYERS AGES 42 OR YOUNGER, BY SERVICEMEMBER STATUS, CREDIT CATEGORY, AND LOAN TYPE
Figure 4 examines early delinquency rates by loan origination year, as measured by the percent of loans 60 days or more delinquent within one year of origination, on loans taken out by borrowers age 42 or younger for different types of mortgages.19 Among nonprime borrowers (left panel), VA loan delinquency rates for servicemembers peaked in 2007 at approximately seven percent and fell to a little over three percent by 2016. By contrast, between 2006 and 2008, delinquency rates among nonprime borrowers were significantly higher for FHA/USDA loans to non-servicemembers as well as for conventional loans to both servicemembers and non-servicemembers. The delinquency rate of FHA/USDA loans to non-servicemembers with nonprime scores reached a peak of almost 11 percent in 2007, then fell to five percent in 2016. Conventional loans to nonprime borrowers, for both servicemembers and non-servicemembers, had delinquency rates greater than 13 percent in 2006, but fell under two percent by 2016. After 2009, conventional loans to all nonprime borrowers generally had lower delinquency rates
19 Excluded are VA loans originated to non-servicemembers in the main CCP sample, as well as FHA/USDA loans
originated to servicemembers, due to small sample sizes. Generally, servicemembers with FHA/USDA loans had delinquency rates similar to non-servicemembers with FHA/USDA loans, and higher delinquency rates than servicemembers with VA or conventional loans.

10 CONSUMER FINANCIAL PROTECTION BUREAU
(under five percent) than both VA loans to nonprime servicemembers and FHA/USDA loans to nonprime non-servicemembers.20
Delinquency rates for the first-time prime borrowers age 42 or younger (right panel of Figure 4) were, not surprisingly, considerably lower compared to nonprime borrowers. Among these prime borrowers, VA loans to servicemembers performed better than FHA loans to non-servicemembers during the study period (except in 2006): across origination years, the VA delinquency rate ranged from 0.3 to 1.3 percent, compared to 0.6 to 2.3 percent for FHA/USDA loans. Conventional loans’ delinquency rates for prime borrowers, both servicemembers and non-servicemembers, were higher than the delinquency rate for VA loans before 2008, ranging between 1.4 and 2.4 percent; but generally below the VA loan delinquency rate for loans originated after 2009.21
20 The Urban Institute has documented lower delinquency rates for VA versus FHA loans, across credit score and
income categories, while the Mortgage Bankers Association Delinquency Survey shows similar delinquency rates for VA and conventional loans, and higher rates for FHA loans. The slight differences in delinquency rates in this report may be due to the delinquency measure used (60 days or more in the first 12 months after home purchase in this report, compared to 90 days or more at any time after origination in the Urban Institute study). See Laurie Goodman, Ellen Seidman, and Jun Zhu (2014). “VA Loans Outperform FHA Loans. Why? And What Can We Learn?” Urban Institute (available at https://www.urban.org/research/publication/va-loans-outperform-fha-loans-why-and-what-can-we-learn); and Mortgage Bankers Association (2018). “MBA Chart of the Week: Mortgage Delinquency Rates, By Loan Type” (available at https://www.mba.org/publications/insights/archive/mba-insights-archive/2018/mba-chart-of-the-week-mortgage-delinquency-rates-by-loan-type).
21 This is true for conventional loans to non-servicemembers after 2009. Servicemembers who have conventional loans had zero delinquency rates from 2012 to 2014, but had rates higher than VA borrowers in 2010 to 2011 and 2015 to 2016.

11 CONSUMER FINANCIAL PROTECTION BUREAU
FIGURE 5: DELINQUENCIES FOR VA LOANS IN THE FIRST 12 MONTHS AFTER ORIGINATION FOR FIRST-TIME HOMEBUYING SERVICEMEMBERS AGES 42 OR YOUNGER, BY ACTIVE DUTY STATUS
Focusing on servicemembers with nonprime credit scores, Figure 5 (left panel) shows that servicemembers who applied for and paid their VA mortgage while on active duty have lower early delinquency rates (using the same 60-day delinquency measure in Figure 4) compared to veterans who take out a VA loan after separation from active-duty service. Delinquency rates are declining for both groups: from 5.9 percent in 2008 down to 2.7 percent in 2016 for active-duty borrowers, compared to 6.8 percent in 2008 down to 3.6 percent in 2016 for veteran borrowers. Among prime borrowers (right panel), delinquency rates for all origination years are all below one percent for VA loans, and there is no material difference in VA loan performance for active-duty versus veteran servicemembers.
The addition of SCRA data to the CCP will enable Bureau researchers to continue to study servicemembers’ experiences with consumer credit products and how servicemembers’ and their families’ credit outcomes may be affected when they transition to active duty or are separated from military service.