quarterly bulletin 2013-ii - central bankcentralbank.cw/uploads/files/quarterly bulletin...
TRANSCRIPT

1
QUARTERLY BULLETIN 2013-2
Centrale Bank van Curacao en Sint Maarten

2
REPORT OF THE PRESIDENT The global economy continued to experience modest growth during the second quarter of 2013 with the U.S. economy expanding below its potential, the euro area encountering a recession, and growth slowing down in the emerging economies. Amid these international developments, the Curaçao economy shrank by 0.3% in the second quarter of 2013 compared to a contraction by 0.2% in the second quarter of 2012. Inflationary pressures in Curaçao eased during the period under review with the quarterly inflation rate dropping from 4.3% in the second quarter of 2012 to 2.1% in the second quarter of 2013. This deceleration was due largely to a decline in fuel prices, mitigated by higher electricity prices. The annualized inflation rate eased as well to 2.3% at the end of June 2013 compared to 2.9% at the end of March 2013. Real GDP growth could not be estimated for Sint Maarten in the second quarter of 2013 because of a lack of data. Nevertheless, the available real sector and balance of payments data indicate that private sector activity in Sint Maarten grew by 0.4% in the second quarter of 2013, a slowdown compared to the expansion of 0.6% registered in the second quarter of 2012. The quarterly inflation in Sint Maarten eased to 2.1% during the June quarter of 2013 in response to smaller increases in the prices of food. The annualized inflation rate dropped also from 3.2% at the end of March 2013 to 2.4% at the end of June. The economic contraction in Curaçao was the result of a decline in domestic demand, reflected by lower private demand mitigated by an increase in public demand. Both private consumption and investment fell. The decline in consumer spending can be attributed to government measures including the increase in social premiums and contributions and the differentiation in sales tax rates. The development in consumer spending coincided with the decline in consumer loans extended in the second quarter of 2013. Meanwhile, government spending rose as a result of increases in both public consumption and investment. In contrast, net foreign demand had a positive impact on real GDP as imports dropped in real terms, mitigated somewhat by a decline in exports. A review of the sectoral performance shows that 2013’s second-quarter contraction in Curaçao was ascribable mainly to the wholesale & retail trade and the financial services sectors. Activities dropped in the wholesale & retail trade sector because of a decline in the re-exports by the free-zone companies and lower private spending, mitigated by increased tourism activities. Real value added in the financial services sector dropped because of a decline in domestic financial services, reflected by a contraction in net interest income of the commercial banks. In contrast, international financial services improved as indicated by increased wages and salaries and other operational expenses. Output also shrank in the construction sector, reflecting a decline in private investments, mitigated by increased public sector investments in road infrastructure. Activities rose in the manufacturing, restaurants & hotels, transport, storage & communication, and utilities sectors during the second quarter of 2013, albeit at a slower pace than in the second quarter of 2012. In the manufacturing industry, production increased because of more refining activities in the Isla refinery, mitigated by the poor performance of the Curaçao dry-dock company. The gain in the restaurants & hotels sector stemmed from more stay-over and cruise tourists. The increase in stay-over tourism was supported by more visitors from North and South America, owing to,

3
among other things, increased airlift and more marketing efforts in these regions. The European market continued to perform poorly due mainly to a decline in the number of Dutch visitors, the result of the economic recession in the Netherlands. Real value added in the transport, storage & communication sector rose in the second quarter of 2013 as a result of increased activities at the airport and the harbor of Curaçao. However, the growth in these industries was less pronounced than in the second quarter of 2012. Activities at the airport weakened as reflected by a slower growth in total passenger traffic. Meanwhile, the harbor posted an increase in oil storage activities and the number of ships piloted into the port, mitigated by fewer cargo movements. However, the expansion in the utilities sector was backed by increased water production. In Sint Maarten, private sector activities grew, supported primarily by gains in the manufacturing, construction, and wholesale & retail trade sectors. Following a contraction in the second quarter of 2012, output picked up in the manufacturing sector, reflecting more repair activities on yachts that visited Sint Maarten. Activities in the construction sector were driven by increases in public and private sector investment. The expansion in the wholesale & retail trade sector stemmed from increased domestic spending, mitigated by less tourism spending. The utilities sector posted a growth due to more water production but moderated by a decline in electricity production. Real value-added growth in the restaurants & hotels sector of Sint Maarten remained flat during the second quarter of 2013 compared to the second quarter of 2012, as the number of stay-over tourists remained stable while the number of cruise tourists contracted. Growth remained muted in stay-over tourism as increases in the number of visitors from North America and the Caribbean were offset by declines in the number of South American and European visitors. Meanwhile, cruise tourism performed poorly during the April–June period of 2013 as reflected by a decline in both the number of cruise calls and cruise visitors. The transport, storage & communication sector also recorded zero-growth as an increase in airport-related activities was counterbalanced by a decline in activities at the harbor. The increase in airport-related activities reflected more passenger traffic at the airport. Meanwhile, the poor outcome at the harbor was caused by a decline in the number of ships that visited the port of Philipsburg. In line with the official instruction given by the Kingdom Council of Ministers in 2012, the Curaçao government continued with the implementation of fiscal consolidation measures during the second quarter of 2013. The aim of these measures is to structurally balance the current account of the budget. Therefore, the government introduced a further differentiation of the sales tax in May 2013. The deficit of the Curaçao government narrowed in the second quarter of 2013 compared to 2012’s second quarter, resulting primarily from a decline in expenditures combined with increased revenues. The decline in expenditures was attributable to a drop in wages & salaries, mitigated by higher outlays on goods and services. Meanwhile, revenues rose slightly driven by increased tax receipts, the result of more earnings from the profit tax and sales tax, moderated somewhat by declines in excises on gasoline and import duties. The provision of complete, accurate, and timely statistics of the public finances continues as a major challenge for Sint Maarten. Again, as with the first quarter, expenditure data for Sint Maarten for the April–June period of 2013 were not available. Consequently,

4
only the development in government revenues could be analyzed. The available data indicate that revenues increased by 1% during the second quarter of 2013 compared to the second quarter of 2012, driven by a growth in turnover tax, income from business licenses, and profit tax. By contrast, revenues from excises on gasoline and nontax revenues dropped. In the external sector, the current account of the balance of payments for the monetary union recorded a lower deficit in the second quarter of 2013 than in the second quarter of 2012, reflected by a rise in exports of goods and services combined with a decline in imports. By contrast, both the income and current transfers balances deteriorated. Exports rose due mainly to more foreign exchange earnings from bunkering activities and transportation services. Moreover, the collected refining fee increased reflecting, among other things, more production activities at the Isla refinery in Curaçao. Export growth was partially offset, however, by a decline in re-exports by the free-zone companies in Curaçao reflecting lower foreign demand, notably from Venezuela. The decline in imports was caused mainly by lower merchandise imports, particularly by the free-zone companies in Curaçao. The current account deficit was financed primarily by the transfer of funds by foreign companies to their local bank accounts and net trade credits received on imports. Furthermore, net direct investments into the monetary union increased due largely to increased claims of foreign direct investors on their subsidiaries in Curaçao and Sint Maarten. By contrast, net portfolio investments abroad increased, largely because institutional investors purchased more foreign securities. Because the financing from abroad exceeded the current account deficit, the balance of payments recorded a surplus in the second quarter of 2013 reflected by an increase in the gross international reserves of the central bank. The money supply contracted in the second quarter of 2013 due to a decline in net foreign assets. The latter decline was mainly the result of a drop in the market value of the gold reserves of the central bank. In contrast, net domestic assets expanded, attributable to the net withdrawal of deposits from the banking system by the governments of both Curaçao and Sint Maarten. Furthermore, miscellaneous balance sheet items rose because of the revaluation of the gold reserves. The increase in net domestic assets was mitigated, however, by a decline in net credit extension to the private sector. The latter decline was the result of a drop in loans extended in both Curaçao and Sint Maarten. During the second quarter of 2013, the Bank continued to direct its monetary policy to the tightening of the surplus in the money market, given the high deficit on the current account of the balance of payments and the declining trend in the international reserves. Consequently, the reserve requirement percentage was raised by 0.50 percentage point to 16.00%. Also, the Bank continued with the credit measure to bring the growth in private credit extension more in line with nominal economic growth. The other monetary policy instrument of the Bank, the auctioning of Certificates of Deposit (CDs) was deployed in a neutral way, aimed only at the refinancing of maturing CDs. However, to increase the attractiveness of the CD auctions, the Bank also offered maturities longer than the regular 1-month and 3-month terms. Since becoming autonomous countries within the Dutch Kingdom, both Curaçao and Sint Maarten have been facing several economic challenges. For both countries,

5
complying with the balanced budget rule, as agreed upon under the debt relief program, seems to be a major issue. In the case of Curaçao, the country was given an official instruction in 2012 as it had not complied with this rule in 2010 and 2011. Again in 2012, the balanced budget rule was not met. For Sint Maarten, the major issue has been to present and approve a balanced budget. Only after lengthy discussions with the financial supervisory board, CFT, was the 2013 budget signed into law in September 2013. Consequently, the focus of both countries has been primarily on how to comply with this rule. Structural measures to promote a macroeconomic environment conducive to growth seem to have been overshadowed by the priority given to sound public finances. Therefore, a more balanced policy agenda is urgently needed. Curacao’s recent unemployment figures underscore the need for more attention to the macroeconomic environment. In that context, we need to be more proactive in creating opportunities and adapting to changing economic conditions. For example, the United States has announced that as of 2014, it will implement the Foreign Account Tax Compliance Act (FATCA). The implementation of this act may have serious implications for our international financial services industry that already has been struggling for several years. While other jurisdictions have already signed FATCA agreements with the United States, Curaçao is lagging behind. Steps must be taken urgently to close an agreement with the United States soon. Although Sint Maarten has been posting some positive growth figures recently, improvement of the macroeconomic environment is crucial to make the economy less vulnerable to external shocks and to embark on a more stable economic growth path. Also, as mentioned on several occasions, Sint Maarten needs to improve the collection and publication of its public sector data. Without these data, it is not possible to devise adequate economic plans to address our needs and at the same time thoroughly assess the performance of the Sint Maarten economy. To contain domestic spending and import growth in light of the declining international reserves, the Bank has been increasing the reserve requirement percentage since 2011. Also, as of 2012, a temporary credit measure came into effect. So far, a moderation in the growth in private sector credit extension, a narrowing of the deficit on the current account of the balance of payments, and the declining trend in the international reserves has slowed. Nevertheless, the Bank has been emphasizing the importance of implementing structural measures by both countries to improve the balance of payments, given that the measures taken by the central bank are temporary in nature. An analysis of the current account data reveals that Curaçao as well as Sint Maarten experienced imbalances between 2007 and 2011. Conventional wisdom suggests that deficits above 4-5% of GDP are unsustainable. In the case of Sint Maarten, the current account deficit was above this benchmark during the period 2007 – 2010 but has been declining since 2008. In 2012, the deficit turned around into a surplus. In the case of Curaçao, the current account deficit was well above the benchmark during the entire period. In 2010, the current account deficit as a percentage of GDP worsened significantly and dropped only slightly afterwards. Hence, although both countries have been facing imbalances on the current account, the problem is bigger in Curaçao than in Sint Maarten. Nevertheless, both countries need to implement measures in a coordinated fashion to structurally strengthen their balance of payments for a more stable and higher growth path for their economies. E.D. Tromp

6
President INTERNATIONAL ECONOMIC DEVELOPMENTS
During the April-June period of 2013, the U.S. economy grew by 3.1% compared to the real GDP growth of 4.5% during the second quarter of 2012 (see Table 1). Growth resulted mainly from an increase in private demand, mitigated by a contraction in public demand. Business expenditures increased as a result of investments in inventory and capital goods. Meanwhile, home construction rose at a slower pace because of higher mortgage rates. Despite increasing payroll taxes, private consumption recorded moderate growth, reflecting mainly more automobile purchases. Public demand adversely affected the U.S. economy as federal government spending was further reduced, whereas state and local governments’ spending increased. In contrast, the improvement in net foreign demand contributed positively to the real GDP growth as export activity expanded and imports diminished slightly. The unemployment rate declined to 7.6% during the June quarter of 2013, but remained relatively high since the number of jobs created was not sufficient to cover the growing unemployed population. Also, the number of long-term unemployed and the number of workers employed part-time for economic reasons did not change significantly. The U.S. inflation rate declined to 1.7% in the April-June period of 2013, recording a lower level than the Federal Reserve’s long-term target of 2%. Based on the relatively low inflation rate and the high unemployment rate, the Federal Reserve maintained the federal funds rate near zero to stimulate the U.S. economy. Table 1 Selected indicators of various countries
United States Netherlands Venezuela
2012-II 2013-II 2012-II 2013-II 2012-II 2013-II
Real GDP (% change) 4.5 3.1 -0.7 -1.7 5.6 2.6
Consumer prices (%) 2.9 1.7 2.5 2.7 25.2 24.1
Unemployment rate (%) 8.2 7.6 5.1* 6.6* 8.0 7.5 Sources: US Bureau of Economic Analysis, US Bureau of Labor Statistics, Central Bureau of Statistics Netherlands, Banco Central de Venezuela, and Instituto Nacional de Estadística Venezuela. * International definition
Real GDP of the Netherlands shrank by 1.7% during the second quarter of 2013 compared to a contraction of 0.7% in the June quarter of 2012. The poor economic performance was caused by a decline in both private and public demand. The favorable contribution of net foreign demand to the economic growth was not sufficient to counterbalance the falling private and government expenditures. Public demand dropped mainly because of the tightened fiscal policy to reduce the Dutch budget deficit to the European Monetary Union’s (EMU) standard of 3%. Consequently, the government cut spending and reduced public investment, although spending on health care rose. Private consumption fell, due to a lower real disposable income as wages increased at a slower pace than the inflation rate. Moreover, declining house prices pushed more Dutch homeowners into a negative net wealth position as their property value recorded lower levels than their mortgage debt, which had a negative effect on private consumption. The decline in private consumption adversely impacted the construction and retail sectors in the Netherlands. However, the decline in private consumption was mitigated by higher gas consumption because of the cold spring period. Gross fixed investments declined, as decreasing capacity utilization reduced the urge to invest in replacing or expanding production capacity. Net foreign demand provided a positive contribution to Dutch real GDP growth because imports declined at a faster pace than exports. The unemployment rate in the Netherlands increased to 6.6% during the second quarter of 2013 mostly

7
because the unemployed population rose faster than job creation. Additionally, businesses were forced to dismiss employees due to the ongoing pressure on their capacity utilization and profitability. The Dutch inflation rate accelerated to 2.7% in the June quarter of 2013, owing to higher domestic petroleum prices, which were offset in part by declining food prices. The economy of Venezuela expanded by 2.6% in real terms in the second quarter of 2013, a deceleration compared to the economic growth of 5.6% in the second quarter of 2012. The economic slowdown resulted primarily from lower government spending after the elections in October 2012 and April 2013, and a deceleration in private consumption. Government spending on massive home-building, pensions for the elderly, and allowances for poor mothers contracted during the second quarter of 2013 compared to the second quarter of 2012. Private consumption decelerated due primarily to a deterioration in consumers’ purchasing power and political uncertainty, mitigated by monetary expansion, whereby consumer lending increased as commercial banks offered lower interest rates. In addition, frequent nationalizations and state controls made domestic companies skeptical about investing in their business operations. Growth in the financial and manufacturing sectors contributed positively to economic growth in Venezuela, mitigated by a deceleration in the oil, construction, and mining sectors. Venezuela is highly dependent on the oil sector as it represents 96% of exports and nearly half of fiscal revenues. Net foreign demand contributed negatively to the real GDP growth of Venezuela, as exports declined while imports decelerated. Export declined mainly as a result of a reduction in oil sales to the United States. Since oil shipments to the United States are paid in cash, this adversely affected the government’s cash position and the foreign exchange reserves of Venezuela. Furthermore, as businesses could hardly buy dollars officially, they were forced to turn to the black market at a much higher rate. Although Venezuela became increasingly dependent on imported products, new jobs were created domestically, resulting in a decrease of the unemployment rate to 7.5% during the second quarter of 2013. Limited access to foreign exchange and insufficient domestic production resulted in shortages of goods, the primary reason for the high inflation rate of 24.1% during the April-June period of 2013.
GENERAL ECONOMIC DEVELOPMENTS IN CURAÇAO Real GDP of Curaçao shrank by 0.3% in the second quarter of 2013 compared to a decline of 0.2% in the second quarter of 2012. The economic contraction during the June quarter of 2013 resulted primarily from a decrease in private demand, despite lower inflationary pressures (see Table 2). The inflation rate in Curaçao eased to 2.1% in the June quarter of 2013, attributable largely to falling food and fuel prices, mitigated by increasing electricity prices. An analysis of GDP by expenditures reveals that the economic contraction in Curaçao was caused primarily by a reduction in both private consumption and investment. Private consumption dropped for a number of reasons, , among them the measures taken by the government, including the increase in social premiums and contributions. In addition, private spending declined because of the shift of various products and services from the 6.0% to the 9.0% sales tax bracket along with fewer consumer loans extended by the commercial banks. In contrast, public demand rose due to an increase in government spending on goods and services, and investments. However, the growth in public

8
demand was not sufficient to offset the contraction in the private sector. Consequently, domestic demand contracted. Net exports contributed positively to the real GDP growth of Curaçao during the April-June period of 2013 as, in real terms, imports fell faster than exports. The decline in exports was reflected mainly by less re-exports of the free-zone companies, notably to Venezuela. In line with less free-zone exports, merchandise imports fell. Furthermore, lower average international oil prices contributed to the decline in the import bill. Table 2 GDP growth by expenditure*) (real percentage changes)
2012-II 2013-II
Domestic expenditure, of which: -0.9 -0.4
Private sector 1.0 -1.2
- Investment 1.1 -0.4
- Consumption -0.1 -0.8
Government sector -1.9 0.8
- Investment -0.1 0.3
- Consumption -1.8 0.5
Changes in inventory 0.3 -0.1
Foreign net expenditure 0.4 0.2
- Export of goods and services 1.4 -0.1
- Import of goods and services 0.9 -0.3
GDP -0.2 -0.3
Net primary income -1.4 -1.2
Gross national income -1.6 -1.5
Net current transfers from abroad 1.2 -0.4
Gross national disposable income -0.4 -2.0 Source: Estimates by the Centrale Bank van Curaçao en Sint Maarten.
*) Expenditure categories data are weighted contributors to GDP growth.
Domestic production From a sectoral perspective, the decline in activities in the private sector during the second quarter of 2013 was attributable mainly to the wholesale & retail trade, and the financial intermediation sectors (see Table 3). The decline in real value added in the wholesale & retail trade sector (-4.1%) in the second quarter of 2013 compared to the second quarter of 2012 was caused by fewer activities in the free-zone sector and lower domestic demand that outweighed the increase in stay-over tourism. The worsening of the free-zone performance was accompanied by a decline in the number of free-zone visitors, particularly from Venezuela, Colombia, Haiti, and Jamaica. Re-exports to Venezuela, which is one of the main markets, dropped significantly during the second quarter of 2013, mainly as a result of the currency restrictions in that country.
9
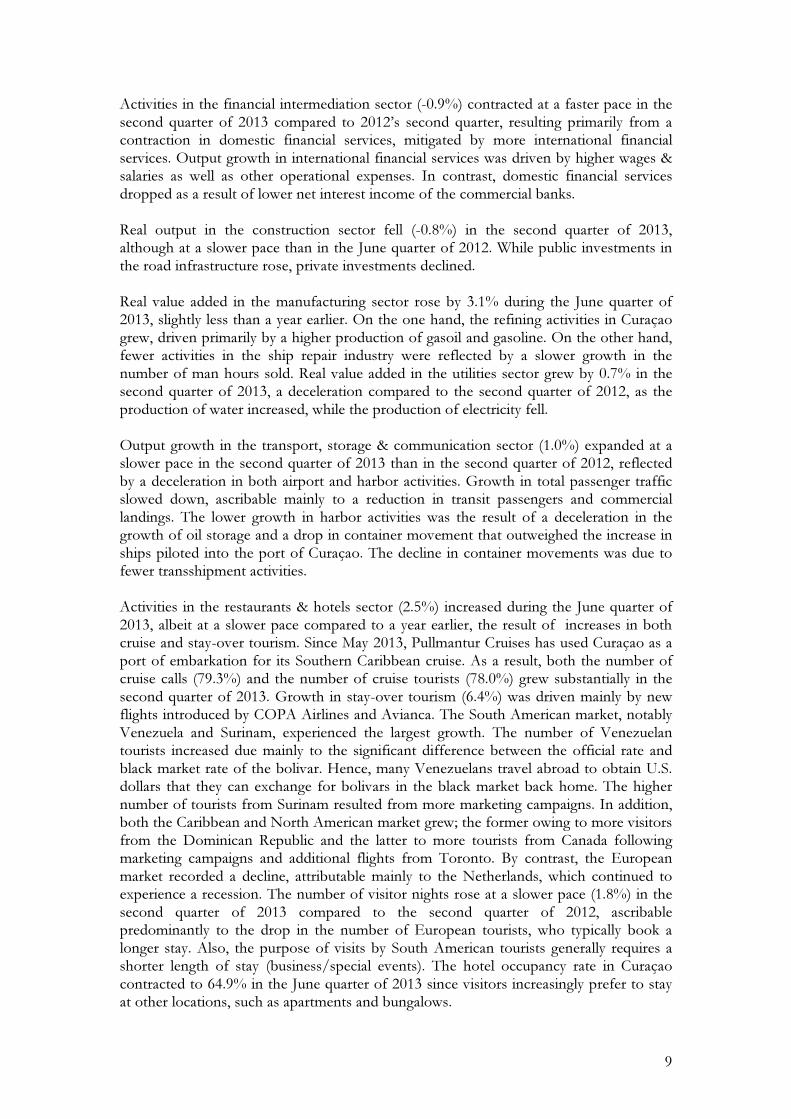
Activities in the financial intermediation sector (-0.9%) contracted at a faster pace in the second quarter of 2013 compared to 2012’s second quarter, resulting primarily from a contraction in domestic financial services, mitigated by more international financial services. Output growth in international financial services was driven by higher wages & salaries as well as other operational expenses. In contrast, domestic financial services dropped as a result of lower net interest income of the commercial banks. Real output in the construction sector fell (-0.8%) in the second quarter of 2013, although at a slower pace than in the June quarter of 2012. While public investments in the road infrastructure rose, private investments declined. Real value added in the manufacturing sector rose by 3.1% during the June quarter of 2013, slightly less than a year earlier. On the one hand, the refining activities in Curaçao grew, driven primarily by a higher production of gasoil and gasoline. On the other hand, fewer activities in the ship repair industry were reflected by a slower growth in the number of man hours sold. Real value added in the utilities sector grew by 0.7% in the second quarter of 2013, a deceleration compared to the second quarter of 2012, as the production of water increased, while the production of electricity fell. Output growth in the transport, storage & communication sector (1.0%) expanded at a slower pace in the second quarter of 2013 than in the second quarter of 2012, reflected by a deceleration in both airport and harbor activities. Growth in total passenger traffic slowed down, ascribable mainly to a reduction in transit passengers and commercial landings. The lower growth in harbor activities was the result of a deceleration in the growth of oil storage and a drop in container movement that outweighed the increase in ships piloted into the port of Curaçao. The decline in container movements was due to fewer transshipment activities. Activities in the restaurants & hotels sector (2.5%) increased during the June quarter of 2013, albeit at a slower pace compared to a year earlier, the result of increases in both cruise and stay-over tourism. Since May 2013, Pullmantur Cruises has used Curaçao as a port of embarkation for its Southern Caribbean cruise. As a result, both the number of cruise calls (79.3%) and the number of cruise tourists (78.0%) grew substantially in the second quarter of 2013. Growth in stay-over tourism (6.4%) was driven mainly by new flights introduced by COPA Airlines and Avianca. The South American market, notably Venezuela and Surinam, experienced the largest growth. The number of Venezuelan tourists increased due mainly to the significant difference between the official rate and black market rate of the bolivar. Hence, many Venezuelans travel abroad to obtain U.S. dollars that they can exchange for bolivars in the black market back home. The higher number of tourists from Surinam resulted from more marketing campaigns. In addition, both the Caribbean and North American market grew; the former owing to more visitors from the Dominican Republic and the latter to more tourists from Canada following marketing campaigns and additional flights from Toronto. By contrast, the European market recorded a decline, attributable mainly to the Netherlands, which continued to experience a recession. The number of visitor nights rose at a slower pace (1.8%) in the second quarter of 2013 compared to the second quarter of 2012, ascribable predominantly to the drop in the number of European tourists, who typically book a longer stay. Also, the purpose of visits by South American tourists generally requires a shorter length of stay (business/special events). The hotel occupancy rate in Curaçao contracted to 64.9% in the June quarter of 2013 since visitors increasingly prefer to stay at other locations, such as apartments and bungalows.

10
Table 3 GDP by sector (real percentage changes) Sector 2012-II 2013-II
Agriculture, fishery & mining -6.3 -1.2
Manufacturing 3.5 3.1
Electricity, gas & water 1.8 0.7
Construction -1.3 -0.8
Wholesale & retail trade -0.8 -4.1
Restaurants & hotels 3.9 2.5
Transport, storage & communication 3.1 1.0
Financial intermediation -0.3 -0.9
Real estate, renting & business activity -0.4 -0.6
Other community, social & personal services 4.7 -1.3
Private households -3.8 2.5
Total private sector 0.4 -0.2
Public sector -0.4 0.1
Taxes minus subsidies -0.2 -0.2
GDP -0.2 -0.3 Source: Estimates by the Centrale Bank van Curaçao en Sint Maarten.
Inflation Inflationary pressures in Curaçao eased from 4.3% in the second quarter of 2012 to 2.1% in the June quarter of 2013, driven predominantly by lower food and fuel prices, mitigated by higher electricity prices. Graph 1 Developments in consumer prices of Curaçao (annual quarterly change)
An analysis of the CPI components indicates that consumer prices decreased in the categories “Health” (-1.1%) and “Transport and communication” (-0.3%), the latter resulting primarily from a drop in domestic gasoline prices. In addition, consumer prices
0
5
10
15
20
25
30
0
1
2
3
4
5
6
7
8
9
10
11-II 11-III 11-IV 12-I 12-II 12-III 12-IV 13-I 13-II
Curaçao (l) US (l) Neth (l) Sint Maarten (l) Venezuela (r)

11
decelerated particularly in the categories “Food” (3.4%) and “Beverages & tobacco” (3.0%). The slowdown in the category “Food” was due mainly to lower prices for grain products. In contrast, inflationary pressures accelerated in the categories “Clothing and footwear” and “Housing”. Consumer prices in the “Housing” category increased, as a result of higher electricity prices, mitigated by lower water tariffs and property maintenance costs. (See Table 9A in the appendix.) GENERAL ECONOMIC DEVELOPMENTS IN SINT MAARTEN Due to a lack of government data, it was not possible to calculate the value added of the public sector of Sint Maarten during the second quarter of 2013. Consequently, the real GDP growth could not be estimated. However, it was possible to estimate the growth in the real value added of the private sector of Sint Maarten for the June quarter of 2013 based on real sector and balance of payments data. Private sector activity expanded by 0.4%, a deceleration compared to the growth of 0.6% in the second quarter of 2012. Meanwhile, inflationary pressures in Sint Maarten eased to 2.1% in the June quarter of 2013, driven primarily by a slowdown in food prices. The expansion in private sector activity can be attributed mainly to the manufacturing and construction sectors. Real value added growth in the manufacturing sector (9.7%) was supported by an increase in repair activities on yachts that visited Sint Maarten during the second quarter of 2013. Table 4 GDP by sector (real percentage changes) Sector 2012-II 2013-II
Agriculture, fishery & mining 0.0 0.0
Manufacturing -1.1 9.7
Electricity, gas & water 2.0 2.4
Construction 1.8 3.5
Wholesale & retail trade -0.5 0.3
Restaurants & hotels 5.0 0.0
Transport, storage & communication 0.2 0.0
Financial intermediation 0.7 -1.3
Real estate, renting & business activity -0.1 -0.2
Other community, social & personal services -0.9 1.0
Private households 3.7 -0.2
Total private sector 0.6 0.4
Public sector n/a n/a
Taxes minus subsidies n/a n/a
GDP 0.6 0.4 Source: Estimates by the Centrale Bank van Curaçao en Sint Maarten.
Activities in the construction sector (3.5%) grew at a higher pace during the June quarter of 2013 due to an increase in both public and private investments. Public investments

12
rose because of more infrastructure projects, including the construction of the Simpson Bay Lagoon Causeway. Growth in private investments was in line with a higher number of building permits issued. Output in the utilities sector increased at a faster pace (2.4%) during 2013’s second quarter as a result of an increase in water production and higher consumption of water and electricity. Real value added in the wholesale & retail trade sector rose slightly (0.3%), related to higher domestic spending moderated by lower tourism spending. Growth in the restaurants & hotels and transport, storage & communication sectors remained muted in the second quarter of 2013. Stay-over tourism remained flat compared to an expansion of 12.5% in the second quarter of 2012 as the increase in the North American and Caribbean markets was offset by a decrease in the South American and European markets. (See Table 8 in the appendix.) Growth in the North American market (1.5%) was ascribable mainly to more Canadian visitors. The number of visitors from the United States, Sint Maarten’s largest market, recorded a marginal increase. Visitors from the Caribbean market (3.2%) rose as a result of more tourists from the Dominican Republic and Trinidad & Tobago; the latter resulted largely from chartered flights. By contrast, the decrease in the South American market (-0.1%) was ascribable to fewer Venezuelan tourists, while the decline in the European market (-1.4%) was due primarily to fewer visitors from Denmark, Finland, Norway, Portugal, Spain, and Sweden. Meanwhile, the number of cruise tourists declined (-1.9%). In addition, the number of cruise calls diminished (-7.5%) due to fewer calls of U.S.-based cruise lines. Despite efforts by a number of hotels to offer special rates and all-inclusive packages, the hotel occupancy rate in Sint Maarten dropped to 57.3% during the April-June period of 2013. This result was related to visitors’ preference for other accommodations, including staying with friends or relatives, instead of hotels. Activities in the transport, storage & communication sector also remained muted in the June quarter of 2013 as increases in air transportation and airport-related activities were offset by a decline in harbor activities. Air transportation and airport-related activities increased because of more passenger traffic, notably transit passengers, while the number of commercial landings declined. At the same time, activities in the harbor decreased because of a decline in the number of ships piloted into the port. Finally, the financial intermediation sector put a drag on the real economic growth of Sint Maarten, driven by a reduction in the net interest income of commercial banks due to lower interest income along with higher interest expenses. Inflation The inflation rate in Sint Maarten fell from 4.0% during the April-June period of 2012 to 2.1% in the second quarter of 2013 and was primarily ascribable to a slowdown in food prices. An analysis of the CPI components shows that in the June quarter of 2013 inflationary pressures decelerated primarily in the categories “Food” (6.1%), “Beverages & tobacco” (3.1%), “Clothing & footwear” (0.8%), “Transport & communication” (0.4%), and “Recreation & education” (1.6%). Consumer prices for the category “Food” rose at a slower pace, as a result of a deceleration in the prices for meat and fish as well as dairy products. Prices in the “Transport & communication” category decelerated because of

13
lower transport costs while telecommunication costs increased. Meanwhile, the category “Health” recorded a slight drop. Prices in the “Housing” category remained stable, attributable to declining electricity prices and property maintenance costs, offset by increasing housing costs. In contrast, the increase in the category “Housekeeping & furnishings” (14.7%) was caused mainly by higher prices for household appliances and tools (See Table 9B in the appendix.) DEVELOPMENTS IN PUBLIC FINANCE Public finances Curaçao Over the course of the second quarter of 2013, the government of Curaçao continued with the implementation of a package of austerity measures aimed at structurally balancing the current account of the budget. On May 1, 2013, the government launched a further differentiation of the sales tax structure,1 complementing the new general health insurance system and the rise in the retirement age introduced in 2013’s first quarter. The major changes in the structure of the sales tax were a 9% levy on so-called ‘luxury goods & services,’ and a broadening of exempted basic commodities. The focus of Curaçao’s public administration on achieving fiscal consolidation should be seen in the context of the instruction received from the Kingdom Council of Ministers in 2012. Through this instruction, the Curaçao government was pressed to take immediate action to balance the current account of its 2012 budget and multiannual projections. However, as a consequence of repeated delays, the actual deployment of tightening fiscal policy did not take off until early 2013. According to the College Financieel Toezicht (CFT),2 Curaçao’s preliminary public finance data on the first half of 2013 suggest that the implemented measures will allow for a roughly balanced current account of the government budget by the end of the year. Still, in order to comply with the instruction, the Curaçao government will also have to run budget surpluses in the next two years that are large enough to make up for the budget deficits recorded in the period 2010-2012. Overall, the public finances of Curaçao improved during the second quarter of 2013 relative to the second quarter of 2012, evidenced by the NAf.49.8 million narrowing of the deficit on the current account of the government budget. This narrowing occurred because of a 9.4% decline in total expenditures and a 0.5% rise in total revenues. The decline in government outlays was due primarily to lower wage and salary disbursements that resulted from reduced pension premium payments to the public pension fund, APC. Spending on goods and services, on the other hand, recorded a rise in the second quarter of 2013, mitigating the fall in government spending. The marginal growth registered on the revenues side was triggered by moderate increases in income from profit tax and sales tax, albeit largely offset by a drop in excises on gasoline and import duties. The fall in the latter category was in line with the decline in imports of goods and services during the April-June period of 2013. (See Tables 10A and 10B in the appendix for an overview.) During the April-June period of 2013, the government of Curaçao covered its budget deficit by drawing down its deposits with the central bank as well as the commercial banks. This monetary funding was complemented by nonmonetary financing in the form of liabilities incurred with other creditors (see Table 5).
1 As a result of the sales tax differentiation, four different rates became applicable: 0%, 6%, 7% and 9%. 2 The College Financieel Toezicht (CFT) is the independent board of financial supervision in charge of monitoring the public finances of Curaçao and Sint Maarten.

14
Table 5 Financing of the budget balance of Curaçao (in millions NAf.) 2012-II 2013-II
Monetary financing 103.2 52.9 Central bank 148.3 10.0 Commercial banks -45.1 42.9 Nonmonetary financing 31.3 31.8 Government securities with the public 0.0 0.0 Other 31.3 31.8
Cash balance -134.5 -84.7
Public sector debt Curaçao In the second quarter of 2013, the outstanding public debt of the Curaçao government rose by a moderate NAf.4.7 million relative to the preceding quarter. Since the growth in public debt was outpaced by the growth in real GDP, Curaçao’s public debt-to-GDP ratio dipped by 0.1%, reaching 33.2% by the end of June 2013. Public finances Sint Maarten As a consequence of a lack of government expenditure data, the contribution of the public sector to the GDP growth estimated for Sint Maarten in 2013’s second quarter could not be established. For this reasons, the following analysis is based solely based on the revenues reported by the Sint Maarten government. During the second quarter of 2013, the government of Sint Maarten generated NAf.103.1 million in revenues, a 1% rise compared to the second quarter of 2012. This rise was primarily triggered by higher turnover tax proceeds, in line with the increase in economic activity on the island. Income from business licenses and profit tax also rose during 2013’s second quarter. Meanwhile, tax revenues from excises on gasoline dropped, as did nontax revenues, moderating the overall growth in government income in the April-June period of 2013. (See Tables 11A and 11B in the appendix for an overview.) DEVELOPMENTS IN THE BALANCE OF PAYMENTS OF THE
MONETARY UNION
During the second quarter of 2013, the deficit on the current account of the balance of payments of the monetary union narrowed by NAf.64.1 million compared to the second quarter of 2012. The smaller deficit was caused largely by an improvement in the services balance and to a lesser extent to an improvement in the trade balance, offset partly by deteriorations of the income and current transfers balances. External financing worsened at a slower pace, reflecting the lower current account deficit. Meanwhile, capital transfers dropped as the development aid from the Netherlands is being phased out. Because the capital inflow and external financing exceeded the current account deficit, the gross reserves of the central bank rose by NAf.14.0 million (see Table 6).

15
Table 6 Balance of payments summary (in millions NAf.) 2011-II 2012-II 2013-II
Current account -467.3 -372.4 -308.3 Capital transfers 24.6 11.9 9.1 External financing of the government 0.0 29.3 -6.5 External financing of the private sector 340.5 331.0 299.1
- Direct investment 64.6 24.7 145.8 - Loans and credits 285.6 -118.2 236.2 - Portfolio investments -9.7 424.5 -82.9
Change in gross reserves of the central bank*) 93.1 -38.1 -14.0
- Foreign exchange 66.4 -59.8 72.2 - held at foreign central banks 48.2 -212.5 159.8 - held at foreign commercial banks 18.2 152.7 -87.6 - Other claims 26.7 21.7 -86.2
Statistical discrepancies 9.1 38.8 20.5 *) A minus sign implies an increase.
Current account Net exports of goods and services in the monetary union rose by NAf.95.6 million during the second quarter of 2013 compared to the second quarter of 2012, as an increase in exports (NAf.72.9 million) was accompanied by a decline in imports (NAf.22.7 million). Below follows an analysis of the development in net exports of goods and services in Curaçao and Sint Maarten.3 Developments in the net exports of goods and services in Curaçao In Curaçao, net exports of goods and services improved by NAf.168.1 million during the second quarter of 2013 compared to the second quarter of 2012, as a rise in exports (NAf.37.9 million) was accompanied by a drop in imports (NAf.130.2 million). The growth in exports was related mostly to a sharp increase in the collected refining fee reflecting mainly increased production at the Isla refinery4. In addition, foreign exchange receipts from the transportation sector rose (NAf.28.9 million) as a result of more air transportation earnings, mitigated by lower foreign exchange receipts from sea transportation activities. The rise in air transportation earnings was supported by more passenger arrivals and departures at the airport, mitigated by fewer transit passengers. Furthermore, despite a decline in international oil prices, foreign exchange earnings from bunkering activities increased, reflecting a rise in the volume sold. Moreover, foreign exchange revenues from the tourism industry remained fairly stable, as a decline in foreign exchange earnings from stay-over tourism (NAf.8.6 million) was almost outbalanced by the rise in cruise tourism earnings (NAf.7.1 million). The increase in cruise tourism receipts reflected more cruise passengers and cruise calls in Curaçao
3 The current account of the monetary union is not equal to the sum of the current accounts of Curaçao and Sint Maarten, due to the transactions between the two countries. 4 Also, the data collection has been improved. The trading activities by the CRU are now incorporated in the refining fee revenues.

16
during the April - June period of 2013. In addition, foreign exchange revenues from ship repair activities remained stable. In contrast, re-exports by free-zone companies dropped significantly, reflecting a sharp fall in foreign demand from mainly Venezuelan merchants. Their demand dropped as a result of a decline in purchasing power due to the devaluation of the bolivar and the currency restrictions imposed by the Venezuelan government. The decline in the import of goods and services was largely the result of less merchandise imports by free-zone companies, reflecting the use of inventories and a reaction to the drop in foreign demand. Developments in the net exports of goods and services in Sint Maarten
In Sint Maarten, net foreign demand declined by NAf.83.0 million during the second quarter of 2013 compared to 2012’s second quarter, as the rise in exports (NAf.24.7 million) was outweighed by the increase in imports (NAf.107.7 million). The growth in export earnings was related mostly to a significant rise in bunkering activities (NAf.15.8 million). In contrast, foreign exchange revenues from the tourism sector declined slightly. The latter contracted by NAf.10.1 million as a result of a drop in revenues from stay-over tourism (NAf.9.8 million) combined with stable revenues from cruise tourism. Imports of goods and services increased as a result of a rise in imports by the wholesale sector and higher oil imports. The rise in oil imports reflected mainly improved reporting of data by the oil-importing companies. Developments in the income balance and current transfers balance The income balance of the monetary union deteriorated by NAf.13.0 million during the second quarter of 2013 compared to the second quarter of 2012, due mainly to a decline in net interest income from abroad. While investment income received from abroad remained fairly flat, investment income paid to abroad rose, mainly as a result of more interest and dividends paid on portfolio investments purchased by foreign investors in previous years. In addition, the current transfers balance deteriorated by NAf.16.0 million, reflecting mainly a decline in current transfers received from abroad, due largely to a drop in profit tax paid by foreign companies. Current transfers paid to abroad increased slightly. Overall, the deficit on the current account declined by NAf.64.1 million to reach NAf.308.3 million in the second quarter of 2013. (For a detailed overview, see Table 12 in the appendix.) Financing of the current account balance In line with the deficit on the current account, the net foreign wealth of the private sector dropped by NAf.299.1 million in the second quarter of 2013. This change in the external financing of the private sector was due mainly to a deterioration of the loans and credits and the direct investment balances. The loans and credits balance deteriorated by NAf.236.2 million as foreign companies transferred funds to their local bank accounts. Meanwhile, local companies increased

17
their funds at foreign bank accounts. Also, the net trade credit balance worsened because of an increase in trade credits received on imports. Net direct investments into the monetary union expanded by NAf.145.8 million during the April–June period of 2013. This expansion was due mainly to increased claims by foreign direct investors on their subsidiaries in Curaçao and Sint Maarten, including the financing of maintenance activities at the Isla refinery. Also, claims of local direct investors on their foreign subsidiaries dropped. The portfolio investment balance improved by NAf.82.9 million largely as a result of the purchase of foreign securities by local investors, mitigated slightly by funds received from matured foreign debt securities held by institutional investors who did not reinvest them abroad. Meanwhile, capital transfers received from abroad dropped to NAf.9.1 million in the second quarter of 2013, down from NAf.11.9 million in the second quarter of 2012, because development aid funds from the Netherlands are being phased out. As the inflows from capital transfers and external financing surpassed the current account deficit, gross reserves increased by NAf.14.0 million. (See Table 13 in the appendix for a detailed overview.) MONETARY DEVELOPMENTS Monetary policy During the second quarter of 2013, the Bank continued to direct its core instruments of monetary policy, the reserve requirement and the auctioning of Certificates of Deposit5 (CDs), toward tightening the surplus on the domestic money market. The aim of the monetary tightening is to contain domestic credit extension and, hence, domestic spending, import growth, and the high deficit on the current account of the balance of payments. Ultimately, the declining trend in the foreign exchange reserves should be reversed. The Bank tried to achieve this goal by raising the percentage of the reserve requirement and implementing a credit measure to bring the growth in private credit extension more in line with nominal economic growth. During the second quarter of 2013, the rate of the reserve requirement was raised by 0.50 percentage points to 16.00%. This rate increase was complemented by a credit measure6 to contain the growth in private credit extension. During the period March to August 2013, a maximum credit growth of 2% compared to the end of August 2012 was allowed. In addition, the Bank deployed the auctioning of Certificates of Deposit (CDs) in a neutral way, aiming only at the refinancing of maturing CDs. However, because the banks did not subscribe during the auctions held in April 2013, the Bank started to offer maturities of 6 and 12 months in addition to the terms of 1 and 3 months to increase the
5 These are negotiable securities issued by the Bank. 6 In February 2012, a temporary freeze on private credit extension was introduced for a period of six
months. This credit measure was continued in September 2012, when a 1% growth in credit was allowed.

18
attractiveness of the auctions. As a result, at the end of June 2013, the amount of outstanding CDs was higher than in the first quarter of 2013. The Bank’s official interest rate, the pledging rate, was left unchanged at 1.00% throughout the second quarter of 2013. Monetary base The monetary base, M0, consists of currency in circulation and the commercial banks’ current account balances with the Bank. Following a growth by NAf.28.3 million (4.2%) during 2013’s first quarter, M0 contracted by NAf.88.1 million (12.6%) during the second quarter of 2013. This contraction was caused by a decline in both components of M0. On an annual basis, M0 declined by 32.1% during 2013’s second quarter, the fourth consecutive quarterly decline. Changes in the monetary base can be explained in terms of movements in the Bank’s assets and remaining liabilities. An increase in the Bank’s assets normally leads to a corresponding increase in the monetary base, whereas growth in the Bank’s remaining liabilities causes M0 to contract. As Table 14 in the appendix indicates, the contraction in M0 in the second quarter of 2013 stemmed from a decline in the Bank’s assets, mitigated by a drop in its remaining liabilities. The decline in assets and remaining liabilities was dominated by the drop in the value of the gold reserves, reflected by large declines in foreign assets and capital and reserves. Corrected for the gold revaluation, the drop in M0 can be explained mainly by the increases in private sector deposits and foreign liabilities. The increase in private sector deposits at the Bank was related to the increases in the reserve requirement of the commercial banks. The foreign liabilities increased as a consequence of interest payments on bonds issued by the governments of Curaçao and Sint Maarten that are held by the Dutch State. These payments were deposited on the account of the Dutch Ministry of the Interior and Kingdom relations (BZK) at the Bank. Monetary aggregates After gaining NAf.60.8 million (0.8%) in the first quarter of 2013, broad money (M2) contracted by NAf.47.5 million (0.6%) during the second quarter of 2013 as the growth in net domestic assets was offset by a decrease in the net foreign assets of the banking system. As a consequence, annual M2 growth turned negative in June (4.1%) compared to a growth (1.3%) in March 2013. Narrow money (M1) declined by 1.3% during the second quarter of 2013 due to a decline in demand deposits. The latter was attributable entirely to a decline in the foreign currency balances of private nonfinancial companies. The near-money component declined marginally (0.1%) due to a decline in time deposits (1.2%), offset largely by an increase in savings (1.0%). (See Table 15 in the appendix.) Factors affecting the money supply Money holdings of the private sector contracted by NAf.47.5 million (0.6%) to reach NAf.7,454.5 million at the end of the second quarter of 2013. The monetary contraction was caused by a drop of NAf.349.5 million (8.9%) in net foreign assets. The net foreign assets of the central bank declined by NAf.351.7 million primarily because of the drop in the market value of the gold reserves (NAf.305.7 million). The commercial banks’ net

19
foreign assets position increased by NAf.2.2 million during 2013’s second quarter. (See Table 16 in the appendix for more details.)
In contrast, net domestic assets increased by NAf.302.0 million (8.4%) during the second quarter of 2013. The expansion in net domestic assets was due to increases in net claims on the government (NAf.76.9 million) and in memorandum balance sheet items (NAf.263.0 million) that outweighed a decline in net claims on the private sector (NAf.38.0 million). The decline in memorandum balance sheet items was related to a decrease in capital and reserves of the central bank due to the lower market value of gold at the end of the second quarter of 2013. The expansionary impact of the public sector stemmed from a net withdrawal of deposits with the banking system by the governments of both Curaçao (NAf.53.0 million) and Sint Maarten (NAf.20.2 million). The loan component of net credit extended to the private sector declined marginally by 0.6% (NAf.36.1 million) in 2013’s June quarter, attributable to declines in consumer loans (3.0%) and business loans (1.1%). Mortgages, on the other hand, increased by 1.0%. A picture similar to that in the monetary union was noticed in Curaçao with total loans contracting by 0.6%, led by declines in consumer loans (3.5%) and business loans (0.7%). In contrast, mortgages in Curaçao increased by 1.1%. In Sint Maarten, total loans declined by 0.8%, the result of fewer outstanding consumer loans (1.7%) and business loans (2.1%), mitigated by an increase in mortgages (0.7%). On an annual basis, total loans expanded by 3.7%, due entirely to the 6.3% growth in Curaçao because Sint Maarten registered a decline of 3.3%.
Developments in domestic interest rates
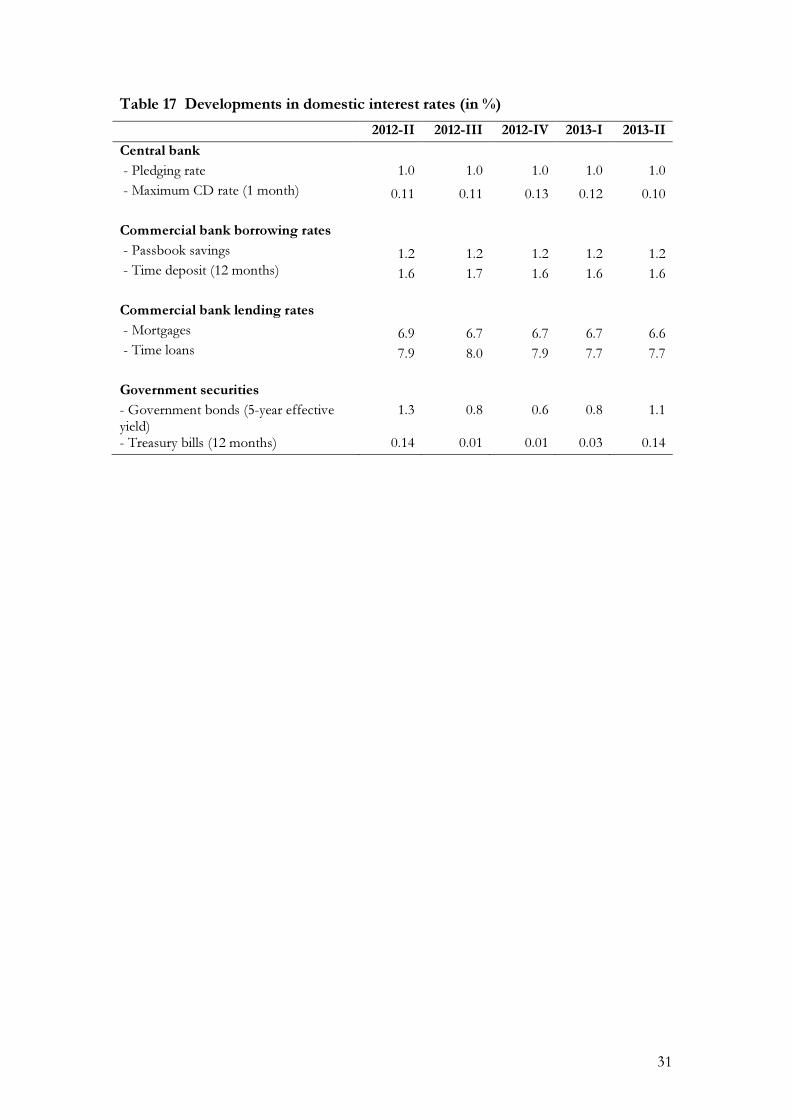
Developments in the international financial markets didn’t affect interest rates in the domestic money market during the June quarter of 2013. The benchmark one-month U.S. dollar libor rate7 declined only marginally during the second quarter of 2013, while the 1-month CD rate offered by the Bank dropped from 0.12% in the first quarter to 0.10% in the second quarter of 2013. The interest rates charged by the commercial banks remained on average fairly stable in the second quarter of 2013 compared to the first quarter of 2013. The average rate on time loans remained unchanged at 7.7%, while the average mortgage rate dropped from 6.7% in the first quarter to 6.6% in the second quarter of 2013. Meanwhile, commercial banks’ borrowing rates remained unchanged during 2013’s June quarter. The average rate offered on a 12-month time deposit remained at 1.6%, and the average rate on passbook savings remained at 1.2%. Changes in the yields on government paper are virtually determined by developments in the Dutch capital market due to the standing subscription by the Dutch State Treasury Agency (DSTA).8 The average effective yield on 5-year government bonds increased from 0.8% at the end of the first quarter to 1.2% at the end of the second quarter of 2013. Finally, the yield on 12-month treasury bills rose from nearly zero (0.03%) at the
7 The London interbank offered rate, the main gauge of interbank lending. 8 As part of the debt relief, the Dutch government agreed to purchase all new bond issues by the
governments of Curaçao and Sint Maarten at rates equivalent to the issuance of Dutch bonds.

20
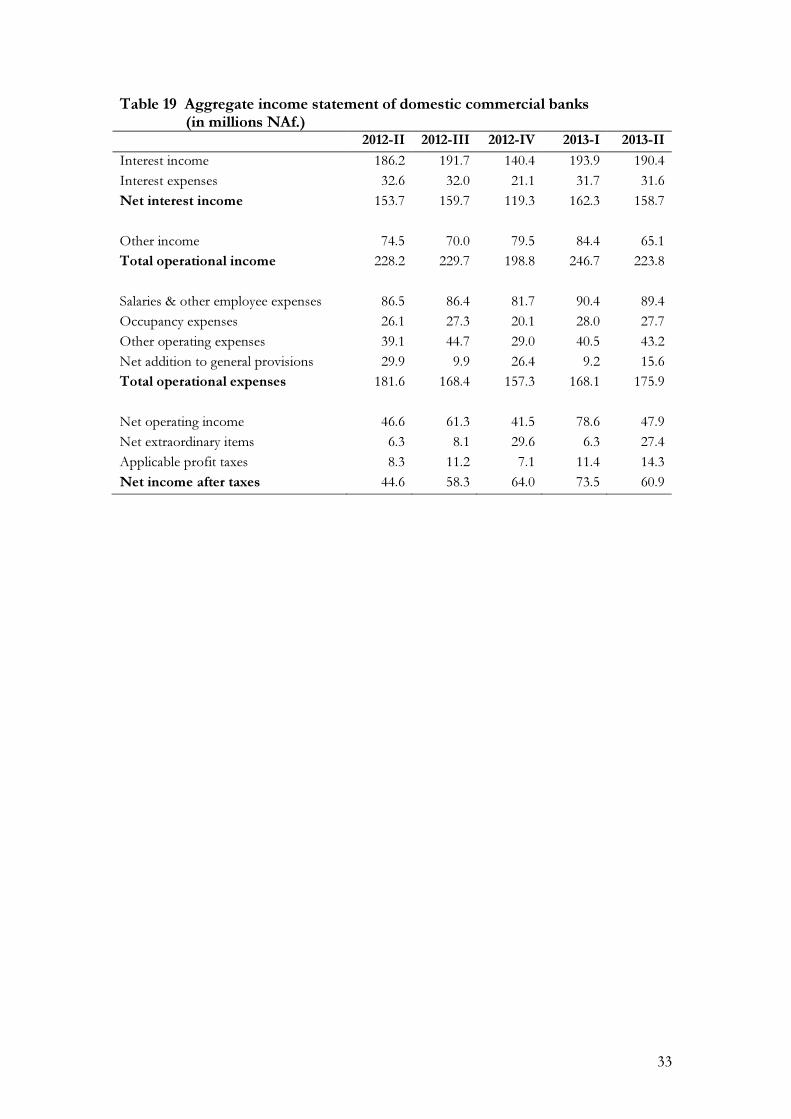
end of the first quarter to 0.14% at the end of the second quarter of 2013. (See Table 17 in the appendix for a detailed overview.) DEVELOPMENTS IN THE COMMERCIAL BANKING SECTOR During the June quarter of 2013, total assets of the domestic commercial banking sector grew at the same pace (1.4%) as during the March quarter of 2013. An expansion in other assets (43.2%) was the main cause of the expansion of the aggregate balance sheet of the commercial banks during the second quarter of 2013. Furthermore, the increases in non-interest-bearing cash (4.2%) and loans (0.3%) are noteworthy. These expansions were mitigated mainly by a contraction in investments (3.0%). (See Table 18 in the appendix for more details.) Total liabilities of the domestic commercial banking sector rose by 1.4% in 2013’s June quarter because of increases in other liabilities (19.7%), borrowings (111.0%), and total deposits (0.4%). The increase in deposits resulted from more savings and time deposits. The share of interest-bearing deposits (i.e., time and savings deposits) in total deposits increased to 52.5% in the June quarter of 2013, up from 51.7% in the March quarter. The domestic commercial banks’ capitalization increased by 0.9% in 2013’s second quarter compared to the March quarter. The share of total capital in total assets of the commercial banking sector amounted to 11.7% at the end of June 2013, almost the same as the 11.8% for the first quarter of 2013. The commercial banks reported a total operating income of NAf.223.8 million in the second quarter of 2013, a 1.9% decline compared to the second quarter of 2012. The decline in income was caused by a contraction of 12.7% in the “other income” category, as net interest income rose. A drop in interest expenses (2.9%) and an increase in interest income (2.2%) caused a rise of 3.3% in net interest income. On the expenses side, total operating expenses dropped (3.1%), entirely the result of a decline in the net addition to general provisions. All other expense categories increased. The developments in income and expenses resulted in a 2.8% increase in net operating income. However, net income after taxes rose by 36.5% because of a substantial increase in net extraordinary items, mitigated by a growth in profit tax paid. (See Table 19 in the appendix for more details.) Financial soundness indicators Financial soundness indicators (FSIs) are used to support macroprudential analysis. The Bank uses these FSIs, which are aggregates of microprudential indicators, as statistical measures to monitor the health and soundness of the financial sector. Because the microeconomic variables take only the exposure of individual banking institutions into account, this microprudential approach is complemented by a more comprehensive analysis that considers macroeconomic factors through stress tests. These stress tests together with the FSIs constitute a macroprudential approach aimed at better assessing the vulnerability of the banking system to shocks and the extent of systemic risk. The robustness of financial institutions to shocks to their balance sheets is determined by their capital adequacy. Capital provides not only a cushion for losses, but also forms a

21
buffer for deposit insurance, while controlling excessive risk-taking by banks. The capital-to-assets ratio reached 11.6% at the end of the second quarter of 2013, about the same as the 11.5% at the end of the first quarter. The upward trend in this ratio is an indication that the capital stock of the domestic commercial banks remained relatively strong, well above the benchmark of 4.0% for Tier 1 capital under the Basel I and Basel II agreements. The quality of the commercial banks’ assets portfolio deteriorated during the second quarter of 2013 as the increase in outstanding nonperforming loans exceeded that in total loans. This deterioration caused the ratio of nonperforming loans-to-total loans to increase from 7.4% in the first quarter of 2013 to 8.9% in the second quarter. The increase in nonperforming loans caused a drop in the ratio of provisions for loan losses-to-nonperforming loans from 42.2% at the end of March 2013 to 35.1% at the end of the second quarter, as provisioning remained at almost the same level. The profitability of the domestic banking sector in the second quarter of 2013 was not affected by the deterioration noticed in asset quality. A decline in interest expenses combined with an increase in interest income generated by the commercial banks caused a slight improvement in the net interest margin to 4.6% in the June quarter of 2013 compared to the June quarter of 2012. The gross earning assets yield dropped from 5.5% in 2012’s second quarter to 5.4% in the second quarter of 2013 due to an increase in average earning assets that outweighed the increase in interest income. The return-on-assets ratio remained unchanged at 1.9% in 2013’s second quarter compared to 2012’s second quarter. Table 7 Financial stability indicators (in %; end of period)
2012-II 2012-III 2012-IV 2013-I 2013-II
Capital adequacy Total capital/ total assets 11.2 11.3 11.5 11.5 11.6
Asset quality Nonperforming loans/ total loans 7.1 7.5 8.2 7.4 8.9
Provisions for loan losses/ non-performing loans
44.7 42.9 38.4 42.2 35.1
Earnings Gross earning assets yield 5.5 5.6 5.5 5.4 5.4
Net interest margin 4.5 4.6 4.6 4.6 4.6
Return on assets 1.9 2.1 1.7 1.8 1.9
Liquidity
Total loans/ total deposits 66.5 68.0 68.7 68.0 67.9
Finally, the ratio of total loans-to-total deposits, which measures the liquidity in the domestic banking sector, dropped from 68.0% in the March quarter of 2013 to 67.9% in the June quarter of 2013. The drop in this ratio reveals a slight increase in liquidity during 2013’s second quarter reflecting a higher increase in total deposits than in the outstanding amount of loans.

22

23
APPENDIX Table 8 Developments in stay-over tourism (% change)1)
Curaçao Sint Maarten
2012-II 2013-II 2012-II 2013-II
North America, of which: (1.0) (0.2) 3.6 0.6 18.0 11.7 1.5 1.0 -U.S.A. (0.1) (0.0) 1.4 0.2 15.9 9.1 0.2 0.1 Europe, of which: 4.5 1.9 (0.7) (0.3) 5.4 1.1 (1.4) (0.3) -The Netherlands (1.2) (0.4) (2.1) (0.6) 7.5 0.3 2.2 0.1 South & Central America, of which:
24.1 6.8 11.0 3.2 3.1 0.1 (0.1) 0.0
-Venezuela 38.6 7.5 5.4 1.0 10.8 0.1 (12.6) (0.1) -Colombia 3.2 0.1 18.3 0.5 -- -- -- --
-Surinam 5.4 0.1 38.2 1.2 -- -- -- --
Caribbean, of which: (8.9) (0.9) 2.6 0.3 (8.9) (0.5) 3.2 0.2 -Dominican Republic (3.2) 0.0 58.3 0.8 0.3 0.0 30.6 0.3
Total 6.2 -- 6.4 -- 12.5 -- 0.0 -- Source: Curacao Tourist Board (CTB) and St. Maarten Tourist Bureau
1) Weighted growth rates between brackets.

24
Table 9A Curaçao consumer prices (annual quarterly percentage change)
2012-II 2012-III 2012-IV 2013-I 2013-II
Food 6.8 5.1 4.4 4.0 3.4
Beverages & tobacco 6.0 4.4 3.5 2.1 3.0
Clothing & footwear 1.1 0.7 1.4 1.5 1.6
Housing 2.7 2.2 3.9 3.9 3.5
Housekeeping & furnishings 2.7 2.6 2.6 2.5 2.7
Health 0.6 1.4 0.3 -0.6 -1.1
Transport & communication 7.5 1.4 1.7 -0.9 -0.3
Recreation & education 1.7 1.4 1.1 0.5 0.6
Other 2.2 1.8 1.9 1.7 1.7
General inflation rate 4.3 2.4 2.8 2.1 2.1 Source: Central Bureau of Statistics of Curaçao
Table 9B Sint Maarten consumer prices (annual quarterly percentage change)
2012-II 2012-III 2012-IV 2013-I 2013-II
Food 13.2 10.7 6.8 6.0 6.1
Beverages & tobacco 10.0 6.8 4.2 4.8 3.1
Clothing & footwear 8.2 6.0 4.0 2.6 0.8
Housing 1.4 0.4 3.1 -0.1 0.0
Housekeeping & furnishings 7.2 4.9 4.7 13.3 14.7
Health 2.4 0.8 -0.2 -0.4 -0.8
Transport & communication 1.3 0.8 2.9 2.2 0.4
Recreation & education 4.3 3.5 3.0 1.3 1.6
Other 2.9 2.0 2.0 2.4 2.7
General inflation rate 4.0 2.8 3.5 2.4 2.1 Source: Department of Statistics, Sint Maarten

25
Table 10A Budgetary overview of Curaçao (in millions NAf.) 2011-II 2012-II 2013-II
Revenues 362.1 375.1 376.9 Tax revenues, of which: 333.6 341.5 346.6 Taxes on income and profits 160.5 165.8 169.9 Taxes on property 11.4 8.4 7.3 Taxes on goods and services 113.4 124.1 127.9 Taxes on international trade and transactions 46.7 42.0 40.2 Nontax and other revenues 28.5 33.6 30.3 Expenditures, of which: 427.0 509.5 461.6 Wages and salaries 221.0 247.6 198.2 Goods and services 47.6 50.2 65.8 Transfers and subsidies 133.6 159.8 161.0 Interest payments 24.7 29.6 24.8 Budget balance -64.9 -134.5 -84.7
Table 10B Overview of selected tax revenues for Curaçao (in millions NAf.)
2011-II 2012-II 2013-II Taxes on income and profits, of which: 160.5 165.8 169.9 Profit tax 35.9 38.3 47.3 Wage tax 121.8 120.1 121.2 Taxes on property, of which: 11.4 8.4 7.3 Land tax 5.3 4.3 4.6 Property transfer tax 5.4 3.7 2.5 Taxes on goods and services, of which: 113.4 124.1 127.9 Sales tax 77.1 93.3 99.5 Excises, of which: 26.8 22.0 18.4 Excise on gasoline 17.8 13.2 11.1 Motor vehicle tax 4.2 3.7 3.8 Taxes on international trade and transactions, of which: 46.7 42.0 40.2 Import duties 46.5 41.7 40.0

26
Table 11A Budgetary overview of Sint Maarten (in millions NAf.)
2011-II 2012-II 2013-II Revenues 101.4 107.8 103.1 Tax revenues, of which: 83.8 83.3 84.1 Taxes on income and profits 35.1 34.4 34.7 Taxes on property 5.9 3.2 2.9 Taxes on goods and services 42.8 45.6 46.5 Social contributions 4.7 5.0 4.9 Nontax and other revenues 12.9 19.6 14.1
Expenditures 99.2 110.8 n.a. Budget balance 2.2 -3.0 n.a. n.a. = not available
Table 11B Overview of selected tax revenues for Sint Maarten (in millions NAf.)
2011-II 2012-II 2013-II Taxes on income and profits, of which: 35.1 34.4 34.7 Profit tax 4.2 2.9 4.6 Wage tax 31.8 32.9 32.4 Taxes on property, of which: 5.9 3.2 2.9 Land tax 1.8 0.7 0.9 Property transfer tax 4.1 2.5 1.9 Taxes on goods and services, of which: 42.8 45.6 46.5 Turnover tax 31.9 34.7 36.9 Vehicle tax 1.0 0.4 1.0 Excise on gasoline 2.1 4.3 1.1

27
Table 12 Detailed overview of the balance of payments (in millions NAf.)
2011-II 2012-II 2013-II
Trade balance -838.3 -855.7 -849.1 -Exports 417.3 429.2 405.1 -Imports 1,255.6 1,284.9 1,254.2
Services balance 435.7 553.0 642.0 Receipts, of which: 886.4 1,079.2 1,176.2 -Travel 472.0 554.3 542.6 -Transportation 87.8 102.7 133.2 -Other services, of which: 326.6 422.2 500.4 -Int. fin & bus. services sector 47.2 47.7 43.7 Expenses, of which: 450.7 526.2 534.2 -Travel 143.6 161.0 171.4 -Transportation 77.4 97.8 85.2 -Other services, of which: 229.7 267.4 277.6 -Int. fin & bus. services sector 28.7 21.3 33.1
Income balance1) -18.5 -34.9 -47.9 Current transfers balance2) -46.2 -37.1 -53.1
Current account balance -467.3 -372.4 -308.3
Capital & financial account balance 458.2 333.5 287.8
Capital account balance 24.6 11.9 9.1 Financial account balance 433.6 321.6 278.7
Net errors & omissions 9.1 38.8 20.5
1) Labor and investment income. 2) Public and private transfers.

28
Table 13 Breakdown of net changes in the financial account1) (in millions NAf.)
2011-II 2012-II 2013-II Direct investment 64.6 24.7 145.8 - Abroad 2) 18.6 -3.2 50.3 - In Curaçao and Sint Maarten 3) 46.0 27.9 95.5 Portfolio investment 3) -9.7 424.5 -82.9 Other investment, of which: 193.1 -170.7 226.2 - Assets 2) 332.1 -117.3 54.4 - Liabilities 3) -139.0 -53.4 171.8 Net lending/borrowing, of which: 92.5 81.8 3.5 - Assets 2) 60.0 48.9 -2.2 - Liabilities 3) 32.5 32.9 5.7 Reserves 4) 93.1 -38.1 -14.0 Total assets 2) 494.1 314.8 5.6 Total liabilities 3) -60.5 7.4 273.0 Balance 433.6 321.6 278.6
1) Transaction basis. 2) A minus sign means an increase in assets. 3) A minus sign means a decrease in liabilities. 4) A minus sign means an increase in reserves.

29
Table 14 The monetary base and its sources (in millions NAf.) Change
2013-I 2013-II Amount Percentage
Banknotes issued 395.4 387.0 -8.4 -2.1
Banks' demand deposits (current account) 304.3 224.6 -79.7 -26.2
Monetary base (M0) 699.7 611.6 -88.1 -12.6
Central bank assets
Foreign assets (including gold) 3,177.3 2,885.3 -292.0 -9.2
Claims on deposit money banks 1.0 8.8 7.8 785.8
Claims on the government 0.2 0.3 0.1 45.2
Claims on government agencies and institutions
524.6 513.3 -11.3 -2.2
Fixed and other assets 115.8 116.3 0.5 0.4
less:
Central bank remaining liabilities
Private sector deposits 1,172.8 1,233.3 60.5 5.2
Government deposits 138.0 130.9 -7.1 -5.1
Foreign liabilities 593.5 627.7 34.2 5.8
Other liabilities 95.9 103.4 7.5 7.8
Capital and reserves 1,118.9 817.2 -301.8 -27.0
Table 15 Monetary aggregates (quarterly changes, in millions NAf.) 2012-IV 2013-I 2013-II
Amount % Amount % Amount %
Money supply (M2) -188.3 -2.5 60.8 0.8 -47.5 -0.6 Money (M1) -153.2 -4.4 1.7 0.1 -42.2 -1.3 Coins & notes with the public 39.4 13.5 -12.6 -3.8 3.6 1.1 Total demand deposits, of which: -192.6 -6.0 14.3 0.5 -45.8 -1.5 - Netherlands Antillean guilders -175.8 -7.1 -71.4 -3.1 5.1 0.2 - Foreign currency -16.8 -2.2 85.7 11.6 -50.9 -6.2 Near money -35.0 -0.9 59.2 1.5 -5.4 -0.1 Time deposits -22.4 -1.0 31.7 1.5 -25.5 -1.2 Savings -12.7 -0.7 27.5 1.4 20.1 1.0

30
Table 16 Monetary survey (in millions NAf.)
2012-II 2012-III 2012-IV 2013-I 2013-II
Money supply (M2) 7,770.0 7,629.4 7,441.2 7,502.0 7,454.5
Money (M1) 3,523.3 3,518.5 3,365.3 3,366.9 3,324.7
Coins & notes with the public 304.4 292.4 331.8 319.2 322.8
Total demand deposits, of which: 3,218.9 3,226.1 3,033.5 3,047.8 3,002.0
- Netherlands Antillean guilders 2,482.3 2,468.1 2,292.3 2,220.9 2,226.0
- Foreign currency 736.6 758.0 741.2 826.9 776.0
Near money 4,246.7 4,110.9 4,075.9 4,135.1 4,129.7
Time deposits 2,310.3 2,171.9 2,149.5 2,181.2 2,155.7
Savings 1,936.4 1,939.1 1,926.4 1,953.9 1,974.0
Factors affecting the money supply 7,770.0 7,629.4 7,441.2 7,502.0 7,454.5
Net domestic assets 3,462.1 3,456.9 3,541.3 3,588.1 3,890.1
Government sector -524.8 -535.1 -425.7 -516.8 -439.9
- Former central government -98.0 -114.0 -113.1 -83.0 -79.3
- Curacao -265.9 -271.8 -180.7 -294.5 -241.5
- Sint Maarten -160.9 -149.2 -131.9 -139.3 -119.1
Private sector 6,315.1 6,473.2 6,373.8 6,460.9 6,422.9
Memorandum items -2,328.1 -2,481.3 -2,406.8 -2,356.0 -2,093.0
Net foreign assets 4,307.9 4,172.5 3,899.9 3,913.9 3,564.4
Central bank 2,850.6 2,900.5 2,845.3 2,751.3 2,399.6
Commercial banks 1,457.2 1,272.0 1,054.6 1,162.6 1,164.8
Government loans by commercial banks 0.1 0.1 0.1 0.1 0.2
Government of Curaçao 0.0 0.0 0.0 0.0 0.1
Government of Sint Maarten 0.1 0.1 0.1 0.1 0.1
Private sector loans Curaçao 3,944.7 4,098.8 4,170.6 4,219.0 4,194.9
- Mortgages 1,732.7 1,753.0 1,782.4 1,793.2 1,812.3
- Consumer loans 922.2 948.4 945.3 932.6 900.2
- Business loans 1,289.9 1,397.4 1,442.9 1,493.1 1,482.5
Private sector loans Sint Maarten 1,493.1 1,498.5 1,471.9 1,455.2 1,443.2
- Mortgages 646.5 622.1 614.2 631.4 635.7
- Consumer loans 370.4 361.5 348.2 341.2 335.4
- Business loans 476.1 514.9 509.5 482.6 472.2
31
Table 17 Developments in domestic interest rates (in %)
2012-II 2012-III 2012-IV 2013-I 2013-II
Central bank - Pledging rate 1.0 1.0 1.0 1.0 1.0
- Maximum CD rate (1 month) 0.11 0.11 0.13 0.12 0.10 Commercial bank borrowing rates - Passbook savings 1.2 1.2 1.2 1.2 1.2 - Time deposit (12 months) 1.6 1.7 1.6 1.6 1.6 Commercial bank lending rates - Mortgages 6.9 6.7 6.7 6.7 6.6 - Time loans 7.9 8.0 7.9 7.7 7.7 Government securities - Government bonds (5-year effective yield)
1.3 0.8 0.6 0.8 1.1
- Treasury bills (12 months) 0.14 0.01 0.01 0.03 0.14

32
Table 18 Aggregate balance sheet of domestic commercial banks (in millions NAf.)
2012-II 2012-III 2012-IV 2013-I 2013-II
Assets Non-interest-bearing cash 1,585.0 1,544.4 1,447.4 1,417.4 1,477.6
Interest-bearing cash 2,703.3 2,795.7 2,697.3 2,868.4 2,872.0
Investments 1,666.8 1,547.4 1,434.3 1,459.7 1,406.2
Loans 8,503.4 8,670.6 8,784.8 8,832.3 8,856.1
Investments in unconsolidated subsidiaries and affiliates
66.5 97.9 94.7 107.2 113.5
Fixed assets 362.9 371.0 393.0 392.1 403.1
Other assets 335.2 373.2 385.9 372.8 533.8
Total assets 15,223.2 15,400.1 15,237.5 15,449.9 15,662.2
Liabilities Demand deposits 6,144.7 6,177.6 6,168.8 6,320.2 6,244.9
Savings deposits 4,057.2 4,020.3 4,117.3 4,082.9 4,120.3
Time deposits 2,729.4 2,636.2 2,598.1 2,684.9 2,779.9
Total deposits 12,931.4 12,834.2 12,884.2 13,087.9 13,145.2
Borrowings 28.3 210.4 20.0 35.7 75.4
Other liabilities 530.9 588.3 549.4 506.3 605.8
Total liabilities 13,490.6 13,633.0 13,453.6 13,629.9 13,826.4
Minority interest 10.8 11.5 10.2 11.2 10.9
Subordinated debentures 0.0 0.0 0.0 0.0 0.0
General provisions 299.8 316.7 297.8 300.8 306.1
Capital & reserves 1,422.1 1,439.0 1,475.9 1,508.0 1,518.8
Total capital 1,732.6 1,767.2 1,783.9 1,819.9 1,835.8
Total liabilities and capital 15,223.2 15,400.1 15,237.5 15,449.9 15,662.2
33
Table 19 Aggregate income statement of domestic commercial banks (in millions NAf.)
2012-II 2012-III 2012-IV 2013-I 2013-II
Interest income 186.2 191.7 140.4 193.9 190.4
Interest expenses 32.6 32.0 21.1 31.7 31.6
Net interest income 153.7 159.7 119.3 162.3 158.7
Other income 74.5 70.0 79.5 84.4 65.1
Total operational income 228.2 229.7 198.8 246.7 223.8
Salaries & other employee expenses 86.5 86.4 81.7 90.4 89.4
Occupancy expenses 26.1 27.3 20.1 28.0 27.7
Other operating expenses 39.1 44.7 29.0 40.5 43.2
Net addition to general provisions 29.9 9.9 26.4 9.2 15.6
Total operational expenses 181.6 168.4 157.3 168.1 175.9
Net operating income 46.6 61.3 41.5 78.6 47.9
Net extraordinary items 6.3 8.1 29.6 6.3 27.4
Applicable profit taxes 8.3 11.2 7.1 11.4 14.3
Net income after taxes 44.6 58.3 64.0 73.5 60.9