quarter and first half results 2021
TRANSCRIPT
2nd QUARTER AND FIRST HALF RESULTS 2021
July, 2021
INDEX
Cautionary Statement
This document may include forward-looking statements, including, without limitation, regarding future results, namely cash flows, dividends, and shareholder returns; liquidity; capital and operating expenditures; performance levels, operational or environmental goals, targets or commitments and project plans, timing, and outcomes; production rates; developments of Galp’s markets; and impacts of the COVID-19 pandemic on Galp’s businesses and results; any of which may significantly differ depending on a number of factors, including supply and demand for oil, gas, petroleum products, power and other market factors affecting them; the outcome of government policies and actions, including actions taken to address COVID-19 and to maintain the functioning of national and international economies and markets; the impacts of the COVID-19 pandemic on people and economies; the impact of Galp’s actions to protect the health and safety of its employees, customers, suppliers and communities; actions of Galp’s competitors and commercial counterparties; the ability to access short- and long-term debt markets on a timely and affordable basis; the actions of consumers; other legal and political factors, including changes in law and regulations and obtaining necessary permits; unexpected operating events or technical difficulties; the outcome of commercial negotiations, including negotiations with governments and private entities; and other factors discussed in Galp’s Management Report & Accounts filed with the Portuguese Securities Market Commission (CMVM) for the year ended December 31, 2020 and available on our website at galp.com. This document may also contain statements regarding the perspectives, objectives, and goals of Galp, including with respect to energy transition, carbon intensity reduction or carbon neutrality. An ambition expresses an outcome desired or intended by Galp, it being specified that the means to be deployed may not depend solely on Galp. It is important to note that as of June 2, 2021, Galp’s business plans and budgets do not fully reflect Galp’s Net Zero Emissions target. Galp aims that, in the future, its business plans and budgets will progressively change to reflect in full this movement towards its Net Zero Emissions target. All statements other than statements of historical facts are, or may be deemed to be, forward-looking statements. Forward-looking statements express future expectations that are based on management’s expectations and assumptions as of the date they are disclosed and involve known and unknown risks and uncertainties that could cause actual results, performance or events to differ materially from those expressed or implied in such those statements. Accordingly, neither Galp nor any other person can assure that its future results, performance or events will meet those expectations, nor assume any responsibility for the accuracy and completeness of the forward-looking statements. Forward-looking statements include, among other things, statements concerning the potential exposure of Galp to market risks and statements expressing management’s expectations, beliefs, estimates, forecasts, projections, and assumptions. These forward-looking statements may generally be identified by the use of the future, gerund or conditional tense or the use of terms and phrases such as "aim", "ambition", "anticipate", "believe", “consider”, "could", “develop”, “envision”, "estimate", "expect", "goals", "intend", "may'', "objectives", "outlook", "plan", “potential”, "probably", "project", “pursue”, "risks", "schedule", "seek", "should", "target", “think”, "will" or the negative of these terms and similar terminology. Financial information by business segment is reported in accordance with the Galp’s management reporting policies and shows internal segment information that is used to manage and measure the Group’s performance. In addition to IFRS measures, certain alternative performance measures are presented, such as performance measures adjusted for special items (adjusted operational cash flow, adjusted earnings before interest, taxes, depreciation and amortisation, adjusted earnings before interest and taxes, and adjusted net income), return on equity (ROE), return on average capital employed (ROACE), investment return rate (IRR), equity investment return rate (eIRR), gearing ratio, cash flow from operations and free cash flow. These indicators are meant to facilitate the analysis of the financial performance of Galp and comparison of results and cash flow among periods. In addition, the results are also measured in accordance with the replacement cost method, adjusted for special items. This method is used to assess the performance of each business segment and facilitate the comparability of the segments’ performance with those of its competitors. This document also contains non-financial performance indicators, including a carbon intensity indicator for energy products sold by Galp, that measures the amount of greenhouse gas emissions of those products, from their production to their end use, per unit of energy delivered. This indicator covers the direct GHG emissions of production and processing facilities (scope 1) and their indirect emissions associated with energy purchased (scope 2), as well as the emissions associated with the use of products by Galp’s costumers (scope 3). The same emissions are considered for products purchased from third parties and sold or transformed by Galp. For a complete definition of scopes 1, 2 and 3 and the methodology used by Galp for this indicator please refer to Galp’s website at galp.com. This document may include data and information from sources that are publicly available. This document may also include data and information provided by third parties, including Wood Mackenzie, Rystad and market analysts, which are not publicly available. Such data and information should not be interpreted as advice and you should not rely on it for any purpose. You may not copy or use this data and information except as expressly permitted by those third parties in writing. To the fullest extent permitted by law, those third parties accept no responsibility for your use of such data and information except as specified in a written agreement you may have entered into with those third parties for the provision of such data and information. Galp and its respective representatives, agents, employees or advisers do not intend to, and expressly disclaim any duty, undertaking or obligation to, make or disseminate any supplement, amendment, update or revision to any of the information, opinions or forward-looking statements contained in this document to reflect any change in events, conditions or circumstances. This document does not constitute investment advice nor forms part of and should not be construed as an offer to sell or issue or the solicitation of an offer to buy or otherwise acquire securities of Galp or any of its subsidiaries or affiliates in any jurisdiction or an inducement to engage in any investment activity in any jurisdiction.
INDEX
Table of Contents 1. Results highlights ____________________________________________________________________________________________________________ 4 2. Upstream _________________________________________________________________________________________________________________ 10 3. Commercial ________________________________________________________________________________________________________________ 13 4. Industrial & Energy Management _______________________________________________________________________________________________ 16 5. Renewables & New Businesses _________________________________________________________________________________________________ 20 6. Financial Data ______________________________________________________________________________________________________________ 23 6.1 Income Statement ________________________________________________________________________________________________________________________________ 24 6.2 Capital Expenditure _______________________________________________________________________________________________________________________________ 26 6.3 Cash flow _______________________________________________________________________________________________________________________________________ 27 6.4 Financial position _________________________________________________________________________________________________________________________________ 29 6.5 Financial debt____________________________________________________________________________________________________________________________________ 30 6.6 IFRS consolidated income statement _________________________________________________________________________________________________________________ 33 6.7 Consolidated financial position ______________________________________________________________________________________________________________________ 34 7. Basis of reporting ___________________________________________________________________________________________________________ 36 8. Appendices ________________________________________________________________________________________________________________ 38 8.1 Governing bodies _________________________________________________________________________________________________________________________________ 39 8.2 Statement of compliance of information presented ______________________________________________________________________________________________________ 41 8.3 Unaudited Condensed Consolidated Financial Statements for the period ended 30 June 2021_____________________________________________________________________44 9. Definitions ________________________________________________________________________________________________________________ 78

RESULTS HIGHLIGHTS
5 2Q21 RESULTS JULY 2021
1. RESULTS HIGHLIGHTS
Second quarter 2021
Galp’s adjusted operating cash flow (OCF)1 reached €470 m, up €231 m YoY, considering
the very challenging macro conditions during 2020, supported by a higher Upstream
contribution as well as a better downstream performance. Cash flow from operations
(CFFO) was €440 m.
Free cash flow (FCF) generation was strong at €228 m, with net capex during the period
of €186 m.
Net debt at the end of the period was €1,711 m, with net debt to RCA Ebitda decreasing
to 1.0x.
RCA Ebitda was €571 m, with the following highlights:
• Upstream: RCA Ebitda was €467 m, a €263 m increase YoY, reflecting the higher
oil price environment, which more than offset the lower production and the
depreciation of the USD against the Euro.
• Commercial: RCA Ebitda of €73 m, up 22% YoY, reflecting the higher demand of
oil products from a partial relief of lockdown measures in Iberia.
• Industrial & Energy Management: RCA Ebitda was €50 m, up €31 m YoY, with
margins still pressured by the international environment. Energy Management
1 Adjusted operating cash flow (OCF) indicator represents a proxy of Galp’s operational performance excluding inventory effects,
working capital changes and special items. The reconciliation of this indicator with CFFO using IFRS is in chapter 6.3 Cash Flow.
Ebitda benefited from timing differences on trading gas derivatives, which should
be partially reverted during 2H21.
• Renewables & New Businesses: No relevant RCA Ebitda as most of the operations
are not consolidated. The pro-forma Ebitda 2 of the Renewables operations
reached €17 m in the period, driven by robust Iberian solar capture prices in
Iberia.
RCA Ebit was up €362 m YoY to €305 m, supported by the stronger operational
performance, whilst including €50 m of impairments in exploration assets in Upstream.
RCA net income was €140 m. IFRS net income was €71 m, with an inventory effect of
€68 m and special items of -€137 m.
First half 2021
Galp’s OCF1 was €914 m, 68% higher YoY, while RCA Ebitda was €1,071 m, 41% higher
YoY, given the improved macro conditions.
Capex totalled €402 m, with Upstream accounting for 71% of total investments, whilst the
downstream activities represented 11% and Renewables & New Businesses 16%. Net
capex represented a gain of €8 m, considering the proceeds from divestments during the
period, most notably the stake in GGND.
FCF amounted to €746 m, with the strong cash generation supported by operational
performance and the GGND divestment.
Considering dividends paid to shareholders of €290 m and to non-controlling interests of
€78 m, as well as other adjustments, net debt decreased €354 m, compared to the end
of last year.
2 Pro-forma considers all Renewables projects as if they were consolidated according to Galp’s equity stakes.

6 2Q21 RESULTS JULY 2021
Other highlights
Galp Capital Markets Day 2021
On June 2, Galp presented a refreshed strategy, aiming to thrive through the energy
transition, continuing to deliver growth from one of the most efficient portfolios in the
industry, whilst progressively transforming its activities in alignment with the energy
transition. The strategy relies on a clear capital allocation framework, with a strict
investment plan capable of delivering both cash flow growth and a competitive shareholder
remuneration. Galp’ strategy also incorporates a commitment to the progressive
decarbonisation of its operations and customers’ sales, as it is committed to be a net zero
emissions Company by 2050, with clear intermediate targets by 2030.
The capital allocation framework relies on a solid financial position, with the Company
targeting to keep a net debt to Ebitda ratio of c.1x. Net capex to average €0.8-1.0 bn p.a.
during 2021-25, a c.20% reduction compared with Galp’s previous plan, with 2021
guidance maintained at €0.5-0.7 bn.
The net capex target includes portfolio management initiatives to support our investment
plan, crystallise value and maintain a robust financial position. The shareholder’s
remuneration framework considers a baseline dividend of €0.50/sh and an additional
variable component which should be triggered by net debt to Ebitda ratio being below 1x.
Total base and variable distributions may reach 1/3 of CFFO depending on maintaining
the net debt to Ebitda ratio at c.1x. More information here.
Final investment decision for Bacalhau phase I in Brazil
On June 1, Galp, through its subsidiary Petrogal Brasil, together with its partners Equinor
(operator), ExxonMobil, and Pré-sal Petróleo SA (PPSA) have decided to sanction the
development of the Bacalhau field in the Brazilian pre-salt Santos area. The investment
estimated is of approximately $8 bn. Bacalhau is a highly competitive project, with an
NPV10 breakeven below $35/bbl and a low carbon intensity of c.9 kgCO2e/bbl. The project
first oil is expected in the second half of 2024 and will add c.40 kbpd to Galp’s working
interest production once at plateau, through a 220 kbpd capacity FPSO. Phase I
recoverable volumes are estimated at over 1 bn bbl. More information here.
7 2Q21 RESULTS JULY 2021
Subsequent events
Changes in Galp’s Board of Directors and Executive Committee
Following Galp´s strategic update presented at its Capital Markets Day by the recently
appointed CEO Andy Brown, the Board of Directors approved on July 23 changes in its
composition and in the Company´s Executive Committee (Exco) to enhance the potential
of each of its activities, adopting a leaner and more agile management model. The new
Exco structure is the following:
• Andy Brown, CEO
• Filipe Silva, CFO
• Carlos Costa Pina, COO Corporate Office
• Teresa Abecasis, COO Commercial
• Thore E. Kristiansen, COO Production & Operations, which will include Upstream
and Industrial businesses
The Board of Directors is in the process of recruiting the new COO for the Renewables &
New Businesses unit, which will be, in the interim, managed by CEO Andy Brown.
Additionally, the development of Energy Management businesses will be led by Andy
Brown.
The changes in the organisational structure will not impact Galp’s reporting segments
during 2021, which should follow the structure announced in the Capital Markets Day 2021
presentation.
More information at Galp’s website (here).

8 2Q21 RESULTS JULY 2021
Financial data
1 Ratio considers the LTM Ebitda RCA (€1,697 m), which includes the adjustment for the impact from the application of IFRS 16 (€184 m).
€m (IFRS, except otherwise stated)
2Q20 1Q21 2Q21 Var. YoY % Var. YoY 2020 2021 Var. YoY % Var. YoY
291 499 571 281 97% RCA Ebitda 760 1,071 311 41%
204 438 467 263 n.m. Upstream 490 906 416 85%
59 69 73 13 22% Commercial 149 142 (7) (5%)
19 (6) 50 31 n.m. Industrial & Energy Management 109 45 (64) (59%)
(4) (2) (6) 2 58% Renewables & New Businesses (5) (8) 4 79%
(57) 284 305 362 n.m. RCA Ebit 161 588 428 n.m.
(32) 314 290 322 n.m. Upstream 113 603 490 n.m.
36 44 48 12 32% Commercial 104 92 (13) (12%)
(60) (67) (9) (51) (85%) Industrial & Energy Management (51) (76) 25 50%
(9) (3) (5) (4) (45%) Renewables & New Businesses (16) (8) (8) (52%)
(52) 26 140 192 n.m. RCA Net income (22) 166 188 n.m.
(154) 161 71 225 n.m. IFRS Net income (410) 232 642 n.m.
(18) 34 (137) 119 n.m. Special items (26) (103) 77 n.m.
(84) 101 68 152 n.m. Inventory effect (362) 169 531 n.m.
239 445 470 231 96% Adjusted operating cash flow 544 914 370 68%
123 390 346 223 n.m. Upstream 255 736 481 n.m.
55 67 69 14 26% Commercial 145 136 (9) (6%)
49 (9) 64 15 31% Industrial & Energy Management 134 55 (79) (59%)
(4) (2) (2) (2) (56%) Renewables & New Businesses (4) (4) (1) (12%)
160 377 440 280 n.m. Cash flow from operations 404 817 413 n.m.
(149) 195 (186) 37 25% Net Capex (360) 8 368 n.m.
16 518 228 212 n.m. Free cash flow 107 746 639 n.m.
(86) - (78) (8) (9%) Dividends paid to non-controlling interests (194) (78) (116) (60%)
(318) - (290) (28) (9%) Dividends paid to shareholders (318) (290) (28) (9%)
1,932 1,552 1,711 (221) (11%) Net debt 1,932 1,711 (221) (11%)
1.1x 1.1x 1.0x 0.0x n.m. Net debt to RCA Ebitda1 1.1x 1.0x 0.0x n.m.
Quarter First Half
9 2Q21 RESULTS JULY 2021
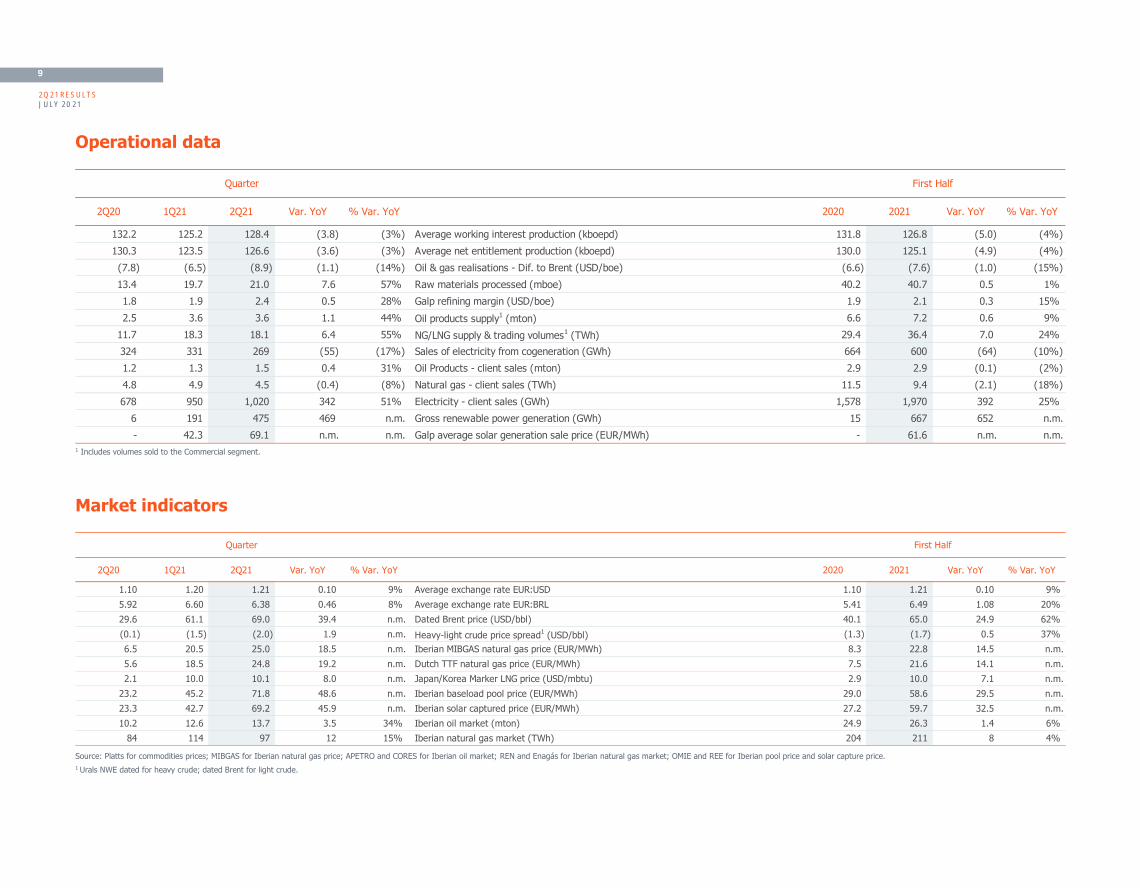
Operational data
1 Includes volumes sold to the Commercial segment.
Market indicators
Source: Platts for commodities prices; MIBGAS for Iberian natural gas price; APETRO and CORES for Iberian oil market; REN and Enagás for Iberian natural gas market; OMIE and REE for Iberian pool price and solar capture price.
1 Urals NWE dated for heavy crude; dated Brent for light crude.
2Q20 1Q21 2Q21 Var. YoY % Var. YoY 2020 2021 Var. YoY % Var. YoY
132.2 125.2 128.4 (3.8) (3%) Average working interest production (kboepd) 131.8 126.8 (5.0) (4%)
130.3 123.5 126.6 (3.6) (3%) Average net entitlement production (kboepd) 130.0 125.1 (4.9) (4%)
(7.8) (6.5) (8.9) (1.1) (14%) Oil & gas realisations - Dif. to Brent (USD/boe) (6.6) (7.6) (1.0) (15%)
13.4 19.7 21.0 7.6 57% Raw materials processed (mboe) 40.2 40.7 0.5 1%
1.8 1.9 2.4 0.5 28% Galp refining margin (USD/boe) 1.9 2.1 0.3 15%
2.5 3.6 3.6 1.1 44% Oil products supply1 (mton) 6.6 7.2 0.6 9%
11.7 18.3 18.1 6.4 55% NG/LNG supply & trading volumes1 (TWh) 29.4 36.4 7.0 24%
324 331 269 (55) (17%) Sales of electricity from cogeneration (GWh) 664 600 (64) (10%)
1.2 1.3 1.5 0.4 31% Oil Products - client sales (mton) 2.9 2.9 (0.1) (2%)
4.8 4.9 4.5 (0.4) (8%) Natural gas - client sales (TWh) 11.5 9.4 (2.1) (18%)
678 950 1,020 342 51% Electricity - client sales (GWh) 1,578 1,970 392 25%
6 191 475 469 n.m. Gross renewable power generation (GWh) 15 667 652 n.m.
- 42.3 69.1 n.m. n.m. Galp average solar generation sale price (EUR/MWh) - 61.6 n.m. n.m.
Quarter First Half
2Q20 1Q21 2Q21 Var. YoY % Var. YoY 2020 2021 Var. YoY % Var. YoY
1.10 1.20 1.21 0.10 9% Average exchange rate EUR:USD 1.10 1.21 0.10 9%
5.92 6.60 6.38 0.46 8% Average exchange rate EUR:BRL 5.41 6.49 1.08 20%
29.6 61.1 69.0 39.4 n.m. Dated Brent price (USD/bbl) 40.1 65.0 24.9 62%
(0.1) (1.5) (2.0) 1.9 n.m. Heavy-light crude price spread1 (USD/bbl) (1.3) (1.7) 0.5 37%
6.5 20.5 25.0 18.5 n.m. Iberian MIBGAS natural gas price (EUR/MWh) 8.3 22.8 14.5 n.m.
5.6 18.5 24.8 19.2 n.m. Dutch TTF natural gas price (EUR/MWh) 7.5 21.6 14.1 n.m.
2.1 10.0 10.1 8.0 n.m. Japan/Korea Marker LNG price (USD/mbtu) 2.9 10.0 7.1 n.m.
23.2 45.2 71.8 48.6 n.m. Iberian baseload pool price (EUR/MWh) 29.0 58.6 29.5 n.m.
23.3 42.7 69.2 45.9 n.m. Iberian solar captured price (EUR/MWh) 27.2 59.7 32.5 n.m.
10.2 12.6 13.7 3.5 34% Iberian oil market (mton) 24.9 26.3 1.4 6%
84 114 97 12 15% Iberian natural gas market (TWh) 204 211 8 4%
Quarter First Half

10 2Q21 RESULTS JULY 2021
UPSTREAM

11 2Q21 RESULTS JULY 2021
2. UPSTREAM
1 Includes natural gas exported; excludes natural gas used or reinjected. 2 Includes abandonment provisions. 2020 and 2021 unit figures exclude impairments of €92 m and €48 m respectively, related with smaller scale exploration assets.
€m (RCA, except otherwise stated; unit figures based on total net entitlement production)
2Q20 1Q21 2Q21 Var. YoY % Var. YoY 2020 2021 Var. YoY % Var. YoY
132.2 125.2 128.4 (3.8) (3%) Average working interest production1 (kboepd) 131.8 126.8 (5.0) (4%)
118.6 112.2 114.9 (3.7) (3%) Oil production (kbpd) 118.3 113.5 (4.8) (4%)
130.3 123.5 126.6 (3.6) (3%) Average net entitlement production1 (kboepd) 130.0 125.1 (4.9) (4%)
12.7 11.3 11.6 (1.1) (9%) Angola 13.4 11.5 (1.9) (14%)
117.6 112.2 115.0 (2.5) (2%) Brazil 116.6 113.6 (3.0) (3%)
(7.8) (6.5) (8.9) (1.1) (14%) Oil and gas realisations - Dif. to Brent (USD/boe) (6.6) (7.6) (1.0) (15%)
2.3 4.8 5.6 3.2 n.m. Royalties (USD/boe) 3.1 5.2 2.1 66%
2.8 1.8 1.2 (1.6) (58%) Production costs (USD/boe) 2.6 1.5 (1.1) (43%)
13.4 13.7 13.4 (0.0) (0%) DD&A2 (USD/boe) 13.3 13.5 0.3 2%
204 438 467 263 n.m. RCA Ebitda 490 906 416 85%
(233) (126) (177) (55) (24%) Depreciation, Amortisation and Impairments2 (373) (303) (69) (19%)
(4) 1 - 4 n.m. Provisions (4) 1 5 n.m.
(32) 314 290 322 n.m. RCA Ebit 113 603 490 n.m.
(4) 340 290 294 n.m. IFRS Ebit 177 630 453 n.m.
123 390 346 223 n.m. Adjusted operating cash flow 255 736 481 n.m.
82 149 135 53 66% Capex 185 283 98 53%
Quarter First Half

12 RE2Q21 RESULTS JULY 2021
Second quarter 2021
Operations
Working Interest (WI) production was down 3% YoY to 128.4 kboepd, impacted by
offshore operational constraints. Natural gas accounted for 11% of Galp’s Upstream
production.
In Brazil, production was 2% lower YoY, at 115.0 kboepd, as the continued ramp-up of
the FPSOs Tupi North, Berbigão/Sururu and Atapu was offset by the offshore constraints.
Angola net entitlement (NE) production decreased YoY, from 12.7 kbpd to 11.6 kbpd.
The Group’s NE production followed the production WI decrease to 126.6 kboepd.
Results
RCA Ebitda was €467 m, a €263 m increase YoY, reflecting the higher oil price environment,
despite a discount increase on realisations, which more than offset the lower production
and the depreciation of the USD against the Euro. OCF was €346 m, compared to €123 m
in 2Q20.
Production costs were €11.4 m, 63% lower YoY, benefiting lower maintenance activities.
In unit terms, and on a net entitlement basis, production costs were $1.2/boe. As per the
application of IFRS 16, the production costs exclude the amounts related with leases,
which accounted for €30 m during the period.
Amortisation and depreciation charges (including abandonment provisions) were down
YoY to €177 m, reflecting the USD dollar depreciation against the Euro and lower asset
impairments registered during the period, despite the €50 m impairments registered in
2Q21 related with exploration assets in the Potiguar and Barreirinhas basins, in Brazil. On
a net entitlement basis and excluding impacts from impairments, unit DD&A and Provisions
were stable YoY, at $13.4/boe, reflecting the lower production dilution.
RCA Ebit was €290 m, up €322 m YoY. IFRS Ebit amounted to €290 m.
First half 2021
Operations
Average WI production during 1H21 was 126.8 kboepd, 4% lower YoY, as the continued
ramp-up of the FPSOs in BM-S-11A, in Brazil, was more than offset by the operational
restrictions registered during the period.
NE production decreased 4% YoY, to 125.1 kboepd.
Results
RCA Ebitda was €906 m, up 85% YoY, reflecting the increased oil price environment. OCF
was €736 m, up from €255 m in 6M20, including €59 m of dividends from associates,
related with Tupi BV, mostly received in 1Q21.
Production costs were €28 m, excluding IFRS 16 leases of €59 m. In unit terms, and on a
net entitlement basis, production costs were $1.5/boe.
Amortisation and depreciation charges (including abandonment provisions) amounted to
€302 m, including the €48 m in impairments. On a net entitlement basis, and not
considering the impacts from impairments, DD&A was $13.5/boe.
RCA Ebit was €603 m, up €490 m YoY.
13 FIRST QUARTER 2021 RESULTS April 2021
COMMERCIAL
14 2Q21 RESULTS JULY 2021
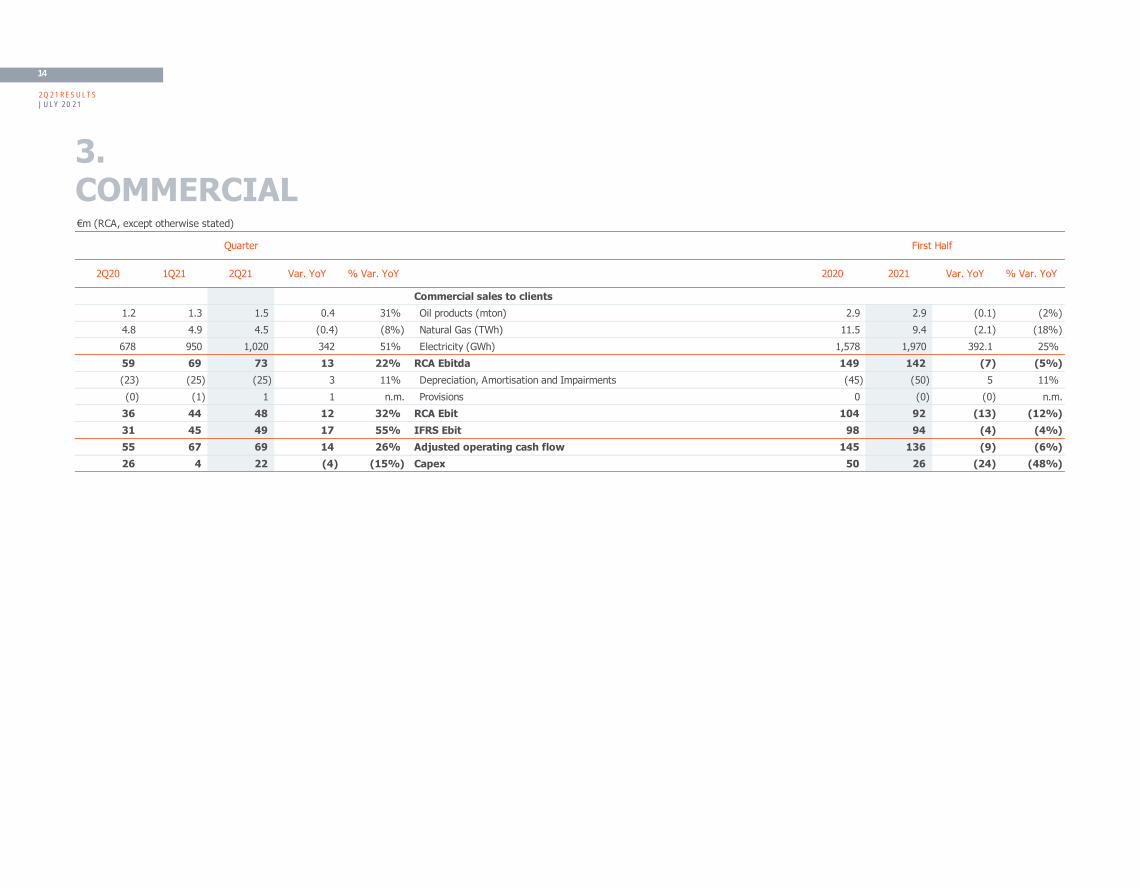
3. COMMERCIAL
€m (RCA, except otherwise stated)
2Q20 1Q21 2Q21 Var. YoY % Var. YoY 2020 2021 Var. YoY % Var. YoY
Commercial sales to clients
1.2 1.3 1.5 0.4 31% Oil products (mton) 2.9 2.9 (0.1) (2%)
4.8 4.9 4.5 (0.4) (8%) Natural Gas (TWh) 11.5 9.4 (2.1) (18%)
678 950 1,020 342 51% Electricity (GWh) 1,578 1,970 392.1 25%
59 69 73 13 22% RCA Ebitda 149 142 (7) (5%)
(23) (25) (25) 3 11% Depreciation, Amortisation and Impairments (45) (50) 5 11%
(0) (1) 1 1 n.m. Provisions 0 (0) (0) n.m.
36 44 48 12 32% RCA Ebit 104 92 (13) (12%)
31 45 49 17 55% IFRS Ebit 98 94 (4) (4%)
55 67 69 14 26% Adjusted operating cash flow 145 136 (9) (6%)
26 4 22 (4) (15%) Capex 50 26 (24) (48%)
First HalfQuarter

15 2Q21 RESULTS JULY 2021
Second quarter 2021
Operations
Oil products’ sales increased 31% YoY to 1.5 mton, reflecting the demand recovery
following the effects of the pandemic and easing of restrictions to mobility in Iberia, which
supported both B2B and B2C segments.
Natural gas volumes sold declined 8% YoY to 4.5 TWh, following the lower consumption
from the B2B segment in Spain.
Sales of electricity were 1,020 TWh, 51% up YoY, supported by a higher customer
acquisition.
Results
RCA Ebitda for the Commercial business was €73 m, up 22% YoY, while OCF was €69 m,
up 26% YoY, also benefiting from the relief of mobility restrictions in Iberia.
RCA Ebit was €48 m, while IFRS Ebit was €49 m.
First half 2021
Operations
Total oil products’ sales were 2.9 mton, down 2% YoY, as 1H21 was impacted by
intermittent mobility restrictions and a weaker economic environment in Iberia. Note that,
in 2020, the impacts from the Covid outbreak in demand were mostly felt from 2Q20
onwards.
Natural gas volumes were 9.4 TWh, down 18% YoY, impacted by the lower sales in B2B
segment.
Electricity sales were 1,970 TWh, 25% higher YoY, reflecting a higher customer acquisition.
Results
RCA Ebitda decreased 5% YoY to €142 m, reflecting the slightly lower volumes of oil
products and natural gas sold to direct clients during the period. OCF was €136 m, down
6% YoY.
RCA Ebit was €92 m, while IFRS Ebit was €94 m.

16 2Q21 RESULTS JULY 2021
c
INDUSTRIAL & ENERGY MANAGEMENT

17 2Q21 RESULTS JULY 2021
4. INDUSTRIAL & ENERGY MANAGEMENT
Note: Following the decision to discontinue refining activities in Matosinhos, 2021 refining indicators only reflect Sines refinery operations.
1 Impact on Ebitda. 2 Includes volumes sold to the Commercial segment.
€m (RCA, except otherwise stated)
2Q20 1Q21 2Q21 Var. YoY % Var. YoY 2020 2021 Var. YoY % Var. YoY
13.4 19.7 21.0 7.6 57% Raw materials processed (mboe) 40.2 40.7 0.5 1%
11.3 16.8 18.6 7.4 65% Crude processed (mbbl) 36.4 35.5 (1.0) (3%)
1.8 1.9 2.4 0.5 28% Galp refining margin (USD/boe) 1.9 2.1 0.3 15%
2.3 1.8 1.5 (0.8) (34%) Refining cost (USD/boe) 2.8 1.7 (1.1) (40%)
0.6 (0.0) (0.1) (0.7) n.m. Refining margin hedging1 (USD/boe) 0.4 (0.0) (0.5) n.m.
2.5 3.6 3.6 1.1 44% Oil products supply2 (mton) 6.7 7.2 0.6 8%
11.7 18.3 18.1 6.4 55% NG/LNG supply & trading volumes2 (TWh) 29.4 36.4 7.0 24%
3.7 8.3 9.1 5.4 n.m. Trading (TWh) 4.6 17.4 12.8 n.m.
324 331 269 (55) (17%) Sales of electricity from cogeneration (GWh) 664 600 (64) (10%)
19 (6) 50 31 n.m. RCA Ebitda 109 45 (64) (59%)
(79) (61) (60) (19) (24%) Depreciation, Amortisation and Impairments (159) (120) (38) (24%)
(0) (0) 0 0 n.m. Provisions (1) (0) (0) (78%)
(60) (67) (9) (51) (85%) RCA Ebit (51) (76) 25 50%
(171) 49 61 232 n.m. IFRS Ebit (540) 110 650 n.m.
49 (9) 64 15 31% Adjusted operating cash flow 134 55 (79) (59%)
23 7 11 (12) (53%) Capex 36 18 (19) (52%)
Quarter First Half
18 2Q21 RESULTS JULY 2021
Second quarter 2021
Following the decision to discontinue refining activities in Matosinhos, 2021 Industrial &
Energy Management indicators exclude Matosinhos refining contribution. The 2020 figures
were kept as reported, including Matosinhos’ contribution.
Operations
Raw materials processed in the quarter were 21.0 mboe, 57% higher YoY, considering the
significant operational slowdown of the refining system in 2Q20 to face the low demand
caused by the lockdown measures.
Total supply of oil products increased 44% YoY to 3.6 mton, following the demand
improvement, as 2Q20 was highly impacted by lockdown restrictions in Iberia.
Supply & trading volumes of NG/LNG increased YoY to 18.1 TWh, driven by increased
network trading of natural gas.
Sales of electricity to the grid from the cogeneration plants were down 17% YoY to
269 GWh, given the lower contribution from Matosinhos’ cogeneration.
Results
RCA Ebitda for Industrial & Energy Management was €50 m, up from
€19 m during 2Q20. OCF was €64 m, up 31% YoY.
Galp’s refining margin was up YoY to $2.4/boe, following a marginally improved refining
environment, despite pressured by higher crude oil prices and impacted by some
operational constraints in the FCC unit during the quarter.
Refining costs were €27 m or $1.5/boe, in unit terms, considering Sines refining operations.
The industrial contribution, which includes refining, cogeneration and logistics activities,
also reflected an increased contribution from cogeneration operations YoY.
Energy Management Ebitda was supported by a higher contribution from trading gas,
despite the one-off regasification costs in Portugal for 2021. It should be noted that trading
gas Ebitda benefited from timing differences on derivative gains, which should be partially
reverted during 2H21. RCA Ebit was -€9 m and IFRS Ebit was €61 m.
First half 2021
Operations
Raw materials processed were 40.7 mboe during the period, in line YoY, now just
considering the processing capacity of Sines refinery and reflecting last year operational
slowdowns.
Crude oil accounted for 87% of raw materials processed, of which 88% corresponded to
medium and heavy crudes. All crudes processed were sweet grades.
Middle distillates (diesel and jet) accounted for 45% of production, gasoline for 24% and
fuel oil for 22%. Consumption and losses accounted for 8% of raw materials processed.
Total oil products supplied increased 8% YoY to 7.2 mton, driven by improved market
conditions in Iberia.
Supply & trading volumes of NG/LNG were 36.4 TWh, up 46% YoY, following the higher
volumes in the network trading activities.
Sales of electricity to the grid were 600 GWh during the period, down 10% YoY, following
the lower contribution from Matosinhos’ cogeneration.
Results
RCA Ebitda for Industrial & Energy Management decreased €64 m YoY to €45 m, despite
the improved refining performance in 2021, as 1Q20 benefited from a material positive
swing in pricing lag effects due to the abrupt decline in commodities prices. OCF was
€55 m.
Galp’s refining margin was up YoY, from $1.9/boe to $2.1/boe, following the slight
improvement of the international refining environment.
Refining costs decreased YoY from $2.8/boe to $1.7/boe, now only reflecting Sines
operational costs, and as last year the system operated under sub optimal conditions.
Industrial results reflect the improvement of the international refining environment YoY
and a higher contribution from cogeneration activities, despite lower sales.

19 2Q21 RESULTS JULY 2021
Energy Management contribution decreased YoY, mostly as a result of the swing in oil
pricing lag formulas, the impacts from gas sourcing restrictions during 1Q21 and the
increased regasification costs in Portugal. It should be noted that in 1H21 trading gas
benefited from timing differences on derivative gains, which should be partially reverted
during 2H21.
RCA Ebit was -€76 m and IFRS Ebit was €110 m.

20 2Q21 RESULTS JULY 2021
RENEWABLES & NEW Businesses

21 2Q21 RESULTS JULY 2021
5. RENEWABLES & NEW BUSINESSES
1 Pro-forma considers all Renewables projects as if they were consolidated
€m (RCA, except otherwise stated)
2Q20 1Q21 2Q21 Var. YoY % Var. YoY 2020 2021 Var. YoY % Var. YoY
Renewable power generation (GWh)
6 191 475 469 n.m. Gross 15 667 652 n.m.
3 141 355 352 n.m. Net to Galp 8 496 489 n.m.
- 42.3 69.1 n.m. n.m. Galp average solar generation sale price (EUR/MWh) - 61.6 n.m. n.m.
(4) (2) (6) 2 58% RCA Ebitda (4.6) (8) 4 79%
(9) (3) (5) (4) (45%) RCA Ebit (16) (8) (8) (52%)
(9) (3) (5) (4) (45%) IFRS Ebit (16) (8) (8) (52%)
(4) (2) (2) (2) (56%) Adjusted operating cash flow (4) (4) (1) (12%)
2 15 51 49 n.m. Capex 2 66 63 n.m.
First HalfQuarter
€m
2Q20 1Q21 2Q21 Var. YoY % Var. YoY 2020 2021 Var. YoY % Var. YoY
Renewables pro-forma - equity to Galp1
(1) 2 17 18 n.m. Ebitda (1) 19 20 n.m.
(1) (3) 11 12 n.m. Ebit (1) 8 9 n.m.
(1) 2 17 18 n.m. Renewables pro-forma adjusted operating cash flow (1) 19 20 n.m.
Quarter First Half

22 2Q21 RESULTS JULY 2021
Operations
Following the closing of the solar acquisition in September 2020 (here), Galp’s current
installed generation capacity consists of 926 MW, on a 100% basis, of which 914 MW from
solar PV projects and the remaining from a 12 MW wind farm in Portugal.
Renewable energy generation, on a 100% basis, was significantly up QoQ to 475 GWh,
driven by normalised operations and seasonally higher sunlight hours. Considering Galp’s
equity stake in these businesses, renewable generation was 355 GWh.
In the first half of 2021, renewable energy generation amounted to 667 GWh, on a 100%
basis, and 496 GWh considering Galp’s equity stake, partially impacted by operational
transformers issues.
Results
Galp’s average sale price was up from €42/MWh to €69/MWh QoQ, driven by the increase
in gas and CO2 prices and low hydro and wind generation in Iberia.
Renewables & New Businesses RCA Ebitda of -€6 m in 2Q21 mostly includes G&A and
corporate expenses.
Renewables pro-forma Ebitda, considering all projects as if they were consolidated
according to Galp’s equity stakes, was €17 m in 2Q21, up €14 m QoQ, following the higher
renewable energy generation and increased solar generation prices. Pro-forma OCF was
€17 m in 2Q21.
In 1H21, renewables pro-forma Ebitda reached €19 m and OCF €19 m.
Under Development Total
Galp Renewable capacity (MW)
Gross 2,603 3,908
Spain 2,252 3,401
Portugal 351 507
Equity to Galp (pro-forma) 2,173 3,185
Spain 1,822 2,684
Portugal 351 501
686 177
6 144
692 321
926 379
In operation Under Construction
914 235
12 144
23 2Q21 RESULTS JULY 2021
FINANCIAL DATA
24 2Q21 RESULTS JULY 2021
6. FINANCIAL DATA
6.1 Income Statement
1 Includes income taxes and taxes on oil and natural gas production, such as SPT payable in Brazil and IRP payable in Angola.
€m (RCA, except otherwise stated)
2Q20 1Q21 2Q21 Var. YoY % Var. YoY 2020 2021 Var. YoY % Var. YoY
1,965 3,338 3,636 1,671 85% Turnover 5,654 6,974 1,320 23%
(1,307) (2,411) (2,695) 1,388 n.m. Cost of goods sold (3,880) (5,106) 1,226 32%
(355) (356) (352) (3) (1%) Supply & Services (805) (708) (97) (12%)
(68) (70) (68) (0) (0%) Personnel costs (150) (138) (12) (8%)
58 (0) 53 (5) (9%) Other operating revenues (expenses) (56) 52 108 n.m.
(2) 0 (3) 1 56% Impairments on accounts receivable (4) (3) (0) (12%)
291 499 571 281 97% RCA Ebitda 760 1,071 311 41%
207 644 644 436 n.m. IFRS Ebitda 332 1,287 955 n.m.
(338) (216) (266) (72) (21%) Depreciation, Amortisation and Impairments (584) (482) (101) (17%)
(9) 0 (0) (9) (97%) Provisions (15) (0) (15) (99%)
(57) 284 305 362 n.m. RCA Ebit 161 588 428 n.m.
(144) 427 376 520 n.m. IFRS Ebit (271) 803 1,074 n.m.
24 (0) 26 2 10% Net income from associates 43 26 (17) (39%)
(10) (55) (4) (6) (59%) Financial results (70) (59) (10) (15%)
(7) (9) (7) 0 2% Net interests (12) (16) 4 32%
5 3 4 (1) (26%) Capitalised interest 11 7 (4) (34%)
(32) (16) 8 39 n.m. Exchange gain (loss) (88) (9) (79) (90%)
18 - (0) (18) n.m. Mark-to-market of derivatives (66) (0) (66) (100%)
(21) (19) (18) (2) (12%) Interest on leases (IFRS 16) (41) (37) (4) (11%)
26 (14) 10 (16) (63%) Other financial costs/income 127 (5) (131) n.m.
(43) 228 327 370 n.m. RCA Net income before taxes and minority interests 134 555 421 n.m.
(20) (181) (153) 133 n.m. Taxes (166) (334) 167 n.m.
(50) (109) (142) 91 n.m. Taxes on oil and natural gas production1 (149) (250) 101 68%
12 (22) (34) (46) n.m. Non-controlling interests 10 (56) (66) n.m.
(52) 26 140 192 n.m. RCA Net income (22) 166 188 n.m.
(18) 34 (137) 119 n.m. Special items (26) (103) 77 n.m.
(70) 60 3 73 n.m. RC Net income (48) 63 111 n.m.
(84) 101 68 152 n.m. Inventory effect (362) 169 531 n.m.
(154) 161 71 225 n.m. IFRS Net income (410) 232 642 n.m.
Quarter First Half

25 2Q21 RESULTS JULY 2021
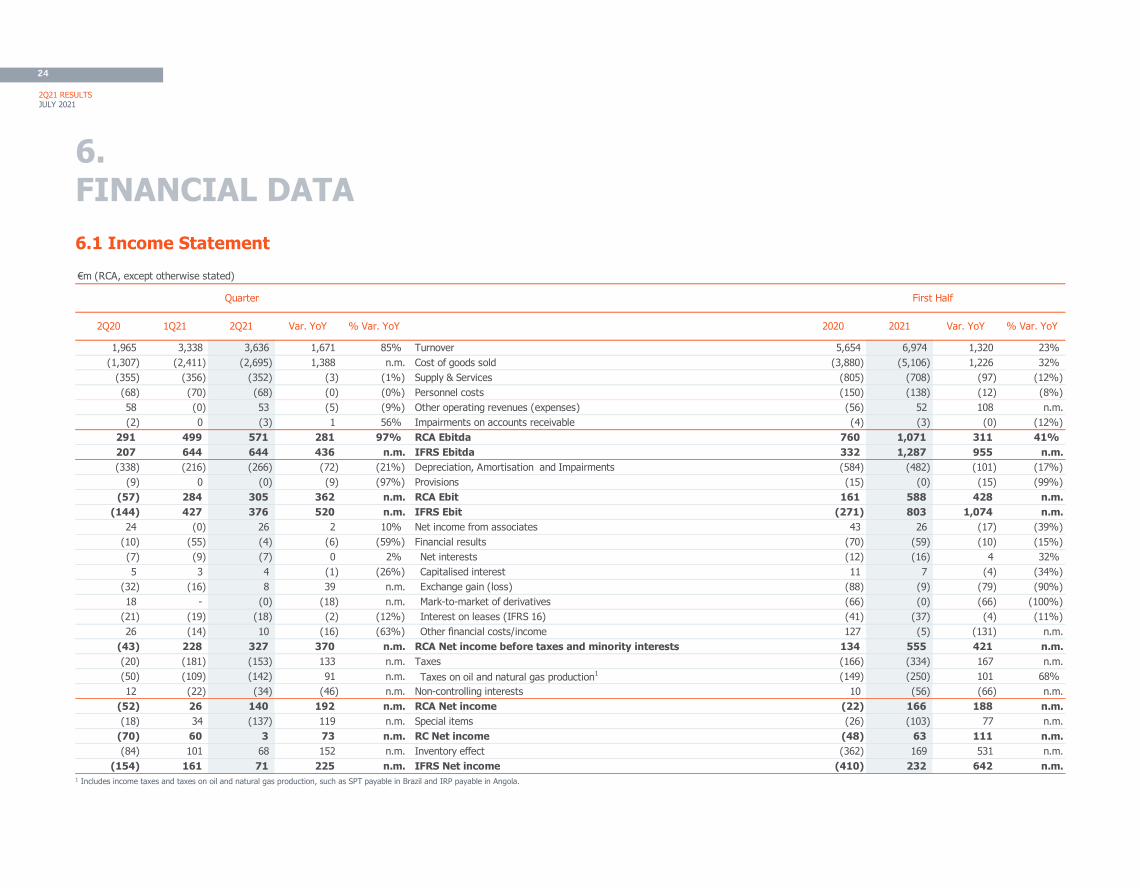
Second quarter 2021
RCA Ebitda increased €281 m YoY to €571 m, driven by a higher Upstream contribution,
supported by increased oil prices, as well as a less challenged downstream performance.
IFRS Ebitda amounted to €644 m, considering -€92 m of inventory effect.
RCA Ebit was up to €305 m, supported by the RCA Ebitda increase and benefiting from
lower DD&A and impairments, despite including the impairments registered in Upstream
of €50 m. IFRS Ebit was €376 m.
Income from associated companies was €26 m, flat YoY, reflecting the contribution from
the international pipelines and the solar renewables joint venture.
Financial results were -€4 m, impacted by positive FX differences registered in the period
and a reclassification of premiums paid for expired Brent put options, now presented
within Ebitda (€18 m booked in 2Q21).
RCA taxes increased YoY, from €20 m to €153 m, following the higher Upstream taxes.
Non-controlling interests of -€34 m, mostly attributed to Sinopec’s stake in Petrogal Brasil.
RCA net income was €140 m, IFRS net income was €71 m, positively impacted by
€68 m of inventory effect and negatively impacted by -€137 m of special items, which
includes Matosinhos operations and mark-to-market of derivatives to hedge client
positions.
Note: for the purpose of better assessing Galp’s recurrent performance, from 1Q21 onwards mark-
to-market swings related with derivative hedges to cover client positions, which have no direct
translation into operational results, are considered as special items. No adjustments were made in
the reported figures from previous periods.
First half 2021
RCA Ebitda of €1,071 m was 41% higher YoY, supported by improved market conditions
during the period.
RCA Ebit was €588 m, up from €161 m in 1H20, following higher operational contribution,
however reflecting the booking of impairments of €48 m in exploration assets in Upstream.
Financial results were -€59 m, mainly reflecting IFRS 16 leases interests and FX differences
registered in the period.
RCA taxes increased YoY from €166 m to €334 m, following the higher production taxes
in Upstream.
Non-controlling interests of -€56 m are related with Sinopec’s stake in Petrogal Brasil.
RCA net income was €166 m, while IFRS net income was €232 m, with special items of
-€103 m and a positive inventory effect of €169 m.
26 2Q21 RESULTS JULY 2021
6.2 Capital Expenditure
1 Capex figures based in change in assets during the period.
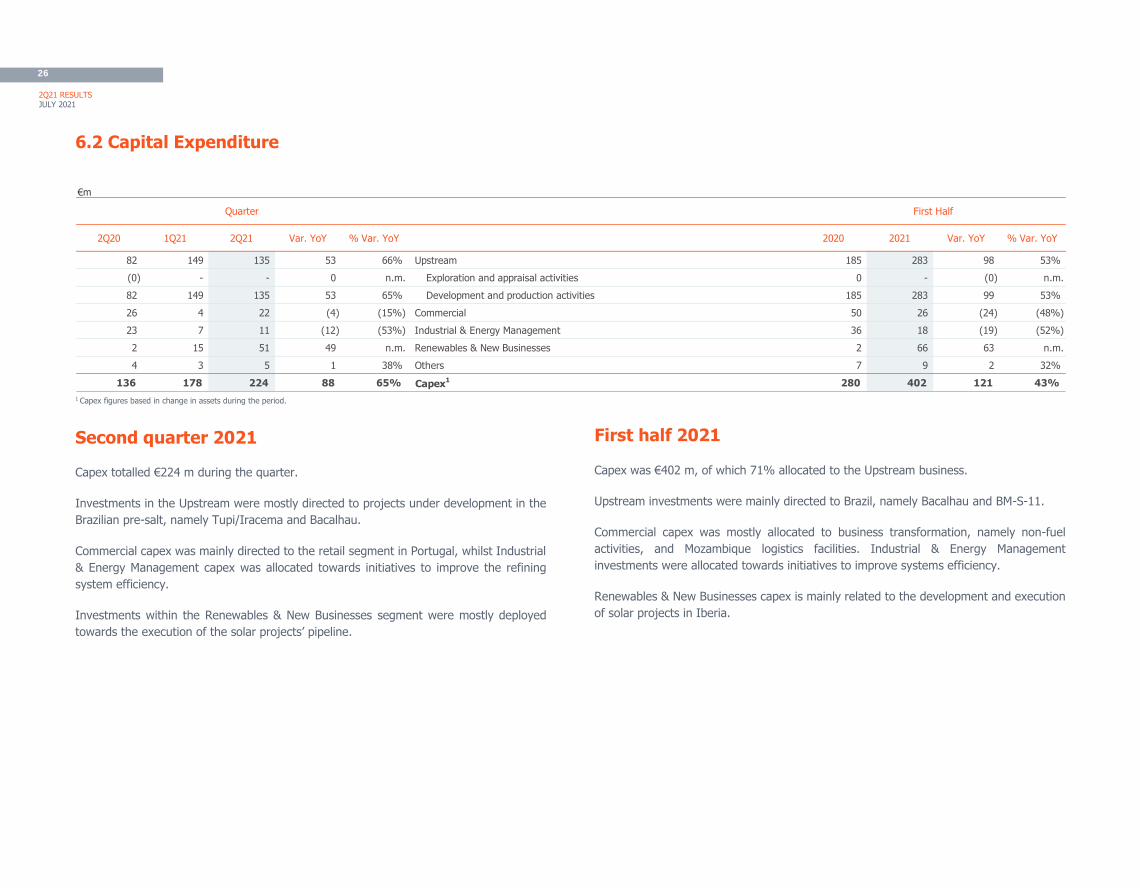
Second quarter 2021
Capex totalled €224 m during the quarter.
Investments in the Upstream were mostly directed to projects under development in the
Brazilian pre-salt, namely Tupi/Iracema and Bacalhau.
Commercial capex was mainly directed to the retail segment in Portugal, whilst Industrial
& Energy Management capex was allocated towards initiatives to improve the refining
system efficiency.
Investments within the Renewables & New Businesses segment were mostly deployed
towards the execution of the solar projects’ pipeline.
First half 2021
Capex was €402 m, of which 71% allocated to the Upstream business.
Upstream investments were mainly directed to Brazil, namely Bacalhau and BM-S-11.
Commercial capex was mostly allocated to business transformation, namely non-fuel
activities, and Mozambique logistics facilities. Industrial & Energy Management
investments were allocated towards initiatives to improve systems efficiency.
Renewables & New Businesses capex is mainly related to the development and execution
of solar projects in Iberia.
€m
2Q20 1Q21 2Q21 Var. YoY % Var. YoY 2020 2021 Var. YoY % Var. YoY
82 149 135 53 66% Upstream 185 283 98 53%
(0) - - 0 n.m. Exploration and appraisal activities 0 - (0) n.m.
82 149 135 53 65% Development and production activities 185 283 99 53%
26 4 22 (4) (15%) Commercial 50 26 (24) (48%)
23 7 11 (12) (53%) Industrial & Energy Management 36 18 (19) (52%)
2 15 51 49 n.m. Renewables & New Businesses 2 66 63 n.m.
4 3 5 1 38% Others 7 9 2 32%
136 178 224 88 65% Capex1 280 402 121 43%
Quarter First Half

27 2Q21 RESULTS JULY 2021
6.3 Cash Flow
1 2021 includes the proceeds from the GGND stake sale of €368 m.
2 Mainly dividends paid to Sinopec.
€m (IFRS figures)
2Q20 1Q21 2Q21 2020 2021
291 499 571 RCA Ebitda 760 1,071
34 48 42 Dividends from associates 35 90
(85) (102) (144) Taxes paid (250) (246)
239 445 470 Adjusted operating cash flow 544 914
33 11 (20) Special items 68 (9)
(116) 133 92 Inventory effect (496) 225
4 (212) (102) Changes in working capital 287 (314)
160 377 440 Cash flow from operations 404 817
(149) 195 (186) Net capex1 (360) 8
(13) (36) (7) Net financial expenses (38) (43)
(21) (19) (18) IFRS 16 leases interest (44) (37)
(43) - - Realised income from derivatives 62 -
83 - - Proceeds from equalisation 83 -
16 518 228 Free cash flow 107 746
(86) - (78) Dividends paid to non-controlling interest2 (194) (78)
(318) - (290) Dividends paid to Galp shareholders (318) (290)
(27) (27) (28) Reimbursement of IFRS 16 leases principal (54) (54)
(21) 22 9 Others (37) 31
436 (513) 159 Change in financial net debt 497 (354)
Quarter First Half
28 2Q21 RESULTS JULY 2021
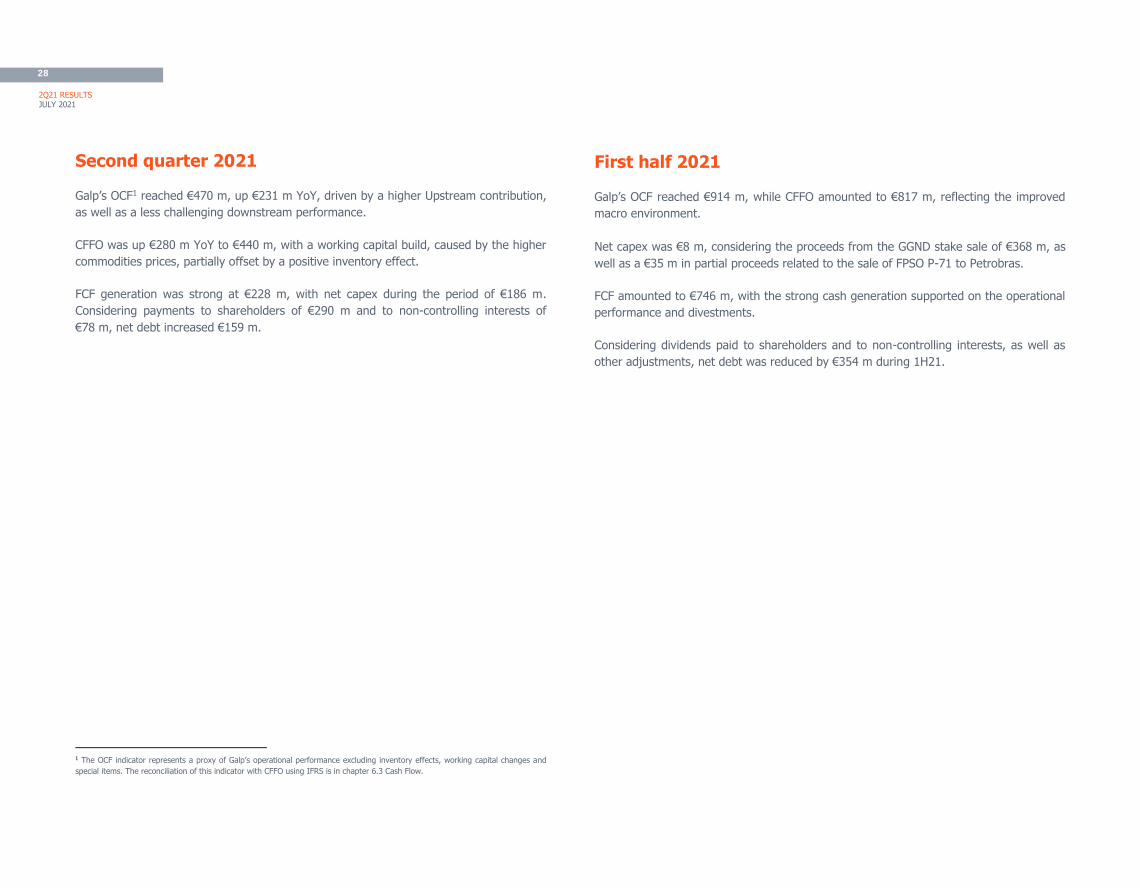
Second quarter 2021
Galp’s OCF1 reached €470 m, up €231 m YoY, driven by a higher Upstream contribution,
as well as a less challenging downstream performance.
CFFO was up €280 m YoY to €440 m, with a working capital build, caused by the higher
commodities prices, partially offset by a positive inventory effect.
FCF generation was strong at €228 m, with net capex during the period of €186 m.
Considering payments to shareholders of €290 m and to non-controlling interests of
€78 m, net debt increased €159 m.
1 The OCF indicator represents a proxy of Galp’s operational performance excluding inventory effects, working capital changes and
special items. The reconciliation of this indicator with CFFO using IFRS is in chapter 6.3 Cash Flow.
First half 2021
Galp’s OCF reached €914 m, while CFFO amounted to €817 m, reflecting the improved
macro environment.
Net capex was €8 m, considering the proceeds from the GGND stake sale of €368 m, as
well as a €35 m in partial proceeds related to the sale of FPSO P-71 to Petrobras.
FCF amounted to €746 m, with the strong cash generation supported on the operational
performance and divestments.
Considering dividends paid to shareholders and to non-controlling interests, as well as
other adjustments, net debt was reduced by €354 m during 1H21.

29 2Q21 RESULTS JULY 2021
6.4 Financial Position
On June 30, 2021, net fixed assets were €6,284 m, including work-in-progress of €1,550 m, mostly related to the Upstream business.
Equity was down €302 m QoQ, mostly reflecting the distributions to shareholders and to minorities in the quarter.
€m (IFRS figures)
31 Dec. 2020 31 Mar. 2021 30 Jun. 2021Var. vs
31 Dec. 2020
Var. vs
31 Mar. 2021
Net fixed assets 6,259 6,374 6,284 25 (91)
Rights of use (IFRS 16) 1,002 1,033 1,008 6 (25)
Working capital 703 916 1,017 314 102
Other assets/liabilities (710) (1,119) (1,267) (558) (149)
Capital employed 7,254 7,204 7,042 (212) (162)
Short term debt 539 84 177 (362) 93
Medium-Long term debt 3,204 3,207 3,068 (137) (139)
Total debt 3,743 3,291 3,244 (499) (47)
Cash and equivalents 1,678 1,739 1,533 (144) (206)
Net debt 2,066 1,552 1,711 (354) 159
Leases (IFRS 16) 1,089 1,125 1,105 17 (20)
Equity 4,100 4,527 4,225 125 (302)
Equity, net debt and leases 7,254 7,204 7,042 (212) (162)

30 2Q21 RESULTS JULY 2021
6.5 Financial debt
1 Debt does not include Financial leases. 2 Ratio considers the LTM Ebitda RCA (€1,697 m), which includes the adjustment for the impact from the application of IFRS 16 (€184 m).
On June 30, 2021, net debt was €1,711 m, up €159 m QoQ, impacted by dividends
payments to shareholders and to non-controlling interests.
Net debt to RCA Ebitda decreased to 1.0x, reaching the Company’s target leverage ratio.
At the end of the period, Galp had unused credit lines of approximately €1.1 bn, of which
c.75% were contractually guaranteed.
Debt maturity profile (€ m)
€m (except otherwise stated)
31 Dec. 2020 31 Mar. 2021 30 Jun. 2021Var. vs
31 Dec. 2020
Var. vs
31 Mar. 2021
Cash and equivalents 1,678 1,739 1,533 (144) (206)
Undrawn credit facilities 1,262 1,263 1,133 (130) (130)
Bonds 2,904 2,412 2,410 (493) (2)
Bank loans and other debt 840 879 834 (6) (45)
Net debt 2,066 1,552 1,711 (354) 159
Leases (IFRS 16) 1,089 1,125 1,105 17 (20)
Average life (years)1 2.8 3.0 2.7 (0.1) (0.2)
Average funding cost1 1.7% 1.5% 1.4% (0 p.p.) (0 p.p.)
Debt at floating rate1 52% 60% 60% 8 p.p. (0 p.p.)
Net debt to RCA Ebitda 2 1.5x 1.1x 1.0x -0.5x -0.1x
0
200
400
600
800
1,000
2021 2022 2023 2024 2025 2026+
@30 jun 2021 @31 mar 2021

31 2Q21 RESULTS JULY 2021
Reconciliation of IFRS and RCA figures
Ebitda by segment
€m
2021
IFRS
Ebitda
Inventory
effect
RC
EbitdaSpecial items
RCA
Ebitda
IFRS
Ebitda
Inventory
effect
RC
EbitdaSpecial items
RCA
Ebitda
644 (92) 551 20 571 Galp 1,287 (225) 1,062 9 1,071
467 - 467 0 467 Upstream 932 - 932 (26) 906
74 (1) 73 - 73 Commercial 144 (2) 142 - 142
122 (91) 30 20 50 Ind. & Energy Management 233 (223) 9 35 45
(6) - (6) - (6) Renewables & New Businesses (8) - (8) - (8)
(13) - (13) (0) (13) Others (13) - (13) (0) (13)
Ebit by segment
€m
2021
IFRS
Ebit
Inventory
effect
RC
EbitSpecial items
RCA
Ebit
IFRS
Ebit
Inventory
effect
RC
EbitSpecial items
RCA
Ebit
376 (92) 283 21 305 Galp 803 (225) 578 11 588
290 - 290 0 290 Upstream 630 - 630 (26) 603
49 (1) 48 - 48 Commercial 94 (2) 92 - 92
61 (91) (30) 21 (9) Ind. & Energy Management 110 (223) (113) 37 (76)
(5) - (5) - (5) Renewables & New Businesses (8) - (8) - (8)
(19) - (19) - (19) Others (23) - (23) - (23)
First Half
First HalfSecond Quarter
Second Quarter

32 2Q21 RESULTS JULY 2021
Special items
1 Includes adjustments from the correspondent CESE, previously booked at GGND.
€m
2Q20 1Q21 2Q21 2020 2021
(33) (11) 20 Items impacting Ebitda (68) 9
(31) - - Margin (Change in production) - Unitisation (31) -
(2) - - Exchange rate differences related with Brazil unitisation processes (38) -
- (26) 0 Termination agreement for service and equipment (P-71) - (26)
- 15 20 Matosinhos Refinery operations (under decomissioning) - 35
4 1 1 Items impacting non-cash costs 4 2
4 - - Depreciations and Amortisations - Unitisation 4 -
- 1 1 Asset impairments (Matosinhos Refinery) - 2
(61) (61) 184 Items impacting financial results (54) 123
1 10 1 Gains/losses on financial investments (GGND)1 8 11
(67) - - Gains/losses on financial investments - Unitisation (67) -
5 - - Financial costs - Unitisation 5 -
- (37) 185 Mark-to-Market of derivatives - 148
- (33) (2) MTM of derivatives and FX from natural gas derivatives - (35)
112 31 (75) Items impacting taxes 141 (44)
8 24 (62) Taxes on special items 20 (37)
96 (3) (22) BRL/USD FX impact on deferred taxes in Brazil 96 (25)
8 10 8 Energy sector contribution taxes 25 18
(4) 6 7 Non-controlling interests (Unitisation and FX on deferred taxes Brazil) 3 12
18 (34) 137 Total special items 26 103
Quarter First Half
33 2Q21 RESULTS JULY 2021
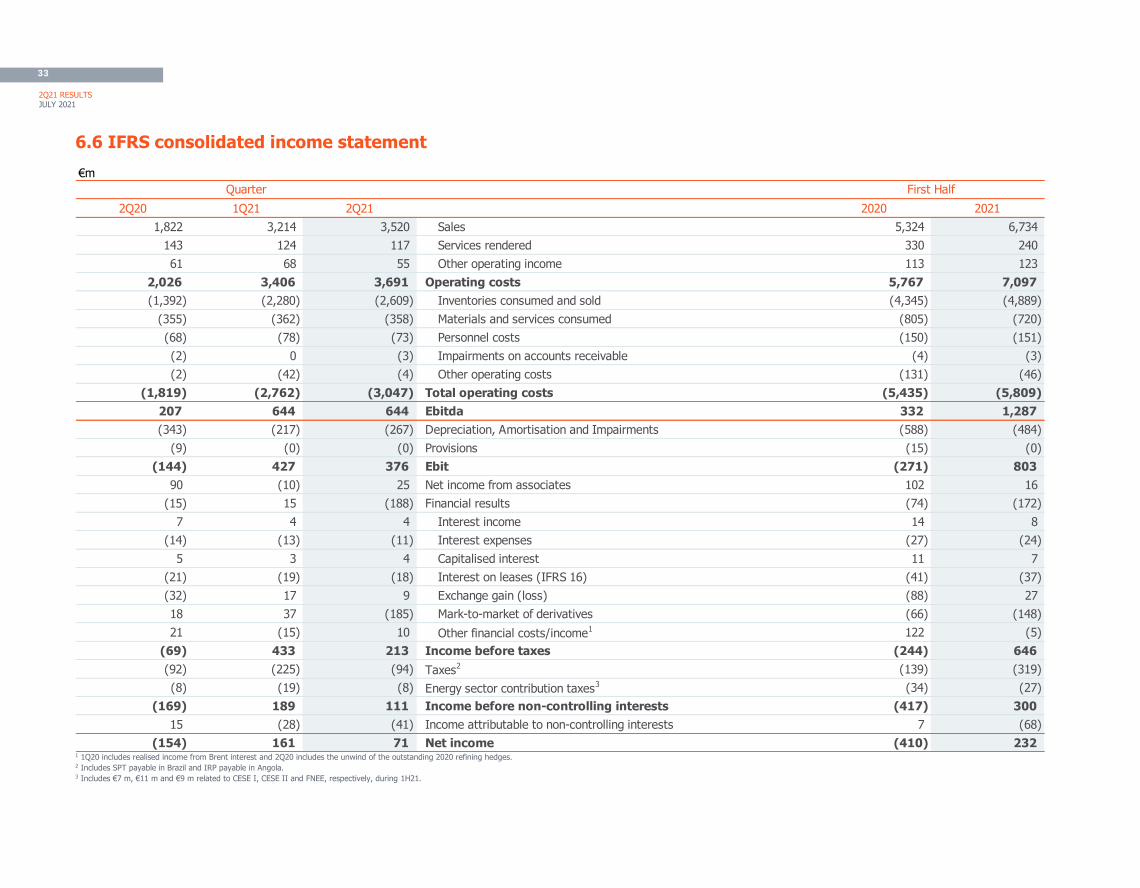
6.6 IFRS consolidated income statement
1 1Q20 includes realised income from Brent interest and 2Q20 includes the unwind of the outstanding 2020 refining hedges. 2 Includes SPT payable in Brazil and IRP payable in Angola. 3 Includes €7 m, €11 m and €9 m related to CESE I, CESE II and FNEE, respectively, during 1H21.
€m
2Q20 1Q21 2Q21 2020 2021
1,822 3,214 3,520 Sales 5,324 6,734
143 124 117 Services rendered 330 240
61 68 55 Other operating income 113 123
2,026 3,406 3,691 Operating costs 5,767 7,097
(1,392) (2,280) (2,609) Inventories consumed and sold (4,345) (4,889)
(355) (362) (358) Materials and services consumed (805) (720)
(68) (78) (73) Personnel costs (150) (151)
(2) 0 (3) Impairments on accounts receivable (4) (3)
(2) (42) (4) Other operating costs (131) (46)
(1,819) (2,762) (3,047) Total operating costs (5,435) (5,809)
207 644 644 Ebitda 332 1,287
(343) (217) (267) Depreciation, Amortisation and Impairments (588) (484)
(9) (0) (0) Provisions (15) (0)
(144) 427 376 Ebit (271) 803
90 (10) 25 Net income from associates 102 16
(15) 15 (188) Financial results (74) (172)
7 4 4 Interest income 14 8
(14) (13) (11) Interest expenses (27) (24)
5 3 4 Capitalised interest 11 7
(21) (19) (18) Interest on leases (IFRS 16) (41) (37)
(32) 17 9 Exchange gain (loss) (88) 27
18 37 (185) Mark-to-market of derivatives (66) (148)
21 (15) 10 Other financial costs/income1 122 (5)
(69) 433 213 Income before taxes (244) 646
(92) (225) (94) Taxes2 (139) (319)
(8) (19) (8) Energy sector contribution taxes3 (34) (27)
(169) 189 111 Income before non-controlling interests (417) 300
15 (28) (41) Income attributable to non-controlling interests 7 (68)
(154) 161 71 Net income (410) 232
Quarter First Half

34 2Q21 RESULTS JULY 2021
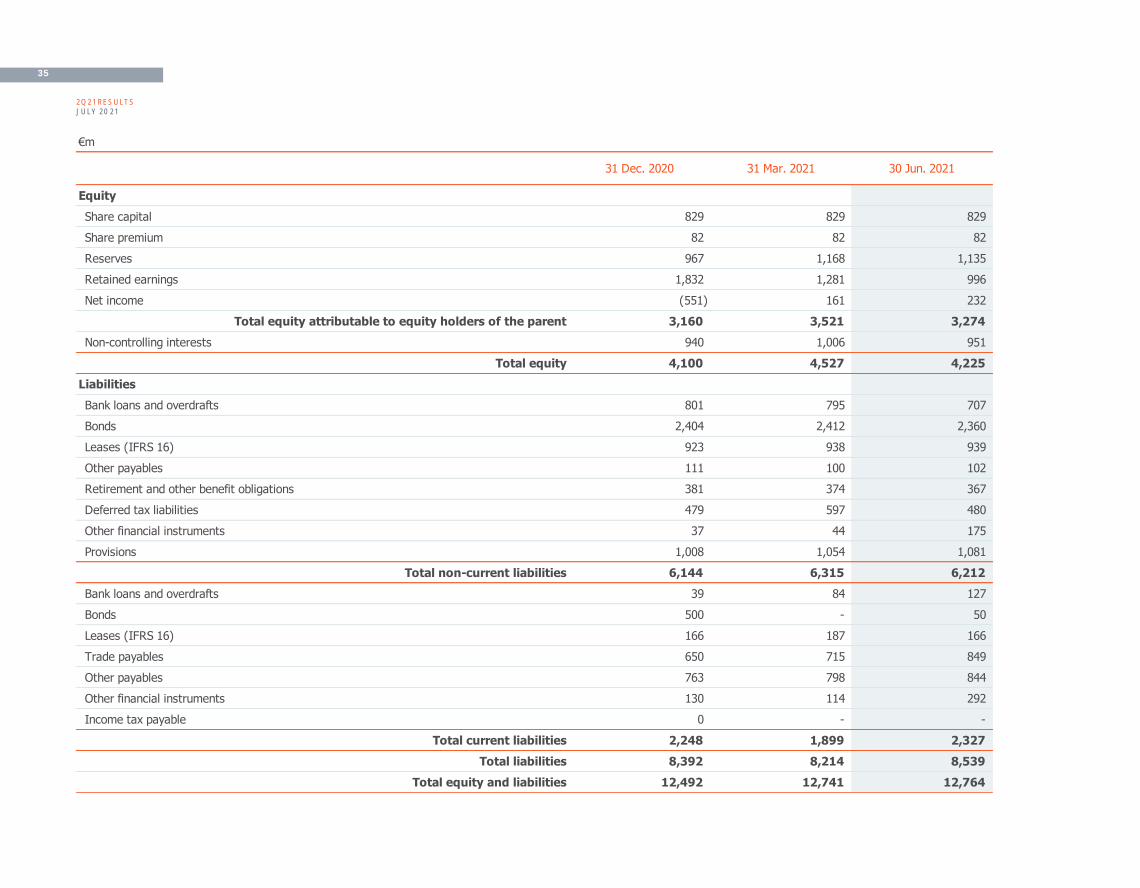
6.7 Consolidated financial Position
1 Includes €37 m of stocks made on behalf of third parties on 30 June 2021.
€m
31 Dec. 2020 31 Mar. 2021 30 Jun. 2021
Assets
Tangible fixed assets 4,878 5,102 4,988
Goodwill 85 86 90
Other intangible fixed assets 532 552 543
Rights of use (IFRS 16) 1,002 1,033 1,008
Investments in associates 483 355 339
Receivables 267 268 279
Deferred tax assets 509 548 479
Financial investments 402 459 614
Total non-current assets 8,157 8,402 8,340
Inventories1 708 798 852
Trade receivables 781 922 1,063
Other receivables 877 595 559
Financial investments 190 238 360
Current Income tax recoverable 101 47 57
Cash and equivalents 1,678 1,739 1,533
Total current assets 4,335 4,339 4,424
Total assets 12,492 12,741 12,764
35 2Q21 RESULTS JULY 2021
€m
31 Dec. 2020 31 Mar. 2021 30 Jun. 2021
Equity
Share capital 829 829 829
Share premium 82 82 82
Reserves 967 1,168 1,135
Retained earnings 1,832 1,281 996
Net income (551) 161 232
Total equity attributable to equity holders of the parent 3,160 3,521 3,274
Non-controlling interests 940 1,006 951
Total equity 4,100 4,527 4,225
Liabilities
Bank loans and overdrafts 801 795 707
Bonds 2,404 2,412 2,360
Leases (IFRS 16) 923 938 939
Other payables 111 100 102
Retirement and other benefit obligations 381 374 367
Deferred tax liabilities 479 597 480
Other financial instruments 37 44 175
Provisions 1,008 1,054 1,081
Total non-current liabilities 6,144 6,315 6,212
Bank loans and overdrafts 39 84 127
Bonds 500 - 50
Leases (IFRS 16) 166 187 166
Trade payables 650 715 849
Other payables 763 798 844
Other financial instruments 130 114 292
Income tax payable 0 - -
Total current liabilities 2,248 1,899 2,327
Total liabilities 8,392 8,214 8,539
Total equity and liabilities 12,492 12,741 12,764

36 2Q21 RESULTS JULY 2021
BASIS OF REPORT

37 2Q21 RESULTS JULY 2021
7. BASIS OF REPORTING
Galp’s consolidated financial statements have been prepared in accordance with IFRS. The
financial information in the consolidated income statement and in the consolidated
financial position is reported for the quarters ended on June 30 and March 31, 2021 and
2020 and December 31, 2020.
Galp’s financial statements are prepared in accordance with IFRS, and the cost of goods
sold is valued at weighted-average cost. When goods and commodity prices fluctuate, the
use of this valuation method may cause volatility in results through gains or losses in
inventories, which do not reflect the Company’s operating performance. This is called the
inventory effect.
Another factor that may affect the Company’s results, without being an indicator of its
true performance, is the set of special items considering the Group’s activities.
For the purpose of evaluating Galp’s operating performance, RCA profitability measures
exclude special items and the inventory effect, the latter because the cost of goods sold
and materials consumed has been calculated according to the Replacement Cost (RC)
valuation method.
Following the decision to discontinue the Matosinhos refinery, the Company is now
booking all Matosinhos related activities as a special item, in order to provide a better
proxy of Galp’s refining operations going forward.
From 1Q21 onwards mark-to-market swings related with derivative hedges to cover client
positions, which have no direct translation into operational results, are considered as
special items. No adjustments were made in the reported figures from previous periods.
With regards to risks and uncertainties, please read Part I – C. III Internal control and risk
management of Corporate Governance Report 2020.

38 2Q21 RESULTS JULY 2021
APPENDIX
39 2Q21 RESULTS JULY 2021
8. APPENDIX
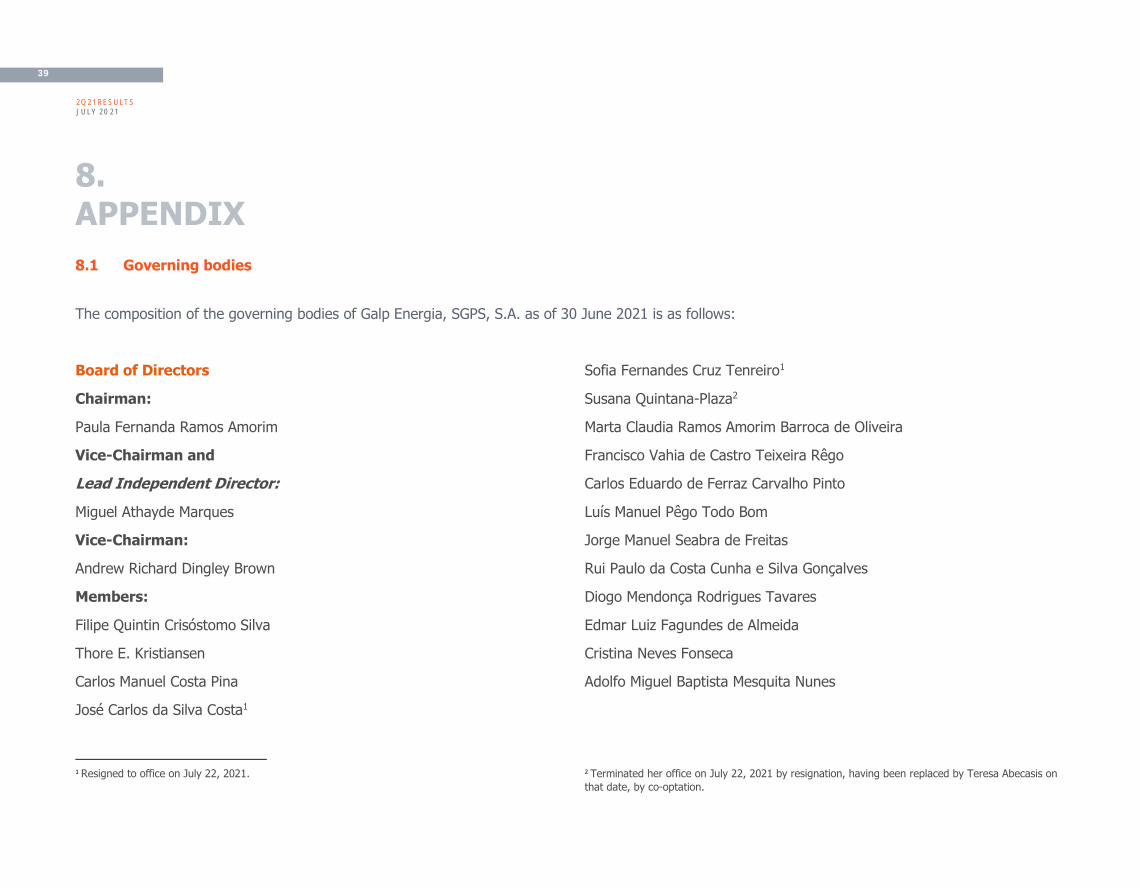
8.1 Governing bodies
The composition of the governing bodies of Galp Energia, SGPS, S.A. as of 30 June 2021 is as follows:
Board of Directors
Chairman:
Paula Fernanda Ramos Amorim
Vice-Chairman and
Lead Independent Director:
Miguel Athayde Marques
Vice-Chairman:
Andrew Richard Dingley Brown
Members:
Filipe Quintin Crisóstomo Silva
Thore E. Kristiansen
Carlos Manuel Costa Pina
José Carlos da Silva Costa1
1 Resigned to office on July 22, 2021.
Sofia Fernandes Cruz Tenreiro1
Susana Quintana-Plaza2
Marta Claudia Ramos Amorim Barroca de Oliveira
Francisco Vahia de Castro Teixeira Rêgo
Carlos Eduardo de Ferraz Carvalho Pinto
Luís Manuel Pêgo Todo Bom
Jorge Manuel Seabra de Freitas
Rui Paulo da Costa Cunha e Silva Gonçalves
Diogo Mendonça Rodrigues Tavares
Edmar Luiz Fagundes de Almeida
Cristina Neves Fonseca
Adolfo Miguel Baptista Mesquita Nunes
2 Terminated her office on July 22, 2021 by resignation, having been replaced by Teresa Abecasis on
that date, by co-optation.
40 2Q21 RESULTS JULY 2021
Executive Committee
Chairman:
Andrew Richard Dingley Brown (CEO)
Members:
Filipe Crisóstomo Silva (CFO)
Thore E. Kristiansen
Carlos Manuel Costa Pina
José Carlos da Silva Costa1
Sofia Fernandes Cruz Tenreiro1
Susana Quintana-Plaza2
Audit Board
Chairman:
José Pereira Alves
Members:
Pedro Antunes de Almeida
Maria de Fátima Castanheira Cortês Damásio Geada
Alternate:
Amável Alberto Freixo Calhau
Statutory Auditor
Standing:
Ernst & Young Audit & Associados, SROC, S.A., represented by Rui Abel
Serra Martins
Alternate:
Manuel Ladeiro de Carvalho Coelho da Mota
General Shareholders Meeting Board
Chairman:
Ana Paz Ferreira da Câmara Perestrelo de Oliveira
Vice-Chairman:
Rafael de Almeida Garrett Lucas Pires
Secretary:
Sofia Leite Borges
Company Secretary
Alternate:
Rita Picão Fernandes
1 Resigned to office on July 22, 2021. 2 Terminated her office on July 22, 2021 by resignation, having been replaced by Teresa Abecasis on
that date, by co-optation.

41 2Q21 RESULTS JULY 2021
8.2 Statement of compliance of information presented
Statement of compliance of the Board of Directors
According to article 246, paragarph 1. c) of the Securities Code, each of the members of the Board of Directors of Galp indicated below declares that, to
the best of their knowledge, the information presented in the financial statements concerning the first half of the financial year 2021 was produced in
conformity with the applicable accounting requirements and gives a true and a fair view of Galp’s assets and liabilities, financial position and results as
well as the companies included in the consolidation as a whole, and the report and accounts for the first half of 2021 faithfully describes the main
developments that occurred during the period and the impact on the income statements, as well as a description of the principal risks and uncertainties
for the next six months.
42 2Q21 RESULTS JULY 2021
Lisbon, 23 July 2021.
The Board of Directores
Chairman:
Paula Amorim
Vice-Chaiman and Lead Independent Director:
Miguel Athayde Marques
Vice-Chairman:
Andrew Brown
Members:
Filipe Crisóstomo Silva
Thore E. Kristiansen
Carlos Costa Pina
José Carlos Silva
Sofia Tenreiro
Teresa Abecasis
Marta Amorim
Francisco Teixeira Rêgo
Carlos Pinto
Luis Todo Bom
Jorge Seabra de Freitas
Rui Paulo Gonçalves
Diogo Tavares
Edmar de Almeida
Critina Fonseca
Adolfo Mesquita Nunes
43 2Q21 RESULTS JULY 2021
Statement of compliance of the Audit Board
According to article 246, paragraph 1. c) of the Securities Code, each of the members of the Audit Board of Galp mentioned below declares that, to the
best of their knowledge, the information presented in the financial statements concerning the first half of the financial year 2021 was produced in conformity
with the applicable accounting requirements and gives a true and fair view of Galp’s assets and liabilities, financial posiition and results as well as the
companies inlcuded in the consolidation as a whole, and the report and accounts for the first half of 2021 faithfully describes the main developments that
occurred during the period and the impact on the income statements, as well as a description of the principal risks and uncertainties for the next six
months.
Lisbon, 23 July 2021.
Chairman:
José Pereira Alves
Members:
Pedro Antunes de Almeida
Maria de Fátima Geada
44 2Q21 RESULTS JULY 2021
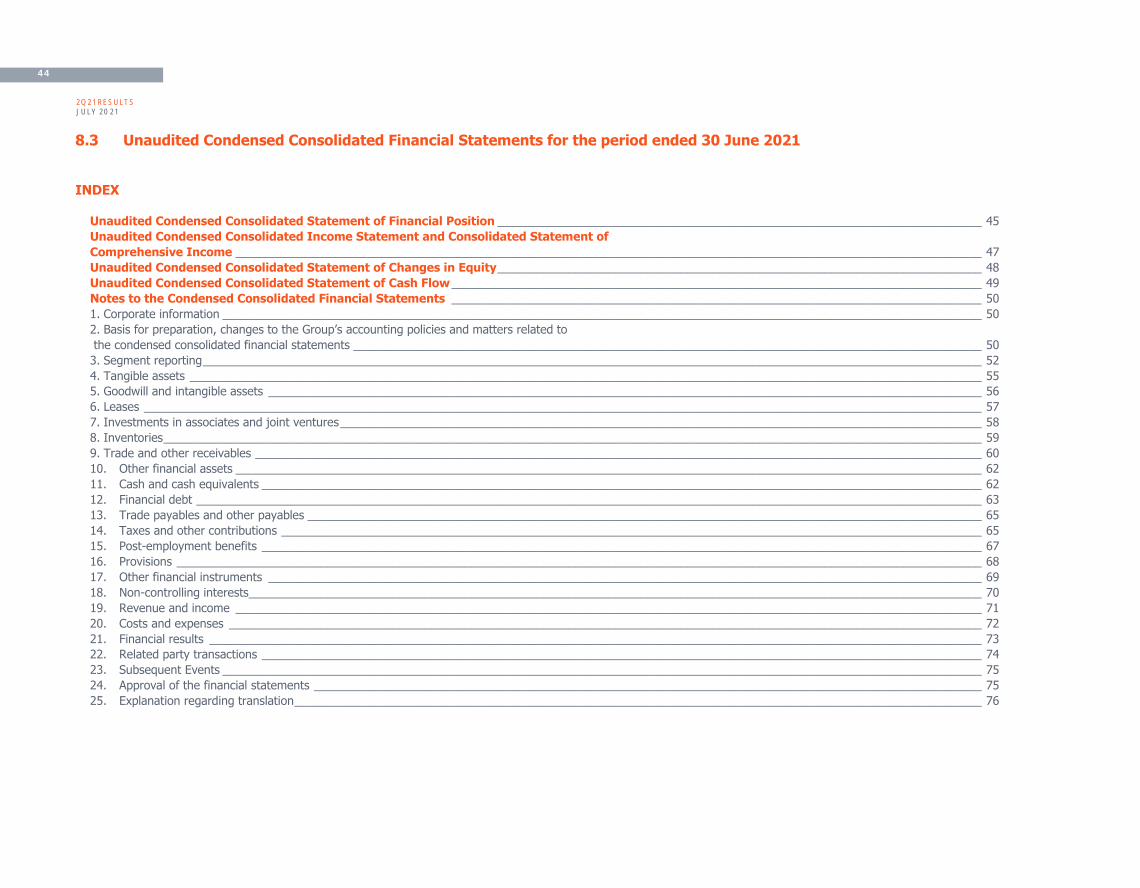
8.3 Unaudited Condensed Consolidated Financial Statements for the period ended 30 June 2021
INDEX
Unaudited Condensed Consolidated Statement of Financial Position __________________________________________________________________________ 45
Unaudited Condensed Consolidated Income Statement and Consolidated Statement of
Comprehensive Income __________________________________________________________________________________________________________________ 47
Unaudited Condensed Consolidated Statement of Changes in Equity __________________________________________________________________________ 48
Unaudited Condensed Consolidated Statement of Cash Flow _________________________________________________________________________________ 49
Notes to the Condensed Consolidated Financial Statements _________________________________________________________________________________ 50
1. Corporate information ____________________________________________________________________________________________________________________ 50
2. Basis for preparation, changes to the Group’s accounting policies and matters related to
the condensed consolidated financial statements ________________________________________________________________________________________________ 50
3. Segment reporting _______________________________________________________________________________________________________________________ 52
4. Tangible assets _________________________________________________________________________________________________________________________ 55
5. Goodwill and intangible assets _____________________________________________________________________________________________________________ 56
6. Leases ________________________________________________________________________________________________________________________________ 57
7. Investments in associates and joint ventures __________________________________________________________________________________________________ 58
8. Inventories _____________________________________________________________________________________________________________________________ 59
9. Trade and other receivables _______________________________________________________________________________________________________________ 60
10. Other financial assets __________________________________________________________________________________________________________________ 62
11. Cash and cash equivalents ______________________________________________________________________________________________________________ 62
12. Financial debt ________________________________________________________________________________________________________________________ 63
13. Trade payables and other payables _______________________________________________________________________________________________________ 65
14. Taxes and other contributions ___________________________________________________________________________________________________________ 65
15. Post-employment benefits ______________________________________________________________________________________________________________ 67
16. Provisions ___________________________________________________________________________________________________________________________ 68
17. Other financial instruments _____________________________________________________________________________________________________________ 69
18. Non-controlling interests ________________________________________________________________________________________________________________ 70
19. Revenue and income __________________________________________________________________________________________________________________ 71
20. Costs and expenses ___________________________________________________________________________________________________________________ 72
21. Financial results ______________________________________________________________________________________________________________________ 73
22. Related party transactions ______________________________________________________________________________________________________________ 74
23. Subsequent Events ____________________________________________________________________________________________________________________ 75
24. Approval of the financial statements ______________________________________________________________________________________________________ 75
25. Explanation regarding translation _________________________________________________________________________________________________________ 76
45 2Q21 RESULTS JULY 2021
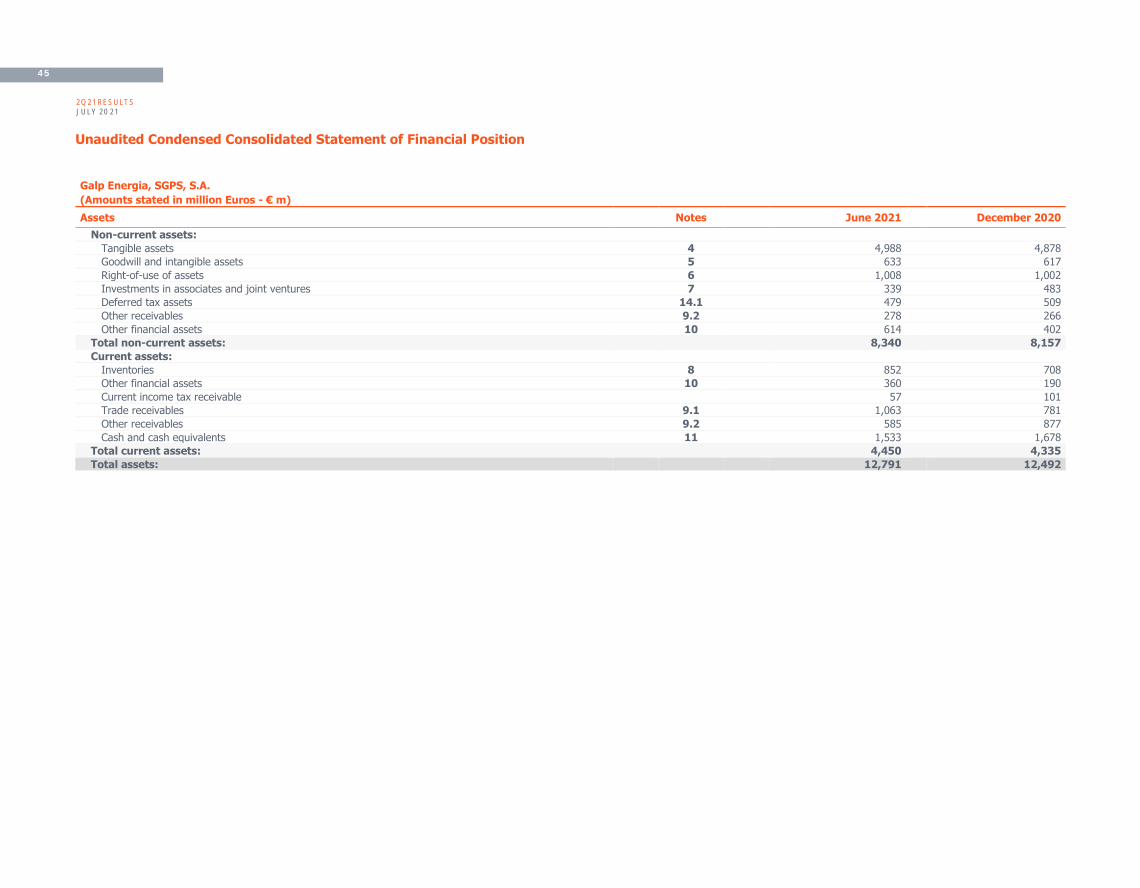
Unaudited Condensed Consolidated Statement of Financial Position
Galp Energia, SGPS, S.A.
(Amounts stated in million Euros - € m)
Assets Notes June 2021 December 2020
Non-current assets:
Tangible assets 4 4,988 4,878
Goodwill and intangible assets 5 633 617
Right-of-use of assets 6 1,008 1,002
Investments in associates and joint ventures 7 339 483
Deferred tax assets 14.1 479 509
Other receivables 9.2 278 266
Other financial assets 10 614 402
Total non-current assets: 8,340 8,157
Current assets:
Inventories 8 852 708
Other financial assets 10 360 190
Current income tax receivable 57 101
Trade receivables 9.1 1,063 781
Other receivables 9.2 585 877
Cash and cash equivalents 11 1,533 1,678
Total current assets: 4,450 4,335
Total assets: 12,791 12,492
46 2Q21 RESULTS JULY 2021
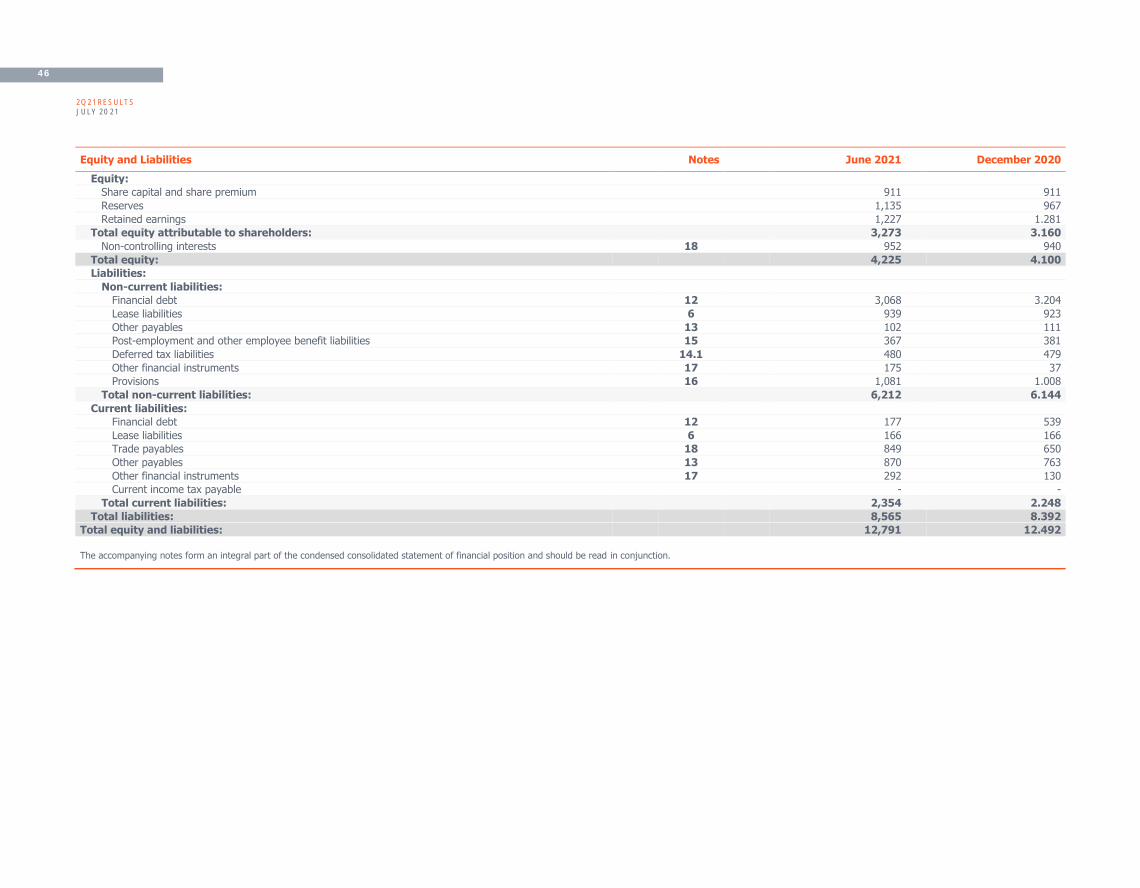
Equity and Liabilities Notes June 2021 December 2020
Equity:
Share capital and share premium 911 911
Reserves 1,135 967
Retained earnings 1,227 1.281
Total equity attributable to shareholders: 3,273 3.160
Non-controlling interests 18 952 940
Total equity: 4,225 4.100
Liabilities:
Non-current liabilities:
Financial debt 12 3,068 3.204
Lease liabilities 6 939 923
Other payables 13 102 111
Post-employment and other employee benefit liabilities 15 367 381
Deferred tax liabilities 14.1 480 479
Other financial instruments 17 175 37
Provisions 16 1,081 1.008
Total non-current liabilities: 6,212 6.144
Current liabilities:
Financial debt 12 177 539
Lease liabilities 6 166 166
Trade payables 18 849 650
Other payables 13 870 763
Other financial instruments 17 292 130
Current income tax payable - -
Total current liabilities: 2,354 2.248
Total liabilities: 8,565 8.392
Total equity and liabilities: 12,791 12.492
The accompanying notes form an integral part of the condensed consolidated statement of financial position and should be read in conjunction.

47 2Q21 RESULTS JULY 2021
Unaudited Condensed Consolidated Income Statement and Consolidated Statement of Comprehensive Income Galp Energia, SGPS, S.A. (Amounts stated in million Euros - € m) Unid: € m
Notes June 2021 June 2020
Sales 19 6,734 5,324
Services rendered 19 240 330
Other operating income 19 123 113
Financial income 21 11 120
Earnings from associates and joint ventures 7/19 16 102
Total revenues and income: 7.124 5,989
Cost of sales 20 (4,889) (4,345)
Supplies and external services 20 (720) (805)
Employee costs 20 (151) (150)
Amortisation and depreciation on fixed assets 20 (434) (496)
Impairment losses on fixed assets 20 (50) (92)
Provisions and impairment losses on receivables 20 (3) (19)
Other operating costs 20 (46) (131)
Financial expenses 21 (184) (195)
Total costs and expenses: (6,478) (6,233)
Profit/(Loss) before taxes and other contributions: 646 (244)
Taxes and SPT 14.1 (319) (139)
Energy sector extraordinary contribution 14.2 (27) (34)
Consolidated net profit/(loss) for the period 300 (417)
Attributable to:
Galp Energia, SGPS, S.A. Shareholders 232 (410)
Non-controlling interests 18 68 (7)
Basic and Diluted Earnings per share (in Euros) 0.28 0.49
Consolidated net profit/(loss) for the period 300 (417)
Items which will not be recycled in the future through net income: Remeasurements 5 (2)
Income taxes related to remeasurements - -
Items which may be recycled in the future through net income: -
Currency translation adjustments 179 7
Hedging reserves 28 (2)
Income taxes related to the above item (7) -
Total Comprehensive income for the period, attributable to: 506 (414)
Galp Energia, SGPS, S.A. Shareholders 404 (425)
Non-controlling interests 102 11
The accompanying notes form an integral part of the condensed consolidated income statement and consolidated statement of comprehensive income and should be read in conjunction.
48 2Q21 RESULTS JULY 2021
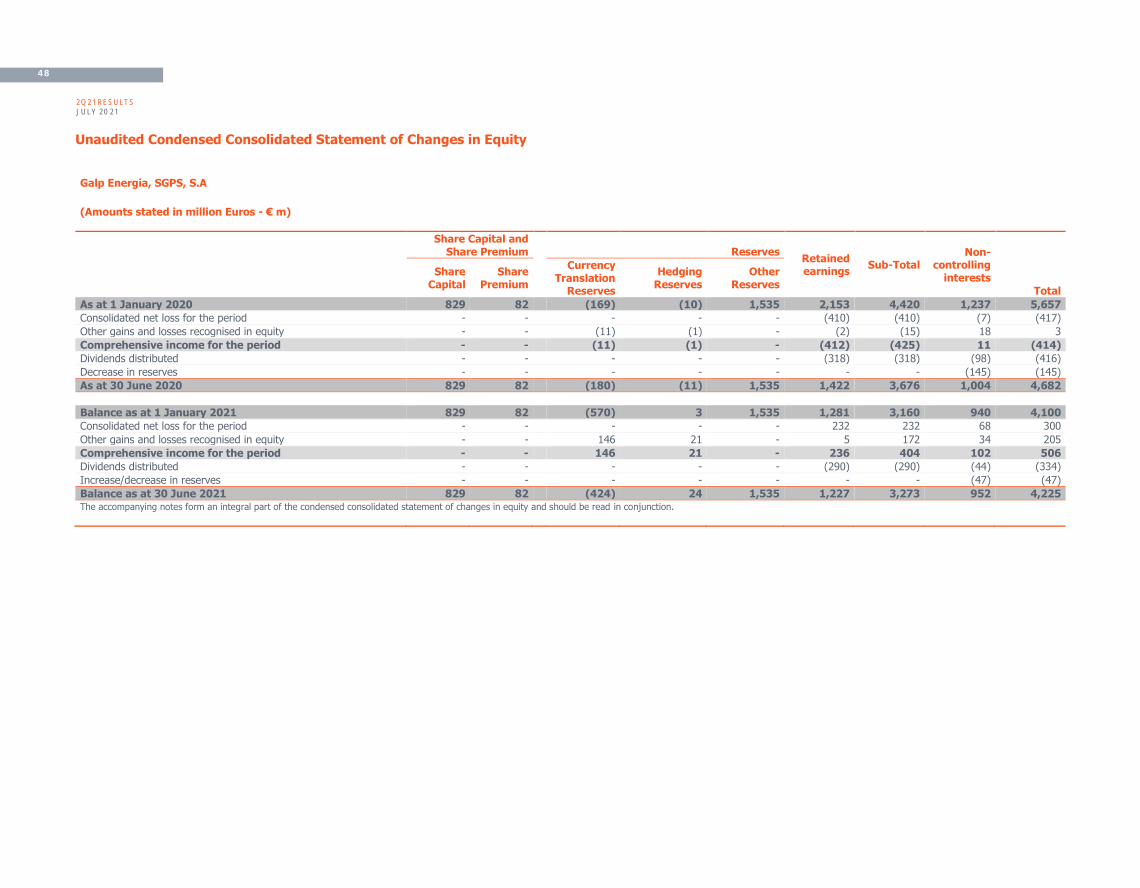
Unaudited Condensed Consolidated Statement of Changes in Equity
Galp Energia, SGPS, S.A
(Amounts stated in million Euros - € m)
Share Capital and Share Premium Reserves
Retained earnings
Sub-Total Non-
controlling interests
Total
Share Capital
Share Premium
Currency
Translation Reserves
Hedging Reserves
Other Reserves
As at 1 January 2020 829 82 (169) (10) 1,535 2,153 4,420 1,237 5,657
Consolidated net loss for the period - - - - - (410) (410) (7) (417)
Other gains and losses recognised in equity - - (11) (1) - (2) (15) 18 3
Comprehensive income for the period - - (11) (1) - (412) (425) 11 (414)
Dividends distributed - - - - - (318) (318) (98) (416)
Decrease in reserves - - - - - - - (145) (145)
As at 30 June 2020 829 82 (180) (11) 1,535 1,422 3,676 1,004 4,682
Balance as at 1 January 2021 829 82 (570) 3 1,535 1,281 3,160 940 4,100
Consolidated net loss for the period - - - - - 232 232 68 300
Other gains and losses recognised in equity - - 146 21 - 5 172 34 205
Comprehensive income for the period - - 146 21 - 236 404 102 506
Dividends distributed - - - - - (290) (290) (44) (334)
Increase/decrease in reserves - - - - - - - (47) (47)
Balance as at 30 June 2021 829 82 (424) 24 1,535 1,227 3,273 952 4,225 The accompanying notes form an integral part of the condensed consolidated statement of changes in equity and should be read in conjunction.

49 2Q21 RESULTS JULY 2021
Unaudited Condensed Consolidated Statement of Cash Flow
Galp Energia, SGPS, S.A.
(Amounts stated in million Euros - €m)
Notes June 2021 June 2020
Income/(Loss) before taxation for the period 646 (244)
Adjustments for:
Amortisation, depreciation and impairment 20 484 588
Adjustments to net realisable value of inventories 20 12 41
Interest Expense, net 21 172 74
Underlifting and/or Overlifting 19;20 11 113
Share of loss of joint ventures and associates 19 (16) (102)
Others 2 (5)
Increase / decrease in assets and liabilities:
(Increase)/decrease in inventories (156) 326
(Increase)/decrease in current receivables (288) 229
Increase/(decrease) in current payables 197 (366)
(Increase) in other receivables, net (90) (35)
Dividends from associates 90 35
Taxes paid (246) (250)
Impact of equalisation - (137)
Cash flow from operating activities 817 267
Capital expenditure in tangible and intangible assets (396) (417)
Investments in associates and joint ventures, net 460 99
Other investment cash outflows, net (57) (24)
Impact of equalisation - 220
Cash flow from investing activities 7 (122)
Loans obtained 2,533 1,792
Loans repaid (3,046) (1,117)
Interest paid (43) (47)
Leases repaid (54) (54)
Interest on leases paid (37) (44)
Share of non-controlling interest on share premium reductions (46) (145)
Dividends paid to Galp shareholders (290) (318)
Dividends paid to non-controlling interest (32) (49)
Realised income on derivative financial instruments - 62
Cash flow from financing activities (1,015) 80
(Decrease)/increase in cash and cash equivalents (191) 225
Currency translation differences in cash and cash equivalents 37 (49)
Cash and cash equivalents at the beginning of the period 1,675 1,431
Cash and cash equivalents at the end of the period 1,522 1,607
The accompanying notes form an integral part of the condensed consolidated statement of Cash Flow and should be read in conjunction.
50 2Q21 RESULTS JULY 2021
Notes to the Condensed Consolidated Financial Statements
1. Corporate information
Galp Energia SGPS, S.A. (the Company) has its Head Office in Lisbon, Portugal and its shares are listed on Euronext Lisbon.
2. Basis for preparation, changes to the Group’s accounting policies and matters related to the condensed consolidated financial
statements
2.1. Basis for presenation
The condensed consolidated financial statements for the six-month period ended 30 June 2021 were prepared in accordance with IAS 34 - Interim Financial Reporting.
The Galp Group has prepared the financial statements on the basis that it will continue to operate as a going concern. The Board of Directors considers that there no material uncertainties
that may cast doubt over this assumption. The Board has formed a judgement that there is a reasonable expectation that the Galp Group has adequate resources to continue in operational existence for the foreseeable future, and not less than 12 months from the end of the reporting period.
These financial statements do not include all of the information and disclosures required for annual financial statements, and therefore should be read in conjunction with the consolidated financial statements of the Galp Group for the year ended as of 31 December 2020.
The condensed consolidated financial statements have been prepared in millions of Euros, except where expressly indicated otherwise. Due to the effects of rounding, the totals and sub-totals of tables may not be equal to the sum of the individual figures presented.
2.2. Galp Strategy Refresh
In June 2021, Galp has announced a refresh in its strategy in which aims to thrive through the energy transition, continuing to deliver growth from one of the most efficient portfolios in the industry, whilst progressively transforming its activities in alignment with the energy transition. Galp’s strategy incorporates the progressive
decabornisation of its operations and products sold to its customers with the commitment to be a net zero emission Company by 2050.
In the strategy refresh exercise, macro and micro-assumptions for each business unit for the period of 2021 to 2025 were updated compared with the budget approved
in December 2020. The guidance provided to the market in our Capital Markets Day brings an improved profitability and cash generation scenario for all business units. Therefore, we have not identified impairment indicators that lead us to a detailed impairment analysis as at 30 june 2021. A detailed impairment analysis will be carried
out for 2021 year-end consolidated financial statements.

51 2Q21 RESULTS JULY 2021
2.3. Impacts of the COVID-19 pandemic
On March 11, 2020, COVID-19 was declared a pandemic by the World Health Organization (WHO). Strict social isolation measures have been put in place since then in
several countries, contributing to a significant slowdown in the global economic environment, reduced demand for oil and its products, including in key markets in which Galp operates such as Portugal and Spain.
During the first semester of 2021, strict isolation measures had been put in place, mainly in Portugal and Spain, that still impact Galp’s operations and sales (although in a smaller magnitude compared with 2020). Notwithstanding the referred impact, and as referred in the section 2.2 – Galp Strategy Refresh, we have not identified
impairment indicators that lead us to a detailed impairment analysis.
2.4. Long-term commitment – LNG purchase agreement
During the first semester of 2021, Galp has assumed a commitment on one of its LNG long-term agreements to purchase natural gas to be delivered during next years. The total commitment as at 30 June 2021 is €54 m, of which €36 m refers to commitments made at fixed price that will be advanced to the LNG supplier in July 2021,
and the remaining €18 m refers to commitments made at floating price that will be fulfilled and paid during the tenure of the agreement.
2.5. Cash Flow statement – indirect method
As permitted by IAS 7 – Cash Flow Statement, Galp has decided to change the method of presenting the condensed consolidated statement of cash flow from direct to
indirect method. For better comparison, the condensed consolidated statement of cash flows for the period of six-months ended as of 30 June 2020 has been restated.
2.6. Changes of the consolidation perimeter
During the six-month period Galp has acquired the following entities:
Legal Entity Country % Acquired Transaction Consolidation Method
Eter Solarbay, SLU Spain 100% Acquisition of Control Full consolidation
Ciclope Solarbay, SLU Spain 100% Acquisition of Control Full consolidation
Duplexia Experts, SL Spain 100% Acquisition of Control Full consolidation
Gastroselector Market, SL Spain 100% Acquisition of Control Full consolidation
SDC International Solar Development Corporation, Lda Portugal 100% Acquisition of Control Full consolidation
2.7. Presentation of cost of emissions in the statement of profit or loss
Galp has decided to change the presentation of the cost of emissions from other operating costs to Cost of sales in the amount of €37m during six months of 2021, for better comparison
the condensed consolidated statement of profit or loss for the period of six-months ended as of 30 June 2020 has been restated.

52 2Q21 RESULTS JULY 2021
3. Segment reporting
The Group operates across four different operating segments based on the types of products sold and services rendered: (i) Upstream, (ii) Industrial & Energy Management; (iii) Commercial and (iv) Renewable & New Businesses.
The Upstream segment represents Galp’s presence in the upstream sector of the oil and gas industry, which involves the management of all activities relating to the exploration, development and production of hydrocarbons, mainly focused in Brazil, Mozambique and Angola.
The Industrial & Energy Management segment incorporates the refining and logistics business, as well as the Group’s oil, gas and power supply and trading activities. This segment also includes co-generation infrastructures.
The Commercial segment integrates the entire offering to Galp’s clients - business to business (B2B) and business to consumer (B2C), of oil, gas, power and non-fuel products. This commercial activity also extends to certain countries in Africa.
The Renewables & New Businesses segment encompasses renewables power generation, mobility and new businesses.
Besides these four business segments, the Group has also included within the category “Others” the holding company Galp Energia, SGPS, S.A. and companies with various other activities including Tagus Re, S.A. and Galp Energia, S.A., a reinsurance company and a provider of shared services at the corporate level, respectively.
Segmented reporting is presented on a replacement cost (RC) basis, which is the earnings metric used by the Chief Operating Decision Maker to make decisions regarding the allocation of resources and to assess performance. Based on the RC method, the current cost of sales measured under IFRS (the weighted average cost) is replaced by the crude reference price (i.e.
Brent-dated) as at the balance sheet date, as though the cost of sales had been measured at the replacement cost of the inventory sold.
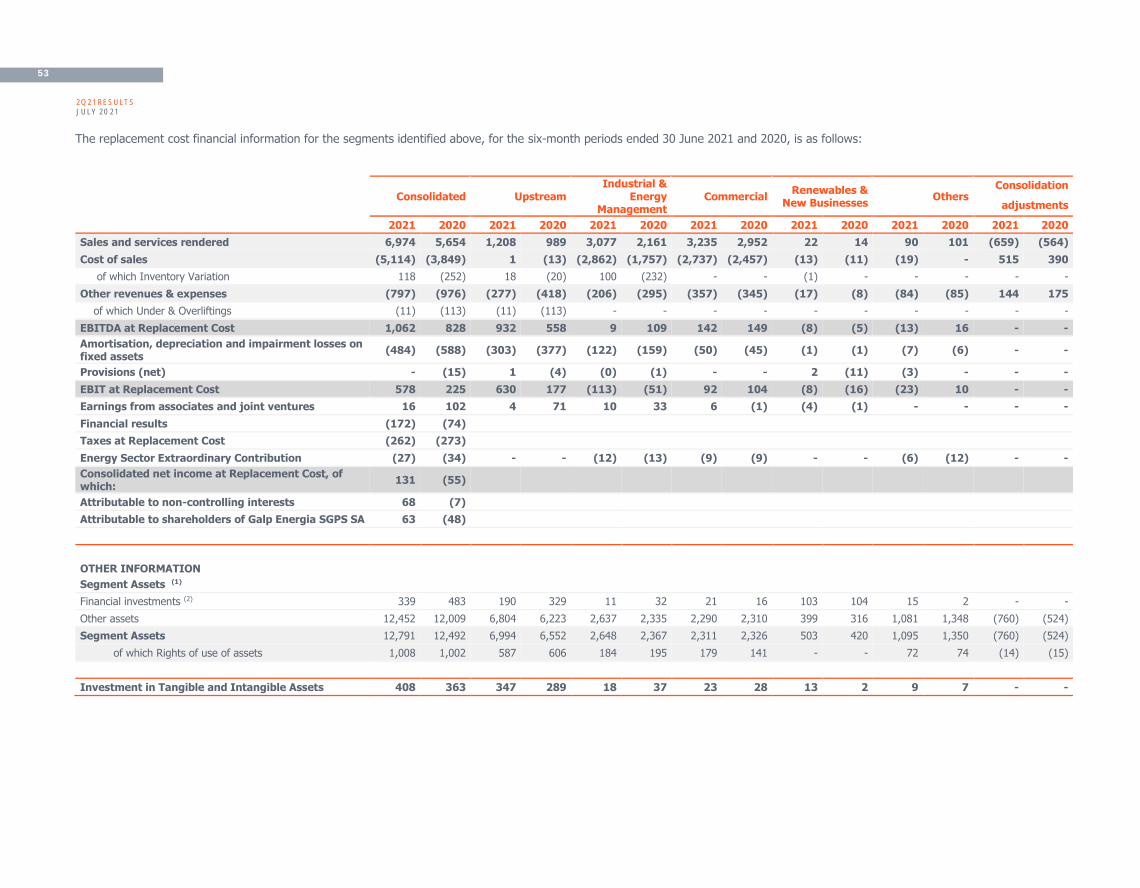
53 2Q21 RESULTS JULY 2021
The replacement cost financial information for the segments identified above, for the six-month periods ended 30 June 2021 and 2020, is as follows:
Consolidated Upstream
Industrial & Energy
Management Commercial
Renewables & New Businesses
Others Consolidation
adjustments
2021 2020 2021 2020 2021 2020 2021 2020 2021 2020 2021 2020 2021 2020
Sales and services rendered 6,974 5,654 1,208 989 3,077 2,161 3,235 2,952 22 14 90 101 (659) (564)
Cost of sales (5,114) (3,849) 1 (13) (2,862) (1,757) (2,737) (2,457) (13) (11) (19) - 515 390
of which Inventory Variation 118 (252) 18 (20) 100 (232) - - (1) - - - - -
Other revenues & expenses (797) (976) (277) (418) (206) (295) (357) (345) (17) (8) (84) (85) 144 175
of which Under & Overliftings (11) (113) (11) (113) - - - - - - - - - -
EBITDA at Replacement Cost 1,062 828 932 558 9 109 142 149 (8) (5) (13) 16 - -
Amortisation, depreciation and impairment losses on fixed assets
(484) (588) (303) (377) (122) (159) (50) (45) (1) (1) (7) (6) - -
Provisions (net) - (15) 1 (4) (0) (1) - - 2 (11) (3) - - -
EBIT at Replacement Cost 578 225 630 177 (113) (51) 92 104 (8) (16) (23) 10 - -
Earnings from associates and joint ventures 16 102 4 71 10 33 6 (1) (4) (1) - - - -
Financial results (172) (74)
Taxes at Replacement Cost (262) (273)
Energy Sector Extraordinary Contribution (27) (34) - - (12) (13) (9) (9) - - (6) (12) - -
Consolidated net income at Replacement Cost, of which:
131 (55)
Attributable to non-controlling interests 68 (7)
Attributable to shareholders of Galp Energia SGPS SA 63 (48)
OTHER INFORMATION
Segment Assets (1)
Financial investments (2) 339 483 190 329 11 32 21 16 103 104 15 2 - -
Other assets 12,452 12,009 6,804 6,223 2,637 2,335 2,290 2,310 399 316 1,081 1,348 (760) (524)
Segment Assets 12,791 12,492 6,994 6,552 2,648 2,367 2,311 2,326 503 420 1,095 1,350 (760) (524)
of which Rights of use of assets 1,008 1,002 587 606 184 195 179 141 - - 72 74 (14) (15)
Investment in Tangible and Intangible Assets 408 363 347 289 18 37 23 28 13 2 9 7 - -
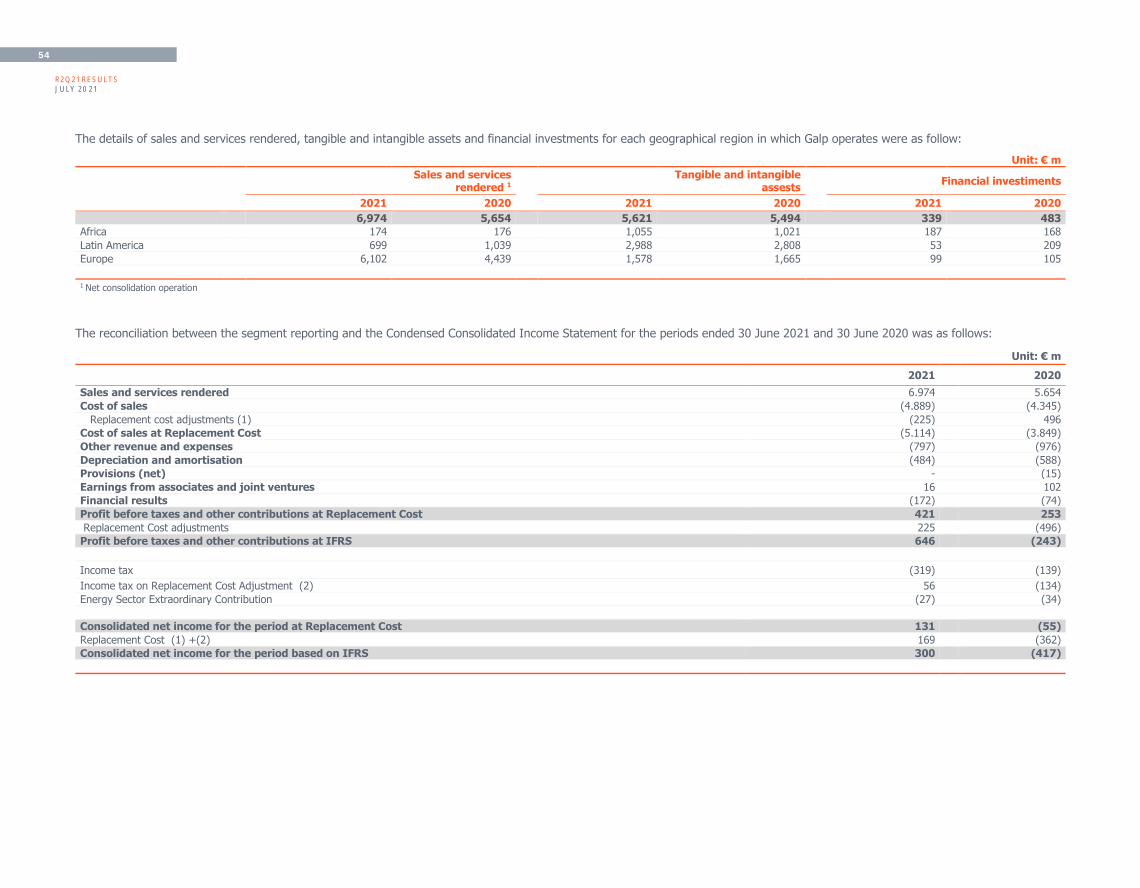
R2Q21 RESULTS JULY 2021
54
The details of sales and services rendered, tangible and intangible assets and financial investments for each geographical region in which Galp operates were as follow:
Unit: € m
Sales and services
rendered 1
Tangible and intangible assests
Financial investiments
2021 2020 2021 2020 2021 2020
6,974 5,654 5,621 5,494 339 483
Africa 174 176 1,055 1,021 187 168
Latin America 699 1,039 2,988 2,808 53 209
Europe 6,102 4,439 1,578 1,665 99 105
1 Net consolidation operation
The reconciliation between the segment reporting and the Condensed Consolidated Income Statement for the periods ended 30 June 2021 and 30 June 2020 was as follows:
Unit: € m
2021 2020
Sales and services rendered 6.974 5.654
Cost of sales (4.889) (4.345)
Replacement cost adjustments (1) (225) 496
Cost of sales at Replacement Cost (5.114) (3.849)
Other revenue and expenses (797) (976)
Depreciation and amortisation (484) (588)
Provisions (net) - (15)
Earnings from associates and joint ventures 16 102
Financial results (172) (74)
Profit before taxes and other contributions at Replacement Cost 421 253
Replacement Cost adjustments 225 (496)
Profit before taxes and other contributions at IFRS 646 (243)
Income tax (319) (139)
Income tax on Replacement Cost Adjustment (2) 56 (134)
Energy Sector Extraordinary Contribution (27) (34)
Consolidated net income for the period at Replacement Cost 131 (55)
Replacement Cost (1) +(2) 169 (362)
Consolidated net income for the period based on IFRS 300 (417)

R2Q21 RESULTS JULY 2021
55
4. Tangible assets
Unit: € m
Land, natural
resources and buildings
Plant and machinery
Other equipment Assets under construction
Total
As at 30 June 2021
Acquisition cost 1,262 11,053 500 1,571 14,386
Impairment (29) (134) (2) (179) (343)
Accumulated depreciation and depletion (781) (7,826) (449) - (9,055)
Net Value 452 3,094 49 1,392 4,988
Balance as at 1 January 2021 454 2,955 52 1,417 4,878
Additions - 8 - 389 397
Depreciation, depletion and impairment (10) (336) (10) (41) (398)
Disposals/Write-offs (1) - - (30) (31)
Transfers 7 399 7 (413) -
Currency exchange differences and other adjustments 2 69 1 70 143
Balance as at 30 June 2021 452 3,094 50 1,392 4,988
During the period under review the Group has made investments mostly in the Upstream business unit, in the amount of €397 m, essentially related to projects in Brazil (€306 m), Angola (€8 m), Mozambique (€40 m), Industrial & Energy Management (€34 m) and Commercial (€8 m). The additions to tangible assets for the six-month period ended 30 June 2021 also include the capitalisation of financial charges amounting to €7 m (Note 21).
In addition, regarding Exploration and Appraisal assets, and based on the assessment of prospects’ potential performed during the second quarter of 2021, a write-off of €50 m was recorded related to Potiguar and smaller scale exploration prospects.

R2Q21 RESULTS JULY 2021
56
5. Goodwill and intangible assets
Unit: € m
Industrial properties
and other rights Intangible assets in
progress Goodwill Total
As at 30 June 2021
Acquisition cost 983 80 92 1,155
Impairment (20) (21) (2) (44)
Accumulated amortisation (479) - - (479)
Net Value 484 59 90 633
Balance as at 1 January 2021 482 49 85 617
Additions 5 15 4 24
Amortisation and impairment (22) - - (22)
Disposals/write-offs (3) - - (3)
Transfers 7 (6) - 1
Currency exchange differences and other adjustments 15 - 1 16
Balance as at 30 June 2021 481 58 90 633
Goodwill additions are regarding the acquisition of entities Eter Solarbay, SLU, Ciclope Solarbay, SLU, Duplexia Experts, SL, Gastroselector Market, SL and SDC International Solar Development Corportation, Lda totalling €4m. The Goodwill is still provisional with a time span of one year to be fully determined in accordance with IFRS 3.
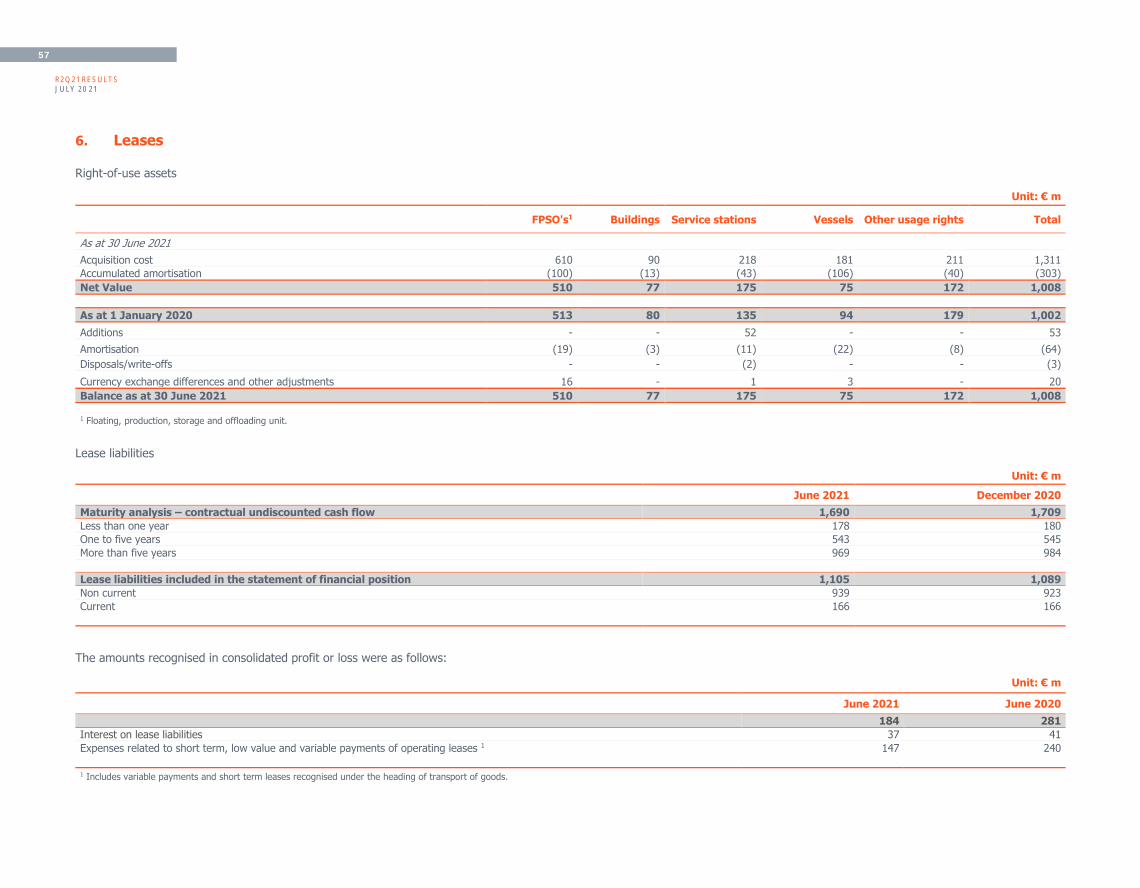
R2Q21 RESULTS JULY 2021
57
6. Leases
Right-of-use assets
Unit: € m
FPSO's1 Buildings Service stations Vessels Other usage rights Total
As at 30 June 2021
Acquisition cost 610 90 218 181 211 1,311
Accumulated amortisation (100) (13) (43) (106) (40) (303)
Net Value 510 77 175 75 172 1,008
As at 1 January 2020 513 80 135 94 179 1,002
Additions - - 52 - - 53
Amortisation (19) (3) (11) (22) (8) (64)
Disposals/write-offs - - (2) - - (3)
Currency exchange differences and other adjustments 16 - 1 3 - 20
Balance as at 30 June 2021 510 77 175 75 172 1,008
1 Floating, production, storage and offloading unit.
Lease liabilities
Unit: € m
June 2021 December 2020
Maturity analysis – contractual undiscounted cash flow 1,690 1,709
Less than one year 178 180
One to five years 543 545
More than five years 969 984
Lease liabilities included in the statement of financial position 1,105 1,089
Non current 939 923
Current 166 166
The amounts recognised in consolidated profit or loss were as follows:
Unit: € m
June 2021 June 2020
184 281
Interest on lease liabilities 37 41
Expenses related to short term, low value and variable payments of operating leases 1 147 240 1 Includes variable payments and short term leases recognised under the heading of transport of goods.

R2Q21 RESULTS JULY 2021
58
Amounts recognised in the consolidated statement of cash flow were as follows:
Unit: € m
June 2021 June 2020
Financing activities 91 98
(Payments) relating to leasing (IFRS 16) 54 54
(Payments) relating to leasing (IFRS 16) interests 37 44
7. Investments in associates and joint ventures
Unit: € m
June 2021 December 2020
339 483
Joint ventures 265 405
Associates 74 78
7.1 Investments in joint ventures
Unit: € m
As at 31 December 2020
Share capital increase/ decrease
Equity Method Other adjustments Dividends As at 30 June
2021
405 (103) - 26 (62) 265
Tupi B.V. 168 (105) 4 6 (58) 15
Galp Disa Aviacion, S.A. 5 - - - - 5
CLC - Companhia Logistica de Combustíveis, S.A. 8 - - - - 8
Zero -E-Euro Assets, S.A. 58 1 (5) 6 - 61
Coral FLNG, S.A. 161 - 1 14 - 175
Other joint ventures 4 - 1 (1) (4) 1
In addition, Tupi B.V. repaid share premium contributions in the amount of €105 m, which includes proceeds from the sale of equipment to the E&P operations in Brazil.
During the six-month period under review, the amount of €58 m was declared and paid in dividends from investments in joint ventures (Tupi BV).

R2Q21 RESULTS JULY 2021
59
7.2 Investments in associates
Unit: € m
As at 31 December 2020
Share capital increase/ decrease
Equity Method Foreign exchange
rate differences Dividends
As at 30 June 2021
78 - 26 - (30) 74
EMPL - Europe Magreb Pipeline, Ltd 14 - 19 (1) (20) 13
Sonangalp - Sociedade Distribuição e Comercialização de Combustíveis, Lda. 6 - 1 (1) - 6
Gasoduto Al-Andaluz, S.A. 3 - - - (2) -
Tauá Brasil Palma, S.A. 42 - 1 1 (5) 38
Galp Gás Natural Distribuição, S.A. 8 - - - - 8
Other associates 6 - 5 - (3) 9
The Earnigns from associates and joint ventures for the six-month period ended as of 30 June 2021 in the Condensed Consolidated Income Statement is € 16 m. The amount was impacted by the obligation assumed by Galp with the GGND shareholders in relation to the CESE I liability (€10 m). In accordance with the agreements made between Galp and GGND shareholders, Galp has assumed the responsibility to reimburse the GGND shareholders in the event the CESE I liability is settled.
8. Inventories
Unit: € m
June 2021 December 2020
852 708
Raw, subsidiary and consumable materials 289 272
Crude oil 104 166
Other raw materials 69 67
Raw materials in transit 116 40
Finished and semi-finished products 438 339
Goods 151 111
Adjustments to net realisable value (26) (14)

R2Q21 RESULTS JULY 2021
60
The movements in the adjustments to net realisable value balance for the six-month period ended 30 June 2021 were as follows:
Unit: € m
Raw, subsidiary and consumable
materials
Finished and semi-finished products
Goods Adjustments Total
Adjustments to net realisable value at 1 January 2021 13 - 1 - 14
Net reductions 6 5 1 - 12
Adjustments to net realisable value at 30 June 2021 19 5 2 - 26
The net reductions in the amount of €12 m were recorded in the income statement as part of cost of sales. These reductions, which resulted from the application of the net realisable value method (NRV), are mainly related to adjustments to reflect expected market price movements during the period under review.
9. Trade and other receivables
9.1. Trade receivables
Unit: € m
Notes
June 2021 December 2020
Current Current
1,063 781
Trade receivables 1,211 926
Impairments 9.3 (148) (145)

R2Q21 RESULTS JULY 2021
61
9.2. Other receivables
Unit: € m
Notes
June 2021 December 2020
Current Non-current Current Non-current
585 278 877 266
State and other Public Entities 28 8 28 17
Other debtors 251 108 587 85
Non-operated oil blocks 67 - 77 -
Underlifting 77 - 85 -
Other receivables 107 108 425 85
Related Parties 8 - 1 -
Contract Assets 225 67 183 68
Sales and services rendered but not yet invoiced 89 - 57 -
Adjustments to tariff deviations - "pass through" 21 - 19 -
Other accrued income 115 67 108 68
Deferred charges 79 95 82 96
Energy sector extraordinary contribution (CESE II) 14.2 11 30 11 35
Deferred charges for services 6 14 3 14
Other deferred charges 62 51 68 46
Impairment of other receivables 9.3 (5) - (5) -
Including in the balance of €67 m recorded under “Other debtors - Non-operated oil blocks” is €41 m related to receivables from partners for payments made by the Group on their behalf, which will be recovered from the respective partners during the production period.
The balance of €77 m recorded in “Other debtors – Underlifting” corresponds to the amounts receivable by the Group as a result of the lifting of barrels of crude oil below the production quota, and is valued at the lower of the market price as at the sale date and the market price as at 30 June 2021.
Other deferred charges (non-current) include the amount of €50 m relating to post-employment benefits (Note 15).
In 2020, Galp agreed to sell 75.01% of Galp Gas Natural Distribuição, S.A. (GGND) for a total consideration of €368 m. From this transaction, a capital gain of €99 m was recongnized in the Consolidated Income Statement for the year-ended 31 December 2020. During the period, the transaction has been completed and Galp received €368 m, which was deducted from “Other debtors – other receivables”.

R2Q21 RESULTS JULY 2021
62
9.3. Impairment of Trade Receivables and Other Receivables
The movements in the impairment of trade receivables and other receivables, for the six-month period ended 30 June 2021, were as follow:
Unit: € m
Opening balance Increase Decrease Others Closing balance
150 6 (3) 1 154
Trade receivables 145 6 (3) 1 148
Other receivables 5 1 (1) - 5
10. Other financial assets
As at 30 June 2021 and 31 December 2020, Other financial assets were as follow:
Unit: € m
Notes June 2021
December 2020
Current Non-current Current Non-current
360 614 190 402
Financial Assets at fair value through profit & loss 17 320 208 149 49
Financial Assets at fair value through comprehensive income - 3 - 3
Financial Assets not measured at fair value - Loans and Capital subscription 40 382 42 330
Others - 21 - 21
Loans and capital subscription (current) in the amount of €40 m relate to the subscribed and unrealised capital increase made by Winland International Petroleum, S.A.R.L. (a Sinopec company) in Petrogal Brasil, S.A., which is considered as a financial asset given the terms established for this capital increase.
The balance in the non-current portion is predominantly related to a shareholder loan to Group Zero E Euro Assets, of €319 m, of which €254m related to a shareholder loan to Group Zero-
E assumed by Galp as total consideration paid for the joint venture at acquisition date.
11. Cash and cash equivalents
Unit: € m
Notes June 2021 December 2020
1,522 1,675
Cash at bank 1,533 1,678
Bank overdrafts 12 (12) (2)
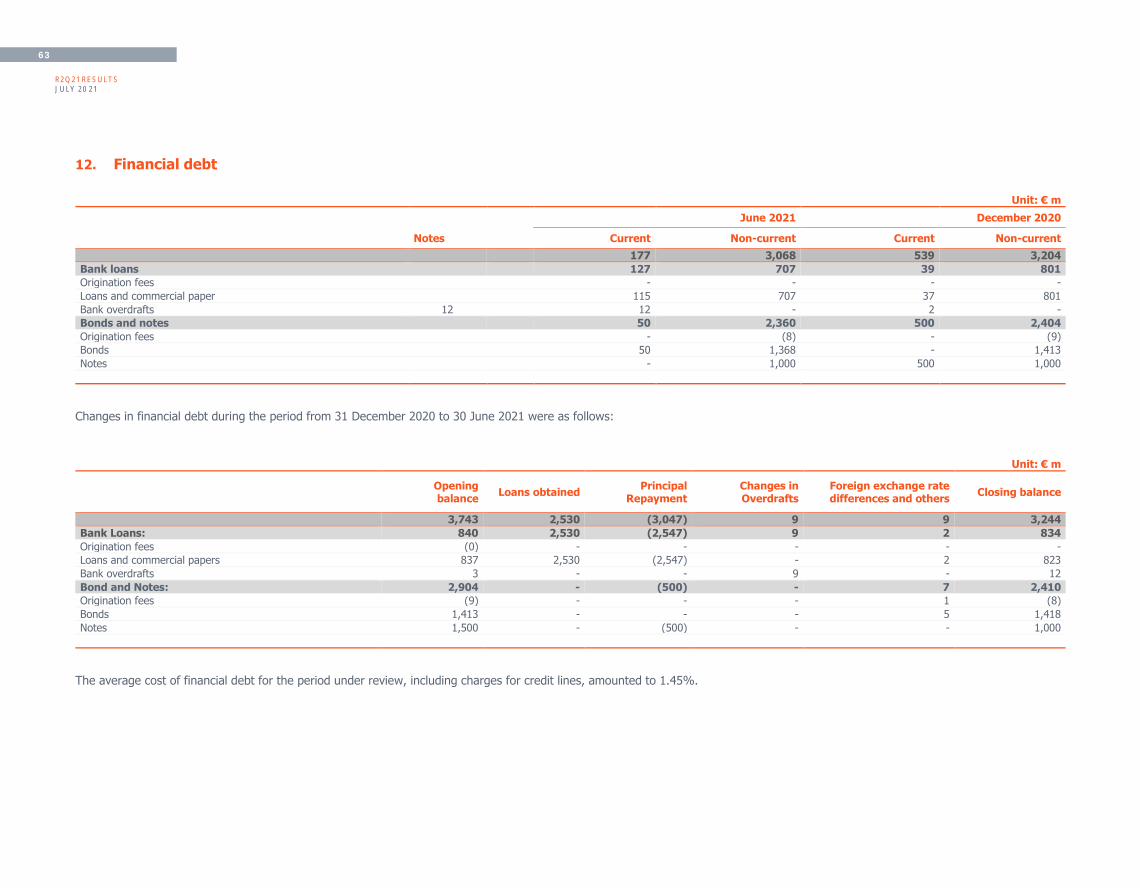
R2Q21 RESULTS JULY 2021
63
12. Financial debt
Unit: € m
June 2021 December 2020
Notes Current Non-current Current Non-current
177 3,068 539 3,204
Bank loans 127 707 39 801
Origination fees - - - -
Loans and commercial paper 115 707 37 801
Bank overdrafts 12 12 - 2 -
Bonds and notes 50 2,360 500 2,404
Origination fees - (8) - (9)
Bonds 50 1,368 - 1,413
Notes - 1,000 500 1,000
Changes in financial debt during the period from 31 December 2020 to 30 June 2021 were as follows:
Unit: € m
Opening balance
Loans obtained Principal
Repayment Changes in Overdrafts
Foreign exchange rate differences and others
Closing balance
3,743 2,530 (3,047) 9 9 3,244
Bank Loans: 840 2,530 (2,547) 9 2 834
Origination fees (0) - - - - -
Loans and commercial papers 837 2,530 (2,547) - 2 823
Bank overdrafts 3 - - 9 - 12
Bond and Notes: 2,904 - (500) - 7 2,410
Origination fees (9) - - - 1 (8)
Bonds 1,413 - - - 5 1,418
Notes 1,500 - (500) - - 1,000
The average cost of financial debt for the period under review, including charges for credit lines, amounted to 1.45%.
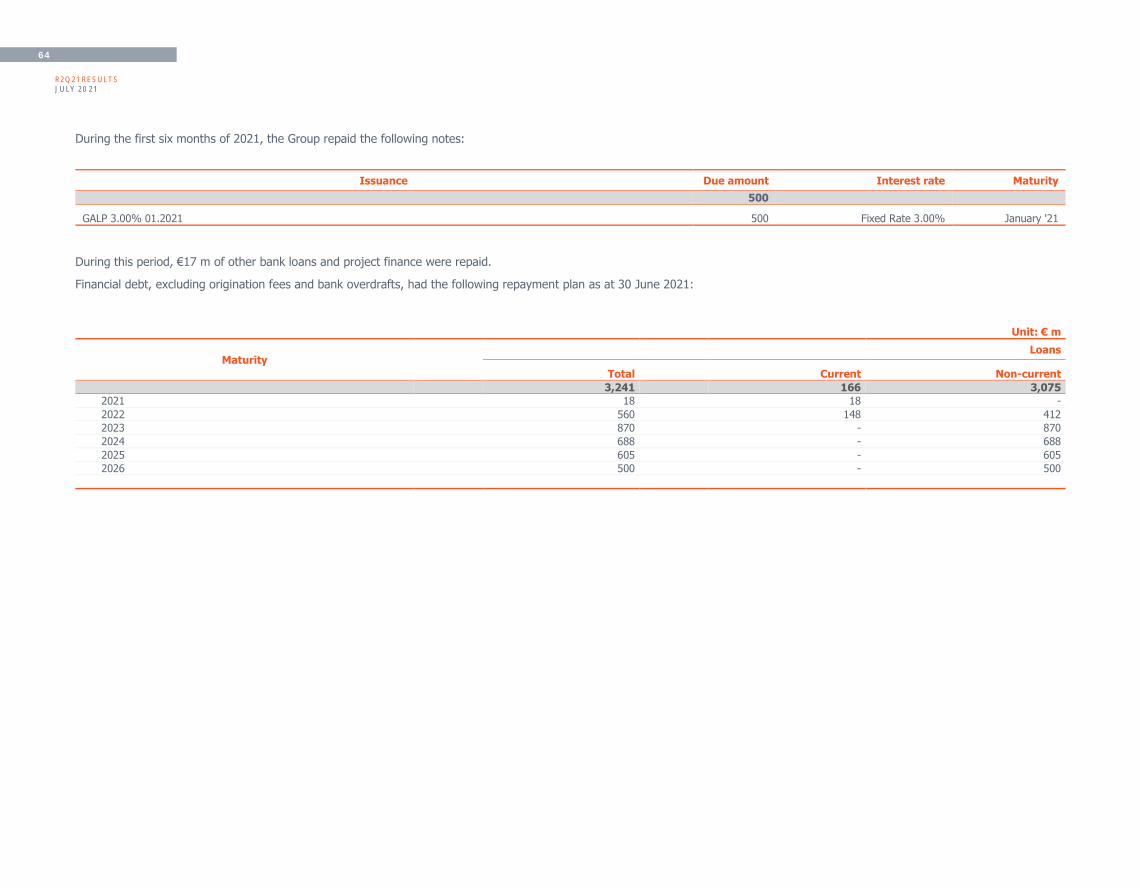
R2Q21 RESULTS JULY 2021
64
During the first six months of 2021, the Group repaid the following notes:
Issuance Due amount Interest rate Maturity
500
GALP 3.00% 01.2021 500 Fixed Rate 3.00% January '21
During this period, €17 m of other bank loans and project finance were repaid.
Financial debt, excluding origination fees and bank overdrafts, had the following repayment plan as at 30 June 2021:
Unit: € m
Maturity Loans
Total Current Non-current
3,241 166 3,075
2021 18 18 -
2022 560 148 412
2023 870 - 870
2024 688 - 688
2025 605 - 605
2026 500 - 500
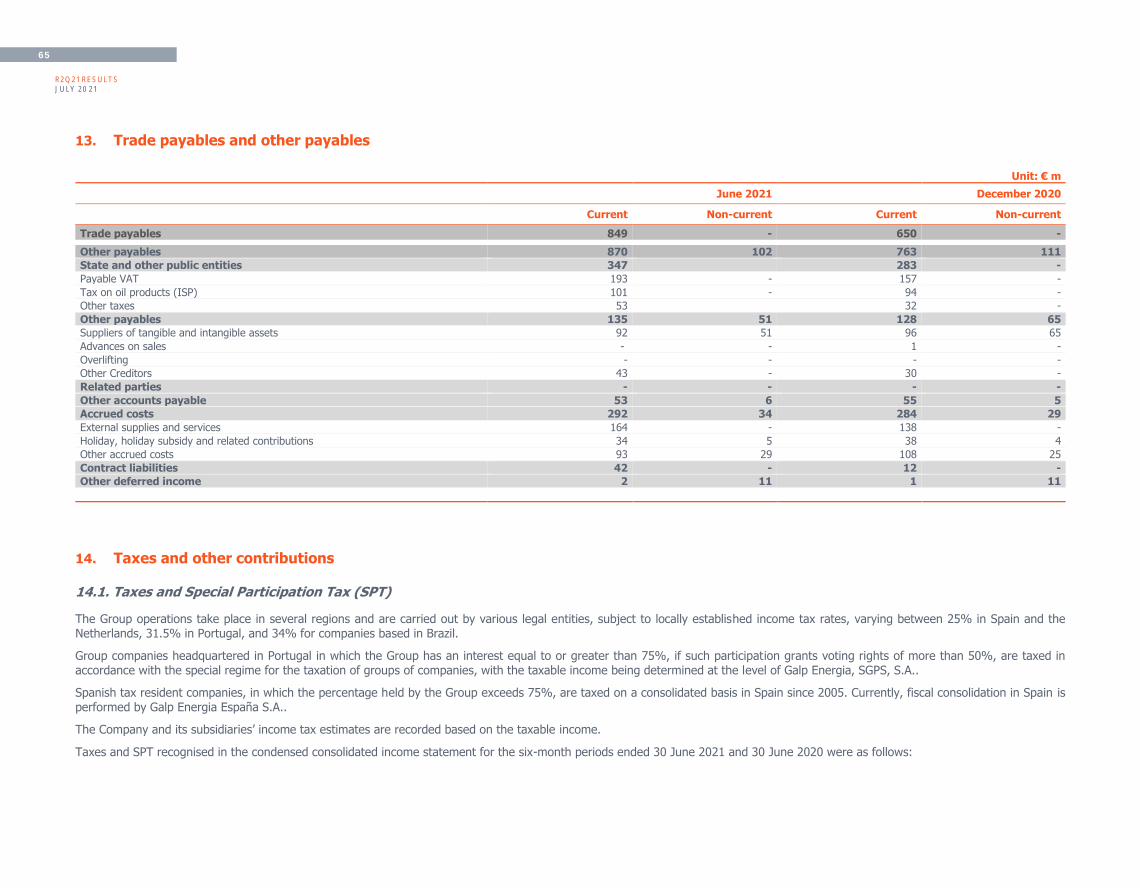
R2Q21 RESULTS JULY 2021
65
13. Trade payables and other payables
Unit: € m
June 2021 December 2020
Current Non-current Current Non-current
Trade payables 849 - 650 -
Other payables 870 102 763 111
State and other public entities 347 283 -
Payable VAT 193 - 157 -
Tax on oil products (ISP) 101 - 94 -
Other taxes 53 32 -
Other payables 135 51 128 65
Suppliers of tangible and intangible assets 92 51 96 65
Advances on sales - - 1 -
Overlifting - - - -
Other Creditors 43 - 30 -
Related parties - - - -
Other accounts payable 53 6 55 5
Accrued costs 292 34 284 29
External supplies and services 164 - 138 -
Holiday, holiday subsidy and related contributions 34 5 38 4
Other accrued costs 93 29 108 25
Contract liabilities 42 - 12 -
Other deferred income 2 11 1 11
14. Taxes and other contributions
14.1. Taxes and Special Participation Tax (SPT)
The Group operations take place in several regions and are carried out by various legal entities, subject to locally established income tax rates, varying between 25% in Spain and the Netherlands, 31.5% in Portugal, and 34% for companies based in Brazil.
Group companies headquartered in Portugal in which the Group has an interest equal to or greater than 75%, if such participation grants voting rights of more than 50%, are taxed in accordance with the special regime for the taxation of groups of companies, with the taxable income being determined at the level of Galp Energia, SGPS, S.A..
Spanish tax resident companies, in which the percentage held by the Group exceeds 75%, are taxed on a consolidated basis in Spain since 2005. Currently, fiscal consolidation in Spain is performed by Galp Energia España S.A..
The Company and its subsidiaries’ income tax estimates are recorded based on the taxable income.
Taxes and SPT recognised in the condensed consolidated income statement for the six-month periods ended 30 June 2021 and 30 June 2020 were as follows:

R2Q21 RESULTS JULY 2021
66
Unit: € m
June 2021 June 2020
Current tax Deferred tax Total Current tax Deferred tax Total
Taxes for the period 301 17 319 65 75 139
Current income tax 48 20 68 (88) 79 (10)
Oil income Tax (IRP) 14 (3) 11 12 (4) 8
Special Participation Tax (SPT) 239 - 239 141 - 141
As at 30 June 2021, the movements in deferred tax assets and liabilities were as follows:
Unit: € m
As at 31 December 2020 Impact on the
income statement
Impact on equity Foreign
exchange rate changes
As at 30 June 2021
Deferred Taxes – Assets 509 (30) (7) 6 479
Adjustments to tangible and intangible assets 79 (27) - 2 54
Retirement benefits and other benefits 110 (4) - 106
Tax losses carried forward 69 5 - 1 75
Regulated revenue 6 1 - - 7
Temporarily non-deductible provisions 179 (9) - 2 172
Potential foreign exchange rate differences in Brazil 37 - - 1 38
Others 28 4 (7) 1 26
Deferred Taxes – Liabilities (479) 13 - (15) (480)
Adjustments to tangible and intangible assets (441) 4 - (15) (452)
Adjustments to the fair value of tangible and intangible assets (5) (1) - - (6)
Regulated revenue (13) - - - (13)
Others (20) 10 - - (10)

R2Q21 RESULTS JULY 2021
67
14.2 Energy Sector Extraordinary Contribution
Unit: € m
Statement of financial position Income statement
Provisions (Note 16) "CESE II" Deferred Charges (Note 9.2) Energy Sector Extraordinary Contribution
CESE I CESE II Current Non-current
As at 1 January 2021 (113) (229) 11 35 -
"CESE I" Increase (7) - - - 7
"CESE II" Increase - (5) - (5) 11
Fondo Nacional de Eficiencia Energética (FNEE) - - - - 9
As at 30 June 2021 (121) (235) 11 30 27
15. Post-employment benefits
During the period under review there were no significant changes compared to 31 December 2020.
On 30 June 2021 and 31 December 2020, the assets of the Pension Funds, valued at fair value, were as follows, in accordance with the report presented by the respective pension plan management company:
Unit: € m
June 2021 December 2020
Total 256 259
Shares 57 52
Bonds 154 158
Real Estate 43 43
Liquidity 1 6
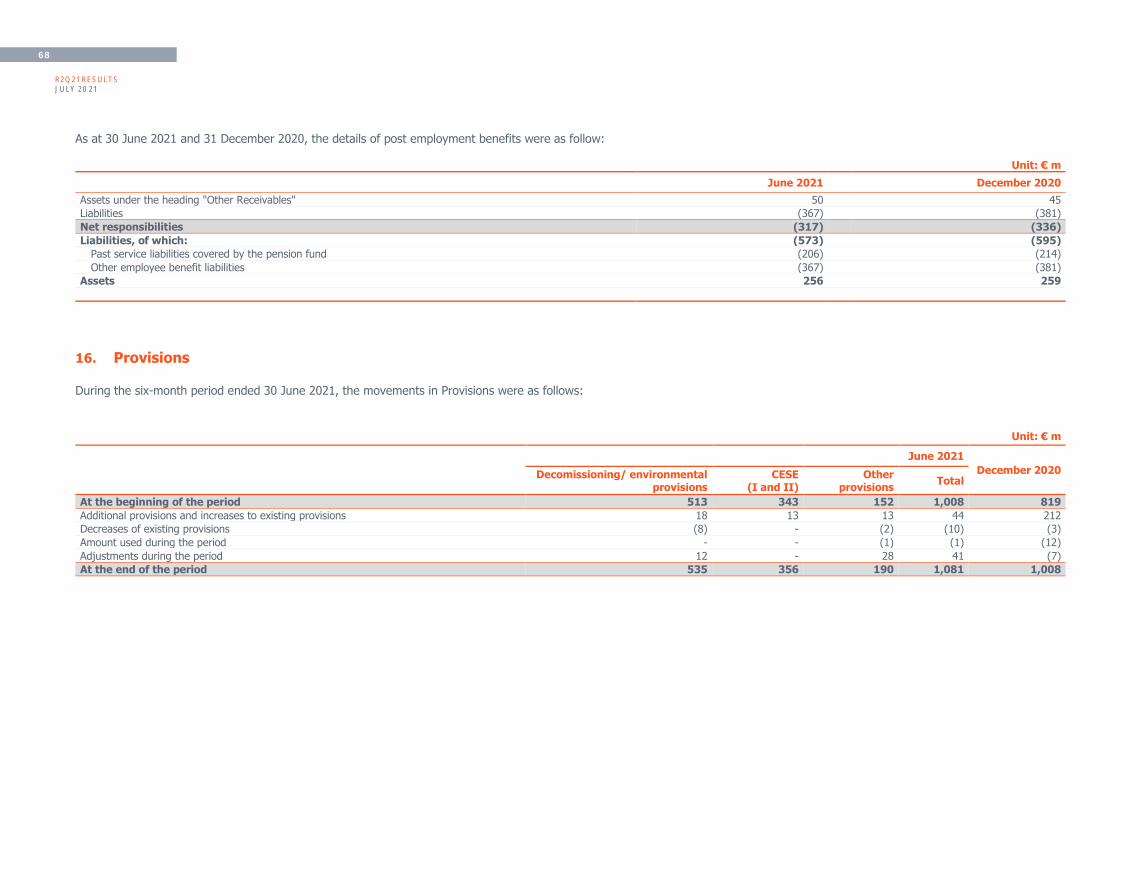
R2Q21 RESULTS JULY 2021
68
As at 30 June 2021 and 31 December 2020, the details of post employment benefits were as follow:
Unit: € m
June 2021 December 2020
Assets under the heading "Other Receivables" 50 45
Liabilities (367) (381)
Net responsibilities (317) (336)
Liabilities, of which: (573) (595)
Past service liabilities covered by the pension fund (206) (214)
Other employee benefit liabilities (367) (381)
Assets 256 259
16. Provisions
During the six-month period ended 30 June 2021, the movements in Provisions were as follows:
Unit: € m
June 2021
December 2020
Decomissioning/ environmental provisions
CESE (I and II)
Other provisions
Total
At the beginning of the period 513 343 152 1,008 819
Additional provisions and increases to existing provisions 18 13 13 44 212
Decreases of existing provisions (8) - (2) (10) (3)
Amount used during the period - - (1) (1) (12)
Adjustments during the period 12 - 28 41 (7)
At the end of the period 535 356 190 1,081 1,008
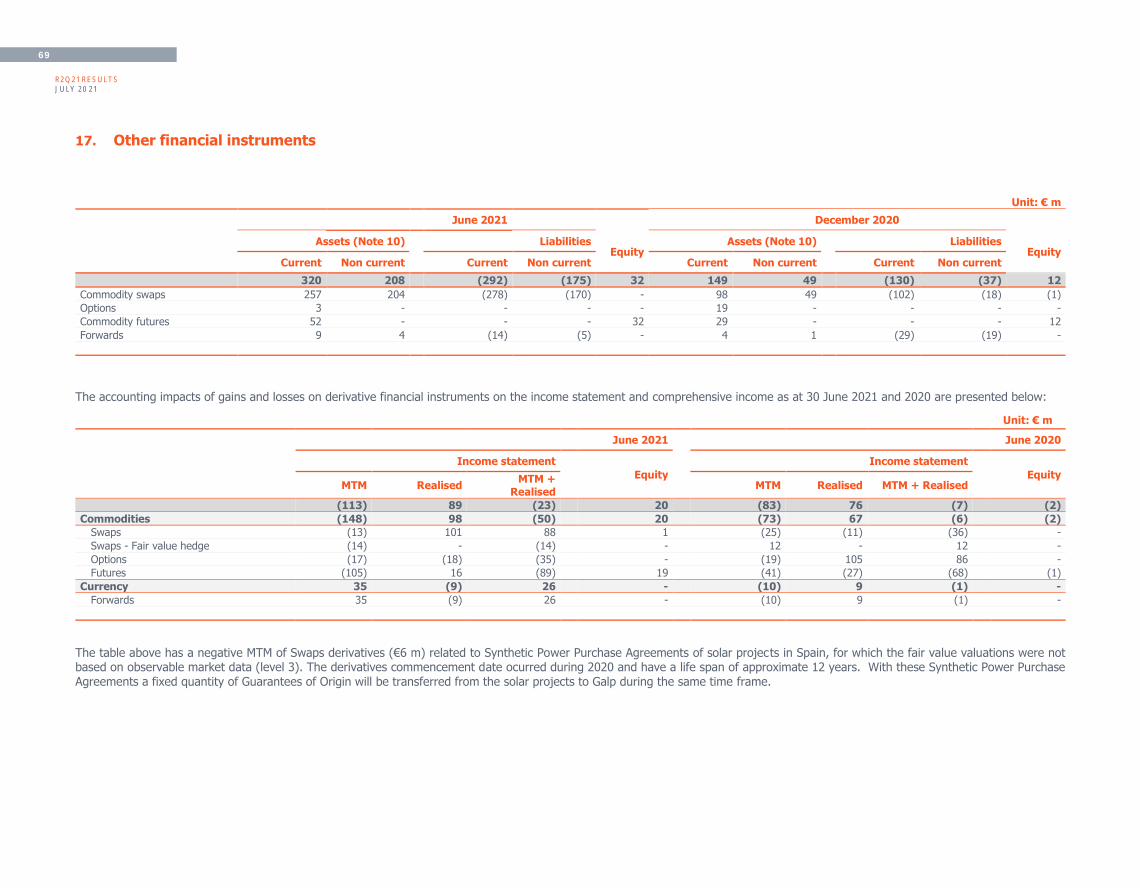
R2Q21 RESULTS JULY 2021
69
17. Other financial instruments
Unit: € m
June 2021 December 2020
Assets (Note 10) Liabilities Equity
Assets (Note 10) Liabilities Equity
Current Non current Current Non current Current Non current Current Non current
320 208 (292) (175) 32 149 49 (130) (37) 12
Commodity swaps 257 204 (278) (170) - 98 49 (102) (18) (1)
Options 3 - - - - 19 - - - -
Commodity futures 52 - - - 32 29 - - - 12
Forwards 9 4 (14) (5) - 4 1 (29) (19) -
The accounting impacts of gains and losses on derivative financial instruments on the income statement and comprehensive income as at 30 June 2021 and 2020 are presented below:
Unit: € m
June 2021 June 2020
Income statement
Equity
Income statement
Equity MTM Realised
MTM + Realised
MTM Realised MTM + Realised
(113) 89 (23) 20 (83) 76 (7) (2)
Commodities (148) 98 (50) 20 (73) 67 (6) (2)
Swaps (13) 101 88 1 (25) (11) (36) -
Swaps - Fair value hedge (14) - (14) - 12 - 12 -
Options (17) (18) (35) - (19) 105 86 -
Futures (105) 16 (89) 19 (41) (27) (68) (1)
Currency 35 (9) 26 - (10) 9 (1) -
Forwards 35 (9) 26 - (10) 9 (1) -
The table above has a negative MTM of Swaps derivatives (€6 m) related to Synthetic Power Purchase Agreements of solar projects in Spain, for which the fair value valuations were not based on observable market data (level 3). The derivatives commencement date ocurred during 2020 and have a life span of approximate 12 years. With these Synthetic Power Purchase Agreements a fixed quantity of Guarantees of Origin will be transferred from the solar projects to Galp during the same time frame.

R2Q21 RESULTS JULY 2021
70
The realised results of derivative financial instruments are mainly recognised as part of the cost of sales (Note 21), financial income or expenses. The breakdown of the financial results related to derivative financial instruments (Note 21) is as follows:
Unit: € m
June 2021 June 2020
(148) 73
Commodity Swaps (27) (6)
Options (17) 86
Commodity Futures (105) (41)
Other trading operations - 34
The derivatives above are entered into to hedge commercial positions.
Table above excludes MTM and gains or losses on FX Forwards which are reflected in the caption of Foreign exchange gains/losses.
18. Non-controlling interests
(a) Non-controlling interest dividends in the amount of €12 m were declared during the period, but still not paid.
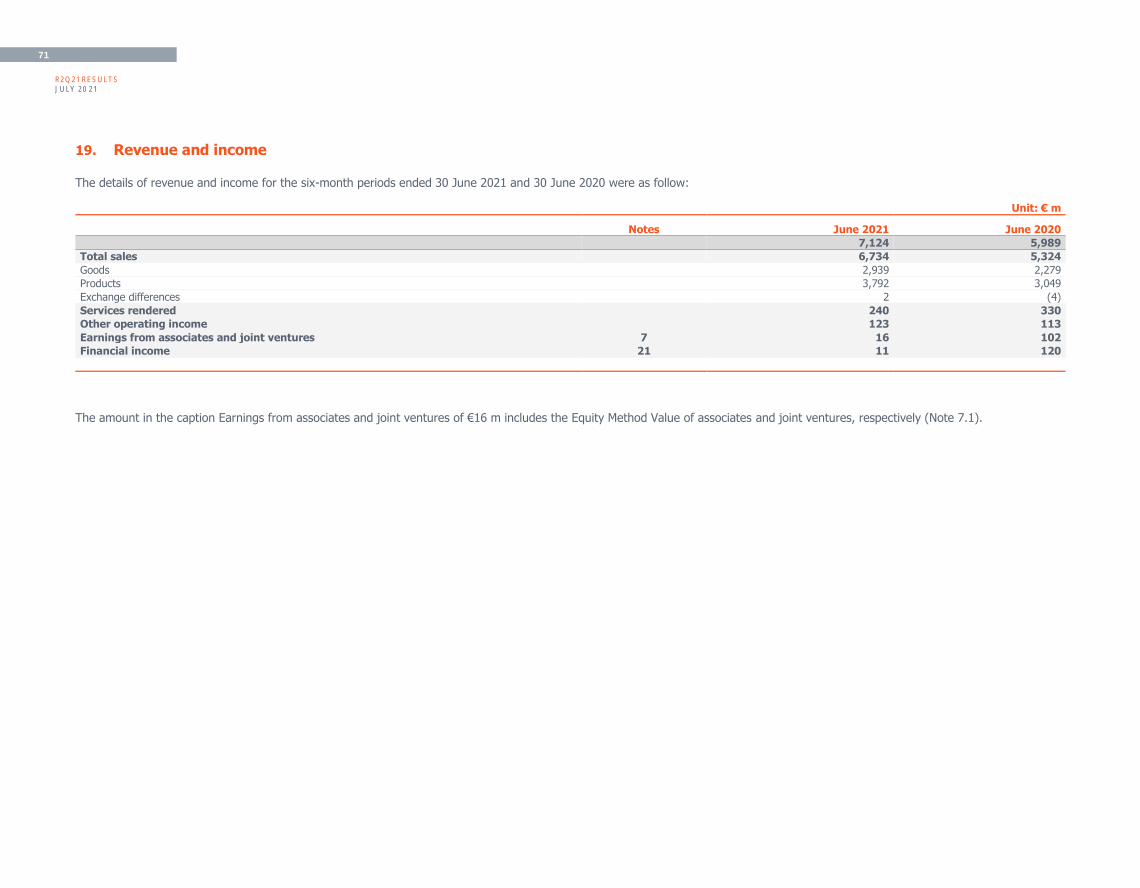
R2Q21 RESULTS JULY 2021
71
19. Revenue and income
The details of revenue and income for the six-month periods ended 30 June 2021 and 30 June 2020 were as follow:
Unit: € m
Notes June 2021 June 2020
7,124 5,989
Total sales 6,734 5,324
Goods 2,939 2,279
Products 3,792 3,049
Exchange differences 2 (4)
Services rendered 240 330
Other operating income 123 113
Earnings from associates and joint ventures 7 16 102
Financial income 21 11 120
The amount in the caption Earnings from associates and joint ventures of €16 m includes the Equity Method Value of associates and joint ventures, respectively (Note 7.1).
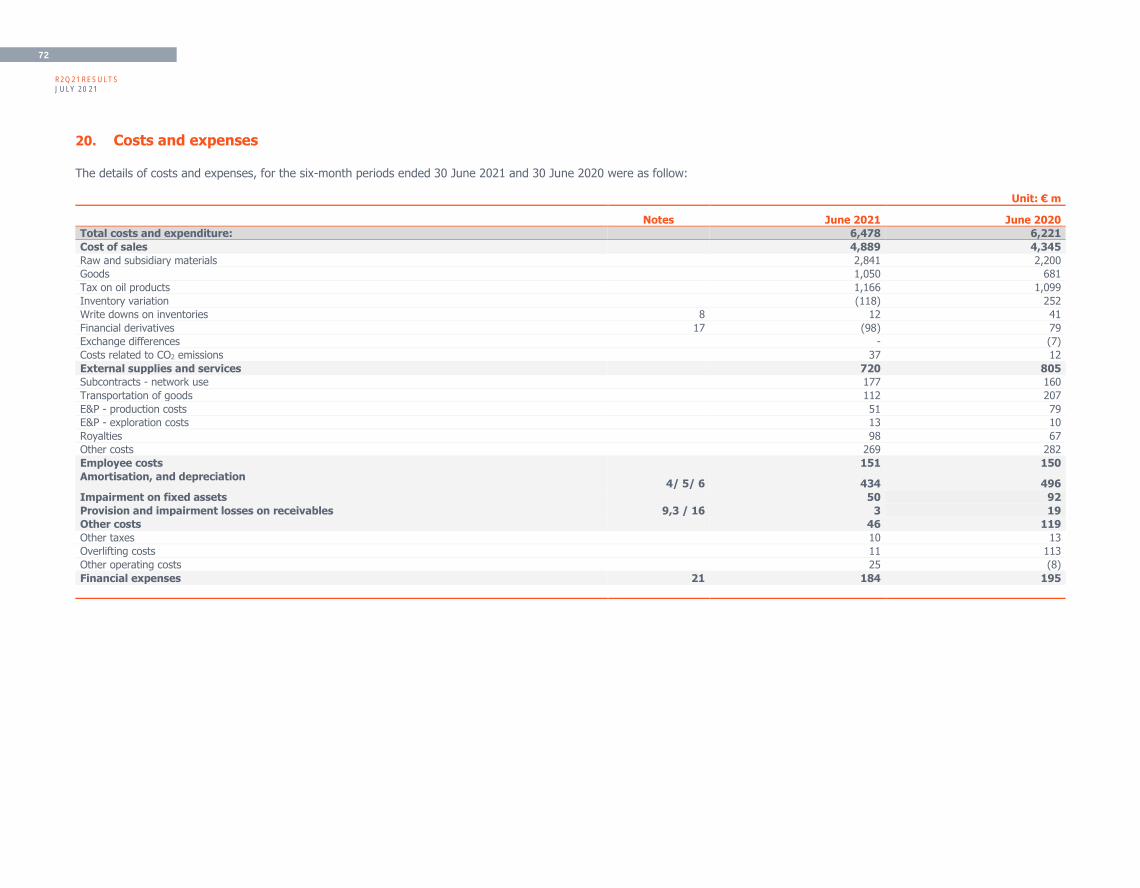
R2Q21 RESULTS JULY 2021
72
20. Costs and expenses
The details of costs and expenses, for the six-month periods ended 30 June 2021 and 30 June 2020 were as follow:
Unit: € m
Notes June 2021 June 2020
Total costs and expenditure: 6,478 6,221
Cost of sales 4,889 4,345
Raw and subsidiary materials 2,841 2,200
Goods 1,050 681
Tax on oil products 1,166 1,099
Inventory variation (118) 252
Write downs on inventories 8 12 41
Financial derivatives 17 (98) 79
Exchange differences - (7)
Costs related to CO2 emissions 37 12
External supplies and services 720 805
Subcontracts - network use 177 160
Transportation of goods 112 207
E&P - production costs 51 79
E&P - exploration costs 13 10
Royalties 98 67
Other costs 269 282
Employee costs 151 150
Amortisation, and depreciation 4/ 5/ 6 434 496
Impairment on fixed assets 50 92
Provision and impairment losses on receivables 9,3 / 16 3 19
Other costs 46 119
Other taxes 10 13
Overlifting costs 11 113
Other operating costs 25 (8)
Financial expenses 21 184 195
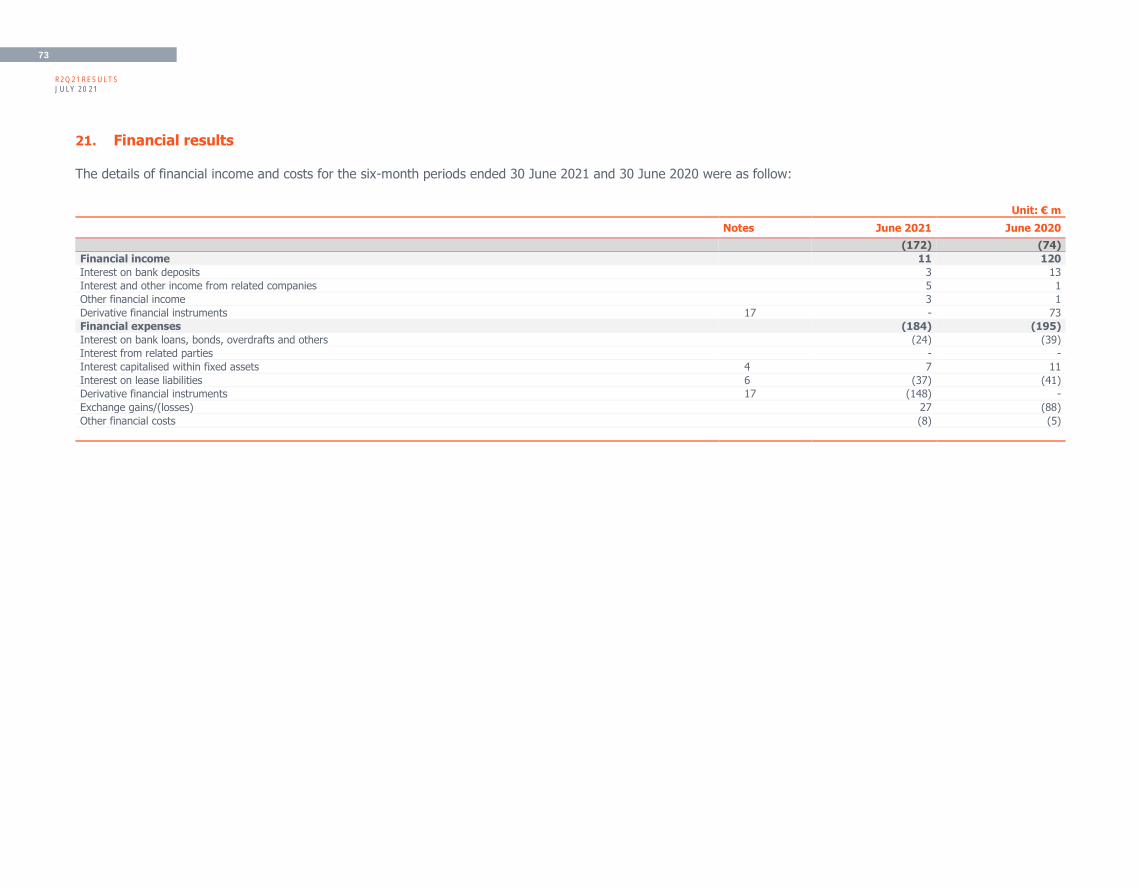
R2Q21 RESULTS JULY 2021
73
21. Financial results
The details of financial income and costs for the six-month periods ended 30 June 2021 and 30 June 2020 were as follow:
Unit: € m
Notes June 2021 June 2020
(172) (74)
Financial income 11 120
Interest on bank deposits 3 13
Interest and other income from related companies 5 1
Other financial income 3 1
Derivative financial instruments 17 - 73
Financial expenses (184) (195)
Interest on bank loans, bonds, overdrafts and others (24) (39)
Interest from related parties - -
Interest capitalised within fixed assets 4 7 11
Interest on lease liabilities 6 (37) (41)
Derivative financial instruments 17 (148) -
Exchange gains/(losses) 27 (88)
Other financial costs (8) (5)

R2Q21 RESULTS JULY 2021
74
22. Related party transactions
The Group had the following material transactions with related parties:
Unit: € m
June 2021 December 2020
Notes Current Non-current Current Non-current
Assets: 19 - 31 158
Associates 17 - 28 49
Joint ventures 1 - 1 109
Other related entities 2 - 2 -
Unit: € m
June 2021 December 2020
Notes Current Non-current Current Non-current
Liabilities: (65) - (58) -
Associates (10) - (11) -
Joint Ventures (55) - (48) -
Other related entities - - 1 -
Unit: € m
June 2021 June 2020
Purchases Operating
cost/income Financial
costs/income Purchases
Operating cost/income
Financial costs/income
Transactions: (8) (33) 1 (46) 5 0
Associates (1) (43) 1 (40) (1) -
Joint Ventures - (5) - - (6) -
Other related entities (7) 15 - (6) 12 0

R2Q21 RESULTS JULY 2021
75
23. Subsequent Events
No material subsequent events occurred between the reporting date and the date of approval of these statements.
24. Approval of the financial statements
The consolidated financial statements were approved by the Board of Directors on 23 July 2021.
Chairman: Paula Amorim
Vice-chair and Lead Independent Director:
Miguel Athayde Marques
Vice-chair: Andrew Brown
Members: Filipe Silva
Thore E. Kristiansen
Carlos Costa Pina
Carlos Silva
Sofia Tenreiro
Teresa Abecasis
Marta Amorim
Francisco Rêgo
Carlos Pinto
Luís Todo Bom
Jorge Seabra
Rui Paulo Gonçalves
Diogo Tavares
Edmar de Almeida
Cristina Fonseca
Adolfo Mesquita Nunes
Accountant: Paula de Freitas Gazul

R2Q21 RESULTS JULY 2021
76
25. Explanation regarding translation
These English language financial statements are a translation of the financial statements prepared in Portuguese in accordance with IAS 34 – Interim Financial Reporting, and with the International Financial Reporting Standards adopted by the European Union. In the event of any discrepancy, the Portuguese language version shall prevail.

R2Q21 RESULTS JULY 2021
77
R2Q21 RESULTS JULY 2021
78
9. DEFINITIONS
Replacement cost (RC)
According to this method of valuing inventories, the cost of goods sold is valued at the
cost of replacement, i.e. at the average cost of raw materials of the month when sales
materialise irrespective of inventories at the start or end of the period. The Replacement
Cost Method is not accepted by the IFRS and is consequently not adopted for valuing
inventories. This method does not reflect the cost of replacing other assets.
Replacement cost adjusted (RCA)
In addition to using the replacement cost method, RCA items exclude special items such
as derivatives hedges, capital gains or losses on the disposal of assets, extraordinary
taxes, impairment or reinstatement of fixed assets and environmental or restructuring
charges which may affect the analysis of the Company’s profit and do not reflect its
operational performance.
Acronyms
%: Percentage
ACS: Actividades de Construccion Y Servicios SA
APETRO: Associação Portuguesa de Empresas Petrolíferas (Portuguese association of oil
companies)
B2B: Business to business
B2C: Business to consumer
bbl: barrel of oil
bn: billion
boe: barrels of oil equivalent
BRL: Brazilian real
c.: circa
CO2: Carbon dioxide
Capex: Capital expenditure
CESE: Contribuição Extraordinária sobre o Sector Energético (Portuguese Extraordinary
Energy Sector Contribution)
CFFO: Cash flow from operations
COFINS: Contribution for the Financing of Social Security
CMVM: Portuguese Securities Market Commission
CORES: Corporación de Reservas Estratégicas de
Produtos Petrolíferos (Spain)
d: day
DD&A: Depreciation, Depletion and Amortisation
Ebit: Earnings before interest and taxes
Ebitda: Ebit plus depreciation, amortisation and provisions
EMPL: Europe Magreb Pipeline, Ltd
EUR/€: Euro
FCC: Fluid Catalytic Cracker
FCF: Free Cash Flow
FID: Final Investment Decision
FLNG: Floating liquified natural gas
FNEE: Fondo Nacional de Eficiência Energética (Spain)
FPSO: Floating, production, storage and offloading unit
Galp, Company or Group: Galp Energia, SGPS, S.A., subsidiaries and participated
companies
GGND: Galp Gás Natural Distribuição, S.A.
GSBV: Galp Sinopec Brazil Services
GW: Gigawatt
GWh: Gigawatt hour
I&EM: Industrial & Energy Management
IAS: International Accounting Standards
IRC: Income tax
IFRS: International Financial Reporting Standards
IRP: Oil income tax (Oil tax payable in Angola)
ISP: Payments relating to tax on oil products
kboepd: thousands of barrels of oil equivalent per day
kbpd: thousands of barrels of oil per day
LNG: liquefied natural gas
LTM: last twelve months
m: million
MIBGAS: Iberian Market of Natural Gas
mbbl: million barrels of oil
mboe: millions of barrels of oil equivalent
mbtu: million British thermal units
mm³: million cubic metres

R2Q21 RESULTS JULY 2021
79
MTM: Mark-to-Market
mton: millions of tonnes
MW: Megawatt
MWh: Megawatt-hour
NE: Net entitlement
NG: natural gas
n.m.: not meaningful
NWE: Northwestern Europe
OCF: Adjusted Operating Cash Flow
PV: photovoltaic
p.p.: percentage point
Q: Quarter
QoQ: Quarter-on-quarter
R&NB: Renewables & New Businesses
REN: Rede Eléctrica Nacional
RC: Replacement Cost
RCA: Replacement Cost Adjusted
SPA: Sale and purchase agreement
SPT: Special participation tax
ton: tonnes
TTF: Title transfer facility
TWh: Terawatt-hour
UA: Unitisation Agreements
U.S.: United States
UOP: Units of production
USD/$: Dollar of the United States of America
Var.: Variation
WI: working interest
YoY: year-on-year

R2Q21 RESULTS JULY 2021
80
Otelo Ruivo, Director
Inês C. Santos
João Antunes
João G. Pereira
Teresa Rodrigues
Galp Energia, SGPS, S.A.
Investor Relations
Contacts:
+351 21 724 08 66
Address:
Rua Tomás da Fonseca, Torre
A, 1600-209 Lisbon
Portugal
Website: www.galp.com/corp/en/investors
Email: [email protected]
Reuters: GALP.LS
Bloomberg: GALP PL