quantum trader
TRANSCRIPT

8/6/2019 Quantum Trader
http://slidepdf.com/reader/full/quantum-trader 1/12

8/6/2019 Quantum Trader
http://slidepdf.com/reader/full/quantum-trader 2/12
Fundamental Analysis and Technical Analysis
Fundamental analysis, is focuses on the overall performance of the economy. You
can say it’s the “big-picture” view that allows price trends to be predicted by
analyzing different economic indicators.
Technical analysis on the other hand, focuses on studying and following price
patterns. And by analyzing past price patterns traders can – hopefully - predict
what price is going to do in the future.
To be a successful and professional trader, you should combine both types of
analysis and never relay on one of them and completely ignore the other. Limiting
yourself to only one or the other is the guaranteed failure formula.
Why? Let's say you're going to focus on technical analysis and totally ignore
fundamental analysis. As you begin to analyze your charts, you start to see what
seems like a good trading opportunity taking place. You've got all your favorite
indicators showing that the US dollar is about to go on a powerful trend and hurry
to get in early. You place the order, relax and wait for price to hit the target easily.
But instead, price moves suddenly in the exact opposite direction!
Because simply, Unemployment numbers were just released and not only that but
one of the world's largest corporations announced that their earnings were well
under forecasted amounts, and they predicted sales would continue to be
sluggish through the next quarter.
Those two factors directly affected the price rally you predicted. If only you had
mixed a little fundamental analysis in with all of those amazing price charts you
were busy studying you may have seen this one coming.

8/6/2019 Quantum Trader
http://slidepdf.com/reader/full/quantum-trader 3/12
Of course, using fundamental analysis alone is not enough as well.
Because it doesn’t provide – for example - entry and exit points. Of course you
may know that there would be price increase for the pound is due for a price, but
how much exactly? When exactly should you buy and when should you sell?
It’s only when you start applying both analysis methods you would get the whole
picture and start trading successfully.

8/6/2019 Quantum Trader
http://slidepdf.com/reader/full/quantum-trader 4/12
Quantum Trading System
Most new trading just doesn’t like to wait for a complete and perfect trade to
take place. These types of short term traders would be very happy to get into
multiple trades per day for 10+ pips profit for each trade. Rather than opening
one trade per day and wait until price hits the 100+ pips target.
Momentum trading or short term system is the best forex trading strategy that
they can use. But with the Quantum system we are also going to include medium
term or long term trading as well. The reason for that is while short term trading
is the favorite strategy for new traders, they won’t be beginners forever! And
soon they will feel the need to trade more professionally for larger profits.
And instead of looking for another trading system, you will find long term trading
strategy within this system as well as the momentum – short term – strategy.
8/6/2019 Quantum Trader
http://slidepdf.com/reader/full/quantum-trader 5/12
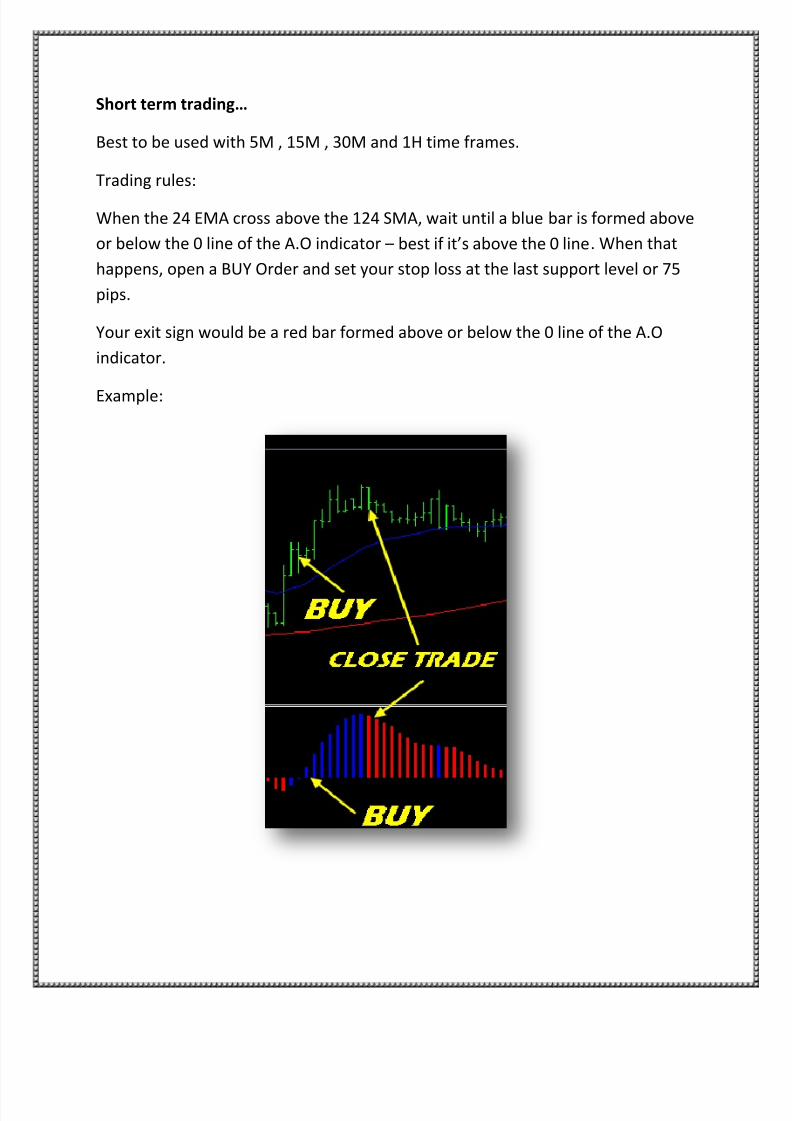
Short term trading…
Best to be used with 5M , 15M , 30M and 1H time frames.
Trading rules:
When the 24 EMA cross above the 124 SMA, wait until a blue bar is formed above
or below the 0 line of the A.O indicator – best if it’s above the 0 line. When that
happens, open a BUY Order and set your stop loss at the last support level or 75
pips.
Your exit sign would be a red bar formed above or below the 0 line of the A.O
indicator.
Example:

8/6/2019 Quantum Trader
http://slidepdf.com/reader/full/quantum-trader 6/12
The opposite conditions are used for sell orders.
When 124 SMA cross the 24 EMA, wait until a new red bar is formed above or
below the A.O indicator. Best if it’s below the 0 line. When that happens, open a
sell order and set your stop loss at the last resistance level or 75 pips.
Your exist sign is when a new blue bar is formed above o below the 0 line of the
A.O indicator.
Example:

8/6/2019 Quantum Trader
http://slidepdf.com/reader/full/quantum-trader 7/12
Long Term Trading
For long term trading we are going to apply almost the same rules with few
changes.
For sell orders, only sell when the red bar is formed below 0 line + 124 MA cross
above 24 MA.
And only exit when a blue bar is formed above the 0 line + 24 MA cross above
124 MA.
Example:
Notice how with this strategy you could get a lot more profits, if you can wait!

8/6/2019 Quantum Trader
http://slidepdf.com/reader/full/quantum-trader 8/12
And for buy orders, only buy when the blue bar is formed above 0 line + 24 MA
cross above 124 MA.
And only exit when a red bar is formed below 0 line + 124 MA cross above 24 MA.
Example:
8/6/2019 Quantum Trader
http://slidepdf.com/reader/full/quantum-trader 9/12
Forex Trading Time
The forex market hours stretch from Monday morning in Sydney, Australia to
Friday afternoon in New York. During that time the market is open somewhere
around the globe at all hours of the day or night.
However it is not a 24/7 market because it does shut down on weekends. 24/5
would be more accurate.
If you need to know the exact times that the markets open and close, you have to
take time zones into consideration. It is very simple when expressed in UTC. This
is Universal Coordinated Time, formerly known as Greenwich Mean Time. This is
the standard (winter) time in Greenwich, London which is the point of zero
longitude on the globe.
So, the normal forex market hours are 22.00 Sunday UTC to 22.00 Friday UTC.This is 10 pm in the UK in winter time.
New York is 5 hours behind the UK so the global forex market opens and closes at
5 pm Sunday/Friday in New York, 2 pm on the US west coast, 11 pm in Germany,
8 am Monday/Saturday in Sydney.
Things get a little complicated when you start to try to take summer time daylight
saving into account. This makes one hour difference in countries that observe it.
But daylight saving operates in a different way in the southern hemisphere

8/6/2019 Quantum Trader
http://slidepdf.com/reader/full/quantum-trader 10/12

8/6/2019 Quantum Trader
http://slidepdf.com/reader/full/quantum-trader 11/12
The US dollar is the most traded currency by a long way, involved in 2.5 times as
many trades as its nearest rival the euro. This means that events in the USA have
a greater impact on the financial markets than events in other countries. The NewYork market tends to slow down around 3 pm local time (8 pm UTC) and if you are
involved in a US dollar pair, this can be a good time to stop trading for the day.
So theoretically you can trade 24 hours a day from Sunday night to Friday night.
Automated software in the form of a forex robot can even make this physically
possible. However, a cautious trader will choose his times and will not be active
during all of the forex market hours.

8/6/2019 Quantum Trader
http://slidepdf.com/reader/full/quantum-trader 12/12
U.S. Government Required Disclaimer –
Commodity Futures Trading Commission Futures and Options trading has largepotential rewards, but also large potential risk. You must be aware of the risks
and be willing to accept them in order to invest in the futures and optionsmarkets.
CFTC RULE 4.41 - HYPOTHETICAL OR SIMULATED PERFORMANCE RESULTS HAVE CERTAIN
LIMITATIONS. UNLIKE AN ACTUAL PERFORMANCE RECORD, SIMULATED RESULTS DO NOTREPRESENT ACTUAL TRADING. ALSO, SINCE THE TRADES HAVE NOT BEEN EXECUTED, THE RESULTS
MAY HAVE UNDER-OR-OVER COMPENSATED FOR THE IMPACT, IF ANY, OF CERTAIN MARKET
FACTORS, SUCH AS LACK OF LIQUIDITY.
SIMULATED TRADING PROGRAMS IN GENERAL ARE ALSO SUBJECT TO THE FACT THAT THEY ARE
DESIGNED WITH THE BENEFIT OF HINDSIGHT. NO REPRESENTATION IS BEING MADE THAT ANY
ACCOUNT WILL OR IS LIKELY TO ACHIEVE PROFIT OR LOSSES SIMILAR TO THOSE SHOWN.