quantitatively assessing and visualising industrial …fms27/papers/2011-leverett-industrial.pdf ·...
TRANSCRIPT

Quantitatively Assessing and Visualising
Industrial System Attack Surfaces
Eireann P. Leverett
University of Cambridge
Computer Laboratory
Darwin College
June 2011
This dissertation is submitted for
the degree of MPhil in Advanced Computer Science

Declaration
I, Eireann P. Leverett of Darwin College, being a candidate for the M. Phil in Advanced
Computer Science, hereby declare that this report and the work described in it are my
work, unaided except as may be specified below, and the report does not contain material
that has already been used to any substantial extent for a comparable purpose.
A small portion of this dissertation is derived from a paper submitted to USENIX
WOOT’11. That text was written in collaboration with Frank Stajano, Jon Crowcroft,
and Shailendra Fuloria in the course of my MPhil study. The project itself is my own
work, and their effort is contained in the writing up and advising on that paper submission,
rather than the execution of the MPhil project itself.
This dissertation contains 14 006 words and does not exceed the regulation length of 15 000
words, including tables and footnotes.
Signed:
Date:

Quantitatively Assessing and Visualising Industrial System
Attack Surfaces
Eireann P. Leverett
Supervisors: Dr. Frank Stajano & Prof. Jon Crowcroft
Summary
Any industrial control systems connected to the Internet are naturally exposed to online
threats such as viruses, Denial of Service and targeted application or machine compromise.
These threats may come from those seeking to inflict mischievous damage, make money, or
sabotage national infrastructure remotely. Best practice, and indeed national regulatory
standards such as NERC-CIP, mandates a strict electronic security perimeter, particularly
since few devices used in control systems support default authentication1. Despite that,
even though many utilities claim to comply with NERC-CIP, we have located on the
Internet many industrial control devices available for connection.
Examining results over a two year time window through the specialised historical search
engine Shodan, we located, identified and categorised more than 7500 such devices—
HVAC systems, building management systems, meters, and other industrial control de-
vices or SCADA servers (supervisory control and data acquisition). In conjunction with
information from exploit databases, this could be used to carry out remote attacks on se-
lected devices or identify networks for further reconnaissance and exploitation. Malicious
actors might already be doing this.
To level the playing field for utility security professionals intent on re-perimeterisation,
we built a visualisation tool that finds exposed systems on the Internet, visualises them
on a time-dependent world map based on their city geolocation and presents details of
potentially applicable remote exploits. This allows defenders to assess their attack surface
and prioritise the required interventions in a timely manner. We expect it will also be
useful to auditors called upon to evaluate whether a utility complies with the required
security standards.
1Evidence supporting this claim can be found within the dissertation.

Acknowledgments
The author’s research is funded by BP. The contents of this dissertation do not nec-
essarily express the views of BP. The author would also like to thank Frank Stajano,
Jon Crowcroft, Shailendra Fuloria, Ross Anderson, John Matherly, Judith Rossebo, Kai
Hansen, Sean McBride, Joshua Pennell, Colin Cassidy, Ian Henderson, and John Meakin.

Contents
1 Introduction 9
1.1 Goals . . . . . . . . . . . . . . . . . . . . . . . . . . . . . . . . . . . . . . . 9
1.2 Industrial Automation History . . . . . . . . . . . . . . . . . . . . . . . . . 10
1.2.1 Incidents . . . . . . . . . . . . . . . . . . . . . . . . . . . . . . . . . 11
1.2.2 NERC CIP . . . . . . . . . . . . . . . . . . . . . . . . . . . . . . . 15
2 Methodology 17
2.1 Technology stack . . . . . . . . . . . . . . . . . . . . . . . . . . . . . . . . 18
2.2 Rules of Engagement . . . . . . . . . . . . . . . . . . . . . . . . . . . . . . 18
2.3 Device and System classification . . . . . . . . . . . . . . . . . . . . . . . . 19
2.3.1 Devices . . . . . . . . . . . . . . . . . . . . . . . . . . . . . . . . . 19
2.3.2 Systems . . . . . . . . . . . . . . . . . . . . . . . . . . . . . . . . . 20
2.4 Banners and Shodan . . . . . . . . . . . . . . . . . . . . . . . . . . . . . . 22
2.4.1 Banners . . . . . . . . . . . . . . . . . . . . . . . . . . . . . . . . . 23
2.5 Adding exploit information and geolocation . . . . . . . . . . . . . . . . . 23
2.5.1 Exploit searches . . . . . . . . . . . . . . . . . . . . . . . . . . . . . 23
2.5.2 Geolocation . . . . . . . . . . . . . . . . . . . . . . . . . . . . . . . 27
3 Exploring the Dataset 31
3.1 Global inferences should not be made . . . . . . . . . . . . . . . . . . . . . 31
3.2 Internal inferences provide some insight into the industry . . . . . . . . . . 32
3.3 HTTP Response Codes . . . . . . . . . . . . . . . . . . . . . . . . . . . . . 32
3.4 Disambiguation and false positives . . . . . . . . . . . . . . . . . . . . . . 35
3.4.1 Geolocation . . . . . . . . . . . . . . . . . . . . . . . . . . . . . . . 36

CONTENTS CONTENTS
3.4.2 Exploits . . . . . . . . . . . . . . . . . . . . . . . . . . . . . . . . . 36
3.4.3 Powerlink product name ambiguity . . . . . . . . . . . . . . . . . . 36
3.4.4 Reverse DNS .arpa addresses . . . . . . . . . . . . . . . . . . . . . 36
4 Industry Feedback Sessions 40
4.1 Judith Rossebo and Kai Hansen . . . . . . . . . . . . . . . . . . . . . . . . 40
4.2 Joshua Pennell . . . . . . . . . . . . . . . . . . . . . . . . . . . . . . . . . 41
4.3 Colin Cassidy . . . . . . . . . . . . . . . . . . . . . . . . . . . . . . . . . . 42
4.4 Sean McBride . . . . . . . . . . . . . . . . . . . . . . . . . . . . . . . . . . 42
5 Conclusion 44
5.1 Potential uses and mitigations . . . . . . . . . . . . . . . . . . . . . . . . . 44
5.1.1 Use as an audit tool . . . . . . . . . . . . . . . . . . . . . . . . . . 44
5.1.2 Recommended counter-measures . . . . . . . . . . . . . . . . . . . . 44
5.2 Extensions and improvements . . . . . . . . . . . . . . . . . . . . . . . . . 45
5.2.1 Crowdsource more banners . . . . . . . . . . . . . . . . . . . . . . . 45
5.2.2 Track down a subset of companies . . . . . . . . . . . . . . . . . . . 46
5.2.3 Active geolocation attacks . . . . . . . . . . . . . . . . . . . . . . . 46
5.2.4 Scan more ports and use more machines . . . . . . . . . . . . . . . 46
5.2.5 Realtime stream processing . . . . . . . . . . . . . . . . . . . . . . 47
5.2.6 Machine fingerprinting techniques . . . . . . . . . . . . . . . . . . . 47
5.2.7 Banner classifier . . . . . . . . . . . . . . . . . . . . . . . . . . . . . 47
5.2.8 Trending . . . . . . . . . . . . . . . . . . . . . . . . . . . . . . . . . 48
5.3 Criticality is dependent on context . . . . . . . . . . . . . . . . . . . . . . 49
5.4 Contributions . . . . . . . . . . . . . . . . . . . . . . . . . . . . . . . . . . 50
5.5 Conclusion . . . . . . . . . . . . . . . . . . . . . . . . . . . . . . . . . . . . 50
Bibliography 53
6

List of Figures
2.1 Example exposure time-map with red marking systems with known exploits 28
2.2 Node information within visualisation . . . . . . . . . . . . . . . . . . . . . 28
2.3 Vulnerable node information within visualisation . . . . . . . . . . . . . . . 29
3.1 Breakdown of HTTP response types . . . . . . . . . . . . . . . . . . . . . . 34
3.2 Screenshot of unauthenticated whitelisting . . . . . . . . . . . . . . . . . . 34
3.3 Default user names and passwords available in help files . . . . . . . . . . . 35
5.1 Number of connections per week . . . . . . . . . . . . . . . . . . . . . . . . 48
List of Tables
1.1 Sampling of Industrial Security Incidents . . . . . . . . . . . . . . . . . . . 12
2.1 Number of connections per query . . . . . . . . . . . . . . . . . . . . . . . 22
2.2 Connections logged per country . . . . . . . . . . . . . . . . . . . . . . . . 30
3.1 Operating System tag count . . . . . . . . . . . . . . . . . . . . . . . . . . 33
3.2 Server tag count . . . . . . . . . . . . . . . . . . . . . . . . . . . . . . . . . 38
3.3 The ten Autonomous Systems with the most exposure. . . . . . . . . . . . 39

Chapter 1
Introduction
Security of industrial control systems (ICS) against online attacks has received consider-
able attention in the last decade. This attention and effort can be commonly interpreted
as securing a variety of systems against on-line sabotage: utilities like electricity, wa-
ter, and oil and gas. The term ICS may also refer to networks like those for maintaining
transport and communication; and industrial plants such as refineries and pharmaceutical
facilities. Some of the devices used in control systems don’t come with default authenti-
cation enabled, so ‘re-perimeterisation’ is the first step towards reducing their exposure.
The North American Electric Reliability Corporation (NERC), the electricity regulator in
the United States, Canada, and part of Mexico, has identified a set of standards for criti-
cal infrastructure protection called NERC-CIP, which mandate a strict electronic security
perimeter (as well as other organisational and technical security measures).
In this chapter we describe the high level goals of this project, and provide a history of
industrial system security and a brief overview of industrial security incidents. We also
describe the regulatory framework in the USA that our work aligns with, although the
techniques and project have relevance outside that regulatory framework as well.
1.1 Goals
The primary aim of this project is to debunk a popular folk myth of industrial control
systems (hereafter ICS); namely, that they are never connected to the internet.
This is a very pervasive story within the ICS community, but is not always backed up
by evidence. Individual counter-examples spring up often enough to warrant further
investigation, and we set out to provide a larger body of such counter-examples than
previously acknowledged. It is intended that other researchers will add to the set of
counter-examples, and that this may become an open source data set for academic research
of ICS.
9
CHAPTER 1. INTRODUCTION 10
A secondary goal is to log such connections over time and visualise them alongside relevant
vulnerability information from the computer security community. The logging of such
connections over time is a first step towards answering important questions such as ‘are
these systems becoming more or less connected?’ The visualisation is focused upon the
management and prioritisation of these systems for re-perimeterisation or patching. Such
information may be used by regulatory auditors such as those employed by NERC-CIP
interested in determining the effectiveness of the program1. It also serves to make such
knowledge accessible to non-technical participants in the debate (or technical participants
from another field of study).
The third and final goal is to present a global view of ICS connectivity and vulnerability,
rather than the partisan views of individual governments or corporations.
1.2 Industrial Automation History
A brief history will help us understand the present situation. Originally, industrial control
systems were developed in isolation and were primarily hardware systems. They required
people to physically go out in the field to operate equipment. Over time though it became
clear that tele-control of these devices was a cost saving approach. This was doubly
reinforced as baby boomer engineers began to retire and there was a shortage of engineers
to replace them. Thus the supervisory control and data acquisition (SCADA) industry
was born. A SCADA or Process Control system is many things to many people, but we
primarily refer to a network of computers and purpose built hardware to maintain control
of an engineering network or industrial process.
The retirement of engineering professionals and the reducing cost of communications sys-
tems led to tele-control through the use of modems, where the connectivity was still point
to point. This increased exposure was minor, and the utilities still controlled the phys-
ical medium of communication for large portions of their network. Over time, though,
increased cost savings drove further automation and the leasing of communications net-
works for the purpose of tele-control. Proprietary protocols were still in use and many
utilities worked with a single system vendor. Interoperability became more of an issue and
movement towards IP connectivity occurred, simultaneously with the shift to firmware
and software. This is the critical inflection point, where point to point connectivity is
abandoned in favour of IP technologies to drive return on investment within the utility
business. Security was an afterthought to the cost savings of increased automation, as is
often seen in other industries.
During this time period there were wake up calls as well, such as the industrial security
incidents documented in Byres and Lowe [5]. A short but representative sample would
include:1Specifically NERC-CIP-5.

CHAPTER 1. INTRODUCTION 11
1. Slammer worm shuts down the Ohio Davis-Besse nuclear power station.
2. Digital infiltration and compromise of a Harrisburg Pennsylvania water utility net-
work.
3. A schoolboy switches trams from tracks and derails them in Lodz, Poland.
4. Insider attack on a sewage system in Maroochyshire, Australia.
5. CIA Agent Tom Donohue’s report of extortion attempts against utilities outside the
USA in 2008.
6. Stuxnet discovered and reverse engineered.
You will note that the motivations of these attackers range from an undirected worm,
to stealing computational time, revenge, extortion, and sabotage. In other words, pro-
gressing from accidental to profitable, and finally directed sabotage probably by a nation
state.
There is another case of interest which is not an industrial security incident, but is highly
relevant. The Aurora research [22] showed that generators could be caused to decouple
themselves and become inoperable due to remote commands.
Motivated by all of these factors the re-perimeterisation of these devices was identified as
a national priority in the USA (and other countries), and NERC CIP-5 [16] is trying to
accomplish this today. By re-perimeterisation, we mean creating an electronic security
perimeter using firewalls, and in combination with logical and physical network segre-
gation. In the long run these devices will need to function in the presence of hostile
network traffic, but in the short run they need to be brought inside the electronic security
perimeter.
Implementing authentication in all these devices is a complex supply chain problem that
might take ten years or more to resolve. This is simply because of the operational life
cycle of these devices, which can range from 2-20 years. Given such a scenario the right
approach is to start authenticating at the perimeter, until such a time as these devices are
functional in the hostile environment of the global internet, as well as the harsh physical
conditions many of them are built to withstand.
1.2.1 Incidents
This section is devoted to computer security incidents of industrial control systems. A brief
walk through industrial security incidents serves to motivate the work below, describes
the context in which industrial control system security operates, and show us a range of
motives and methods for compromise of these systems. It also serves to counter act the

CHAPTER 1. INTRODUCTION 12
pervasive folk-myth of security by air-gap, a frequently invoked barrier towards security
innovation in this field. In Table 1.1, ICS security incidents are ordered from accidental
to targeted.
Incident Locale Directiveness Apparent Motivation
Davis-Besse Remote Untargeted Renown
Harrisburg Remote Incidental Repurposing Resources
Lodz Local Targeted Mischief
Maroochyshire Local Targeted Revenge
Donahue Remote Targeted Profit
Stuxnet Remote Targeted Sabotage
Table 1.1: Sampling of Industrial Security Incidents
Davis-Besse
The Davis-Besse nuclear power plant run by First Energy next to Lake Erie in Ohio [8]
was affected by the slammer worm in 2003. Luckily the plant was not operational at the
time, and was offline for ongoing maintenance. Still, a Safety Parameter Display System
was made inoperative for 5 hours, and such a display is safety critical even when the
plant is not operating. The worm entered the network via a consultant’s T1 connection,
and spread rapidly in an environment where patching is infrequent. Slammer is well
documented in Moore et al [15], and this incident essentially serves as evidence that these
systems are reachable by a randomly scanning worm. The presence of an airgap may
increase the latency of this process, but does not mitigate it.
It is also valuable to note that malware which was not specifically designed to affect
supervisory control and data acquisition (SCADA) systems, or indeed specifically target
them can have safety critical effects.
Harrisburg
In 2006 an employee’s laptop was compromised by a hacker operating from outside the
USA. The employee was contracting for a Harrisburg Pennsylvania water company, and
the hacker subsequently compromised the remote connection into the water company’s
SCADA network. Once into the network a Human Machine Interface (see Section 2.3.2
for further definition of an HMI) was infected with spyware and malware. The attacker’s
motivation appears to be the appropriation of computers for use as part of an online
gaming network. This involved the creation of forums and email servers to facilitate
gaming.
CHAPTER 1. INTRODUCTION 13
This particular case is interesting because it shows that such compromises are possible
even for a hacker without knowledge of SCADA systems, and for reasons unexpected to
your average control system engineer. The motivation of a directed compromise might
simply be the use of your computational resources, not money or terror. Additionally, all
the old challenges of computer security arise such as tracking and prosecuting someone in
another national jurisdiction.
Maroochyshire
Between February 9th and April 23rd 2000, multiple malicious interventions in sewage
pumping stations occurred in Maroochyshire, Australia. Hundreds of gallons of raw
sewage were released into rivers and parks.
Since then, a former employee of an IT consultancy employed by the council has been
convicted of these attacks. The incident report notes that the former employee (Vitek
Boden) used stolen equipment and his insider knowledge of the system, which allowed him
to alter radio messages sent to pumping stations or to falsify them altogether. Addition-
ally, he was able to remove ‘alarms’ from the pumping stations to make his changes and
simultaneously remain undetected. The alarms in this case are not the physical alarms,
but rather urgent messages passed (via SMS or email) to control engineers when a de-
vice exceeds some operational limit or parameter, or has its configuration altered. By
disabling these alarms he exacerbated the damage caused by his malicious actions, since
it increased the time until alterations were noticed.
The key points in this case are that he was motivated by revenge, and highly knowledge-
able of the systems and protocols he exploited. He was able to evade detection for months,
and in the initial stages the control system engineers blamed installation errors rather than
detecting malicious actions. It took weeks for the office culture to shift towards proving
the existence of, and detecting, a malicious actor.
Lastly, the sabotage perpetrated by Vitek Boden is a mixture of remote and local. While
he issued his malicious commands remotely and wirelessly, he was in close proximity to
the stations he exploited. So during a period that he was parked near a pumping station,
he was picked up by local police officers. This highlights the value of control system
engineers, computer security professionals, and police forces having an understanding of
each other’s roles and responsibilities during such an event.
According to the Repository of Industrial Security Incidents (RISI) analysis done by Byres
and Lowe [5], insider attacks happen less frequently than remote attacks, but they are
much more costly.

CHAPTER 1. INTRODUCTION 14
Lodz
In January of 2008 a teenage boy took unauthorised command of the city tram control
system in Lodz, Poland, derailing four vehicles [3]. He had adapted a television remote
control so that it was capable of switching tram vehicles from one set of tracks to another.
These unexpected track changes caused a great deal of damage to the trams that were
derailed and injury to passengers.
In this particular case, we can see that even if the control system itself is isolated from
the Internet, there are still field controllers that need further protection from jamming,
unauthorised control, and exploitation locally. It also provides evidence that someone
untrained in SCADA and process control can bypass security mechanisms and control
SCADA equipment without bespoke expertise.
The motive was to create mayhem, and there appeared to be no financial incentive. Since
injuries were caused to passengers during the derailments, the teenager was subsequently
sentenced to imprisonment.
Donahue Announcement
During the same week in January 2008, a CIA agent named Tom Donahue announced to
the SANS SCADA Security Conference in New Orleans that electricity utilities outside
the USA had been remotely compromised for extortion. While this information came with
no actionable data for the industry such as cost of incident, or method of compromise, it
was a very important announcement. It came before Stuxnet2, and served to inform the
industry that SCADA had attracted criminal attention. Apparently, Donahue had spent
a long time persuading others to make this information public, so utilities would take the
risk seriously. The precise quotation follows:
“We have information, from multiple regions outside the United States,
of cyber intrusions into utilities, followed by extortion demands. We suspect,
but cannot confirm, that some of these attackers had the benefit of inside
knowledge. We have information that cyberattacks have been used to disrupt
power equipment in several regions outside the United States. In at least one
case, the disruption caused a power outage affecting multiple cities. We do not
know who executed these attacks or why, but all involved intrusions through
the Internet.” -Tom Donahue [7]
We still do not know with certainty which cities were affected, although some people have
made efforts to correlate open source electrical outage information with the statement.
So far as this author knows, that has been inconclusive in determining the affected cities.
2Covered briefly in the next section.

CHAPTER 1. INTRODUCTION 15
Stuxnet
In July of 2010 the control system community started to discuss Stuxnet. This is the
name given to a worm that propagated itself randomly, but only included payloads fit-
ting for specific industrial system deployments. A full technical analysis was written by
Falliere, O’Murchu, Chien [9], but a great deal of work detailing the industrial controller
compromise was done by Langner [11]. The target of this malware appears to be a ura-
nium enrichment facility in Iran, but there were other payload codes and the target of
those remains unknown. The authors appear to be well-funded nation state actors, and a
few nations are under suspicion but conclusive evidence has not yet appeared. Plenty of
circumstantial indicators are present, but no formal allegations or proceedings have been
made.
The original element in this incident is Stuxnet’s combination of undirected propaga-
tion methods with targeted payloads designed to affect only specific processes in specific
facilities. It spread using traditional security vulnerabilities (4 of them) in commercial
operating systems, and then wormed its way through two ICS applications (with hard-
coded passwords) to inhibit the functioning of Variable Frequency Drives (VFD) made
by specific vendors. It used a trick to remain hidden from SCADA engineers, displaying
the last program sent to the VFDs even when running its own malicious code. This is the
malware equivalent of playing back CCTV footage of a bank vault from the night before,
while robbers raid the vault.
Thus Stuxnet marks the entry of malicious state actors into the widely accepted threat
model. Previously, many people in business who suggested infrastructure software might
be targeted by nation states were not taken seriously. Post-Stuxnet the consensus was
almost unanimous that nation states were targeting each other’s infrastructure.
Since we have not found the authors of Stuxnet, this analysis of authorship and motive
may be flawed. At a minimum they are highly funded professionals who can remain
operationally anonymous and function without clear financial motives. This marks a
substantial shift of the folk threat model of control system security, and warrants global
re-evaluation of the security measures defending industrial networks.
1.2.2 NERC CIP
Armed with knowledge of past events, we can see that there may be an argument for
government regulation and potentially market failure. This seems to be the position of
the US government which has tasked a number of different agencies with providing part
of an overall solution. We will focus on those relevant to our research, namely Industrial
Control System Computer Emergency Response Team (ICS-CERT) and North American
Electric Reliability Corporation Critical Infrastructure Protection (NERC-CIP).

CHAPTER 1. INTRODUCTION 16
“ICS-CERT recommends that users minimize network exposure for all con-
trol system devices. Control system devices should not directly face the In-
ternet.” [18]
In July 2009 the NERC CIP regulations took effect with 1800+ asset owners expected to
be ‘compliant’ by that date and ‘auditably compliant’ a year later. While we have many
methodologies for auditing organisations, a preferred approach would be to audit the
networks themselves for ‘critical cyber assets’ with respect to NERC-CIP-5. This can be
done by the regulated and regulator alike, reducing ambiguity in standards interpretation.
The traditional IT approach would be to use a tool such as Nmap, ScanLine, or simply
netcat connections to enumerate nodes on a network and then evaluate their function
as assets. However, in a SCADA environment this is strongly resisted by control system
engineers for operational safety, high demands for availability, and historical reasons. The
historical reason is repeated as a mantra in almost every control room when a network
scan is suggested.
“While a ping sweep was being performed on an active SCADA network
that controlled 9-foot robotic arms, it was noticed that one arm became active
and swung around 180 degrees. The controller for the arm was in standby
mode before the ping sweep was initiated. In a separate incident, a ping sweep
was being performed on an ICS network to identify all hosts that were attached
to the network, for inventory purposes, and it caused a system controlling the
creation of integrated circuits in the fabrication plant to hang. This test
resulted in the destruction of $50,000 worth of wafers.” [19]
It is difficult to defend a network that you cannot map properly. So while it is rational
for control system engineers to defend their network from this type of scan, they are
potentially shooting the messenger. A malicious actor will not obey such restrictions,
and a device that cannot maintain functionality in the presence of a scan should be
decommissioned as soon as possible. We fully realise the implications of this statement and
that decommissioning may take years. The protestations of the control system engineers
should be directed towards the purchase and test of such systems in the first place (Caveat
emptor!), or the lack of funding to replace insecure devices or fix their network stacks.

Chapter 2
Methodology
In this chapter we discuss our rules of engagement, and why they are necessary. We also
explain in more detail how this data has been collected and synthesised from multiple
sources. It is necessary to understand the role of devices and systems in the industrial
system architecture, to understand the relevance of the project. Here we describe the types
of devices and the purpose they serve in such systems. Finally, we detail the information
we have gathered, how we collected it, how we use it to derive other information, and the
obstacles to such tasks. We also present some broad quantitative results such as numbers
of devices and systems found with each query. More quantitative results are presented in
Chapter 3.
Currently it is believed that industrial control and process control systems are not, and
should not be, connected to the internet. These are large distributed systems and the
knowledge of all their devices and configuration is often tribal. Such knowledge is spread
throughout organisations with changing employees, and that knowledge can leave the
business when certain employees leave, sometimes with expensive consequences such as
in the case of Terry Childs [20], who turned out to be the sole holder of authentication
tokens for a San Francisco communications network.
This is then a primary candidate for an asset management approach, where we continually
scan and track devices connecting to a network, and also scan from outside to maintain our
compliance. This keeps the configuration information and device inventory in collective
hands, and derivable from the network itself. The barrier here then is that one should
not scan a live network for devices directly since a ping sweep can have such disastrous
consequences. How then, are industrial computer security professionals, system engineers,
auditors, and regulators to progress?
Ideally, we would employ passive network traffic analysis techniques to map and identify
all communications as they pass. Unfortunately, this is not possible with an academic
study unless a corporate or state sponsor steps forward to provide an example network
17

CHAPTER 2. METHODOLOGY 18
for analysis1. Thus, we must gather evidence of the connectedness of these systems from
open sources.
2.1 Technology stack
In this project we have used Python 2.7 along with a number of libraries. The most
important library is from Shodan (described in Section 2.4), and provides an API for
querying their data. We have also used an MIT project called TimeMap which takes
formatted data and displays it in a timeline alongside a Googlemap with markers. To
view the data in this manner, a version of TimeMap must be configured and the HTML
page created placed in the appropriate directory.
Thus the technical output of this project is twofold:
1. A visualisation HTML map-timeline that can be viewed to tell a story of ICS con-
nectivity and vulnerability.
2. Python pickle files containing connection dates, IP addresses, HTTP responses,
Hostnames, approximate Latitiude and Longitude, and remote exploits that may
be applicable.
2.2 Rules of Engagement
Any security testing conducted on behalf of an industrial customer must obey rigorous
rules of engagement. In the absence of a customer in this case, we must set our own,
and to do so we examined the Centre for the Protection of National Infrastructure and
Department of Homeland Security (CPNI & DHS) good practice guideline [17]. Since a
ping sweep of an ICS network can prove so costly, we set ourselves the following ‘rules of
engagement’ for the purpose of this study:
1. We will not interact with a device except to view any HyperText Transfer Protocol
(HTTP) interface available. Viewing a device webpage is something any search
engine does in an automated manner. If it is dangerous for us to do so, then every
search engine webcrawler is a weapon.
2. We will not attempt a login to any device. When asked for a password we cancel
any interaction with a web page.
3. We will not actively scan the Internet ourselves, but instead will source existing
information.
1Or the network traffic itself.

CHAPTER 2. METHODOLOGY 19
4. Combining other sources of information such as exploit databases and Google’s
Geoquery we derive further information.
To comply with our own rule 3, in order to discover devices we don’t scan any systems
directly; instead, we query Shodan [12], a specialised search engine that scans the Internet
for HTTP, FTP, SSH and Telnet connectivity.
2.3 Device and System classification
During the course of this study we have identified systems and devices in Shodan’s data
primarily through domain expertise. This requires knowledge of the products, both soft-
ware and hardware running in industrial control systems. In practice this can be done
by anyone spending time reading product manuals, but previous experience from these
industries expedites such efforts. However, we specifically reject the use of such knowledge
to obfuscate issues from the reader, therefore an attempt to build a loose taxonomy has
been made. This should explain the general purpose of each ‘type’ of system or device
to the reader. This taxonomy is not an official one, but rather an informal aggregation
of the results into broad categories. Since these products are necessarily as diverse as the
industries they serve, all of our results do not neatly fit into the boxes below. However, the
lists below serve sufficiently to open the debate on the general connectedness of Industrial
Control Systems.
2.3.1 Devices
1. RTU – Remote Terminal Unit or sometimes Remote Telemetry Unit. This is a
microprocessor used to transmit telemetry back from the field and to control de-
vices in the field. They are often widely geographically dispersed, and use diverse
wireless communications accordingly. They can run simple safety logic programs
for redundancy and to reduce control delays.
2. PLC – Programmable Logic Controller. These are similar to RTUs, but are more
often deployed without their own power supply and using wired communications.
They are more often found on a plant floor or factory, where controllers are close to
the centre of control.
3. PAC – Programmable Automation Controller. These provide very similar functions
to PLCs, but are programmed differently, and use an open, modular, architecture.
They typically differ in how they do things from PLCs, but still serve the same
purpose of acquiring data and performing process control.
CHAPTER 2. METHODOLOGY 20
4. IED – Intelligent Electronic Device. Once again this performs similar functions to a
PLC, but is primarily deployed in the electrical sector, for example in substations.
Since these devices sometimes have to function in the presence of high voltages, they
can be constructed with substantial protections for hostile environments. However,
from an outsider’s perspective they still gather data, provide protective logic, and
execute simple controls as does a PLC or RTU.
5. Meter – A meter is a device capable of providing telemetry readings, and is func-
tionally the same as your electrical meter. However, in process control they serve
a different purpose such as monitoring the energy going through each substation,
or water purified per day to measure business efficiency. Some meters are process
critical, in that they monitor the levels of a chemical into a water supply, or amount
of water into a reactor cooling tower. Others are much smaller and cheaper, and
only serve to show the electricity you consume in a home.
6. Protocol Bridge – These are points where one protocol is translated to another.
Mainly in our study they are points where TCP/IP traffic is converted to some (often
proprietary) control protocol such as Modbus, LonWorks, BACNet, etc. These
other protocols are often industry specific and there are too many serving different
purposes to list them all here. We are interested in these bridges because they
are specifically places where an automation or control network connects to an IP
network. Thus it is a great place to look for the internet connectivity of an industrial
system.
7. Embedded Web Server – These are micro webservers designed for embedded systems.
They are commonly found in industrial system devices, but also in many other
embedded system devices. Disambiguating those designed for industrial systems
from others is sometimes necessary.
2.3.2 Systems
1. HMI – Human Machine Interface sometimes called the (Man Machine Interface)
MMI or (Human Computer Interface) HCI. These are nodes at which control en-
gineers monitor their plants, factories, pipelines, and field devices. Often found in
control rooms, but sometimes dispersed across the plant floor. These are often run-
ning a well known operating system and any internet reachability is of particular
concern as these nodes are in control of field or plant devices. Anecdotally, changing
a display on an HMI can cause an operator to perform a detrimental safety critical
action under false pretences, in a similar manner to Phishing attacks on banking
customers today.

CHAPTER 2. METHODOLOGY 21
2. SCADA Server – Supervisory Control and Data Acquisition Server. This system
typically interacts with multiple HMIs and control engineers. They are often repli-
cated for redundancy and availability reasons.
3. Historian – These computers store values for various processes or states of interest
to the industrial system. Sometimes they are regulatory records, and provide data
reporting functionality designed to translate raw engineering values into CEO level
reports. They are often the point of connection between the corporate network and
the control network.
4. Telemetry – This is the sensor data, process data, and other engineering values of
interest to control engineers. It may also refer to the server to used collect such
data and there is some crossover in these systems with an Historian.
5. EMS – Energy Management System. Essentially a SCADA server tailored for the
energy industry. In some cases this will refer to a large electrical network, and in
other products this refers to the energy used within a building. Philosophically they
are similar, but the criticality of the former is likely to be national and the criticality
of the latter much reduced to that of a few businesses.
6. DMS – Distribution Management System. A SCADA server tailored for the energy
distribution companies.
7. Home Area/Automation Network – This is a small energy management system for
the home, but also refers to the appliances in the home which will communicate
with it to determine the best time of day to function while saving energy or money.
The smart meter may be part of this system directly or indirectly.
8. Building Management System – This is a system designed to control doors, elevators,
access control, CCTV cameras and display their footage. They often contain some
energy management elements and sometimes HVAC as well. Compromising one of
these can lead to physical site compromise or CCTV footage of personnel and their
daily tasks.
9. HVAC – Heating Venting Air Conditioning. These systems tend to be regarded as
‘lightweight’ by control systems security personnel. They are mini control systems,
but focus on an individual building or site. They can be equally critical though as
they may be found in a hospital or data centre, both of which have some stringent
restrictions on temperature for various reasons. Thus, considering them of lesser
criticality is a false comfort.

CHAPTER 2. METHODOLOGY 22
Shodan Query Connections Category Note
A850+Telemetry+Gateway 3 Telemetry
ABB+Webmodule 3 Embedded Webserver
Allen-Bradley 23 PAC
/BroadWeb/ 148 HMI Known Vulnerabilities
Cimetrics+Eplus+Web+Server 6 Embedded Web Server
CIMPLICITY 90 HMI Zero Config Web View
CitectSCADA 3 PCS
EIG+Embedded+Web+Server 104 Embedded Web Server
eiPortal 1 Historian
EnergyICT 585 RTU Primarily Energy
HMS+AnyBus-S+WebServer 40 Embedded Web Server
i.LON 1342 BMS Primarily for energy
ioLogik 36 PLC Small Vendor
Modbus+Bridge 12 Protocol Bridge IP to Modbus
ModbusGW 11 Protocol Bridge
Modicon+M340+CPU 3 Protocol Bridge
Niagara+Web+Server 2794 HAN/BMS Web server for EMS/BMS
NovaTech+HTTPD 1 Embedded Web Server Substation Automation
Powerlink 257 BMS/HAN
Reliance+4+Control+Server 10 SCADA
RTS+Scada 15 SCADA Runs on FreeBSD
RTU560 2 RTU Web Interface
Simatic+HMI 9 HMI Affected by Stuxnet
SIMATIC+NET 13 HMI Affected by Stuxnet
Simatic+S7 13 PLC Affected by Stuxnet
SoftPLC 80 PAC Eastern Europe
TAC/Xenta 1880 BMS Self Certs for HTTPS
WAGO 2 Telemetry
webSCADA-Modbus 3 HAN
Total 7489
Table 2.1: Number of connections per query
2.4 Banners and Shodan
In Table 2.1 we list the numbers of types of devices and systems discovered by Shodan
using our queries, which collectively represent a Proto-Smart Grid Ecosystem. This is a
diverse list, and we have attempted to classify the different devices into broad categories.
We have assembled a list of 29 queries of interest, and further discussion with other
concerned members of the community can certainly elicit more. The challenge primarily
comes from translating product names into what is likely to be present within a banner.

CHAPTER 2. METHODOLOGY 23
A banner is the metadata associated with a TCP connection to a specific port. Tradition-
ally this was used by network engineers to tag ports with information (such as applications
redirected to another port), but recently these banners often reflect the default setup of
a system. They contain a great deal of information such as time zones, character sets,
dates of connection, server information, protocol, and sometimes OS information.
2.4.1 Banners
An example banner:
HTTP/1.0 200 OK
Date: Sat, 23 Apr 2011 21:1:34 GMT
Content-Type: text/html
EnergyICT RTU 130-D93392-0840
Expires: Sat, 23 Apr 2011 21:1:34 GMT
An average banner returned by Shodan provides a server information field such as:
Apache/1.3.31 (Unix)
PHP/4.3.9 mod_ssl/2.8.20 OpenSSL/0.9.7e
So the device under investigation is running an Apache Server version 1.3.31 on Unix with
with dynamic webpages and using SSL.
2.5 Adding exploit information and geolocation
Having found a number of different systems that are or at least were at a certain time
connected to the global internet, we turn towards other sources of information. Specifi-
cally, Google’s geocoding service, and two sources of vulnerability information: Metasploit
and ExploitDB. This allows us to get an idea of where these systems are, and if known
vulnerabilities exist for the technology stack those devices or systems advertise through
their banners.
2.5.1 Exploit searches
Decomposing the banner information in a hierarchical manner, it is possible to search for
known exploits in exploit databases. We can:
1. Search exploit databases with the same query given to Shodan (which rarely returns
anything) and cache the result for the rest of the session.

CHAPTER 2. METHODOLOGY 24
2. Search exploit databases with pre-processed/decomposed information in the server
and OS tags returned in the banner and cache results for the rest of the session.
3. Search exploit databases with any other information we can derive from the ban-
ner. For example, anomalies in timestamp formats might reveal the the underlying
operating system.
In this dissertation we pursue only the first two options to derive interesting results.
Both databases can be searched using keywords to find vulnerabilities and download
exploits for them. The challenge here lies in the disarray of data, and its formatting
within the different databases.
Exploits are not all the same, and achieve different ends. For example, one exploit may
require local physical access to a device while another is executable remotely. The first
may copy the hashed password list to disk, while the latter may run arbitrary code.
Consequently both the type of access required and the result are different. It may be
possible to combine multiple local vulnerabilities to produce remote access. For the rest of
this paper we are concerned primarily with vulnerabilities that can be exploited remotely.
Fortunately, one of the databases (ExploitDB) allows us to filter for remote vulnerabilities
in its interface.
An exploit may also be limited to a specific deployment or configuration. Some of that
information about context for exploitation may be available in the description, but the
device may not provide all information required to confirm exploitability.
Additionally, while the contextual information required for exploitation is in a human
readable form, it is not always well organised or tagged with different taxonomies such
as local/remote or integration specifics such as ‘only works on application version X.Y
running on operating system version A.B’. To complicate matters further, both databases
use different formats.
Thus determining vulnerability to known exploits is only a semi-automatable process
at present. It is possible to say with confidence that known vulnerabilities exist for a
given system, but not with certainty that a given device in its current configuration
is exploitable. The best way to determine that is to try the exploit on a live device,
something that is clearly beyond ethical behaviour outside of a controlled environment.
Equally, the absence of known exploits does not confirm ‘security’, but merely assures us
we have done all we could to protect such a device.
Within the exposure map, we use the colour red to show that known remote exploits exist.
It is not possible to confirm exploitability, only suggest it is potentially exploitable with
known techniques. For example, even if the device is remotely exploitable, the system
may be running an Intrusion Detection Service. In many cases, there are other exploits
available, but it is preferable to tailor the visualisation to remotely exploitable devices.

CHAPTER 2. METHODOLOGY 25
Of course, it is simple to extend and customize the visualisation to reflect other types of
vulnerabilities, with a minimum of code.
Initially in vulnerability searching we simply use the same product name or query given
to Shodan to find the device. In initial tests this returned no vulnerabilities, when we
knew that some existed for a particular result. This is often because the query is a blunt
tool to find products of a particular type. The results returned by Shodan queries are
a richer source of information though, often providing the name and version number of
the operating system and applications. These are more targeted pieces of software with a
longer list of exploits available, and make much better sources for accurate vulnerability
assessments.
To run ExploitDB queries utilising these richer sources of information we need to de-
compose the banners more carefully. This is tractable and automatable, but only with
effort placed into disambiguating and decomposing each result differently. Currently this
involves pre-processing the banners of different queries to some degree by hand. This
begins with query dependent processing, and rapidly fans out to variations found in the
subsets of data types present in different Shodan queries. There are conflicts between
these differing data structures in banners that must be overcome to fully automate the
process into a scalable unsupervised approach.
For example, consider two server strings:
Firstly one with multiple applications and operating system information.
Apache/1.3.31 (Unix)
PHP/4.3.9 mod_ssl/2.8.20 OpenSSL/0.9.7e
And secondly, one with only the webserver information exposed.
ioLogik Web Server/1.0
The top banner is of a type we encounter frequently. A long string separated by spaces,
with each application helpfully providing its version number to aid our exploit searches. So
the simple approach would seem to be to tokenising the string by splitting it at the spaces
to produce the search terms: ‘Apache/1.3.31’, ‘(Unix)’, ‘PHP/4.3.9’, ‘mod ssl/2.8.20’,
‘OpenSSL/0.9.7e’. Of course when doing this we need to use some regular expressions
to clean up these search terms as well so they become the more useful ‘Apache 1.3.31’,
‘Unix’, ‘PHP 4.3.9’, ‘mod ssl 2.8.20’, ‘OpenSSL 0.9.7e’.
However, as can be seen the bottom banner is not conducive to this technique, as we
would be searching for exploits using ‘ioLogik’,‘Web’,‘Server 1.0’. Incidentally, ‘ioLogik’
happens to be the original product name and search term, so it has already been searched.
‘Web’ and ‘Server 1.0’ are ambiguous search terms returning all vulnerabilities related to

CHAPTER 2. METHODOLOGY 26
web products and unlikely to be relevant to this data point. Of course, we can hard code
all counter-examples, but this requires a case by case examination of the whole dataset,
or a ‘supervised’ approach. The core of this issue is that sometimes a space can be used
to tokenise the server banner, but in other cases, it will be part of the token itself2.
Now that we have seen that banner decomposition cannot employ the same technique
across all queries, and some decomposition techniques are in direct conflict, it is clear that
a case statement is needed for each query, or at the very least each ‘family of decomposition
techniques’. Unfortunately again, there are variations within a given query family.
There are other issues too such as caching complications, that result from particular query
and result sub-structures.
Cache conflict resolution example:
EnergyICT RTU 130-D93392-0840
This banner presents a time-consuming problem in the exploit queries, as the server
has a unique identifier at the end of the server string. So for this particular Shodan
query, we must remove the unique identifier as part of its specific query specific banner
decomposition technique. This is because we cache our exploit queries on a session by
session basis. Since it is not necessary to search for ‘Apache 1.3.31’ more than once per
session, we would like to minimise our network overheads. Thus when we have queried for
remote exploits and found them we store them for later on in the session. We only keep
this cache for a single session since new exploits may appear or have updated information
in a given viewing of the HTML page. We clear this cache at the end of the run of code so
that if there are new exploits the next time we run it, we add them to the visualisation3.
So the banner above initially proved troublesome when combined with caching since, we
were caching over 600 ‘unique’ exploit queries for the same device type. The unique hex-
numeric string on the end, ensured that each exploit query was unique, but useless. Thus
we need to strip the device identifier before performing exploit queries, or we repeatedly
query for something that returns no exploits. This is a good example of how each ini-
tial Shodan query, and then differences in products and version and deployments dictate
our banner decomposition techniques. This also serves to explain why the automation
approach is not scalable in the long run, since many queries have data dependant de-
composition techniques. We present some other ideas in the conclusion where we discuss
future work.
Of course, finding exploits does not mean definitively that these devices are exploitable,
as many of these vulnerabilities will be local or the device may be protected by an IDS,
2This conflict of tokenisable and non-tokenisable whitespace sometimes occurs within the same banner
string.3This is in contrast to our geolocation caching where a city’s latitude and longitude does not change.

CHAPTER 2. METHODOLOGY 27
but it does allow us to build a vulnerability visualisation tool which provides a partial
view of the global ground truth. We also have filtered exploits to include only those that
are remote. We have coloured any node with remote exploits red. We could easily alter
this visualisation to colour non-remote exploits yellow, thus increasing the information
available on screen, and tailoring the visualisation to the user’s interest. By simply re-
colouring on demand, and re-rendering the page, we can answer questions such as ‘What
if all Cimplicity servers had a 0-day tomorrow, how exposed are they?’ This can be
enormously useful to roundtable discussion of cyber security at scale.
Having discussed how to visualise exposure to future 0-day exploits as well, we note from
personal experience that web technologies offer many such approaches. The example cited
below is typical of such an approach.
“Another area that is gaining popularity in the ICS domain is Web and
database applications. These applications are commonly used to allow corpo-
rate users to view data from the ICS. The assessment team may find additional
attack vectors by examining these applications for problems such as Structured
Query Language (SQL) injection or Cross-Site Scripting (XSS) problems. At-
tackers can use these problems to make a network transition from the corporate
LAN to a DMZ server or even to an ICS server.” [17]
The advantage of a tool such as the one prototyped here, you have the opportunity to
discover how widespread the exposure to such an exploit is rapidly, whether that exploit
is real or proposed. This is useful to defenders looking to rapidly evaluate what their
product exposure is. Figure 2.1 should give some idea of how this is assisted through
visualisation techniques.
2.5.2 Geolocation
As we can see in Table 2.2 most of these banners collected from Shodan have been tagged
with an ISO-3166 country code. We use this in conjunction with Google’s geocode service
to provide the average latitude and longitude of that country. Only 26 data points are
missing this information, and for those data points we place them at Lat 0.0 and Lon
0.0 which is off the coast of Africa. We do this so we may still inspect them in the
visualisation, but know that they are not correctly placed on the Google map.
This gives all of our data points an initial location on the global map, but this is only a
first approximation. Since there are so few countries in the ISO list, we have constructed
a pickled (Python Serialised) dictionary to save the effort of multiple repetitive queries.
We then note that approximately 75% of the data comes with a localised city name. We
use Google geocoding to again query for the city name and country code, and cache the

CHAPTER 2. METHODOLOGY 28
Figure 2.1: Example exposure time-map with red marking systems with known exploits
Figure 2.2: Node information within visualisation

CHAPTER 2. METHODOLOGY 29
Figure 2.3: Vulnerable node information within visualisation
result for later use. We pickle these results so that we do not exceed Google’s daily request
limit of 5000 queries, but also because there are often repetitions. For example we found
over 200 results in The Hague, and there is no need to repeat these location queries.
At the end of a run of our code the city cache is pickled (saved to disc), for future use
when we run another week of queries. This cache data will not alter between runs and
each city geocoding query should only be run once. This is in contrast to our exploit
queries, which are cached on a session-only basis.

CHAPTER 2. METHODOLOGY 30
Country Count Country Count
Albania 1 Kuwait 1
Argentina 2 Latvia 1
Armenia 1 Lithuania 12
Australia 81 Luxembourg 9
Austria 17 Macedonia 1
Belgium 39 Malaysia 6
Bermuda 1 Malta 1
Brazil 27 Mexico 7
Bulgaria 10 Namibia 1
Canada 365 Netherlands 370
Chile 2 Netherlands Antilles 2
China 29 New Zealand 3
Croatia 2 Norway 271
Cyprus 23 Panama 4
Czech Republic 90 Philippines 8
Denmark 194 Poland 191
Estonia 20 Portugal 93
Faroe Islands 1 Puerto Rico 4
Finland 301 Romania 13
France 53 Russian Federation 37
Germany 92 Serbia 3
Greece 10 Singapore 5
Guernsey 1 Slovakia 16
Hong Kong 3 Slovenia 50
Hungary 14 South Africa 9
Iceland 2 Spain 86
India 14 Sweden 442
Indonesia 2 Switzerland 34
Iran, Islamic Republic of 1 Taiwan 66
Ireland 76 Thailand 7
Israel 10 Trinidad and Tobago 1
Italy 57 Turkey 7
Japan 59 Ukraine 12
Jersey 1 United Kingdom 122
Kazakstan 1 United States 3920
Korea, Republic of 41 Vietnam 1
No Country Information Available 31 Total 7489
Table 2.2: Connections logged per country

Chapter 3
Exploring the Dataset
In this chapter, we establish some ground rules of examining the data we have filtered out
of Shodan’s dataset. Some basic quantification of results is performed, and uses for such
analysis. We cannot currently produce a complete industrial system exposure data set,
and here discuss why. We also begin asking questions of what the data set can reasonably
tell us, and note some false positives that muddy the waters.
3.1 Global inferences should not be made
There are many reasons why this data should not be used to make global inferences
about the state of industrial control system security. Firstly, it is derived ultimately
from product names, and product names primarily known to one person. As an English
speaker, it is necessarily biased towards products from the English speaking world. In
addition to being a subset of global products devoted to industrial control systems, it
is also a subset restricted to those systems that run on the four ports investigated by
Shodan. Finally, that subset is further subdivided in time. All the systems found are not
still exposed, but we know that they once were. Thus we admit we have a very limited
view of global exposure, but believe it is a functional approach to one day providing a full
view.
The key point to remember while exploring the data, is that we have a numerator of
exposed systems as counter-examples of an air-gap, with an unknown denominator of the
total number of deployed systems. This exposed list of systems and devices is only part
of the story. If we discover in the future that these counter-examples represent 1% of
the total deployments of systems worldwide, then that will be a very positive story for
the industry. This author speculates that is not the case, but admits freely that it is
speculation.
31
CHAPTER 3. EXPLORING THE DATASET 32
3.2 Internal inferences provide some insight into the
industry
While we have cautioned against using this data set to make statistical inferences about
the global state of ICS, there is a lot to be learned from inferences within the data. Some
example highlights in this section are the low percentage of Authorisation Required HTTP
responses, the types of common software and operating systems present in ICS software,
and an anecdotal comment on IP white-listing.
What is the most popular OS
In Table 3.1 we have a provided a list of the OS tags found in the banners returned and
the number of times they are encountered. There are some tags that suggest the presence
of firewalls, which leads us to believe that they are present in our data by misconfiguration
of firewall rule sets, rather than being outside the firewall perimeter.
Some popular applications/webservers in the ICS space
We have counted the instances where server tags are present in the banner, and categorised
them by the banner information. This gives us an overview of both operating systems and
applications such as web-servers in use in these industries. Many are clearly recognisable
without any specialised SCADA knowledge. For example, note the profile of Microsoft
IIS use in Table 3.2. While it represents a small portion of the data set overall, we see
that those using it are mostly still on version 5.1 and 6, implying the use of Windows XP
as an underlying operating system. This should encourage the re-evaluation of another
common myth of SCADA security; that only an expert from the industry could find their
way around in these systems.
3.3 HTTP Response Codes
Presented here is an analysis of HTTP response codes (see Figure 3.1) which provides
insight into how those devices with an HTTP interface behave when a random connection
is made. Particularly of concern is the low number of 401 responses (where authorisation
is required). It also gives an insight that other sequential IP address may be related to
this industry. There may be authentication required a few clicks later while interacting
with the device, but this means our infrastructure protections are reduced to password
security. There really is no need for everyone on the internet to view a particular building
management or SCADA server login. White-listing based on IP Address seems a low

CHAPTER 3. EXPLORING THE DATASET 33
Operating System Tag Count
Adtran NetVanta 15
Cisco, Nortel, SonicWall, Tasman Aironet, BayStack Switch, Soho, 1200 2
Enterasys Vertical Horizon Switch 1
F5 BigIP LB 4.1.x 3
F5 BigIP LB 4.1.x (sometimes FreeBSD) 21
Foundry, SonicWall BigIron, TZ 202
FreeBSD 4.4 2
HPUX 10.20 3
Linux older 2.4 1
Linux recent 2.4 23
Linux recent 2.4 (2) 1
NetApp Data OnTap 6.x 3
NetBSD 1.6 7
NetCache 5.3.1 14
NetScreen Firewall 1
Nortel Contivity 256
OS/390 1
Printer controller (?) 20
Symbol Spectrum Access Point 32
Tru64 5.0 3
Windows 2000 166
Windows 2003 14
Windows NT 4.0 SP1+ 2
Table 3.1: Operating System tag count
cost and simple approach to reducing ICS exposures, and is also a solution that can be
implemented in the device itself or at the perimeter using firewall rule sets.
In fact, we encountered one device during the course of this study where the IP whitelisting
page was viewable unauthenticated (see Figure 3.2). This is disconcerting for two reasons:
1. Firstly, if it had been filled in properly we would not have been able to see this
device at all.
2. Secondly, we could have filled in the IP list ourselves unauthenticated, thus lock-
ing control engineers out of their own web configuration screen by limiting it to
a single IP address such as 192.0.2.0 (Which is a bogon IP Address reserved for
documentation and examples in a similar manner to www.example.com).
The ability to lock out field engineers from a device because they did not white-list their

CHAPTER 3. EXPLORING THE DATASET 34
Figure 3.1: Breakdown of HTTP response types
Figure 3.2: Screenshot of unauthenticated whitelisting
own IP addresses earlier is a disturbing discovery. We can only hope this individual device
was not safety critical, and merely a demonstration system.
In another case, we found the default user name and password provided in online help
files. The screenshot can be found in Figure 3.3, showing the help file available from the
website itself.

CHAPTER 3. EXPLORING THE DATASET 35
Figure 3.3: Default user names and passwords available in help files
Proportion of connected and remotely exploitable nodes
This dissertation is primarily concerned with the scale of industrial system exposure, so
while the anecdotal cases above are interesting, they do not assist understanding the
scale of the problem. The data shows roughly 7500 nodes exposed online, 17% with
authentication, and most without. Primarily this protection is a password, and there are
plenty of known techniques for compromising those. If simple attacks such as password
cracking are eliminated from discussion, then 20.5% of the nodes analysed from SHODAN
have published remote exploits for a technology listed in their application or operating
system dependency stack (as derived from a banner).
Top ten Autonomous Systems
In Table 3.3 the top ten Autonomous Systems are shown and ranked by the number
of devices or systems we found within their allocations. The top ten also conveniently
delineate ASes that contain greater than 100 each. In some cases the AS will have some
responsibility for this state of affairs, but in others they will not. The point of this table
is to show that if one of these ISPs suffer a loss of connectivity, then that has an effect
on the remote management of these systems accordingly.
3.4 Disambiguation and false positives
In general false positives (presence of a node in the dataset when it should not be) can
occur when the string we are searching for in SHODAN is replicated in another banner,

CHAPTER 3. EXPLORING THE DATASET 36
that does not belong to a product of interest. One example case of reverse DNS entries,
is reflected in the reverse DNS section below. We have attempted to make the queries
used with SHODAN as unique as possible to disambiguate other products, and vetted our
results as verification that the queries are unique enough to disambiguate the results.
3.4.1 Geolocation
The accuracy of the data acquired during the geolocation process is the most likely to
contain errors. Firstly, since only 75% of our data has a city name present, we know that
25% is incorrectly placed at the average latitude and longitude of the country, instead of
the city it actually resides in. Secondly, when we do have a city with unicode characters
in its name, we see that the query can fail to return results. Additionally, it may return
incorrect results, and we have found and fixed some within our data. 189 entries in the
city cache needed correction in this manner, and were verified by hand.
3.4.2 Exploits
The exploits listed for each node in the dataset are conservative lists. For example we
have only included remote exploits, eliminating those that are local. The reality in the
case of exploit databases is that false negatives are more likely. Since there aren’t rules
to how exploits are written up in databases, it is possible (though unlikely) that some do
not name the product they affect. For example, with a type in the product name. In this
case, we are not in a position to discover the vulnerability.
3.4.3 Powerlink product name ambiguity
Powerlink is the name of both a building management and home security product (Vi-
sionic), but also the name of a ethernet suite for open automation. In this dissertation
we were concerned with the building and home security product, rather than the ethernet
suite, but initially were concerned about overlap in the search term. After examining the
data returned it would appear that we have correctly gathered only the former product
(sometimes used in substation CCTV), and that the latter is not present in the data. Of
course, that does not mean that future conflicts will not arise.
Once example banner data is seen from ethernet Powerlink, the dismabiguation will prob-
ably be easy to perform.
3.4.4 Reverse DNS .arpa addresses
Addresses such as the one below are reverse dns lookups. The host webpages that reflect
the locations of other servers, and usually have a copy of the banner of such a server.

CHAPTER 3. EXPLORING THE DATASET 37
Thus they can represent false positives within our dataset. However, this is easy to filter
out of the final results, as the hostnames field contains an entry such as the one below.
cpe-108.121.125.200.in-addr.arpa
In our data set we only have 7 such addresses, and have been careful not to let them
influence other calculations.

CHAPTER 3. EXPLORING THE DATASET 38
Server Tag Count
MicrosoftOfficeWeb5.0 Pub 3
ABB RTU560 1
Apache 6
Apache-Coyote/1.1 3
Apache/1.3.31 (Unix) PHP/4.3.9 mod ssl/2.8.20 OpenSSL/0.9.7e 192
Apache/2.0.52 (CentOS) 1
Apache/2.0.63 (FreeBSD) mod python/3.3.1 Python/2.5.1 5
Apache/2.0.63 (FreeBSD) mod python/3.3.1 Python/2.5.2 8
Apache/2.2.11 (Unix) mod ssl/2.2.11 OpenSSL/0.9.8e-fips-rhel5 mod auth passthrough/2.1
mod bwlimited/1.4 FrontPage/5.0.2.2635 mod perl/2.0.4 Perl/v5.8.8 4
Apache/2.2.3 (CentOS) 1
Boa/0.93.15 14
CIMPLICITY-HttpSvr/1.0 84
Cimetrics Eplus Web Server v.1.2 6
EIG Embedded Web Server 102
EnergyICT 562
HMS AnyBus-S WebServer 40
Indy/9.00.10 10
Microsoft-IIS/5.0 4
Microsoft-IIS/5.1 100
Microsoft-IIS/6.0 39
Microsoft-IIS/7.0 10
Microsoft-IIS/7.5 4
Niagara Web Server/1.1 1211
Niagara Web Server/3.0 1
NovaTech HTTPD 1.5.0 1
TAC/Xenta511 1.10 99
TAC/Xenta511 1.20 431
TAC/Xenta527 1.10 14
TAC/Xenta527 1.20 116
TAC/Xenta527-NPR 1.10 6
TAC/Xenta527-NPR 1.20 69
TAC/Xenta555 1.20 77
TAC/Xenta711 1.20 147
TAC/Xenta721 1.20 1
TAC/Xenta731 1.20 63
TAC/Xenta911 1.10 152
TAC/Xenta911 1.20 534
TAC/Xenta913 1.20 21
WindRiver-WebServer/4.4 63
WindWeb/1.0 1
WindWeb/1.0.2 11
WindWeb/1.0.3 1217
ioLogik Web Server/1.0 36
Table 3.2: Server tag count

CHAPTER 3. EXPLORING THE DATASET 39
AS
BG
PP
refix
CC
Reg
istr
yA
lloca
ted
AS
Nam
eC
ount
2239
469
.98.
160.
0/19
US
arin
2003
-11-
19C
EL
LC
O-
Cel
lco
Par
tner
ship
DB
AV
eriz
onW
irel
ess
405
7132
69.1
04.0
.0/1
3U
Sar
in20
03-1
1-21
SB
IS-A
S-
AT
&T
Inte
rnet
Ser
vic
es36
0
1134
89.2
00.0
.0/1
7N
Lri
pen
cc20
06-0
3-30
KP
NM
-NL
KP
NM
obile
Net
wor
kO
per
ator
220
8786
46.6
6.0.
0/15
NO
rip
encc
2010
-06-
23T
EL
EN
OR
-MO
BIL
Tel
enor
Nor
geA
S19
5
3292
62.2
36.0
.0/1
5F
Iri
pen
cc19
98-0
4-01
TD
CT
DC
Dat
aN
etw
orks
188
7018
64.1
08.0
.0/1
5U
Sar
in20
00-0
6-13
AT
T-I
NT
ER
NE
T4
-A
T&
TSer
vic
es,
Inc.
156
1926
264
.222
.0.0
/18
US
arin
2000
-03-
01V
ZG
NI-
TR
AN
SIT
-V
eriz
onO
nline
LL
C13
8
209
65.1
00.0
.0/1
4U
Sar
in20
01-0
1-03
ASN
-QW
EST
-Q
wes
tC
omm
unic
atio
ns
Com
pan
y,L
LC
129
3301
78.6
4.0.
0/12
SE
rip
encc
2007
-03-
09T
EL
IAN
ET
-SW
ED
EN
Tel
iaN
etSw
eden
121
6389
168.
8.48
.0/2
2U
Sar
in19
93-0
7-16
BE
LL
SO
UT
H-N
ET
-BL
K-
Bel
lSou
th.n
etIn
c.10
0
Tab
le3.
3:T
he
ten
Auto
nom
ous
Syst
ems
wit
hth
em
ost
exp
osure
.

Chapter 4
Industry Feedback Sessions
In this chapter responses to interactive demonstrations were given to people from various
functions in industry. This is to demonstrate the value of such visualisation and datasets
within those industries. An effort has been made to provide a diversity of roles and
companies to provide a realistic critical review. This is also important to validate the
approach of using Shodan and not interacting with field devices directly. The Rules of
engagement cited in Section 2.2 present a limitation many other security researchers would
find arbitrarily restrictive, but these interviews should serve to demonstrate the necessity
of such precautions in the ICS security domain.
In each of these cases, the visualisation tool was presented over a conference call. The
screen was shared, allowing the industry representatives to see the exposure surface visu-
alisation and ask questions. They could not interact with the visualisation directly, but
could request the researcher to go to a particular node and click on it to reveal further
information. As part of the discussion we tended to focus on a part of the world familiar
to the industry respondents, and sometimes they recognised particular infrastructure as
part of the demonstration. For example in Section 4.1 we discuss particular results from
Fornebu, Norway.
4.1 Judith Rossebo and Kai Hansen
Corporate Research and Department Manager - Automation Networks at ABB (respec-
tively)
“Possible uses of this exercise could be further extended by utilities to ac-
tually find out that none of their devices is accessible from outside – something
that NERC-CIP stipulates. There is a potential to build up a realistic picture
on how connected these devices are to the public network/the Internet.
40

CHAPTER 4. INDUSTRY FEEDBACK SESSIONS 41
To get a better basis for the statistical data you might try to obtain infor-
mation from ARC who reports on the overall numbers of deployment of the
different types of devices (e.g., number of Ethernet nodes, number of PLCs,
etc.)
The visualization was clear and the work was well explained. It was easy
to get an overview of the situation visualized. However, the data plotted is
not continuous, so that devices appear and disappear on the map over time.
As we understand, this depends on which queries were carried out, and when,
how often they were done. This could be resolved by filling in the ‘gaps’ where
data is missing on a particular device. For the time-line it is expected that
this type of equipment is always on, so an improvement could be to visualize
more clearly when devices appear and disappear since drawing the life-line for
when they are on takes a lot of space with little information.
Also, another point to consider is how much information does the IP ad-
dress actually provide? For example, when we looked at the data for Norway,
many devices appeared to be located at Fornebu, however, this is the geograph-
ical location of the mobile telecom operator headquarters (Telenor Fornebu),
so it is not clear whether the devices are actually physically located there, but
are rather accessible through the operators public network. So, several ques-
tions could arise: e.g., is the operator supposed to be providing a protected
connectivity (depends on the contract between the industrial company/utility
and the telecoms service provider), furthermore: it could be one of several
stakeholders responsible for the device being exposed. As you pointed out,
the tool provides some information, but not all.
Another example of a good use of the tool could be for Asset management
in a customer’s Intranet.
A way a visualization like this could be further developed could be in-
ternally in a large company on the intranet connecting several plants and/or
inside one plant to validate that there is the correct (planned) visibility of
devices on the different levels of the network.”
4.2 Joshua Pennell
Founder and President of IOActive
“The critical research Mr Leverett has conducted provides measurable clarity into a world
where assumptions are made that process control networks are rarely exposed to the public
internet is in fact patently false. The results of his research and others will continue to
challenge these false assumptions through a quantitative based approach and hopefully
empower asset owners to address the issues head on.”

CHAPTER 4. INDUSTRY FEEDBACK SESSIONS 42
4.3 Colin Cassidy
A lead software engineer from the industry speaking privately, rather than in an official
capacity on behalf of a company
“One of the key problems with Critical Infrastructure security is the dif-
ficulty in visualising not just the scale of the problem, but visualising that a
problem exists at all. From a historical background of control systems being
‘air-gapped’, this work shows that this is certainly no longer the case, and
just how much things have moved on from that state. Whilst managers and
the technical staff ‘understand’ this, but do not necessarily know the scale of
the problem and therefore the resources that are needed to bring a level of
confidence in the security of their systems.
Getting vendor and operators to buy into security requires strong manage-
ment commitment to make it happen. The ability to explain the situation to a
manner that a manager in terms they can understand can be tricky (especially
when you start mentioning ‘arcane terms’ such as attack surface, XSS, CSRF,
Threat modelling).
This work provides a very simple visualisation tool to explain to the stake-
holders the scale of the problem, in terms of volume of sites to secure, but
also how bad things are with the ability to tie known vulnerabilities to real
specific examples.
The other obvious use for this tool is to measure scope for attack scenarios,
e.g. being able to determine the scope of a possible attack if a 0-day vulner-
ability were to be identified in a given component, useful from an attackers
viewpoint, but also useful in Cyber warfare table top exercises/scenarios.
Where I think the real strength of this tool will be is tying this to other
databases. It can very easily become a useful patch auditing tool. If it were
possible to identify, for a given component, the security patches that are avail-
able, you could then find the internet facing components and verify their patch
level, and/or watch a patch roll-out occur. This could then be tied into the
asset management database keeping track of the assets, age, location and now
patch level.”
4.4 Sean McBride
Director of Analysis and founder at Critical Intelligence
“The research conducted by Eireann Leverett regarding the segregation of
industrial automation systems from the Internet demonstrates:

CHAPTER 4. INDUSTRY FEEDBACK SESSIONS 43
1. the trend of convergence between the Internet and automation systems;
2. the susceptibility of these Internet-connected systems to potential access,
misuse, and attack.
Segregating automation systems from the Internet is important because
compromise can lead directly to physical effects. This is not the case for
corporate information systems, which control (only) information rather than
real-life physical processes.
Industrial automation and control systems is historically a separate disci-
pline from computer science and information technology - meaning, unfortu-
nately, that these systems developed largely without security consideration.
As a result, control systems asset owners have not paid attention to the dy-
namic external threat environment.
This is particularly troublesome when one considers that in many in-
stances, industrial automation equipment controls the most critical (revenue-
generating) assets and process possessed by an organization. Educating and
convincing asset owners to appropriately fund, create and enforce security
policy, procedure, and capability for these systems is a major challenge in the
industry today.
Though the implications of the aforementioned trends have been empiri-
cally alleged for some time, Leverett’s research un-intrusively documents these
trends over time (with some limitations), and presents the findings visually,
allowing him to voice concern over unsegregated automation systems with
unprecedented clarity. Immediate applications of his research may include:
• National computer emergency readiness teams (CERTs) using the data
to contact affected and/or vulnerable asset owners to warn and suggest
mitigation
• National protection agencies using the data and visualization tool to
conduct table-top exercises in which they gauge and respond to certain
risks
• Auditors using the tool to check whether automation systems have been
or are currently directly connected to the Internet
In addition to these immediate uses, Leverett’s research can provide impe-
tus for further investigation into the depth of the segregation problem (such as
modems to control systems reachable from the public telephone system, and
control system equipment accessible on networks from commercial wireless car-
riers). Such future research may further illuminate the need for appropriate
segregation of industrial automation systems from publicly-reachable network
space.”

Chapter 5
Conclusion
In this chapter we discuss improvements, other directions to extend this work, and what
the major contributions have been. Finally, we summarise what this small data set can
tell us about the scale of ICS connectivity and deployment, and finally speculate briefly
on what the future of ICS security holds in store.
5.1 Potential uses and mitigations
5.1.1 Use as an audit tool
By plotting the deployment of these devices over time (see Figure 2.1) and synthesising
information from whois queries we can approximate who they belong to. This was done
during the project itself, but the information from whois queries can refer the ISP or the
company who owns the device. It is also possible to track either the growth of the company
selling devices or the one that owns them them by their deployment footprint. The
techniques differ for these two tasks, but there is certainly value in the ability to confidently
make statements such as ‘94 connections to Cimplicity servers1 have been logged by
Shodan since the 17th of July 2009 worldwide’. For example, ICS-Cert and NERC CIP
Auditors will find this information both useful and relevant if those connections continue
to be logged within their regional remit and those systems qualify as Critical Cyber Assets
under NERC CIP-5.
5.1.2 Recommended counter-measures
While we were working on this project, ICS-CERT released an alert [10] stating that
multiple independent security researchers had been locating potentially insecure SCADA
1Cimplicity is a product name for industrial control.
44
CHAPTER 5. CONCLUSION 45
systems via Shodan, and recommended a list of sensible countermeasures, from firewalls
and VPNs to strong passwords and removal of default accounts. We agree with those
recommendations, and in particular with the basic remediation of placing the devices
behind a properly configured firewall. Where an external connection is necessary, in
addition to the use of default authentication, we recommend IP address white-listing. It
is quite unlikely that these systems need to accept connections from absolutely any IP
address, and limiting to a small subset of relevant IP addresses would reduce the exposure
greatly. Perhaps these systems already have this capability and we are witnessing cases
of misconfiguration of the firewall or the device itself. In either case, some exposure of
industrial systems is evident regardless of the mode of failure. By logging and mapping
that exposure over time we aim to provide an open source dataset for future researchers.
Overly focussing on the vulnerability of the device is a red herring though, because we
know from ICS-Cert that many of these devices should not be facing the Internet at
all. Disclosing the existence of these devices is enough information in itself, without
resorting to exploitability of the device. Indeed some of them offer readings of meter
data or configuration data, without any authentication being presented to the viewer.
This information disclosure may be business critical or disclose personally identifiable
information both of which carry separate operational security concerns.
5.2 Extensions and improvements
5.2.1 Crowdsource more banners
The approach we have taken is dependent on banners we can search Shodan with. Ban-
ners are product dependent and sometimes version dependant, and without them we know
very little about ICS connectivity. When presented with an individual banner, we can
determine if it is unique enough, or on the right ports to be found by Shodan. Addition-
ally, industrial system components are bespoke and not commonly encountered, so new
examples are very helpful to academic researchers.
If we were to crowdsource banners through a webpage or email campaign, we might very
well find a great deal more industrial system components. In one case during our research
one new query resulted in approximately 3000 new data points. This isn’t just valuable in
reducing the exposure of these systems. It is also useful to identifying critical components
upstream in the supply chain, that can be given increased security review when we know
our industrial infrastructures rely on them.

CHAPTER 5. CONCLUSION 46
5.2.2 Track down a subset of companies
It is impractical to believe we can track down contacts for all 7500 data points. However,
some data points make this very easy, by disclosing addresses or employee names that
can assist such efforts. If we were to contact a small number of them, to inform them of
the exposure and/or understand why this is acceptable in their risk management policy,
we could keep track of the time and cost of these efforts, and learn more about the risk
management decisions.
This was always our intention with this project, but necessarily comes at the end so that
we do not skew our data set prematurely. Clearly though, we will need to work with a
great deal of other organisations to achieve this, and countries that provide a protection
agency to facilitate remediations help immensely.
5.2.3 Active geolocation attacks
Recently, work by Wang et al [21] has improved geolocation to an accuracy within 690
meters.
In the case of substations, or large physical devices, this is a relatively small area to
physically search. If we were to use physical searches or satellite images, we might be able
to infer the function the device serves in an engineering sense. For example, if we find a
PLC near to railroad tracks, we can raise our confidence that it belongs to the rail sector,
perhaps determining that it switches tracks.
The real-world location of these devices can greatly assist in assessing their criticality and
their functionality, an issue for both malicious actors and network defenders alike.
5.2.4 Scan more ports and use more machines
Shodan is only focussed on four ports and many SCADA protocols run on different ports.
Many more machines are thus obscured from our current implementation. In this project
we have chosen a passive approach gathering data from an already available source. How-
ever, with an active scanning approach that focuses on particular SCADA protocols we
may be able to get a more accurate view of the scale of the problem.
The opportunity to do so using cloud resources and parallel processing is present, and
only needs a funded project to support it. The particular appeal of this approach is that
reachability in the internet is directional. It may be possible to reach an address from one
IP address but not from another. A distributed strategy is the only methodology with
the power to distinguish reachability in that sense. It is also less likely to have the simple
mitigation of blocking requests from a single address or netblock, which is presumably
another simple mitigation against Shodan.
CHAPTER 5. CONCLUSION 47
5.2.5 Realtime stream processing
Shodan proposes a new tool called Firehose which will stream scanned results in real
time. Processing each banner as quickly as possible (decomposition for exploit searches,
geolocation, whois lookups) can create a stream of exposure information at a much finer
resolution. This could allow rapid processing of exposure information and thus rapid
reaction or detection tools. This means all derivable information from the banner needs
to be decomposed as fast and as scalably as possible. Depending on the number of
queries of interest, and level of decomposition or information gathering, this is a realistic
goal under current technologies. Larger scaling will be inhibited by the problems present
in continuous data stream query methods, but there is strong research in that field such
as by Babu and Wisdom [2].
5.2.6 Machine fingerprinting techniques
The field of OS and machine fingerprinting is quite mature, and could be applied to
strong effect in industrial systems security. There are both active and passive techniques
to determine operating systems based on TCP traffic, with differing success rates. These
same techniques can be applied again, but there are a great variety of embedded operating
systems and TCP implementations.
Another approach would be to attempt the same techniques to identify applications on
specific ports. Incorporating this type of analysis into the visualisation tool would allow
us to identify Operating Systems that were not explicitly identified in the banner. The
major problem with this work at the moment, is that we need example data to begin
such efforts. This data set should serve as an initial seed dataset in that respect; allowing
machine fingerprinting techniques to begin their analysis with at least some example data.
5.2.7 Banner classifier
Our main barrier to accuracy and scalability in exploit identification is the conflicts of
data types during banner decomposition. It is necessary to perform a hierarchical cat-
egorisation of banners based on initial query, OS and application version number. This
structure can alter radically from one product version to another.
To achieve data-independence and scalability, we need a generalised technique. We know
from previous discussion that a single generalised solution does not exist, but can we gener-
alise the decision making process of which technique to use? It is possible that a Bayesian
learning approach to classifying the banners and choosing an appropriate decomposition
technique accordingly, is worth investigating. Language processing techniques can also be
applied to the problem of spaces in application names, and thus allow us to tokenise the
banners in a more useful manner.
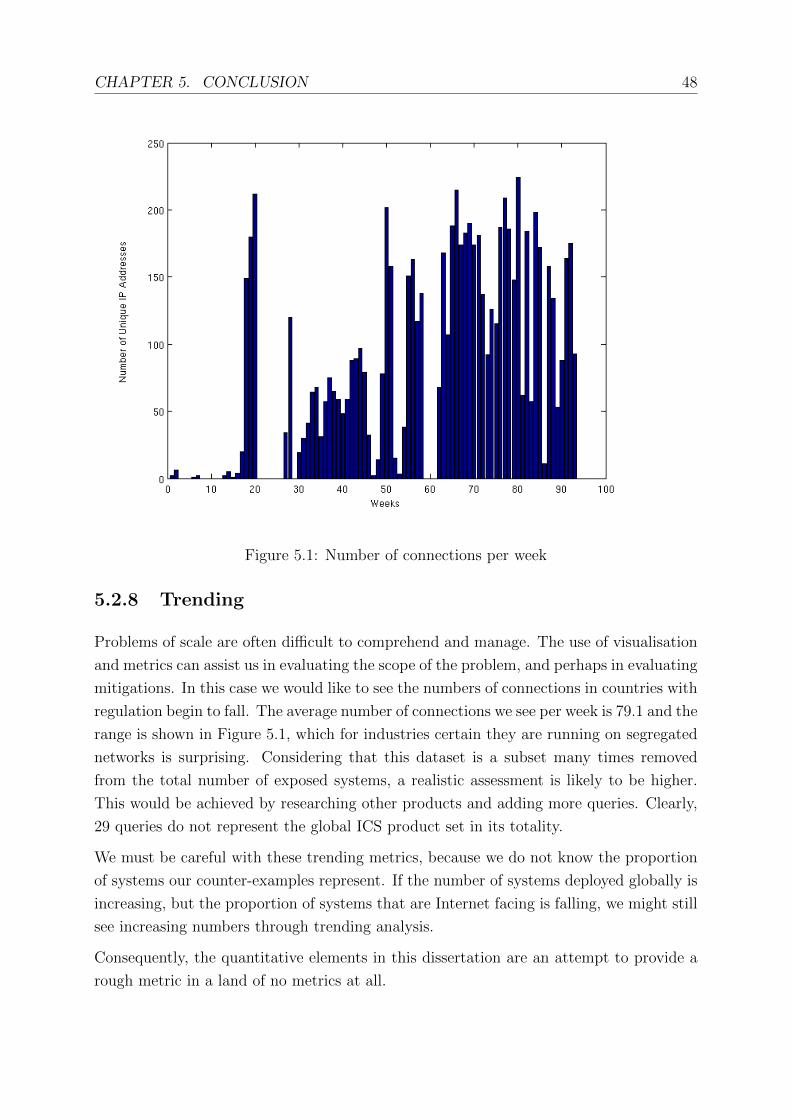
CHAPTER 5. CONCLUSION 48
Figure 5.1: Number of connections per week
5.2.8 Trending
Problems of scale are often difficult to comprehend and manage. The use of visualisation
and metrics can assist us in evaluating the scope of the problem, and perhaps in evaluating
mitigations. In this case we would like to see the numbers of connections in countries with
regulation begin to fall. The average number of connections we see per week is 79.1 and the
range is shown in Figure 5.1, which for industries certain they are running on segregated
networks is surprising. Considering that this dataset is a subset many times removed
from the total number of exposed systems, a realistic assessment is likely to be higher.
This would be achieved by researching other products and adding more queries. Clearly,
29 queries do not represent the global ICS product set in its totality.
We must be careful with these trending metrics, because we do not know the proportion
of systems our counter-examples represent. If the number of systems deployed globally is
increasing, but the proportion of systems that are Internet facing is falling, we might still
see increasing numbers through trending analysis.
Consequently, the quantitative elements in this dissertation are an attempt to provide a
rough metric in a land of no metrics at all.

CHAPTER 5. CONCLUSION 49
5.3 Criticality is dependent on context
When examining this data, a natural question is ‘how many of these data points are really
critical?’ This is an important but difficult question.
Clearly, not all of them are critical to national systems, and some of them may even be
demo systems with a legitimate reason to be Internet facing. However, some of these
systems may be critical to a nation or at the very least the business that operates them.
While it is difficult to quantitatively answer the question posed, we do not wish to avoid
it.
So in return we ask for refinement in the definition of criticality. Are we interested in
the global economy, or a nation state, or a business critical operation? We might very
well discover that a global economy means that a critical system to one nation resides
in another nation. For example, 80% of Ireland’s natural gas is supplied by the UK
wholesale market, and comes to Bord Gais Eireann from three sub sea pipelines across
the Irish sea. Thus the pressure pumps in Scotland and Wales could be considered critical
infrastructure to Ireland’s gas supply.
We also point out that criticality can have temporal variance. In the example above, if
Ireland has enough gas stored to ride-out shortages induced by temporary loss of those
sub sea pipelines, then their criticality is reduced for short duration outages.
To truly tackle this well-intentioned but poorly framed question, we must shift from a
quantitative approach to a qualitative one. Analysis must be done on the data presented
in the hope that it answers the question for a particular data point and in a particular
context. This involves investigating each individual point hoping that clues from whois
queries, hostnames, geolocation, logos on webservers, and other semi-reliable information
can allow us to derive at least the company name of the asset owner. Then it is down to
a querent to determine in conjunction with the owning organisation the criticality with
respect to a given context.
Criticality is a combination of dependency, process context, and risk. Additionally, there
is no convenient tag for criticality. Only the users of a system have a notional concept of
the utility of a system. Even then, they may not know that the system itself depends on
services such as DNS for its daily functionality. Thus while we do not wish to dodge the
question, we must admit we cannot with any confidence answer it for every single data
point in this data set.
Only further investigation can determine the answer for each data point on a case by case
basis, with respect to the context or interests of a particular organisation.

CHAPTER 5. CONCLUSION 50
5.4 Contributions
The contribution presented in this dissertation should now be clear, but are given below
as a summary:
1. Analysis of real world data that suggests industrial automation is not as segregated
from the Internet as claimed.
2. An open source and real world dataset of approximately 7500 data points, for others
to use2.
3. A methodology for academic research in a traditionally closed industry.
4. A visualisation that is fast and easy to customise from open source technologies and
open source data.
5. Code for gathering data from Shodan and rendering a webpage visualisation, usable
with TimeMap.
6. Queries for Shodan relevant to the industrial automation industry.
5.5 Conclusion
Evidence we present is a counter example to claims of ICS network segregation. We
accept it will have some false positives and have pointed out a few ourselves. However,
we stand by it as a strong evidence that the claims of air-gapped ICS networks need to be
re-examined. Perhaps it is time to re-evaluate the threat model as well, and continue to
research the real world level of ICS connectedness instead of accepting the mantra ‘they
are all air-gapped’.
The techniques presented here offer a very basic approach available to any malicious ac-
tor but equally to any researcher. The state of the art for malicious actors is no doubt
substantially beyond this capability. Hopefully ICS researchers will ‘steal the techniques’
of malicious actors in an effort to defend the networks. For example, by mapping and vi-
sualising network vulnerability, and creatively using the information in exploit databases.
ICS auditors can use a visualisation tool such as the one we have prototyped to take a
global or national view of product or system exposure. The ability to identify systems
of wide deployment, and begin re-mediations or thought experiments in proportion to
their deployment is an important step in reducing and managing the risk associated with
critical infrastructure exposure.
2While the data will be included in the submission, the author would like to the university to with-hold
it until relevant authorities have been informed of the IP addresses.

CHAPTER 5. CONCLUSION 51
Of academic interest is that we can see the operating systems and applications in use
in many industrial components. This allows us to target security investment into those
operating systems in proportion to their visible use, with the knowledge that they are
used in mission critical systems. This is also a seed data set for future ICS application
and device classification or ‘fingerprinting’.
Additionally, we note that Shodan represents a historical record during an important two
year period in this domain. The astute reader will notice that a few Siemens SIMATIC
products are logged during that time frame, a critical period in the investigations of
Stuxnet. Understanding the deployments of products during that period could assist in
the investigations. For example, it would also have been necessary to replicate Stuxnet’s
target/s somewhere, and while the network segregation will have been in place during
the construction of the worm, it may not have been in place when the test system was
commissioned.
It has been a few months since ICS-Cert warned the community about the existence of
Shodan in an ICS-CERT Alert [10], and we are still finding evidence of PLCs and RTUs
online. This is particularly critical when a device is so fragile it can be disabled with
maliciously or poorly formed packets. Industrial control field devices are engineered to
withstand hostile environments such as cold, heat, corrosion, humidity, aridity, vibration,
over and under-voltage, lightning protection, and other extreme environmental hazards.
It is time for device manufacturers to put the same rigorous engineering into protecting
them from the hostile environment of the global Internet as well.
IP address white-listing is one of the most important tools available to us in the current
threat environment. It can be used to protect systems currently in deployment and
can quickly be implemented through firewall rule-sets, application security features, and
intrusion detection systems. This is a mitigation that can be deployed today, to reduce
exposure immediately in deployments worldwide, which is why it is so important.
Databases of vulnerable critical national infrastructure will be traded in the future like the
data of stolen credit card numbers today. When such data is processed, some nodes will
still be visible and vulnerable, others will have already been compromised, and some will
no longer be exposed online. The freshness of the data will be a factor in the price of such
datasets, probably more so than the strict accuracy of the data it contains. The ability
to rapidly act in an automated manner on such data by either defenders or attackers will
define the next few years of critical infrastructure protection.
What will be the price of a target list of vulnerable infrastructure in the future? Consid-
ering the low-cost approach to this dissertation, the kind of results presented herein will
become very inexpensive indeed. However, the potential cost of disruptions to infrastruc-
ture is unlikely to reduce by any order of magnitude. This is simply because the cost of
repairing damage is grounded in the economics of the physical world, while the cost of
finding processes to disrupt is grounded in the economies of the digital world. This once
CHAPTER 5. CONCLUSION 52
again highlights the asymmetrical economic nature of cyber escalation and disruption.
The cost of finding and exploiting critical infrastructure will continue to fall. The marginal
cost of copying vulnerable infrastructure lists or exploits will tend towards zero. The
cost of producing a disruption for attackers will continue to reduce, while the cost of
disruption remediation will remain relatively constant. Therefore our best hope is if the
cost of defending and technical security innovation is as low as the cost of discovering or
disrupting vulnerable infrastructure.
Asymmetric digital warfare is an asymmetric economy, with falling costs for those bent
on disruption and fixed costs for the society disrupted.
The ICS industry has been protected from computer security issues primarily by its ob-
scurity, which is rapidly eroding. Absence of evidence in ICS security incidents has too
often been used as evidence of absence of a threat. However, such incidents do exist and
should be studied in the public domain. The technical efforts in this dissertation are a
lower bar which malicious actors will easily surpass during their reconnaissance phase.
While this research has refrained from running any scan because it might affect a process,
this is not a courtesy the malicious actor will extend.
Therefore it is to the advantage of the ICS community to put products on the desks of
digital security students and professional researchers alike. If ICS devices cannot be tested
in a live environment, then they must be security tested in an isolated environment. The
ideal time to do this is during Factory Acceptance Testing and Site Acceptance Testing,
when the system deployer still has the power and time for remediations. These are also the
rare moments in an ICS when they are not ‘live production environments’. Additionally,
if we want more capable security researchers at a lower cost for our future, then it is in
our best interests to approach academia today to train our ICS security professionals for
tomorrow.
Securing critical infrastructure is too important to society, to rely on the promise of
network isolation and security. If these systems are secured, then let that be proven
to society in the open, and not whispered and claimed in private conversation. It is
imperative to reverse a philosophical trend in this domain, namely; that a system or
device is secure until it is compromised. The inverse of this logic is what is required in
today’s threat environment: we must assume that these devices and systems are insecure
until it is proven that they have been secured against a given threat.

Bibliography
[1] Ross Anderson and Shailendra Fuloria. “Security Economics and Critical National
Infrastructure”. Economics of Information Security and Privacy, 2009.
[2] Shivnath Babu and Jennifer Wisdom. “Continuous Queries over Data Streams”.
2001.
[3] Graeme Baker. “Schoolboy hacks into city’s tram system”, Jan
2008. http://www.telegraph.co.uk/news/worldnews/1575293/
Schoolboy-hacks-into-citys-tram-system.html.
[4] Eric Byres, Matt Franz and Darrin Miller. “The Use of Attack Trees in Assessing
Vulnerabilities in SCADA Systems”. International Infrastructure Survivability, 2004.
[5] Eric Byres and Justin Lowe. “The Myths and Facts behind Cyber Security Risks for
Industrial Control Systems”. Proceedings of the VDE Kongress, 2004.
[6] Alvaro A. Cardenas, Tanya Roosta and Shankar Sastry. “Rethinking security prop-
erties, threat models, and the design space in sensor networks: A case study
in SCADA systems”. Ad Hoc Networks, 7(8):1434 – 1447, 2009. ISSN 1570-
8705. http://www.sciencedirect.com/science/article/B7576-4W6XW0G-1/2/
94067c0d7345cf2e23523a0ccb3c39ad. Privacy and Security in Wireless Sensor and
Ad Hoc Networks.
[7] Thomas Claburn. “CIA Admits Cyberattacks Blacked Out Cities”, Jan 2008. http:
//www.informationweek.com/news/205901631.
[8] NUCLEAR REGULATORY COMMISSION. “NRC INFORMATION NOTICE
2003-14: POTENTIAL VULNERABILITY OF PLANT COMPUTER NET-
WORK TO WORM INFECTION”. 2003. http://www.nrc.gov/reading-rm/
doc-collections/gen-comm/info-notices/2003/in200314.pdf.
[9] Nicolas Falliere, Liam O’Murchu and Eric Chien. “W32.Stuxnet Dossier”. Symantec
Corporate Publication, 2010.
53

BIBLIOGRAPHY 54
[10] ICS-CERT. “ICS-ALERT-10-301-01 CONTROL SYSTEM INTERNET ACCESSI-
BILITY October 28, 2010”, Oct 2010. www.us-cert.gov/control_systems/pdf/
ICS-Alert-10-301-01.pdf.
[11] Ralp Langner. “Stuxnet Timeline”, 2010. http://www.langner.com/en/2010/12/
09/our-stuxnet-timeline/.
[12] John C. Matherly. “SHODAN the computer search engine”, Jan 2009. http://www.
shodanhq.com/help.
[13] Miles McQueen, Wayne Boyer, Mark Flynn and George Beitel. “Time-to-
Compromise Model for Cyber Risk Reduction Estimation”. Quality of Protection,
2006.
[14] Miles McQueen, Wayne Boyer, Trevor McQueen and Sean McBride. “Empirical
Estimates of 0Day Vulnerabilities in Control Systems”. System Sciences, 2009.
[15] D. Moore, V. Paxson, S. Savage, C. Shannon, S. Staniford and N. Weaver. “Inside
the Slammer worm”. Security Privacy, IEEE, 1(4):33 – 39, july-aug 2003. ISSN
1540-7993.
[16] NERC. “NERC-CIP”, Feb 2010. http://www.nerc.com/page.php?cid=2|20.
[17] Department of Homeland Security and Centre for the Protection of National In-
frastructure. “Cyber Security Assessments of Industrial Control Systems Good
Practice Guide”. 2010. http://www.us-cert.gov/control_systems/pdf/Cyber_
Security_Assessments_of_Industrial_Control_Systems.pdf.
[18] Dale Peterson. “Boredom / Not Better Limiting Vuln Re-
sponse Bashing”, 2011. http://www.digitalbond.com/2011/04/01/
boredom-not-better-limiting-vuln-response-bashing/more-9715.
[19] Keith Stouffer, Joe Falco and Karen Ken. “Guide to Supervisory Control and Data
Acquisition (SCADA) and Industrial Control Systems Security”. NIST Special Pub-
lication 800-82, 2006.
[20] Paul Venezia. “Why San Francisco’s network admin went
rogue”, 2008. http://www.infoworld.com/d/adventures-in-it/
why-san-franciscos-network-admin-went-rogue-286?page=0,0.
[21] Yong Wang, Daniel Burgener, Aleksandar Kuzmanovic, Marcel Flores and Cheng
Huang. “Towards Street-Level Client-Independent IP Geolocation”. USENIX Tech-
nical Report 2010, 2010.
[22] Phil Windley. “Blowing up generators remotely”, Sep 2007. http://www.zdnet.
com/blog/btl/blowing-up-generators-remotely/6451.