quantitative trace analysis of a broad range of antiviral drugs in … · 2017-08-25 · original...
TRANSCRIPT
ORIGINAL PAPER
Quantitative trace analysis of a broad range of antiviraldrugs in poultry muscle using column-switch liquidchromatography coupled to tandem mass spectrometry
Bjorn J. A. Berendsen & Robin S. Wegh &
Martien L. Essers & Alida A. M. Stolker & Stefan Weigel
Received: 15 September 2011 /Revised: 14 November 2011 /Accepted: 15 November 2011 /Published online: 16 December 2011# The Author(s) 2011. This article is published with open access at Springerlink.com
Abstract A liquid chromatography–tandem mass spec-trometry method for the analysis of seven antiviral drugs,zanamivir, ribavirin, oseltamivir, oseltamivir carboxylate,amantadine, rimantadine and arbidol, in poultry muscle isreported. The antiviral drugs were extracted from thehomogenized poultry muscle sample using methanol.The extract was purified using tandem solid-phase extractioncombining a cation exchange cartridge and a phenyl-boronic acid cartridge. To prevent excessive matrixeffects, the analytes were separated from the matrixconstituents using a column-switch liquid chromatogra-phy system combining a reversed-phase and a Hyper-carb analytical column. Detection was carried out usingtandem mass spectrometry. The method was fully validatedaccording to 2002/657/EC [1] and proved to be adequate forquantification and confirmation of zanamivir and ribavirin at10 μg kg−1, oseltamivir, oseltamivir carboxylate, amantadineand rimantadine at levels below 1.0 μg kg−1 and for qualita-tive confirmatory analysis of arbidol at levels below1 μg kg−1.
Keywords Antiviral drugs .Mass spectrometry . Poultrymuscle . Residue analysis
Introduction
Influenza infections continue to pose a serious problem.Recent outbreaks of avian influenza (H5N1) have had ahuge economic effect in the poultry breeding sector [2, 3]but besides the economic effect, human health is at stakebecause avian influenza can also infect mammals includinghumans [4, 5]. The increasing incidence of resistance toantiviral drugs is a major concern to public health. Becausestrains tend to become more aggressive, adequate therapeu-tic strategies are needed [6].
Progress has been made by identifying several com-pounds that aid in the treatment of viral infections andbesides the treatment of humans, these are used by farmersto protect their flocks [7]. However, concerns arose aboutthe increasing incidence of resistance to antiviral drugs [7–12]. Several causes have been suggested including the inap-propriate use of antiviral drugs in the treatment of humansduring the outbreaks of avian influenza and severe acuterespiratory syndrome (SARS) [13, 14]. Furthermore, it hasbeen shown that oseltamivir carboxylate (Fig. 1) is notremoved or degraded in normal sewage water treatmentand thus enters the environment [15]. Waterfowl are thenin a position to ingest the active oseltamivir carboxylate.This could drive the selection of resistant avian influenza Astrains in the gut. Especially in countries (e.g. SoutheastAsia) where waterfowl and humans come in close contact,this could lead to the spread of other strains incorporatingthe resistance genes and change of host [16, 17]. Finally,amantadine, oseltamivir and arbidol (Fig. 1) are allegedlybeing administered to poultry and other livestock in China,Southeast Asia and Russia [7, 18, 19]. To prevent excessiveuse of antiviral drugs the Food and Drug Administration(FDA) prohibited the non-consistent use of two types ofantiviral drugs in chickens, turkeys and ducks: the
Electronic supplementary material The online version of this article(doi:10.1007/s00216-011-5581-3) contains supplementary material,which is available to authorized users.
B. J. A. Berendsen (*) : R. S. Wegh :M. L. Essers :A. A. M. Stolker : S. WeigelRIKILT–Institute of Food Safety,Wageningen University and Research Centre,Akkermaalsbos 2, 6708WB, P.O. Box 230, 6700AE Wageningen,The Netherlandse-mail: [email protected]
Anal Bioanal Chem (2012) 402:1611–1623DOI 10.1007/s00216-011-5581-3
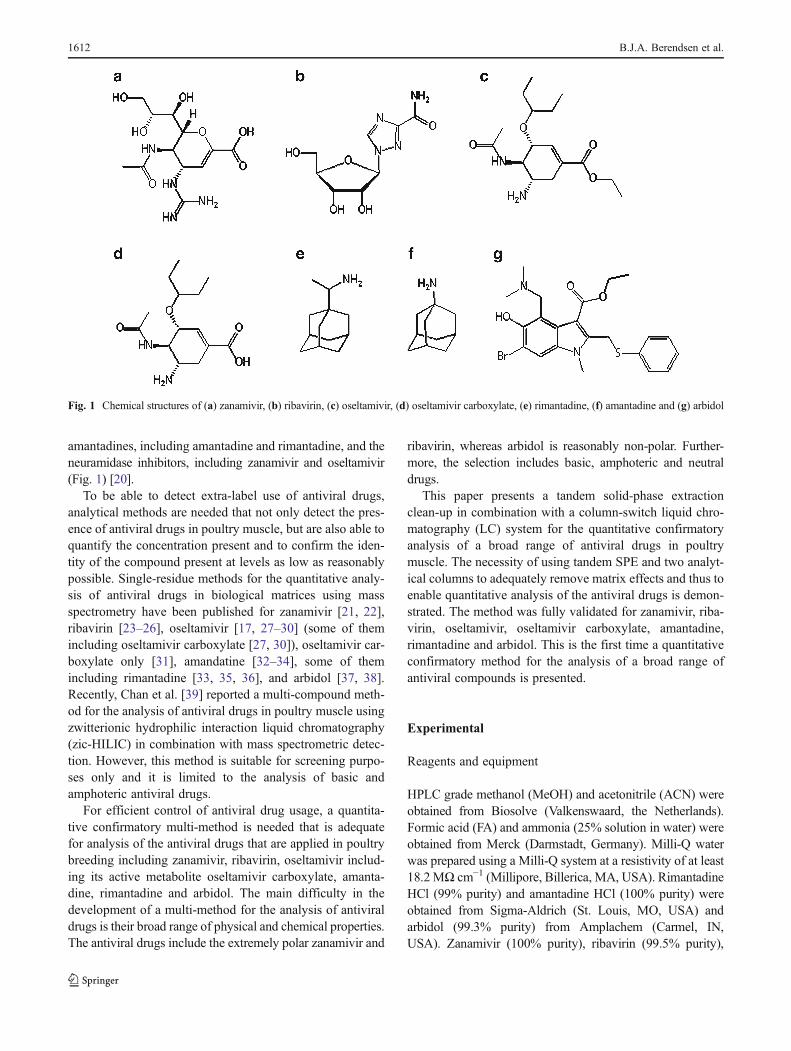
amantadines, including amantadine and rimantadine, and theneuramidase inhibitors, including zanamivir and oseltamivir(Fig. 1) [20].
To be able to detect extra-label use of antiviral drugs,analytical methods are needed that not only detect the pres-ence of antiviral drugs in poultry muscle, but are also able toquantify the concentration present and to confirm the iden-tity of the compound present at levels as low as reasonablypossible. Single-residue methods for the quantitative analy-sis of antiviral drugs in biological matrices using massspectrometry have been published for zanamivir [21, 22],ribavirin [23–26], oseltamivir [17, 27–30] (some of themincluding oseltamivir carboxylate [27, 30]), oseltamivir car-boxylate only [31], amandatine [32–34], some of themincluding rimantadine [33, 35, 36], and arbidol [37, 38].Recently, Chan et al. [39] reported a multi-compound meth-od for the analysis of antiviral drugs in poultry muscle usingzwitterionic hydrophilic interaction liquid chromatography(zic-HILIC) in combination with mass spectrometric detec-tion. However, this method is suitable for screening purpo-ses only and it is limited to the analysis of basic andamphoteric antiviral drugs.
For efficient control of antiviral drug usage, a quantita-tive confirmatory multi-method is needed that is adequatefor analysis of the antiviral drugs that are applied in poultrybreeding including zanamivir, ribavirin, oseltamivir includ-ing its active metabolite oseltamivir carboxylate, amanta-dine, rimantadine and arbidol. The main difficulty in thedevelopment of a multi-method for the analysis of antiviraldrugs is their broad range of physical and chemical properties.The antiviral drugs include the extremely polar zanamivir and
ribavirin, whereas arbidol is reasonably non-polar. Further-more, the selection includes basic, amphoteric and neutraldrugs.
This paper presents a tandem solid-phase extractionclean-up in combination with a column-switch liquid chro-matography (LC) system for the quantitative confirmatoryanalysis of a broad range of antiviral drugs in poultrymuscle. The necessity of using tandem SPE and two analyt-ical columns to adequately remove matrix effects and thus toenable quantitative analysis of the antiviral drugs is demon-strated. The method was fully validated for zanamivir, riba-virin, oseltamivir, oseltamivir carboxylate, amantadine,rimantadine and arbidol. This is the first time a quantitativeconfirmatory method for the analysis of a broad range ofantiviral compounds is presented.
Experimental
Reagents and equipment
HPLC grade methanol (MeOH) and acetonitrile (ACN) wereobtained from Biosolve (Valkenswaard, the Netherlands).Formic acid (FA) and ammonia (25% solution in water) wereobtained from Merck (Darmstadt, Germany). Milli-Q waterwas prepared using a Milli-Q system at a resistivity of at least18.2MΩ cm−1 (Millipore, Billerica, MA, USA). RimantadineHCl (99% purity) and amantadine HCl (100% purity) wereobtained from Sigma-Aldrich (St. Louis, MO, USA) andarbidol (99.3% purity) from Amplachem (Carmel, IN,USA). Zanamivir (100% purity), ribavirin (99.5% purity),
Fig. 1 Chemical structures of (a) zanamivir, (b) ribavirin, (c) oseltamivir, (d) oseltamivir carboxylate, (e) rimantadine, (f) amantadine and (g) arbidol
1612 B.J.A. Berendsen et al.
oseltamivir phosphate (98% purity) and oseltamivir car-boxylate (98% purity), and the internal standardszanamivir-13C15N2, ribavirin-
13C5, oseltamivir-d3 phosphate,oseltamivir-d3 carboxylate, rimantadine-d4 HCl andamantadine-d15 HCl were obtained from Toronto ResearchChemicals (North York, ON, Canada). Stock solutions ofoseltamivir, amantadine, rimantadine, their corresponding iso-topically labelled internal standards and arbidol were preparedat 100 mg L−1 in MeOH. Stock solutions of zanamivir, riba-virin, oseltamivir carboxylate and their isotopically labelledinternal standards were prepared at 100 mg L−1 in water. Alldilutions of the stock solutions were prepared fresh daily inMilli-Q water.
Sample preparation
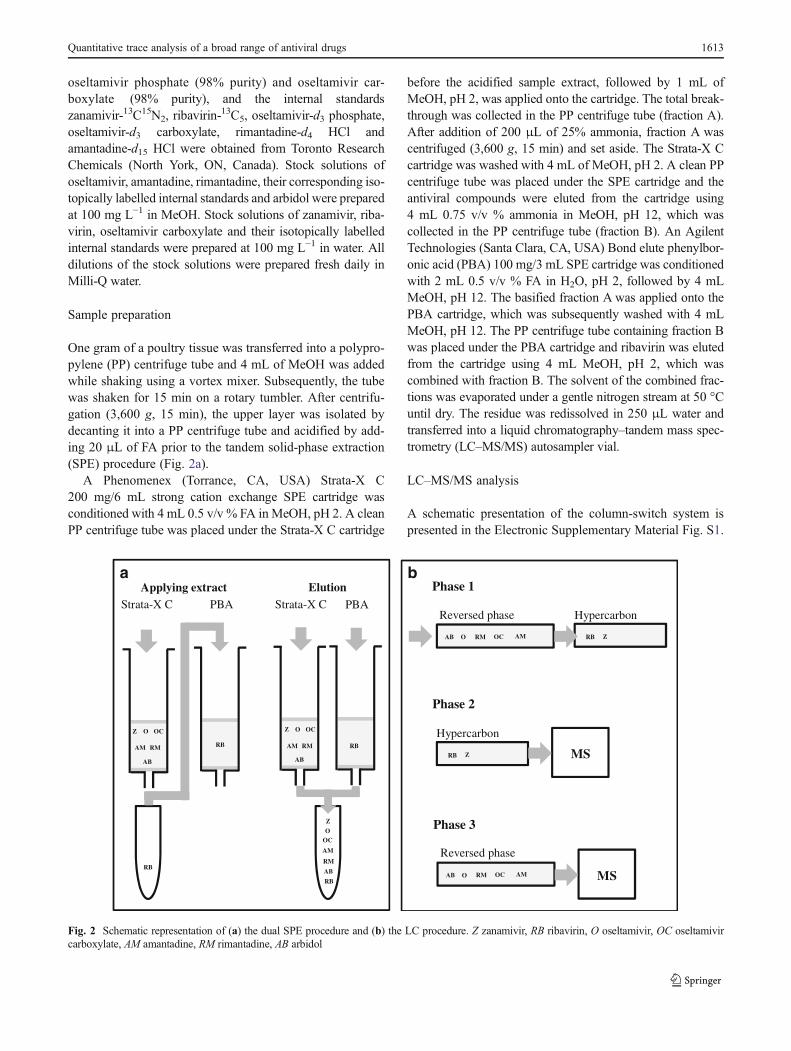
One gram of a poultry tissue was transferred into a polypro-pylene (PP) centrifuge tube and 4 mL of MeOH was addedwhile shaking using a vortex mixer. Subsequently, the tubewas shaken for 15 min on a rotary tumbler. After centrifu-gation (3,600 g, 15 min), the upper layer was isolated bydecanting it into a PP centrifuge tube and acidified by add-ing 20 μL of FA prior to the tandem solid-phase extraction(SPE) procedure (Fig. 2a).
A Phenomenex (Torrance, CA, USA) Strata-X C200 mg/6 mL strong cation exchange SPE cartridge wasconditioned with 4 mL 0.5 v/v % FA inMeOH, pH 2. A cleanPP centrifuge tube was placed under the Strata-X C cartridge
before the acidified sample extract, followed by 1 mL ofMeOH, pH 2, was applied onto the cartridge. The total break-through was collected in the PP centrifuge tube (fraction A).After addition of 200 μL of 25% ammonia, fraction A wascentrifuged (3,600 g, 15 min) and set aside. The Strata-X Ccartridge was washed with 4 mL of MeOH, pH 2. A clean PPcentrifuge tube was placed under the SPE cartridge and theantiviral compounds were eluted from the cartridge using4 mL 0.75 v/v % ammonia in MeOH, pH 12, which wascollected in the PP centrifuge tube (fraction B). An AgilentTechnologies (Santa Clara, CA, USA) Bond elute phenylbor-onic acid (PBA) 100 mg/3 mL SPE cartridge was conditionedwith 2 mL 0.5 v/v % FA in H2O, pH 2, followed by 4 mLMeOH, pH 12. The basified fraction A was applied onto thePBA cartridge, which was subsequently washed with 4 mLMeOH, pH 12. The PP centrifuge tube containing fraction Bwas placed under the PBA cartridge and ribavirin was elutedfrom the cartridge using 4 mL MeOH, pH 2, which wascombined with fraction B. The solvent of the combined frac-tions was evaporated under a gentle nitrogen stream at 50 °Cuntil dry. The residue was redissolved in 250 μL water andtransferred into a liquid chromatography–tandem mass spec-trometry (LC–MS/MS) autosampler vial.
LC–MS/MS analysis
A schematic presentation of the column-switch system ispresented in the Electronic Supplementary Material Fig. S1.
Z O OC
AM RM
AB
Strata-X C
RB
PBA
RB
Strata-X C
OC
AM
RM
AB
PBA
RB
Applying extract Elution Phase 1
Reversed phase Hypercarbon
Z RB
O
RB
Z
O AM OC AB RM
Phase 2
Hypercarbon
Z RB MS
Phase 3
Reversed phase
O AM OC AB RM MS
a b
Z O OC
AM RM
AB
Fig. 2 Schematic representation of (a) the dual SPE procedure and (b) the LC procedure. Z zanamivir, RB ribavirin, O oseltamivir, OC oseltamivircarboxylate, AM amantadine, RM rimantadine, AB arbidol
Quantitative trace analysis of a broad range of antiviral drugs 1613
‘LC 1’ consisted of an Acquity vacuum degasser, autosam-pler and binary solvent pump (Waters, Milford, MA, USA).‘LC 2’ consisted of a Separations (Hendrik-Ido-Ambacht,the Netherlands) vacuum degasser, mixing chamber and twotype K-1001 HPLC pumps. ‘V1’ and ‘V2’ are 6-way valves(Separations), which are operated by ‘LC 1’. ‘MS’ is a massspectrometer Quattro Premier XE (Waters, Milford, MA,USA). ‘Column1’ is a Waters Symmetry C18 (3.0×150 mm,5 μm) analytical column and ‘column 2’ is a Thermo FisherScientific (Waltham MA, USA) Hypercarb (3.0×100 mm,5 μm) analytical column.
From the initial time ‘LC 1’ runs a gradient (solvent A,50 mM FA in water; solvent B, 50 mM FA in ACN): 0–6.0 min, linear increase from 0% to 5% B; 6.0–14.0 min,linear increase to 100% B; 14.0–14.5 min, linear decrease to0% B; 14.5–20.0 min, equilibration at 0% B, operating at aflow of 0.4 mL min−1. ‘LC 2’ runs a gradient using the samesolvents: 0–6.0 min, 5% B; 6.0–10.0 min, linear increase to100% B; 10.0–11.0 min, 100% B; 11.0 – 12.0 min, lineardecrease to 0% B; 12.0–20.0 min, equillibration at 0% B,operating at a flow of 0.4 mL min−1. The injection volume(injected at ‘LC 1’) is 50 μL.
During phase 1, running from the initial time until 6 min,both columns are placed in series. At the start of phase 2(6.0 min) ‘V2’ is switched and the mobile phase of ‘LC 1’runs solely through the Symmetry C18 column and isdiverted to waste, whereas the mobile phase of ‘LC 2’ runsthrough the Hypercarb column and enters the MS. At the
start of phase 3 (10.0 min) ‘V1’ is switched and the mobilephase of ‘LC 1’ runs solely through the Symmetry C18
column and enters the MS, whereas the mobile phase run-ning through the Hypercarb column is diverted to waste.
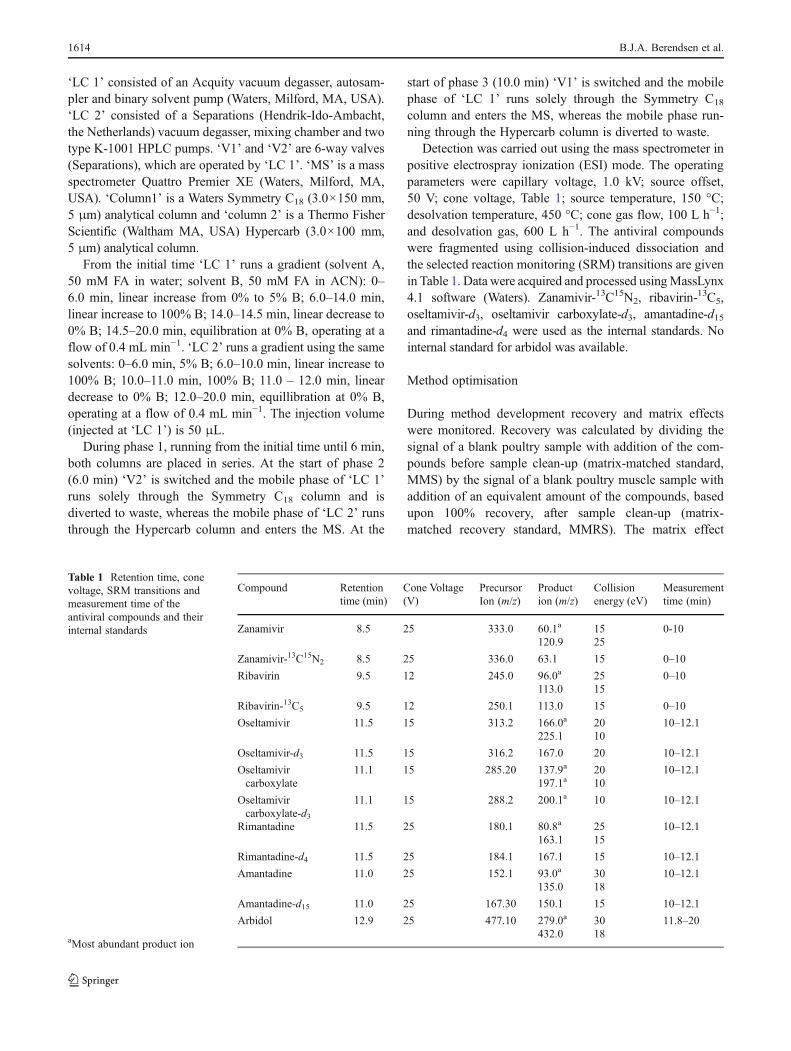
Detection was carried out using the mass spectrometer inpositive electrospray ionization (ESI) mode. The operatingparameters were capillary voltage, 1.0 kV; source offset,50 V; cone voltage, Table 1; source temperature, 150 °C;desolvation temperature, 450 °C; cone gas flow, 100 L h−1;and desolvation gas, 600 L h−1. The antiviral compoundswere fragmented using collision-induced dissociation andthe selected reaction monitoring (SRM) transitions are givenin Table 1. Data were acquired and processed usingMassLynx4.1 software (Waters). Zanamivir-13C15N2, ribavirin-13C5,oseltamivir-d3, oseltamivir carboxylate-d3, amantadine-d15and rimantadine-d4 were used as the internal standards. Nointernal standard for arbidol was available.
Method optimisation
During method development recovery and matrix effectswere monitored. Recovery was calculated by dividing thesignal of a blank poultry sample with addition of the com-pounds before sample clean-up (matrix-matched standard,MMS) by the signal of a blank poultry muscle sample withaddition of an equivalent amount of the compounds, basedupon 100% recovery, after sample clean-up (matrix-matched recovery standard, MMRS). The matrix effect
Table 1 Retention time, conevoltage, SRM transitions andmeasurement time of theantiviral compounds and theirinternal standards
aMost abundant product ion
Compound Retentiontime (min)
Cone Voltage(V)
PrecursorIon (m/z)
Production (m/z)
Collisionenergy (eV)
Measurementtime (min)
Zanamivir 8.5 25 333.0 60.1a 15 0-10120.9 25
Zanamivir-13C15N2 8.5 25 336.0 63.1 15 0–10
Ribavirin 9.5 12 245.0 96.0a 25 0–10113.0 15
Ribavirin-13C5 9.5 12 250.1 113.0 15 0–10
Oseltamivir 11.5 15 313.2 166.0a 20 10–12.1225.1 10
Oseltamivir-d3 11.5 15 316.2 167.0 20 10–12.1
Oseltamivircarboxylate
11.1 15 285.20 137.9a 20 10–12.1197.1a 10
Oseltamivircarboxylate-d3
11.1 15 288.2 200.1a 10 10–12.1
Rimantadine 11.5 25 180.1 80.8a 25 10–12.1163.1 15
Rimantadine-d4 11.5 25 184.1 167.1 15 10–12.1
Amantadine 11.0 25 152.1 93.0a 30 10–12.1135.0 18
Amantadine-d15 11.0 25 167.30 150.1 15 10–12.1
Arbidol 12.9 25 477.10 279.0a 30 11.8–20432.0 18
1614 B.J.A. Berendsen et al.
was calculated by dividing the signal of the MMRS by thesignal of a standard solution in water at equivalent concen-tration. No matrix effects are present if the result of thiscalculation is 100%. If the result is below 100%, suppressionoccurs and if the result is above 100%, signal enhancementoccurs.
As an alternative to the column-switch set-up, differentsingle analytical columns were tested. zic-HILIC (Sequant,Umeå, Sweden) was tested in combination with gradientelution using ammonium formate in water and ACN orMeOH as the mobile phase, at a pH ranging from 3 to 10.Reversed-phase (RP) C18 was tested in combination withgradient elution using water and ACN or MeOH as themobile phase, at a pH ranging from 3 to 11. Hypercarbwas tested in combination with gradient elution using waterand ACN, MeOH or tetrahydrofuran as the mobile phase.For each chromatographic condition, the matrix effects wereevaluated on the basis of spiked poultry muscle samplesusing only a methanolic extraction in combination withevaporation of the extraction solvent and redissolution in asuitable solvent. We aimed for a chromatographic systemthat results in sufficient retention for all compounds andadequate separation of the antiviral drugs from the matrixconstituents to minimize matrix effects.
SPE using strong cation exchange and PBA were testedfor sample clean-up. A 50 μg kg−1 spiked methanolic sampleextract was acidified and applied onto a Strata-X C cartridge.The breakthrough during application and washing were col-lected separately. These and the eluent were analysed usingthe LC–MS/MS system. The same procedure was followedfor the PBA cartridges, but then the spiked methanolic extractwas basified prior to application.
Method validation
A full validation was carried out according to 2002/657/EC[1]. The following parameters were determined: linearity,trueness, repeatability, within-laboratory reproducibility,decision limit (CCα), detection capability (CCβ), selectivityand robustness. The validation was carried out on threedifferent occasions, by two different technicians, using differentbatches of SPE cartridges and including 21 different poultrymuscle samples.
Linearity
On three different days a matrix-matched calibration linewas prepared including the following calibration levels: 0,2.5, 5, 10, 15 and 20 μg kg−1 (six data points including zero)by adding solutions of the antiviral drugs to blank poultrymuscle samples. Calibration lines were constructed by plot-ting the peak areas normalized by the peak areas of theinternal standards, versus the added concentration and
carrying out least-squares linear regression. The linearitywas considered acceptable if the coefficient of correlationwas at least 0.990.
Trueness, repeatability and within-lab reproducibility
On each of the 3 days seven different blank poultry musclesamples were selected and analysed as such and spiked at 5,10 and 15 μg kg−1. For each sample the level of the indi-vidual antiviral drugs was calculated using the calibrationline constructed on the same day. The trueness was calcu-lated for each level by dividing the overall average calcu-lated concentration by the nominal concentration.According to 2002/657/EC [1] the trueness at the selectedvalidation levels should be between 80 and 110%.
The repeatability and within-lab reproducibility werecalculated using single factor analysis of variance(ANOVA). According to 2002/657/EC [1] the relativewithin-laboratory reproducibility (RSDRL) and relativerepeatability (RSDr) are considered acceptable if theyare below the value calculated from the Horwitz equation[40] and two thirds of that value, respectively (i.e. below31.7% and 21.1%, respectively, at a validation level of10 μg kg−1). Thompson [41], however, demonstrated thatthe Horwitz equation is not applicable to the lowerconcentration range (<120 μg kg−1) and suggested acomplementary model. On the basis of this model theRSDRL and RSDr are acceptable if they are below 22%and 14.7%, respectively. The latter, more stringent crite-ria were adopted for this validation study. It is stated thatbecause different poultry muscle samples were usedwithin 1 day, the repeatability is not the pure repeatabil-ity as stated in 2002/657/EC [1]. However, using differ-ent poultry muscle samples within 1 day provides abetter understanding of the between-sample variationand the validation better reflects a routine analysissituation.
Decision limit and detection capability
Within the EU no regulations for the use of antiviraldrugs in food production are established. Within theUSA, the FDA prohibited extra-label use of antiviraldrugs [20]. Therefore, confirmation of the identity ofantiviral drugs should be carried out at levels as low asreasonably possible. Therefore, the decision limit (CCα)was calculated on the basis of zero tolerance in accor-dance with 2002/657/EC [1] to assign samples that con-tain antiviral drugs and thus deviate from the blankpopulation (α-error is 1%). CCα was calculated on thebasis of the bandwidth of the signal in blank samples(n021) in the time window in which the analyte isexpected. CCβ is the detection capability and expresses
Quantitative trace analysis of a broad range of antiviral drugs 1615
the concentration of the antiviral drugs in a poultry muscle atwhich the sample will be found non-compliant (β-error is5%). CCβ was determined on the basis of the bandwidth ofthe signal in blank samples (n021) and the bandwidth of thesignal in the samples spiked at 10 μg kg−1 (zanamivir andribavirin, n021) or 5 μg kg−1 (other antiviral drugs, n021) inthe time window in which the analyte is expected. The indi-vidual blank and spiked samples were analysed on threedifferent occasions and calculations were carried out as sug-gested by Antignac et al. [42], but without a normalisationbased on the signal of the internal standards.
Selectivity
The selectivity of the method was studied on the basisof a practical and a theoretical study. Firstly, the 21analysed blank samples were checked for interferencesat the retention times corresponding to the antiviraldrugs. Secondly, databases were searched for com-pounds having a molecular mass equal to the antiviraldrugs that could possibly be present in poultry musclesamples. Standard solutions of 100 μg L−1 of androsta-1,4-diene-3,17-dione (ADD), 5-hydroxyflunixin and tet-rahydrogestrinone (THG), indicated as possibly interfer-ing compounds, were analysed using the developedmethod. The resulting chromatograms were checked forinterferences at the retention times corresponding to theantiviral drugs.
Robustness
The robustness of the method became clear during theoptimisation of the sample preparation, chromatographicconditions and MS parameters. Additionally, some minorchanges to the method were tested in duplicate: (1) extrac-tion for 30 min instead of 15, (2) dry the PBA cartridges byapplying vacuum for 1 min after applying the extract andafter washing the cartridge and (3) evaporation of the sol-vent at 55 °C instead of 50 °C. The trueness and repeatabil-ity of the results were compared to the characteristics of theregular method.
Application to real samples
The suitability of the developed method was tested byapplying it to affected sample materials. Amantadine-affected poultry and turkey muscle were a kind gift fromthe Food and Environmental Research Agency (FERA),York, UK. The determined levels using the developedmethod were compared to the indicated amantadine con-centration in the samples, being approximately 4 μg kg−1
for the poultry muscle and 8–25 μg kg−1 for the turkeymuscle.
Results and discussion
Chromatography
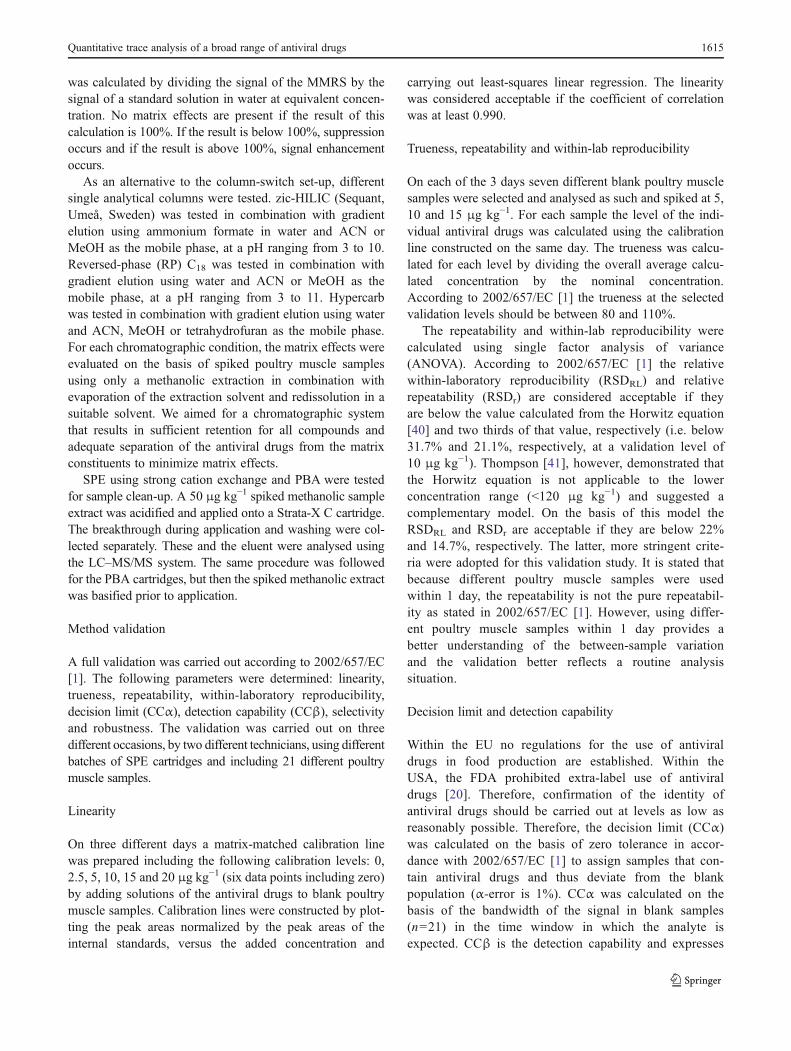
Stationary phases using three different interaction mecha-nisms were tested to obtain sufficient separation power andseparate the antiviral drugs from matrix constituents. There-fore, a retention factor of at least 2 should be obtained. Theuse of zic-HILIC was reported by Chan et al. [39] for thescreening analysis of some antiviral drugs. However, usingzic-HILIC no retention was obtained for arbidol, the mostnon-polar compound we studied and which was not includ-ed in the screening method reported by Chan et al. [39].Only slight improvement in the retention time (RT) wasmade by protonating arbidol (pKa 6) using a mobile phaseof pH≤4 and lowering the ammonium formate concentra-tion to 5 mM. Nevertheless, insufficient retention wasobtained for arbidol and severe matrix effects, even forlate-eluting polar compounds like zanamivir and ribavirin,were observed (Fig. 3).
Using RP chromatography applying C18 columns, zana-mivir eluted at the dead time of the system and only slightretention was obtained for ribavirin (retention factor of 0.4).Although the matrix effects significantly decreased for riba-virin, zanamivir was completely suppressed by matrix con-stituents (Fig. 3) and was therefore not detectable, even at aconcentration of 50 μg kg−1 in poultry muscle.
When using Hypercarb as the stationary phase, allantiviral drugs, including the most polar compoundszanamivir and ribavirin obtained retention (retention fac-tor of 3.0 and 4.6 respectively). The matrix suppressionfor zanamivir decreased from 100% using zic-HILIC or C18 to97% (Fig. 3) resulting in the detection of zanamivir inpoultry muscle at a concentration of 50 μg kg−1. Forribavirin, instead of signal suppression, signal enhancementwas observed (signal MMRS/signal standard 255%). Themain disadvantage of the use of a Hypercarb column is thatarbidol, the most non-polar compound studied, does notelute from the column. It contains a free phenyl group,which strongly interacts with the column material, prevent-ing its elution even when using tetrahydrofuran as themobile phase.
To be able to analyse the antiviral drugs within one run, acolumn-switch system combining a C18 column with aHypercarb column was developed. A schematic of the LCprocedure is given in Fig. 2b. Zanamivir and ribavirin arenot or hardly retained by the C18 column, elute from itwithin 5 min and are subsequently retained on the Hyper-carb column. After that, on the Hypercarb column, zanami-vir and ribavirin are separated from the matrix constituentsusing a gradient and are directly detected by MS. In themeantime the other antiviral compounds are retained on theC18 column. After elution of zanamivir and ribavirin from
1616 B.J.A. Berendsen et al.
the Hypercarb column, the other antiviral drugs are elutedfrom the C18 column by increasing the organic content ofthe mobile phase, passing by the Hypercarb column andentering the MS directly. The total run time, includingequilibration of both columns, is 20 min. As presented inFig. 3, the matrix effects using the column-switch LC sys-tem are tremendously improved for zanamivir.
Sample clean-up
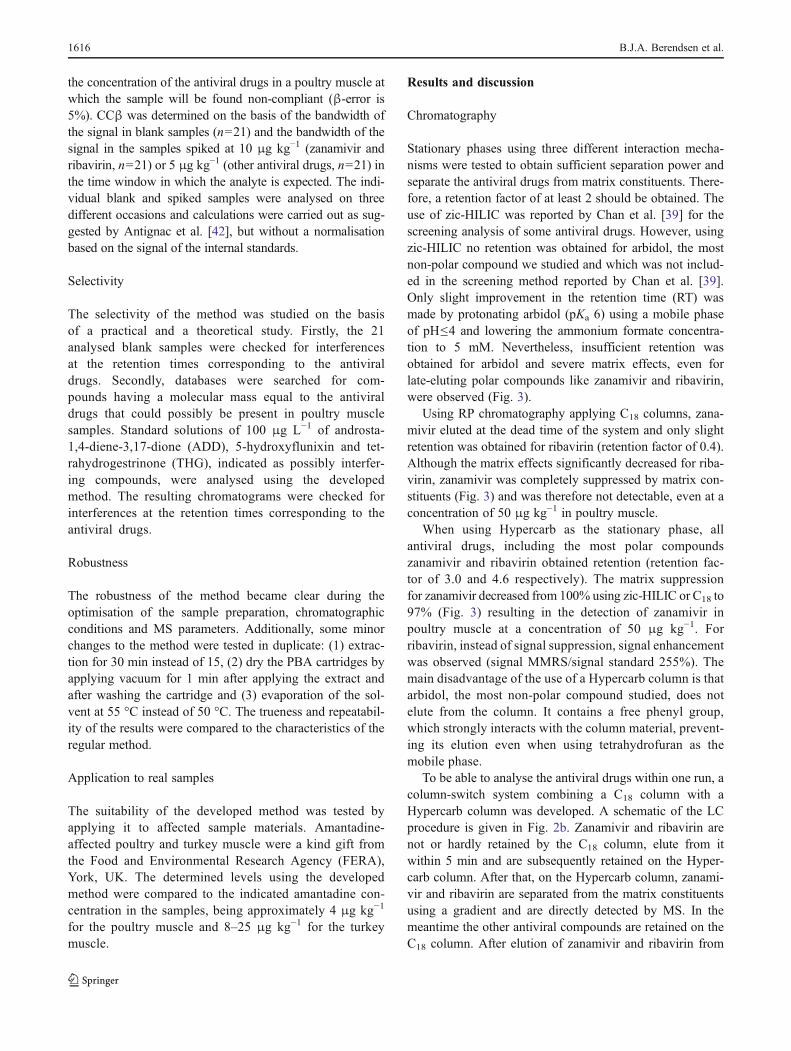
To further reduce the matrix effects and therefore to facili-tate detection and confirmation at a concentration of at least10 μg kg−1 in poultry muscle, additional sample clean-upproved to be necessary. Two different SPE systems weretested: Strata-X C and PBA. The relative amounts of theantiviral drugs in the breakthrough during application of thesample extract on the cartridge, the breakthrough duringwashing and the eluent are presented in Fig. 4a, b.
Because ribavirin remains neutral at pH 2, it does notinteract with the Strata-X C cartridge and elutes duringapplication of the extract and the washing procedure. Theother antiviral compounds are positively charged at pH 2and therefore are retained. Only zanamivir, having the low-est pKa of all the antiviral compounds (pKa 3.8), shows 10%breakthrough during the washing procedure which is con-sidered acceptable. The Strata-X C cartridge is consideredsuitable for the clean-up of all antiviral drugs includedexcept for ribavirin.
The PBA material has multiple interaction mechanisms.The strongest is the covalent binding at high pH with cis-diol groups, as present in ribavirin. Other mechanisms in-clude van der Waals interaction, π–π bonding and ionicinteraction. Therefore, the results using this type of material
are hard to predict. Ribavirin, oseltamivir, amantadine,rimantadine and arbidol are retained by the PBA cartridge(Fig. 4b). Zanamivir and oseltamivir carboxylate do notinteract with the PBA material and elute during applicationof the extract and the washing procedure. It stands out thatboth compounds containing a carboxylic acid moiety are leftunretained by the PBA material. No explanation was foundfor this observation.
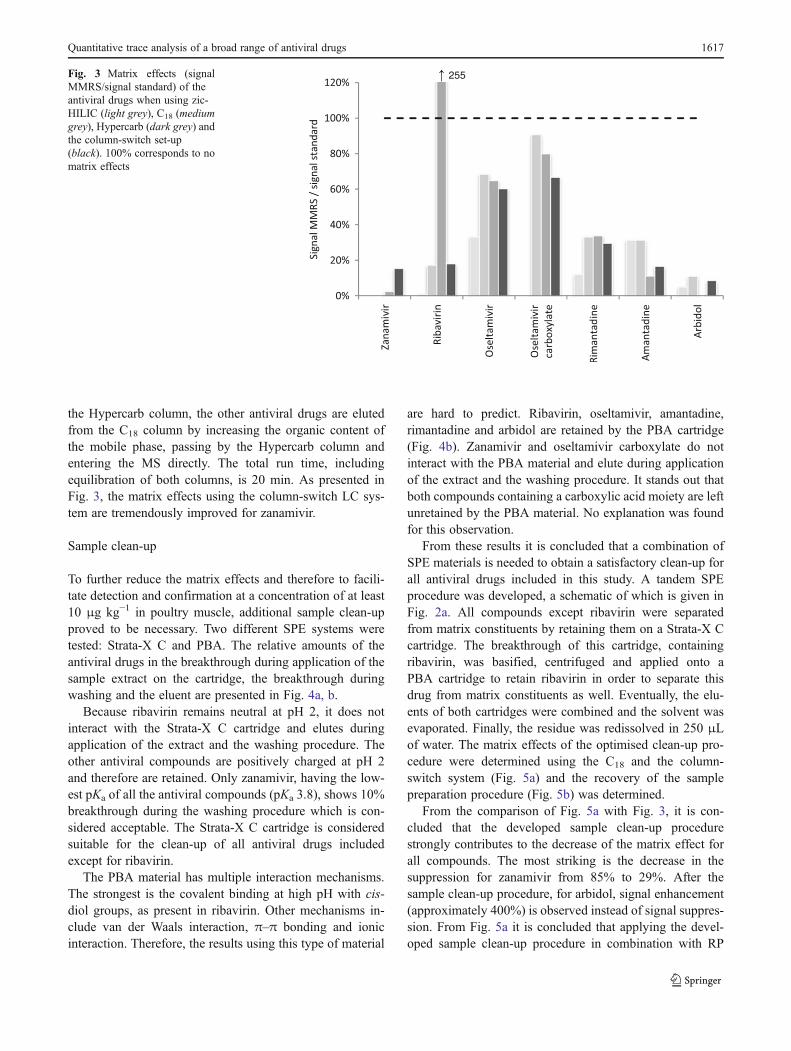
From these results it is concluded that a combination ofSPE materials is needed to obtain a satisfactory clean-up forall antiviral drugs included in this study. A tandem SPEprocedure was developed, a schematic of which is given inFig. 2a. All compounds except ribavirin were separatedfrom matrix constituents by retaining them on a Strata-X Ccartridge. The breakthrough of this cartridge, containingribavirin, was basified, centrifuged and applied onto aPBA cartridge to retain ribavirin in order to separate thisdrug from matrix constituents as well. Eventually, the elu-ents of both cartridges were combined and the solvent wasevaporated. Finally, the residue was redissolved in 250 μLof water. The matrix effects of the optimised clean-up pro-cedure were determined using the C18 and the column-switch system (Fig. 5a) and the recovery of the samplepreparation procedure (Fig. 5b) was determined.
From the comparison of Fig. 5a with Fig. 3, it is con-cluded that the developed sample clean-up procedurestrongly contributes to the decrease of the matrix effect forall compounds. The most striking is the decrease in thesuppression for zanamivir from 85% to 29%. After thesample clean-up procedure, for arbidol, signal enhancement(approximately 400%) is observed instead of signal suppres-sion. From Fig. 5a it is concluded that applying the devel-oped sample clean-up procedure in combination with RP
255Fig. 3 Matrix effects (signalMMRS/signal standard) of theantiviral drugs when using zic-HILIC (light grey), C18 (mediumgrey), Hypercarb (dark grey) andthe column-switch set-up(black). 100% corresponds to nomatrix effects
Quantitative trace analysis of a broad range of antiviral drugs 1617
chromatography only is adequate for the analysis of ribavirin,oseltamivir, oseltamivir carboxylate, rimantadine, amantadineand arbidol, but the matrix effect for zanamivir is still verypronounced and as a result 50 μg kg−1 of zanamivir in poultrymuscle is not detectable using solely RP chromatography.Only when using the combination of the tandem SPE sampleclean-up procedure and the column-switch LC–MS/MS
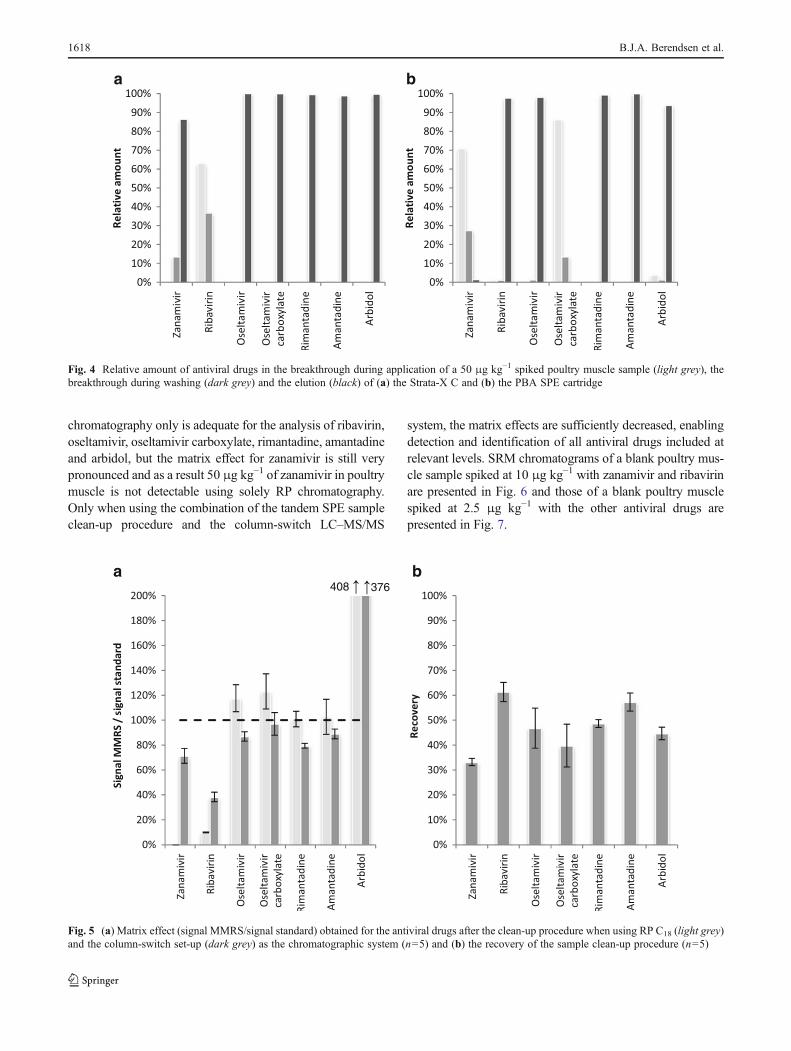
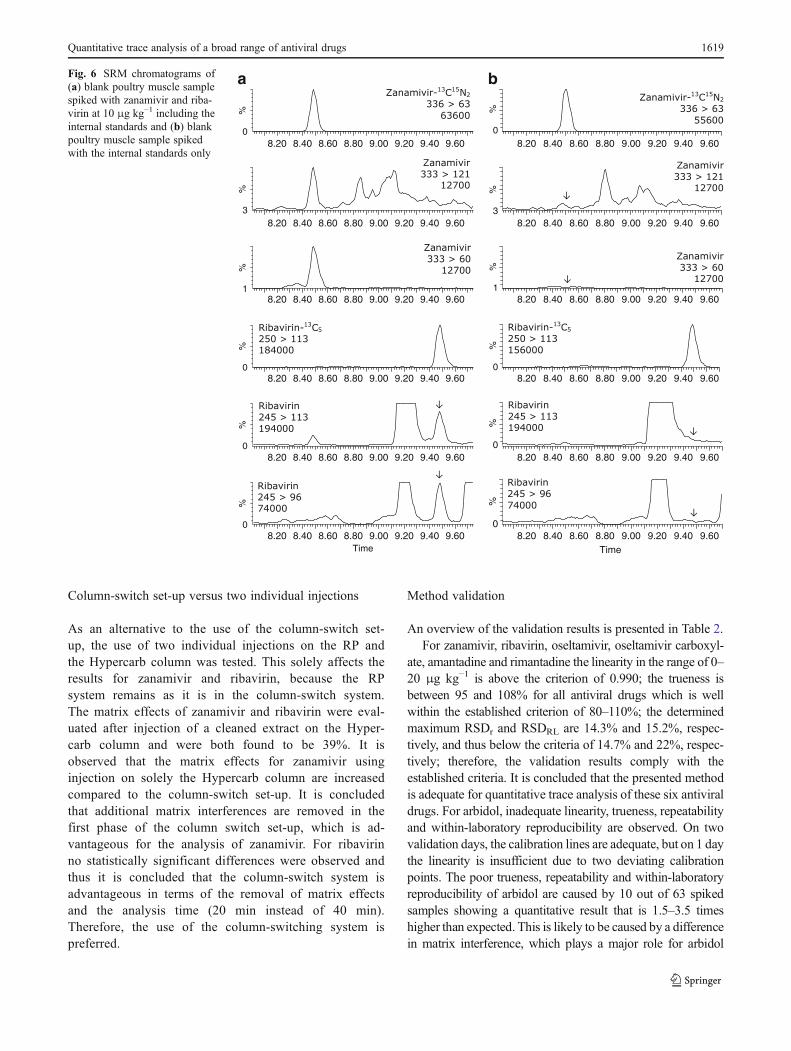
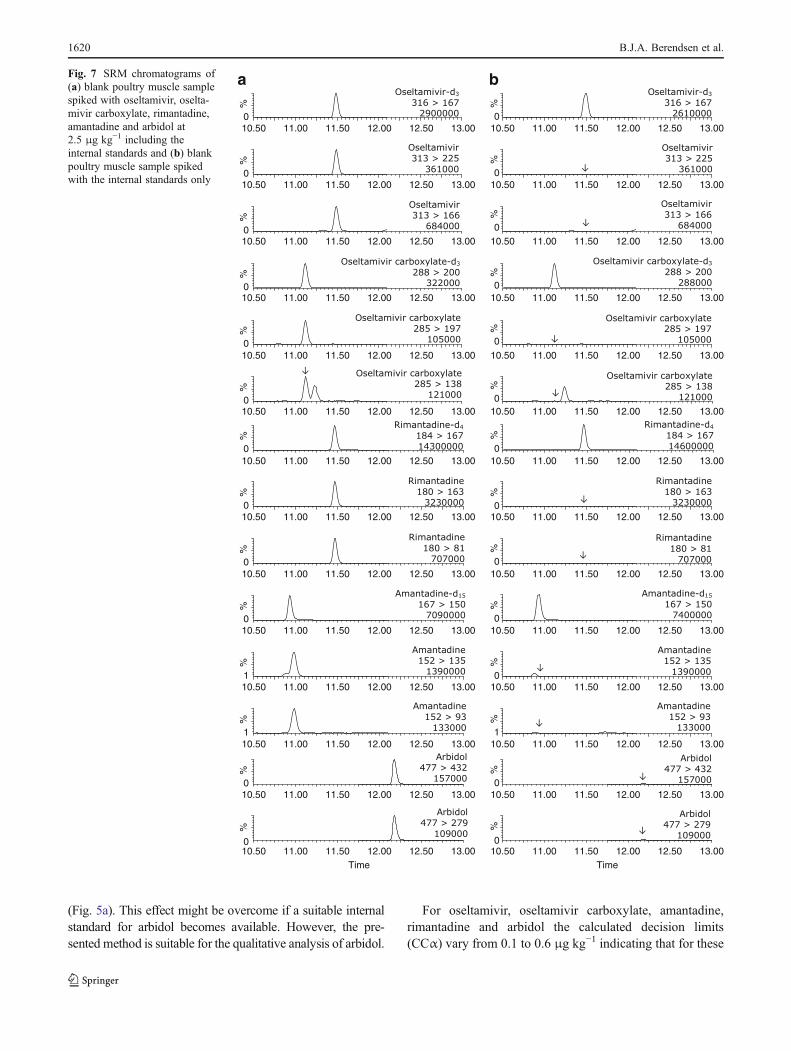
system, the matrix effects are sufficiently decreased, enablingdetection and identification of all antiviral drugs included atrelevant levels. SRM chromatograms of a blank poultry mus-cle sample spiked at 10 μg kg−1 with zanamivir and ribavirinare presented in Fig. 6 and those of a blank poultry musclespiked at 2.5 μg kg−1 with the other antiviral drugs arepresented in Fig. 7.
a b
Fig. 4 Relative amount of antiviral drugs in the breakthrough during application of a 50 μg kg−1 spiked poultry muscle sample (light grey), thebreakthrough during washing (dark grey) and the elution (black) of (a) the Strata-X C and (b) the PBA SPE cartridge
408 376a b
Fig. 5 (a) Matrix effect (signal MMRS/signal standard) obtained for the antiviral drugs after the clean-up procedure when using RP C18 (light grey)and the column-switch set-up (dark grey) as the chromatographic system (n05) and (b) the recovery of the sample clean-up procedure (n05)
1618 B.J.A. Berendsen et al.
Column-switch set-up versus two individual injections
As an alternative to the use of the column-switch set-up, the use of two individual injections on the RP andthe Hypercarb column was tested. This solely affects theresults for zanamivir and ribavirin, because the RPsystem remains as it is in the column-switch system.The matrix effects of zanamivir and ribavirin were eval-uated after injection of a cleaned extract on the Hyper-carb column and were both found to be 39%. It isobserved that the matrix effects for zanamivir usinginjection on solely the Hypercarb column are increasedcompared to the column-switch set-up. It is concludedthat additional matrix interferences are removed in thefirst phase of the column switch set-up, which is ad-vantageous for the analysis of zanamivir. For ribavirinno statistically significant differences were observed andthus it is concluded that the column-switch system isadvantageous in terms of the removal of matrix effectsand the analysis time (20 min instead of 40 min).Therefore, the use of the column-switching system ispreferred.
Method validation
An overview of the validation results is presented in Table 2.For zanamivir, ribavirin, oseltamivir, oseltamivir carboxyl-
ate, amantadine and rimantadine the linearity in the range of 0–20 μg kg−1 is above the criterion of 0.990; the trueness isbetween 95 and 108% for all antiviral drugs which is wellwithin the established criterion of 80–110%; the determinedmaximum RSDr and RSDRL are 14.3% and 15.2%, respec-tively, and thus below the criteria of 14.7% and 22%, respec-tively; therefore, the validation results comply with theestablished criteria. It is concluded that the presented methodis adequate for quantitative trace analysis of these six antiviraldrugs. For arbidol, inadequate linearity, trueness, repeatabilityand within-laboratory reproducibility are observed. On twovalidation days, the calibration lines are adequate, but on 1 daythe linearity is insufficient due to two deviating calibrationpoints. The poor trueness, repeatability and within-laboratoryreproducibility of arbidol are caused by 10 out of 63 spikedsamples showing a quantitative result that is 1.5–3.5 timeshigher than expected. This is likely to be caused by a differencein matrix interference, which plays a major role for arbidol
Time
%
0
%
0
%
0
%
1
%
3
%
0
%
0
ba
%
3
%
1
%
0
%
0
Time8.20 8.40 8.60 8.80 9.00 9.20 9.40 9.60
8.20 8.40 8.60 8.80 9.00 9.20 9.40 9.60
8.20 8.40 8.60 8.80 9.00 9.20 9.40 9.60
8.20 8.40 8.60 8.80 9.00 9.20 9.40 9.60
8.20 8.40 8.60 8.80 9.00 9.20 9.40 9.60
8.20 8.40 8.60 8.80 9.00 9.20 9.40 9.60
8.20 8.40 8.60 8.80 9.00 9.20 9.40 9.60
8.20 8.40 8.60 8.80 9.00 9.20 9.40 9.60
8.20 8.40 8.60 8.80 9.00 9.20 9.40 9.60
8.20 8.40 8.60 8.80 9.00 9.20 9.40 9.60
8.20 8.40 8.60 8.80 9.00 9.20 9.40 9.60
8.20 8.40 8.60 8.80 9.00 9.20 9.40 9.60
%
0
Fig. 6 SRM chromatograms of(a) blank poultry muscle samplespiked with zanamivir and riba-virin at 10 μg kg−1 including theinternal standards and (b) blankpoultry muscle sample spikedwith the internal standards only
Quantitative trace analysis of a broad range of antiviral drugs 1619
(Fig. 5a). This effect might be overcome if a suitable internalstandard for arbidol becomes available. However, the pre-sented method is suitable for the qualitative analysis of arbidol.
For oseltamivir, oseltamivir carboxylate, amantadine,rimantadine and arbidol the calculated decision limits(CCα) vary from 0.1 to 0.6 μg kg−1 indicating that for these
%
0
%
0
%
0
%
0
%
0
%
0
%
0
%
0
%
0
%
1
%
0
TimeTime10.50 11.00 11.50 12.00 12.50 13.00 10.50 11.00 11.50 12.00 12.50 13.00
10.50 11.00 11.50 12.00 12.50 13.00 10.50 11.00 11.50 12.00 12.50 13.00
10.50 11.00 11.50 12.00 12.50 13.00 10.50 11.00 11.50 12.00 12.50 13.00
10.50 11.00 11.50 12.00 12.50 13.00 10.50 11.00 11.50 12.00 12.50 13.00
10.50 11.00 11.50 12.00 12.50 13.00 10.50 11.00 11.50 12.00 12.50 13.00
10.50 11.00 11.50 12.00 12.50 13.00 10.50 11.00 11.50 12.00 12.50 13.00
10.50 11.00 11.50 12.00 12.50 13.00 10.50 11.00 11.50 12.00 12.50 13.00
10.50 11.00 11.50 12.00 12.50 13.00 10.50 11.00 11.50 12.00 12.50 13.00
10.50 11.00 11.50 12.00 12.50 13.00 10.50 11.00 11.50 12.00 12.50 13.00
10.50 11.00 11.50 12.00 12.50 13.00 10.50 11.00 11.50 12.00 12.50 13.00
10.50 11.00 11.50 12.00 12.50 13.00 10.50 11.00 11.50 12.00 12.50 13.00
10.50 11.00 11.50 12.00 12.50 13.00 10.50 11.00 11.50 12.00 12.50 13.00
10.50 11.00 11.50 12.00 12.50 13.00 10.50 11.00 11.50 12.00 12.50 13.00
10.50 11.00 11.50 12.00 12.50 13.00 10.50
ba
11.00 11.50 12.00 12.50 13.00
%
0
%
0
%
0
%
0
%0
%
0
%
0
%
1
%
1
%
0
%
0
%
0
%
0
%
0
%
0
%
0
%0
Fig. 7 SRM chromatograms of(a) blank poultry muscle samplespiked with oseltamivir, oselta-mivir carboxylate, rimantadine,amantadine and arbidol at2.5 μg kg−1 including theinternal standards and (b) blankpoultry muscle sample spikedwith the internal standards only
1620 B.J.A. Berendsen et al.
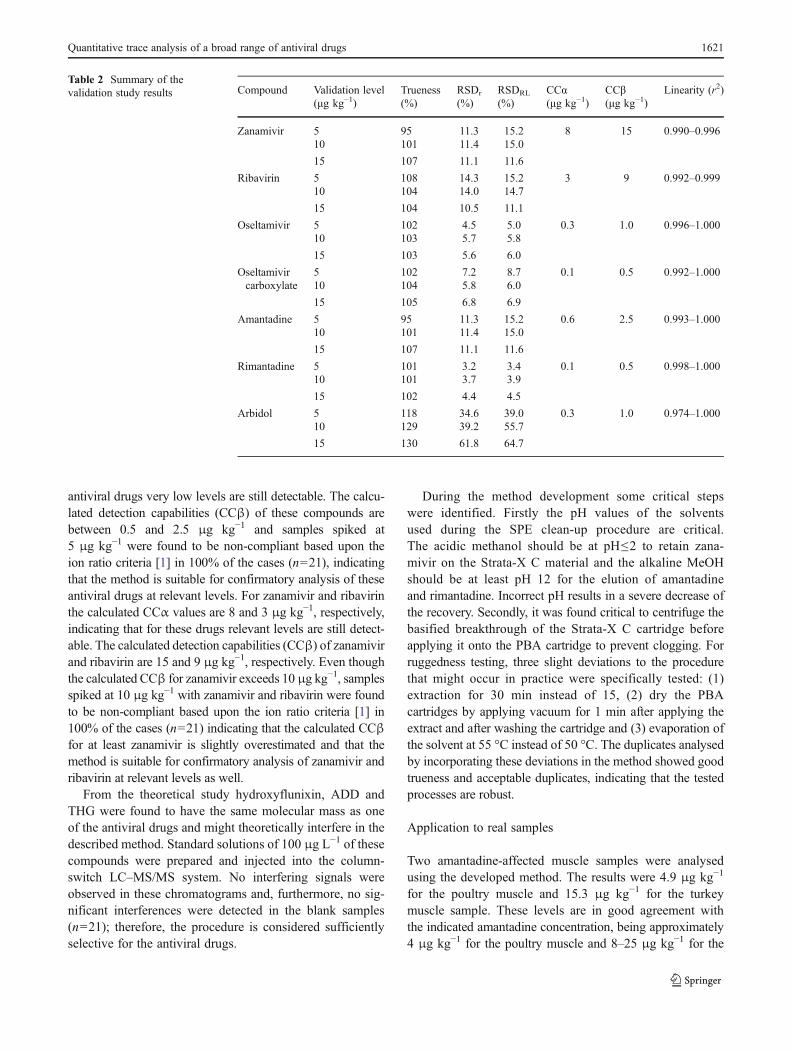
antiviral drugs very low levels are still detectable. The calcu-lated detection capabilities (CCβ) of these compounds arebetween 0.5 and 2.5 μg kg−1 and samples spiked at5 μg kg−1 were found to be non-compliant based upon theion ratio criteria [1] in 100% of the cases (n021), indicatingthat the method is suitable for confirmatory analysis of theseantiviral drugs at relevant levels. For zanamivir and ribavirinthe calculated CCα values are 8 and 3 μg kg−1, respectively,indicating that for these drugs relevant levels are still detect-able. The calculated detection capabilities (CCβ) of zanamivirand ribavirin are 15 and 9 μg kg−1, respectively. Even thoughthe calculated CCβ for zanamivir exceeds 10 μg kg−1, samplesspiked at 10 μg kg−1 with zanamivir and ribavirin were foundto be non-compliant based upon the ion ratio criteria [1] in100% of the cases (n021) indicating that the calculated CCβfor at least zanamivir is slightly overestimated and that themethod is suitable for confirmatory analysis of zanamivir andribavirin at relevant levels as well.
From the theoretical study hydroxyflunixin, ADD andTHG were found to have the same molecular mass as oneof the antiviral drugs and might theoretically interfere in thedescribed method. Standard solutions of 100 μg L−1 of thesecompounds were prepared and injected into the column-switch LC–MS/MS system. No interfering signals wereobserved in these chromatograms and, furthermore, no sig-nificant interferences were detected in the blank samples(n021); therefore, the procedure is considered sufficientlyselective for the antiviral drugs.
During the method development some critical stepswere identified. Firstly the pH values of the solventsused during the SPE clean-up procedure are critical.The acidic methanol should be at pH≤2 to retain zana-mivir on the Strata-X C material and the alkaline MeOHshould be at least pH 12 for the elution of amantadineand rimantadine. Incorrect pH results in a severe decrease ofthe recovery. Secondly, it was found critical to centrifuge thebasified breakthrough of the Strata-X C cartridge beforeapplying it onto the PBA cartridge to prevent clogging. Forruggedness testing, three slight deviations to the procedurethat might occur in practice were specifically tested: (1)extraction for 30 min instead of 15, (2) dry the PBAcartridges by applying vacuum for 1 min after applying theextract and after washing the cartridge and (3) evaporation ofthe solvent at 55 °C instead of 50 °C. The duplicates analysedby incorporating these deviations in the method showed goodtrueness and acceptable duplicates, indicating that the testedprocesses are robust.
Application to real samples
Two amantadine-affected muscle samples were analysedusing the developed method. The results were 4.9 μg kg−1
for the poultry muscle and 15.3 μg kg−1 for the turkeymuscle sample. These levels are in good agreement withthe indicated amantadine concentration, being approximately4 μg kg−1 for the poultry muscle and 8–25 μg kg−1 for the
Table 2 Summary of thevalidation study results Compound Validation level
(μg kg−1)Trueness(%)
RSDr
(%)RSDRL
(%)CCα(μg kg−1)
CCβ(μg kg−1)
Linearity (r2)
Zanamivir 5 95 11.3 15.2 8 15 0.990–0.99610 101 11.4 15.0
15 107 11.1 11.6
Ribavirin 5 108 14.3 15.2 3 9 0.992–0.99910 104 14.0 14.7
15 104 10.5 11.1
Oseltamivir 5 102 4.5 5.0 0.3 1.0 0.996–1.00010 103 5.7 5.8
15 103 5.6 6.0
Oseltamivircarboxylate
5 102 7.2 8.7 0.1 0.5 0.992–1.00010 104 5.8 6.0
15 105 6.8 6.9
Amantadine 5 95 11.3 15.2 0.6 2.5 0.993–1.00010 101 11.4 15.0
15 107 11.1 11.6
Rimantadine 5 101 3.2 3.4 0.1 0.5 0.998–1.00010 101 3.7 3.9
15 102 4.4 4.5
Arbidol 5 118 34.6 39.0 0.3 1.0 0.974–1.00010 129 39.2 55.7
15 130 61.8 64.7
Quantitative trace analysis of a broad range of antiviral drugs 1621
turkey muscle. From this it is concluded that the developedmethod is applicable to real muscle samples.
Conclusions
A method using a tandem SPE sample preparation clean-upcombined with column-switch LC–MS/MS was developedfor the analysis of seven antiviral drugs in poultry muscle,ranging from very polar to reasonably non-polar drugs, andincluding basic, amphoteric and neutral compounds. Theremoval of matrix interferences was critical for the detectionand quantification of zanamivir and ribavirin in particular.Because neither compound was sufficiently retained byusing reversed-phase chromatography, a column-switchLC system combining a reversed-phase and a Hypercarbcolumn was developed. This system showed improved sep-aration power and is relatively easy to set-up, which is ofmajor importance in a routine situation. Furthermore, atandem SPE procedure proved to be mandatory for addi-tional removal of matrix constituents. The method was fullyvalidated according to 2002/657/EC [1] at concentrations of5, 10 and 15 μg kg−1. Good linearity, trueness, repeatabilityand within-lab reproducibility were obtained for zanamivir,ribavirin, oseltamivir, oseltamivir carboxylate, amantadineand rimantadine. For arbidol these paramaters did not com-ply with the established criteria because the method resultedin a severe overestimation of the concentration for 16% ofthe spiked samples. The selectivity and robustness proved tobe sufficient to apply the presented method in a routinesituation enabling parallel analysis of at least 48 sampleswithin 1 day. It is concluded that the presented method issuitable for the quantitative confirmatory analysis of zana-mivir and ribavirin at levels as low as 10 μg kg−1 and foroseltamivir, oseltamivir carboxylate, amantadine and riman-tadine at a concentration of 1 μg kg−1. Furthermore, thepresented method is suitable for the qualitative confirmatoryanalysis of arbidol at a concentration of 1 μg kg−1.
Acknowledgements This project was financially supported by theDutchMinistry of Economic Affairs, Agriculture and Innovation (project1217261301). We thank Frédérique van Holthoon for her contribution tothe method development and FERA for kindly supplying amantadine-affected muscle samples.
Open Access This article is distributed under the terms of the Crea-tive Commons Attribution Noncommercial License which permits anynoncommercial use, distribution, and reproduction in any medium,provided the original author(s) and source are credited.
References
1. EC (2002) Commission Decision 2002/657/EC of 12 August 2002implementing Council Directive 96/23/EC concerning the perfor-
mance of analytical methods and the interpretation of results. Off JEurop Commun L221:8–36
2. The Writing Committee of the World Health Organization (WHO)Consultation on Human Influenza A/H5 (2005) Avian influenza A(H5N1) infection in humans. N Engl J Med 353:1374–1385
3. WHO (2011) Avian influenza, fact sheet. WHO, Geneva4. Malik Peiris JS, De Jong MD, Guan Y (2007) Avian influenza
virus (H5N1): a threat to human health. Clin Microbiol Rev20:243–267
5. Mumford E, Bishop J, Hendrickx S, Embarek P, Perdue M (2007)Avian influenza H5N1: risks at the human-animal interface. FoodNutr Bull 28:S357–S363
6. Von Itzstein M (2007) The war against influenza: discovery anddevelopment of sialidase inhibitors. Nat Rev Drug Discov 6:967–974
7. He G, Qiao J, Dong C, He C, Zhao L, Tian Y (2008) Amantadine-resistance among H5N1 avian influenza viruses isolated in North-ern China. Antivir Res 77:72–76
8. Souza TML, Mesquita M, Resende P, Machado V, Gregianini TS,Fernandes SB, Oliveira ICD, Rosa MdCD, Marinelli R, deAzeredo-Lima CH, Motta FC, Aguiar-Oliveira MdL, SiqueiraMM (2011) Antiviral resistance surveillance for influenza A virusin Brazil: investigation on 2009 pandemic influenza A (H1N1)resistance to oseltamivir. Diag Microbiol Infect Dis 71:98–99
9. Zaraket H, Kondo H, Tabet C, Hanna-Wakim R, Suzuki Y, DbaiboGS, Saito R, Suzuki H (2011) Genetic diversity and antiviral drugresistance of pandemic H1N1 2009 in Lebanon. J Clin Virol51:170–174
10. Pawlotsky J-M (2011) Treatment failure and resistance with direct-acting antiviral drugs against hepatitis C virus. Hepatology53:1742–1751
11. Hayden FG, De Jong MD (2011) Emerging influenza antiviralresistance threats. J Infect Dis 203:6–10
12. Thorlund K, Awad T, Boivin G, Thabane L (2011) Systematicreview of influenza resistance to the neuraminidase inhibitors.BMC Infect Dis 11
13. Lyushina NA, Govorkova EA, Webster RG (2005) Detection ofamantadine-resistant variants among avian influenza viruses iso-lated in North America and Asia. Virology 341:102–106
14. Weinstock DM, Zuccotti G (2006) Adamantane resistance in influ-enza A. J Am Med Assoc 295:934–936
15. Ghosh GC, Nakada N, Yamashita N, Tanaka H (2010) Oseltamivircarboxylate, the active metabolite of oseltamivir phosphate (Tamiflu),detected in sewage discharge and river water in Japan. Environ HealthPersp 118:103–107
16. Singer AC, Nunn MA, Gould EA, Johnson AC (2007) Potentialrisks associated with the proposed widespread use of Tamiflu.Environ Health Perspect 115:102–106
17. Fick J, Lindberg RH, Tysklind M, Haemig PD, Waldenström J,Wallensten A, Olsen B (2007) Antiviral oseltamivir is not removedor degraded in normal sewage water treatment: implications fordevelopment of resistance by influenza A virus. PLoS One 2:e986
18. Cyranoski D (2005) China's chicken farmers under fire for anti-viral abuse. Nature 435:1009
19. Delogu I, Pastorino B, Baronti C, Nougairède A, Bonnet E, deLamballerie X (2011) In vitro antiviral activity of arbidol againstChikungunya virus and characteristics of a selected resistant mutant.Antivir Res 90:99–107
20. FDA (2006) FDA prohibits use of antiviral drugs in poultry to helpkeep drugs effective for humans. http://www.fda.gov/NewsEvents/Newsroom/PressAnnouncements/2006/ucm108620.htm. Accessed18 Jun 2009
21. Allen GD, Brookes ST, Barrow A, Dunn JA, Grosse CM (1999)Liquid chromatographic-tandem mass spectrometric method forthe determination of the neuraminidase inhibitor zanamivir(GG167) in human serum. J Chromatogr B 732:383–393
1622 B.J.A. Berendsen et al.
22. Baughman TM, Wright WL, Hutton KA (2007) Determination ofzanamivir in rat and monkey plasma by positive ion hydrophilicinteraction chromatography (HILIC)/tandem mass spectrometry. JChromatogr B 852:505–511
23. Yeh LT, Nguyen M, Lourenco D, Lin CC (2005) A sensitive andspecific method for the determination of total ribavirin in monkeyliver by high-performance liquid chromatography with tandemmass spectrometry. J Pharm Biomed Anal 38:34–40
24. Yeh LT, Nguyen M, Dadgostari S, Bu W, Lin CC (2007) LC-MS/MS method for simultaneous determination of viramidine andribavirin levels in monkey red blood cells. J Pharm Biomed Anal43:1057–1064
25. Liu Y, Xu C, Yan R, Lim C, Yeh LT, Lin CC (2006) Sensitive andspecific LC-MS/MS method for the simultaneous measurements ofviramidine and ribavirin in human plasma. J Chromatography B832:17–23
26. Svensson JO, Bruchfeld A, Schvarcz R, Ståhle L (2000) Determi-nation of ribavirin in serum using highly selective solid-phaseextraction and high-performance liquid chromatography. TherDrug Monit 22:215–218
27. Lindegårdh N, Hanpithakpong W, Wattanagoon Y, SinghasivanonP, White NJ, Day NPJ (2007) Development and validation of aliquid chromatographic-tandem mass spectrometric method fordetermination of oseltamivir and its metabolite oseltamivir carbox-ylate in plasma, saliva and urine. J Chromatogr B Anal TechnolBiomed Life Sci 859:74–83
28. Wiltshire B, Citron A, Clarke T, Serpe C, Gray D, Herron W (2000)Development of a high-performance liquid chromatographic-massspectrometric assay for the specific and sensitive quantification ofRo 64–0802, an anti-influenza drug, and its pro-drug, oseltamivir, inhuman and animal plasma and urine. J Chromatogr B 745:373–388
29. Yamanaka T, Yamada M, Tsujimura K, Kondo T, Nagata S,Hobo S, Kurosawa M, Matsumura T (2007) Clinical pharma-cokinetics of oseltamivir and its active metabolite oseltamivircarboxylate after oral administration in horses. J Vet Med Sci69:293–296
30. Heinig K, Bucheli F (2008) Sensitive determination of oseltamivirand oseltamivir carboxylate in plasma, urine, cerebrospinal fluidand brain by liquid chromatography-tandem mass spectrometry. JChromatogr B 876:129–136
31. Bahrami G, Mohammadi B, Kiani A (2008) Determination ofoseltamivir carboxylic acid in human serum by solid phase extrac-tion and high performance liquid chromatography with UV detec-tion. J Chromatogr B 864:38–42
32. Ping W, Yi-Zeng L, Ben-Mei C, Neng Z, Lun-Zhao Y, Yan Y,Zhi-Biao Y (2007) Quantitative determination of amantadinein human plasma by liquid chromatography-mass spectrometryand the application in a bioequivalence study. J PharmBiomed Anal 43:1519–1525
33. Xu M, Ju W, Xia X, Tan H, Chen M, Zhang J, Xiong N, Jiang M,Chen L, Gong L (2008) Determination of rimantadine in ratplasma by liquid chromatography/electrospray mass spectrometryand its application in a pharmacokinetic study. J Chromatogr B864:123–128
34. Feng S, Tian Y, Zhang Z, Zhang J, Huang M, Chen Y (2009)Rapid simultaneous determination of paracetamol, amantadinehydrochloride, caffeine and chlorpheniramine maleate in humanplasma by liquid chromatography/ tandem mass spectrometry.Arzneim Forsch 59:86–95
35. Higashi Y, Uemori I, Fujii Y (2005) Simultaneous determination ofamantadine and rimantadine by HPLC in rat plasma with pre-column derivatization and fluorescence detection for pharmacoki-netic studies. Biomed Chromatogr 19:655–662
36. Shuangjin C, Fang F, Han L, Ming M (2007) New method for high-performance liquid chromatographic determination of amantadineand its analogues in rat plasma. J Pharm Biomed Anal 44:1100–1105
37. Liu X, Huang YW, Li J, Li XB, Bi KS, Chen XH (2007) Determi-nation of arbidol in human plasma by LC-ESI-MS. J Pharm BiomedAnal 43:371–375
38. Wang Y, Chen X, Li Q, Zhong D (2008) Metabolite identificationof arbidol in human urine by the study of CID fragmentationpathways using HPLC coupled with ion trap mass spectrometry.J Mass Spectrom 43:1099–1109
39. Chan D, Tarbin J, Sharman M, Carson M, Smith M, Smith S(2011) Screening method for the analysis of antiviral drugs inpoultry tissues using zwitterionic hydrophilic interaction liquidchromatography/tandem mass spectrometry. Anal Chim Acta700:194–200
40. Horwitz W, Kamps LR, Boyer KW (1980) Quality assurance in theanalysis of foods and trace constituents. J Assoc Off Anal Chem63:1344–1354
41. Thompson M, Ellison SL, Wood R (2006) The international harmo-nized protocol for the proficiency testing of analytical chemistrylaboratories. Pure Appl Chem 78:145–196
42. Antignac J-P, Le Bizec BL, Monteau F, Andre F (2003) Validationof analytical methods based on mass spectrometric detectionaccording to the “2002/657/EC” European decision: guidelineand application. Anal Chim Acta 483:325–334
Quantitative trace analysis of a broad range of antiviral drugs 1623