quantitative structural characterization of poss and octavinyl-poss nanocomposites by solid state...
TRANSCRIPT
Solid State Nuclear Magnetic Resonance 43–44 (2012) 56–61
Contents lists available at SciVerse ScienceDirect
Solid State Nuclear Magnetic Resonance
0926-20
doi:10.1
n Corrnn Cor
E-m
shanmi
journal homepage: www.elsevier.com/locate/ssnmr
Quantitative structural characterization of POSS and octavinyl-POSSnanocomposites by solid state NMR
Huipeng Zhao a,b, Jie Shu a, Qun Chen a,n, Shanmin Zhang a,n
a Shanghai Key Laboratory of Magnetic Resonance, Department of Physics, East China Normal University, Shanghai 200062, Chinab Research Center for Analysis and Measurement, Donghua University, Shanghai 201620, China
a r t i c l e i n f o
Article history:
Received 14 November 2011
Received in revised form
24 December 2011Available online 21 February 2012
Keywords:
Solid-state NMR
Cross polarization/depolarization
Reciprocity relation
Chloromethylphenyl isobutyl POSS
Octavinyl-POSS nanocomposites
40/$ - see front matter Crown Copyright & 2
016/j.ssnmr.2012.02.005
esponding author. Fax: þ86 21 62576217.
responding author. Fax: þ86 21 62235029.
ail addresses: [email protected] (Q. C
[email protected] (S. Zhang).
a b s t r a c t
The ratio between two different 29Si atoms in chloromethylphenyl isobutyl Polyhedral Oligomeric
Silsesquioxane (POSS) was determined based on the quantitative cross polarization (QCP) (Shu et al.,
Chem. Phys. Lett. 462 (2008) 125) in solid-state NMR. For a 29Si/1H spin system, cross polarization and
depolarization together with the reciprocity relation were performed with optimized experimental
conditions. It saves considerable experimental time compared to the 29Si direct polarization experi-
ment. The same method was further applied to octavinyl-POSS nanocomposites containing perfluor-
opolyether (PFPE) for deriving directly and accurately the average numbers of reacted vinyl groups,
which may not be obtained by combining FTIR and solution 1H NMR. In principle, the aforementioned
method proves to be valuable in quantitative characterization of silicon related structures in bulk
materials.
Crown Copyright & 2012 Published by Elsevier Inc. All rights reserved.
1. Introduction
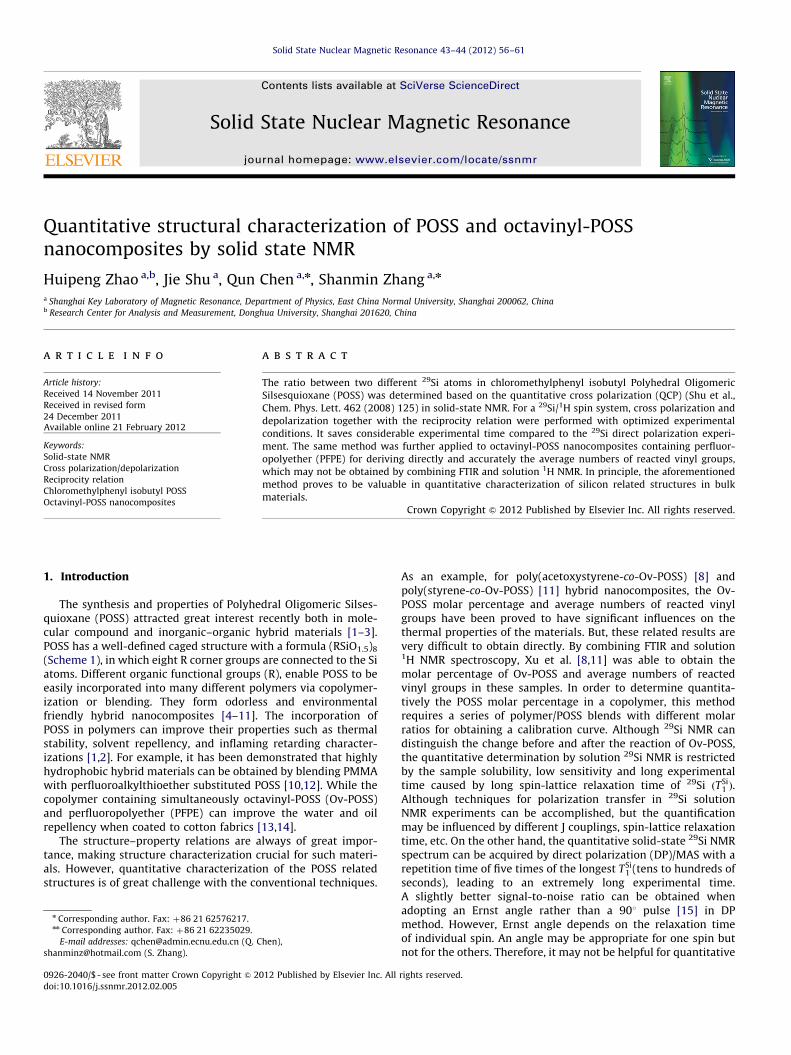
The synthesis and properties of Polyhedral Oligomeric Silses-quioxane (POSS) attracted great interest recently both in mole-cular compound and inorganic–organic hybrid materials [1–3].POSS has a well-defined caged structure with a formula (RSiO1.5)8
(Scheme 1), in which eight R corner groups are connected to the Siatoms. Different organic functional groups (R), enable POSS to beeasily incorporated into many different polymers via copolymer-ization or blending. They form odorless and environmentalfriendly hybrid nanocomposites [4–11]. The incorporation ofPOSS in polymers can improve their properties such as thermalstability, solvent repellency, and inflaming retarding character-izations [1,2]. For example, it has been demonstrated that highlyhydrophobic hybrid materials can be obtained by blending PMMAwith perfluoroalkylthioether substituted POSS [10,12]. While thecopolymer containing simultaneously octavinyl-POSS (Ov-POSS)and perfluoropolyether (PFPE) can improve the water and oilrepellency when coated to cotton fabrics [13,14].
The structure–property relations are always of great impor-tance, making structure characterization crucial for such materi-als. However, quantitative characterization of the POSS relatedstructures is of great challenge with the conventional techniques.
012 Published by Elsevier Inc. All
hen),
As an example, for poly(acetoxystyrene-co-Ov-POSS) [8] andpoly(styrene-co-Ov-POSS) [11] hybrid nanocomposites, the Ov-POSS molar percentage and average numbers of reacted vinylgroups have been proved to have significant influences on thethermal properties of the materials. But, these related results arevery difficult to obtain directly. By combining FTIR and solution1H NMR spectroscopy, Xu et al. [8,11] was able to obtain themolar percentage of Ov-POSS and average numbers of reactedvinyl groups in these samples. In order to determine quantita-tively the POSS molar percentage in a copolymer, this methodrequires a series of polymer/POSS blends with different molarratios for obtaining a calibration curve. Although 29Si NMR candistinguish the change before and after the reaction of Ov-POSS,the quantitative determination by solution 29Si NMR is restrictedby the sample solubility, low sensitivity and long experimentaltime caused by long spin-lattice relaxation time of 29Si ðTSi
1 Þ.Although techniques for polarization transfer in 29Si solutionNMR experiments can be accomplished, but the quantificationmay be influenced by different J couplings, spin-lattice relaxationtime, etc. On the other hand, the quantitative solid-state 29Si NMRspectrum can be acquired by direct polarization (DP)/MAS with arepetition time of five times of the longest TSi
1 (tens to hundreds ofseconds), leading to an extremely long experimental time.A slightly better signal-to-noise ratio can be obtained whenadopting an Ernst angle rather than a 901 pulse [15] in DPmethod. However, Ernst angle depends on the relaxation timeof individual spin. An angle may be appropriate for one spin butnot for the others. Therefore, it may not be helpful for quantitative
rights reserved.
H. Zhao et al. / Solid State Nuclear Magnetic Resonance 43–44 (2012) 56–61 57
purpose. Hartmann–Hahn cross polarization (CP) [16] fromabundant nuclei (1H) to rare or low magnetogyric ratio (g) nucleican improve considerably the signal-to-noise ratio and reducesignificantly the repetition time because it only needs a repetitiontime greater than five times of 1H spin-lattice relaxation time (TH
1 ,usually shorter than one second). The conventional CP methodnevertheless loses one of the important NMR characteristics-quantification.
Solid-state NMR can provide tremendous information aboutstructures, dynamics, spatial and chemical-bond connectivity, etc.It has been applied to investigate the POSS compound andnanocomposites [17–21]. To obtain quantitative results from CPspectra, a number of methods have been developed, includingvariable contact time [19,22,23], ramp-CP [24], Lee Goldburgspin-locking [25], dipolar recoupling [26,27] and cross depolar-ization (CDP) [28,29]. Among these methods, quantitative CP(QCP) scheme based on the reciprocity relation between CP andCDP provides straightforwardly quantitative information aboutCP dynamics [28,29]. The enhancement factors (Z) of CP signalscan be directly determined. Given the enhancement factors,conventional CP/MAS spectra can be quantified. Shu et al. [30]extended the theory to the relaxation (T1r) compensated recipro-city relation and applied the method to 13C quantitative determi-nation. A modified QCP, 13C/1H CPSP/CDP has been applied toquantitatively characterize the multi-phase polymer containingPS and PI [31]. To our knowledge, the QCP method has never beenapplied to 29Si quantitative determination. From thermo equili-brium, 29Si/1H CP can obtain a higher theoretical Z value than thatof 13C/1H due to relatively lower 9g9 value (9gH/gSi9¼5.03, 9gH/gC9¼3.98).
In this work, the quantitative method is employed to deter-mine the ratio between two different 29Si atoms in chloromethyl-phenyl isobutyl POSS (POSS-Cl) [9,32] and various experimentalconditions are explored to optimize the method for 29Si/1Hsystem. The method is then applied to determine the averagenumbers of reacted vinyl groups in hybrid tetra-polymers (NPcopolymer) containing Ov-POSS, methyl methacrylate (MMA),hydroxyethyl acrylate (HEA) and PFPE. They can reflect directly
Scheme 1. The structures of POSS-Cl (a) and iBu-POSS (b).
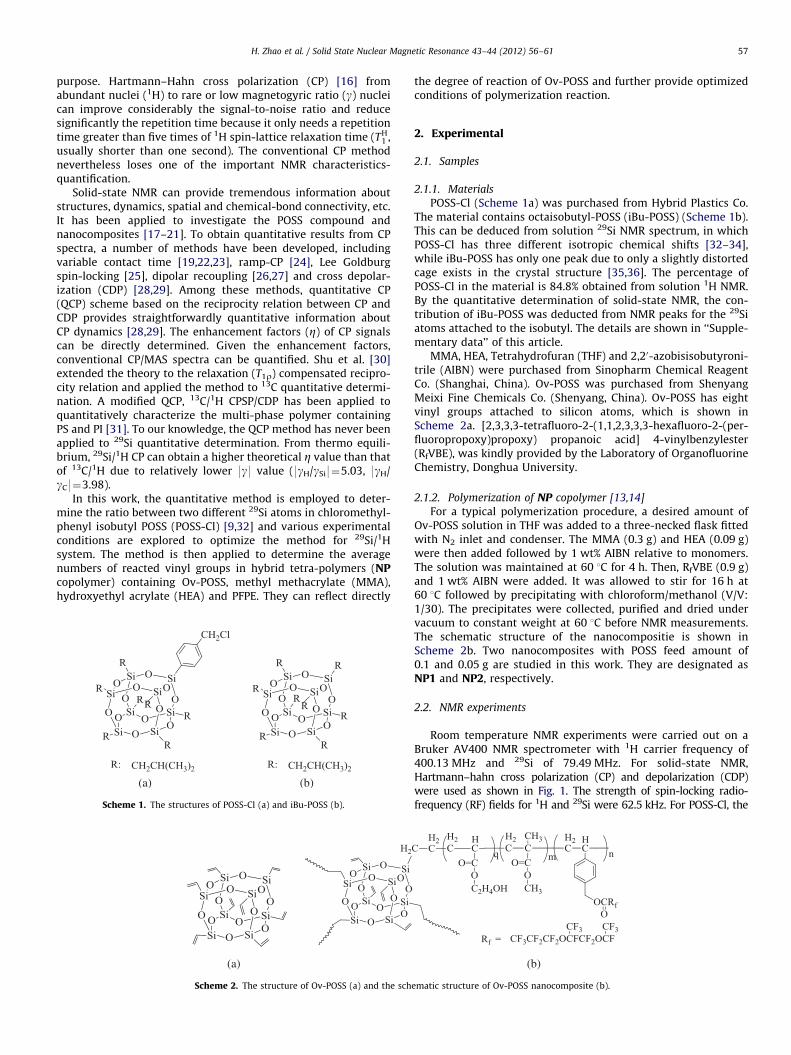
Scheme 2. The structure of Ov-POSS (a) and the sch
the degree of reaction of Ov-POSS and further provide optimizedconditions of polymerization reaction.
2. Experimental
2.1. Samples
2.1.1. Materials
POSS-Cl (Scheme 1a) was purchased from Hybrid Plastics Co.The material contains octaisobutyl-POSS (iBu-POSS) (Scheme 1b).This can be deduced from solution 29Si NMR spectrum, in whichPOSS-Cl has three different isotropic chemical shifts [32–34],while iBu-POSS has only one peak due to only a slightly distortedcage exists in the crystal structure [35,36]. The percentage ofPOSS-Cl in the material is 84.8% obtained from solution 1H NMR.By the quantitative determination of solid-state NMR, the con-tribution of iBu-POSS was deducted from NMR peaks for the 29Siatoms attached to the isobutyl. The details are shown in ‘‘Supple-mentary data’’ of this article.
MMA, HEA, Tetrahydrofuran (THF) and 2,20-azobisisobutyroni-trile (AIBN) were purchased from Sinopharm Chemical ReagentCo. (Shanghai, China). Ov-POSS was purchased from ShenyangMeixi Fine Chemicals Co. (Shenyang, China). Ov-POSS has eightvinyl groups attached to silicon atoms, which is shown inScheme 2a. [2,3,3,3-tetrafluoro-2-(1,1,2,3,3,3-hexafluoro-2-(per-fluoropropoxy)propoxy) propanoic acid] 4-vinylbenzylester(RfVBE), was kindly provided by the Laboratory of OrganofluorineChemistry, Donghua University.
2.1.2. Polymerization of NP copolymer [13,14]
For a typical polymerization procedure, a desired amount ofOv-POSS solution in THF was added to a three-necked flask fittedwith N2 inlet and condenser. The MMA (0.3 g) and HEA (0.09 g)were then added followed by 1 wt% AIBN relative to monomers.The solution was maintained at 60 1C for 4 h. Then, RfVBE (0.9 g)and 1 wt% AIBN were added. It was allowed to stir for 16 h at60 1C followed by precipitating with chloroform/methanol (V/V:1/30). The precipitates were collected, purified and dried undervacuum to constant weight at 60 1C before NMR measurements.The schematic structure of the nanocompositie is shown inScheme 2b. Two nanocomposites with POSS feed amount of0.1 and 0.05 g are studied in this work. They are designated asNP1 and NP2, respectively.
2.2. NMR experiments
Room temperature NMR experiments were carried out on aBruker AV400 NMR spectrometer with 1H carrier frequency of400.13 MHz and 29Si of 79.49 MHz. For solid-state NMR,Hartmann–hahn cross polarization (CP) and depolarization (CDP)were used as shown in Fig. 1. The strength of spin-locking radio-frequency (RF) fields for 1H and 29Si were 62.5 kHz. For POSS-Cl, the
ematic structure of Ov-POSS nanocomposite (b).
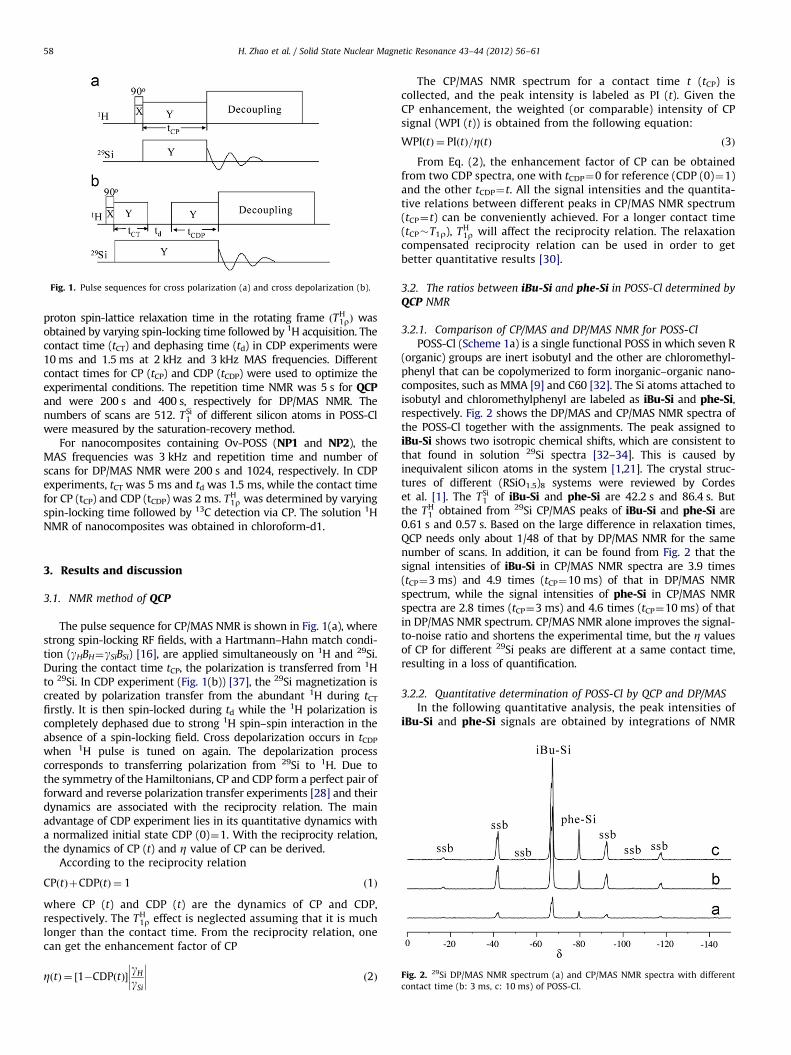
Fig. 1. Pulse sequences for cross polarization (a) and cross depolarization (b).
H. Zhao et al. / Solid State Nuclear Magnetic Resonance 43–44 (2012) 56–6158
proton spin-lattice relaxation time in the rotating frame ðTH1rÞ was
obtained by varying spin-locking time followed by 1H acquisition. Thecontact time (tCT) and dephasing time (td) in CDP experiments were10 ms and 1.5 ms at 2 kHz and 3 kHz MAS frequencies. Differentcontact times for CP (tCP) and CDP (tCDP) were used to optimize theexperimental conditions. The repetition time NMR was 5 s for QCPand were 200 s and 400 s, respectively for DP/MAS NMR. Thenumbers of scans are 512. TSi
1 of different silicon atoms in POSS-Clwere measured by the saturation-recovery method.
For nanocomposites containing Ov-POSS (NP1 and NP2), theMAS frequencies was 3 kHz and repetition time and number ofscans for DP/MAS NMR were 200 s and 1024, respectively. In CDPexperiments, tCT was 5 ms and td was 1.5 ms, while the contact timefor CP (tCP) and CDP (tCDP) was 2 ms. TH
1r was determined by varyingspin-locking time followed by 13C detection via CP. The solution 1HNMR of nanocomposites was obtained in chloroform-d1.
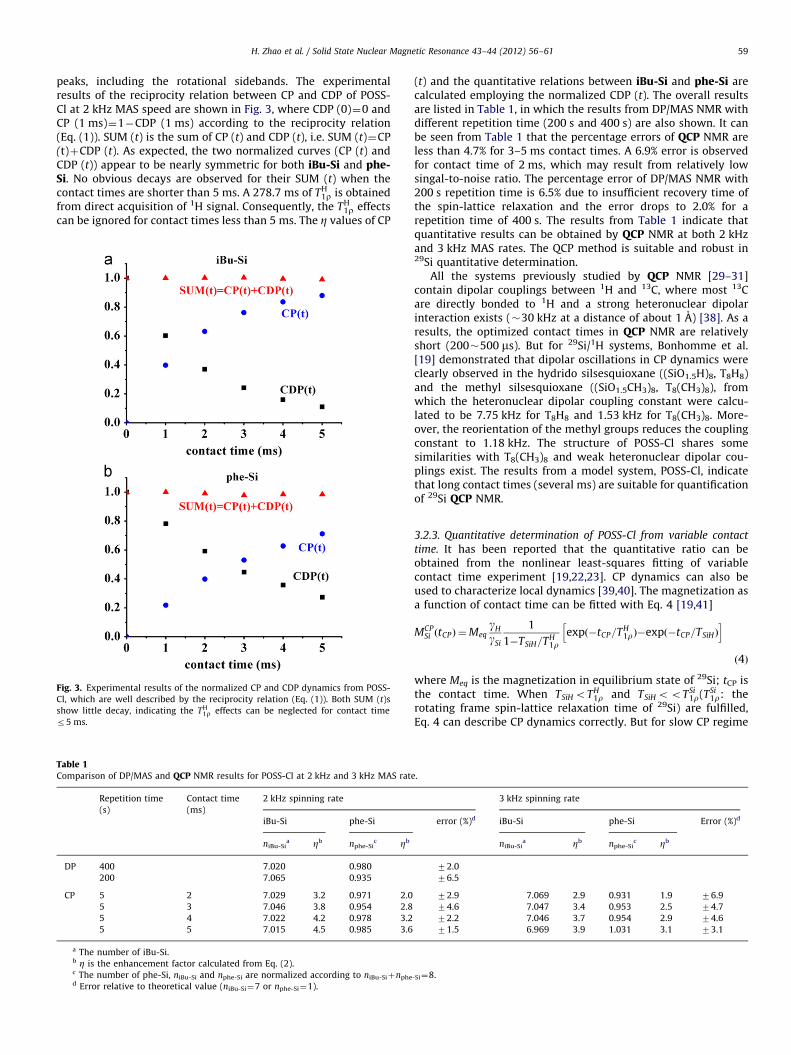
Fig. 2. 29Si DP/MAS NMR spectrum (a) and CP/MAS NMR spectra with different
contact time (b: 3 ms, c: 10 ms) of POSS-Cl.
3. Results and discussion
3.1. NMR method of QCP
The pulse sequence for CP/MAS NMR is shown in Fig. 1(a), wherestrong spin-locking RF fields, with a Hartmann–Hahn match condi-tion (gHBH¼gSiBSi) [16], are applied simultaneously on 1H and 29Si.During the contact time tCP, the polarization is transferred from 1Hto 29Si. In CDP experiment (Fig. 1(b)) [37], the 29Si magnetization iscreated by polarization transfer from the abundant 1H during tCT
firstly. It is then spin-locked during td while the 1H polarization iscompletely dephased due to strong 1H spin–spin interaction in theabsence of a spin-locking field. Cross depolarization occurs in tCDP
when 1H pulse is tuned on again. The depolarization processcorresponds to transferring polarization from 29Si to 1H. Due tothe symmetry of the Hamiltonians, CP and CDP form a perfect pair offorward and reverse polarization transfer experiments [28] and theirdynamics are associated with the reciprocity relation. The mainadvantage of CDP experiment lies in its quantitative dynamics witha normalized initial state CDP (0)¼1. With the reciprocity relation,the dynamics of CP (t) and Z value of CP can be derived.
According to the reciprocity relation
CPðtÞþCDPðtÞ ¼ 1 ð1Þ
where CP (t) and CDP (t) are the dynamics of CP and CDP,respectively. The TH
1r effect is neglected assuming that it is muchlonger than the contact time. From the reciprocity relation, onecan get the enhancement factor of CP
ZðtÞ ¼ 1�CDPðtÞ½ �gH
gSi
�������� ð2Þ
The CP/MAS NMR spectrum for a contact time t (tCP) iscollected, and the peak intensity is labeled as PI (t). Given theCP enhancement, the weighted (or comparable) intensity of CPsignal (WPI (t)) is obtained from the following equation:
WPIðtÞ ¼ PIðtÞ=ZðtÞ ð3Þ
From Eq. (2), the enhancement factor of CP can be obtainedfrom two CDP spectra, one with tCDP¼0 for reference (CDP (0)¼1)and the other tCDP¼t. All the signal intensities and the quantita-tive relations between different peaks in CP/MAS NMR spectrum(tCP¼t) can be conveniently achieved. For a longer contact time(tCP�T1r), TH
1r will affect the reciprocity relation. The relaxationcompensated reciprocity relation can be used in order to getbetter quantitative results [30].
3.2. The ratios between iBu-Si and phe-Si in POSS-Cl determined by
QCP NMR
3.2.1. Comparison of CP/MAS and DP/MAS NMR for POSS-Cl
POSS-Cl (Scheme 1a) is a single functional POSS in which seven R(organic) groups are inert isobutyl and the other are chloromethyl-phenyl that can be copolymerized to form inorganic–organic nano-composites, such as MMA [9] and C60 [32]. The Si atoms attached toisobutyl and chloromethylphenyl are labeled as iBu-Si and phe-Si,respectively. Fig. 2 shows the DP/MAS and CP/MAS NMR spectra ofthe POSS-Cl together with the assignments. The peak assigned toiBu-Si shows two isotropic chemical shifts, which are consistent tothat found in solution 29Si spectra [32–34]. This is caused byinequivalent silicon atoms in the system [1,21]. The crystal struc-tures of different (RSiO1.5)8 systems were reviewed by Cordeset al. [1]. The TSi
1 of iBu-Si and phe-Si are 42.2 s and 86.4 s. Butthe TH
1 obtained from 29Si CP/MAS peaks of iBu-Si and phe-Si are0.61 s and 0.57 s. Based on the large difference in relaxation times,QCP needs only about 1/48 of that by DP/MAS NMR for the samenumber of scans. In addition, it can be found from Fig. 2 that thesignal intensities of iBu-Si in CP/MAS NMR spectra are 3.9 times(tCP¼3 ms) and 4.9 times (tCP¼10 ms) of that in DP/MAS NMRspectrum, while the signal intensities of phe-Si in CP/MAS NMRspectra are 2.8 times (tCP¼3 ms) and 4.6 times (tCP¼10 ms) of thatin DP/MAS NMR spectrum. CP/MAS NMR alone improves the signal-to-noise ratio and shortens the experimental time, but the Z valuesof CP for different 29Si peaks are different at a same contact time,resulting in a loss of quantification.
3.2.2. Quantitative determination of POSS-Cl by QCP and DP/MAS
In the following quantitative analysis, the peak intensities ofiBu-Si and phe-Si signals are obtained by integrations of NMR
H. Zhao et al. / Solid State Nuclear Magnetic Resonance 43–44 (2012) 56–61 59
peaks, including the rotational sidebands. The experimentalresults of the reciprocity relation between CP and CDP of POSS-Cl at 2 kHz MAS speed are shown in Fig. 3, where CDP (0)¼0 andCP (1 ms)¼1�CDP (1 ms) according to the reciprocity relation(Eq. (1)). SUM (t) is the sum of CP (t) and CDP (t), i.e. SUM (t)¼CP(t)þCDP (t). As expected, the two normalized curves (CP (t) andCDP (t)) appear to be nearly symmetric for both iBu-Si and phe-Si. No obvious decays are observed for their SUM (t) when thecontact times are shorter than 5 ms. A 278.7 ms of TH
1r is obtainedfrom direct acquisition of 1H signal. Consequently, the TH
1r effectscan be ignored for contact times less than 5 ms. The Z values of CP
Fig. 3. Experimental results of the normalized CP and CDP dynamics from POSS-
Cl, which are well described by the reciprocity relation (Eq. (1)). Both SUM (t)s
show little decay, indicating the TH1r effects can be neglected for contact time
r5 ms.
Table 1Comparison of DP/MAS and QCP NMR results for POSS-Cl at 2 kHz and 3 kHz MAS rate
Repetition time
(s)
Contact time
(ms)
2 kHz spinning rate
iBu-Si phe-Si
niBu-Sia Zb nphe-Si
c Zb
DP 400 7.020 0.980
200 7.065 0.935
CP 5 2 7.029 3.2 0.971 2.0
5 3 7.046 3.8 0.954 2.8
5 4 7.022 4.2 0.978 3.2
5 5 7.015 4.5 0.985 3.6
a The number of iBu-Si.b Z is the enhancement factor calculated from Eq. (2).c The number of phe-Si, niBu-Si and nphe-Si are normalized according to niBu-Siþnphed Error relative to theoretical value (niBu-Si¼7 or nphe-Si¼1).
(t) and the quantitative relations between iBu-Si and phe-Si arecalculated employing the normalized CDP (t). The overall resultsare listed in Table 1, in which the results from DP/MAS NMR withdifferent repetition time (200 s and 400 s) are also shown. It canbe seen from Table 1 that the percentage errors of QCP NMR areless than 4.7% for 3–5 ms contact times. A 6.9% error is observedfor contact time of 2 ms, which may result from relatively lowsingal-to-noise ratio. The percentage error of DP/MAS NMR with200 s repetition time is 6.5% due to insufficient recovery time ofthe spin-lattice relaxation and the error drops to 2.0% for arepetition time of 400 s. The results from Table 1 indicate thatquantitative results can be obtained by QCP NMR at both 2 kHzand 3 kHz MAS rates. The QCP method is suitable and robust in29Si quantitative determination.
All the systems previously studied by QCP NMR [29–31]contain dipolar couplings between 1H and 13C, where most 13Care directly bonded to 1H and a strong heteronuclear dipolarinteraction exists (�30 kHz at a distance of about 1 A) [38]. As aresults, the optimized contact times in QCP NMR are relativelyshort (200�500 ms). But for 29Si/1H systems, Bonhomme et al.[19] demonstrated that dipolar oscillations in CP dynamics wereclearly observed in the hydrido silsesquioxane ((SiO1.5H)8, T8H8)and the methyl silsesquioxane ((SiO1.5CH3)8, T8(CH3)8), fromwhich the heteronuclear dipolar coupling constant were calcu-lated to be 7.75 kHz for T8H8 and 1.53 kHz for T8(CH3)8. More-over, the reorientation of the methyl groups reduces the couplingconstant to 1.18 kHz. The structure of POSS-Cl shares somesimilarities with T8(CH3)8 and weak heteronuclear dipolar cou-plings exist. The results from a model system, POSS-Cl, indicatethat long contact times (several ms) are suitable for quantificationof 29Si QCP NMR.
3.2.3. Quantitative determination of POSS-Cl from variable contact
time. It has been reported that the quantitative ratio can beobtained from the nonlinear least-squares fitting of variablecontact time experiment [19,22,23]. CP dynamics can also beused to characterize local dynamics [39,40]. The magnetization asa function of contact time can be fitted with Eq. 4 [19,41]
MCPSi ðtCPÞ ¼Meq
gH
gSi
1
1�TSiH=TH1r
expð�tCP=TH1rÞ�expð�tCP=TSiHÞ
h i
ð4Þ
where Meq is the magnetization in equilibrium state of 29Si; tCP isthe contact time. When TSiH oTH
1r and TSiH ooTSi1r(TSi
1r: therotating frame spin-lattice relaxation time of 29Si) are fulfilled,Eq. 4 can describe CP dynamics correctly. But for slow CP regime
.
3 kHz spinning rate
error (%)d iBu-Si phe-Si Error (%)d
niBu-Sia Zb nphe-Si
c Zb
72.0
76.5
72.9 7.069 2.9 0.931 1.9 76.9
74.6 7.047 3.4 0.953 2.5 74.7
72.2 7.046 3.7 0.954 2.9 74.6
71.5 6.969 3.9 1.031 3.1 73.1
-Si¼8.
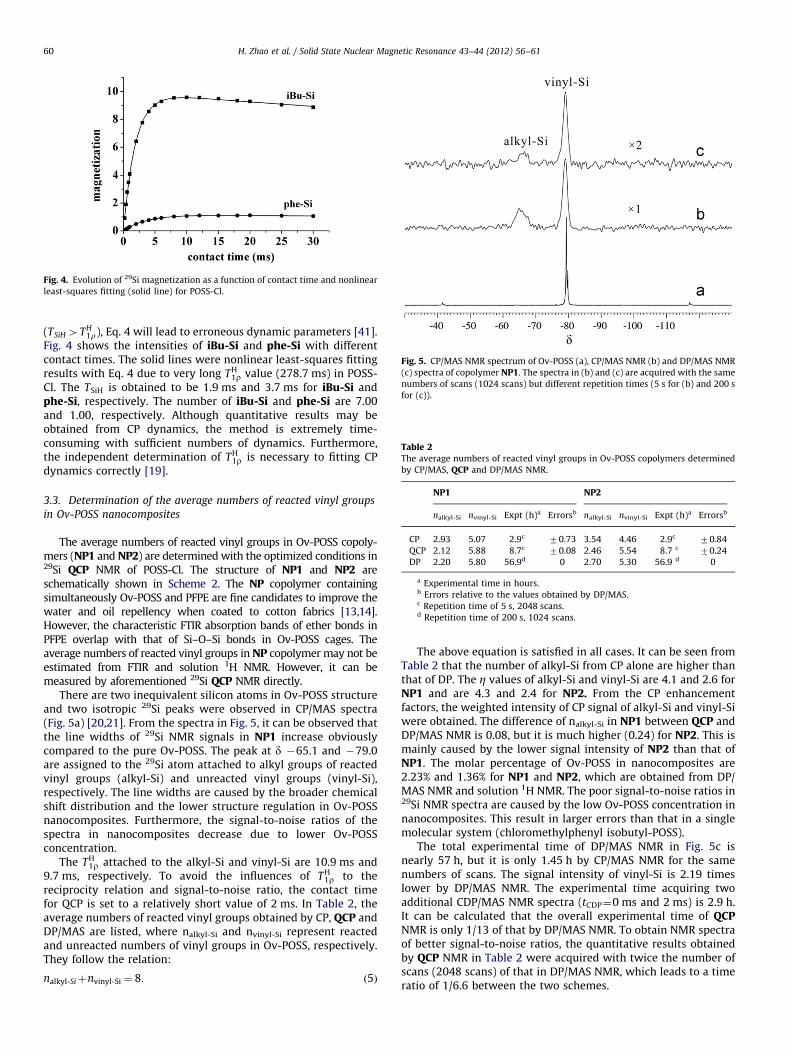
Fig. 4. Evolution of 29Si magnetization as a function of contact time and nonlinear
least-squares fitting (solid line) for POSS-Cl.
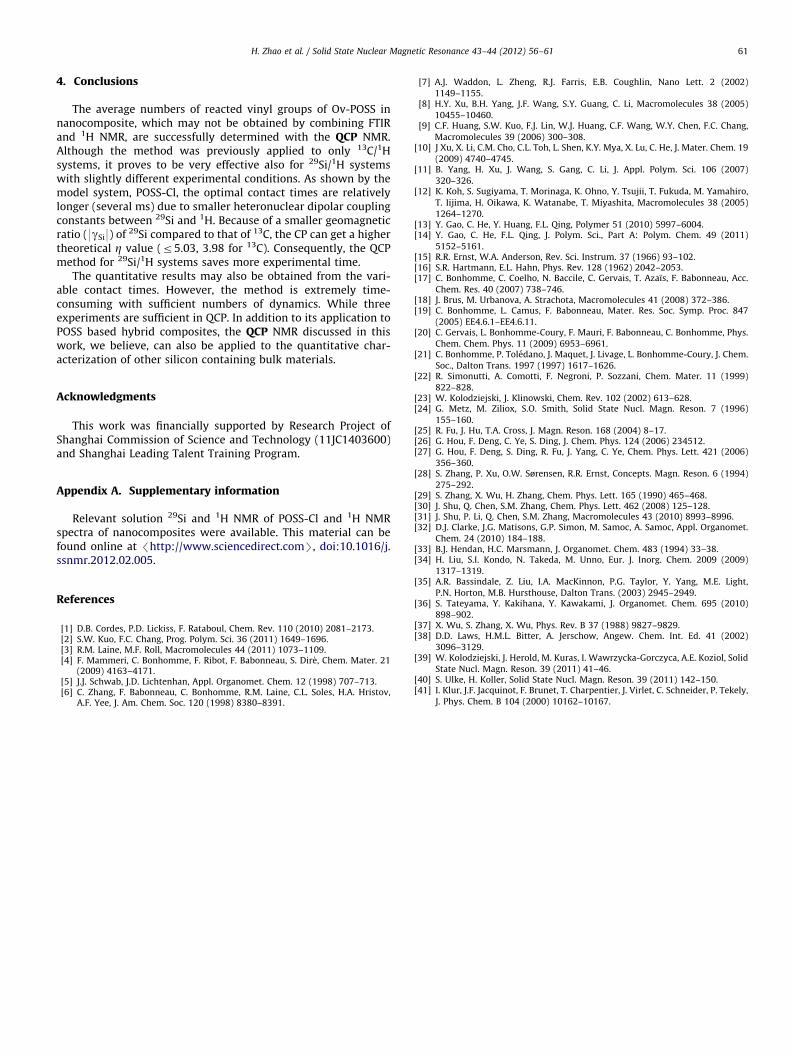
Fig. 5. CP/MAS NMR spectrum of Ov-POSS (a), CP/MAS NMR (b) and DP/MAS NMR
(c) spectra of copolymer NP1. The spectra in (b) and (c) are acquired with the same
numbers of scans (1024 scans) but different repetition times (5 s for (b) and 200 s
for (c)).
Table 2The average numbers of reacted vinyl groups in Ov-POSS copolymers determined
by CP/MAS, QCP and DP/MAS NMR.
NP1 NP2
nalkyl-Si nvinyl-Si Expt (h)a Errorsb nalkyl-Si nvinyl-Si Expt (h)a Errorsb
CP 2.93 5.07 2.9c 70.73 3.54 4.46 2.9c 70.84
QCP 2.12 5.88 8.7c 70.08 2.46 5.54 8.7 c 70.24
DP 2.20 5.80 56.9d 0 2.70 5.30 56.9 d 0
a Experimental time in hours.b Errors relative to the values obtained by DP/MAS.c Repetition time of 5 s, 2048 scans.d Repetition time of 200 s, 1024 scans.
H. Zhao et al. / Solid State Nuclear Magnetic Resonance 43–44 (2012) 56–6160
(TSiH 4TH1r), Eq. 4 will lead to erroneous dynamic parameters [41].
Fig. 4 shows the intensities of iBu-Si and phe-Si with differentcontact times. The solid lines were nonlinear least-squares fittingresults with Eq. 4 due to very long TH
1r value (278.7 ms) in POSS-Cl. The TSiH is obtained to be 1.9 ms and 3.7 ms for iBu-Si andphe-Si, respectively. The number of iBu-Si and phe-Si are 7.00and 1.00, respectively. Although quantitative results may beobtained from CP dynamics, the method is extremely time-consuming with sufficient numbers of dynamics. Furthermore,the independent determination of TH
1r is necessary to fitting CPdynamics correctly [19].
3.3. Determination of the average numbers of reacted vinyl groups
in Ov-POSS nanocomposites
The average numbers of reacted vinyl groups in Ov-POSS copoly-mers (NP1 and NP2) are determined with the optimized conditions in29Si QCP NMR of POSS-Cl. The structure of NP1 and NP2 areschematically shown in Scheme 2. The NP copolymer containingsimultaneously Ov-POSS and PFPE are fine candidates to improve thewater and oil repellency when coated to cotton fabrics [13,14].However, the characteristic FTIR absorption bands of ether bonds inPFPE overlap with that of Si–O–Si bonds in Ov-POSS cages. Theaverage numbers of reacted vinyl groups in NP copolymer may not beestimated from FTIR and solution 1H NMR. However, it can bemeasured by aforementioned 29Si QCP NMR directly.
There are two inequivalent silicon atoms in Ov-POSS structureand two isotropic 29Si peaks were observed in CP/MAS spectra(Fig. 5a) [20,21]. From the spectra in Fig. 5, it can be observed thatthe line widths of 29Si NMR signals in NP1 increase obviouslycompared to the pure Ov-POSS. The peak at d �65.1 and �79.0are assigned to the 29Si atom attached to alkyl groups of reactedvinyl groups (alkyl-Si) and unreacted vinyl groups (vinyl-Si),respectively. The line widths are caused by the broader chemicalshift distribution and the lower structure regulation in Ov-POSSnanocomposites. Furthermore, the signal-to-noise ratios of thespectra in nanocomposites decrease due to lower Ov-POSSconcentration.
The TH1r attached to the alkyl-Si and vinyl-Si are 10.9 ms and
9.7 ms, respectively. To avoid the influences of TH1r to the
reciprocity relation and signal-to-noise ratio, the contact timefor QCP is set to a relatively short value of 2 ms. In Table 2, theaverage numbers of reacted vinyl groups obtained by CP, QCP andDP/MAS are listed, where nalkyl-Si and nvinyl-Si represent reactedand unreacted numbers of vinyl groups in Ov-POSS, respectively.They follow the relation:
nalkyl-Siþnvinyl-Si ¼ 8: ð5Þ
The above equation is satisfied in all cases. It can be seen fromTable 2 that the number of alkyl-Si from CP alone are higher thanthat of DP. The Z values of alkyl-Si and vinyl-Si are 4.1 and 2.6 forNP1 and are 4.3 and 2.4 for NP2. From the CP enhancementfactors, the weighted intensity of CP signal of alkyl-Si and vinyl-Siwere obtained. The difference of nalkyl-Si in NP1 between QCP andDP/MAS NMR is 0.08, but it is much higher (0.24) for NP2. This ismainly caused by the lower signal intensity of NP2 than that ofNP1. The molar percentage of Ov-POSS in nanocomposites are2.23% and 1.36% for NP1 and NP2, which are obtained from DP/MAS NMR and solution 1H NMR. The poor signal-to-noise ratios in29Si NMR spectra are caused by the low Ov-POSS concentration innanocomposites. This result in larger errors than that in a singlemolecular system (chloromethylphenyl isobutyl-POSS).
The total experimental time of DP/MAS NMR in Fig. 5c isnearly 57 h, but it is only 1.45 h by CP/MAS NMR for the samenumbers of scans. The signal intensity of vinyl-Si is 2.19 timeslower by DP/MAS NMR. The experimental time acquiring twoadditional CDP/MAS NMR spectra (tCDP¼0 ms and 2 ms) is 2.9 h.It can be calculated that the overall experimental time of QCPNMR is only 1/13 of that by DP/MAS NMR. To obtain NMR spectraof better signal-to-noise ratios, the quantitative results obtainedby QCP NMR in Table 2 were acquired with twice the number ofscans (2048 scans) of that in DP/MAS NMR, which leads to a timeratio of 1/6.6 between the two schemes.
H. Zhao et al. / Solid State Nuclear Magnetic Resonance 43–44 (2012) 56–61 61
4. Conclusions
The average numbers of reacted vinyl groups of Ov-POSS innanocomposite, which may not be obtained by combining FTIRand 1H NMR, are successfully determined with the QCP NMR.Although the method was previously applied to only 13C/1Hsystems, it proves to be very effective also for 29Si/1H systemswith slightly different experimental conditions. As shown by themodel system, POSS-Cl, the optimal contact times are relativelylonger (several ms) due to smaller heteronuclear dipolar couplingconstants between 29Si and 1H. Because of a smaller geomagneticratio (9gSi9) of 29Si compared to that of 13C, the CP can get a highertheoretical Z value (r5.03, 3.98 for 13C). Consequently, the QCPmethod for 29Si/1H systems saves more experimental time.
The quantitative results may also be obtained from the vari-able contact times. However, the method is extremely time-consuming with sufficient numbers of dynamics. While threeexperiments are sufficient in QCP. In addition to its application toPOSS based hybrid composites, the QCP NMR discussed in thiswork, we believe, can also be applied to the quantitative char-acterization of other silicon containing bulk materials.
Acknowledgments
This work was financially supported by Research Project ofShanghai Commission of Science and Technology (11JC1403600)and Shanghai Leading Talent Training Program.
Appendix A. Supplementary information
Relevant solution 29Si and 1H NMR of POSS-Cl and 1H NMRspectra of nanocomposites were available. This material can befound online at /http://www.sciencedirect.comS, doi:10.1016/j.ssnmr.2012.02.005.
References
[1] D.B. Cordes, P.D. Lickiss, F. Rataboul, Chem. Rev. 110 (2010) 2081–2173.[2] S.W. Kuo, F.C. Chang, Prog. Polym. Sci. 36 (2011) 1649–1696.[3] R.M. Laine, M.F. Roll, Macromolecules 44 (2011) 1073–1109.[4] F. Mammeri, C. Bonhomme, F. Ribot, F. Babonneau, S. Dir�e, Chem. Mater. 21
(2009) 4163–4171.[5] J.J. Schwab, J.D. Lichtenhan, Appl. Organomet. Chem. 12 (1998) 707–713.[6] C. Zhang, F. Babonneau, C. Bonhomme, R.M. Laine, C.L. Soles, H.A. Hristov,
A.F. Yee, J. Am. Chem. Soc. 120 (1998) 8380–8391.
[7] A.J. Waddon, L. Zheng, R.J. Farris, E.B. Coughlin, Nano Lett. 2 (2002)1149–1155.
[8] H.Y. Xu, B.H. Yang, J.F. Wang, S.Y. Guang, C. Li, Macromolecules 38 (2005)
10455–10460.[9] C.F. Huang, S.W. Kuo, F.J. Lin, W.J. Huang, C.F. Wang, W.Y. Chen, F.C. Chang,
Macromolecules 39 (2006) 300–308.[10] J Xu, X. Li, C.M. Cho, C.L. Toh, L. Shen, K.Y. Mya, X. Lu, C. He, J. Mater. Chem. 19
(2009) 4740–4745.[11] B. Yang, H. Xu, J. Wang, S. Gang, C. Li, J. Appl. Polym. Sci. 106 (2007)
320–326.[12] K. Koh, S. Sugiyama, T. Morinaga, K. Ohno, Y. Tsujii, T. Fukuda, M. Yamahiro,
T. Iijima, H. Oikawa, K. Watanabe, T. Miyashita, Macromolecules 38 (2005)1264–1270.
[13] Y. Gao, C. He, Y. Huang, F.L. Qing, Polymer 51 (2010) 5997–6004.[14] Y. Gao, C. He, F.L. Qing, J. Polym. Sci., Part A: Polym. Chem. 49 (2011)
5152–5161.[15] R.R. Ernst, W.A. Anderson, Rev. Sci. Instrum. 37 (1966) 93–102.[16] S.R. Hartmann, E.L. Hahn, Phys. Rev. 128 (1962) 2042–2053.[17] C. Bonhomme, C. Coelho, N. Baccile, C. Gervais, T. Azaıs, F. Babonneau, Acc.
Chem. Res. 40 (2007) 738–746.[18] J. Brus, M. Urbanova, A. Strachota, Macromolecules 41 (2008) 372–386.[19] C. Bonhomme, L. Camus, F. Babonneau, Mater. Res. Soc. Symp. Proc. 847
(2005) EE4.6.1–EE4.6.11.[20] C. Gervais, L. Bonhomme-Coury, F. Mauri, F. Babonneau, C. Bonhomme, Phys.
Chem. Chem. Phys. 11 (2009) 6953–6961.[21] C. Bonhomme, P. Toledano, J. Maquet, J. Livage, L. Bonhomme-Coury, J. Chem.
Soc., Dalton Trans. 1997 (1997) 1617–1626.[22] R. Simonutti, A. Comotti, F. Negroni, P. Sozzani, Chem. Mater. 11 (1999)
822–828.[23] W. Kolodziejski, J. Klinowski, Chem. Rev. 102 (2002) 613–628.[24] G. Metz, M. Ziliox, S.O. Smith, Solid State Nucl. Magn. Reson. 7 (1996)
155–160.[25] R. Fu, J. Hu, T.A. Cross, J. Magn. Reson. 168 (2004) 8–17.[26] G. Hou, F. Deng, C. Ye, S. Ding, J. Chem. Phys. 124 (2006) 234512.[27] G. Hou, F. Deng, S. Ding, R. Fu, J. Yang, C. Ye, Chem. Phys. Lett. 421 (2006)
356–360.[28] S. Zhang, P. Xu, O.W. Sørensen, R.R. Ernst, Concepts. Magn. Reson. 6 (1994)
275–292.[29] S. Zhang, X. Wu, H. Zhang, Chem. Phys. Lett. 165 (1990) 465–468.[30] J. Shu, Q. Chen, S.M. Zhang, Chem. Phys. Lett. 462 (2008) 125–128.[31] J. Shu, P. Li, Q. Chen, S.M. Zhang, Macromolecules 43 (2010) 8993–8996.[32] D.J. Clarke, J.G. Matisons, G.P. Simon, M. Samoc, A. Samoc, Appl. Organomet.
Chem. 24 (2010) 184–188.[33] B.J. Hendan, H.C. Marsmann, J. Organomet. Chem. 483 (1994) 33–38.[34] H. Liu, S.I. Kondo, N. Takeda, M. Unno, Eur. J. Inorg. Chem. 2009 (2009)
1317–1319.[35] A.R. Bassindale, Z. Liu, I.A. MacKinnon, P.G. Taylor, Y. Yang, M.E. Light,
P.N. Horton, M.B. Hursthouse, Dalton Trans. (2003) 2945–2949.[36] S. Tateyama, Y. Kakihana, Y. Kawakami, J. Organomet. Chem. 695 (2010)
898–902.[37] X. Wu, S. Zhang, X. Wu, Phys. Rev. B 37 (1988) 9827–9829.[38] D.D. Laws, H.M.L. Bitter, A. Jerschow, Angew. Chem. Int. Ed. 41 (2002)
3096–3129.[39] W. Kolodziejski, J. Herold, M. Kuras, I. Wawrzycka-Gorczyca, A.E. Koziol, Solid
State Nucl. Magn. Reson. 39 (2011) 41–46.[40] S. Ulke, H. Koller, Solid State Nucl. Magn. Reson. 39 (2011) 142–150.[41] I. Klur, J.F. Jacquinot, F. Brunet, T. Charpentier, J. Virlet, C. Schneider, P. Tekely,
J. Phys. Chem. B 104 (2000) 10162–10167.