quantitative research restaurant menu labelling: is it...
TRANSCRIPT

e354 REVUE CANADIENNE DE SANTÉ PUBLIQUE • VOL. 105, NO. 5 © Canadian Public Health Association, 2014. All rights reserved.
Restaurant menu labelling: Is it worth adding sodium to the label?
Mary J. Scourboutakos, BSc,1 Paul N. Corey, PhD,2 Julio Mendoza, PhD,3 Spencer J. Henson, PhD,3
Mary R. L’Abbé, PhD1
ABSTRACT
OBJECTIVE: Several provincial and federal bills have recommended various forms of menu labelling that would require information beyond just calories;however, the additional benefit of including sodium information is unknown. The objective of this study was to determine whether sodium informationon menus helps consumers make lower-sodium choices and to understand what other factors influence the effect of menu labelling on consumers’ mealchoices.
METHODS: A total of 3,080 Canadian consumers completed an online survey that included a repeated measures experiment in which consumers wereasked to select what they would typically order from four mock-restaurant menus. Subsequently, consumers were randomly allocated to see one of threemenu-labelling treatments (calories; calories and sodium; or calories, sodium and serving size) and were given the option to change their order.
RESULTS: There was a significant difference in the proportion of consumers who changed their order, varying from 17% to 30%, depending on therestaurant type. After participants had seen menu labelling, sodium levels decreased in all treatments (p<0.0001). However, in three of the fourrestaurant types, consumers who saw calorie and sodium information ordered meals with significantly less sodium than consumers who saw only calorieinformation (p<0.01). Consumers who saw sodium labelling decreased the sodium level of their meal by an average of 171-384 mg, depending on therestaurant. In the subset of consumers who saw sodium information and chose to change their order, sodium levels decreased by an average of 681-1,360 mg, depending on the restaurant. Sex, intent to lose weight and the amount of calories ordered at baseline were the most importantpredictors of who used menu labelling. Eighty percent of survey panelists wanted to see nutrition information when dining out.
CONCLUSION: Including sodium information alongside calorie information may result in a larger decrease in the amount of sodium ordered byrestaurant-goers.
KEY WORDS: Restaurants; fast foods; food labelling; sodium
La traduction du résumé se trouve à la fin de l’article. Can J Public Health 2014;105(5):e354-e361.
In response to the growing obesity epidemic1 and the prevalenceof eating outside the home,2 restaurant menu labelling is a policybeing explored as a means to enable healthier choices when
people are eating out. In the United States, several jurisdictionshave enacted menu-labelling laws.3 Meanwhile, in Canada therehave been several unsuccessful bills at both the provincial andfederal level.4,5 Recently, Toronto Public Health recommendedlegislation requiring the mandatory disclosure of calorie andsodium information in large restaurant chains.6
Toronto Public Health’s recommendation differs from the menu-labelling laws enacted in New York City and proposed in the PatientProtection and Affordable Care Act (which includes the US’s federalmenu-labelling legislation),3 because it calls for the disclosure ofsodium levels in addition to calorie information. To date, only onecounty in Washington has a menu-labelling law that includesinformation beyond calories, by also requiring the disclosure ofsaturated fat, carbohydrate and sodium content,7 while anothercounty has a similar, voluntary program.8
The inclusion of sodium information is important becauseresearch on the nutritional quality of restaurant foods hasdemonstrated that sodium levels are alarmingly high, and there isa wide range of sodium levels among similar foods.9,10 Because ofthis variation, there is no way for the consumer to determine whichfoods are higher or lower in sodium. This is a concern as dietarysodium is the leading preventable risk factor for hypertension,11
which is the leading risk factor for death worldwide.12
Studies have shown that people prefer forms of menu labellingthat include information beyond just calories. For example,Mackison et al. found that 61% of consumers wanted to see sodiuminformation on menus.13
To date, there is no published research investigating the effect ofincluding sodium or serving size information on menus. Using arandomized controlled experiment embedded within an onlinesurvey, this study sought to answer the following researchquestions:1) Does the inclusion of sodium information on restaurant
menus result in lower-sodium choices?
Author Affiliations
1. Department of Nutritional Sciences, Faculty of Medicine, University of Toronto,Toronto, ON
2. Biostatistics Division, Dalla Lana School of Public Health, University of Toronto,Toronto, ON
3. Department of Food, Agricultural and Resource Economics, University of Guelph,Guelph, ON
Correspondence: Dr. Mary R. L’Abbe, Earle W. McHenry Professor, and Chair,Department of Nutritional Sciences, Faculty of Medicine, University of Toronto,FitzGerald Bldg, 150 College St, Rm 315, Toronto, ON M5S 3E2, Tel: 416-978-7235,Cell: 416-605-1902, E-mail: [email protected]: Mary J. Scourboutakos received funding from the VanierCanada Graduate Scholarship; Canadian Institutes of Health Research (CIHR)/CancerCare Ontario, Population Intervention for Chronic Disease Prevention Fellowship; andthe CIHR, Strategic Training Program in Public Health Policy. Mary R. L’ Abbé receivedfunding from the CIHR/Canadian Stroke Network Operating Grant Competition201103SOK; and the University of Toronto, Earle W. McHenry Chair unrestrictedresearch grant.Conflict of Interest: None to declare.
QUANTITATIVE RESEARCH
2) Does the inclusion of serving size information result in thechoice of meals with a lower calorie density (calories per 100 g)and/or a lower sodium density (sodium per 100 g)?
3) What factors (demographic factors, as well as the calorie andsodium content of consumers’ meal choice) influenceconsumers’ use of menu labelling?
METHODS
ParticipantsThe Canadian Consumer Monitor (CCM) panel was used for thisstudy. The CCM is a nationally representative consumer surveypanel. It was recruited by a professional recruiting company toreflect the Canadian population (according to 2006 Census data)for age, sex, education and region. Initially, 31,223 Canadian adultswere contacted by e-mail. Survey panelists were required to be theprimary household grocery shopper. An initial invitation toparticipate was sent to all panelists to collect data on theirdemographic characteristics; 6,665 provided informed consent andcompleted the baseline questionnaire. Beginning in 2010, 15-minute surveys were administered to the CCM panel every 8-10 weeks.14,15 Typically 2,500-7,000 consumers participated ineach survey. Because of attrition, 3,080 consumers participated inthis survey, which was administered in April 2012. Ethics approvalwas received from both the University of Toronto and theUniversity of Guelph’s research ethics boards. Before beingadministered to the CCM, the survey was pilot tested on a smallpanel of 255 consumers from Guelph, Ontario. The survey wasadministered using Snap 10 Professional Survey Software andWebhost (Snap Surveys, Portsmouth, NH).
Experimental design and survey structureA repeated measures randomized controlled experiment wasembedded within the survey. The experiment used a parallelwithin-subject design in which each consumer served as his or herown control. Each consumer was asked to make a selection fromeach of four different restaurant menus. After making a selection,consumers were randomly assigned to see one of three differenttypes of menu labelling (referred to as treatments): 1) calorielabelling (kcal), 2) calorie (kcal) and sodium labelling (mg),3) calorie (kcal), sodium (mg) and serving size labelling (g).Randomization was based on the timing within the minute whenthe panelist started the survey. After randomization, consumerswere shown the same series of menus labelled with nutritioninformation according to the consumer’s treatment allocation, andwere given the option to change their order. This enabled pre-postcomparisons, so that panelists who were influenced by theinformation and chose to change their order could be analyzedseparately from those who did not change their order. Similarmethods have been used in previous studies with separate analysisof consumers who reported using the information and those whoreported not doing so.16,17
In addition, at the beginning of the survey, consumers were askedabout their frequency of eating out and whether they were tryingto lose weight. At the end of the survey, consumers were askedwhether the nutrition information they saw influenced what theyordered (with the option of answering yes, somewhat or no) andwere given an open-ended response field to explain why.
Restaurant menusFour restaurant scenarios were tested in the survey: a fast-foodhamburger restaurant, a sit-down breakfast restaurant, a sub shop anda sit-down dinner restaurant (Supplemental Figure 1). The restaurantmenus were adapted from actual Canadian chain restaurant menusand were selected because they had a large range of menu offerings,including both high- and low-calorie and sodium options. Multipleversions of each menu were created to reflect each of the treatments:no information; calorie labelling; calorie and sodium labelling; calorie,sodium and serving size labelling (Supplemental Figure 2). The calorie,sodium and serving size information on the menu was based on therestaurant’s nutrition information disclosed online in 2010 and wasretrieved from the University of Toronto’s restaurant database;however, the restaurant’s identity was not revealed to consumers.18
The labelled menus also provided consumers with information aboutthe daily recommended amount of calories (2,000 kcal) and the uppertolerable intake for sodium (2,300 mg), as previous research hasdemonstrated the added benefit of including contextual statementswith daily reference amounts.16
TreatmentsThree menu-labelling treatments were tested in this survey. Calorielabelling was tested because it is the most common form of menulabelling.19, 20 Calorie and sodium labelling was tested because TorontoPublic Health has recently recommended the disclosure of calorie andsodium information on restaurant menus.6 The third treatment,which includes calorie, sodium and serving size labelling, was usedto determine whether the addition of serving size information helpsconsumers choose meals with a lower calorie and/or sodium density.
Data analysisThe primary outcome was the difference in nutrient levels amongtreatments before versus after labelling information had been seen.
CANADIAN JOURNAL OF PUBLIC HEALTH • SEPTEMBER/OCTOBER 2014 e355
RESTAURANT MENU LABELLING
Table 1. Demographic characteristics of the panelists in thestudy
Sample characteristic* Value
Sample size (n) 3080Age range (years), n (%)
20-29 199 (7)30-39 472 (15)40-49 761 (25)50-59 891 (29)60-69 737 (24)
Sex, n (%)M 1012 (33)F 2058 (67)
Education, n (%)High school or less 622 (20)Trades 306 (10)College 1033 (34)University 1099 (36)
Frequency of eating at fast-food restaurants, n (%)Never 161 (5)Infrequently (once per month or less) 246 (8)Semi-frequently (once per week) 778 (25)Frequently (more than once per week) 1892 (61)
Frequency of eating at sit-down restaurants, n (%)Never 33 (1)Infrequently (once per month or less) 321 (10)Semi-frequently (once per week) 932 (30)Frequently (more than once per week) 1787 (58)
Reported trying to lose weight, n (%) 1525 (50)
* Some demographic data were missing for certain variables (sex, 10 missing;education, 20; age, 20; frequency of eating fast food, 3; frequency ofeating at sit-down restaurants, 7; trying to lose weight, 25. Only 9 peoplesaid that they never ate out at sit-down or fast-food restaurants.
Secondary outcomes were differences in the subset of panelists whoopted to change their order, the effect of serving size labelling on thenutrient density of meals ordered and demographic influences onmenu labelling. The analysis included both complete and incompletesurveys. Mean±SE for calories, sodium and serving size of mealsordered by consumers before and after seeing menu labelling werecalculated. Because the data were not normally distributed, MonteCarlo simulations of the exact p values were used to compare nutrientlevels before and after seeing labelling. For the subset of panelistswho changed their order, t-tests were used to compare treatment oneand treatment two and paired t-tests were used to compare the levelsbefore and after seeing menu labelling. Panelists did not necessarilychange their order in all four restaurants. Therefore, data for thesubset of panelists who changed their order is reported separately foreach restaurant. Odds ratios were used to compare the proportion ofconsumers who changed their order in each restaurant and eachtreatment. Analysis of variance was used to compare the caloriedensity, sodium density and serving size of meals ordered byconsumers in different treatments.
To explore the role of socio-demographic factors on the effect ofmenu labelling, the following predictors (age, sex, education,
frequency of eating out, intent to lose weight, treatment andrestaurant) were tested in a repeated measures logistic regression(using Proc Genmod). Separate models were constructed for eachinteraction term, and because there was interaction between therestaurant scenario and some demographic predictors, a separatemodel was constructed for each restaurant. An additional modelwas constructed that incorporated income and body mass index(BMI) data collected in the baseline questionnaire. Key themes inthe open-ended questions were identified, and responses werecoded and quantified. Some responses were classified as havingmore than one theme. Only themes mentioned by a minimum of5% of consumers were reported. Statistical analyses were conductedusing SAS version 9.3 software (SAS Institute Inc., Cary, NorthCarolina, 2010).
RESULTS
ParticipantsA total of 3,080 panelists participated in the survey; their baselinecharacteristics are reported in Table 1. More than 85% ofrespondents reported eating out at least once a week.
e356 REVUE CANADIENNE DE SANTÉ PUBLIQUE • VOL. 105, NO. 5
RESTAURANT MENU LABELLING
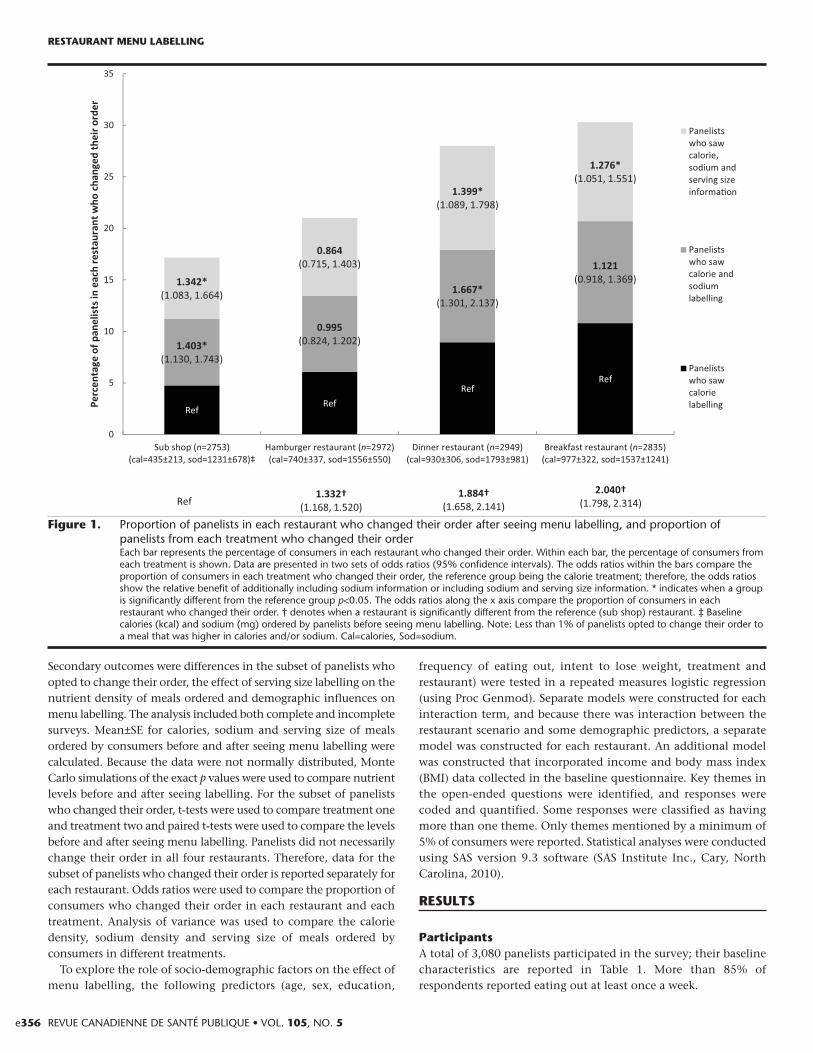
Figure 1. Proportion of panelists in each restaurant who changed their order after seeing menu labelling, and proportion ofpanelists from each treatment who changed their orderEach bar represents the percentage of consumers in each restaurant who changed their order. Within each bar, the percentage of consumers fromeach treatment is shown. Data are presented in two sets of odds ratios (95% confidence intervals). The odds ratios within the bars compare theproportion of consumers in each treatment who changed their order, the reference group being the calorie treatment; therefore, the odds ratiosshow the relative benefit of additionally including sodium information or including sodium and serving size information. * indicates when a groupis significantly different from the reference group p<0.05. The odds ratios along the x axis compare the proportion of consumers in eachrestaurant who changed their order. † denotes when a restaurant is significantly different from the reference (sub shop) restaurant. ‡ Baselinecalories (kcal) and sodium (mg) ordered by panelists before seeing menu labelling. Note: Less than 1% of panelists opted to change their order toa meal that was higher in calories and/or sodium. Cal=calories, Sod=sodium.
CANADIAN JOURNAL OF PUBLIC HEALTH • SEPTEMBER/OCTOBER 2014 e357
RESTAURANT MENU LABELLING
Tab
le 2
.C
omp
aris
on o
f the
cal
orie
and
sod
ium
con
tent
of m
eals
ord
ered
by
pan
elis
ts w
ho s
aw c
alor
ie o
r ca
lorie
and
sod
ium
labe
lling
Cal
ori
es (
kca
l)So
diu
m (
mg
)R
esta
ura
nt
Typ
e o
f n
Bef
ore
see
ing
men
u
Aft
er s
eein
g
Ch
ang
e:
Bef
ore
see
ing
men
u
Aft
er s
eein
g
Ch
ang
e:
lab
elli
ng
lab
elli
ng
(b
asel
ine)
men
u l
abel
lin
gb
efo
re v
s.
lab
elli
ng
(b
asel
ine)
men
u l
abel
lin
gb
efo
re v
s.
afte
r se
ein
g
afte
r se
ein
g
Mea
n±
SE
Mea
n±
SE
men
u
Mea
n±SE
M
ean
±SE
m
enu
lab
elli
ng
(M
edia
n)I
QR
(Med
ian
)IQ
Rla
bel
lin
g
(Med
ian
)IQ
R(M
edia
n)I
QR
All
pan
elis
tsH
ambu
rger
Cal
orie
1041
731±
10 (
656)
505-
920
657±
10 (
600)
410-
800
–74*
1545
±17
(149
5)13
10-1
750
1452
±15
(143
5)11
95,1
580
–-93
*‡C
alor
ie +
sod
ium
939
737±
11 (
690)
510-
940
653±
11 (
610)
410-
820
–84*
1531
±18
(151
0)13
00-1
750
1360
±19
(136
5)97
5-15
75–1
71*
Brea
kfas
tC
alor
ie99
896
8±10
(96
0)57
0-12
3279
3±10
(58
0)56
0-11
10–1
75*†
1504
±38
(130
0)77
0-15
9812
49±3
3 (8
90)6
30-1
598
–255
*C
alor
ie +
sod
ium
899
980±
11 (
960)
580-
1232
828±
11 (
690)
560-
1190
–152
*15
66±4
3 (1
300)
770-
1598
1226
±35
(890
)600
-159
8–3
40*
Sub
shop
Cal
orie
970
434±
6 (3
70)2
82-5
3240
2±6
(310
)282
-510
–32*
1247
±22
(980
)900
-152
011
91±2
1 (9
80)9
00-1
360
–56*
§C
alor
ie +
sod
ium
868
432±
7 (3
70)2
82-5
3239
0±6
(310
)280
-480
–42*
1203
±23
(970
)820
-136
010
69±2
1 (9
20)7
00-1
260
–134
*
Din
ner
Cal
orie
1034
937±
9 (9
77)6
42-1
170
816±
9 (7
31)5
52-1
094
–121
*18
11±3
0 (1
807)
1039
-238
415
21±3
0 (1
482)
637-
2133
–290
*†C
alor
ie +
sod
ium
933
917±
10 (
969)
574-
1143
798±
10 (
720)
532-
1090
–119
*17
73±3
3 (1
770)
974-
2360
1389
±32
(112
9)51
0-20
21–3
84*
Subs
et o
f H
ambu
rger
Cal
orie
204
858±
23 (
840)
580-
1030
485±
16 (
415)
350-
615
–373
*17
37±4
4 (1
560)
1370
-198
512
66±2
7 (1
335)
1127
-153
5–4
71*§
pan
elis
ts
Cal
orie
+ s
odiu
m23
878
3±22
(72
0)54
0-99
044
7±14
(42
0)34
0-57
0–3
36*
1637
±34
(156
0)14
20-1
915
956±
28 (
955)
700-
1300
–681
*w
ho
chan
ged
Brea
kfas
tC
alor
ie36
911
33±1
2 (1
232)
960-
1232
659±
14 (
570)
450-
690
–474
*18
20±6
9 (1
598)
1130
-159
811
26±5
2 (8
90)6
30-1
300
–694
*th
eir
orde
r C
alor
ie +
sod
ium
322
1115
±15
(123
2)95
0-12
3268
5±15
(57
0)56
0-74
0–4
30*
1955
±84
(159
8)11
10-1
598
996±
56 (
630)
600-
890
–959
*af
ter
seei
ng
Sub
shop
Cal
orie
136
591±
19 (
532)
480-
600
361±
13 (
290)
280-
375
–230
*15
18±6
7 (1
260)
920-
1830
1122
±44
(980
)900
-124
0–3
96*§
labe
lled
Cal
orie
+ s
odiu
m18
852
7±17
(51
0)37
0-58
033
1±9
(310
)280
-310
–196
*14
79±5
2 (1
260)
920-
1830
853±
31 (
700)
700-
970
–-62
6*m
enus
Din
ner
Cal
orie
282
1079
±14
(112
0)92
0-11
9363
6±12
(57
4)51
4-69
4–4
43*
2181
±47
(213
3)16
71-2
921
1112
±44
(974
)510
-161
1–1
069*
§C
alor
ie +
sod
ium
263
1034
±16
(109
3)90
0-11
9261
1±11
(55
3)51
4-67
8–4
23*
2206
±51
(213
3)16
11-2
921
846±
37 (
541)
475-
1185
–136
0*
*In
dica
tes
a p
valu
e th
at is
less
tha
n th
e Bo
nfer
roni
adj
uste
d ex
per
imen
t-w
ise
cut
poi
nt o
f 0.0
016.
†In
dica
tes
a si
gnifi
cant
diff
eren
ce b
etw
een
trea
tmen
ts, p
<0.0
1; ‡
rep
rese
nts
p<0.
001;
§ r
epre
sent
s p<
0.00
01.
IQR=
inte
rqua
rtile
ran
ge.
Dat
a w
ere
anal
yzed
usi
ng M
onte
Car
lo s
imul
atio
ns o
f exa
ct p
valu
es fo
r th
e an
alys
is o
f all
pan
elis
ts o
n w
hom
the
dat
a w
ere
skew
ed a
nd u
sing
pai
red
t te
sts
for
the
eval
uatio
n of
the
sub
set
of p
anel
ists
who
cho
seto
cha
nge
thei
r or
der.
Not
e: P
anel
ists
did
not
nec
essa
rily
chan
ge in
all
four
res
taur
ants
. The
refo
re t
his
tabl
e se
par
atel
y ill
ustr
ates
dat
a fo
r th
e p
anel
ists
who
cha
nged
the
ir or
der
in e
ach
rest
aura
nt. D
ata
for
trea
tmen
t 3
(incl
udin
gca
lorie
s, s
odiu
m a
nd s
ervi
ng s
ize
data
) w
ere
not
rep
orte
d he
re b
ecau
se in
mos
t ca
ses
the
resu
lts w
ere
sim
ilar
to t
hose
of t
reat
men
t 2
with
reg
ard
to t
he b
enef
it of
incl
udin
g so
dium
. Tab
le 3
pre
sent
s da
ta fr
omtr
eatm
ent
3 in
rel
atio
n to
the
res
earc
h q
uest
ion
it is
mea
nt t
o an
swer
.
Tab
le 3
.C
omp
aris
on o
f the
ser
ving
siz
e, c
alor
ie d
ensi
ty a
nd s
odiu
m d
ensi
ty o
rder
ed a
fter
see
ing
men
u la
belli
ng a
mon
g th
ose
who
op
ted
to c
hang
e th
eir
orde
r
Serv
ing
siz
eC
alo
rie
den
sity
Sod
ium
den
sity
Men
u-l
abel
lin
g c
on
dit
ion
Men
u-l
abel
lin
g c
on
dit
ion
Men
u-l
abel
lin
g c
on
dit
ion
Mea
n±
SEM
ean
±SE
Mea
n±SE
(Med
ian
) In
terq
uar
tile
ran
ge
(Med
ian
) In
terq
uar
tile
ran
ge
(Med
ian
) In
terq
uar
tile
ran
ge
nC
al*
Cal
+So
d†
Cal
+So
d+
SS‡
pC
alC
al+
Sod
Cal
+So
d+
SSp
Cal
Cal
+So
dC
al+So
d+SS
pBr
eakf
ast
455±
6a46
8±7a
472±
7a14
3±1a
144±
1a14
6±1a
230±
7a20
2±7b
205±
7b
rest
aura
nt98
8(4
99)3
27-5
04(4
49)4
06-5
04(4
49)4
06-5
040.
14(1
37)1
25-1
66(1
38)1
25-1
61(1
38)1
25-1
610.
25(1
93)1
77-2
73(1
77)1
34-1
93(1
76)1
34-1
930.
005
Sub
shop
273±
8a24
6±6a
257±
8a13
2±1a
134±
1a13
3±1a
403±
6a33
7±6b
341±
6b
478
(233
)226
-255
(233
)226
-236
(233
)226
-236
0.04
(125
)142
-134
(133
)125
-136
(133
)125
-136
0.26
(429
)398
-442
(300
)243
-429
(300
) 24
3-42
90.
0001
Din
ner
408±
7a40
4±7a
387±
7a16
4±3a
160±
3ab17
9±3c
272±
9a20
7±8b
224±
8b
rest
aura
nt85
3(4
03)3
19-4
83(4
14)3
13-4
83(3
83)2
73-4
830.
09(1
62)1
13-1
99(1
64)1
13-2
05(1
91)1
29-2
180.
0001
(260
)108
-394
(115
)104
-307
(174
)108
-311
0.00
01
*C
al=c
alor
ie la
belli
ng t
reat
men
t; †
Cal
+Sod
=cal
orie
and
sod
ium
labe
lling
tre
atm
ent;
‡ C
al+S
od+S
S=ca
lorie
, sod
ium
and
ser
ving
siz
e la
belli
ng t
reat
men
t. T
he n
rep
rese
nts
only
tho
se w
ho c
hang
ed t
heir
orde
ran
d it
incl
udes
pan
elis
ts fr
om a
ll th
ree
trea
tmen
ts.
a,b,
cVa
lues
with
diff
eren
t al
pha
betic
al s
uper
scrip
ts a
re s
igni
fican
tly d
iffer
ent.
Not
e: A
pva
lue
that
is le
ss t
han
the
Bonf
erro
ni a
djus
ted
exp
erim
ent-
wis
e cu
t p
oint
of 0
.006
can
be
cons
ider
ed s
igni
fican
t.H
ambu
rger
res
taur
ant
data
wer
e no
t an
alyz
ed b
ecau
se t
he b
ever
ages
offe
red
pre
vent
ed t
he p
rop
er c
alcu
latio
n of
cal
orie
and
sod
ium
den
sity
.
Proportion of consumers who changed their order afterseeing nutrition informationFigure 1 shows the proportion of consumers, within each restauranttype, who changed their order after seeing labelled menus. Therewas a significant difference among restaurants, ranging from 17%in the sub shop to 30% in the breakfast restaurant. There was alsoa significant difference in the proportion of consumers in eachtreatment who changed their order. In the sub shop, dinnerrestaurant and breakfast restaurant scenarios, consumers who sawmore information (serving size and/or sodium) were significantly(p<0.05) more likely to change their order than consumers whoonly saw calorie information.
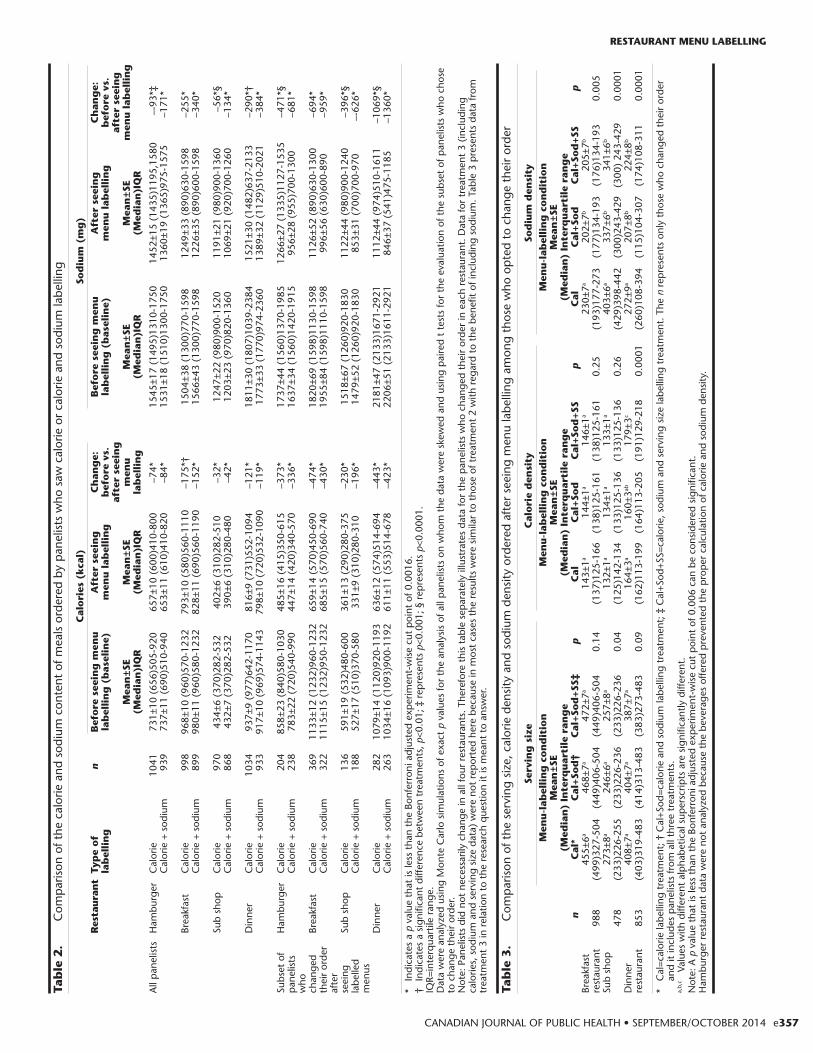
Sodium level of meals ordered before versus after seeinglabelled menus (all consumers)Table 2 shows the average calorie and sodium level of meals orderedbefore and after seeing labelled menus. Sodium levels decreased inall treatments (p<0.0001). However, in three of the four restaurantscenarios, consumers who saw calorie and sodium informationordered meals with significantly less sodium than consumers whosaw only calorie information (p<0.01). The average decrease insodium ranged from 56 to 290 mg among panelists who saw calorielabelling and from 134 to 384 mg among panelists who saw calorieand sodium labelling.
Sodium level of meals ordered before versus after seeinglabelled menus (subset of consumers who changed theirorder)Table 2 shows the average calorie and sodium levels of meals orderedbefore and after panelists saw menu labelling in the subset who choseto change their order. In the hamburger, breakfast, sub and dinnerrestaurants, the average difference in sodium ordered before versusafter seeing labelling was 471, 694, 396 and 1,069 mg respectivelyamong consumers who saw only calorie information and 681, 959,626 and 1,360 mg respectively among consumers who saw calorie andsodium information.
Effect of serving size information on the calorie andsodium density of consumers’ choicesConsumers who saw serving size information did not order mealswith a lower calorie or sodium density compared with consumerswho did not see serving size information (Table 3).
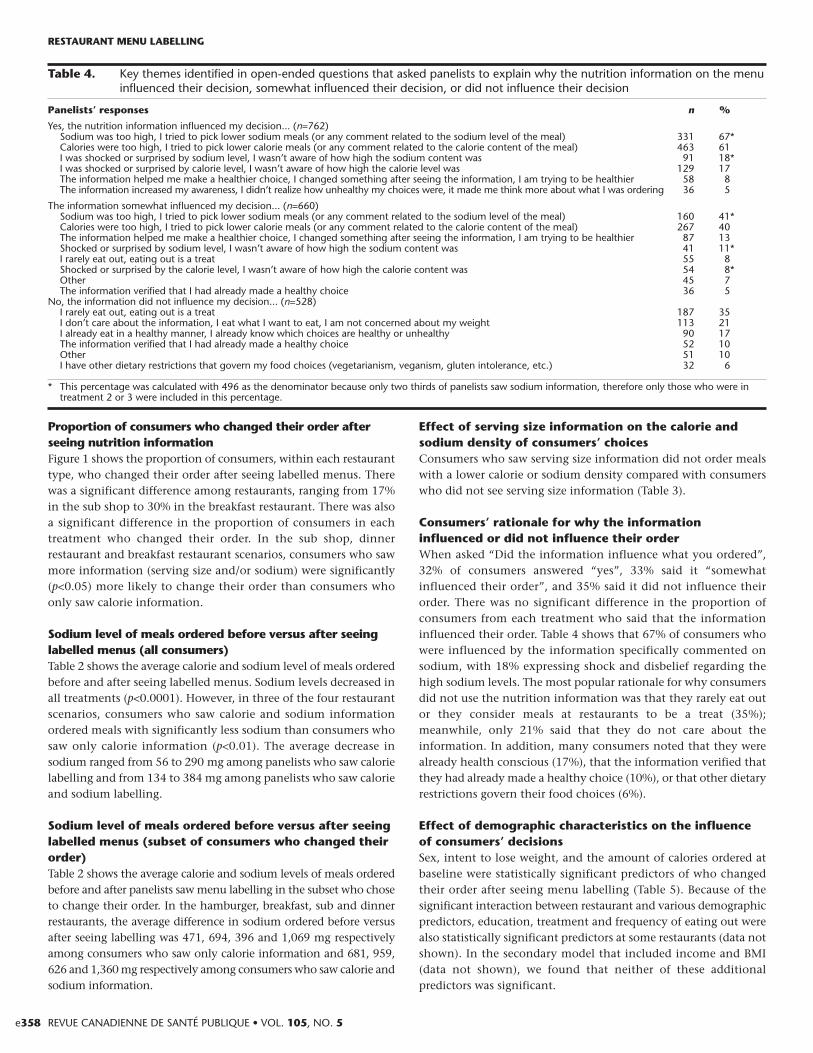
Consumers’ rationale for why the informationinfluenced or did not influence their orderWhen asked “Did the information influence what you ordered”,32% of consumers answered “yes”, 33% said it “somewhatinfluenced their order”, and 35% said it did not influence theirorder. There was no significant difference in the proportion ofconsumers from each treatment who said that the informationinfluenced their order. Table 4 shows that 67% of consumers whowere influenced by the information specifically commented onsodium, with 18% expressing shock and disbelief regarding thehigh sodium levels. The most popular rationale for why consumersdid not use the nutrition information was that they rarely eat outor they consider meals at restaurants to be a treat (35%);meanwhile, only 21% said that they do not care about theinformation. In addition, many consumers noted that they werealready health conscious (17%), that the information verified thatthey had already made a healthy choice (10%), or that other dietaryrestrictions govern their food choices (6%).
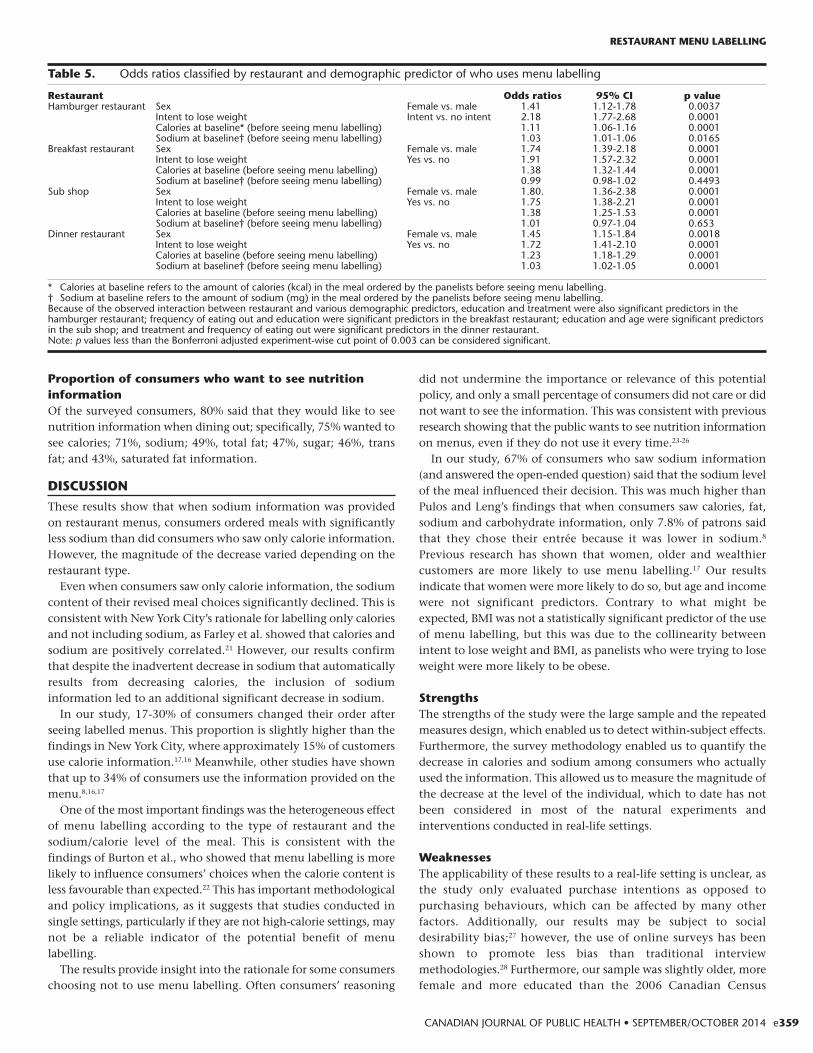
Effect of demographic characteristics on the influenceof consumers’ decisionsSex, intent to lose weight, and the amount of calories ordered atbaseline were statistically significant predictors of who changedtheir order after seeing menu labelling (Table 5). Because of thesignificant interaction between restaurant and various demographicpredictors, education, treatment and frequency of eating out werealso statistically significant predictors at some restaurants (data notshown). In the secondary model that included income and BMI(data not shown), we found that neither of these additionalpredictors was significant.
e358 REVUE CANADIENNE DE SANTÉ PUBLIQUE • VOL. 105, NO. 5
RESTAURANT MENU LABELLING
Table 4. Key themes identified in open-ended questions that asked panelists to explain why the nutrition information on the menuinfluenced their decision, somewhat influenced their decision, or did not influence their decision
Panelists’ responses n %
Yes, the nutrition information influenced my decision... (n=762)Sodium was too high, I tried to pick lower sodium meals (or any comment related to the sodium level of the meal) 331 67*Calories were too high, I tried to pick lower calorie meals (or any comment related to the calorie content of the meal) 463 61I was shocked or surprised by sodium level, I wasn’t aware of how high the sodium content was 91 18*I was shocked or surprised by calorie level, I wasn’t aware of how high the calorie level was 129 17The information helped me make a healthier choice, I changed something after seeing the information, I am trying to be healthier 58 8The information increased my awareness, I didn’t realize how unhealthy my choices were, it made me think more about what I was ordering 36 5
The information somewhat influenced my decision... (n=660)Sodium was too high, I tried to pick lower sodium meals (or any comment related to the sodium level of the meal) 160 41*Calories were too high, I tried to pick lower calorie meals (or any comment related to the calorie content of the meal) 267 40The information helped me make a healthier choice, I changed something after seeing the information, I am trying to be healthier 87 13Shocked or surprised by sodium level, I wasn’t aware of how high the sodium content was 41 11*I rarely eat out, eating out is a treat 55 8Shocked or surprised by the calorie level, I wasn’t aware of how high the calorie content was 54 8*Other 45 7The information verified that I had already made a healthy choice 36 5
No, the information did not influence my decision... (n=528)I rarely eat out, eating out is a treat 187 35I don’t care about the information, I eat what I want to eat, I am not concerned about my weight 113 21I already eat in a healthy manner, I already know which choices are healthy or unhealthy 90 17The information verified that I had already made a healthy choice 52 10Other 51 10I have other dietary restrictions that govern my food choices (vegetarianism, veganism, gluten intolerance, etc.) 32 6
* This percentage was calculated with 496 as the denominator because only two thirds of panelists saw sodium information, therefore only those who were intreatment 2 or 3 were included in this percentage.
Proportion of consumers who want to see nutritioninformationOf the surveyed consumers, 80% said that they would like to seenutrition information when dining out; specifically, 75% wanted tosee calories; 71%, sodium; 49%, total fat; 47%, sugar; 46%, transfat; and 43%, saturated fat information.
DISCUSSION
These results show that when sodium information was providedon restaurant menus, consumers ordered meals with significantlyless sodium than did consumers who saw only calorie information.However, the magnitude of the decrease varied depending on therestaurant type.
Even when consumers saw only calorie information, the sodiumcontent of their revised meal choices significantly declined. This isconsistent with New York City’s rationale for labelling only caloriesand not including sodium, as Farley et al. showed that calories andsodium are positively correlated.21 However, our results confirmthat despite the inadvertent decrease in sodium that automaticallyresults from decreasing calories, the inclusion of sodiuminformation led to an additional significant decrease in sodium.
In our study, 17-30% of consumers changed their order afterseeing labelled menus. This proportion is slightly higher than thefindings in New York City, where approximately 15% of customersuse calorie information.17,16 Meanwhile, other studies have shownthat up to 34% of consumers use the information provided on themenu.8,16,17
One of the most important findings was the heterogeneous effectof menu labelling according to the type of restaurant and thesodium/calorie level of the meal. This is consistent with thefindings of Burton et al., who showed that menu labelling is morelikely to influence consumers’ choices when the calorie content isless favourable than expected.22 This has important methodologicaland policy implications, as it suggests that studies conducted insingle settings, particularly if they are not high-calorie settings, maynot be a reliable indicator of the potential benefit of menulabelling.
The results provide insight into the rationale for some consumerschoosing not to use menu labelling. Often consumers’ reasoning
did not undermine the importance or relevance of this potentialpolicy, and only a small percentage of consumers did not care or didnot want to see the information. This was consistent with previousresearch showing that the public wants to see nutrition informationon menus, even if they do not use it every time.23-26
In our study, 67% of consumers who saw sodium information(and answered the open-ended question) said that the sodium levelof the meal influenced their decision. This was much higher thanPulos and Leng’s findings that when consumers saw calories, fat,sodium and carbohydrate information, only 7.8% of patrons saidthat they chose their entrée because it was lower in sodium.8
Previous research has shown that women, older and wealthiercustomers are more likely to use menu labelling.17 Our resultsindicate that women were more likely to do so, but age and incomewere not significant predictors. Contrary to what might beexpected, BMI was not a statistically significant predictor of the useof menu labelling, but this was due to the collinearity betweenintent to lose weight and BMI, as panelists who were trying to loseweight were more likely to be obese.
StrengthsThe strengths of the study were the large sample and the repeatedmeasures design, which enabled us to detect within-subject effects.Furthermore, the survey methodology enabled us to quantify thedecrease in calories and sodium among consumers who actuallyused the information. This allowed us to measure the magnitude ofthe decrease at the level of the individual, which to date has notbeen considered in most of the natural experiments andinterventions conducted in real-life settings.
WeaknessesThe applicability of these results to a real-life setting is unclear, asthe study only evaluated purchase intentions as opposed topurchasing behaviours, which can be affected by many otherfactors. Additionally, our results may be subject to socialdesirability bias;27 however, the use of online surveys has beenshown to promote less bias than traditional interviewmethodologies.28 Furthermore, our sample was slightly older, morefemale and more educated than the 2006 Canadian Census
CANADIAN JOURNAL OF PUBLIC HEALTH • SEPTEMBER/OCTOBER 2014 e359
RESTAURANT MENU LABELLING
Table 5. Odds ratios classified by restaurant and demographic predictor of who uses menu labelling
Restaurant Odds ratios 95% CI p valueHamburger restaurant Sex Female vs. male 1.41 1.12-1.78 0.0037
Intent to lose weight Intent vs. no intent 2.18 1.77-2.68 0.0001Calories at baseline* (before seeing menu labelling) 1.11 1.06-1.16 0.0001Sodium at baseline† (before seeing menu labelling) 1.03 1.01-1.06 0.0165
Breakfast restaurant Sex Female vs. male 1.74 1.39-2.18 0.0001Intent to lose weight Yes vs. no 1.91 1.57-2.32 0.0001Calories at baseline (before seeing menu labelling) 1.38 1.32-1.44 0.0001Sodium at baseline† (before seeing menu labelling) 0.99 0.98-1.02 0.4493
Sub shop Sex Female vs. male 1.80. 1.36-2.38 0.0001Intent to lose weight Yes vs. no 1.75 1.38-2.21 0.0001Calories at baseline (before seeing menu labelling) 1.38 1.25-1.53 0.0001Sodium at baseline† (before seeing menu labelling) 1.01 0.97-1.04 0.653
Dinner restaurant Sex Female vs. male 1.45 1.15-1.84 0.0018Intent to lose weight Yes vs. no 1.72 1.41-2.10 0.0001Calories at baseline (before seeing menu labelling) 1.23 1.18-1.29 0.0001Sodium at baseline† (before seeing menu labelling) 1.03 1.02-1.05 0.0001
* Calories at baseline refers to the amount of calories (kcal) in the meal ordered by the panelists before seeing menu labelling.† Sodium at baseline refers to the amount of sodium (mg) in the meal ordered by the panelists before seeing menu labelling.Because of the observed interaction between restaurant and various demographic predictors, education and treatment were also significant predictors in thehamburger restaurant; frequency of eating out and education were significant predictors in the breakfast restaurant; education and age were significant predictorsin the sub shop; and treatment and frequency of eating out were significant predictors in the dinner restaurant.Note: p values less than the Bonferroni adjusted experiment-wise cut point of 0.003 can be considered significant.

data.29,30 It might, therefore, have been biased toward individualswho were more likely to use labelling and thus may not berepresentative of the Canadian population. The results should beconfirmed with a real-life intervention that takes intoconsideration factors such as cost.
In addition, our study investigated only one of the manypotential mechanisms through which menu labelling can affect thenutritional content of consumers’ purchases. A recent studyshowed that 18 months after the implementation of menulabelling, the calorie, saturated fat and sodium levels of restaurantmeals were lowered.31 Therefore, it is important to remember thatin order to draw conclusions about the benefit of a policy such asmenu labelling, we must consider all of its potential benefits,including its effect on promoting product reformulation and theintroduction of new, healthier menu offerings.
CONCLUSION
These results suggest that menu labelling could have an impact onthe nutrient content of meals ordered by some consumers whenthey are dining out. Additionally, they show that including sodiuminformation may lead to lower-sodium choices compared withproviding calorie information alone. Finally, this study shed lighton the effect of context, and how the restaurant setting and thenutritional quality of the foods being offered have a large impact onthe effect of menu labelling on consumer choices. Thus, given theprevalence of eating outside the home alongside the rising rates ofdiet-related disease, and the alarmingly high calorie and sodiumcontent of restaurant meals, it is important that menu-labellinginterventions be considered by policy-makers.
REFERENCES1. Public Health Agency of Canada, Canadian Institute for Health Information.
Obesity in Canada – A Joint Report from the Public Health Agency of Canadaand the Canadian Institute for Health Information. 2011.
2. Lin B-H, Frazao E, Guthrie J. Away-from-home food increasingly important toquality of American diet. Economic Research Service, U.S. Department ofAgriculture. Washington, DC, 1999.
3. Food and Drug Administration. New Menu and Vending Machine LabelingRequirements. 2010. Available at: http://www.fda.gov/food/labelingnutrition/ucm217762.htm (Accessed December 20, 2012).
4. Gelinas F. Bill 86, Healthy Decisions for Healthy Eating Act. Legislative Assemblyof Ontario. Toronto, ON, 2012.
5. Wappel T. Bill C-398 An Act to Amend the Food and Drugs Act (food labelling).Legislative Assembly of Ontario. Ottawa, ON, 2003.
6. Toronto Public Health. What’s on the Menu? Making Key NutritionInformation Readily Available in Restaurants. Toronto, 2013.
7. Finkelstein EA, Strombotne KL, Chan NL, Krieger J. Mandatory menu labelingin one fast-food chain in King County, Washington. Am J Prev Med2011;40(2):122-27.
8. Pulos E, Leng K. Evaluation of a voluntary menu-labeling program in full-service restaurants. Am J Public Health 2010;100(6):1035-39.
9. Scourboutakos M, L’Abbe M. Sodium levels in Canadian fast-food and sit-down restaurants. Can J Public Health 2013;104(1):e2-8.
10. Scourboutakos MJ, Semnani-Azad Z, L’Abbe MR. Restaurant meals: Almost afull day’s worth of calories, fats, and sodium. JAMA Intern Med2013;173(14):1373-74.
11. Intersalt: An international study of electrolyte excretion and blood pressure.Results for 24 hour urinary sodium and potassium excretion. IntersaltCooperative Research Group. BMJ 1988;297(6644):319-28.
12. Lopez AD, Mathers CD, Ezzati M, Jamison DT, Murray CJ. Global and regionalburden of disease and risk factors, 2001: Systematic analysis of populationhealth data. Lancet 2006;367(9524):1747-57.
13. Mackison D, Wrieden WL, Anderson AS. Making an informed choice in thecatering environment: What do consumers want to know? J Hum Nutr Diet2009;22(6):567-73.
14. Arcand J, Mendoza J, Qi Y, Henson S, Lou W, L’Abbe MR. Results of a nationalsurvey examining Canadians’ concern, actions, barriers, and support fordietary sodium reduction interventions. Can J Cardiol 2013;29(5):628-31.
15. Wong CL, Arcand J, Mendoza J, Henson SJ, Qi Y, Lou W, et al. Consumerattitudes and understanding of low-sodium claims on food: An analysis ofhealthy and hypertensive individuals. Am J Clin Nutr 2013;97(6):1288-98.
16. Vadiveloo MK, Dixon LB, Elbel B. Consumer purchasing patterns in responseto calorie labeling legislation in New York City. Int J Behav Nutr Phys Act2011;8:51.
17. Dumanovsky T, Huang CY, Nonas CA, Matte TD, Bassett MT, Silver LD.Changes in energy content of lunchtime purchases from fast food restaurantsafter introduction of calorie labelling: Cross sectional customer surveys.BMJ 2011;343:d4464.
18. Scourboutakos MJ, L’Abbe MR. Restaurant menus: Calories, caloric density,and serving size. Am J Prev Med 2012;43(3):249-55.
19. Stein K. A national approach to restaurant menu labeling: The PatientProtection and Affordable Health Care Act, Section 4205. J Am Diet Assoc2010;110(9):1280-89.
20. The Healthy Kids Panel. No Time to Wait: The Healthy Kids Strategy. Queen’sPrinter for Ontario, 2013.
21. Farley TA, Caffarelli A, Bassett MT, Silver L, Frieden TR. New York City’s fightover calorie labeling. Health Affairs 2009;28(6):w1098-w1109.
22. Burton S, Howlett E, Tangari AH. Food for thought: How will the nutritionlabeling of quick service restaurant menu items influence consumers’ productevaluations, purchase intentions, and choices? J Retailing 2009;85(3):258-73.
23. Bleich SN, Pollack KM. The public’s understanding of daily caloricrecommendations and their perceptions of calorie posting in chainrestaurants. BMC Public Health 2010;10:121.
24. Lando AM, Labiner-Wolfe J. Helping consumers make more healthful foodchoices: Consumer views on modifying food labels and providing point-of-purchase nutrition information at quick-service restaurants. J Nutr Educ Behav2007;39(3):157-63.
25. O’Dougherty M, Harnack LJ, French SA, Story M, Oakes JM, Jeffery RW.Nutrition labeling and value size pricing at fast-food restaurants: A consumerperspective. Am J Health Promot 2006;20(4):247-50.
26. Center for Science in the Public Interest. Anyone’s Guess: The Need forNutrition Labelling at Fast-Food and Other Chain Restaurants. Washington,DC: Center for Science in the Public Interest, 2003.
27. Hebert JR, Clemow L, Pbert L, Ockene IS, Ockene JK. Social desirability biasin dietary self-report may compromise the validity of dietary intake measures.Int J Epidemiol 1995;24(2):389-98.
28. Kreuter FPS, Tourangeu R. Social desirability bias in CATI, IVR and Websurveys. Public Opin Q 2008;72(5):847-65.
29. Martel L, Malenfant C, Statistics Canada. 2006 Census: Portrait of theCanadian Population in 2006, by Age and Sex: Findings. Available at:http://www12.statcan.gc.ca/census-recensement/2006/as-sa/97-551/index-eng.cfm (Accessed May 13, 2013).
30. Statistics Canada. Education Highlight Tables, 2006 Census. Available at:http://www12.statcan.ca/census-recensement/2006/dp-pd/hlt/97-560/pages/page.cfm?Lang=E&Geo=PR&Code=01&Table=1&Data=Dist&Sex=1&StartRec=1&Sort=2&Display=Page (Accessed May 13, 2014).
31. Bruemmer B, Krieger J, Saelens BE, Chan N. Energy, saturated fat, and sodiumwere lower in entrées at chain restaurants at 18 months compared with6 months following the implementation of mandatory menu labelingregulation in King County, Washington. J Acad Nutr Diet 2012;112(8):1169-76.
Received: March 1, 2014Accepted: July 25, 2014
RÉSUMÉ
OBJECTIF : Plusieurs projets de loi provinciaux et fédérauxrecommandent diverses formes d’étiquetage nutritionnel des menusexigeant davantage d’information que la simple teneur en calories; onignore cependant quel serait l’avantage supplémentaire d’inclure lateneur en sodium. Notre étude visait à déterminer si l’ajout de la teneuren sodium sur les menus aiderait les consommateurs à choisir des metsplus faibles en sodium; elle visait aussi à comprendre les autres facteursqui modifient l’effet de l’étiquetage nutritionnel des menus sur les metschoisis par les consommateurs.
MÉTHODE : En tout, 3 080 consommateurs canadiens ont répondu à unsondage en ligne incluant une expérience à mesures répétées au cours delaquelle on leur a demandé de choisir ce qu’ils commanderaientd’habitude aux menus de quatre faux restaurants. Ensuite, lesconsommateurs ont été répartis de façon aléatoire en trois groupes, et onleur a présenté l’un de trois modes d’étiquetage nutritionnel des menus(calories; calories et sodium; ou calories, sodium et portion), et on leur adonné la possibilité de modifier leur commande.
e360 REVUE CANADIENNE DE SANTÉ PUBLIQUE • VOL. 105, NO. 5
RESTAURANT MENU LABELLING

RÉSULTATS : Il y avait un écart significatif dans la proportion deconsommateurs ayant changé leur commande, soit de 17 % à 30 %selon le type de restaurant. Après que les participants ont vu l’étiquetagenutritionnel des menus, les niveaux de sodium ont diminué pour les troismodes d’étiquetage (p<0,0001). Toutefois, pour trois des quatre types derestaurants, les consommateurs qui ont vu la teneur en calories et ensodium ont commandé des mets contenant significativement moins desodium que ceux qui n’ont vu que la teneur en calories (p<0,01). Lesconsommateurs ayant vu l’étiquetage sur le sodium ont réduit le niveaude sodium de leur repas de 171-384 mg en moyenne, selon le restaurant.Dans le sous-ensemble des consommateurs ayant vu la teneur en sodiumet choisi de modifier leur commande, les niveaux de sodium ont diminuéen moyenne de 681-1 360 mg, selon le restaurant. Le sexe, l’intention deperdre du poids et le nombre de calories des mets commandés à l’origineétaient les principaux prédicteurs des consommateurs ayant utilisél’étiquetage nutritionnel des menus. Quatre-vingt p. cent des répondantsvoulaient voir de l’information nutritionnelle quand ils allaient aurestaurant.
CONCLUSION : Inclure la teneur en sodium en plus de la teneur encalories pourrait entraîner une plus forte réduction de la quantité desodium commandée par la clientèle des restaurants.
MOTS CLÉS : restaurant; aliments de restauration rapide; étiquetagealiments; sodium
CANADIAN JOURNAL OF PUBLIC HEALTH • SEPTEMBER/OCTOBER 2014 e361
RESTAURANT MENU LABELLING

Supplementary Figure 1A Hamburger Restaurant Menu
HAMBURGERS Hamburger Cheeseburger Deluxe Burger Deluxe Cheeseburger Double Burger Double Cheeseburger Veggie Burger
SANDWICHES Fried Chicken Sandwich Grilled Chicken Sandwich Fish Sandwich
CHICKEN 4 Chicken Nuggets/Strips 6 Chicken Nuggets/Strips
SALADS Chicken BLT Salad Chicken Caesar Salad
FRENCH FRIES Small Medium Large
ONION RINGS Small Medium Large
SIDE GARDEN SALAD Regular Dressing Light Dressing
POUTINE
MOZZARELLA STICKS
APPLE SAUCE
SOFT DRINKS (any kind) Small Medium
Large DIET SOFT DRINKS (any kind) Small Medium
Large JUICE (any kind) Small Medium
Large MILKSHAKE Small Medium Large
COFFEE/TEA Cream Milk Sugar
WATER
Mains Sides Drinks
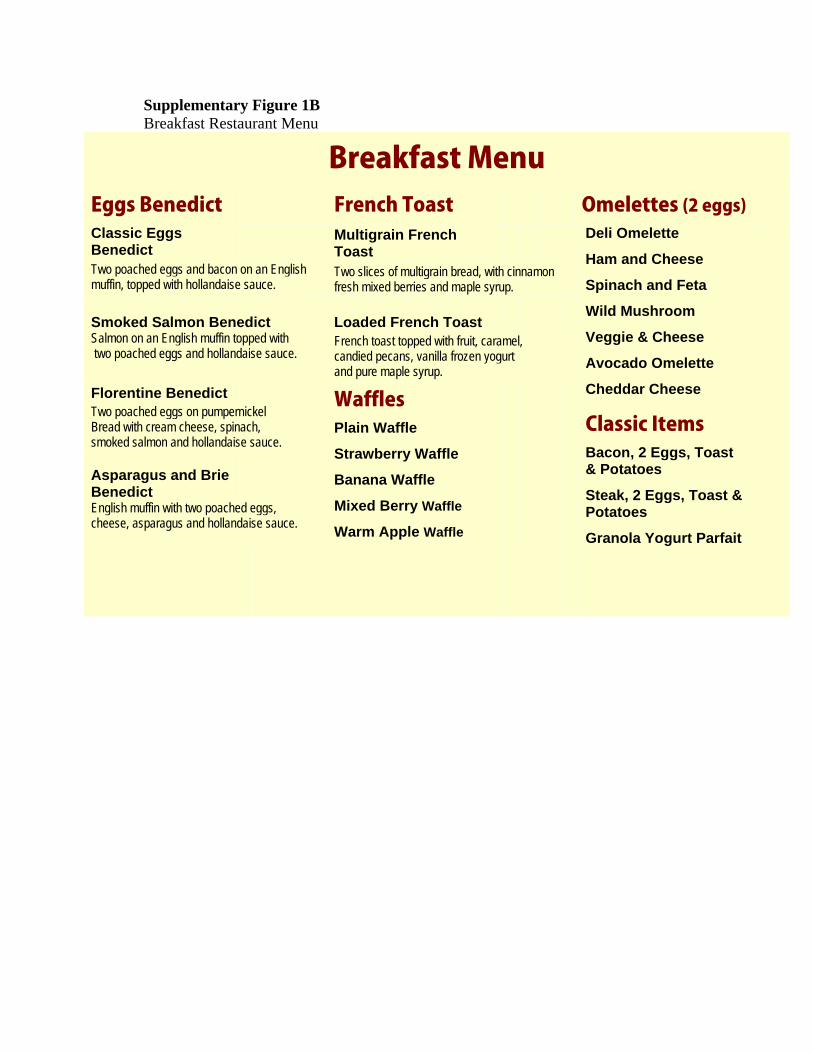
Supplementary Figure 1B Breakfast Restaurant Menu
Breakfast Menu Eggs Benedict French Toast Omelettes (2 eggs)
Classic Eggs Benedict
Multigrain French Toast
Deli Omelette
Ham and Cheese
Spinach and Feta
Wild Mushroom
Veggie & Cheese
Avocado Omelette
Cheddar Cheese
Classic Items Bacon, 2 Eggs, Toast & Potatoes
Steak, 2 Eggs, Toast & Potatoes
Granola Yogurt Parfait
Two poached eggs and bacon on an English muffin, topped with hollandaise sauce.
Two slices of multigrain bread, with cinnamon fresh mixed berries and maple syrup.
Smoked Salmon Benedict
Loaded French Toast
Salmon on an English muffin topped with two poached eggs and hollandaise sauce.
French toast topped with fruit, caramel, candied pecans, vanilla frozen yogurt and pure maple syrup.
Florentine Benedict Waffles Plain Waffle
Strawberry Waffle
Banana Waffle
Mixed Berry Waffle
Warm Apple Waffle
Two poached eggs on pumpernickel Bread with cream cheese, spinach, smoked salmon and hollandaise sauce. Asparagus and Brie Benedict
English muffin with two poached eggs, cheese, asparagus and hollandaise sauce.
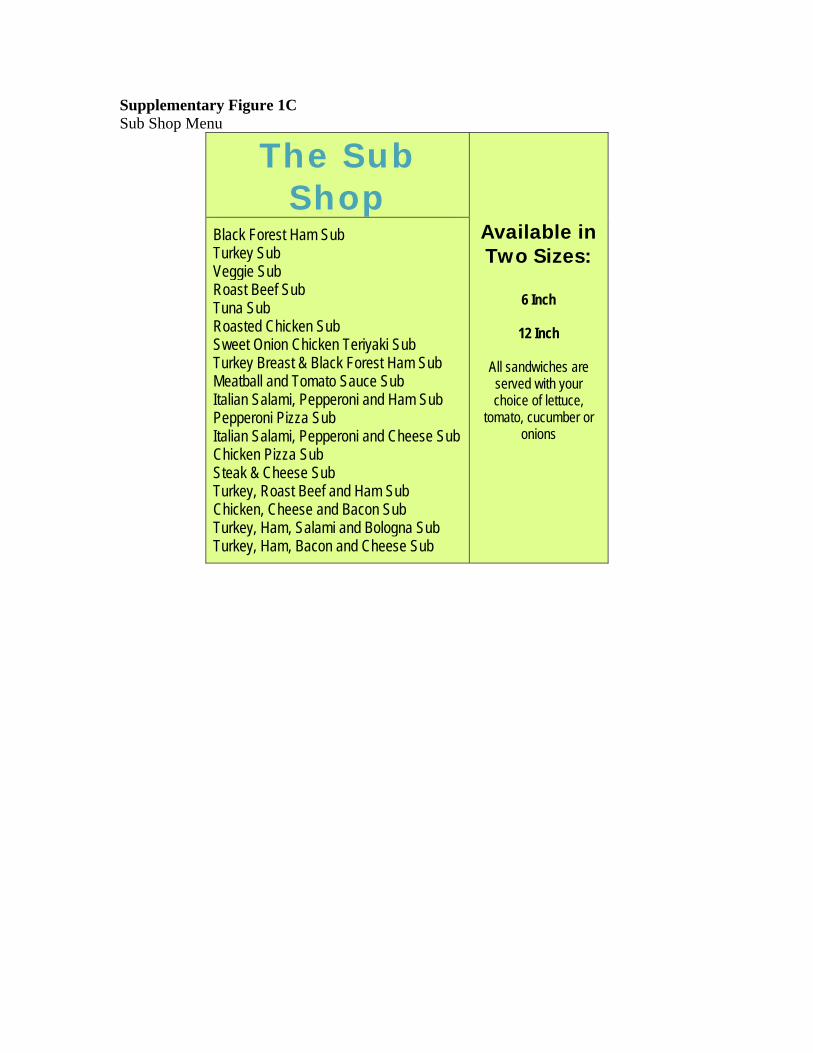
Supplementary Figure 1C Sub Shop Menu
The Sub Shop
Available in Two Sizes:
6 Inch
12 Inch
All sandwiches are served with your choice of lettuce,
tomato, cucumber or onions
Black Forest Ham Sub Turkey Sub Veggie Sub Roast Beef Sub Tuna Sub Roasted Chicken Sub Sweet Onion Chicken Teriyaki Sub Turkey Breast & Black Forest Ham Sub Meatball and Tomato Sauce Sub Italian Salami, Pepperoni and Ham Sub Pepperoni Pizza Sub Italian Salami, Pepperoni and Cheese Sub Chicken Pizza Sub Steak & Cheese Sub Turkey, Roast Beef and Ham Sub Chicken, Cheese and Bacon Sub Turkey, Ham, Salami and Bologna Sub Turkey, Ham, Bacon and Cheese Sub

Supplementary Figure 1D Dinner Restaurant Menu
Entrées
***The Following Items are Served with Your Choice
of One Side Dish***
Salad Entrées Caesar Salad Chicken Caesar Salad Warm Beet and Spinach Salad Santa Fe Chicken Salad Pasta Entrées
Sandwiches*** Grilled Chicken on a Ciabatta Roasted Chicken Quesadilla Chicken Tacos Steak Sandwich Short Rib Beef Dip
Penne Alfredo Mediterranean Linguini w/ Chicken Prawn and Scallop Linguini International Entrées
Chicken*** Cajun Blackened Chicken Roast Chicken with Dijon Parmesan Pine Nut Chicken
Chicken Curry Rice w/ Naan Bread Pad Thai Spicy Thai Curry with Shrimp Kung Pao Stir Fry Seafood Entrées
Steak*** 9oz Top Sirloin 9oz Top Sirloin w/Peppercorn Sauce 12 oz New York Striploin 12 oz Blackened New York Striploin
Fish and Chips Seafood*** Cedar Planked Salmon
Side Dish Choices (pick one) Fingerling Potatoes w/Garlic Butter Garlic Mashed Potatoes Potato Salad Roast Potatoes Penne Alfredo Coleslaw Mediterranean Vegetables Mixed Green Salad with Vinaigrette French Fries

Supplementary Figure 2A Menu-labelling Treatment 1: Calorie Labelling
HAMBURGERS Hamburger
Cheeseburger Deluxe Burger
Deluxe Cheeseburger Double Burger
Double Cheeseburger Veggie Burger
SANDWICHES Fried Chicken Sandwich
Grilled Chicken Sandwich Fish Sandwich
CHICKEN 4 Chicken Nuggets/Strips 6 Chicken Nuggets/Strips
SALADS Chicken BLT Salad
Chicken Caesar Salad
Calories 300 340 670 760 910
1000 310
640 370 500
160 250
540 450
FRENCH FRIES Small
Medium Large
ONION RINGS Small
Medium Large
SIDE GARDEN SALAD
Regular Dressing Light Dressing
POUTINE
MOZZARELLA STICKS
APPLE SAUCE
Calories 270 350 440
200 320 380
200 40
740
350
50
SOFT DRINKS (any kind)
Small Medium Large
DIET SOFT DRINKS (any kind)
Small Medium Large
JUICE (any kind) Small
Medium Large
MILKSHAKE Small
Medium Large
COFFEE/TEA Cream
Milk Sugar
WATER
Calories
160 230 320
0 0 0
180 260 360
440 640 950
22 5
16 0
A 2000 calorie diet is used as the basis for general nutrition advice; however, individual calorie needs may vary.
Mains Sides Drinks
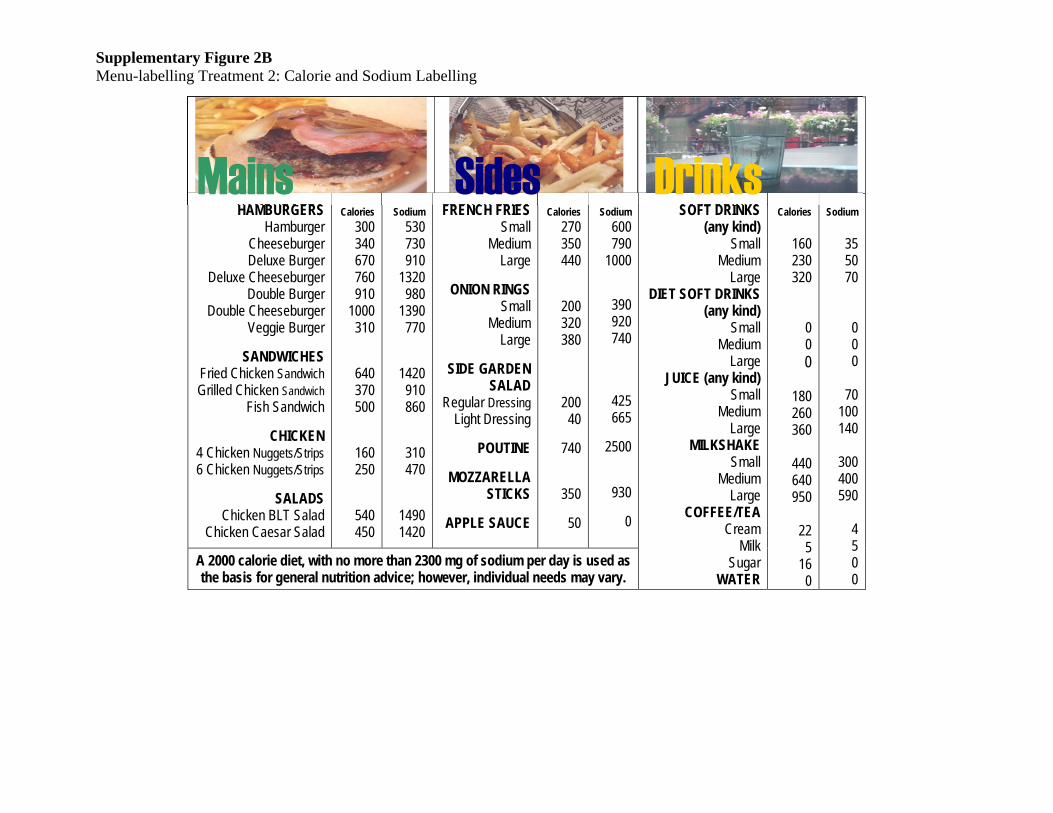
Supplementary Figure 2B Menu-labelling Treatment 2: Calorie and Sodium Labelling
HAMBURGERS Hamburger
Cheeseburger Deluxe Burger
Deluxe Cheeseburger Double Burger
Double Cheeseburger Veggie Burger
SANDWICHES Fried Chicken Sandwich Grilled Chicken Sandwich
Fish Sandwich
CHICKEN 4 Chicken Nuggets/Strips 6 Chicken Nuggets/Strips
SALADS Chicken BLT Salad
Chicken Caesar Salad
Calories
300 340 670 760 910
1000 310
640 370 500
160 250
540 450
Sodium
530 730 910
1320 980
1390 770
1420 910 860
310 470
1490 1420
FRENCH FRIES Small
Medium Large
ONION RINGS Small
Medium Large
SIDE GARDEN SALAD
Regular Dressing Light Dressing
POUTINE
MOZZARELLA STICKS
APPLE SAUCE
Calories
270 350 440
200 320 380
200 40
740
350
50
Sodium
600 790
1000
390 920 740
425 665
2500
930
0
SOFT DRINKS (any kind)
Small Medium Large
DIET SOFT DRINKS (any kind)
Small Medium Large
JUICE (any kind) Small
Medium Large
MILKSHAKE Small
Medium Large
COFFEE/TEA Cream
Milk Sugar
WATER
Calories
160 230 320
0 0 0
180 260 360
440 640 950
22 5
16 0
Sodium
35 50 70
0 0 0
70
100 140
300 400 590
4 5 0 0
A 2000 calorie diet, with no more than 2300 mg of sodium per day is used as the basis for general nutrition advice; however, individual needs may vary.
Mains Sides Drinks
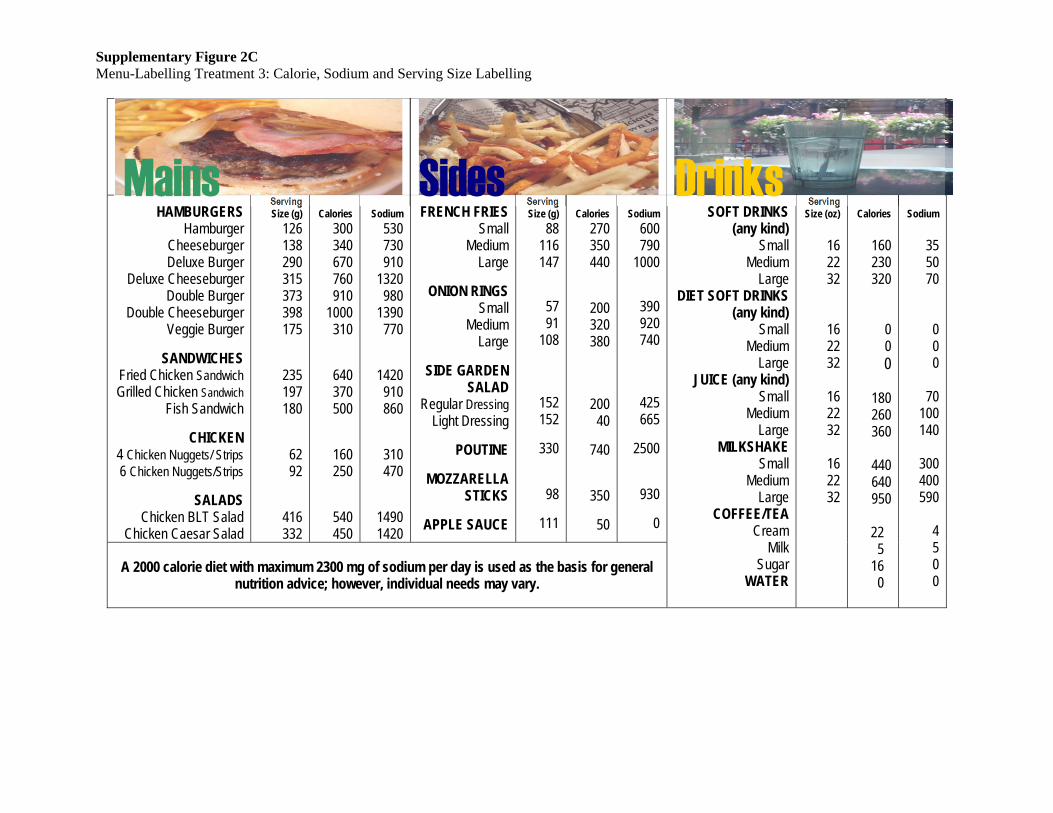
Supplementary Figure 2C Menu-Labelling Treatment 3: Calorie, Sodium and Serving Size Labelling
HAMBURGERS Hamburger
Cheeseburger Deluxe Burger
Deluxe Cheeseburger Double Burger
Double Cheeseburger Veggie Burger
SANDWICHES Fried Chicken Sandwich Grilled Chicken Sandwich
Fish Sandwich
CHICKEN 4 Chicken Nuggets/ Strips 6 Chicken Nuggets/Strips
SALADS Chicken BLT Salad
Chicken Caesar Salad
Serving Size (g)
126 138 290 315 373 398 175
235 197 180
62 92
416 332
Calories
300 340 670 760 910
1000 310
640 370 500
160 250
540 450
Sodium
530 730 910
1320 980
1390 770
1420 910 860
310 470
1490 1420
FRENCH FRIES Small
Medium Large
ONION RINGS Small
Medium Large
SIDE GARDEN SALAD
Regular Dressing Light Dressing
POUTINE
MOZZARELLA STICKS
APPLE SAUCE
Serving Size (g)
88 116 147
57 91
108
152 152
330
98
111
Calories
270 350 440
200 320 380
200 40
740
350
50
Sodium
600 790
1000
390 920 740
425 665
2500
930
0
SOFT DRINKS (any kind)
Small Medium Large
DIET SOFT DRINKS (any kind)
Small Medium Large
JUICE (any kind) Small
Medium Large
MILKSHAKE Small
Medium Large
COFFEE/TEA Cream
Milk Sugar
WATER
Serving Size (oz)
16 22 32
16 22 32
16 22 32
16 22 32
Calories
160 230 320
0 0 0
180 260 360
440 640 950
22 5
16 0
Sodium
35 50 70
0 0 0
70
100 140
300 400 590
4 5 0 0
A 2000 calorie diet with maximum 2300 mg of sodium per day is used as the basis for general nutrition advice; however, individual needs may vary.
Mains Sides Drinks