quantitative reconstruction in pet / ct and pet /...
TRANSCRIPT

7/30/2018
1
Quantitative Reconstruction in PET / CT and PET / MR
Georges El Fakhri, PhD, DABR
Gordon Center for Medical Imaging
Massachusetts General Hospital
Harvard Medical School
Outline
• PET 101
• Tomography in medical imaging
• Projection imaging
• Sinogram
• Reconstruction-analytic
• Backprojection artifacts
• Reconstruction-iterative
• Comparison of analytic and iterative reconstructions
• Simultaneous PET-MR
History of PET at MGH
The birthplace of Positron Emission Imaging was at MGH in
1952 in the Center for Radiological Sciences (Ancestor of the
Gordon Center for Medical Imaging) where the first positron-
imaging device was invented by Dr Gordon Brownell and used
for the detection of brain tumors for neurosurgery by Dr Sweet
(1953)Coincidence (a) and “unbalance” (b)
scans of a patient with recurring
tumor (left) under previous operation
site [Brownell and Sweet, 1953]

7/30/2018
2
What is tomography?
• Greek translation:• tomos means slice, section• graph means write
• 2-D representations of structures in a selected plane of a 3-D object
• Mathematical algorithms can be used to reconstruct the original 3-D object from the 2-D projections
• Used in medical imaging• SPECT and PET-Emission computed
tomography• CT-Transmission computed tomography
http://science.howstuffworks.com/cat-scan1.htm
History of PET at MGH
MGH is also the birthplace of filtered backprojection that is stil
widely used in PET and in CT. Dr David Chesler (Brownell Lab)
presented the first results about filtered backprojection at the
Meeting of Tomographic Imaging in Nuclear Medicine (1972).
So the PE & T of PET started at MGH!
History
A.M.Cormack
G.N.Hounsfield
J. Radon

7/30/2018
3
Why tomography over planar imaging?
10 10 10
10 20 10
10 10 10
30
40
30
Contrast (Planar) = (40 – 30)/30 = 0.33
Contrast (Tomo) = (20 – 10)/10 = 1.00
rotating X
-ray
detector
line of response
L(S,D)
rota
ting
X-r
ay
sourc
e
S
D
line of response
L(D,θ)
D
θ
Tomography in medical imaging
*
*
line of response L(d1,d2)
d1
d2
Positron emission tomography (PET)
X-ray computed tomography (CT)
Single Photon Emission Tomography
(SPECT)
emission tomography
transmission tomography
emission tomography
Unstable
parent
nucleus
N
N
N P
P
P P
P N
N
P
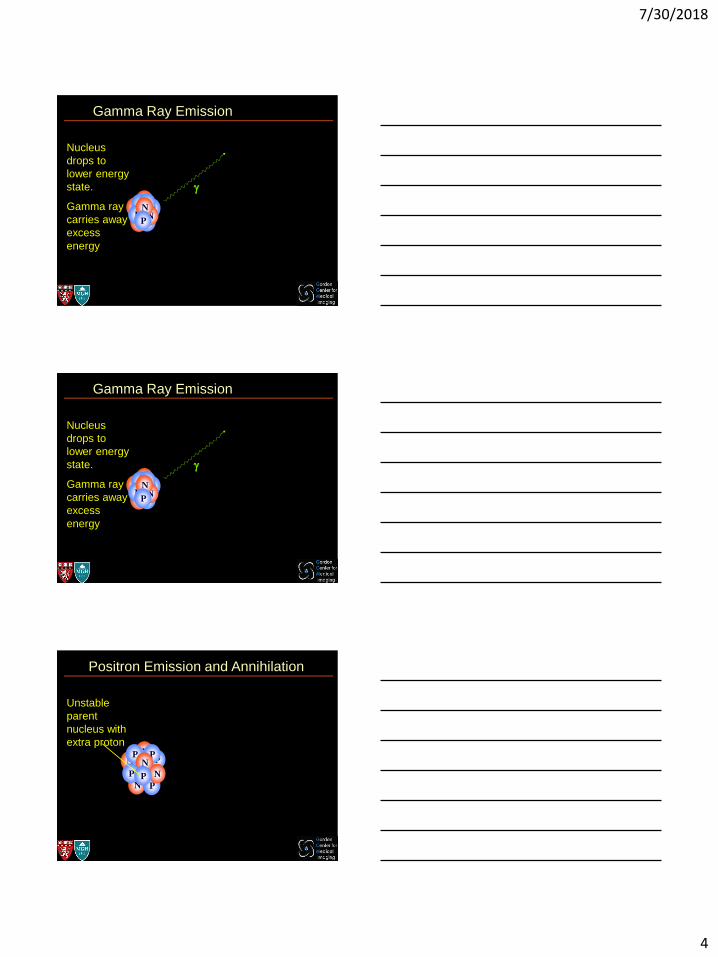
Gamma Ray Emission
7/30/2018
4
Nucleus
drops to
lower energy
state.
Gamma ray
carries away
excess
energy
NN
N P
PPP
P NN
P
Gamma Ray Emission
Nucleus
drops to
lower energy
state.
Gamma ray
carries away
excess
energy
NN
N P
PPP
P NN
P
Gamma Ray Emission
Unstable
parent
nucleus with
extra protonN
N
N P
PP P
P N
N
P
Positron Emission and Annihilation

7/30/2018
5
NN
N P
PP P
P N N
N
Proton
decays to
neutron …
nemitting a
neutrino ...
and a
positrone-
Positron
combines with
electron to
form
positronium ...
e+e+
which then
rapidly
annhilates
Two anti-
parallel 511
keV photons
produced
Positron Emission and Annihilation
e-
Dynodes have
increasing voltage
AnodePhotocathode
Electronics
Incoming
light ray
Dynodes
Evacuated glass tube
Photoelectron
The Photomultiplier Tube
γ
The Scintillation Detector
Scintillating
crystal
Photomultiplier
7/30/2018
6
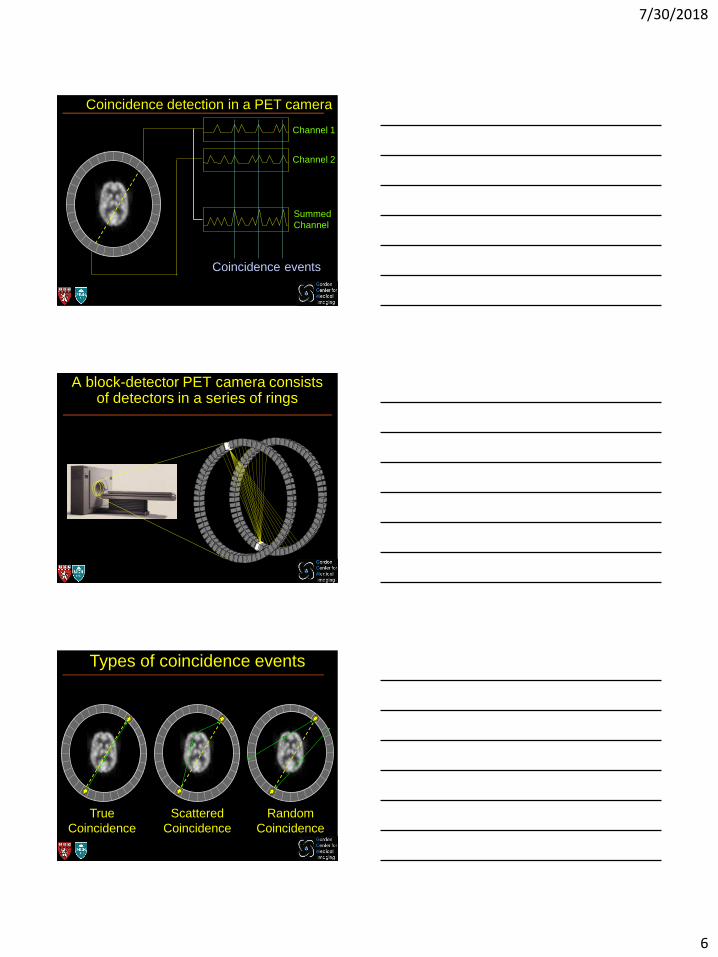
Channel 1
Channel 2
Summed
Channel
Coincidence events
Coincidence detection in a PET camera
A block-detector PET camera consists of detectors in a series of rings
Scattered
Coincidence
Random
Coincidence
True
Coincidence
Types of coincidence events

7/30/2018
7
Type of coincidence Percentage (%)
Raw 100
Trues 38
Randoms 34
Scattered 28
Multiple 7
Example: Typical Whole Body PET
Electronic collimation and intrinsic resolution
Field of View
Detector
• Resolution depends on size of detector elements
• Resolution does not change much between the detectors
Positron range and intrinsic resolution
NN
N P
PP P
P N
N
n
e-
PN
e+
Positron range
Positron range depends on energy of emitted positron
Positron collides with electrons and loses kineticenergy
At thermal energies positronium can form

7/30/2018
8
Isotope Maximum Mean Range in waterpositron positron FHWM energy energy (mm)(MeV) (MeV)
18F 0.64 0.25 0.10
11C 0.96 0.39 0.19
13N 1.19 0.49 0.28
15O 1.70 0.74 0.50
82Rb 3.15 1.6
Positron range and intrinsic resolution (2)N
um
ber
of events
Annihilation point (mm)
-2 -1 0 1 2
Approximate annihilation distribution for 18F and 82Rb in water
Positron range and intrinsic resolution (3)
82Rb
18F
Positron range and intrinsic resolution (4)
82RbGE-DST, OSEM
13N-ammoniaScanditronix, FBP

7/30/2018
9
Photon non co-linearity & intrinsic resolution
e-e+
Momentum is conserved.
What happens to the momentum of the positronium?
The annihilation photons must carry it away -so they are not exactly co-linear.
Angular uncertainty ~ 0.5 degrees
Positional uncertainty for 1m PET scanner ~ 2 mm
Incidence point
Interaction point
Interaction point
Incidence point
Depth of interaction and intrinsic resolution
Resolution degrades as the radial distance increases
PET-CT: 4.5 mm at the center5.5 mm at 10 cm from center
Most clinical tomographshave spatial resolution in 4-6 mm range
Positioning error
General concepts of tomography acquisition
Cherry, S. R.; Sorenson, J. A.; Phelps, M. E. Physics in Nuclear Medicine; Elsevier, 2012.
Planar acquisition

7/30/2018
10
Projection imaging
Projection imaging
sinogram
backprojection
non filtered
General concepts of tomography acquisition
Cherry, S. R.; Sorenson, J. A.; Phelps, M. E. Physics in Nuclear Medicine; Elsevier, 2012.
Tomography: Many planar acquisitions
7/30/2018
11
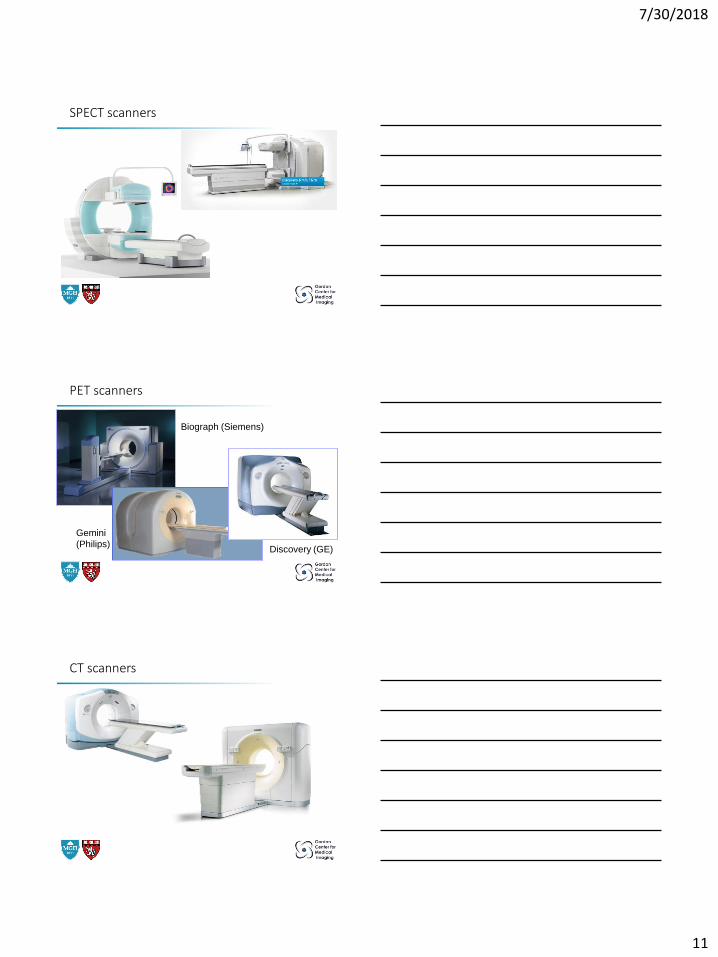
SPECT scanners
PET scanners
Biograph (Siemens)
Gemini
(Philips)Discovery (GE)
CT scanners

7/30/2018
12
Displaying projection data: Sinogram
A sinogram is a representation of the projection data in a 2D matrix. Each slice will have its own 2D sinogram.
Cherry, S. R.; Sorenson, J. A.; Phelps, M. E. Physics in Nuclear Medicine; Elsevier, 2012. v v
Tomography: sinogram
sinogram
4 projections
4 projections
90°
90°
135°
135°
45°
45°
0°
0°
8 projections
16 projections
32 projections
Sinograms are useful for detecting patient motion
No movement
original image
sinogram reconstructed image
original image after movement
sinogram reconstructed image
phantom moves halfway through scan

7/30/2018
13
Scanner coordinate system
• Object space (x,y) to scanner space (r,s):
• Explains how radioactivity at location (x,y) contributes to signal recorded at location r acquired at rotation angle θ
r = xcosq + ysinq
s = ycosq - xsinq
Foundation of backprojection: Radon transform
• An integral transform that takes f(x,y) and defines it as line integrals through f(x,y) at different offsets from the origin
R r,q( ) = f x, y( )d xcosq + ysinq - r( )-¥
¥
ò-¥
¥
ò dxdy
Radon transform:
b x, y( ) = R r,q( ) |r=xcosq+ysinq
dq0
p
ò
Backprojection:
Simple backprojection
Cherry, S. R.; Sorenson, J. A.; Phelps, M. E. Physics in Nuclear Medicine; Elsevier, 2012.
7/30/2018
14
7 9
11 13
3 3
7 7
? ?
? ?
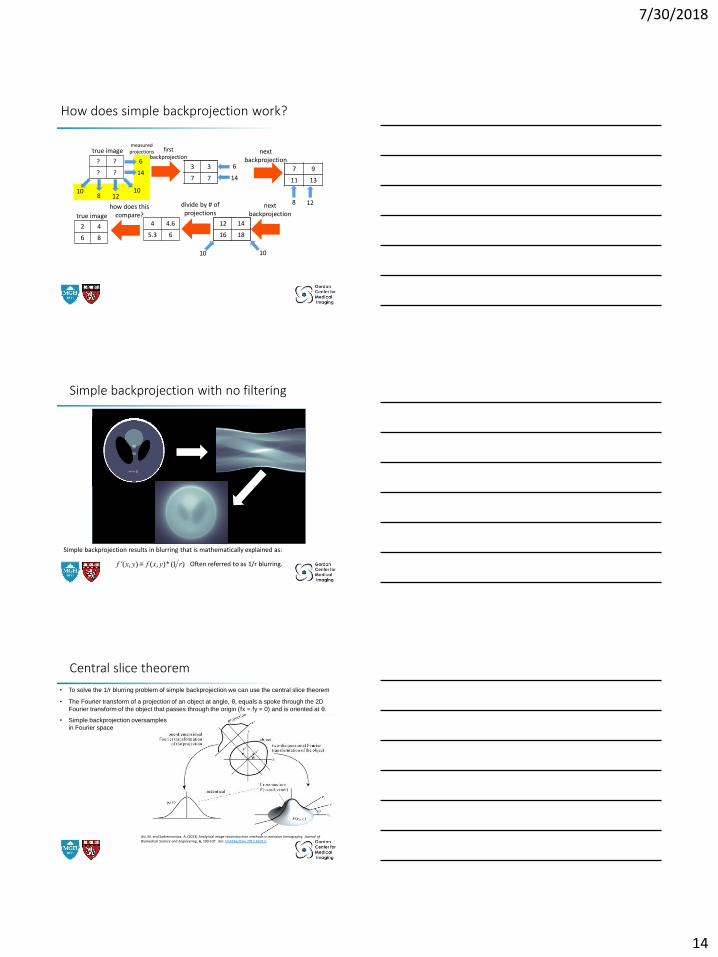
How does simple backprojection work?
? ?
? ?
108 12
10
14
6
true image first backprojection
3 3
7 7 14
6 7 9
11 13
next backprojection
8 12
12 14
16 18
10 10
divide by # of projections
4 4.6
5.3 62 4
6 8
true image
how does this compare?
measured projections
next backprojection
Simple backprojection with no filtering
Simple backprojection results in blurring that is mathematically explained as:
f '(x, y) = f (x, y)*(1 r) Often referred to as 1/r blurring.
Central slice theorem
Asl, M. and Sadremomtaz, A. (2013) Analytical image reconstruction methods in emission tomography. Journal of Biomedical Science and Engineering, 6, 100-107. doi: 10.4236/jbise.2013.61013.
• The Fourier transform of a projection of an object at angle, θ, equals a spoke through the 2D
Fourier transform of the object that passes through the origin (fx = fy = 0) and is oriented at θ.
• To solve the 1/r blurring problem of simple backprojection we can use the central slice theorem
• Simple backprojection oversamples
in Fourier space

7/30/2018
15
Steps for filtered backprojection (FBP)
Cherry, S. R.; Sorenson, J. A.; Phelps, M. E. Physics in Nuclear Medicine; Elsevier, 2012.
Steps for FBP1. Acquire projection images
2. Compute the 1D Fourier transform of each profile (convert to spatial frequency domain)
3. Apply the filter in the frequency domain
4. Compute the inverse Fourier transform to convert back to spatial domain
5. Perform backprojection
Filtered Backprojection: Filters
Cherry, S. R.; Sorenson, J. A.; Phelps, M. E. Physics in Nuclear Medicine; Elsevier, 2012.
• Filtering is used to remove the 1/r blurring found in simple backprojection
• Ramp is simplest
• Others are used to remove noise artifacts at high frequencies
• Shepp-Logan
• Hann
• Filtering is performed in spatial frequency space following a Fourier transform
Tomography: filtering
No filtering ramp HanningInitial Image
sinogram 32 projections

7/30/2018
16
f x, y( ) = dq dw w P w( )e2piwr
0
¥
òé
ëêù
ûú0
p
òr=xcosq+ysinq
Filtered Backprojection: Equation form
Steps for FBP1. Acquire projection images
2. Compute the 1D Fourier transform of each profile (convert to frequency domain)
3. Apply the filter in the frequency domain
4. Compute the inverse Fourier transform to convert back to spatial domain
5. Perform backprojection
6. Then apply this procedure and sum over all projections
p r,q( )
Tomography : reconstruction of 1 slice
non filtering
sinogram
Ramp filter Hanning filter
backprojections
Factors affecting image quality: Noise
original no noise
0.5*Poisson Poisson

7/30/2018
17
Factors affecting image quality: Acquisition sampling
Low projection sampling resolution can cause blurring and aliasing artifacts
Δr = 0.1 cm Δr = 0.2 cm
Δr = 0.4 cm Δr = 0.8 cm
Factors affecting image quality: Reconstruction filter
Cherry, S. R.; Sorenson, J. A.; Phelps, M. E. Physics in Nuclear Medicine; Elsevier, 2012.
• Reduction of cutoff frequency:• Increase blurring
• Reduction in noise
• Reduction in image detail
Cherry, S. R.; Sorenson, J. A.; Phelps, M. E. Physics in Nuclear Medicine; Elsevier, 2012.
Factors affecting image quality: Angular sampling
• Reduction in acquired projection angles:
• Decrease acquisition time
• Increase spoke-like artifacts
3015
60 90

7/30/2018
18
Factors affecting image quality: Angular sampling range
• Full 180° angular sampling is needed
45° 90°
135° 180°
Factors affecting image quality: Full object coverage
• Incomplete coverage of the object during some or parts of the scan can lead to artifacts
Factors affecting image quality: Missing detector
• Instrumentation failure can cause artifacts due to missing data
7/30/2018
19
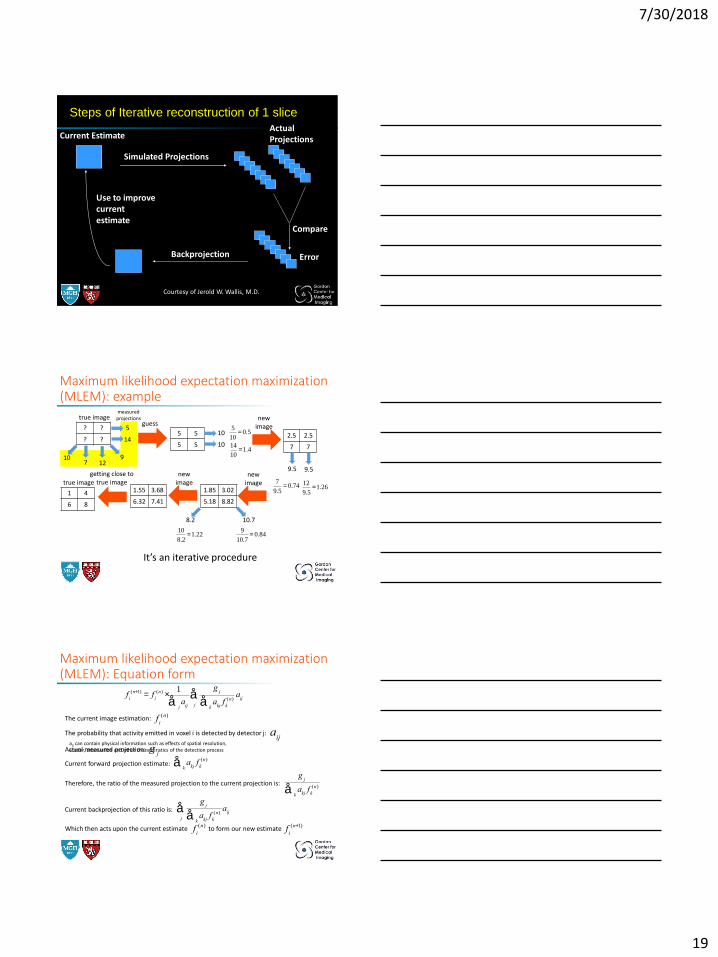
Steps of Iterative reconstruction of 1 slice
Backprojection
Simulated Projections
ActualProjections
Compare
Use to improve current estimate
Current Estimate
Error
Courtesy of Jerold W. Wallis, M.D.
Maximum likelihood expectation maximization (MLEM): example
? ?
? ?
107 12
9
14
5
true imageguess
5 5
5 5 10
105
10= 0.5
14
10=1.4
2.5 2.5
7 7
new image
9.5 9.5
7
9.5= 0.74 12
9.5=1.26
new image
1.85 3.02
5.18 8.82
8.2 10.7
10
8.2=1.22
9
10.7= 0.84
new image
1.55 3.68
6.32 7.411 4
6 8
true imagegetting close to
true image
measured projections
It’s an iterative procedure
Maximum likelihood expectation maximization (MLEM): Equation form
fi
(n+1) = fi
(n) ×1
aijj
å
gj
akjfk
(n)
kå
aij
j
å
The current image estimation: fi
(n)
The probability that activity emitted in voxel i is detected by detector j: aij
Actual measured projection: gj
Current forward projection estimate: akjfk
(n)
kå
Therefore, the ratio of the measured projection to the current projection is: gj
akjfk
(n)
kå
gj
akjfk
(n)
kå
aij
j
åCurrent backprojection of this ratio is:
Which then acts upon the current estimate to form our new estimatefi
(n) fi
(n+1)
aij can contain physical information such as effects of spatial resolution, scatter, attenuation and other characteristics of the detection process

7/30/2018
20
Steps of maximum likelihood expectation maximization (MLEM): equation form
fi
(n+1) = fi
(n) ×1
aijj
å
gj
akjfk
(n)
kå
aij
j
å
1. The first is a guess and is typically uniform.fi
(0)
2. Forward project: Simulate the projection measurement from the previous estimate
akjfk
(n)
kå
3. Compare the forward projected estimate to the actual measured projection
gj
akjfk
(n)
kå
4. Next, update (improve) our estimated image using the current information
fi
(n+1) = fi
(n) ×1
aijj
å
gj
akjfk
(n)
kå
aij
j
å
5. Repeat this until convergence is reached!
Maximum-likelihood, expectation maximization algorithm (MLEM)
- Correct for Poisson noise
- Positivity guaranteed
- Slow compared to FBP
- Acceleration of the process by the “Ordered Subsets (OSEM) approach”:
projections are divided into subsets, which are updated at each iteration
- Noise at high iteration numbers (approximation of a continuous function by
a pixelated one)
- Noise can be reduced greatly by convolving the noisy image estimate with
a gaussian kernel (regularization)
- How to define when to stop?
How do we know when to stop?• Low frequencies are
reconstructed first
• As iterations increase image detail is recovered and so is noise
• Too few iterations: no image detail and lack of convergence
• Too many iterations: image is noisy
• Solution: assure proper convergence and remove noise with a gaussian filter
Cherry, S. R.; Sorenson, J. A.; Phelps, M. E. Physics in Nuclear Medicine; Elsevier, 2012.

7/30/2018
21
Ordered subset expectation maximization
• Solution to improve MLEM: Ordered-subset
expectation maximization (OSEM)
• At each step, project and backproject at only some
angles (i.e. a subset)
• Perform the steps in an ordered way to include all
angles
• Data start to converge even before the 1st iteration
is complete
• Convergence achieved in 3 - 10 iterations
• Much quicker than MLEM
Iterative reconstruction can model the reality of emission tomography
• Attenuation• Positron range• Noncollinearity of photons
(PET)• Deadtime• Scatter coincidences• Random coincidences• Physics of crystal: size,
intercrystal scatter andpenetration
• Noise
Scattered
Coincidence
Random
Coincidence
True
Coincidence
Corrected for attenuation Not corrected for attenuation
crystal penetration
Iterative vs. FBP
• Advantages of iterative methods:
• The results must be better because the correct physics is
included in the reconstruction: The reconstruction algorithm
“knows” the physics
• Attenuation correction
• Reduction of streak artifact
• Overall quality
• Disadvantages of iterative methods (MLEM)
• Slow convergence to the desired solution (e.g. tens -
hundreds of iterations)
• Computationally demanding - number of iterations and
inclusion of the physics

7/30/2018
22
OSEM vs FBP
• Filtered Back-Projection• Fast
• Robust
• Subject to noise & streaks
• OSEM• Almost as fast
• Handles noise & streaks
Analytic vs iterative reconstructions
OS
EM
FB
P
FDG PET
Analytic vs iterative reconstructions
FBP, Han filterOSEM, 2 iteration
28 subsets
7/30/2018
23
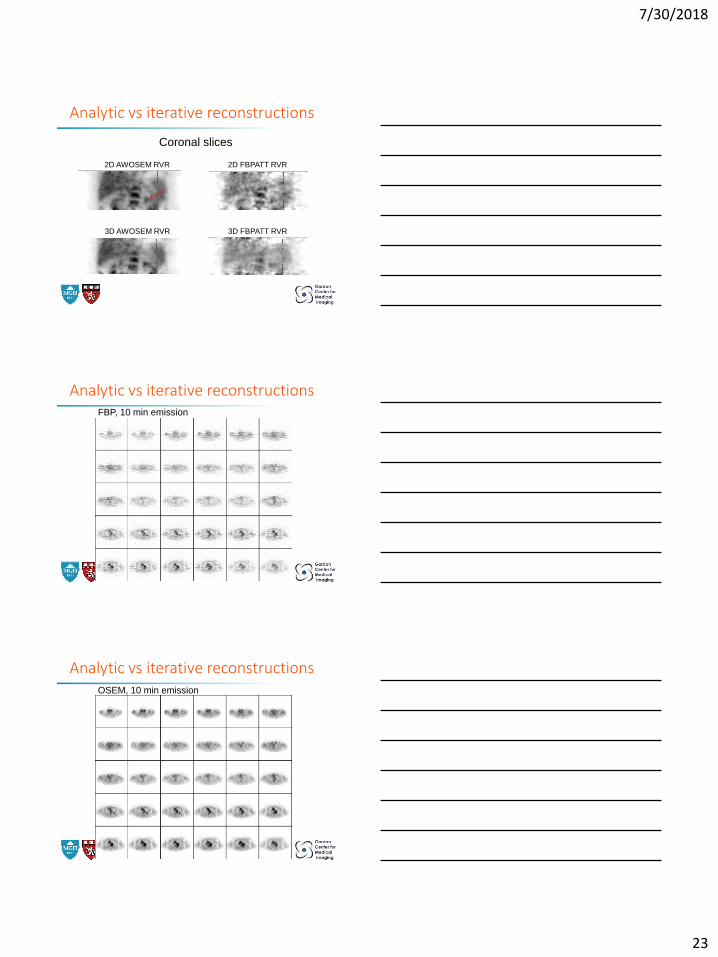
Analytic vs iterative reconstructions
Coronal slices
2D AWOSEM RVR 2D FBPATT RVR
3D AWOSEM RVR 3D FBPATT RVR
Analytic vs iterative reconstructionsFBP, 10 min emission
Analytic vs iterative reconstructionsOSEM, 10 min emission

7/30/2018
24
Integrated Whole-Body PET-MR
32 channel
3T Verio MR
Simultaneous PET – MR
25 cm axial coverage
PET - MR
PET - MR
CT
60 cm
PET
G. El Fakhri, Ph.D.
Methods: Motion Corrected OSEM
• List-mode MLEM reconstruction algorithm with motion modeled in the system matrix:
Attenuation map in the reference frame Attenuation maps in the deformed frames
Transformation using
measured motion fields
from tagged MR
• Attenuation correction using deformed attenuation maps at each frame:
Ouyang J., Petibon Y., El Fakhri G.
• Motion Correction with Primate in simultaneous PET-MR
Gated tagged MR Gated PET
Primate Results: Acquisition
Chun et al. J. Nucl. Med. 2012

7/30/2018
25
Uncorrected Gated
MR motion corrected
Reference gated 30 min
Nonhuman Primate Results (2/3)
Chun S.Y., Reese T., Guerin B., Catana C., Zhu X., Alpert N., El Fakhri G.
Tagged MR-based Motion Correction in Simultaneous PET-MR. JNM 2012;
1284-1291
Liver patient study (1/3)
Cine MRI
(TrueFISP)
Respiratory Gated
PET
Respiratory motion amplitude in the dome of the liver (~0.7-
1.5cm).
Petibon, Huang, Ouyang and El Fakhri. Relative role of MR-based motion in WB PET-MR. Med. Phys., 2014 41
Initial results in hepatic lesions (2)
• Estimated Motion via B-spline non-rigid image registration
Reference : End-inspiration (Isrc) End-exhalation (Itar)
( )ˆ arg min , ( )SSD tar srcT I TI R T= +
G. El Fakhri, Ph.D.

7/30/2018
26
Liver patient study (3/3)
PSF-OP-OSEM
MC-OP-OSEM MC-PSF-OP-OSEM
T1w OP-OSEM
Petibon, Huang, Ouyangand El Fakhri. Role of MR-based motion and PSF corrections in WB PET-MR. Med. Phys., 2014
Measure Motion Fields and Track Motion Phases
PET
imaging
Measure motion fields Track motion & acquire PET/MRI data
Cardiac motion
phase
Resp
irato
ry m
oti
on
ph
ase
Motion
correction for
PET
reconstruction
Summary
• PET 101
• Tomography in medical imaging
• Projection imaging
• Sinogram
• Reconstruction-analytic
• Backprojection artifacts
• Reconstruction-iterative
• Comparison of analytic and iterative reconstructions
• Simultaneous PET-MR

7/30/2018
27
Quantitative Reconstruction in PET / CT and PET / MR
THANK YOU!