quantitative proteomics combined with bac … assume that in this case, the cleavage site was...
TRANSCRIPT

JCB: Article
The Rockefeller University Press $30.00J. Cell Biol. Vol. 189 No. 4 739–754www.jcb.org/cgi/doi/10.1083/jcb.200911091 JCB 739
N.C. Hubner and A.W. Bird contributed equally to this paper.Correspondence to Anthony Hyman: [email protected]; or Matthias Mann: [email protected] used in this paper: AP, affinity purification; APC, anaphase-promoting complex; BAC, bacterial artificial chromosome; FDR, false dis-covery rate; IP, immunoprecipitation; LC, liquid chromatography; MS, mass spectrometry; QUBIC, quantitative BAC-GFP interactomics; SILAC, stable isotope labeling by amino acids in cell culture; TAP, tandem AP; TREX, transcription/ export; WT, wild type.
IntroductionOne of the challenges in modern cell biology is how to reveal proteomic changes that underlie cellular perturbations, e.g., from gene mutation, RNAi, or chemical inhibition. Rapid iden-tification of the members of protein complexes in a quantitative manner would facilitate these types of experiments. Affinity purification (AP) of proteins in combination with mass spec-trometric detection of bound proteins (AP mass spectrometry [AP-MS]) identifies the components of protein complexes (Gingras et al., 2007; Köcher and Superti-Furga, 2007). AP-MS has already been the basis of large-scale interaction mapping in Saccharomyces cerevisiae (Gavin et al., 2006; Krogan et al., 2006). However, it has suffered from two principal problems. First, it is difficult to distinguish true interactors from back-ground. Proteins binding nonspecifically to the antibodies or beads always copurify with the specific interactors. This either
results in a high rate of false-positive interactions or it requires stringent purification, such as by tandem affinity tagging (Rigaut et al., 1999), often leading to loss of weak and transient binders. Second, although the prey proteins are expressed under native conditions, in tissue culture, the tagged bait protein is usually overexpressed from a cDNA under a general promoter, poten-tially compromising interaction data. For example, it would be very interesting to study how multiple protein complexes change with phenotypic perturbation, but such data would be difficult to interpret when not expressing the bait under endog-enous control.
Bacterial artificial chromosome (BAC) recombineering (Zhang et al., 1998) is an alternative method to create the bait proteins needed for interaction proteomics. In this study, a gene of interest in its genomic context is tagged with a construct con-taining, e.g., GFP (Kittler et al., 2005). The BAC transgene can then be stably transfected into mammalian cell lines of choice. This allows for expression of the tagged protein at endogenous levels and ensures cell type–specific processing and regulation.
Protein interactions are involved in all cellular processes. Their efficient and reliable characterization is therefore essential for understanding biological
mechanisms. In this study, we show that combining bacterial artificial chromosome (BAC) TransgeneOmics with quantitative interaction proteomics, which we call quantitative BAC–green fluorescent protein interactomics (QUBIC), allows specific and highly sensitive detection of interactions using rapid, generic, and quantitative procedures with minimal material. We applied this approach to identify known and novel components of wellstudied
complexes such as the anaphasepromoting complex. Furthermore, we demonstrate second generation interaction proteomics by incorporating directed mutational transgene modification and drug perturbation into QUBIC. These methods identified domain/isoformspecific interactors of pericentrin and phosphorylationspecific interactors of TACC3, which are necessary for its recruitment to mitotic spindles. The scalability, simplicity, cost effectiveness, and sensitivity of this method provide a basis for its general use in smallscale experiments and in mapping the human protein interactome.
Quantitative proteomics combined with BAC TransgeneOmics reveals in vivo protein interactions
Nina C. Hubner,1 Alexander W. Bird,2 Jürgen Cox,1 Bianca Splettstoesser,1 Peter Bandilla,1 Ina Poser,2 Anthony Hyman,2 and Matthias Mann1
1Department of Proteomics and Signal Transduction, Max Planck Institute of Biochemistry, 82152 Martinsried, Germany2Department of Microtubules and Cell Division, Max Planck Institute of Molecular Cell Biology and Genetics, 01307 Dresden, Germany
© 2010 Hubner et al. This article is distributed under the terms of an Attribution–Noncommercial–Share Alike–No Mirror Sites license for the first six months after the pub-lication date (see http://www.rupress.org/terms). After six months it is available under a Creative Commons License (Attribution–Noncommercial–Share Alike 3.0 Unported license, as described at http://creativecommons.org/licenses/by-nc-sa/3.0/).
TH
EJ
OU
RN
AL
OF
CE
LL
BIO
LO
GY
on Septem
ber 30, 2010jcb.rupress.org
Dow
nloaded from
Published May 17, 2010
http://jcb.rupress.org/content/suppl/2010/05/17/jcb.200911091.DC1.htmlSupplemental Material can be found at:

JCB • VOLUME 189 • NUMBER 4 • 2010 740
precoupled monoclonal mouse anti-GFP antibody. We compared different ways to release bound interacting proteins, including specific enzymatic elution, unspecific elution with 8 M urea, and a newly developed, very efficient in-column digestion proce-dure with trypsin. We determined that specific protease cleav-age between bait and GFP tag worked efficiently for a subset of baits but poorly for others. For example, when purifying the transcription/export (TREX) complex with THOC3 as bait, most of the complex components were not identified with spe-cific protease cleavage (PreScission; GE Healthcare; Fig. S1 B). We assume that in this case, the cleavage site was shielded by the complex. In contrast, direct enzymatic digests of proteins in the column provided high and uniform elution efficiency and allowed direct analysis of eluted peptides without pro-tein precipitation.
We optimized all steps of the procedure using a variety of GFP-tagged cell lines. The combination of small magnetic beads with elution by in-column protease digestion of proteins helped to keep the entire pull-down procedure short (2 h including cell lysis). True interaction partners could be distinguished from background binders present in the immunoprecipitations (IPs) by their quantitative ratios. This also allowed the use of low stringency wash conditions, helping to retain weak interaction partners. We optimized LC gradients and the instrument method on our high resolution mass spectrometers for optimal peptide identification and quantitation of interaction partners. Our pro-tocol allows automated analysis of 10 pull-downs per day. We also developed bioinformatic analysis procedures for the statis-tical interpretation of the quantitative pull-down data on the basis of the publicly available MaxQuant package (Cox and Mann, 2008). We found that a 15-cm dish, corresponding to 107 cells, provides sufficient material for QUBIC. This is at least a factor of 10 less than that commonly used in nonquantitative tandem AP (TAP)–MS.
Unraveling the interactors of the TREX complex using SILAC-QUBICWe next applied these techniques to the characterization of the interaction network centered around the TREX complex (Reed and Cheng, 2005). Although mRNA export is similar in yeast and humans, the TREX complex is associated with the transcription apparatus in yeast and the splicing machinery in humans (Reed and Hurt, 2002; Strässer et al., 2002). In humans, the TREX com-plex consists of a core called the THO complex that is comprised of six proteins (THOC1, THOC2, THOC3, THOC5, THOC6, and THOC7) and two adaptor proteins (Aly/THOC4 and Bat1/UAP56; Masuda et al., 2005). The human TREX complex was only recently characterized in 2005, and this required ectopic ex-pression of several complex members, extensive purification, MS, and Western blotting (Masuda et al., 2005).
We reasoned that the QUBIC technology might be able to define the TREX complex and its interactions in a rapid and ro-bust manner. We performed GFP pull-downs of its six core mem-bers (THOC1–3 and THOC5–7) and the coadaptor THOC4/Aly from stable cell lines created by BAC TransgeneOmics. Immuno-precipitating the TREX complex is especially challenging because its function involves association with mRNA, which
BAC TransgeneOmics has been streamlined and can be readily performed for large numbers of genes in parallel (Sarov et al., 2006; Poser et al., 2008). Furthermore, recombineering tech-nologies allow for the precise manipulation of BAC transgenes. For example, sites of protein modification can be mutated, and functional consequences can then be carefully analyzed in their native context when the endogenous protein is selectively de-pleted (Bird and Hyman, 2008).
Quantitative interaction proteomics can efficiently dis-criminate between specific and background binders without re-sorting to stringent purification procedures (Blagoev et al., 2003; Ranish et al., 2003; Vermeulen et al., 2008). We reasoned that combining this approach with the BAC recombineering technology would overcome most of the limitations currently associated with protein interaction screens. This strategy would avoid artifacts associated with overexpression but without the need to generate specific antibodies. Furthermore, by using GFP as the affinity tag, it would directly combine sophisticated imaging possibilities with quantitative proteomics technology (Cheeseman and Desai, 2005; Trinkle-Mulcahy and Lamond, 2007; Poser et al., 2008). Using quantitative proteomics would efficiently discriminate against background binders while pre-serving weak interactions. We call this technique quantitative BAC-GFP interactomics (QUBIC). Accurate quantification can be achieved by stable isotope labeling by amino acids in cell culture (SILAC; Ong et al., 2002; Mann, 2006). However, QUBIC performs as efficiently in label-free format. We demonstrate the power of QUBIC in analyzing the changing nature of protein complexes and interactions by addressing the long-standing ques-tion in mitotic spindle assembly of how the spindle protein TACC3 is recruited to spindles through its phosphorylation. We identified clathrin as a phospho-dependent spindle-associated TACC3 interactor, thereby revealing a functional role of clathrin in mitosis.
ResultsQUBIC is a rapid and efficient method to map protein complexesQUBIC builds on large-scale BAC TransgeneOmics and power-ful imaging technologies to which it adds an equally powerful quantitative protein interaction screening capability (Fig. 1). To create a platform for large-scale interaction studies in mamma-lian cells, we systematically engineered the various steps with a view to minimizing cost, time, and material while maximizing reproducibility and generic applicability without compromis-ing sensitivity. Early on, we found that single-step AP was suf-ficient to define specific interaction partners when coupled to SILAC-based quantitative proteomics performed with high res-olution liquid chromatography (LC) tandem MS (LC-MS/MS) on a mass spectrometer instrument (LTQ Orbitrap). Small mag-netic beads in combination with a flow-through column system gave the best results for bait sequence coverage by MS, de-tection of interaction partners, and robustness while keeping background proteins at acceptable levels (Fig. S1 A). The small beads provide a large surface to volume ratio and consequently favorable binding kinetics as well as short incubation times using
on Septem
ber 30, 2010jcb.rupress.org
Dow
nloaded from
Published May 17, 2010

741Quantitative BAC interactomics • Hubner et al.
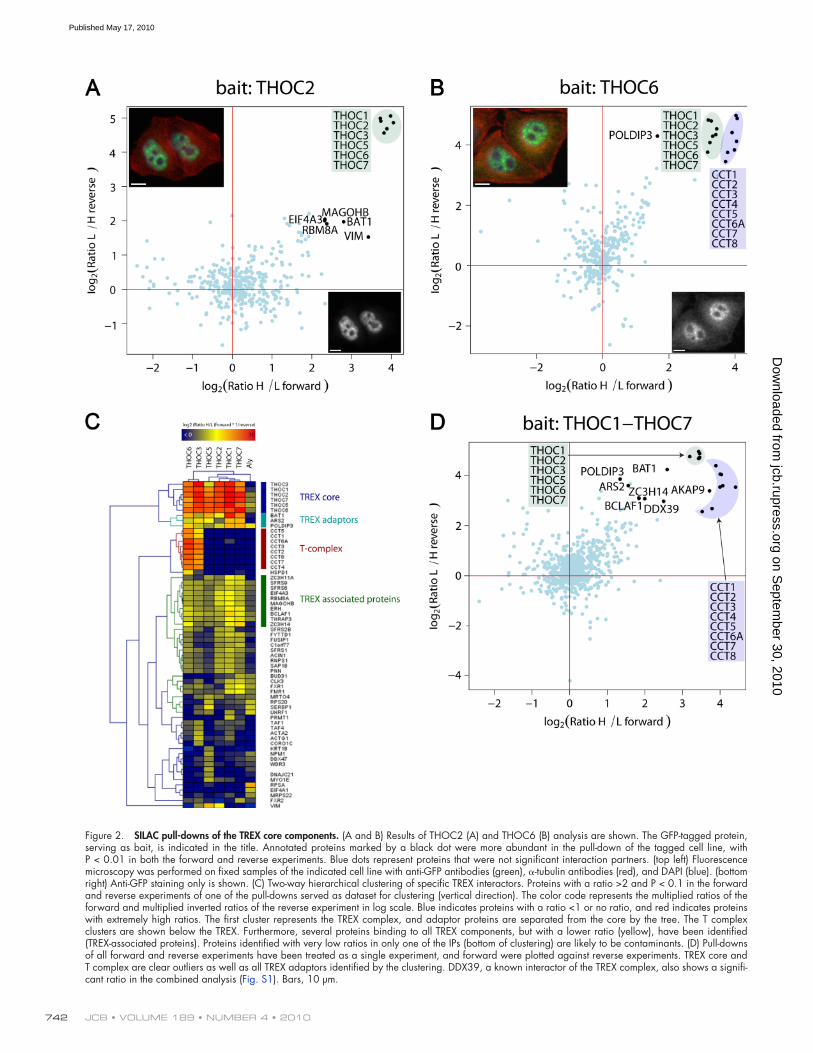
is likewise a noncore TREX interactor. Aly/THOC4, another adaptor protein, was identified in our pull-downs but not with a statistically significant ratio. It is a highly abundant nuclear pro-tein, often seen as background binder to beads, and is involved in many cellular processes, such as acting as a chaperone in the dimerization of transcription factors and mRNA processing and mRNA export from the nucleus (Virbasius et al., 1999; Reed and Cheng, 2005). The pull-down with Aly-GFP led to only moderate enrichment of Aly itself because it binds to control beads as well. Nevertheless, THOC2, -5, -6, and -7 were enriched in the Aly pull-down (Fig. 2 C). The strongest interaction was with THOC5, with which it functionally and physically inter-acts independently of the TREX complex (Fig. S2 E; Katahira et al., 2009).
Below the core and adaptor proteins, there is a cluster com-prising the entire T complex (TRiC), a chaperone with a role in folding nascent, unfolded protein chains (Fig. 2 C). As the T com-plex is only pulled down with THOC3 and THOC6, we can ex-clude that it binds to the entire TREX complex. Instead, it is likely involved in correct folding of the two proteins before they are assembled into the TREX complex.
Lastly, we combined the results of all forward and reverse pull-downs into a single graph (Fig. 2 D). By grouping all for-ward and all reverse pull-downs on the individual components
in turn associates with numerous RNA-binding proteins. This problem was minimized by the nucleic acid digestion step in the QUBIC lysis procedure, which prevents coprecipitation of mRNA and associated background proteins. SILAC pull-downs were performed in forward and reverse format, providing biological replicates and separating binders and background by their ra-tios in two dimensions (Fig. 2, A and B; and Fig. S2). The entire complex-mapping experiment required 16 single LC-MS/MS runs corresponding to 1.5 d of measurement.
All THOC core components specifically retrieved all other THOC core components (forward and reverse pull-down, P < 0.01), reliably defining the core complex (Fig. 2, A and B; and Fig S2, A–D). GFP fluorescence microscopy was performed in parallel on the same cell lines, which verified nuclear localization with a characteristic speckled pattern.
Fig. 2 C shows a two-way hierarchical clustering by ratio of significant TREX interactors (P < 0.1 in forward and reverse, and a ratio >2 for one of the baits). The TREX complex clusters at the top of the matrix, and the core members are separated from the known adaptor proteins, Bat1, and ARS2 as a result of their somewhat lower ratios. ARS2 has been reported as a weak and substoichiometric interactor, easily lost during purification (Masuda et al., 2005). POLDIP3 is a protein of unknown func-tion. Its similar pattern in the TREX pull-downs suggests that it
Figure 1. QUBIC: a method for mapping protein–protein interactions by combination of BAC TransgeneOmics and quantitative MS. (A and B) Two optimized AP-MS approaches of QUBIC are shown using either SILAC (A) or label-free (B) protein quantitation. (A) In SILAC experiments, the WT cell line without a BAC transgene is cultured in a medium containing the C12N14 form of lysine, and the tagged cell line is cultured in a medium containing the C13N15 form of lysine. Separate pull-downs using magnetic beads coupled to anti-GFP antibody are performed, and elutes merged directly after elution by in-column digestion. Peptides are identified by high resolution LC-MS/MS and quantified by directly compar-ing relative intensities of the light and heavy forms of each peptide present in the mass spectrum. Specific interaction partners show high H/L ratios, whereas background bind-ers have a ratio of 1. (B) In label-free experi-ments, tagged and control cells are cultured in normal media, and separate pull-downs are performed. Eluates are not mixed but ana-lyzed separately by LC-MS/MS. Proteins are quantified with the label-free algorithm in Max-Quant software.
on Septem
ber 30, 2010jcb.rupress.org
Dow
nloaded from
Published May 17, 2010
JCB • VOLUME 189 • NUMBER 4 • 2010 742
Figure 2. SILAC pull-downs of the TREX core components. (A and B) Results of THOC2 (A) and THOC6 (B) analysis are shown. The GFP-tagged protein, serving as bait, is indicated in the title. Annotated proteins marked by a black dot were more abundant in the pull-down of the tagged cell line, with P < 0.01 in both the forward and reverse experiments. Blue dots represent proteins that were not significant interaction partners. (top left) Fluorescence microscopy was performed on fixed samples of the indicated cell line with anti-GFP antibodies (green), -tubulin antibodies (red), and DAPI (blue). (bottom right) Anti-GFP staining only is shown. (C) Two-way hierarchical clustering of specific TREX interactors. Proteins with a ratio >2 and P < 0.1 in the forward and reverse experiments of one of the pull-downs served as dataset for clustering (vertical direction). The color code represents the multiplied ratios of the forward and multiplied inverted ratios of the reverse experiment in log scale. Blue indicates proteins with a ratio <1 or no ratio, and red indicates proteins with extremely high ratios. The first cluster represents the TREX complex, and adaptor proteins are separated from the core by the tree. The T complex clusters are shown below the TREX. Furthermore, several proteins binding to all TREX components, but with a lower ratio (yellow), have been identified (TREX-associated proteins). Proteins identified with very low ratios in only one of the IPs (bottom of clustering) are likely to be contaminants. (D) Pull-downs of all forward and reverse experiments have been treated as a single experiment, and forward were plotted against reverse experiments. TREX core and T complex are clear outliers as well as all TREX adaptors identified by the clustering. DDX39, a known interactor of the TREX complex, also shows a signifi-cant ratio in the combined analysis (Fig. S1). Bars, 10 µm.
on Septem
ber 30, 2010jcb.rupress.org
Dow
nloaded from
Published May 17, 2010

743Quantitative BAC interactomics • Hubner et al.
separating binders from background in the fold change versus p-value plane (Fig. 3 B). All detectable members of APC and the known adaptors CDC20 and FZR1 were clearly inside the accepted area with a false-positive rate <0.001.
In addition, we found FBXO5/EMI1, a reported interactor of APC and of these adaptor proteins (Miller et al., 2006). Inter-estingly, NEK2, a serine/threonine protein kinase involved in mitotic regulation, was also a significant interactor. NEK2 con-tains a KEN box through which it is targeted for destruction by the APC (Pfleger and Kirschner, 2000). We were intrigued by two novel and completely uncharacterized APC binders, both quanti-fied with >100-fold ratios. C10orf104/ANAPC16 (11.7 kD) was detected with P = 1.4 × 10⁵, and C11orf51 (14.3 kD) with P = 1.4 × 10⁴. They may have escaped detection by gel-based methods because of their small size. One of the proteins, C10orf104/ANAPC16, was identified in parallel studies as a genuine member of the APC core complex (Hutchins et al., 2010; Kops et al., 2010). C11orf51 was also identified by SILAC-QUBIC when using dou-ble labeling with arginine and lysine combined with tryptic diges-tion (Fig. S3). Furthermore, when we GFP tagged C11orf51 at both the N and C terminus, it showed a similar localization pattern to CDC23 in interphase (Fig. 3 C).
QUBIC uncovers proteins mediating phosphorylation-dependent targeting of TACC3 to the mitotic spindleWe next used QUBIC to investigate an unsolved question in mitotic spindle assembly: how does the phosphorylation of TACC3 by aurora A kinase mediate TACC3 localization to spindles? Aurora A regulates several mitotic processes (Barr and Gergely, 2007). However, how phosphorylation of specific proteins by aurora A facilitates the progression through mitosis is largely unknown. One relatively well-characterized target of aurora A is the protein TACC3, a conserved protein that has established roles in mitosis and microtubule dynamics in a variety of organ-isms (for review see Peset and Vernos, 2008). TACC3 localizes
into two single experiments, specific interactors of the complex are enhanced, whereas background binders are diminished. In-deed, all proteins annotated as TREX adaptors and several proteins annotated as TREX-associated proteins are clearly distinguished from background in this virtual pull-down experiment. For ex-ample, BAT1, POLDIP3, and ARS2 associate more closely with the core TREX complex than in the individual pull-downs. Fur-ther demonstrating the usefulness of this analysis, DDX39 pro-tein was revealed as a significant interactor, although it was not statistically significant in any single pull-downs. DDX39 is an RNA helicase, and through its interaction with THOC4 and Bat1, is an already known interactor of the TREX complex (Pryor et al., 2004).
SILAC and label-free QUBIC of the anaphase-promoting complex (APC)Although SILAC quantification is accurate and reliable, this technique requires prior labeling of the cell line under study. Be-cause the ratios between preys binding to bait and control are generally large, we investigated whether label-free quantitation could identify complex members with the same confidence. For this study, we used the APC and performed, in addition to SILAC forward and reverse pull-downs, three pull-downs of unlabeled cells with CDC23-GFP as bait. We compared the intensities of all proteins with three pull-downs with eluates from beads ex-posed to untransfected HeLa cell lysates. In contrast to a recently published method that uses spectral counting as a proxy for pep-tide abundance (Sowa et al., 2009), we integrated total signal from all peptides from our high resolution MS measurements using the MaxQuant platform (Cox and Mann, 2008; unpublished data). By far, the simplest and most robust method to assign statis-tical significance to pull-down results turned out to be a t test comparing the three IPs with the three controls. We accepted pro-teins based on a combination of this p-value and the observed fold change (Tusher et al., 2001). A newly developed soft-ware package (QUBICvalidator) calculates a significance curve,
Figure 3. SILAC and label-free pull-downs of CDC23. (A) SILAC pull-down of CDC23 versus the untagged HeLa cell line. Annotated proteins were specific interaction partners of CDC23 with a p-value of ratio significance <0.001. APC core proteins are separated from APC adaptors (CDC20 and FZR1) by intensity. (B) Volcano plot representing results of the label-free pull-down of CDC23. The logarithmic ratio of protein intensities in the CDC23/HeLa pull-downs were plotted against negative logarithmic p-values of the t test performed from triplicates. A hyperbolic curve separates specific CDC23-interacting proteins marked in black (red dotted line) from background (blue dots). The known components of the APC (C10orf104/ANAPC16 only recently char-acterized in parallel studies), several known APC adaptors, and one uncharacterized protein, C11orf51, show a significant ratio in combination with high reproducibility (positive log2 ratios). (C) Localization patterns of GFP-tagged CDC23 and the new component C11orf51 in interphase. Bars, 10 µm.
on Septem
ber 30, 2010jcb.rupress.org
Dow
nloaded from
Published May 17, 2010
JCB • VOLUME 189 • NUMBER 4 • 2010 744
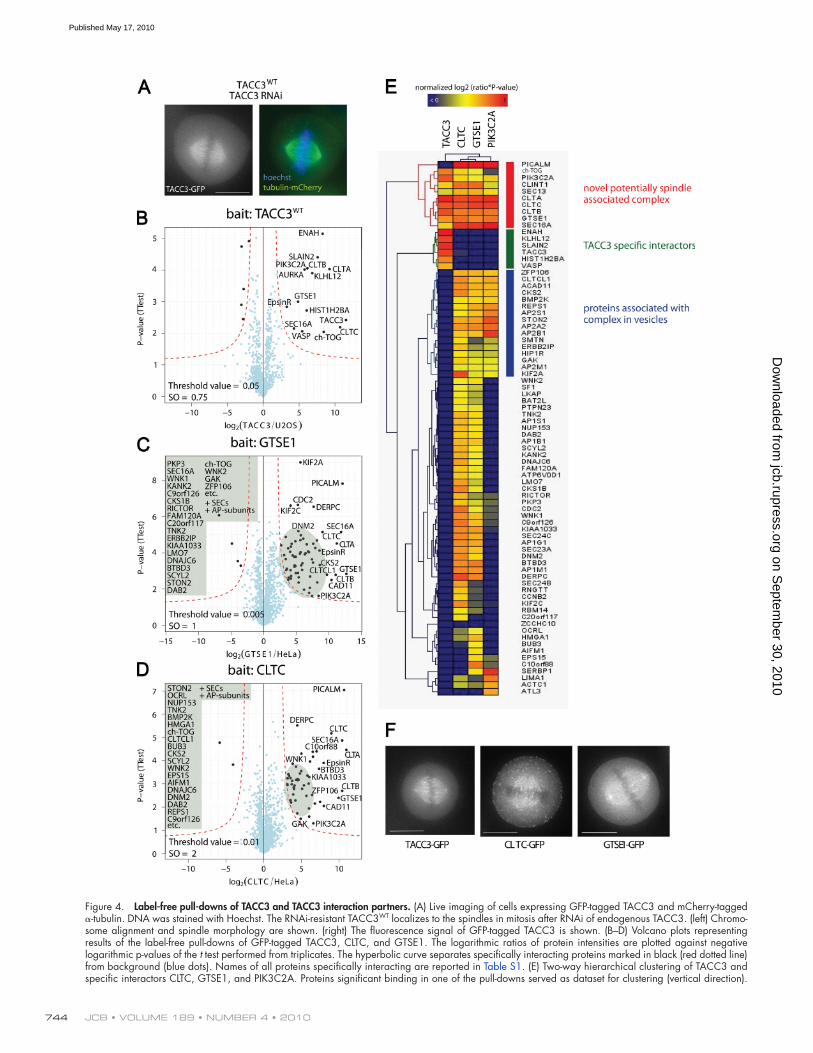
Figure 4. Label-free pull-downs of TACC3 and TACC3 interaction partners. (A) Live imaging of cells expressing GFP-tagged TACC3 and mCherry-tagged -tubulin. DNA was stained with Hoechst. The RNAi-resistant TACC3WT localizes to the spindles in mitosis after RNAi of endogenous TACC3. (left) Chromo-some alignment and spindle morphology are shown. (right) The fluorescence signal of GFP-tagged TACC3 is shown. (B–D) Volcano plots representing results of the label-free pull-downs of GFP-tagged TACC3, CLTC, and GTSE1. The logarithmic ratios of protein intensities are plotted against negative logarithmic p-values of the t test performed from triplicates. The hyperbolic curve separates specifically interacting proteins marked in black (red dotted line) from background (blue dots). Names of all proteins specifically interacting are reported in Table S1. (E) Two-way hierarchical clustering of TACC3 and specific interactors CLTC, GTSE1, and PIK3C2A. Proteins significant binding in one of the pull-downs served as dataset for clustering (vertical direction).
on Septem
ber 30, 2010jcb.rupress.org
Dow
nloaded from
Published May 17, 2010

745Quantitative BAC interactomics • Hubner et al.
The rapid availability of BAC transgene cell lines allowed us to perform reverse IP experiments using CLTC, GTSE1, and PIK3C2A as baits. This analysis revealed that these proteins all interact with each other and bind to several proteins that were ini-tially identified as TACC3 interaction partners, including ch-TOG, CLINT1, and SEC16A (Fig. 4, C and D; and Fig. S4 A). We clus-tered specific interaction partners according to their variability in the replicate experiments and the ratios between bait and control. This uncovered a putative novel complex consisting of clathrin heavy and light chain subunits CLTA, CLTB, and CLTC, as well as CLINT1, SEC13, SEC16, PICALM, GTSE1, PIK3C2A, and ch-TOG (Fig. 4 E). In addition to a different cluster containing TACC3-specific interactors (Fig. 4 E, green), we found several proteins that interact with CLTC, GTSE1, and PIK3C2A but not TACC3 (Fig. 4 E, blue). Many of the proteins in the latter cluster are known to be located in clathrin-coated vesicles. This cluster likely represents clathrin-associated proteins present in vesi-cles in mitotic cells (Fig. 4 F) that do not interact with the spindle- associated clathrin directly.
The BAC-GFP cell lines allowed us to analyze the mitotic localization of putative spindle-associated interactors by fluores-cence microscopy. We found that the clathrin (CLTC) and GTSE1-GFP constructs indeed localize to mitotic spindles similar to TACC3 (Fig. 4 F), which is consistent with an interaction. We next sought to determine through QUBIC whether any of the TACC3 interactors would fail to bind TACC3 when it is not phosphorylated by aurora A. Such proteins would be candidates for targeting TACC3 to spindles. We inhibited aurora A phos-phorylation of a GFP-tagged TACC3 construct through two complementary methods: treating wild-type (WT) TACC3-GFP cells with the aurora A inhibitor MLN8054 and generating point mutations in conserved aurora A sites in the TACC3-GFP pro-tein. For the latter, we additionally engineered three point muta-tions into the siRNA-resistant TACC3WT construct in conserved serines previously shown in Xenopus laevis or human cells to be phosphorylated by aurora A (S34A, S552A, and S558A [TACC3AAA]; Kinoshita et al., 2005; LeRoy et al., 2007).
The TACC3WT construct was not associated with spindles after 5 h of treatment with 500 nM MLN8054, which is in agree-ment with previous results (Fig. 5 A, bottom; LeRoy et al., 2007). In a complementary approach, we analyzed our phosphosite-mutated TACC3AAA line. RNAi of endogenous TACC3 in the TACC3WT line had no effect on TACC3WT localization to the spin-dle, whereas RNAi of endogenous TACC3 in the TACC3AAA line resulted in the loss of TACC3AAA from the spindle, which is similar to MLN8054 treatment (Fig. 5 B). This is consistent with previous data that a TACC3 cDNA transgene mutated at S558A does not target to mitotic spindles (LeRoy et al., 2007). We additionally found that when TACC3AAA was the only version of TACC3 expressed in cells, we observed perturbations in
to the mitotic spindle and interacts and shares functions with the microtubule polymerase ch-TOG/CKAP5 (Gergely et al., 2000, 2003; Cullen and Ohkura, 2001; Lee et al., 2001). TACC3 also interacts with aurora A, which phosphorylates TACC3 on spe-cific serine residues (Giet et al., 2002; Kinoshita et al., 2005). This phosphorylation regulates localization of TACC3 to the mitotic spindle, as depletion of aurora A or mutation of aurora A phosphorylation sites in TACC3 results in TACC3 mislocalization in several systems (Giet et al., 2002; Bellanger and Gönczy, 2003; Srayko et al., 2003; Barros et al., 2005; Kinoshita et al., 2005). Furthermore, inhibition of aurora A activity with an aurora A– specific small molecule inhibitor, MLN8054 (Manfredi et al., 2007), also delocalizes TACC3 from spindles in human cells (LeRoy et al., 2007).
Despite the many studies on TACC3 and aurora A, it is still unknown how TACC3 is recruited to mitotic spindles and why phosphorylation by aurora A is required. To elucidate the molecular mechanisms responsible for aurora A–dependent TACC3 targeting to the spindle, we wished to identify the pro-teins that interact with TACC3 in mitosis and to determine which of these interactions was dependent on TACC3 phosphorylation. We initially performed QUBIC on a TACC3-GFP cell line to identify interacting proteins. To validate the function of the TACC3-GFP transgene, and to subsequently combine QUBIC with functional RNAi experiments, we first made an RNAi-resistant TACC3-GFP BAC construct by recombineering based mutation of the region targeted by a 21mer siRNA. This con-struct, in addition to an mCherry–-tubulin–expressing con-struct, was stably transfected into U2OS cells. The functionality of the TACC3-GFP protein was verified by its correct localiza-tion to mitotic spindles and by the fact that it did not show any noticeable phenotype after RNAi of the endogenous TACC3 (Fig. 4 A). We refer to this line as TACC3WT.
Because aurora A phosphorylates TACC3 during mitosis (Kinoshita et al., 2005), we next immunoprecipitated TACC3 from mitotically arrested cells to identify interacting proteins. TACC3 itself is the most enriched protein in the pull-down (Fig. 4 B), and the known interactors aurora A and ch-TOG also had significant p-values (P < 0.01). Multiple novel interactors were also identified by QUBIC. Interestingly, these included three clathrin subunits, CLTA, CLTB, and CLTC, as well as PIK3C2A, which associates with clathrins and is involved in mito-sis (Gaidarov et al., 2001; Didichenko et al., 2003). These results are consistent with the finding that clathrin concentrates at the spindle apparatus in mitosis and is involved in microtubule sta-bilization (Okamoto et al., 2000; Royle et al., 2005). The pro-tein GTSE1 was also recovered as a significant TACC3-binding protein. GTSE1 has been reported to localize to interphase micro-tubules, but its known functions are related to p53 regulation (Utrera et al., 1998; Monte et al., 2004).
The color code represents the normalized log2 of ratios multiplied with the negative logarithmic p- values of the t test. Blue fields represent values close to 0, and the protein is therefore unlikely to be binding, whereas red fields represent highly specific binders in the distinct pull-down experiment. The first cluster represents a novel spindle-associated complex (red). The second cluster represents TACC3-specific interactors (green). The cluster marked in blue mainly consists of proteins associated with clathrin-coated vesicles. (F) Fluorescence microscopy showing live GFP fluorescence of TACC3, CLTC, and GTSE1 C-terminally tagged with GFP by the BAC TransgenOmics standard protocol. Both TACC3 interactors localize to the mitotic spindle. Bars, 10 µm.
on Septem
ber 30, 2010jcb.rupress.org
Dow
nloaded from
Published May 17, 2010

JCB • VOLUME 189 • NUMBER 4 • 2010 746
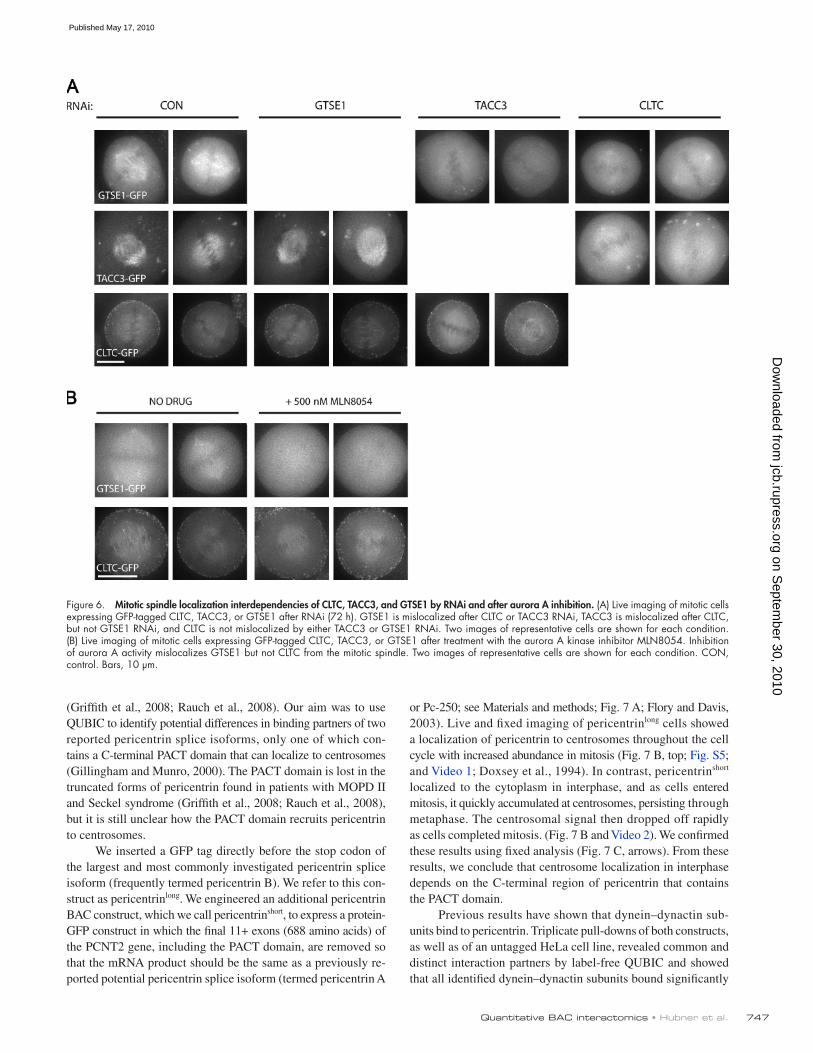
To confirm and expand the spindle localization dependen-cies of these proteins, we additionally performed RNAi of TACC3, CLTC, and GTSE1 in CLTC-GFP and GTSE1-GFP cell lines (Fig. 6). We found that depletion of neither GTSE1 nor TACC3 resulted in mislocalization of CLTC-GFP from spindles, which is consistent with our hypothesis that clathrin recruits TACC3 to spindles and suggesting that GTSE1 is re-cruited through clathrin as well. GTSE1 RNAi depleted protein levels to <10%, confirming the efficiency of the siRNA used (un-published data). Conversely, individual RNAi of both TACC3 and CLTC displaced GTSE1 from spindles, suggesting that GTSE1 is recruited downstream of phospho-TACC3 to these spindles. These results support a mechanism in which clathrin is first recruited to spindles independently of aurora A. Aurora A phosphorylation of TACC3 then allows it to interact with clath-rin and to localize to spindles. In this study, phospho-TACC3 also recruits GTSE1. For confirmation of this mechanism, we next analyzed the localization of these proteins after treat-ment with the aurora A inhibitor MLN8054. Consistent with the aforementioned hypothesis, inhibition of aurora A activity re-sulted in the mislocalization of TACC3-GFP (Fig. 4 A, bottom; LeRoy et al., 2007) and GTSE1-GFP from spindles but not of CLTC-GFP (Fig. 6).
Interaction and localization analysis of pericentrin isoformsPericentrin is a large (>350 kD) conserved protein that localizes to centrosomes and the pericentriolar material and is required for centrosome function (Doxsey et al., 1994). Mutations in the pericentrin gene (PCNT2), including stop, missense, and splice site mutations, are linked to the MOPD II and Seckel syndrome disorders, which are characterized by dwarfism and microcephaly
spindle integrity and chromosome alignment (Fig. 5 B). Thus, both methods of inhibiting aurora A phosphorylation of TACC3 led to mislocalization of TACC3 from spindles and defects in spindle assembly.
We then used label-free QUBIC to investigate the under-lying proteomics changes associated with these phosphorylation events. We compared interaction partners of TACC3WT with cells treated with aurora A kinase inhibitor or cells expressing the TACC3AAA phosphomutant. When aurora A activity was inhibited by MLN8054 treatment, GTSE1 and CLINT1 bound much less to TACC3, as did the three clathrin subunits (CLTA, CLTB, and CLTC; Fig. 5 C). PIK3C2A, ch-TOG, and SEC16A showed some reduced binding, although to a lesser extent, whereas other inter-actors exhibited no phospho-dependent binding. Comparing TACC3AAA with TACC3WT interactors confirmed a differential, phospho-dependent interaction of GTSE1 and the clathrin sub-units (Fig. S4 D). Strikingly, all proteins that showed differen-tial binding to TACC3 upon aurora A kinase inhibitor treatment belong to the aforementioned novel complex (Fig. 5 E), whereas proteins that did not change clustered separately as TACC3-specific interactors in the initial pull-down. This suggests that members of this putative spindle-associated complex may either recruit TACC3 to mitotic spindles after its phosphorylation by aurora A or otherwise require this phosphorylation for local-ization to spindles.
To test whether clathrin or GTSE1 was required to local-ize TACC3 to spindles, we performed RNAi of CLTC or GTSE1 in TACC3WT cells that also stably expressed mCherry–-tubulin. RNAi of CLTC but not GTSE1 delocalizes TACC3 from spin-dles (Fig. 6 D). Thus, clathrin but not GTSE1 targets TACC3 to mitotic spindles, which is likely dependent on the phosphoryla-tion of TACC3.
Figure 5. Label-free pull-downs of TACC3 untreated and treated with aurora A inhibitor. (A and B) Live imaging of cells expressing GFP-tagged TACC3 and mCherry-tagged -tubulin. DNA was stained with Hoechst. (top) Chromo-some alignment and spindle morphology are shown. (bottom) The fluorescence signal of GFP-tagged TACC3 is shown. (A) TACC3WT normally localizes to spindles in untreated cells (left) but is mislocalized away from spindles after treatment with the aurora A kinase inhibi-tor MLN8054, similar to TACC3AAA (middle and right). Under both MLN8054-treated and mutant TACC3 conditions, spindle morphology and chromosome alignment are compromised. (B) The RNAi-resistant TACC3AAA mutant does not localize to spindles after RNAi of endog-enous TACC3 (middle and right). (C) Volcano plot representing differential binding partners of TACC3 in dependence of treatment with aurora A kinase inhibitor. The logarithmic ratios of protein intensities are plotted against nega-tive logarithmic p-values of the t test performed from triplicates. Proteins binding specifically in either condition are marked in black and annotated. (D) Localization of TACC3 after RNAi of phospho-dependent interactors. Cells expressing TACC3WT and mCherry–-tubulin were transfected with control (CON), CLTC, or GTSE1 siRNAs, and live cells were imaged after 72 h. TACC3 is mislocalized from spindles after CLTC but not GTSE1 RNAi. Bars, 10 µm.
on Septem
ber 30, 2010jcb.rupress.org
Dow
nloaded from
Published May 17, 2010
747Quantitative BAC interactomics • Hubner et al.
or Pc-250; see Materials and methods; Fig. 7 A; Flory and Davis, 2003). Live and fixed imaging of pericentrinlong cells showed a localization of pericentrin to centrosomes throughout the cell cycle with increased abundance in mitosis (Fig. 7 B, top; Fig. S5; and Video 1; Doxsey et al., 1994). In contrast, pericentrinshort localized to the cytoplasm in interphase, and as cells entered mitosis, it quickly accumulated at centrosomes, persisting through metaphase. The centrosomal signal then dropped off rapidly as cells completed mitosis. (Fig. 7 B and Video 2). We confirmed these results using fixed analysis (Fig. 7 C, arrows). From these results, we conclude that centrosome localization in interphase depends on the C-terminal region of pericentrin that contains the PACT domain.
Previous results have shown that dynein–dynactin sub-units bind to pericentrin. Triplicate pull-downs of both constructs, as well as of an untagged HeLa cell line, revealed common and distinct interaction partners by label-free QUBIC and showed that all identified dynein–dynactin subunits bound significantly
(Griffith et al., 2008; Rauch et al., 2008). Our aim was to use QUBIC to identify potential differences in binding partners of two reported pericentrin splice isoforms, only one of which con-tains a C-terminal PACT domain that can localize to centrosomes (Gillingham and Munro, 2000). The PACT domain is lost in the truncated forms of pericentrin found in patients with MOPD II and Seckel syndrome (Griffith et al., 2008; Rauch et al., 2008), but it is still unclear how the PACT domain recruits pericentrin to centrosomes.
We inserted a GFP tag directly before the stop codon of the largest and most commonly investigated pericentrin splice isoform (frequently termed pericentrin B). We refer to this con-struct as pericentrinlong. We engineered an additional pericentrin BAC construct, which we call pericentrinshort, to express a protein-GFP construct in which the final 11+ exons (688 amino acids) of the PCNT2 gene, including the PACT domain, are removed so that the mRNA product should be the same as a previously re-ported potential pericentrin splice isoform (termed pericentrin A
Figure 6. Mitotic spindle localization interdependencies of CLTC, TACC3, and GTSE1 by RNAi and after aurora A inhibition. (A) Live imaging of mitotic cells expressing GFP-tagged CLTC, TACC3, or GTSE1 after RNAi (72 h). GTSE1 is mislocalized after CLTC or TACC3 RNAi, TACC3 is mislocalized after CLTC, but not GTSE1 RNAi, and CLTC is not mislocalized by either TACC3 or GTSE1 RNAi. Two images of representative cells are shown for each condition. (B) Live imaging of mitotic cells expressing GFP-tagged CLTC, TACC3, or GTSE1 after treatment with the aurora A kinase inhibitor MLN8054. Inhibition of aurora A activity mislocalizes GTSE1 but not CLTC from the mitotic spindle. Two images of representative cells are shown for each condition. CON, control. Bars, 10 µm.
on Septem
ber 30, 2010jcb.rupress.org
Dow
nloaded from
Published May 17, 2010

JCB • VOLUME 189 • NUMBER 4 • 2010 748
are already known to depend on each other (Haren et al., 2009), our QUBIC experiment was the first evidence of a protein–protein interaction between these two centrosome proteins. Enhanced binding to the short form was surprising because the long form should have all domains of the short form. To investigate possi-ble further differences between the baits, we mapped all identi-fied pericentrin peptides to both forms (Fig. 8 D). We identified 91 and 128 peptides from the pericentrinlong and pericentrinshort pull-downs, respectively. None of the peptides found in the pericentrinshort pull-down mapped to the C-terminal 688–amino acid
more to pericentrinlong (Fig. 8). PCM-1, a pericentriolar protein known to bind pericentrin (Li et al., 2001) and Fam133A, an uncharacterized protein of 30 kD, also bound preferentially to the pericentrinlong construct (ratio of 3.9, P = 5.7 × 10³; and ratio of 4.6, P = 1.4 × 10³).
Interestingly, one centrosomal protein, CDK5RAP2/Cep215 (Graser et al., 2007; Fong et al., 2008; Haren et al., 2009), was significantly enriched in the pull-down of the short construct (5.7-fold; P = 1.1 × 10³; Fig. 8, A and C). Although the centro-somal localization patterns of CDK5RAP2/Cep215 and pericentrin
Figure 7. Fluorescence analysis of pericentrinlong and pericentrinshort cell lines. (A) Diagram of pericentrinlong and pericentrinshort BAC constructs. Pericentrinshort lacks a 29.5-kb region of genomic DNA present in pericentrinlong, including the PACT domain (red). The green and yellow box represents the GFP cassette. (B) Pericentrinlong and pericentrinshort show distinct cell cycle localizations. Still images from videos of GFP fluorescence are shown. (top) Pericentrinlong localizes to centrosomes throughout the cell cycle. (bottom) Pericentrinshort only shows centrosomal localization in mitosis. (C) Immunofluores-cence showing pericentrinshort localization to centrosomes. Mitotic but not interphase centrosomes are stained by anti-GFP (pericentrinshort), whereas anti-pericentrin antibody labels all centrosomes. Arrows point to the location of interphase centrosomes. (bottom) Enlarged images of the above boxed regions are shown, containing two prophase/prometaphase centrosomes and one interphase centrosome. Cells are stained for -tubulin, GFP (pericentrinshort), pericentrin, and DNA. Bars, 10 µm.
on Septem
ber 30, 2010jcb.rupress.org
Dow
nloaded from
Published May 17, 2010

749Quantitative BAC interactomics • Hubner et al.
beads, leading to favorable kinetics and therefore short incuba-tion times, increasing the interactor to background ratio. Elu-tion from the beads is performed by direct in-column enzymatic digestion. Among different quantification methods, we found that label-free quantification of high resolution MS data using the MaxQuant algorithms provided the best separation of back-ground and specific binders. High resolution MS is an integral part of the QUBIC procedure because it leads to accurate quan-titation of bait pull-down against control pull-down. This effi-ciently distinguishes specific binders from background proteins, even when the latter are of much higher abundance. The QUBIC technology has been applied on hundreds of baits in different projects in our laboratory and has proven extremely robust with-out requiring case-specific optimization.
In Table I, we summarize different aspects of the three existing major AP-MS approaches, which are based on tagged cDNA with TAP purification (Sowa et al., 2009), tagged cDNA with single-step purification (Glatter et al., 2009), or purifica-tion of endogenous protein complexes using specific antibodies (Trinkle-Mulcahy and Lamond, 2007), and compare them with QUBIC. TAP has been the basis of some of the most successful work so far in yeast, but it clearly only works for very stable as-sociations. QUBIC only requires a small fraction of the large amounts of input material required in TAP-tagging approaches. Furthermore, the combination of high yields with short purifica-tion times minimizes the risk of losing weak interactions com-pared with TAP procedures. The cDNA approach inevitably involves ectopic expression of the gene, which can lead to incor-rect localization (and therefore inappropriate binding) and forced interactions that do not occur in vivo. For example, many cDNA baits are not naturally expressed at all in the system that is used
region of pericentrin, confirming its absence from the expressed protein. Surprisingly, however, a second region of 500 amino acids, directly N terminal to this region, was well represented (25 peptides) in the short form but absent in the long form. This was unexpected, as the published predominant cDNA, which shares the C terminus with the pericentrinlong construct, contains these regions. Analysis of the genomic DNA of these cells con-firmed that the DNA encoding this region was present in both constructs. Therefore, we assume that the observed discrepancy is the result of cell type–specific splicing or processing events. The finding that pericentrinshort contains a region not found in pericentrinlong is the likely explanation of the preferential bind-ing of CDK5RAP2/Cep215 to this construct.
DiscussionRecent developments in functional genomics using procedures such as RNAi have revolutionized the study of phenotype by scaling up the rate at which these experiments can be performed in a genome-wide manner. However, follow-up techniques, which map the proteomic changes underlying these phenotypic changes, have lagged behind these studies. With QUBIC, we have devel-oped an effective technology for studying cell biological ques-tions in the area of protein interactions, which addresses these challenges. Our study shows that modern techniques in MS to-gether with BAC-based recombineering and live cell imaging allow rapid and quantitative assessment of members of a protein complex and how they change in response to acute chemical or mutational perturbations.
The QUBIC procedure described in this study has several attractive features. Interactors are captured on nanometer-sized
Figure 8. Pull-downs of pericentrin splice iso-forms. (A–C) Volcano plots representing results of the label-free pull-downs of GFP-tagged peri-centrinshort and pericentrinlong. The logarithmic ratio of protein intensities in the pericentrin/HeLa (A and B) and pericentrinlong/pericentrinshort (C) pull-downs were plotted against negative logarithmic p-values of the t test performed from triplicates. (A and B) The hyperbolic curve separates specific pericentrin-interacting proteins marked in black (red dotted line) from background (blue dots). (C) Proteins binding specifically to either form of pericentrin are marked in black. The dotted line represents the ratio of pericentrinlong/pericentrinshort. (D) Plot-ted relative intensities of all peptides identified from pericentrinshort (blue) and pericentrinlong (red). The N-terminal part of the protein was identified in both pull-downs, whereas there is a stretch of 500 amino acids unique to the pericentrinshort form (green box). The C terminus was deleted in pericentrinshort, and therefore, peptides from this region were only identified in the pull-downs of pericentrinlong (brown box).
on Septem
ber 30, 2010jcb.rupress.org
Dow
nloaded from
Published May 17, 2010

JCB • VOLUME 189 • NUMBER 4 • 2010 750
rather than expressing a protein from an artificial cDNA construct. High resolution MS can then characterize the isoforms expressed as shown in this study.
These applications demonstrate that QUBIC provides a versatile platform to accommodate second generation functional interaction experiments. Importantly, the quantitative nature of QUBIC makes it readily compatible with chemical inhibition or RNAi depletion, although these techniques often do not achieve full penetrance.
Despite the broad capabilities and versatility of QUBIC, it can readily be performed by nonspecialist laboratories. For BAC TransgeneOmics, BACs can be ordered and processed, and stable cell lines were generated according to published pro-tocols (Zhang et al., 1998; Poser et al., 2008). All other steps similarly require only standard laboratory equipment or readily available reagents and only knowledge of common biochemical procedures. Costs per pull-down are very low. QUBIC does re-quire access to high resolution MS equipment coupled to high performance LC. However, such equipment is increasingly accessible, and the MS analyses themselves are relatively stan-dard. Data analysis can be performed using the freely avail-able MaxQuant software suite. Thus, any laboratory can select genes of interest and perform QUBIC on them in a wide variety of formats.
To make it easy for the research community to perform QUBIC, we need to create the generic resources involved. This includes the genome-wide generation of BAC-based vectors consisting of the gene of interest fused 5 or 3 to the GFP-containing cassette. First, this set of DNA constructs should be available as a resource. Second, stable cell lines of at least one common model cell line should be generated with these con-structs and be available to the community. We have already streamlined the BAC TransgeneOmics process (Sarov et al., 2006; Poser et al., 2008). Based on our experience and the fact that we have so far created hundreds of stable cell lines, we pre-dict that scale up to the whole genome is entirely feasible.
to study interactions. The second strategy of using antibodies against endogenous proteins is theoretically the best way to de-fine in vivo interactions. However, it is not scalable, and it com-pletely depends on the specificity of the antibody.
QUBIC is the only approach that combines the advantages of endogenous gene processing and gene expression while still retaining scalability. Because it uses BAC-GFP technology, it already comes with several desirable features. These include a large reagent base, manipulation of the bait by BAC recombineer-ing, access to large genes that are not contained in cDNA libraries (or that are corrupted in those libraries), and of course direct coupling to powerful microscopy methods such as 96-well–based live cell imaging. The major conceptual advance in QUBIC is the extension of methods that were possible only in yeast to the mammalian system.
In addition, QUBIC exemplifies how interaction proteomics can be used to rapidly study the proteomic changes underly-ing phenotypic perturbation. By inhibiting phosphorylation of TACC3 either by small molecule inhibition of its upstream kinase or by point mutation of conserved phosphorylation sites, we identified several proteins that preferentially bind aurora A–phosphorylated TACC3, representing a novel complex associ-ated with spindles in mitosis. We have identified one member of this complex required for the interaction of phosphorylated TACC3 with spindles in clathrin heavy chain (CLTC). Clathrin targeting of TACC3 to spindles suggests that reported mitotic phenotypes associated with clathrin RNAi and the observed role of clathrin in microtubule stability (Royle et al., 2005) are caused by the mislocalization of TACC3.
We also show that different forms of the protein pericentrin interact with different subsets of centrosomal proteins, which may explain their divergent localization patterns. Additionally, we found that the predominant pericentrin isoform expressed in these cells differs from the published cDNA sequence. This re-sult illustrates a major advantage of using BACs as transgenes in that they allow the cell to process the relevant splice isoforms
Table I. Strengths and weaknesses of different AP-MS approaches
Strength/weakness Tagged cDNA Specific antibodiesc QUBIC
Single-step purificationa TAP purificationb
Endogenous gene expression level + +Endogenous gene processing + +Material required + + +Transient interactors + +/ +True quantification for background
discrimination+/ + +/ +
Objective statistical evaluation +/ +/ +/ +Sensitivity + +/ +Measurement time +/ + +Standard protocol for all baits +/ +/ +Compatible with imaging methods +/ +/ +
+, fulfilled; +/, partially fulfilled; , not fulfilled. Three common AP-MS strategies are summarized and compared with QUBIC. There are different aspects that facili-tate reliable and scalable results in MS-based interaction mapping. Before QUBIC, it is possible to meet some but not all of these requirements at the same time.aSowa et al., 2009.bGlatter et al., 2009.cTrinkle-Mulcahy and Lamond, 2007.
on Septem
ber 30, 2010jcb.rupress.org
Dow
nloaded from
Published May 17, 2010

751Quantitative BAC interactomics • Hubner et al.
(Invitrogen), respectively. For SILAC labeling, HeLa cells were cultured for 2 wk in DME (4.5 g/L glucose) without lysine and with methionine (Invitro-gen) containing 49 mg/ml light (C12N14) or heavy (C13N15) lysine (Euriso-Top), 100 U/ml penicillin (Invitrogen), 100 mg/ml streptomycin (Invitrogen), and 10% fetal bovine serum dialyzed with a cut off of 10 kD (Invitro-gen) at 37°C and 5% CO2. The WT cell line was treated the same as a control. Cells were harvested using trypsin, washed once with PBS, and the pellet was shock frozen in liquid nitrogen and stored at 80°C until used for IP.
Specific cell culture of TACC3 cells for QUBICFor aurora A inhibitor experiments, triplicate experiments each using four 15-cm dishes of GFP-tagged TACC3 and two 15-cm dishes of U2OS con-trol cells were seeded to 60% confluence and arrested in mitosis by adding 2 mM thymidine (Sigma-Aldrich) for 20 h. They were then washed with PBS, and fresh media were added. After 6 h, 100 ng/ml nocodazole was added, and after an additional 3 h, aurora A kinase inhibitor MLN8054 (provided by J. Ecsedy, Millennium Pharmaceuticals, Cambridge, MA) was added to two TACC3 dishes to a final concentration of 500 nM. 5 h later, all cells were harvested.
For TACC3 RNAi of cells before QUBIC analysis, 107 cells for each condition were resuspended in 8 ml media without antibiotics. Transfection complexes containing of 1.8 nmol siRNA and 30 µl Oligofectamine were added to cells in a 50-ml tube. Cells were incubated for 6 h at 37°C with occasional agitation and plated. 77 h after transfection, nocodazole was added to cells for 22 h, at which point cells were harvested for analysis.
IPCell pellets were thawed on ice and incubated for 30 min at room tempera-ture in 1 ml lysis buffer containing 150 mM NaCl, 50 mM Tris, pH 7.5, 5% glycerol, 1% IGEPAL-CA-630, 1 mM MgCl2, 200 U benzonase (Merck), and EDTA-free complete protease inhibitor cocktail (Roche). When study-ing phospho-dependent interactions, phosphatase inhibitors (Roche) were added as well. Lysates were cleared by centrifugation at 4,000 g and 4°C for 15 min to remove remaining membrane and DNA, and the supernatant was incubated with 50 µl magnetic beads coupled to monoclonal mouse anti-GFP antibody (Miltenyi Biotec) for 15 min on ice. Because of the ex-tremely small size of the beads (50 nm), they are nonsedimenting and show fast reaction kinetics. Magnetic columns were equilibrated using 250 µl lysis buffer. Cell lysates were added to the column after incubation and washed three times with 800 µl ice-cold wash buffer I containing 150 mM NaCl, 50 mM Tris, pH 7.5, 5% glycerol, and 0.05% IGEPAL-CA-630, and two times with 500 µl of wash buffer II containing 150 mM NaCl, 50 mM Tris, pH 7.5, and 5% glycerol. Purified proteins were predigested by add-ing 25 µl 2 M urea in 50 mM Tris, pH 7.5, 1 mM DTT, and 150 ng Endo-LysC (Wako Chemicals USA, Inc.) for SILAC experiments or 150 ng trypsin (Promega) for label-free experiments. After in-column digestion for 30 min at room temperature, proteins were eluted by adding two times 50 µl 2 M urea in 50 mM Tris, pH 7.5, and 5 mM chloroacetamide. In SILAC experi-ments, heavy and light eluates of transgenic cell line and the correspond-ing WT cell line were combined immediately after elution from the columns. Proteins were digested overnight at room temperature. The digestion was stopped by adding 1 µl trifluoroacetic acid, and peptides of each experi-ment were split and purified on two C18 Stage Tips and stored at 4°C (Rappsilber et al., 2007).
Pull-downs can be performed manually on a hand magnet. In our laboratory, pull-downs were performed on the automated liquid-handling platform (Freedom EVO 200; Tecan) in a fully automated manner.
LC-MS/MS analysisPeptides were eluted from C18 Stage Tips with 2 × 20 µl solvent B (80% acetonitrile and 0.5% acetic acid). Acetonitrile was evaporated, and thereby, the volume reduced to 5 µl in a speed vacuum centrifuge. 10 µl solvent containing 2% acetonitrile and 0.1% trifluoroacetic acid was added.
Peptides were separated on line to the mass spectrometer by using an easy nano-LC system (Proxeon Biosystems). 5 µl samples were loaded with a constant flow of 700 nl/min onto a 15-cm fused silica emitter with an inner diameter of 75 µm (IntelliFlow; Proxeon Biosystems) packed in house with RP ReproSil-Pur C18-AQ 3 µm resin (Dr. Maisch). Peptides were eluted with a segmented gradient of 2–60% (for trypsin digest) and 5–60% (for EndoLysC digest) solvent B over 105 min with a constant flow of 250 nl/min. The nano-LC system was coupled to a mass spectrometer (LTQ-Orbitrap; Thermo Fisher Scientific) via a nanoscale LC interface (Proxeon Biosystems). The spray voltage was set to 2.1 kV, and the temperature of the heated capillary was set to 180°C.
Materials and methodsBAC constructsBACs containing the gene of interest were purchased from BACPAC Resources Center (for detailed information see Supplemental data). A LAP tag cassette (Poser et al., 2008) was recombined at the C terminus of all TREX components, CDC23, TACC3, CLTC, GTSE1, and PIK3C2A by Red E/T–based recom-bination (Zhang et al., 1998; Muyrers et al., 2001). Point mutations in TACC3 were introduced through recombineering using counter selection based on an RpsL-amp cassette (Guo et al., 2006; Bird and Hyman, 2008) as described in the Counter Selection BAC Modification kit (Genebridges). For the pericentrinlong construct, a GFP tag cassette was recombined at the C termi-nus of the PCNT2 gene, ending with the amino acid sequence QKIKQ. For the pericentrinshort construct, a GFP tag cassette was recombined into the coding region of the PCNT gene to directly follow the amino acid sequence QKTLSK, while simultaneously deleting all of the following exons until the 3 UTR, so as to match the sequence in the 3 end of GenBank accession no. AY179559.
Cell culture and cell lines for BAC transfectionU2OS, HeLa, and HeLa Kyoto cells were grown in DME containing 10% fetal bovine serum, 2 mM L-glutamine, 100 U/ml penicillin, and 100 mg/ml streptomycin at 37°C and 5% CO2. BAC constructs or an mCherry– -tubulin plasmid were transfected into cells in 6-cm dishes with 20 µl Effectene (QIAGEN) following the manufacturer’s protocol, and stable line popula-tions were selected on G418 (BACs) or puromycin. TACC3 constructs were used in U2OS cells, pericentrin constructs were used in HeLa cells, and CLTC, PIK3C2A, APC members, and TREX members were used in HeLa Kyoto cells. GTSE1 constructs for pull-downs were used in HeLa Kyoto cells, and for localization after RNAi and inhibitor treatment, were used in U2OS cells. For siRNA transfections, cells were added to prewarmed media, and transfection complexes containing 2.0 µl Oligofectamine (Invitrogen) and 80 pmol (TACC3 and control) or 40 pmol (GTSE1, CLTC, and control) siRNA added immediately afterward in a total volume of 500 µl. Media were changed after 6–8 h. Control (Silencer Negative Control #3), TACC3 (5-GUUACCGGAAGAUCGUCUG-3), GTSE1 (5-CGGCCUCUGUCA-AACAUCA-3), and CLTC (5-GGUUGCUCUUGUUACGGAU-3) siRNAs were purchased from Applied Biosystems. For MLN8054 experiments, cells were treated for 5 h with 500 nM MLN8054.
AntibodiesThe following antibodies were used for immunofluorescence: mouse anti–-tubulin (DM1; Sigma-Aldrich), rat anti–-tubulin (AbD Serotec), rabbit anti-pericentrin (Abcam), mouse anti-GFP (Roche), and goat anti-GFP (Poser et al., 2008). Secondary antibodies used were donkey anti–mouse, –rabbit, or –rat conjugated to Alexa Fluor 488, 594, or 647 (Invitrogen).
ImmunofluorescenceCells on coverslips were fixed with PFA (TREX and APC images) or 20°C methanol (pericentrin images). Cells were blocked with 0.2% fish skin gela-tin (Sigma-Aldrich) in PBS. Cells were incubated with primary antibodies in 0.2% fish skin gelatin in PBS for 20 min at 37°C, washed, and repeated with secondary antibodies. Coverslips were mounted with ProLong gold with DAPI (Invitrogen) overnight and sealed.
Microscopy and image quantificationImages of TREX and APC components were acquired using MetaMorph soft-ware (version 7.1.2.0; MDS Analytical Technologies) on a microscope (Axio-plan 2; Carl Zeiss, Inc.) with a 63× 1.40 NA oil differential interference contrast Plan Apochromat objective (Carl Zeiss, Inc.) and a camera (CA 742–95; Hamamatsu Photonics) at room temperature. All other fixed and live images were acquired using an imaging system (Deltavision RT; Applied Precision) with an inverted microscope (IX70/71; Olympus) equipped with a charge-coupled device camera (CoolSNAP HQ; Roper Industries). Fixed images were acquired in 0.2-µm serial z sections using a 100× 1.35 NA UPlanApo objec-tive at room temperature. Live cell videos were acquired in 1.5-µm serial z sections at intervals of 3 (pericentrinlong) or 15 min (pericentrinshort) using a 60× 1.42 NA PlanApo N objective at 37°C. For live three-color still images of TACC3-GFP mCherry–-tubulin lines, 100 ng/ml Hoechst 33342 was added to the media 1 h before imaging. All live cell still images were acquired in 0.5-µm serial z sections. For live cell imaging, cells were incubated in a CO2-independent medium (Invitrogen). Datasets were deconvolved using Soft-Worx software (Applied Precision).
Cell culture for QUBIC experimentsFor all pull-downs, 107 cells were used. Stably transfected HeLa and U2OS cells were cultured in media containing 400 µg/ml and 500 µg/ml geneticin
on Septem
ber 30, 2010jcb.rupress.org
Dow
nloaded from
Published May 17, 2010

JCB • VOLUME 189 • NUMBER 4 • 2010 752
for reverse hits and contaminants (Processing – Filter – Filter category – Reverse = + and Contaminant = +). Positive intensity values were logarith-mized (Processing – Transformation – LOG – Log2). Signals that were originally zero were imputed with random numbers from a normal distribu-tion, whose mean and standard deviation were chosen to best simulate low abundance values below the noise level (Processing – Imputation – Replace missing values by normal distribution – Width = 0.3; Shift = 1.8). Signifi-cant interactors were determined by a volcano plot-based strategy, com-bining t test p-values with ratio information. The standard equal group variance t test was applied (Processing – Testing – Two groups). Signifi-cance lines in the volcano plot corresponding to a given FDR were deter-mined by a permutation-based method (Tusher et al., 2001). The pull-down was selected as Group1 and the control as Group2. Threshold values (= FDR) were selected between 0.1 and 0.001 and SO values (= curve bend) between 0.5 and 2.0. The resulting table was then exported (Export – Tab separated). The second tab (Table S1 and Table S2) was selected, and values saved with the same file name were supplemented with “_sup” (e.g., Exp.txt → Exp_sup.txt). Results were then plotted using the open source statistical software R and the provided script QUBIC-LABELFREE.R. In the beginning of the script, Exp.txt and Exp_sup.txt have to be re-placed with the real file names. Dynamic experiments were plotted using the script QUBIC-LABELFREE_dynamic.R. Significant TREX and TACC3 interactors were clustered using Genesis (Sturn et al., 2002).
A detailed step by step protocol and the raw data and programs associated with this manuscript may be downloaded from https:// proteomecommons.org/tranche, launching Tranche, choosing “Open By Hash”, and entering the following hash: iNYsECWFuN0KDV0Q8QoE3uXxRGuBiCo5+iwydOM7h29jlyPv+Xv4+1piRkFr+mcnsy+eErYIvmcRQf9ZU/l5lxQYNQYAAAAAAABFCA==
Online supplemental materialFig. S1 shows development of the QUBIC technology. Fig. S2 shows addi-tional SILAC pull-downs of the TREX complex components. Fig. S3 shows an additional SILAC pull-down of CDC23. Fig. S4 shows additional label-free pull-downs of TACC3. Fig. S5 shows that pericentrinlong GFP colocal-izes with anti-pericentrin antibody throughout the cell cycle. Table S1 shows specific interaction partners of label-free pull-downs of TACC3, CLTC, GTSE1, and PIK3C2A. Table S2 shows links to the University of California, Santa Cruz genome browser for used BACs, BAC length, gene length, number, and name of additional genes. Video 1 shows that pericentrinlong localizes to centrosomes throughout mitosis and the cell cycle. Video 2 shows that pericentrinshort localizes to centrosomes in mitosis but not interphase. Supplemental data show step by step QUBIC protocol, QUBICvalidator (download at Tranche), and R scripts, including test datasets (download at Tranche). Online supplemental material is available at http://www.jcb .org/cgi/content/full/jcb.200911091/DC1.
We thank Maximiliane Hilger, Michiel Vermeulen, and Trisha Davis for critical reading of the manuscript and Jennifer Yen for help with TACC3 mutant characterization.
This work was supported by the German National Genome Research Network (From Disease Genes to Protein Pathways [DiGtoP] grant) and PROSPECTS, a seventh framework program of the European Research Directorate.
Submitted: 17 November 2009Accepted: 14 April 2010
ReferencesBarr, A.R., and F. Gergely. 2007. Aurora-A: the maker and breaker of spindle
poles. J. Cell Sci. 120:2987–2996. doi:10.1242/jcs.013136
Barros, T.P., K. Kinoshita, A.A. Hyman, and J.W. Raff. 2005. Aurora A activates D-TACC–Msps complexes exclusively at centrosomes to stabilize centrosomal microtubules. J. Cell Biol. 170:1039–1046. doi:10.1083/ jcb.200504097
Bellanger, J.M., and P. Gönczy. 2003. TAC-1 and ZYG-9 form a complex that promotes microtubule assembly in C. elegans embryos. Curr. Biol. 13: 1488–1498. doi:10.1016/S0960-9822(03)00582-7
Bird, A.W., and A.A. Hyman. 2008. Building a spindle of the correct length in human cells requires the interaction between TPX2 and Aurora A. J. Cell Biol. 182:289–300. doi:10.1083/jcb.200802005
Blagoev, B., I. Kratchmarova, S.E. Ong, M. Nielsen, L.J. Foster, and M. Mann. 2003. A proteomics strategy to elucidate functional protein-protein interactions applied to EGF signaling. Nat. Biotechnol. 21:315–318. doi:10.1038/nbt790
Survey full-scan MS spectra (m/z = 300–1,650) were acquired in the Orbitrap with a resolution of 60,000 at the theoretical m/z = 400 after accumulation of 1,000,000 ions in the Orbitrap. The most intense ions (up to 10) from the preview survey scan delivered by the Orbitrap were sequenced by centromere identifier (collision energy 35%) in the LTQ after accumulation of 5,000 ions concurrently to full scan acquisition in the Orbitrap (TOP10 peptide sequencing). Maximal filling times were 1,000 ms for the full scans and 150 ms for the MS/MS. Precursor ion charge state screening was enabled, and all unassigned charge states as well as singly charged peptides were rejected. The dynamic exclusion list was restricted to a maximum of 500 entries with a maximum retention period of 90 s and a relative mass window of 5 ppm. Orbitrap measurements were performed with the lock mass option enabled for survey scans to improve mass accu-racy (Olsen et al., 2005).
Data analysisAfter processing raw files with the in house–developed software MaxQuant (version 1.0.12.36 or 1.0.13.12; Cox and Mann, 2008), data were searched against the human database concatenated with reversed copies of all sequences (Peng et al., 2003) and supplemented with frequently ob-served contaminants (porcine trypsin, achromobacter lyticus lysyl endo-peptidase, and human keratins) using MASCOT (version 2.2.0; Matrix Science). For the analysis of pericentrin experiments, the mouse pericentrin sequence was added to the database. Carbamidomethylated cysteins were set as fixed, oxidation of methionine, and N-terminal acetylation as variable modification. Mass deviation of 0.5 D was set as maximum allowed for MS/MS peaks, and a maximum of two missed cleavages were allowed. Maximum false discovery rates (FDRs) were set to 0.01 both on peptide and protein levels. Minimum required peptide length was six amino acids.
Quantification of proteins in SILAC experiments was performed using MaxQuant (Cox and Mann, 2008). Methionine oxidations and acetylation of protein N termini were specified as variable modifications and carbamido-methylation as fixed modification. Maximum peptide charge was set to 6. SILAC settings were adjusted to doublets, and Lys0 and Lys8 were selected as light and heavy label, respectively. Peptide and protein FDRs were set to 0.01. The maximum PEP was set to 1, and six amino acids were required as minimum peptide length. Only proteins with at least two peptides (thereof one uniquely assignable to the respective protein group) were considered as reliably identified. Unique and razor peptides were considered for quantifi-cation with a minimum ratio count of 2. Forward and reverse experiments were analyzed together and specified as QUBICH and QUBICL in the ex-perimentalDesign.txt. Ratios of the reverse experiment QUBICL were in-verted. Specific interaction partners in SILAC experiments were determined by a combination of ratio and ratio significance calculated by MaxQuant. The p-value for the significance of enrichment had to be <0.01 in both the forward and reverse experiment. The provided R script QUBIC-SILAC.R was used to plot all identified proteins according to their ratios in the forward and reverse experiment and mark specific interaction partners (http://www .r-project.org).
Label-free quantification was performed with MaxQuant (see Sup-plemental data). Methionine oxidations and acetylation of protein N ter-mini were specified as variable modifications and carbamidomethylation as fixed modification. Maximum peptide charge was set to 6. SILAC set-tings were set to singlets. Peptide and protein FDRs were set to 0.01. The maximum PEP was set to 1, and six amino acids were required as minimum peptide length. Only proteins with at least two peptides (thereof one uniquely assignable to the respective protein group) were considered as reliably identified. Label-free protein quantification was switched on, and unique and razor peptides were considered for quantification with a minimum ratio count of 1. Retention times were recalibrated based on the built-in non-linear time-rescaling algorithm. MS/MS identifications were transferred between LC-MS/MS runs with the “Match between runs” option in which the maximal retention time window was set to 2 min. The quantification is based on the extracted ion current and is taking the whole three-dimensional isotope pattern into account. At least two quantitation events were required for a quantifiable protein. Every single experiment/raw file was annotated as a separate experiment in experimentalDesign.txt. Control experi-ments were named Control1, Control2, and Control3. Pull-downs were named with the specific bait name and the replicate number. Identification of specific interaction partners was determined using the MaxQuant-based program QUBICvalidator. The proteinGroups.txt file was loaded (Load – Generic), and a group file template, Groups.txt, was generated (Processing – Groups – Write group file template). Replicates were grouped using one unique name in Groups.txt. The file was then loaded into QUBICvalidator (Processing – Groups – Load groups). Subsequently, results were cleaned
on Septem
ber 30, 2010jcb.rupress.org
Dow
nloaded from
Published May 17, 2010

753Quantitative BAC interactomics • Hubner et al.
transgenesis in mammalian tissue culture cells. Proc. Natl. Acad. Sci. USA. 102:2396–2401. doi:10.1073/pnas.0409861102
Köcher, T., and G. Superti-Furga. 2007. Mass spectrometry-based functional proteomics: from molecular machines to protein networks. Nat. Methods. 4:807–815. doi:10.1038/nmeth1093
Kops, G.J., M. van der Voet, M.S. Manak, M.H. van Osch, S.M. Naini, A. Brear, I.X. McLeod, D.M. Hentschel, J.R. Yates III, S. van den Heuvel, and J.V. Shah. 2010. APC16 is a conserved subunit of the anaphase-promoting complex/cyclosome. J. Cell Sci. 123:1623–1633. doi:10.1242/jcs.061549
Krogan, N.J., G. Cagney, H. Yu, G. Zhong, X. Guo, A. Ignatchenko, J. Li, S. Pu, N. Datta, A.P. Tikuisis, et al. 2006. Global landscape of protein com-plexes in the yeast Saccharomyces cerevisiae. Nature. 440:637–643. doi:10.1038/nature04670
Lee, M.J., F. Gergely, K. Jeffers, S.Y. Peak-Chew, and J.W. Raff. 2001. Msps/XMAP215 interacts with the centrosomal protein D-TACC to regu-late microtubule behaviour. Nat. Cell Biol. 3:643–649. doi:10.1038/ 35083033
LeRoy, P.J., J.J. Hunter, K.M. Hoar, K.E. Burke, V. Shinde, J. Ruan, D. Bowman, K. Galvin, and J.A. Ecsedy. 2007. Localization of human TACC3 to mitotic spindles is mediated by phosphorylation on Ser558 by Aurora A: a novel pharmacodynamic method for measuring Aurora A activity. Cancer Res. 67:5362–5370. doi:10.1158/0008-5472.CAN-07-0122
Li, Q., D. Hansen, A. Killilea, H.C. Joshi, R.E. Palazzo, and R. Balczon. 2001. Kendrin/pericentrin-B, a centrosome protein with homology to pericen-trin that complexes with PCM-1. J. Cell Sci. 114:797–809.
Manfredi, M.G., J.A. Ecsedy, K.A. Meetze, S.K. Balani, O. Burenkova, W. Chen, K.M. Galvin, K.M. Hoar, J.J. Huck, P.J. LeRoy, et al. 2007. Antitumor activity of MLN8054, an orally active small-molecule inhibitor of Aurora A kinase. Proc. Natl. Acad. Sci. USA. 104:4106–4111. doi:10.1073/pnas.0608798104
Mann, M. 2006. Functional and quantitative proteomics using SILAC. Nat. Rev. Mol. Cell Biol. 7:952–958. doi:10.1038/nrm2067
Masuda, S., R. Das, H. Cheng, E. Hurt, N. Dorman, and R. Reed. 2005. Recruitment of the human TREX complex to mRNA during splicing. Genes Dev. 19:1512–1517. doi:10.1101/gad.1302205
Miller, J.J., M.K. Summers, D.V. Hansen, M.V. Nachury, N.L. Lehman, A. Loktev, and P.K. Jackson. 2006. Emi1 stably binds and inhibits the anaphase-promoting complex/cyclosome as a pseudosubstrate inhibitor. Genes Dev. 20:2410–2420. doi:10.1101/gad.1454006
Monte, M., R. Benetti, L. Collavin, L. Marchionni, G. Del Sal, and C. Schneider. 2004. hGTSE-1 expression stimulates cytoplasmic localization of p53. J. Biol. Chem. 279:11744–11752. doi:10.1074/jbc.M311123200
Muyrers, J.P., Y. Zhang, and A.F. Stewart. 2001. Techniques: recombinogenic engineering—new options for cloning and manipulating DNA. Trends Biochem. Sci. 26:325–331. doi:10.1016/S0968-0004(00)01757-6
Okamoto, C.T., J. McKinney, and Y.Y. Jeng. 2000. Clathrin in mitotic spindles. Am. J. Physiol. Cell Physiol. 279:C369–C374.
Olsen, J.V., L.M. de Godoy, G. Li, B. Macek, P. Mortensen, R. Pesch, A. Makarov, O. Lange, S. Horning, and M. Mann. 2005. Parts per million mass accuracy on an Orbitrap mass spectrometer via lock mass injec-tion into a C-trap. Mol. Cell. Proteomics. 4:2010–2021. doi:10.1074/mcp .T500030-MCP200
Ong, S.E., B. Blagoev, I. Kratchmarova, D.B. Kristensen, H. Steen, A. Pandey, and M. Mann. 2002. Stable isotope labeling by amino acids in cell cul-ture, SILAC, as a simple and accurate approach to expression proteomics. Mol. Cell. Proteomics. 1:376–386. doi:10.1074/mcp.M200025-MCP200
Peng, J., J.E. Elias, C.C. Thoreen, L.J. Licklider, and S.P. Gygi. 2003. Evaluation of multidimensional chromatography coupled with tandem mass spectro-metry (LC/LC-MS/MS) for large-scale protein analysis: the yeast proteome. J. Proteome Res. 2:43–50. doi:10.1021/pr025556v
Peset, I., and I. Vernos. 2008. The TACC proteins: TACC-ling microtubule dynamics and centrosome function. Trends Cell Biol. 18:379–388. doi:10.1016/j.tcb.2008.06.005
Pfleger, C.M., and M.W. Kirschner. 2000. The KEN box: an APC recognition sig-nal distinct from the D box targeted by Cdh1. Genes Dev. 14:655–665.
Poser, I., M. Sarov, J.R. Hutchins, J.K. Hériché, Y. Toyoda, A. Pozniakovsky, D. Weigl, A. Nitzsche, B. Hegemann, A.W. Bird, et al. 2008. BAC TransgeneOmics: a high-throughput method for exploration of protein function in mammals. Nat. Methods. 5:409–415. doi:10.1038/nmeth.1199
Pryor, A., L. Tung, Z. Yang, F. Kapadia, T.H. Chang, and L.F. Johnson. 2004. Growth-regulated expression and G0-specific turnover of the mRNA that encodes URH49, a mammalian DExH/D box protein that is highly related to the mRNA export protein UAP56. Nucleic Acids Res. 32:1857–1865. doi:10.1093/nar/gkh347
Ranish, J.A., E.C. Yi, D.M. Leslie, S.O. Purvine, D.R. Goodlett, J. Eng, and R. Aebersold. 2003. The study of macromolecular complexes by quantita-tive proteomics. Nat. Genet. 33:349–355. doi:10.1038/ng1101
Cheeseman, I.M., and A. Desai. 2005. A combined approach for the localization and tandem affinity purification of protein complexes from metazoans. Sci. STKE. 2005:pl1. doi:10.1126/stke.2662005pl1
Cox, J., and M. Mann. 2008. MaxQuant enables high peptide identification rates, individualized p.p.b.-range mass accuracies and proteome-wide protein quantification. Nat. Biotechnol. 26:1367–1372. doi:10.1038/nbt.1511
Cullen, C.F., and H. Ohkura. 2001. Msps protein is localized to acentrosomal poles to ensure bipolarity of Drosophila meiotic spindles. Nat. Cell Biol. 3:637–642. doi:10.1038/35083025
Didichenko, S.A., C.M. Fragoso, and M. Thelen. 2003. Mitotic and stress- induced phosphorylation of HsPI3K-C2alpha targets the protein for degra-dation. J. Biol. Chem. 278:26055–26064. doi:10.1074/jbc.M301657200
Doxsey, S.J., P. Stein, L. Evans, P.D. Calarco, and M. Kirschner. 1994. Pericentrin, a highly conserved centrosome protein involved in microtubule organiza-tion. Cell. 76:639–650. doi:10.1016/0092-8674(94)90504-5
Flory, M.R., and T.N. Davis. 2003. The centrosomal proteins pericentrin and ken-drin are encoded by alternatively spliced products of one gene. Genomics. 82:401–405. doi:10.1016/S0888-7543(03)00119-8
Fong, K.W., Y.K. Choi, J.B. Rattner, and R.Z. Qi. 2008. CDK5RAP2 is a peri-centriolar protein that functions in centrosomal attachment of the gamma-tubulin ring complex. Mol. Biol. Cell. 19:115–125. doi:10.1091/mbc .E07-04-0371
Gaidarov, I., M.E. Smith, J. Domin, and J.H. Keen. 2001. The class II phos-phoinositide 3-kinase C2alpha is activated by clathrin and regulates clathrin-mediated membrane trafficking. Mol. Cell. 7:443–449. doi:10.1016/S1097 -2765(01)00191-5
Gavin, A.C., P. Aloy, P. Grandi, R. Krause, M. Boesche, M. Marzioch, C. Rau, L.J. Jensen, S. Bastuck, B. Dümpelfeld, et al. 2006. Proteome survey reveals modularity of the yeast cell machinery. Nature. 440:631–636. doi:10.1038/nature04532
Gergely, F., C. Karlsson, I. Still, J. Cowell, J. Kilmartin, and J.W. Raff. 2000. The TACC domain identifies a family of centrosomal proteins that can interact with microtubules. Proc. Natl. Acad. Sci. USA. 97:14352–14357. doi:10.1073/pnas.97.26.14352
Gergely, F., V.M. Draviam, and J.W. Raff. 2003. The ch-TOG/XMAP215 protein is essential for spindle pole organization in human somatic cells. Genes Dev. 17:336–341. doi:10.1101/gad.245603
Giet, R., D. McLean, S. Descamps, M.J. Lee, J.W. Raff, C. Prigent, and D.M. Glover. 2002. Drosophila Aurora A kinase is required to localize D-TACC to centrosomes and to regulate astral microtubules. J. Cell Biol. 156:437–451. doi:10.1083/jcb.200108135
Gillingham, A.K., and S. Munro. 2000. The PACT domain, a conserved centro-somal targeting motif in the coiled-coil proteins AKAP450 and pericen-trin. EMBO Rep. 1:524–529.
Gingras, A.C., M. Gstaiger, B. Raught, and R. Aebersold. 2007. Analysis of protein complexes using mass spectrometry. Nat. Rev. Mol. Cell Biol. 8:645–654. doi:10.1038/nrm2208
Glatter, T., A. Wepf, R. Aebersold, and M. Gstaiger. 2009. An integrated work-flow for charting the human interaction proteome: insights into the PP2A system. Mol. Syst. Biol. 5:237. doi:10.1038/msb.2008.75
Graser, S., Y.D. Stierhof, and E.A. Nigg. 2007. Cep68 and Cep215 (Cdk5rap2) are required for centrosome cohesion. J. Cell Sci. 120:4321–4331. doi:10 .1242/jcs.020248
Griffith, E., S. Walker, C.A. Martin, P. Vagnarelli, T. Stiff, B. Vernay, N. Al Sanna, A. Saggar, B. Hamel, W.C. Earnshaw, et al. 2008. Mutations in pericentrin cause Seckel syndrome with defective ATR-dependent DNA damage signaling. Nat. Genet. 40:232–236. doi:10.1038/ng.2007.80
Guo, J., Z. Yang, W. Song, Q. Chen, F. Wang, Q. Zhang, and X. Zhu. 2006. Nudel contributes to microtubule anchoring at the mother centriole and is involved in both dynein-dependent and -independent centrosomal protein assembly. Mol. Biol. Cell. 17:680–689. doi:10.1091/mbc.E05-04-0360
Haren, L., T. Stearns, and J. Lüders. 2009. Plk1-dependent recruitment of gamma-tubulin complexes to mitotic centrosomes involves multiple PCM components. PLoS One. 4:e5976. doi:10.1371/journal.pone.0005976
Hutchins, J.R., Y. Toyoda, B. Hegemann, I. Poser, J.K. Hériché, M.M. Sykora, M. Augsburg, O. Hudecz, B.A. Buschhorn, J. Bulkescher, et al. 2010. Systematic analysis of human protein complexes identifies chromosome segregation proteins. Science. 328:593–599. doi: 10.1126/science.1181348
Katahira, J., H. Inoue, E. Hurt, and Y. Yoneda. 2009. Adaptor Aly and co-adaptor Thoc5 function in the Tap-p15-mediated nuclear export of HSP70 mRNA. EMBO J. 28:556–567. doi:10.1038/emboj.2009.5
Kinoshita, K., T.L. Noetzel, L. Pelletier, K. Mechtler, D.N. Drechsel, A. Schwager, M. Lee, J.W. Raff, and A.A. Hyman. 2005. Aurora A phosphorylation of TACC3/maskin is required for centrosome-dependent microtubule assembly in mitosis. J. Cell Biol. 170:1047–1055. doi:10.1083/jcb.200503023
Kittler, R., L. Pelletier, C. Ma, I. Poser, S. Fischer, A.A. Hyman, and F. Buchholz. 2005. RNA interference rescue by bacterial artificial chromosome
on Septem
ber 30, 2010jcb.rupress.org
Dow
nloaded from
Published May 17, 2010

JCB • VOLUME 189 • NUMBER 4 • 2010 754
Rappsilber, J., M. Mann, and Y. Ishihama. 2007. Protocol for micro-purification, enrichment, pre-fractionation and storage of peptides for proteomics using StageTips. Nat. Protoc. 2:1896–1906. doi:10.1038/nprot.2007.261
Rauch, A., C.T. Thiel, D. Schindler, U. Wick, Y.J. Crow, A.B. Ekici, A.J. van Essen, T.O. Goecke, L. Al-Gazali, K.H. Chrzanowska, et al. 2008. Mutations in the pericentrin (PCNT) gene cause primordial dwarfism. Science. 319:816–819. doi:10.1126/science.1151174
Reed, R., and H. Cheng. 2005. TREX, SR proteins and export of mRNA. Curr. Opin. Cell Biol. 17:269–273. doi:10.1016/j.ceb.2005.04.011
Reed, R., and E. Hurt. 2002. A conserved mRNA export machinery coupled to pre-mRNA splicing. Cell. 108:523–531. doi:10.1016/S0092- 8674(02)00627-X
Rigaut, G., A. Shevchenko, B. Rutz, M. Wilm, M. Mann, and B. Séraphin. 1999. A generic protein purification method for protein complex char-acterization and proteome exploration. Nat. Biotechnol. 17:1030–1032. doi:10.1038/13732
Royle, S.J., N.A. Bright, and L. Lagnado. 2005. Clathrin is required for the function of the mitotic spindle. Nature. 434:1152–1157. doi:10.1038/nature03502
Sarov, M., S. Schneider, A. Pozniakovski, A. Roguev, S. Ernst, Y. Zhang, A.A. Hyman, and A.F. Stewart. 2006. A recombineering pipeline for functional genomics applied to Caenorhabditis elegans. Nat. Methods. 3:839–844. doi:10.1038/nmeth933
Sowa, M.E., E.J. Bennett, S.P. Gygi, and J.W. Harper. 2009. Defining the human deubiquitinating enzyme interaction landscape. Cell. 138:389–403. doi:10.1016/j.cell.2009.04.042
Srayko, M., S. Quintin, A. Schwager, and A.A. Hyman. 2003. Caenorhabditis elegans TAC-1 and ZYG-9 form a complex that is essential for long as-tral and spindle microtubules. Curr. Biol. 13:1506–1511. doi:10.1016/ S0960-9822(03)00597-9
Strässer, K., S. Masuda, P. Mason, J. Pfannstiel, M. Oppizzi, S. Rodriguez-Navarro, A.G. Rondón, A. Aguilera, K. Struhl, R. Reed, and E. Hurt. 2002. TREX is a conserved complex coupling transcription with messen-ger RNA export. Nature. 417:304–308. doi:10.1038/nature746
Sturn, A., J. Quackenbush, and Z. Trajanoski. 2002. Genesis: cluster analysis of microarray data. Bioinformatics. 18:207–208. doi:10.1093/ bioinformatics/18.1.207
Trinkle-Mulcahy, L., and A.I. Lamond. 2007. Toward a high-resolution view of nuclear dynamics. Science. 318:1402–1407. doi:10.1126/science .1142033
Tusher, V.G., R. Tibshirani, and G. Chu. 2001. Significance analysis of micro-arrays applied to the ionizing radiation response. Proc. Natl. Acad. Sci. USA. 98:5116–5121. doi:10.1073/pnas.091062498
Utrera, R., L. Collavin, D. Lazarevic, D. Delia, and C. Schneider. 1998. A novel p53-inducible gene coding for a microtubule-localized protein with G2-phase-specific expression. EMBO J. 17:5015–5025. doi:10.1093/ emboj/17.17.5015
Vermeulen, M., N.C. Hubner, and M. Mann. 2008. High confidence deter-mination of specific protein-protein interactions using quantitative mass spectrometry. Curr. Opin. Biotechnol. 19:331–337. doi:10.1016/ j.copbio.2008.06.001
Virbasius, C.M., S. Wagner, and M.R. Green. 1999. A human nuclear-localized chaperone that regulates dimerization, DNA binding, and transcrip-tional activity of bZIP proteins. Mol. Cell. 4:219–228. doi:10.1016/ S1097-2765(00)80369-X
Zhang, Y., F. Buchholz, J.P. Muyrers, and A.F. Stewart. 1998. A new logic for DNA engineering using recombination in Escherichia coli. Nat. Genet. 20:123–128. doi:10.1038/2417
on Septem
ber 30, 2010jcb.rupress.org
Dow
nloaded from
Published May 17, 2010