quantitative magnetic resonance imaging in experimental hypercapnia: improvement in the relation...
TRANSCRIPT

Journal of Cerehral Blood Flow and Metabolism 19:853-862 © 1999 The International Society for Cerebral Blood Flow and Metabolism Published by Lippincott Williams & Wilkins, Inc., Philadelphia
Quantitative Magnetic Resonance Imaging in Experimental
Hypercapnia: Improvement in the Relation Between Changes in
Brain R2* and the Oxygen Saturation of Venous Blood After
Correction for Changes in Cerebral Blood Volume
*tWeili Lin, *t Azim Celik, *Richard P. Paczynski, :j:Chung Y. Hsu, and *:j:William J. Powers
*Mallinckrodt Institute of Radiology, tDepartment of Electrical Engineering, and tDepartment of Neurology, Washington
University, St. Louis, Missouri, U.S.A.
Summary: Acute hypercapnia simultaneously induces increases in regional cerebral blood volume (rCBV) and the oxygen saturation of cerebral venous blood (Yv). Changes in both physiologic parameters may influence the changes in R2* (LlR2*) that can be measured in the brain with gradient echo magnetic resonance imaging. The authors examined the effect of incorporating independent measurements of the change in rCBV (LlrCBV) on the fidelity of the relation between LlR2* and Ll Yv in the setting of experimental hypercapnia. A twodimensional T2*-weighted gradient echo sequence was used to measure LlR2* in the brain parenchyma of anesthetized rats in response to hypercapnia with respect to the control state. In parallel, estimates of rCBV were obtained using a threedimensional steady-state approach in conjunction with a paramagnetic contrast agent during both control and hypercapnic states so that a LlrCBV could be calculated. Regional CBV
The discovery of blood oxygen level-dependent (BOLD) contrast (Ogawa and Lee, 1990a,b, 1993) has opened a new avenue for noninvasive measurement of cerebral blood oxygen saturation (CBOS) in vivo. It is well established that deoxyhemoglobin molecules can act as paramagnetic particles (Ogawa et aI., 1993; Thulborn et aI., 1982) and that changes in their concentration within blood induce signal intensity (SI) changes in T2-
Received August 3, 1998; final revision received November 5, 1998; accepted November 6, 1998.
Supported in part by National Institutes of Health grants NS35147 and NS06833.
Address correspondence and reprint requests to Dr. Weili Lin, Washington University, 510 S. Kingshighway, St. Louis, MO 63110, U.S.A.
Abbreviations used: BOLD, blood oxygen level-dependent; CBOS, cerebral blood oxygen saturation; 20, two-dimensional; 3D, threedimensional; Gd-DTPA, gadopentetate dimeglumine; MR, magnetic resonance; ROI, region of interest; SI, signal intensity; TE, echo time; Ya, oxygen saturation of arterial blood; Yv, oxygen saturation of cerebral venous blood.
853
values of 2.96 ± 0.82% and 5.74 ± 1.21 % were obtained during the control and hypercapnic states, respectively, and linear relations between rCBV and CO2 tension in both arterial (r =
0.80) and jugular venous (r = 0.76) blood samples were obtained. When correlating LlR2* directly with Ll Yv, no clear relation was apparent, but a strong linear relation (r = 0.76) was observed when correction for LlrCBV was incorporated into the data analysis. These results are consistent with the current understanding of the mechanisms of blood oxygen level-dependent (BOLD) contrast and underscore the potential importance of taking into account LlrCBV when quantitative estimates of Ll Yv from the "BOLD effect" are intended. Key Words: Magnetic resonance imaging-Blood oxygen leveldependent contrast-Experimental hypercapnia-Oxygen saturation-Cerebral blood volume.
and T2*-weighted magnetic resonance (MR) images. In the case of the CNS, these SI changes can be measured from intravascular voxels (within the larger blood vessels themselves) or from the brain parenchyma, which is permeated by many small, pseudorandomly distributed vessels (Ogawa and Lee, 1990a, 1993; Wright et aI., 1991). An extensive literature has developed around the use of the "BOLD effect" to localize the physiologic changes in CBOS that accompany task-specific regional cerebral metabolic activation (i.e., functional brain imaging) (Kwong et aI., 1992; Ogawa et aI., 1993). In addition, it has been demonstrated that the BOLD effect can be used to map global or even regional changes in CBOS under a variety of experimental conditions that simulate clinical pathophysiologic states or therapeutic interventions. These include hypoxemic hypoxia (Turner et aI., 1991; Prielmeier et aI., 1994; Jezzard et aI., 1994; Hoppel et aI., 1993; Rostrup et aI., 1995; Kennan et aI., 1997; Lin et aI., 1998a), hypercapnia and hypocapnia (Jezzard et aI., 1994; Davis et aI., 1998), acute hemodi-

854 W. LIN ET AL.
lution (Lin et aI. , 1998b), focal and global cerebral ischemia (De Crespigny et aI., 1992; Ono et aI. , 1997), epileptic convulsions (Weiss et aI., 1998), and the effects of drugs that induce cerebral hemodynamic changes (e.g. ,
acetazolamide) (Hedera et aI., 1996). In good agreement with the theoretical understanding of BOLD contrast mechanisms, an increase in SI (decreased R2*) occurs when interventions such as acute hypercarbia or pharmacologic cerebral vasodilation are made. These states often are associated with increases in CBOS (i.e. , decreased deoxyhemoglobin content) (Jezzard et a!., 1994; Kwong et aI., 1995; Davis et aI., 1998). Conversely, when reductions in CBOS are induced (e.g., in hypoxia, apnea, hypocapnia, and ischemia), a reduction in SI within the brain parenchyma frequently is seen on T2*weighted images, most likely reflecting the influence of an increase in the parenchymal deoxyhemoglobin content (Turner et aI. , 1991; Prielmeier et aI., 1994; Jezzard et aI., 1994; Hoppel et aI. , 1993; Rostrup et aI., 1995; Kennan et aI., 1997; Lin et aI., 1998a; De Crespigny et aI., 1992; Ono et a!. , 1997).
The quantitative aspects of these observations have come under detailed scrutiny. Both Prielmeier and associates ( 1994) and our group (Lin et a!., 1997, 1998a) report a linear relation between the experimentally measured LlR2* in brain parenchyma and changes in CBOS in rat models of acute hypoxemic hypoxia. These findings suggest that quantitation of the BOLD. effect from MR images can be used, in theory, to make noninvasive estimates CBOS. However, accurate quantitation of the BOLD effect with respect to CBOS is a complex and technically challenging task. In addition to the level of blood oxygen saturation, many other factors may influence SI behavior in T2*-weighted MR imaging (Kennan et aI., 1994; Yablonskiy and Haacke, 1994; Haacke et aI. , 1995; Boxerman et aI., 1995). These include the tissuelevel hematocrit (Lin et aI., 1998a, b), the absolute value of rCBV (a co-determinant of tissue deoxyhemoglobin content) (Jezzard et aI., 1994; Kennan et a!., 1997), and the anatomic partitioning of blood volume between arterial and venous elements (Lin et a!. , 1997). Details of rCBV are of particular interest because it has been suggested that changes in tissue blood volume alone can result in substantial changes in R2*, independent of any change in CBOS that may occur in a given experimental setting (Jezzard et a!. , 1994; Kennan et a!. , 1997). Furthermore, the changes in rCBV that are associated with the various pathophysiologic states discussed earlier are multifactorial and may vary considerably both between subjects and as a function of time within a given subject. Quantitation of LlrCB V associated with the various pathophysiologic states in individual subjects is therefore essential. However, few of the previous studies that have examined the relation between R2* and CBOS have taken into account the LlrCBV that may occur during
J Cereb Blood Flow Metab. Vol. 19, No. 8, 1999
experimental manipulations. Jezzard and coworkers ( 1994) demonstrated that dynamic changes in R2 * (LlR2*) measured from cat brain could be readily detected using an echo-planar gradient echo sequence under conditions of respiratory challenges including acute
anoxia, apnea, and hypercapnia. Spectrophotometric measurements of CBOS from the surface of the brain were made concurrently through a cranial window. These investigators demonstrated that when the spectrophotometric data indicated little concomitant change in rCBV (e.g., anoxia, apnea, and hyperoxia), there was a good correlation between LlR2* and LlCBOS. In contrast, when large changes in rCBV were associated with the experimental manipulation (e.g., hypercapnia), MR imaging and spectrophotometric CBOS results diverged widely. To a large degree, these findings are not unexpected. As suggested by the authors, changes in rCB V that alter SI independent of changes in oxygen saturation should cause a discrepancy between the MR imaging data and CBOS measurements. Similar findings have been reported in humans by Rostrup and associates ( 1995). Taken together, these data suggest the importance of taking into account the changes in rCBV that may occur in association with experimental manipulations when quantitative estimates of CBOS from the BOLD effect are intended.
In this study, acute hypercapnia was induced in rats as a means to alter both rCBV and the oxygen saturation of cerebral venous blood (Yv). The oxygen saturation of arterial blood (Ya) entering the brain was maintained constantly and greater than 95% throughout each experiment. A two-dimensional (2D) gradient echo sequence was used to acquire images continuously before and during hypercapnia so that LlR2* in the brain parenchyma could be calculated. In parallel, a three-dimensional (3D) steady-state approach was used to measure rCBV both before and after producing hypercapnia so that LlrCBV could be obtained (Moseley et aI. , 1992; Schwarzbauer et aI., 1993; Kuppusamy et aI., 1996; Lin et aI. , 1997). The relation between Ll Yv as measured by ex vivo blood gas analyses and LlR2*, with and without the correction for LlrCBV, then was investigated.
THEORY
It has been proposed (Yablonskiy and Haacke, 1994) that when a set of small cylindrical objects containing paramagnetic centers (e.g., venules) are randomly distributed in a voxel within the brain parenchyma, signal decay can be observed with sufficiently long echo times. For these long echo times, the relation between R2' (equals 1112') and the susceptibility for a set of randomly oriented cylinders is given by
R2' = 1.337T')'LlXBox'(1 - Y)Hct ( 1)

QUANTITATIVE MRI IN EXPERIMENTAL HYPERCAPNIA 855
where 'Y is the magnetogyric ratio = 2.67 x 10⁸ rad/s/T and A is the rCBV, Y is the fractional oxygen saturation, Bo is the static magnetic field, Hct is the fractional hematocrit, and �X is the susceptibility difference between 100% oxygenated and deoxygenated blood, which has been measured to be 0.18 ppm (Weisskoff and Kiihne, 1992) in centimeter-gram-second units. Assuming that only rCBV and Y are changing during the experimental manipulation, and that the R2 of brain parenchyma remains invariant, the expected R2* changes can be rewritten as follows:
�R 2 ' = �R2* = C(�A - MAY)) (2)
where C = 1.337T'Y�XBoAHct, �A = Apost - Apre, and �(A Y) = Apost Y post - Apre Y pre' The "pre" and "post" here denote the control and hypercapnic states, respectively. Therefore, when either rCBV, Y, or both are altered, R2* should be modified accordingly. More importantly, a linear relation is predicted between �R2* and .1 Y when they are normalized with respect to �A, as .1R2*/�A and �(A Y)/.1A. In this study, because the Ya entering the brain remained constant throughout the experiments, only the induced changes in Yv should contribute to the observed effect on R2*. The animal preparations and imaging protocols are addressed later.
MATERIALS AND METHODS
All procedures described here were approved by the Animal Studies Committee of Washington University Medical Center (St. Louis, MO, U.S.A ) and fall within the guidelines for animal care established by the National Institutes of Health (Bethesda, MD, U.S.A.).
Animal preparations Twelve adult male Long-Evans rats weighing 300 to 400 g
were used for these studies. The general surgical procedures are addressed later. Animals were maintained under ad libitum conditions for 24 hours before surgery, and general anesthesia was induced with a single intraperitoneal injection of pentobarbital (30 mg/kg). The descending aorta was cannulated through the left femoral artery with a PE-50 polyethylene catheter (Becton-Dickinson, Sparks, MD, U.S.A.) for obtaining samples for arterial blood gas analyses and the injection of a contrast agent. Subsequently, the right jugular vein was exposed and cannulated with a heparinized PE-50 catheter so that its tip would lie at the mouth of the transverse sinus as it exits the postglenoid foramen (Greene, 1935). This preparation for obtaining proximal jugular vein blood samples is done routinely in our laboratory; using this method, contamination of blood samples by the venous drainage of extracerebral structures is minimized (Lin et aI., 1997). Tracheotomy and tracheal cannulation then were performed, tracheal tubing was attached to a small animal ventilator (Harvard Apparatus, South Natick, MA, U.S.A.), and an intravenous neuromuscular blocking agent was administered (pancuronium hydrochloride) at the rate of 0.1 mg/kg/h. At the end of each experiment, the anesthetized rat was killed humanely with an overdose of intravenously administered pentobarbital.
To maintain strict anaerobic conditions during the blood
sampling process and to minimize time-dependent alterations of pH and blood gas tensions, all blood samples were analyzed for pH, Pco2, and P02 within 3 minutes after collection with a blood gas analyzer (Ciba-Coming Diagnostics, Medfield, MA, U.S.A.). Both arterial and venous hemoglobin saturation values were calculated, and the pH-corrected values for P02 obtained from arterial and venous samples were gauged to the oxygen dissociation curve of the rat (pSO of 37 to 38 mm Hg) (Hall, 1966).
Hypercapnia protocol After the animals were transported to the MR imager, 15
minutes was allowed for stabilization of physiologic conditions. During this period, 02-supplemented room air was given to the animals to maintain Ya greater than 95%. Both arterial and jugular venous blood samples were taken immediately before the MR imaging session to obtain control-state blood gas parameters. After acquiring control-state images (described in the MR imaging protocols section later), hypercapnia was induced by changing the inspired gas to a mixture of 5% CO2 and 95% O2 while animals remained immobile within the MR imager and images were acquired continuously. Immediately after the completion of each MR imaging session, both arterial and jugular venous blood samples again were taken for blood gas analyses. One or two such manipulations to produce hypercapnia were carried out in each animal. When two manipulations were performed, hyperventilation (achieved by increasing the rate of minute ventilation while changing the inspired gas to 02-supplemented room air) was carried out over a IO-minute interval between the first and second episode. This was done to decrease the elevated Pac02 from the first episode of hypercapnia. Nineteen manipulations were performed in 12 rats.
Magnetic resonance imaging protocols All images were acquired on a Siemens 1.5-T whole-body
VISION system (Siemens, Erlangen, Germany) with a gradient strength of 25 mT/m and a ramp time of 0.6 milliseconds to the maximum gradient. A small, homemade, receive-only radiofrequency coil was used for data acquisition. Two sequences were used. To obtain rCBV estimates, a 3D gradient echo sequence was used, and the imaging parameters were as follows: repetition time (TR) 25 milliseconds; echo time (TE) 8.4 milliseconds; flip angle 50°; slice thickness I mm for a total of 32 partitions; field of view 45 x 60 mm
2; and matrix size 96* 128.
In contrast, to obtain R2* changes in relation to the experimental manipulations, a 2D gradient echo FLASH sequence was used with the following imaging parameters: repetition time 97 milliseconds; TE 35 milliseconds; slice thickness 2 mm; fieldof-view 45 x 60 mm
2; matrix size 96*128; and flip angle ISO.
First-order velocity compensation was used along both the slice select and frequency encoding directions for both sequences so that How artifacts could be minimized.
Before and roughly 3 minutes after the injection of a bolus of gadopentetate dimeglumine (Gd-DTPA) (Magnevist, Berlex Laboratories, Wayne, NJ, U.S.A.) at a dose of 0.1 mmol/kg, the 3D sequence was used to obtain precontrast and postcontrast images for determination of baseline rCBV. Subsequently, the 2D gradient echo sequence, roughly 8 minutes after the injection of contrast agent, was used to acquire T2*-weighted images continuously. In total, 80 MR images were acquired at a rate of 10 seconds per scan. The first 10 scans were used as control-state studies; the inspired gas then was changed to 5% CO2 and 95% O2, and 70 additional scans were acquired during the induction and plateau phase of the hypercapnic state. Finally, immediately after completion of the 2D acquisition, the 3D gradient echo sequence was repeated so that the rCBV
.J Cereb Blood Flow Me/ab, Vol. 19, No. Ii, 1999

856 W. LIN ET AL.
associated with the hypercapnic state could be obtained. When two hypercapnic manipulations were induced, the same imaging protocol as described earlier was repeated with a second injection of the contrast agent.
Data analysis Regional cerebral blood volume measurements. The details
of rCBV calculation have been described elsewhere (Kuppusamy et aI., 1996; Lin et aI., 1997). In short, absolute measurements of rCBV (expressed as percent tissue volume) can be obtained using
(3)
where Spre and Spa"� represent the SI before and after �ontrast Lnjection in the brain parenchyma, respectively, and Spre and Spas, represent the SI in voxels located entirely within a blood vessel before and after contrast injection, respectively. The voxels chosen for intravascular SI analysis were within the superior sagittal sinus, a readily identified structure, and were free from partial volume effects with the underlying brain parenchyma. In this way, a pixel-by-pixel rCBV map could be obtained. A 3 x 3 low-pass filter was applied to improve the signal-to-noise ratio in the rCBV maps.
To investigate the changes in rCBV from control to hypercapnic states, three slices centered at the same location as T2*weighted images of the same brain were used for rCBV measurements. A region of interest (ROI) analysis, which encompassed both hemispheres, excluding any visible large vessels, was defined in the rCBV maps obtained during control state. The same ROI were subsequently used for rCBV measurements during the hypercapnic state.
t:.R2 * measurements. Since only one echo' was used, the changes in R2* induced by hypercapnia with respect to the control state was calculated using
t:.R2* = In(S(t)/So)ITE (4)
where Set) is the SI at a given time, and So is the mean SI during the control state (the first 10 scans). Similar ROI, as defined earlier for the rCBV measurements, were used to obtain t:.R2* measurements. To investigate the relation between t:.R2* and t:. Yv (the latter determined by the difference in oxygen
saturation of jugular venous blood before and after induction of hypercapnia), the t:.R2* from the last 20 scans (plateau phase of hypercapnia) were averaged. These last 20 scans were chosen because of their temporal proximity to venous blood sampling and rCBV measurements. The t:. Ya was not taken into consideration here because little or no change occurred in Ya over the course of the experiments (Table 1) and the absolute values of Ya (more than 95%) were such that bulk susceptibility effects from arterial blood were unlikely to contribute to t:.R2 *.
Statistical analysis Data are expressed as mean ± SD where SD represents the
intersubject variability. A linear regression analysis was used, and a correlation coefficient (r) was calculated to indicate the correlation between two experimentally measured parameters.
RESULTS
Physiologic parameters from both arterial and jugular venous blood gas analyses obtained during the control and hypercapnic states for the first and the second manipulations, respectively, are shown in Table 1. Although hyperventilation was carried out over a IO-minute interval between the first and the second manipulations to bring Paco2 back toward baseline, these adjustments were incomplete, and the second manipulation started from a higher Paco2 (42.4 ± 1 1. 1 mm Hg) than the first manipulation (32.8 ± 6.9 mm Hg). Combining physiologic parameters from both manipulations, the Paco2
increased from 36.4 9.2 to 62.5 10.9 mm Hg during hypercapnia, reflecting a 7 1.7% increase from the mean control-state Paco2 value. Similarly, an increase in Pvco2 from 50.1 ± 8.9 to 79.7 ± 9.4 mm Hg was observed. The Ya value was greater than 95% at the beginning of all experiments and changed minimally after induction of hypercapnia. In contrast, an increase in Yv from 71.8 ± 10.7% to 85.5 ± 6.4%-a 19% increase from the mean control-state value-was observed.
The measured rCBV values are summarized in Table 2 for both control and hypercapnic states. During the
TABLE 1. Physiologic parameters
Control Hypercapnia Mean (control) Mean (hypercapnia)
Control Hypercapnia Mean (control) Mean (hypercapnia)
pH Pac02 (mm Hg) P02 (mm Hg) Sat (%)
First Second First Second First Second First Second manipulation manipulation manipulation manipulation manipulation manipulation manipulation manipulation
7.43 ± 0.07 7.31 ± 0.06 7.25 ± 0.04 7.17 ± 0.04
7.38 ± 0.08 7.21 ± 0.06
pH
7.42 ± 0.04 7.32 ± 0.04 7.23 ± 0.04 7.17 ± 0.02
7.38 ± 0.06 7.20 ± 0.05
Arterial
32.8 ± 6.9 42.4 ± 11.1 59.2 ± 10.8 65.8 ± \1.5
36.4 ± 9.2 62.5 ± 10.9
Venous
pvc02 (mm Hg)
44.8 ± 4.8 58.8 ± 7.4 75.0 ± 8.6 85.2 ± 7.0
50.1 ± 8.9 79.7 ± 9.4
213.1 ± 111.4 201.0 ± 106.5 385.3 ± 52.5 389.5 ± 41.2
204.3 ± 102.6 389.5 ± 45.5
P02 (mm Hg)
57.3 ± 13.8 59.6 ± 12.0 107.9 ± 60.6 92.5 ± 12.4
59.8 ± 14.7 112.9±57.1
98.0 ± 1.6 96.7 ± 2.4 99.4 ± 0.22 99.5 ± 0.3
97.5 ± 1.89 99.4 ± 0.22
Sat (%)
71.9 ± 10.6 69.3 ± 10.0 85.1 ± 5.5 82.6 ± 4.9
71.8 ± 10.7 85.5 ± 6.4
Parameters obtained from arterial and venous blood samples for both the first and the second manipulations, respectively. Data are expressed as mean ± standard deviation. Sat., measured blood oxygen saturation.
J Cereb Blood Flow Metab. Vol. 19, No. 8, 1999
QUANTITATIVE MR I IN EXPERIMENTAL HYPERCAPNIA 857
TABLE 2. Experimental measurements of regional cerebral blood volume
Control Hypercapnia
First manipulation
(12 experiments)
Second manipulation
(7 experiments)
First manipulation
(12 experiments)
Second manipulation
(7 experiments)
rCBV Group mean
2.47 ± 0.32% 3.79 ± 0.74% 5.36 ± 0.95% 6.38 ± 1.42% 2.96 ± 0.82% 5.74 ± 1.21 %
Cerebral blood volume measured in the brain parenchyma for all rats. The data are expressed as mean ± standard deviation where standard deviation is the inter-subject variability.
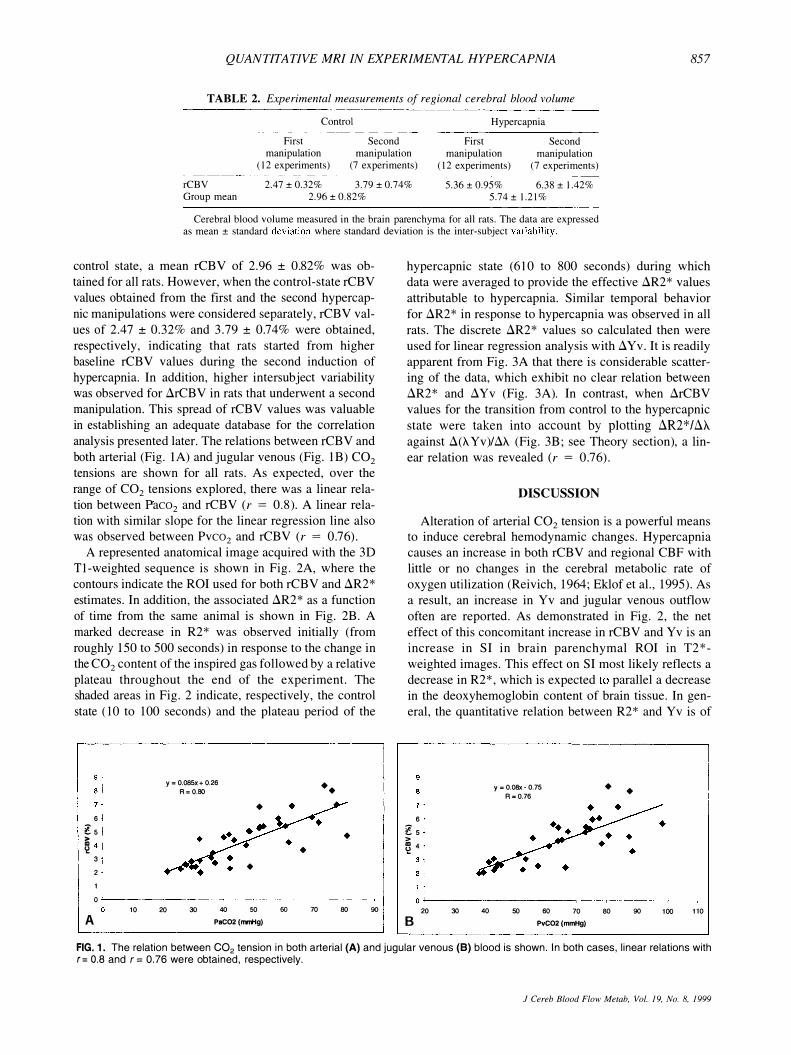
control state, a mean rCBV of 2.96 ± 0.82% was obtained for all rats. However, when the control-state rCBV values obtained from the first and the second hypercapnic manipulations were considered separately, rCBV values of 2.47 ± 0.32% and 3.79 ± 0.74% were obtained, respectively, indicating that rats started from higher baseline rCBV values during the second induction of hypercapnia. In addition, higher intersubject variability was observed for arCBV in rats that underwent a second manipulation. This spread of rCBV values was valuable in establishing an adequate database for the correlation analysis presented later. The relations between rCBV and both arterial (Fig. IA) and jugular venous (Fig. IB) CO2 tensions are shown for all rats. As expected, over the range of CO2 tensions explored, there was a linear relation between Paco2 and rCBV (r = 0 .8). A linear relation with similar slope for the linear regression line also was observed between Pvco2 and rCBV (r = 0.76).
A represented anatomical image acquired with the 3D Tl-weighted sequence is shown in Fig. 2A, where the contours indicate the ROI used for both rCBV and aR2* estimates. In addition, the associated aR2* as a function of time from the same animal is shown in Fig. 2B. A marked decrease in R2* was observed initially (from roughl y 150 to 500 seconds) in response to the change in the CO2 content of the inspired gas followed by a relative plateau throughout the end of the experiment. The shaded areas in Fig. 2 indicate, respectively, the control state ( 10 to 100 seconds) and the plateau period of the
6
!s > � 4 11
3 ; 2 j 1 j
y = 0.085x+ 0.26 R= 0.80
••
•
•
•
•
o L-�------,----------,----,-�� -,----r--·-----�---_, --- ------, 10 20
A 30 40 50 60
PaC02 (mmHg) 70 80 90
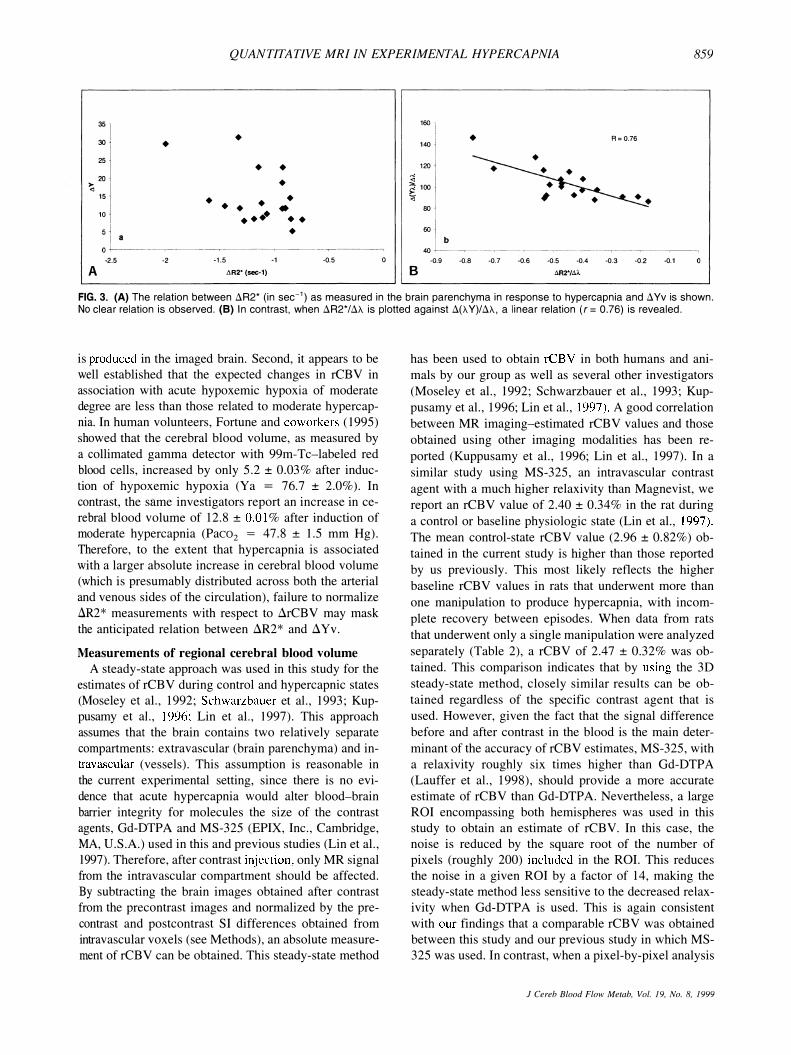
hypercapnic state (6 10 to 800 seconds) during which data were averaged to provide the effective aR2* values attributable to hypercapnia. Similar temporal behavior for aR2* in response to hypercapnia was observed in all rats. The discrete aR2* values so calculated then were used for linear regression analysis with a Yv. It is readily apparent from Fig. 3A that there is considerable scattering of the data, which exhibit no clear relation between aR2* and a Yv (Fig. 3A). In contrast, when arCBV values for the transition from control to the hypercapnic
state were taken into account by plotting aR2*laA. against a(A YV)/aA (Fig. 3B; see Theory section), a linear relation was revealed (r = 0.76).
DISCUSSION
Alteration of arterial CO2 tension is a powerful means to induce cerebral hemodynamic changes. Hypercapnia causes an increase in both rCBV and regional CBF with little or no changes in the cerebral metabolic rate of oxygen utilization (Reivich, 1964; Eklof et aI. , 1995). As a result, an increase in Yv and jugular venous outflow often are reported. As demonstrated in Fig. 2, the net effect of this concomitant increase in rCBV and Yv is an increase in SI in brain parenchymal ROI in T2*weighted images. This effect on SI most likely reflects a decrease in R2*, which is expected to parallel a decrease in the deoxyhemoglobin content of brain tissue. In general, the quantitative relation between R2* and Yv is of
6 ! 5 > � 4
B 20 30 40
y = 0.08x - 0.75 R=0.76
•
50 60 70 80 PVC02 (mmHg)
•
90 100 110
FIG. 1. The relation between CO2 tension in both arterial (A) and jugular venous (8) blood is shown. In both cases, linear relations with r= 0.8 and r= 0.76 were obtained, respectively.
J Cereb Blood Flow Metab. Vol. 19. No. 8. 1999

858 W. L IN ET AL.
0.1
·0.1
-0.3
-0.5
-0.7
·0.9
.1.1
· 1 .3
·1.5 0 100 200 300 400 500 600 700 800
B Time (sec)
FIG. 2. (A) A representative anatomical image obtained with the three-dimensional T1-weighted sequence is shown in which the contours indicate the regions of interest used for regional cerebral blood volume and ilR2* estimates. (8) The associated R2* changes (Y axis) from the same animal in responding to acute hypercapnia (increase in Pac02 by approximately 25 mm Hg) as a function of time in one rat brain are shown. Shaded regions correspond to the control state (up to second 100) and the plateau phase of the response (seconds 610 to 800); the difference between averaged data from these intervals was used to determine an effective ilR2* for hypercapnia.
great practical interest because noninvasive estimates of Yv could be useful in both experimental and clinical investigation (Cruz, 1993; Bullock et aI., 1993).
To investigate the relation between the � Yv and �R2* induced by hypercapnia, the �R2* measured in the brain parenchyma was correlated with the changes in the oxygen saturation of venous blood as measured from samples obtained from jugular catheters. This experimental approach was justified for the following reasons.
J Cereb Blood Flow Metah. Vol. 19. No. 8. 1999
First, in previous studies, we have demonstrated that the oxygen saturation values in samples taken simultaneously from the proximal jugular vein (at the outlet of the transverse sinus) and the superior sagittal sinus are
closely similar across a wide range of experimental conditions, including hypercapnia. This finding indicates that the oxygen saturation of blood taken from properly positioned jugular vein catheters is representative of the cerebral venous effluent in the rat (Lin et aI., 1998a). Second, since the arterial blood entering the brain was maintained at nearly full saturation (greater than 95%) throughout each experiment, � Y a does not contribute to the SI changes observed in these T2*-weighted images.
Only the venous blood within the tissue is expected to contribute to bulk magnetic susceptibility effects. However, no correlation was apparent in the direct comparison of � Yv and �R2* (Fig. 3A). To a large degree, these results may not be surprising, since, according to BOLD theory, �R2 * is a function of both rCB V and CBOS (see Eq. I) (Yablonskiy and Haacke, 1994; Haacke et aI., 1995). When these two parameters vary concurrently, either one alone might be expected to correlate poorly with �R2*, as shown in Fig. 3A for � Yv. In particular, if the blood volume within the venous portion of the circulation were to vary to a large and variable degree in relation to the changes in cerebral venous oxygen saturation, a poor correlation between �R2* and � Yv would be expected, since venous blood volume is a codeterminant of tissue deoxyhemoglobin content. As shown in Eq. 2, �R2* can be characterized generally as a function of the changes in rCBV minus the changes of the product of the rCBV and CBOS. When both rCBV and venous oxygen saturation vary simultaneously and contributions to bulk magnetic susceptibility effect from arterial blood are minimized, a linear relation between �R2*/�A and �(A YV)/�A is predicted. Indeed, when the data were replotted in light of these considerations, a linear relation between �R2*/�A and �(A YV)/�A was revealed (Fig. 3B, r = 0.76).
These findings may seem at odds with the previously reported results of Prielmeier and colleagues (Prielmeier et aI., 1994) and our group (Lin et aI., 1998a,b) involving rat models of acute hypoxemic hypoxia. In those studies, �R2* was well correlated with changes in CBOS, even when cerebral blood volume was not taken into account. This discrepancy may be explained by consideration of two interrelated factors. First, in the experiments involving hypoxemic hypoxia, the overall magnitude of change in CBOS was much greater than the approximately 15% change in Yv associated with hypercapnia in the current experiments. Since CBOS is the primary determinant of the BOLD effect, the putative influence of changes in rCBV of whatever magnitude would be expected to be overwhelmed in the case of an experimental manipulation in which a large change in blood oxygen saturation
QUANTITATIVE MRI IN EXPERIMENTAL HYPERCAPNIA 859
35 160
30 • • 140
• R= 0.76
25 • • 120
20 "' • <1 > �100 <1
15 • • • <1 • • .. 80
10 • • •• • •
• 60
�--- -. -----�------ 40 ·2.5 ·2 · 1 .5 ·1 ·0.5 0 ·0.9 ·O.B ·0.7 ·0.6 ·0.5 ·0.4 ·0.3 ·0.2 ·0.1
A t>R2' (sec·l) B t>R2"t>l.
FIG, 3. (A) The relation between �R2* (in sec-1) as measured in the brain parenchyma in response to hypercapnia and � Yv is shown. No clear relation is observed. (8) In contrast, when �R2*/�i\ is plotted against �(i\ Y)/�i\, a linear relation (r = 0.76) is revealed.
is produced in the imaged brain. Second, it appears to be well established that the expected changes in rCBV in association with acute hypoxemic hypoxia of moderate degree are less than those related to moderate hypercapnia. In human volunteers, Fortune and coworkers (1995) showed that the cerebral blood volume, as measured by a collimated gamma detector with 99m-Tc-labeled red blood cells, increased by only 5.2 ± 0.03% after induction of hypoxemic hypoxia (Ya = 76.7 ± 2.0%). In contrast, the same investigators report an increase in cerebral blood volume of 12.8 ± 0.01 % after induction of moderate hypercapnia (Paco2 = 47.8 ± 1.5 mm Hg). Therefore, to the extent that hypercapnia is associated with a larger absolute increase in cerebral blood volume (which is presumably distributed across both the arterial and venous sides of the circulation), failure to normalize LlR2* measurements with respect to LlrCBV may mask the anticipated relation between LlR2* and Ll Yv.
Measurements of regional cerebral blood volume
A steady-state approach was used in this study for the estimates of rCBV during control and hypercapnic states (Moseley et aI., 1992; Schwarzbauer et a\., 1993; Kuppusamy et a\., 1996; Lin et aI., 1997). This approach assumes that the brain contains two relatively separate compartments: extravascular (brain parenchyma) and intravascular (vessels). This assumption is reasonable in the current experimental setting, since there is no evidence that acute hypercapnia would alter blood-brain barrier integrity for molecules the size of the contrast agents, Gd-DTPA and MS-325 (EPIX, Inc., Cambridge, MA, U.S.A.) used in this and previous studies (Lin et aI., 1997). Therefore, after contrast injection, only MR signal from the intravascular compartment should be affected. By subtracting the brain images obtained after contrast from the precontrast images and normalized by the pre
contrast and postcontrast SI differences obtained from intravascular voxels (see Methods), an absolute measurement of rCBV can be obtained. This steady-state method
has been used to obtain rCBV in both humans and ani
mals by our group as well as several other investigators
(Moseley et aI., 1992; Schwarzbauer et aI., 1993; Kup
pusamy et aI., 1996; Lin et aI., 1997). A good correlation
between MR imaging-estimated rCB V values and those
obtained using other imaging modalities has been re
ported (Kuppusamy et aI., 1996; Lin et aI., 1997). In a
similar study using MS-325, an intravascular contrast
agent with a much higher relaxivity than Magnevist, we report an rCBV value of 2.40 ± 0.34% in the rat during
a control or baseline physiologic state (Lin et aI., 1997).
The mean control-state rCBV value (2.96 ± 0.82%) ob
tained in the current study is higher than those reported
by us previously. This most likely reflects the higher
baseline rCBV values in rats that underwent more than
one manipulation to produce hypercapnia, with incom
plete recovery between episodes. When data from rats
that underwent only a single manipUlation were analyzed
separately (Table 2), a rCBV of 2.47 ± 0.32% was ob
tained. This comparison indicates that by using the 3D
steady-state method, closely similar results can be ob
tained regardless of the specific contrast agent that is
used. However, given the fact that the signal difference
before and after contrast in the blood is the main deter
minant of the accuracy of rCBV estimates, MS-325, with a relaxivity roughly six times higher than Gd-DTPA (Lauffer et a\., 1998), should provide a more accurate estimate of rCBV than Gd-DTPA. Nevertheless, a large ROI encompassing both hemispheres was used in this study to obtain an estimate of rCBV. In this case, the noise is reduced by the square root of the number of pixels (roughly 200) included in the ROI. This reduces the noise in a given ROI by a factor of 14, making the steady-state method less sensitive to the decreased relaxivity when Gd-DTPA is used. This is again consistent with our findings that a comparable rCBV was obtained between this study and our previous study in which MS-325 was used. In contrast, when a pixel-by-pixel analysis
J Cereb Blood Flow Metab, Vol. 19, No. 8, 1999

860 W. LIN ET AL.
is desired, rCBV estimates would benefit from the higher
relaxivity offered by MS-325.
Since there is no accepted "gold standard" for mea
suring regional blood volume in an organ as complex as
the brain, we are unable to comment definitively on the accuracy-in absolute terms-of the 3D steady-state
method. In addition to many other factors that have been
addressed by other investigators (Moseley et ai., 1992;
Schwarzbauer et ai., 1993) and our group (Kuppusamy et
ai., 1996; Lin et ai., 1997), the signal alteration in the blood caused by the changes of deoxyhemoglobin con
centration, in responding to hypercapnic manipulation
could potentially affect the accuracy of rCBV estimates.
However, the signal change is expected to be small, since
a TE of 8 milliseconds was used for the rCBV estimates,
and this TE is insensitive to BOLD effects at 1.5 T.
Furthermore, the changes of jugular blood oxygen satu
ration in responding to experimental hypercapnic ma
nipulations also is small (Table 1, from 7 1.8 ± 10,7% to
85.5 ± 6.4% during control and hypercapnic states, re
spectively). Therefore, signal changes induced by the
alteration of deoxyhemoglobin concentration in respond
ing to hypercapnic manipUlations should have minimum
effects on the estimates of rCBV. Furthermore, the re
sults from the current study are in good agreement with
the rat rCBV values of Todd and colleagues ( 1993) (2.67
± 0.33%) who used a microwave fixation method to
firmly trap an intravascular tracer before removal of the
brain for ex vivo blood volume analysis. Overall, the
steady-state method appears to produce rCBV values
consistent with results obtained using alternative modali
ties and, within the limitations of the assumptions stated
earlier, can be readily used in making determinations of
IlrCBV.
Relation between CO2 tension and regional cerebral
blood volume
Over the range of Paco2 values investigated in this study, there was a linear relation between Pacoz and rCBV (Fig. 2A). When the data from all 19 episodes of hypercapnia were combined, rCBV increased from 2.96 ± 0.82% to 5.74 ± 1.21 % (Table 2). This reflects a 93.9% increase in rCBV from the control-state rCBV. When considering the results obtained from the first and the second hypercapnia manipulations separately, rCBV increased from 2.47 ± 0.32% to 5.36 ± 0.95 and 3.79 ± 0.74% to 6.38 ± 1.42%, respectively. The percentage increase in rCBV was larger ( 117%) for the first manipulation when compared with the second (68.3%). This is most likely explained by the fact that the second manipulations started with higher baseline Pacoz and, therefore, higher rCBV values. With a physiologically limited vascular caliber, a smaller degree of rCBV change would be expected for the second manipulation despite a similar
J Cereb Blood Flow Melah, Vol, 19, No, 8, 1999
increase in Paco2 in both. These data are in good general
agreement with our previously reported results using the
steady-state approach (Lin et ai., 1997) and are consis
tent with the reported relation between Paco2 and rCBV
in the literature using other modalities (Reivich, 1964;
Kety and Schmidt, 1947; Grubb et aI., 1973; Greenberg
et ai., 1978). However, some investigators report a sig
moidal relation between Pacoz and rCBV when more
extreme Paco2 values are encompassed (Reivich, 1964). Interestingly, when rCBV was plotted against the jugular venous CO2 tension, a linear relation between rCBV
and Pvco2 also was obtained. Although this finding
may not be unexpected (since Pvco2 should be slightly
higher than but otherwise reflective of the Pacoz) to
our knowledge this relation has not been reported previ
ously.
Theoretical considerations
The effects of BOLD contrast on MR signal can be
considered separately for the intravascular and extravas
cular compartments in which distinct signal behavior for
each compartment is anticipated. In this study, the theory
proposed by Yablonskiy and Haacke (Yablonskiy and
Haacke, 1994; Haacke et aI., 1995) was used to compare
the theoretically predicted signal behavior with the ex
perimentally measured MR signal changes in responding
to hypercapnic manipulation. As addressed in the Theory
section, the susceptibility induced by a set of randomly
oriented cylinders that contain paramagnetic centers can
be measured through an estimate of R2'. Here, the ef
fects of the intravascular compartment and diffusion
about the paramagnetic centers were ignored. In this
study, IlR2* and IlrCBV measured in the brain paren
chyma in responding to hypercapnic manipulation were
used to investigate the effects of rCBV alterations be
tween IlR2* and CBOS changes. As demonstrated in Table 2, the rCBV measured in the brain parenchyma is
2.96% and 5.74% during the control and hypercapnic states, respectively. Therefore, any intravascular contributions are likely to be small and should not affect our data analysis. This is reinforced by our experimental results, where the relation between IlR2* and Il Yv is greatly improved after the correction of rCBV, consistent with the anticipated theoretical prediction as proposed by Yablonskiy and Haacke ( 1994). However, the contributions of the intravascular compartment could play a more significant role when the blood volume ratio within a voxel is increased. For example, in a voxel that contains a pial vein, the blood volume ratio could be as high as 50%. Under this condition, contributions of both intravascular and extravascular compartments would need to be taken into account. This would require a careful modeling of both compartments and is beyond the scope of this report.

QUANTITATIVE MRI IN EXPERIMENTAL HYPERCAPNIA 861
Effects of contrast agent in the measurements of
.:iR2* and regional cerebral blood volume
The clearance of the contrast agent during the hypercapnic episode could potentially decrease R2* in addition to the anticipated reduction of R2* measured in the brain parenchyma in responding to experimental hypercapnia. However, this effect is anticipated to be small because of the fact that, as addressed in the imaging protocol, all 2D T2*-weighted images, including both the control and hypercapnic scans, are acquired after the injection of contrast agent. Furthermore, the first 8 minutes (when substantial changes of the concentration of contrast agent are anticipated) are used for the acquisition of the 3D Tl-weighted images and then followed by the 2D T2*-weighted sequence. Therefore, the clearance of contrast agent should not affect our conclusion that the relation between R2* measured in the brain parenchyma and cerebral venous oxygen saturation can be improved after correction for changes in rCBV as shown in Fig. 3B.
In addition, since a paramagnetic contrast agent was used for the estimation of rCBV, after the injection of contrast, the R2* of blood potentially could be altered, resulting in an inaccurate estimate of rCB V. In our study, this confounding factor is avoided by delaying the first 3D Tl-weighted. imaging acquisition by at least 3 minutes so that the maximum induced R2* changes of contrast agent is minimized. In addition, a short TE, 8 milliseconds, was used for the 3D Tl-weighted sequence. This should further reduce effects of contrast induced R2* changes in the blood.
CONCLUSION
In this study, hypercapnia was used to alter both rCBV and Yv while maintaining a stable Ya throughout each experiment. By doing so, the combined effects of changes in rCBV and Ll Yv on the BOLD effect could be isolated. Although no clear relation was apparent in a direct comparison of LlR2* and Ll Yv, a linear relation between LlR2*ILlA. and Ll(A. Yv)/LlA. was revealed. These data presuppose the ability to measure rCBV changes in individual subjects, as demonstrated amply by the 3D steady-state technique described earlier. The results of this study suggest two important conclusions. First, the
overall comparability of the experimental results and theoretical predictions indicates that in addition to CBOS, rCBV is indeed an important physiologic parameter in the interpretation of SI in T2*-weighted images. Second, when attempting to quantitate the BOLD effect, it is essential to take into account changes in rCBV, particularly in the case of conditions such as hypercapnia, where large and variable absolute changes or large relative changes in blood volume concurrent with CBOS changes are expected. Although absolute estimates of
CBOS using MR imaging are the ultimate goal and are an actively pursued area, only limited success has been reported. To a large degree, this results from the fact that the effects of rCBV alteration, as demonstrated in our study, and R2', as shown in Eq. 2, are likely to influence MR signal in the images. The accuracy of the measurements of these parameters are both technically challenging and beyond the scope of this report. For these and several other reasons, quantitative measurements of CBOS are not available. Nevertheless, in our study, we have demonstrated by measuring changes in both rCBV and R2* with MR imaging under conditions that preserve a high, constant Ya, noninvasive measurement of changes in Yv on a regional basis may be achievable. This information could be of use in the study of cerebral oxygen metabolism under a variety of physiologic or pathophysiologic conditions.
Acknowledgment: The authors thank Dr. E. Mark Haacke, Washington University, St. Louis, Missouri, for his valuable suggestions and review of this manuscript.
REFERENCES
Boxerman JL. Hamberg LM. Rosen BR. Weisskoff RM (1995) MR contrast due to intravascular magnetic susceptibility perturbations. Magn Reson Med 34:555-566
Bullock R. Stewart L. Rafferty C, Teasdale GM (1993) Continuous monitoring of jugular bulb oxygen saturation and the effect of drugs acting on cerebral metabolism. Acta Neurochir 59(S): 113-118
Cruz J (1993) JugUlar-venous oximetry. Acta Neurochir 59(S):86-90 Davis TL, Kwong KK, Weisskoff RM, Rosen BR (1998) Calibrated
functional MRI: mapping the dynamics of oxidative metabolism. Proc Natl Acad Sci USA 95:1834-1839
De Crespigny AJ, Wendland MF, Dcrugin N, Kozniewska E, Moseley ME (1992) Real-time observation of transient focal ischemia and hyperemia in cat brain. Magn Reson Med 27:391-397
Eklof B, Lassen NA, Nilsson L, Norberg K, Siesjo BK (1995) Blood flow and metabolic rate for oxygen in the cerebral cortex of the rat. Acta Physiol Scand 88:587-589
Fortune JB, Feustel PJ, De Luna C. Graca L. Hasselbarth J, Kupinski AM (1995) Cerebral blood flow and blood volume in response to 02 and C02 changes in normal humans. J Trauma 39:463-471
Greenberg JH, Alavi A, Reivich M, Kuhl 0, Uzzell B (1978) Local cerebral blood volume response to carbon dioxide in man. eirc Res 43:324-331
Greene EC (1935) Anatomy of the Rat. New York, Hofner Publishing, pp 215-220
Grubb RL, Phelps ME, Ter-Pogossian MM (1973) Regional cerebral blood volume in humans: x-ray fluorescence studies. Arch Neurol 28:31-44
Haacke EM, Lai S, Yablonskiy DA, Lin W (1995) In vivo validation of the BOLD mechanism: a review of signal changes in gradient echo functional MRI in the presence of flow. Int J Imaging Systems Technol6:153-163
HaJJ FG (1966) Minimal utilizable oxygen and the oxygen dissociation curve of blood of rodents. J Appl Physiol 21:375-378
Hedera P, Lai S, Lewin JS, Haacke EM, Wu 0 (1996) Assessment of cerebral blood flow reserve using functional magnetic resonance imaging. J Magn Reson Imaging 6:7 I 8-725
Hoppel BE, Weisskoff RM, Thulbom KR, Moore JB, Kwong KK, Rosen BR (1993) Measurement of regional blood oxygenation and cerebral hemodynamics. Magn Reson Med 30:715-723
Jezzard P, Heineman F, Taylor J, DesPres 0, Wen H, Balaban RS, et al (1994) Comparison of EPI gradient-echo contrast changes in cat
J Cereh Blood Flow Metah, Vol. 19, No. 8, 1999

862 W. L IN ET AL.
brain caused by respiratory challenges with direct simultaneous evaluation of cerebral oxygenation via a cranial window. NMR Biomed 7:35-44
Kennan RP, Gao JH, Zhong J, Gore JC (1994) A general model of microcirculatory blood flow effects in gradient sensitized MRI. Med Phys 21:539-545
Kennan RP, Scanley BE, Gore JC (1997) Physiological basis for BOLD MR signal changes due to hypoxia/hyperoxia: separation of blood volume and magnetic susceptibility effects. Magn Reson Med 37:353-356
Kety SS, Schmidt CF (1947) The effects of altered arterial tension of carbon dioxide and oxygen on cerebral blood flow and cerebral oxygen consumption of normal young men. J Clin Invest 27:484-492
Kwong KK, Belliveau JW, Chesler DA, Goldberg IE, Weisskoff RM, Ponce let BP, et al (1992) Dynamic magnetic resonance imaging of human brain activity during primary sensory stimulation. Proc Natl Acad Sci USA 89:5675-5679
Kwong KK, Wanke I, Donahue KM, Davis TL (1995) EPI imaging of global increase of brain MR signal with breath-hold preceded by breathing O2, Magn Reson Med 33:448-452
Kuppusamy K, Lin W, Cizek G, Haacke EM (1996) In vivo regional cerebral blood volume: quantitative assessment with 3D TIweighted pre- and post contrast MR imaging. Rad iology 201: 106-112
Lauffer RB, Parmelee DJ, Dunham SU, Ouel1et HS, Dolan RP, Witte S, et al (1998) MS-325: albumin-targeted contrast agent for MR angiography. Rad iology 207:529-538
Lin W, Paczynski RP, Kuppusamy K, Hsu CY, Haacke EM (1997) Quantitative measurements of regional cerebral blood volume using MRI in rats: effects of arterial carbon dioxide tension and mannitol. Magn Reson Med 38:420-428
Lin W, Paczynski RP, Celik A, Kuppusamy K, Hsu CY, Powers WJ (1998a) Experimental hypoxemic hypoxia: changes in R2* of brain parenchyma accurately reflect the combined effects of changes in arterial and cerebral venous oxygen saturation. Magn Reson Med 39:474-481
Lin W, Paczynski RP, Celik A, Hsu CY, Powers WJ (I 998b) Effects of acute normovolemic hemodilution on T2*-weighted images of rat brain. Magn Reson Med (in press)
Moseley ME, Chew WM, White DL, Kucharczyk J, Litt L, Derugin N, Dupon J, Brasch RC, Norman D (1992) Hypercarbia-induced changes in cerebral blood volume in the cat: a I H MRI and intravascular contrast agent study. Magn Reson Med 23:21-30
Ogawa S, Lee TM (1990a) Magnetic resonance imaging of blood vessels at high field: in vivo and in vitro measurements and image simulation. Magn Reson Med 16:9-18
J Cereb Blood Flow Metab. Vol. 19, No. 8, 1999
Ogawa S, Lee TM, Kay AR, Tank DW (l990b) Brain magnetic resonance imaging with contrast dependent on blood oxygenation. Proc Natl Acad Sci USA 87:9868-9872
Ogawa S, Menon RS, Tank DW, Kim SG, Markle H, Ellermann JM, Ugurbil K (1993) Functional brain mapping by blood oxygenation level dependent contrast magnetic resonance imaging. Biophys J 64:803-812
Ono Y, Morikawa S, lnubushi T, Shimizu H, Yoshimoto T (1997) T2*-weighted magnetic resonance imaging of cerebrovascular reactivity in rat: reversible focal cerebral ischemia. Brain Res 744: 207-215
Pollard V, Prough DS, DeMelo AE, Deyo DJ, Uchida T, Widman R (1996) The influence of carbon dioxide and body position on nearinfrared spectroscopic assessment of cerebral hemoglobin oxygen saturation. Anesth Analg 82:278-287
Prielmeier F, Nagatomo Y, Frahm J (1994) Cerebral blood oxygenation in rat brain during hypoxic hypoxia: quantitative MRI of effective transverse relaxation rates. Magn Reson Med 31 :678-681
Reivich M (1964) Arterial PC02 and cerebral hemodynamics. Am J Physiol 206:25-35
Rostrup E, Larsson HBW, Toft PB, Garde K, Henriksen 0 (1995) Signal changes in gradient echo images of human brain induced by hypo- and hyperoxia. NMR Biomed 8:41-47
Schwarzbauer C, Syha J, Haase A (1993) Quantification of regional blood volumes using rapid T l mapping. Magn Reson Med 29:709-712
Thulborn KR, Waterton JC, Matthews PM, Radda GK (1982) Oxygenation dependence of the transverse relaxation time of water protons in whole blood at high field. Biochim Biophys Acta 714:265-270
Todd MM, Weeks JB, Warner DS (1993) Microwave fixation for the determination of cerebral blood volume in rats. J Cereb Blood Flow Metab 13:328-336
Turner R, Le Bihan 0, Moonen CTW, Despres 0, Frank J (1991) Echo-planar time course MRI of cat brain oxygenation changes. Magn Reson Med 22: 159-166
Weiss KC, Figueroa RF, Allison J (1998) Functional MR imaging in patients with epilepsy. Magn Reson Clin North Am 6:95-112
Weisskoff RM, Kiihne S (1992) MRI susceptometry: image-based measurement of absolute susceptibility of MR contrast agents and human blood. Magn Reson Med 24:375-383
Wright GA, Hu BS, Macovski A (1991) Estimating oxygen saturation of blood in vivo with MR imaging at 1.5 T. J Magn Reson Imaging 1:275-283
Yablonskiy DA, Haacke EM (1994) Theory of NMR signal behavior in magnetically inhomogeneous tissue: the static dephasing regime. Magn Reson Med 32:746-763