quantitative assessment of operational weather radar
TRANSCRIPT
Quantitative Assessment of Operational Weather Radar Rainfall Estimates overCalifornia’s Northern Sonoma County Using HMT-West Data
SERGEY Y. MATROSOV
Cooperative Institute for Research in Environmental Sciences, University of Colorado at Boulder,
and NOAA/Earth System Research Laboratory, Boulder, Colorado
F. MARTIN RALPH,* PAUL J. NEIMAN, AND ALLEN B. WHITE
NOAA/Earth System Research Laboratory, Boulder, Colorado
(Manuscript received 11 March 2013, in final form 23 August 2013)
ABSTRACT
An evaluation of Weather Surveillance Radar-1988 Doppler (WSR-88D) KMUX and KDAX radar
quantitative precipitation estimation (QPE) over a site in California’s northern Sonoma County is performed
and rain type climatology is presented. This site is next to the flood-proneRussianRiver basin and, because of
the mountainous terrain and remoteness from operational radars, is generally believed to lack adequate
coverage. QPE comparisons were conducted for multiyear observations with concurrent classification of
rainfall structure usingmeasurements from a gauge and an S-band profiler deployed at the location of interest.
The radars were able to detect most of the brightband (BB) rain, which contributed over half of the total
precipitation. For this rain type hourly radar-basedQPE obtained with a default vertical profile of reflectivity
correction provided results with errors of about 50%–60%. The operational radars did not detect pre-
cipitation during about 30% of the total rainy hours with mostly shallow nonbrightband (NBB) rain, which,
depending on the radar, provided;(12%–15%) of the total precipitation. The accuracy of radar-based QPE
for the detected fraction of NBB rain was rather poor with large negative biases and characteristic errors of
around 80%. On some occasions, radars falsely detected precipitation when observing high clouds, which did
not precipitate or coexisted with shallow rain (less than 10% of total accumulation). For heavier rain with
a significant fraction of BB hourly periods, radar QPE for event totals showed relatively good agreement with
gauge data. Cancelation of errors of opposite signs contributed, in part, to such agreement. On average,
KDAX-based QPE was biased low compared to KMUX.
1. Introduction
It has been recognized that coverage of the operational
S-band (wavelength l ; 10–11cm) Weather Surveillance
Radar-1988 Doppler (WSR-88D) network for quantitative
precipitation estimation (QPE) over the coastal western
United States has significant limitations and gaps (e.g.,
Westrick et al. 1999;Maddox et al. 2002;White et al. 2003).
In addition to the large distances between WSR-88D sites
in many important coastal areas, gaps in operational radar
coverage are also often caused by the blockage of radar
beams by mountainous terrain at lower radar tilt (eleva-
tion) angles (e.g., Young et al. 1999;Miller et al. 2010). This
necessitates the use of higher tilt angles, which often causes
overshooting of shallow rainfall or sampling higher regions
of precipitating clouds, resulting in biased rain accumula-
tion estimates from operational radar data.
A number of flood-prone river basins are in the areas
of poor WSR-88D coverage. Hence, it is important to
quantify the performance of radar-based QPE there.
Despite the existence of rain gauge networks in such
areas, the gauge coverage generally is not sufficient. The
complexity of the terrain requires relatively highly re-
solved temporal (5–6 radar scans per hour at a given
elevation) and horizontal spatial (1–3 km) radar-derived
rainfall information. The limitations of radar QPE are
expected to depend on precipitation types varying from
*Current affiliation: Scripps Institution of Oceanography, Uni-
versity of California, San Diego, La Jolla, California.
Corresponding author address: Sergey Y. Matrosov, University
of Colorado, CIRES, R/PSD2, 325 Broadway, Boulder, CO 80305.
E-mail: [email protected]
FEBRUARY 2014 MATROSOV ET AL . 393
DOI: 10.1175/JHM-D-13-045.1
� 2014 American Meteorological Society

warm rain, which is typically contained in a lower 1–2-km
layer where temperatures in the area of interest to this
study are generally above freezing even during the
winter season, to relatively deep precipitating systems
with cloud echo-top heights he exceeding 8 km above
mean sea level (MSL).
While it is generally believed that the northern Sonoma
County lacks adequate WSR-88D coverage (Fig. 1), the
extent to which operational radar data can be used in this
area is not exactly known. This study aimed to quantify
the performance of operational radar-based QPE for dif-
ferent rainfall types using available long-term gauge mea-
surements supported by collocated and simultaneous
observations of precipitation regimes. Such measure-
ments are available from a site located near Cazadero
(CZD; 38.61078N, 123.21538W; 478m MSL) in Cal-
ifornia’s northern Sonoma County where the National
Oceanic and Atmospheric Administration’s (NOAA’s)
Hydrometeorology Testbed-West (HMT; http://hmt.
noaa.gov) has operated an S-band vertical profiling
precipitation radar (S-PROF; White et al. 2000) and
a collocated precipitation gauge (0.01-in. resolution) for
several years. The S-PROF provides high-resolution
(;60m) measurements of vertical profiles of equivalent
radar reflectivity factorZe (hereafter just reflectivity) and
verticalDoppler velocityW. Theseprofiles allow classifying
precipitation types and their vertical structure. The CZD
site is located in an operational radar gap, where WSR-
88D coverage is often not available at heights less than
;3 km MSL. It is also in the vicinity of the flood-prone
Russian River basin, where improved radar-based QPE
can result in better flood forecasting (Ralph et al. 2006;
Dettinger et al. 2011).
Factors contributing to QPE errors resulting from re-
trievals with scanning weather radars include radar-beam
overshooting of shallow rain, inferring precipitation at
the surface when there are virga instead, using inappro-
priate relations between reflectivity and rain rate,R, (i.e.,
Ze–R relations), and not correcting for vertical profiles
of reflectivity (VPR). However, it is rare to be able to
diagnose the relative importance of different factors
contributing to the overall errors. The availability of long-
term S-PROF and rain gauge observations in a clima-
tologically wet coastal mountain location enables such
analysis. This study takes advantage of the recent analysis
by Ralph et al. (2013) of precipitation events observed
during landfalling atmospheric rivers (ARs), which are
relatively narrow bands of enhanced water vapor trans-
port associated with extratropical cyclones. These au-
thors showed that AR events observed during only about
1500h are responsible for 51% of the total CZD 6-yr (fall
2004–summer 2010) precipitation. ARs are also responsible
for most flooding in the area of interest (Ralph et al. 2006).
The main objectives of this study were (a) to quan-
titatively evaluate WSR-88D QPE in a flood-prone
mountainous site located in a gap of the operational
radar coverage, (b) to stratify the results based on the rain
type observed at the ground, and (c) to estimate potential
improvements for the WSR-88D QPE based on concur-
rent data from vertically pointing profilers. Quantitative
assessment of QPE results is tied to a broader issue of
FIG. 1. (a) Locations of differentWSR-88D radars relative to the
CZD site on the Google Earth image, and maps of the coverage
height by the (b) KBHX, (c) KBBX, (d) KDAX, and (e) KMUX
radars (from www.ncdc.noaa.gov). Green, yellow, and blue corre-
sponds to coverage at 4000, 6000, and 10 000 ft above radar sites,
respectively. Radar site altitudes are 0.73, 0.05, 0.01, and 1.06 km
MSL for KBHX, KBBX, KDAX, and KMUX, respectively.
394 JOURNAL OF HYDROMETEOROLOGY VOLUME 15
how well different rain types are detected by remote
operational radars. Another goal of the study was to
provide climatological information on duration and
intensity of different rain types in this environmentally
sensitive area.
2. Datasets and methodology
Overall, during the 6-yr periodmentioned above, there
were 91 landfalling AR events observed at and near the
CZD site using theNOAAHMT instrumentation (Ralph
et al. 2013, their Table 1). Strong hydrological events in
the Russian River basin are usually associated with
such events (Dettinger et al. 2011). Since there were gaps
in the deployment of the S-PROF, profiler data at CZD
were available for only 58 of the 91AR events. This study
focuses on assessment of WSR-88D-based QPE during
these 58 events. An average duration of an AR event, as
defined by the integrated water vapor (IWV) exceeding
a threshold of 20mm, which is normally used when
defining AR boundaries (e.g., Ralph et al. 2013), was
about 16 h.
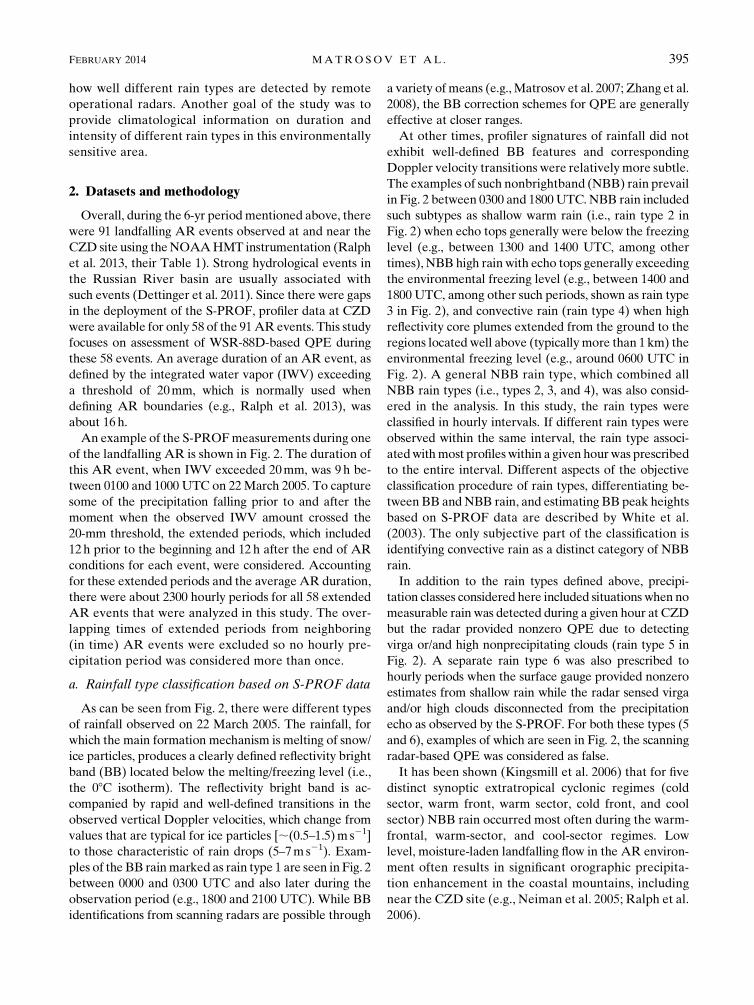
An example of the S-PROFmeasurements during one
of the landfalling AR is shown in Fig. 2. The duration of
this AR event, when IWV exceeded 20mm, was 9 h be-
tween 0100 and 1000 UTC on 22March 2005. To capture
some of the precipitation falling prior to and after the
moment when the observed IWV amount crossed the
20-mm threshold, the extended periods, which included
12h prior to the beginning and 12h after the end of AR
conditions for each event, were considered. Accounting
for these extended periods and the average AR duration,
there were about 2300 hourly periods for all 58 extended
AR events that were analyzed in this study. The over-
lapping times of extended periods from neighboring
(in time) AR events were excluded so no hourly pre-
cipitation period was considered more than once.
a. Rainfall type classification based on S-PROF data
As can be seen from Fig. 2, there were different types
of rainfall observed on 22 March 2005. The rainfall, for
which the main formation mechanism is melting of snow/
ice particles, produces a clearly defined reflectivity bright
band (BB) located below the melting/freezing level (i.e.,
the 08C isotherm). The reflectivity bright band is ac-
companied by rapid and well-defined transitions in the
observed vertical Doppler velocities, which change from
values that are typical for ice particles [;(0.5–1.5)m s21]
to those characteristic of rain drops (5–7ms21). Exam-
ples of the BB rainmarked as rain type 1 are seen in Fig. 2
between 0000 and 0300 UTC and also later during the
observation period (e.g., 1800 and 2100 UTC). While BB
identifications from scanning radars are possible through
a variety of means (e.g.,Matrosov et al. 2007; Zhang et al.
2008), the BB correction schemes for QPE are generally
effective at closer ranges.
At other times, profiler signatures of rainfall did not
exhibit well-defined BB features and corresponding
Doppler velocity transitions were relativelymore subtle.
The examples of such nonbrightband (NBB) rain prevail
in Fig. 2 between 0300 and 1800UTC. NBB rain included
such subtypes as shallow warm rain (i.e., rain type 2 in
Fig. 2) when echo tops generally were below the freezing
level (e.g., between 1300 and 1400 UTC, among other
times), NBB high rain with echo tops generally exceeding
the environmental freezing level (e.g., between 1400 and
1800 UTC, among other such periods, shown as rain type
3 in Fig. 2), and convective rain (rain type 4) when high
reflectivity core plumes extended from the ground to the
regions located well above (typically more than 1km) the
environmental freezing level (e.g., around 0600 UTC in
Fig. 2). A general NBB rain type, which combined all
NBB rain types (i.e., types 2, 3, and 4), was also consid-
ered in the analysis. In this study, the rain types were
classified in hourly intervals. If different rain types were
observed within the same interval, the rain type associ-
atedwithmost profileswithin a given hour was prescribed
to the entire interval. Different aspects of the objective
classification procedure of rain types, differentiating be-
tween BB andNBB rain, and estimating BB peak heights
based on S-PROF data are described by White et al.
(2003). The only subjective part of the classification is
identifying convective rain as a distinct category of NBB
rain.
In addition to the rain types defined above, precipi-
tation classes considered here included situations when no
measurable rain was detected during a given hour at CZD
but the radar provided nonzero QPE due to detecting
virga or/and high nonprecipitating clouds (rain type 5 in
Fig. 2). A separate rain type 6 was also prescribed to
hourly periods when the surface gauge provided nonzero
estimates from shallow rain while the radar sensed virga
and/or high clouds disconnected from the precipitation
echo as observed by the S-PROF. For both these types (5
and 6), examples of which are seen in Fig. 2, the scanning
radar-based QPE was considered as false.
It has been shown (Kingsmill et al. 2006) that for five
distinct synoptic extratropical cyclonic regimes (cold
sector, warm front, warm sector, cold front, and cool
sector) NBB rain occurred most often during the warm-
frontal, warm-sector, and cool-sector regimes. Low
level, moisture-laden landfalling flow in the AR environ-
ment often results in significant orographic precipita-
tion enhancement in the coastal mountains, including
near the CZD site (e.g., Neiman et al. 2005; Ralph et al.
2006).
FEBRUARY 2014 MATROSOV ET AL . 395
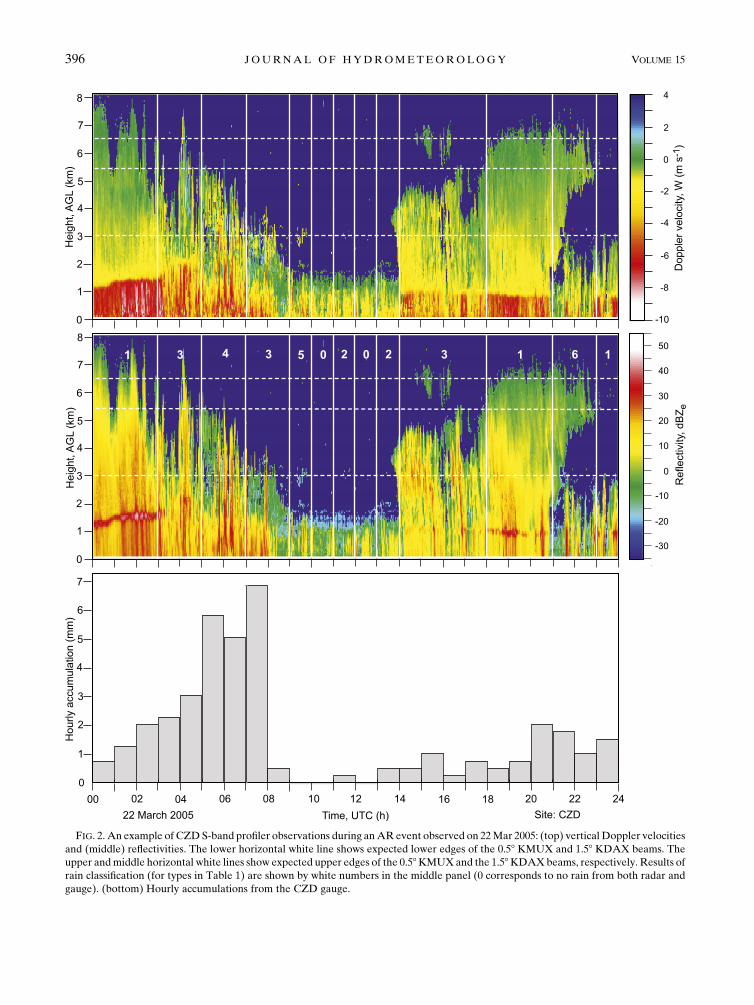
FIG. 2. An example of CZDS-band profiler observations during anAR event observed on 22Mar 2005: (top) vertical Doppler velocities
and (middle) reflectivities. The lower horizontal white line shows expected lower edges of the 0.58 KMUX and 1.58 KDAX beams. The
upper andmiddle horizontal white lines show expected upper edges of the 0.58KMUXand the 1.58KDAXbeams, respectively. Results of
rain classification (for types in Table 1) are shown by white numbers in the middle panel (0 corresponds to no rain from both radar and
gauge). (bottom) Hourly accumulations from the CZD gauge.
396 JOURNAL OF HYDROMETEOROLOGY VOLUME 15
FIG. 3. Examples of (left) KMUX 0.58 tilt and (right) KDAX 1.48 tilt reflectivity measurements during the AR event of 22 Mar 2005
shown in Fig. 1 when precipitation at CZD was classified as (a),(e) BB rain (0119 UTC), (b),(f) NBB high rain (0309 UTC), (c),(g) NBB
convective rain (0557 UTC), and (d),(h) NBBwarm shallow rain (1111UTC). Images were generated by the NOAAweather and climate
toolkit.
FEBRUARY 2014 MATROSOV ET AL . 397
b. Selection of WSR-88D radars to use
TheWSR-88D radars that are located closest to CZD
are in California’s Central Valley (i.e., the KDAX radar,
located at about 134 km from CZD and the KBBX ra-
dar, located at about 169 km from CZD; see Fig. 1).
Their views, however, are blocked by the coastal
mountains and often the lowest beam tilt (;0.58) mea-
surements cannot be used. Higher beam tilts and hybrid
scans (e.g., O’Bannon 1997) are required to obtain QPE
over this terrain. As seen from Figs. 1c and 1d, the valley
radars do not provide adequate coverage of offshore
regions adjacent to the area of interest.
Various beam blockage fractions necessitating the use
of different radar beam tilts can result in spatially dis-
continuous radar-derived QPE maps (e.g., Zhang et al.
2012). While partial beam blockage algorithms approxi-
mately correct for nonsevere beam blockage (e.g., Young
et al. 1999), significant uncertainties of such corrections
could arise from an assumption of standard radio signal
propagation because for any beam direction actual oc-
cultation can vary.Although theKMUXWSR-88D radar
is located farther from CZD (;199km) compared to the
Central Valley WSR-88D radars, because it is sited at
relatively high altitude (;1060m MSL) it provides an
unobstructed view of CZD (and surrounding coastal
areas) at the lowest beam tilt of 0.58 (Fig. 1e). The coastalKBHX radar, which is also located high (;740m MSL)
does not provide adequate coverage of the area of interest
because of longer distances and considerable blockage
(Fig. 1b).
The standard value of the second tilt elevation utilized
during most WSR-88D precipitation volume coverage
patterns (VCPs) is often 1.58. At this tilt, center beam
directions from the KDAX and KBBX radars to CZD
are generally not blocked for normal propagation con-
ditions. In this study, the KMUX 0.58 tilt and the KDAX
1.58 tilt measurements were used for assessments of
WSR-88D QPE over the CZD site. It is assumed that,
in terms of quality of radar-based QPE, this site is
representative of a broader area of Sonoma County,
including parts of the flood-prone Russian River ba-
sin, andQPE errors obtained for this site are applicable
to this broader area. The choice of KDAX over KBBX
was dictated by a shorter distance to the CZD site
(Fig. 1a).
Because of the sphericity of the earth, the center of
a fixed elevation scanning radar beam becomes pro-
gressively higher above the ground as range increases.
At the same time, the cross-beam resolution becomes
coarser with distance. The horizontal white lines in Fig. 2
show the expected levels of the lower and upper edges of
the KMUX radar beam over the CZD site. The heights
of these levels were calculated using a common ap-
proach [e.g., Doviak and Zrnic 1993, their Eq. (2.28)]
assuming the 0.958 beamwidth and the 0.58 tilt of theKMUX radar. It can be seen that for a number of hourly
time intervals for the example shown in Fig. 2, the radar
beam ‘‘overshoots’’ rainfall, which is detected by the
S-PROFandmeasured by the rain gauge (i.e., rain type 2).
At the standard 1.58 tilt the lower edge of the KDAX
beam above CZD is approximately the same as for
KMUX, while the upper edge is at about 5.4 AGL. It
should be mentioned, however, that for different ana-
lyzed events the exact values of the KDAX tilts, which
are nearest to 1.58, varied from about 1.48 to 1.78. Theactual tilt values were used in the analysis. Note that
the lower and upper edges of the 1.58 KBBX radar beam
over CZD for normal propagation conditions are about
4.2 and 7.2km, respectively. For the KBHX radar, these
edges over CZD are at about 3.4 and 7.4 km, respectively
(for the 0.58 tilt).
c. QPE schemes used with the WSR-88D radar data
Since, as seen from Fig. 2, the radar resolution volume
is relatively high above the ground, it is essential to
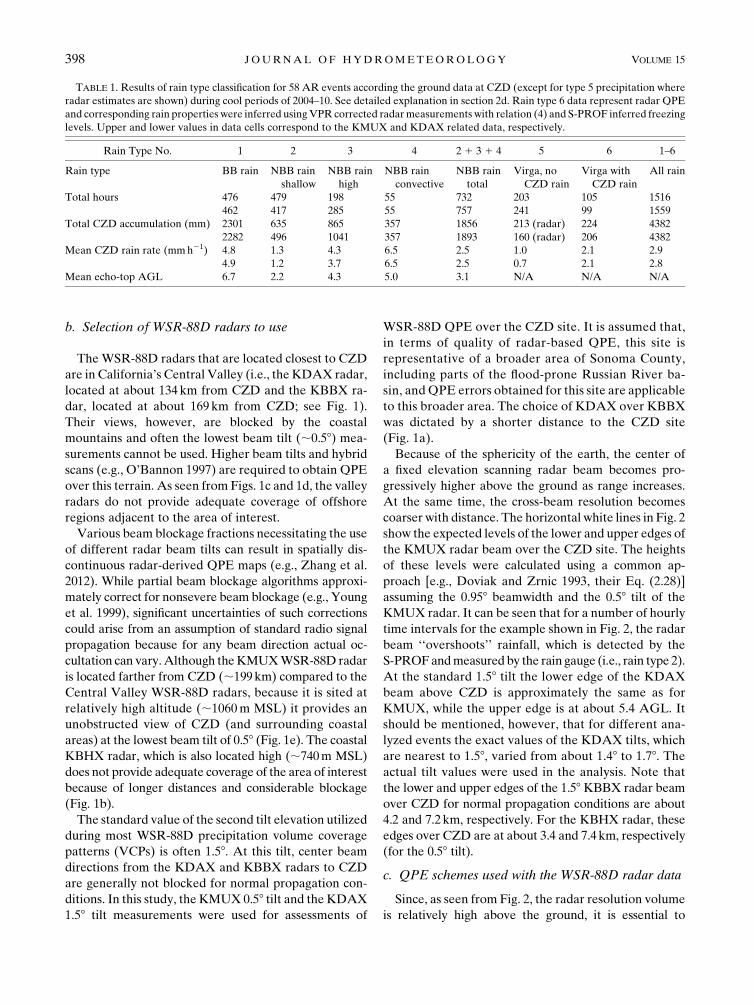
TABLE 1. Results of rain type classification for 58 AR events according the ground data at CZD (except for type 5 precipitation where
radar estimates are shown) during cool periods of 2004–10. See detailed explanation in section 2d. Rain type 6 data represent radar QPE
and corresponding rain properties were inferred usingVPR corrected radarmeasurements with relation (4) and S-PROF inferred freezing
levels. Upper and lower values in data cells correspond to the KMUX and KDAX related data, respectively.
Rain Type No. 1 2 3 4 2 1 3 1 4 5 6 1–6
Rain type BB rain NBB rain
shallow
NBB rain
high
NBB rain
convective
NBB rain
total
Virga, no
CZD rain
Virga with
CZD rain
All rain
Total hours 476 479 198 55 732 203 105 1516
462 417 285 55 757 241 99 1559
Total CZD accumulation (mm) 2301 635 865 357 1856 213 (radar) 224 4382
2282 496 1041 357 1893 160 (radar) 206 4382
Mean CZD rain rate (mmh21) 4.8 1.3 4.3 6.5 2.5 1.0 2.1 2.9
4.9 1.2 3.7 6.5 2.5 0.7 2.1 2.8
Mean echo-top AGL 6.7 2.2 4.3 5.0 3.1 N/A N/A N/A
398 JOURNAL OF HYDROMETEOROLOGY VOLUME 15
correct for the vertical profiles of reflectivity in calculat-
ingQPE (e.g., Koistinen 1991). VPR corrections are used
to predict rain reflectivity near the ground based on radar
measurements aloft. Typically, VPR schemes are better
suited for stratiform types of precipitation. As such, they
assume a decrease in reflectivity with height in snow and
ice regions of precipitating systems above the freezing
level (FL), a BB reflectivity enhancement due to particle
melting, and a nearly constant reflectivity profile in the
rain region below the melting layer. Significant uncer-
tainty in VPR reflectivity corrections is associated with
BB enhancement assumptions, as this enhancement ex-
hibits significant variability and is progressively smeared
as the radar range to observed precipitation increases
(e.g., Matrosov 2008).
Examining S-PROF measurements for all 58 obser-
vational AR cases showed that freezing levels generally
did not exceed 3 km AGL, which indicates that when
WSR-88D measurements detect precipitation over the
areas near the CZD site, the radar typically samples ice
phase hydrometeors except possibly in NBB rain. Be-
cause of this fact, VPR uncertainties caused by the BB
influence assumptions are avoidedwhen performingQPE
retrievals using the radar data. This essentially reduces
VPR applications to the assumptions of the reflectivity
gradient in the snow/ice regions, dZe/dh, and the height
of the freezing level hf. For the purpose of this study it
was assumed that dZe/dh525dBkm21, which is close to
a typical value found during previous HMT studies
(Matrosov et al. 2007), who suggested a simple VPR
shape (see their Fig. 2) that was also used in the current
study. This negative gradient of reflectivity reflects a de-
crease in ice mass content with height (e.g., Matrosov
1997). In this study, two sets of radar retrievals were
performed: one with a common for all observations
default value of hf 5 2.2 km MSL, which is close to the
mean synoptic freezing level at CZD during the cool
season (Neiman et al. 2005), and the other with the ac-
tual case dependent hf inferred from the S-PROF esti-
mates of BB heights. As BB maximum reflectivity
enhancements are generally located a few hundred
meters lower than the 08C isotherm (e.g., Matrosov
2008), the freezing level heights were assumed to be
0.2 km above the heights of S-PROF BB estimates.
The WSR-88D reflectivity estimates over the CZD
site were calculated by interpolation of data obtained at
two neighboring azimuthal directions which bracket the
direction from a radar site to CZD. Linear interpolation
was also used in range to obtain a reflectivity estimate
over the CZD site. The data in the super-resolution
WSR-88D mode, which has been employed by both ra-
dars since mid-2008, were averaged using a three-gate
running window to reduce measurement noise.
WSR-88D radars have been recently upgraded to
conduct dual-polarization measurements. The dual-
polarization data are expected to provide better QPE for
regions where radar resolution volumes are filled by rain
(i.e., primarily at shorter ranges, where the upper edge of
the radar beam is below the freezing level). However, rain
rate R retrievals based on conventional radar reflectivity
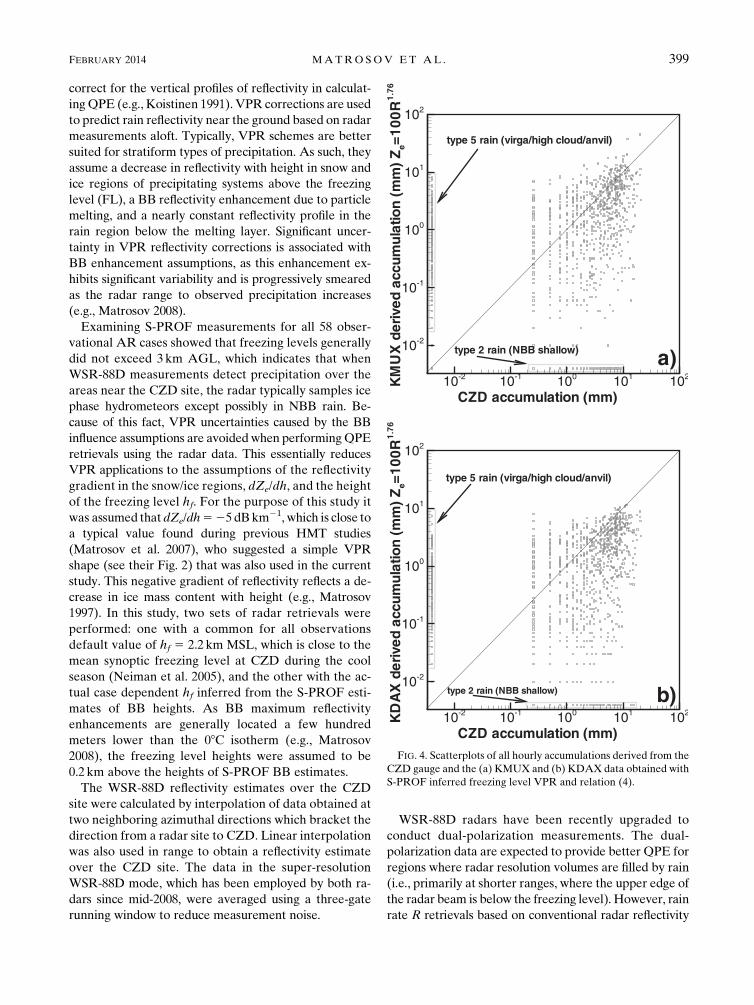
FIG. 4. Scatterplots of all hourly accumulations derived from the
CZD gauge and the (a) KMUX and (b) KDAX data obtained with
S-PROF inferred freezing level VPR and relation (4).
FEBRUARY 2014 MATROSOV ET AL . 399
measurements still are (and will likely remain) an im-
portant option for QPE estimates at longer ranges when
radar signals are attributable to ice–snow parts of preci-
pitating systems producing rainfall near the ground. Thus,
VPR-corrected Ze–R-based retrievals remain the viable
(if not the only) option for WSR-88D-based QPE in the
region of interest to this study.
The performance of four different Ze–R relations,
given below, was evaluated in this study:
Ze 5 44R1:91 , (1)
Ze 5 200R1:6 , (2)
Ze 5 75R2:0 , (3)
Ze 5 100R1:76 . (4)
Relation (1) was found by Martner et al. (2008) when
they analyzed drop size distribution (DSD) data in NBB
rainmeasured by an impact Joss–Waldvogel disdrometer
(JWD) at the CZD site during the cool season of 2004/05.
Relation (2) is the standard one used byWSR-88D radars
in stratiform rain. It is very close to the average Ze–R
relation for BB rain from Martner et al. (2008), so their
BB relation (i.e.,Ze5 170R1.61) was not considered in this
study separately. In addition to relations (1) and (2), re-
lation (3), which was recommended for cool-season ap-
plications in the western United States, and relation (4),
found using DSD measurements during HMT-06 field
project (Matrosov et al. 2007), were also utilized in this
study.
Figure 3 shows examples of KMUX lowest tilt (0.58)andKDAX1.48 tilt reflectivitymeasurements during the
event of 22 March 2005 shown in Fig. 2 when rain of
different types was detected by the CZDS-PROF. It can
be seen that a continuous radar echo is detected during
the BB rain (Figs. 3a,e). The gradual echo decrease with
range is due to the fact that higher ice regions with lower
reflectivity are sensed as range increases. Regions of
high NBB rain (i.e., the NBB rain detected by the radars
as opposed to shallow NBB rain) are characterized by
more discontinuous echoes (Figs. 3b,f). Some cellular
echo is observed during convective showers near CZD
(Figs. 3c,g). Warm shallow rain over CZD is not de-
tected by both radars at all (Figs. 3d,h). It can also be
seen from Fig. 3 that compared to the KDAX radar, the
KMUX radar observes more echo offshore, thus pro-
viding better coverage of precipitation associated with
landfalling ARs.
d. Intensity and relative duration of differentprecipitation types observed at CZD
Totals of 1516 (for KMUX) and 1559 (for KDAX)
hourly periods of rain from 58 extended AR events (out
of 2300 available) were analyzed in this study. These
hours were chosen based on the availability of the CZD
rain gauge, the S-PROF and WSR-88D radar observa-
tions, and the presence of measurable precipitation in
either the rain gauge (.0.01 in.) or radar data (i.e., when
the radar reflectivities were above the reported WSR-
88D noise level). Several hourly rainy periods during 58
AR events when radars were temporarily not operational
were disregarded. Also excluded were periods when
neither the gauge nor the operating radar indicated pre-
cipitation. Based on S-PROF data analysis, Table 1
presents the results of rain type classification for all
hourly periods and shows total hours and accumulations
for each rain type. This table also shows mean echo tops
he estimated from the S-PROF, total rainy hours and
accumulations, and the mean CZD rain rate (i.e., the
mean gauge hourly accumulation). Summary data for
all rain types are shown.
The results are presented separately for all precipi-
tation types defined earlier in section 3a. For type 5, when
the radars observed virga or/and high cloud, the radar-
derived false accumulations using relation (4) are
shown because the corresponding CZD gauge did not
TABLE 2. Statistical scores characterizingWSR-88D radar basedQPE for differentZe–R relations andVPR freezing levels hf (kmMSL)
assumptions as compared to the CZD gauge data for all hourly accumulation measurements for all rain types. Upper and lower values in
data cells correspond to the KMUX and KDAX related data, respectively.
hf 5 2.2 km hf 5 2.2 km hf 5 2.2 km hf 5 2.2 km S-Prof hf S-Prof hf S-Prof hf S-Prof hf
Ze 5 44R1.91 Ze 5 200R1.6 Ze 5 75R2.0 Ze 5 100R1.76 Ze 5 44R1.91 Ze 5 200R1.6 Ze 5 75R2.0 Ze 5 100R1.76
RMB (%) 7.0 233 226 217 210 246 237 231
223 256 245 243 232 263 252 251
RMSE (mm) 4.7 4.0 3.5 4.1 3.6 3.4 3.2 3.3
3.2 3.1 3.2 3.2 3.2 3.5 3.3 3.3
NMAE (%) 91 78 76 81 81 73 72 74
74 75 72 72 72 76 73 73
Correlation, r 0.66 0.61 0.67 0.64 0.70 0.67 0.71 0.69
0.72 0.69 0.72 0.71 0.72 0.70 0.72 0.71
400 JOURNAL OF HYDROMETEOROLOGY VOLUME 15
record any precipitation. Periods with erroneous rain
detection by radar when high cloud–anvil–virga radar
echoes were accompanied by shallow rainfall, which
was detached from higher regions of radar returns (i.e.,
rain type 6), were observed during approximately 7%
of all rainy hours for both radars. Such rainfall
amounted to about 5% of the total CZD accumulation.
Less than 12 (depending on the radar) rainy hourly
intervals classified as BB rain (rain type 1) lacked any
accumulations derived from the radar measurements.
This was due to low echo-top heights for these intervals
(e.g., between 2300 and 2400 UTC in Fig. 2), even
though the mean echo-top height for BB rains (i.e., he56.7 km AGL) was the highest among all rain types. The
BB rain produced more than half of the total accumu-
lationmeasured by the CZDgauge. It is seen fromTable
1 that while the total duration of this rain type was about
the same as for shallow NBB rain type 2, which went
undetected by the radars, BB rain was, on average,
about 4 times more intense than shallow NBB rain. The
heaviest, on average, was the NBB convective rain (i.e.,
type 4 rain), although it was observed during less than
4% of all rainy hours.
3. Evaluation of radar-derived hourly rainfallaccumulation
It is customary to evaluate the quality of radar-based
QPE based on 1-h accumulation values (e.g., Zhang et al.
2012). Evaluation for finer temporal scales is hampered
by incremental (i.e., 0.01 in.) estimates of rain gauges and
a diminishing number of radar scans at a given tilt as time
scales decrease. Scatterplots of WSR-88D derived hourly
QPE estimates, ak, for all hourly intervals versus CZD
gauge accumulations, ac, are depicted in Fig. 4. The re-
sults are shown for the QPE retrieval dataset obtained
whenVPRcorrections utilizemean freezing-level heights
inferred from the S-PROF data and theZe–R relation (4)
for calculating rain rates from VPR-corrected estimates
of reflectivity near the ground. This relation was obtained
using a large set of rain DSDs collected during HMT.
Even though the scatterplot data are depicted for relation
(4), a detailed statistical evaluation was performed for all
relations given by Eqs. (1)–(4).
The incremental character of gauge estimates is
manifested in Fig. 4 by the alignment of accumulations
along the vertical lines spaced 0.254mm (0.01 in.) apart.
A group of horizontal points that is aligned horizontally
near the x axis represents the NBB shallow rain, which is
not captured in radar observations. This rain accounts
for about 15% (for KMUX) and 12% (for KDAX) of the
total observed accumulation. Overall radars completely
missed or wrongly identified rainfall, which resulted in
859mm (for KMUX) and 702mm (for KDAX) of gauge
accumulation [;(16%–20%) of the total] at CZD (i.e.,
combined rain types 2 and 6 in Table 1). The group of
vertical points near the y axis represents false radar-
retrieved rainfall when no accumulation was actually
observed at the CZD site. As shown in Table 1, these
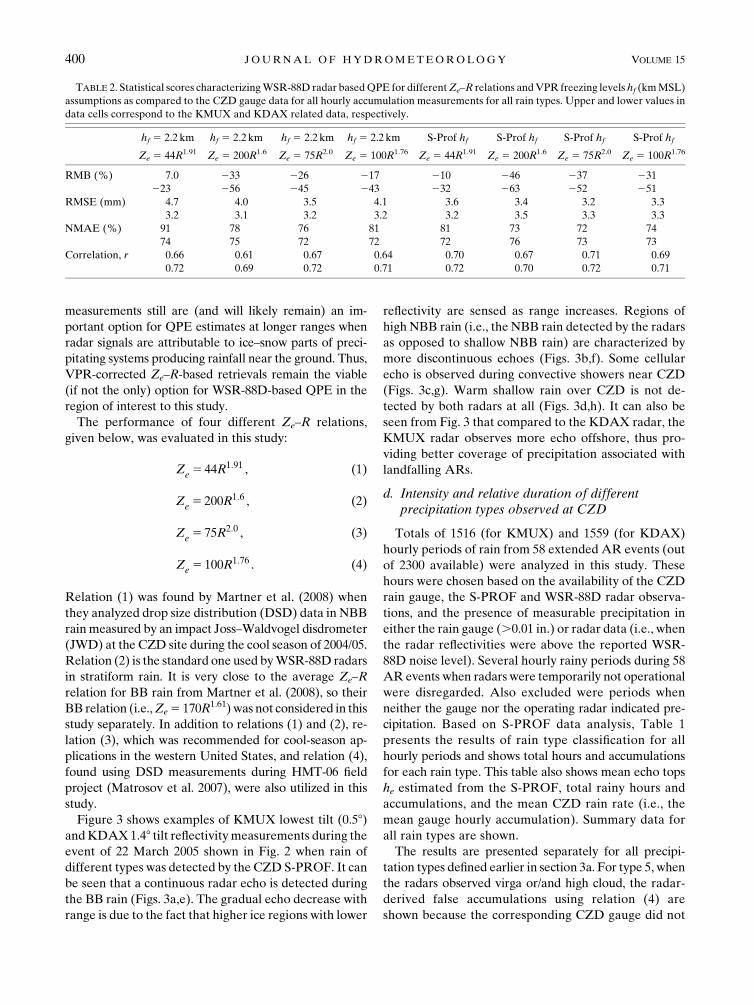
FIG. 5. Scatterplots of hourly accumulations during the BB rain
periods (type 1 rain in Table 1) derived from the CZD gauge and
the (a) KMUX and (b) KDAX data obtained with S-PROF in-
ferred freezing-level VPR and relation (4).
FEBRUARY 2014 MATROSOV ET AL . 401
erroneous radar QPE data amounted to 213mm (for
KMUX) and 160 (for KDAX) of accumulation.
Several statistical estimators were used to quantita-
tively assess the quality of radar-derived QPE. These
estimators were the relative mean bias (RMB),
RMB5 (hak 2 aci/haci)100%, (5)
the root-mean-square error (RMSE),
RMSE5 h(ak 2 ac)2i0:5 , (6)
and the normalized mean absolute error (NMAE),
NMAE5 (hjak 2 acji/haci)100%, (7)
where angle brackets mean averaging of hourly accu-
mulations. The statistical estimator scores and corre-
sponding linear correlation coefficients (r) between
radar and gauge accumulations are shown in Table 2 for
all hourly data points. The radar QPE results were
obtained using Ze–R relations (1)–(4) and the VPR
corrections, which utilized the default climatological
value for the freezing level height (hf 5 2.2 km) and
also the mean hf values inferred from the S-PROF.
As seen from Table 2 the NMAE values of radar QPE
based on both freezing-level sources are quite large
(70%–90%) and the corresponding RMSE values exceed
the mean hourly gauge accumulation (i.e., ;2.9mm) for
all data points. Partial cancellation of errors of different
signs from shallow NBB rain and high cloud/virga points
(rain types 3 and 6), when either radar or gauge data did
not show accumulations, results in small relative mean
biases for some Ze–R relations. Overall, for a given re-
lation and the same FL assumptions, KDAX accumu-
lations are generally lower than those from KMUX.
Possible reasons for that will be discussed later.
While Fig. 4 and Table 2 statistics are for all data
points including hourly periods of wrong detection (i.e.,
rain type 6) and those periods when only radar or only
gauge reported precipitation (rain types 2 and 5), of
special interest are comparisons of rain accumulations
when both radar and gauge sensors generally provided
data simultaneously from the same precipitating sys-
tems. Figure 5 shows scatterplots of radar-derived and
gauge hourly accumulations during periods of BB rain-
fall. The VPR correction with the S-PROF estimates of
FL level heights and relation (4) were used to obtain
radar data depicted in this figure. As mentioned earlier,
BB type rain over CZD was, for the most part, detected
by the radars. This rain type is characterized by higher
mean intensity (;4.8mmh21) than NBB rain (exclud-
ing convective periods), and was responsible for about
52% of the total CZD accumulation. The statistical
scores characterizing comparisons of WSR-88D QPE
and CZD gauge measurements for BB rain are shown
in Table 3.
It is evident from comparing Figs. 4 and 5 and Tables 2
and 3 that the agreement between radar and gauge QPE
for the BB rain hourly periods is much better than when
all hourly data points are considered. For KMUX there
is a noticeable improvement when the information on
freezing-level heights is inferred from S-PROF data
rather than using the default value of hf 5 2.2 km MSL.
For both radars the Ze–R relation (4) provides decent
results with relatively small biases and NMAE values of
around 50%. The correlation coefficients between radar
and gauge estimates are quite large (.0.8) using the
S-PROF based freezing levels and a bit less when using
the default value of hf 5 2.2 km. The RMSE values for
radar estimates that use S-PROF information are no-
ticeably smaller than the gauge mean hourly accumu-
lation for this rain type (i.e., 4.8mm).
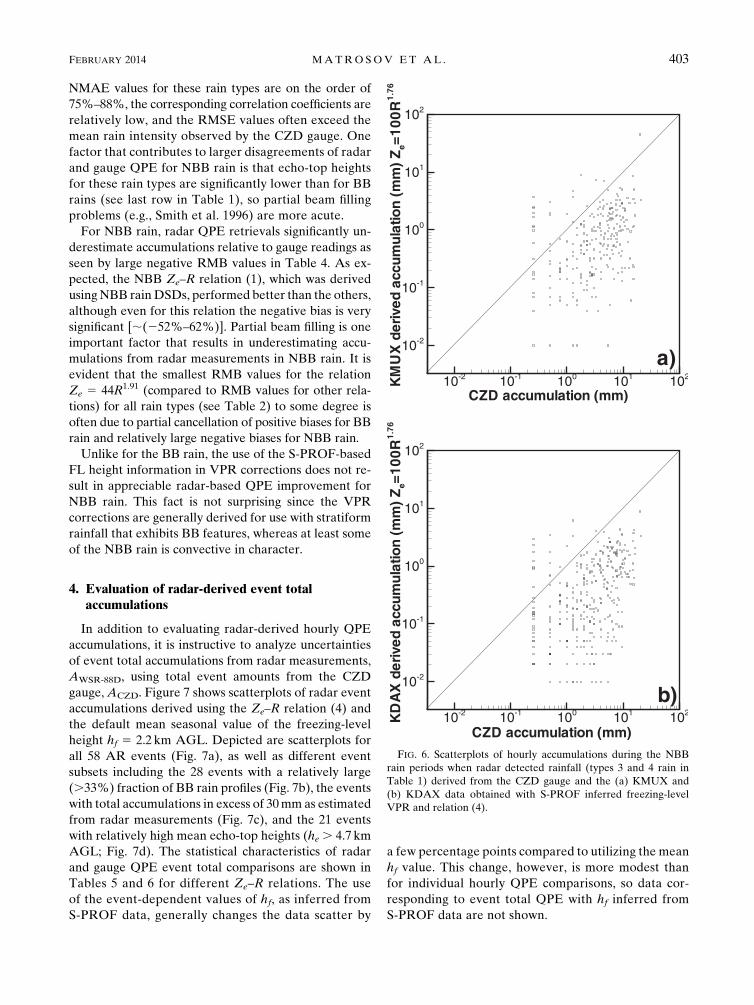
Scatterplots between radar-derived and gauge mea-
sured hourly accumulation data for NBB rain when both
sensors detected the same rainfall (i.e., rain types 3 and 4)
are depicted in Fig. 6. These data compare significantly
worse than for the BB rain type. As shown in Table 4, the
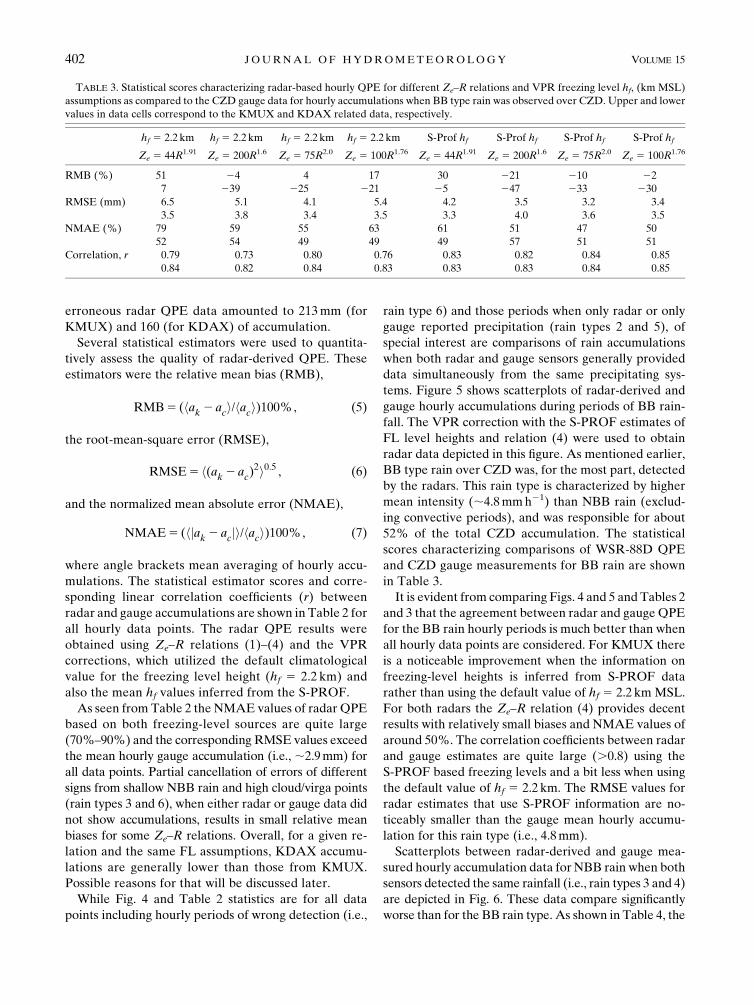
TABLE 3. Statistical scores characterizing radar-based hourly QPE for different Ze–R relations and VPR freezing level hf, (km MSL)
assumptions as compared to the CZD gauge data for hourly accumulations when BB type rain was observed over CZD. Upper and lower
values in data cells correspond to the KMUX and KDAX related data, respectively.
hf 5 2.2 km hf 5 2.2 km hf 5 2.2 km hf 5 2.2 km S-Prof hf S-Prof hf S-Prof hf S-Prof hf
Ze 5 44R1.91 Ze 5 200R1.6 Ze 5 75R2.0 Ze 5 100R1.76 Ze 5 44R1.91 Ze 5 200R1.6 Ze 5 75R2.0 Ze 5 100R1.76
RMB (%) 51 24 4 17 30 221 210 22
7 239 225 221 25 247 233 230
RMSE (mm) 6.5 5.1 4.1 5.4 4.2 3.5 3.2 3.4
3.5 3.8 3.4 3.5 3.3 4.0 3.6 3.5
NMAE (%) 79 59 55 63 61 51 47 50
52 54 49 49 49 57 51 51
Correlation, r 0.79 0.73 0.80 0.76 0.83 0.82 0.84 0.85
0.84 0.82 0.84 0.83 0.83 0.83 0.84 0.85
402 JOURNAL OF HYDROMETEOROLOGY VOLUME 15
NMAE values for these rain types are on the order of
75%–88%, the corresponding correlation coefficients are
relatively low, and the RMSE values often exceed the
mean rain intensity observed by the CZD gauge. One
factor that contributes to larger disagreements of radar
and gauge QPE for NBB rain is that echo-top heights
for these rain types are significantly lower than for BB
rains (see last row in Table 1), so partial beam filling
problems (e.g., Smith et al. 1996) are more acute.
For NBB rain, radar QPE retrievals significantly un-
derestimate accumulations relative to gauge readings as
seen by large negative RMB values in Table 4. As ex-
pected, the NBB Ze–R relation (1), which was derived
usingNBB rainDSDs, performed better than the others,
although even for this relation the negative bias is very
significant [;(252%–62%)]. Partial beam filling is one
important factor that results in underestimating accu-
mulations from radar measurements in NBB rain. It is
evident that the smallest RMB values for the relation
Ze 5 44R1.91 (compared to RMB values for other rela-
tions) for all rain types (see Table 2) to some degree is
often due to partial cancellation of positive biases for BB
rain and relatively large negative biases for NBB rain.
Unlike for the BB rain, the use of the S-PROF-based
FL height information in VPR corrections does not re-
sult in appreciable radar-based QPE improvement for
NBB rain. This fact is not surprising since the VPR
corrections are generally derived for use with stratiform
rainfall that exhibits BB features, whereas at least some
of the NBB rain is convective in character.
4. Evaluation of radar-derived event totalaccumulations
In addition to evaluating radar-derived hourly QPE
accumulations, it is instructive to analyze uncertainties
of event total accumulations from radar measurements,
AWSR-88D, using total event amounts from the CZD
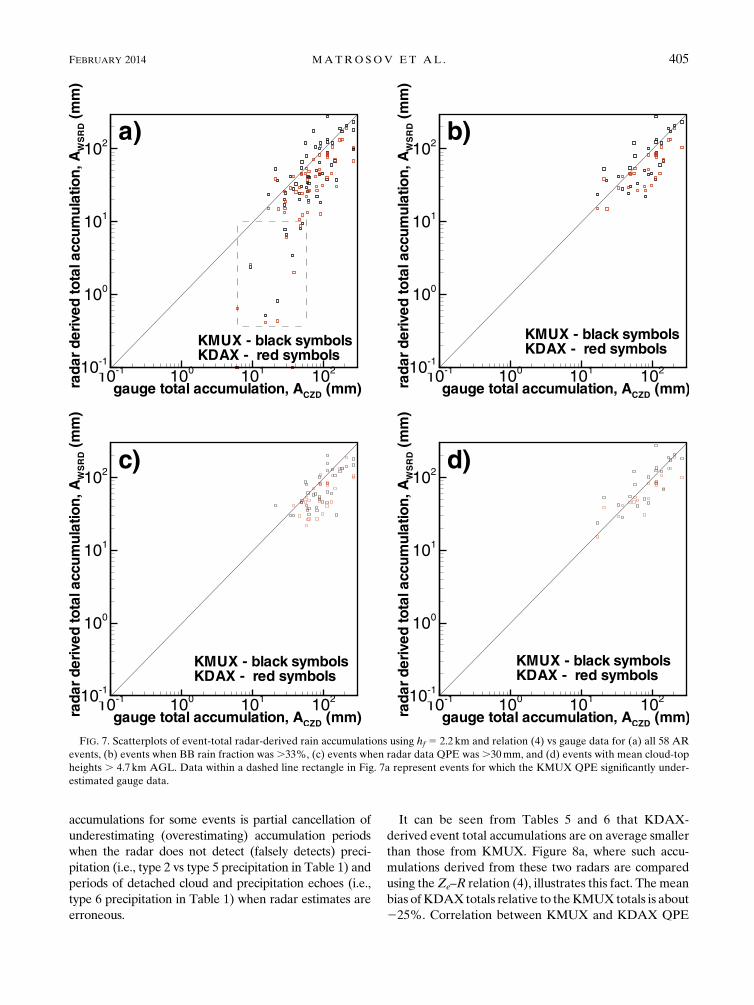
gauge, ACZD. Figure 7 shows scatterplots of radar event
accumulations derived using the Ze–R relation (4) and
the default mean seasonal value of the freezing-level
height hf 5 2.2 km AGL. Depicted are scatterplots for
all 58 AR events (Fig. 7a), as well as different event
subsets including the 28 events with a relatively large
(.33%) fraction of BB rain profiles (Fig. 7b), the events
with total accumulations in excess of 30mm as estimated
from radar measurements (Fig. 7c), and the 21 events
with relatively high mean echo-top heights (he . 4.7 km
AGL; Fig. 7d). The statistical characteristics of radar
and gauge QPE event total comparisons are shown in
Tables 5 and 6 for different Ze–R relations. The use
of the event-dependent values of hf, as inferred from
S-PROF data, generally changes the data scatter by
a few percentage points compared to utilizing the mean
hf value. This change, however, is more modest than
for individual hourly QPE comparisons, so data cor-
responding to event total QPE with hf inferred from
S-PROF data are not shown.
FIG. 6. Scatterplots of hourly accumulations during the NBB
rain periods when radar detected rainfall (types 3 and 4 rain in
Table 1) derived from the CZD gauge and the (a) KMUX and
(b) KDAX data obtained with S-PROF inferred freezing-level
VPR and relation (4).
FEBRUARY 2014 MATROSOV ET AL . 403

As seen from Fig. 7a, three AR events were not
‘‘sensed’’ at all by the radars (the corresponding data
points are on the x axis). Examining S-PROF data (not
shown) indicates that these events were almost entirely
associated with shallow warm rain. They produced CZD
gauge accumulations of 5.9, 6.2 (these two points almost
overlap in Fig. 7a), and 36.1mm, respectively. Therewere
also a number of AR events (shown inside the dashed-
line rectangle in Fig. 7a), for which radar-derived accu-
mulations (while exceeding a few tenths of a millimeter)
were significantly smaller than the gauge values observed
at CZD. These events, however, as seen from Fig. 7a,
were not among the ones that produced heaviest total
precipitation amounts.
Twenty-eight AR events with at least a 33% fraction
of BB rain type in observed precipitation (Fig. 7b)
generally produced more total accumulation (i.e., on
average 95.8mm of CZD totals per event as opposed to
75.6mm, which is the mean value for all 58 events). The
agreement between radar QPE and CZD QPE for
these events is noticeably better compared to all event
statistics. Corresponding NMAE values for relation (4)
are about 35%. This is comparable to the accuracy of
storm totals from WSR-88D-based QPE with obser-
vations at shorter ranges (e.g., Krajewski et al. 2010)
when no VPR corrections for radar measurements were
necessary.
Agreement between radar and gauge event total QPE
results is better for cases with large observed rainfall
amounts. Figure 7c shows the scatterplot for the data
when the radar QPE amounts calculated using the re-
lation (4) were in excess of a 30-mm threshold. There
were 35 and 31 such events observed by the KMUX and
KDAX radars, respectively. According to the gauge,
these events produced more than about 80% of the 58
event total rainfall at CZD. Statistical scores in Table 6
show that the data scatter for these events is somewhat
larger and correlation coefficients are a bit smaller
compared to the subset in Fig. 7b. CorrespondingNMAE
values, however, exhibit less sensitivity to the choice of
the Ze–R relation.
The event total accumulation estimates from the radar
data are, on average, more accurate for precipitating
systems that have higher echo tops. This fact is illus-
trated by Fig. 7d where a subset of 21 AR events was
chosen when mean echo-top height was greater than
a 4.7-km AGL threshold. This subset provided about
half of the total CZD accumulation. The 4.7-km AGL
threshold approximately corresponds to the center of
the lowest tilt KMUX beam over CZD, which means
that the partial beam filling effects negatively affecting
reflectivity measurements are not very severe. For full
beam filling, WSR-88D minimum detectable reflectivity
is about 25 dBZ at 200 km (D. Burgess 2012, personal
communication), which approximately corresponds to
values near echo fringes in Fig. 2. It should bementioned,
however, that the reported CZD S-PROF reflectivity
values might be somewhat biased because of drifts in
receiver–transmitter properties. The absolute calibra-
tion uncertainties of the S-PROF, however, do not affect
rainfall type classification results. Statistical score char-
acteristics (Table 6) for the 21 events with high echo tops
are rather similar to those for the subset of events with
higher fractions of BB rain.
The subsets ofAR events shown in Figs. 7b–d partially
overlap, as precipitating systems with larger fraction of
BB rain type generally have higher echo tops and tend to
produce larger amounts of precipitation.While choosing
an event with certain BB rain fractions or echo-top
height thresholds requires simultaneous S-PROF mea-
surements, a choice based on radar totals (i.e., Fig. 7c) is
based solely onWSR-88D radar data. This indicates that
radar-based estimates of the event accumulations could
be on average satisfactory if those estimates produce
larger amounts (e.g., greater than 30mm).A caveat here is
that one factor contributing to decent agreement of total
TABLE 4. Statistical scores characterizing radar-based hourly QPE for differentZe–R relations and VPR freezing-level hf (in kmMSL)
assumptions as compared to the CZD gauge data for hourly accumulations for NBB high and convective rain (types 3 and 4), which was
simultaneously measured by the radar and the CZD rain gauge. Upper and lower values in data cells correspond to the KMUX and
KDAX related data, respectively.
hf 5 2.2 km hf 5 2.2 km hf 5 2.2 km hf 5 2.2 km S-Prof hf S-Prof hf S-Prof hf S-Prof hf
Ze 5 44R1.91 Ze 5 200R1.6 Ze 5 75R2.0 Ze 5 100R1.76 Ze 5 44R1.91 Ze 5 200R1.6 Ze 5 75R2.0 Ze 5 100R1.76
RMB (%) 252 270 267 263 262 278 274 272
269 283 278 277 273 286 280 281
RMSE (mm) 5.7 5.9 5.3 5.7 5.4 5.6 5.3 5.5
4.4 4.9 4.7 4.7 4.5 5.0 4.8 4.8
NMAE (%) 77 84 79 81 78 87 81 82
75 86 81 82 79 88 84 85
Correlation, r 0.53 0.44 0.55 0.49 0.54 0.45 0.57 0.51
0.70 0.66 0.71 0.68 0.71 0.67 0.71 0.68
404 JOURNAL OF HYDROMETEOROLOGY VOLUME 15
accumulations for some events is partial cancellation of
underestimating (overestimating) accumulation periods
when the radar does not detect (falsely detects) preci-
pitation (i.e., type 2 vs type 5 precipitation in Table 1) and
periods of detached cloud and precipitation echoes (i.e.,
type 6 precipitation in Table 1) when radar estimates are
erroneous.
It can be seen from Tables 5 and 6 that KDAX-
derived event total accumulations are on average smaller
than those from KMUX. Figure 8a, where such accu-
mulations derived from these two radars are compared
using theZe–R relation (4), illustrates this fact. The mean
bias ofKDAXtotals relative to theKMUX totals is about
225%. Correlation between KMUX and KDAX QPE
FIG. 7. Scatterplots of event-total radar-derived rain accumulations using hf 5 2.2 km and relation (4) vs gauge data for (a) all 58 AR
events, (b) events when BB rain fraction was .33%, (c) events when radar data QPE was .30mm, and (d) events with mean cloud-top
heights . 4.7 km AGL. Data within a dashed line rectangle in Fig. 7a represent events for which the KMUX QPE significantly under-
estimated gauge data.
FEBRUARY 2014 MATROSOV ET AL . 405
results, however, is very high with the correlation co-
efficient being approximately 0.95. The underestimation
of rainfall fromKDAX relative to KMUX is also present
for hourly accumulations as shown in Fig. 8b. The cor-
relation coefficient between radar hourly accumulations
is approximately 0.8. One plausible explanation of the
KDAX–KMUX bias is differences in calibration and/or
in losses due to attenuation along the propagation paths.
Although calibrations are performed using common
procedures, reflectivity offsets between neighboring
WSR-88D radars are often present (e.g., Gourley et al.
2003). An independent recent study based on spring 2012
data usingDavis, California,HMT site data (D.Kingsmill
2012, personal communication) indicated that while the
KMUX reflectivities were in good agreement with
disdrometer-based estimates, KDAX reflectivities were
biased low relative to KMUX by about 3 dB. A detailed
investigation of relative miscalibration between KMUX
and KDAX radars over a multiyear period is, however,
beyond the scope of the current study. With a possibility
of such miscalibration, it should be mentioned that gen-
erally smaller biases (in the absolute sense) of KDAX
QPE obtained with the use of theZe–R relation (1) could
be just a consequence of the fact that this relation com-
pared to other considered here relations generally pro-
duces higher rain rates for the same reflectivities.
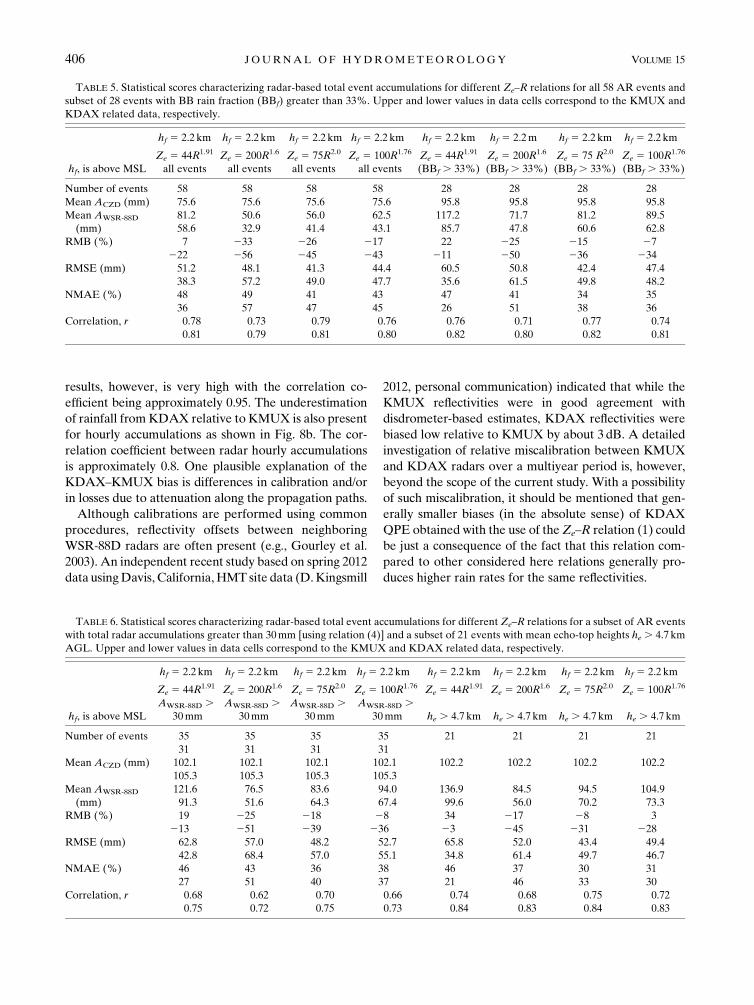
TABLE 5. Statistical scores characterizing radar-based total event accumulations for different Ze–R relations for all 58 AR events and
subset of 28 events with BB rain fraction (BBf) greater than 33%. Upper and lower values in data cells correspond to the KMUX and
KDAX related data, respectively.
hf, is above MSL
hf 5 2.2 km hf 5 2.2 km hf 5 2.2 km hf 5 2.2 km hf 5 2.2 km hf 5 2.2m hf 5 2.2 km hf 5 2.2 km
Ze 5 44R1.91
all events
Ze 5 200R1.6
all events
Ze 5 75R2.0
all events
Ze 5 100R1.76
all events
Ze 5 44R1.91
(BBf . 33%)
Ze 5 200R1.6
(BBf . 33%)
Ze 5 75 R2.0
(BBf . 33%)
Ze 5 100R1.76
(BBf . 33%)
Number of events 58 58 58 58 28 28 28 28
Mean ACZD (mm) 75.6 75.6 75.6 75.6 95.8 95.8 95.8 95.8
Mean AWSR-88D
(mm)
81.2 50.6 56.0 62.5 117.2 71.7 81.2 89.5
58.6 32.9 41.4 43.1 85.7 47.8 60.6 62.8
RMB (%) 7 233 226 217 22 225 215 27
222 256 245 243 211 250 236 234
RMSE (mm) 51.2 48.1 41.3 44.4 60.5 50.8 42.4 47.4
38.3 57.2 49.0 47.7 35.6 61.5 49.8 48.2
NMAE (%) 48 49 41 43 47 41 34 35
36 57 47 45 26 51 38 36
Correlation, r 0.78 0.73 0.79 0.76 0.76 0.71 0.77 0.74
0.81 0.79 0.81 0.80 0.82 0.80 0.82 0.81
TABLE 6. Statistical scores characterizing radar-based total event accumulations for different Ze–R relations for a subset of AR events
with total radar accumulations greater than 30mm [using relation (4)] and a subset of 21 events with mean echo-top heights he . 4.7 km
AGL. Upper and lower values in data cells correspond to the KMUX and KDAX related data, respectively.
hf, is above MSL
hf 5 2.2 km hf 5 2.2 km hf 5 2.2 km hf 5 2.2 km hf 5 2.2 km hf 5 2.2 km hf 5 2.2 km hf 5 2.2 km
Ze 5 44R1.91 Ze 5 200R1.6 Ze 5 75R2.0 Ze 5 100R1.76 Ze 5 44R1.91 Ze 5 200R1.6 Ze 5 75R2.0 Ze 5 100R1.76
AWSR-88D .30mm
AWSR-88D .30mm
AWSR-88D .30mm
AWSR-88D .30mm he . 4.7 km he . 4.7 km he . 4.7 km he . 4.7 km
Number of events 35 35 35 35 21 21 21 21
31 31 31 31
Mean ACZD (mm) 102.1 102.1 102.1 102.1 102.2 102.2 102.2 102.2
105.3 105.3 105.3 105.3
Mean AWSR-88D
(mm)
121.6 76.5 83.6 94.0 136.9 84.5 94.5 104.9
91.3 51.6 64.3 67.4 99.6 56.0 70.2 73.3
RMB (%) 19 225 218 28 34 217 28 3
213 251 239 236 23 245 231 228
RMSE (mm) 62.8 57.0 48.2 52.7 65.8 52.0 43.4 49.4
42.8 68.4 57.0 55.1 34.8 61.4 49.7 46.7
NMAE (%) 46 43 36 38 46 37 30 31
27 51 40 37 21 46 33 30
Correlation, r 0.68 0.62 0.70 0.66 0.74 0.68 0.75 0.72
0.75 0.72 0.75 0.73 0.84 0.83 0.84 0.83
406 JOURNAL OF HYDROMETEOROLOGY VOLUME 15

5. Discussion and conclusions
Evaluation of the KMUX and KDAX radar-derived
QPE over the NOAA HMT Cazadero (CZD) site in
northern Sonoma County, located in an area of relatively
poor WSR-88D network coverage, showed that the un-
certainty of radar estimates strongly depends on the type
of rainfall. Measurements from the S-PROF deployed
at CZD were used to classify rainfall in several types,
such as brightband (BB) and nonbrightband (NBB) rain
(including convective rain and shallowwarm rain), and to
infer echo-top and BB heights. The dataset was com-
posed of measurements taken simultaneously by the
S-PROF and WSR-88D radars during 58 atmospheric
river (AR) events observed over the cool-season pe-
riods of 2005–10. The radar QPE procedures included
the VPR corrections. The heights of radar resolution
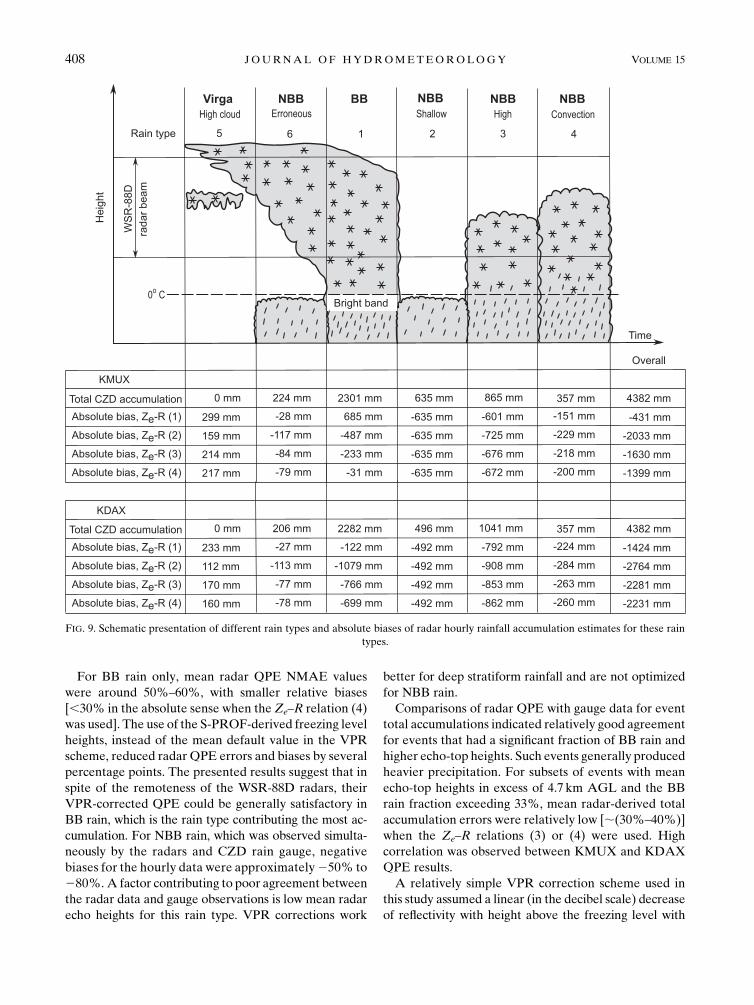
volumes were such that they rarely intersected the bright
band. Figure 9 schematically illustrates rain classifications,
provides information about contributions of different rain
types to the total accumulations, and shows absolute
biases of radar hourly QPE obtained using the S-PROF
information on freezing-level heights utilized in the VPR
correction. These biases were calculated as S(ak 2 ac),
where the summation was performed over all hourly
periods within a given rain type.
Overall more than 1500 hourly periods with measure-
able rain from gauge and/or radar data were analyzed.
During these periods 4382mm of rain were measured at
the ground. Radars and the gauge observed the same
precipitating systems during half of all rainy periods (in-
cluding BB and NBB high and convective rain), during
which more than about 80% of the total rainfall fell.
Because of the high altitude of the radar resolution vol-
umes above the ground for the tilts used (i.e., ;0.58 and;1.58 for KMUX and KDAX, respectively), the radars
were not able to detect shallow NBB rain, which was
largely warm rain. The number of hours of missed shal-
low NBB rain by the KDAX radar was about 15% less
than for the KMUX radar. The radars were able to detect
most of the BB rain, which produced about 2300mm of
accumulation over approximately 470 h of observations.
Since they were sensing high-altitude ice clouds or/and
anvils, the radars falsely detected 112–299mm (depend-
ing on the radar and the Ze–R relation choice) of pre-
cipitation when no rain was recorded on the ground.
During approximately 100 hourly periods the radars de-
tected rain, but for the wrong reason. Specifically, radar
sensed high clouds and/or virga instead of shallow rain,
which produced slightly over 200mm of precipitation at
the ground.
If all rainy periods are considered, the radars, on av-
erage, underestimated 1-h accumulations at the ground
with mean NMAE values on the order of 70%–90% and
relative mean biases varying from small positive values
to as low as about260% depending on the choice of the
Ze–R relation. These bias estimates, however, were
influenced by the periods of shallow rain, which was not
observed by the radars, and periods of radar false rain
detections. The negative biases for KDAX QPE were
larger (in the absolute sense) compared toKMUXQPE.
Differences in the radar calibrations and/or losses might
be responsible (at least in part) for this effect.
FIG. 8. Comparisons of KMUX and KDAX-derived (a) event total
and (b) hourly accumulations.
FEBRUARY 2014 MATROSOV ET AL . 407
For BB rain only, mean radar QPE NMAE values
were around 50%–60%, with smaller relative biases
[,30% in the absolute sense when the Ze–R relation (4)
was used]. The use of the S-PROF-derived freezing level
heights, instead of the mean default value in the VPR
scheme, reduced radar QPE errors and biases by several
percentage points. The presented results suggest that in
spite of the remoteness of the WSR-88D radars, their
VPR-corrected QPE could be generally satisfactory in
BB rain, which is the rain type contributing the most ac-
cumulation. For NBB rain, which was observed simulta-
neously by the radars and CZD rain gauge, negative
biases for the hourly data were approximately250% to
280%. A factor contributing to poor agreement between
the radar data and gauge observations is low mean radar
echo heights for this rain type. VPR corrections work
better for deep stratiform rainfall and are not optimized
for NBB rain.
Comparisons of radar QPE with gauge data for event
total accumulations indicated relatively good agreement
for events that had a significant fraction of BB rain and
higher echo-top heights. Such events generally produced
heavier precipitation. For subsets of events with mean
echo-top heights in excess of 4.7 km AGL and the BB
rain fraction exceeding 33%, mean radar-derived total
accumulation errors were relatively low [;(30%–40%)]
when the Ze–R relations (3) or (4) were used. High
correlation was observed between KMUX and KDAX
QPE results.
A relatively simple VPR correction scheme used in
this study assumed a linear (in the decibel scale) decrease
of reflectivity with height above the freezing level with
FIG. 9. Schematic presentation of different rain types and absolute biases of radar hourly rainfall accumulation estimates for these rain
types.
408 JOURNAL OF HYDROMETEOROLOGY VOLUME 15
a gradient dZe/dh of 25dBkm21 and a constant reflec-
tivity profile in the rain layer. While this VPR provided
a generally decent agreement between radar QPE and
gauge data for BB rains, the reflectivity gradients can
vary. It appears that the VPR utilized here may reflect
some mean conditions and seems to be appropriate for
observed BB rains.
The results of this study indicate that the use of pro-
filers such as the S-PROF for identifying rain type, echo-
top heights, and the VPR vertical structure operationally
at different locations is one way to improve radar-based
QPE in the area of interest. Accounting for FL heights
based on profiler data improves QPE by few percentage
points on average compared to the default VPR. Poten-
tial improvements in VPR shapes and accounting for
partial beam filling effects for detected rain with lower
echo tops based on profiler data will most likely further
improve QPE, especially for NBB rainfall. Deploying
profilers in environmentally sensitive areas is one im-
portant activity of the NOAA HMT Program.
The total accumulations for the events when the radar-
derived estimates exceeded 30mm (and thus flooding
hazards were more likely) compared favorably with
gauge data. An advantage for identifying such events is
that no auxiliary information on rain types and echo-top
heights from the profiler measurements is necessary and
only WSR-88D information is used in identifying such
events (even though accounting for the profiler informa-
tion still improves the general improvement with ground
data). These events usually contained larger fractions of
BB rain. One caveat for event-total QPE comparisons is
that partial cancellation of errors from no radar rain pe-
riods (e.g., rain type 2) and periodswhen the radar detects
virga/high clouds can occur when both such periods are
observed within the same event.
The KMUX radar has an unobstructed view of the
entire area of interest at the lowest tilt. Observations
with the KDAX radar over some regions in the area
might have differing occultation at the 1.58 tilt even
though the direction along the KDAX-CZD line is
largely unblocked at this tilt under the assumption of
normal propagation. It will be instructive in the future to
assess if radar QPE can reproduce the spatial variability
of rainfall in the larger area of interest.
The challenge of observing precipitation in the Rus-
sian River basin reflects conditions across much of the
western United States where weather service radars
alone cannot adequately detect orographic precipitation,
which is often relatively shallow. The converse problem,
when high cloud/virga is seen by a distant radar and
misrepresented as precipitation at the ground, is also an
issue (e.g., White et al. 2003; Kingsmill et al. 2006). This
study provides an evaluation of these issues over multiple
cool seasons with profiler data used to quantify the errors
separately. The findings will aid in the identification of
underobserved regions across the western United States,
and in consideration of alternative methods for filling the
gaps. The lessons learned from this study are relevant to
many basins from California to Washington State (e.g.,
the Eel River in California, Nehalem and Smith Rivers in
Oregon, and Chehalis River in Washington). Extreme
precipitation events in these basins are also associated
with AR conditions (Dettinger et al. 2011; Neiman
et al. 2011).
Acknowledgments. This study was funded by the
NOAA HMT project.
REFERENCES
Dettinger, M. D., F. M. Ralph, T. Das, P. J. Neiman, andD. Cayan,
2011: Atmospheric rivers, floods, and the water resources of
California. Water, 3, 455–478, doi:10.3390/w3020445.Doviak, R. J., and D. S. Zrnic, 1993: Doppler Radar and Weather
Observations. Academic Press, 562 pp.
Gourley, J. J., B. Kaney, and R. A. Maddox, 2003: Evaluating the
calibration of radars: A software approach. Extended Ab-
stracts, 31st Int. Conf. on Radar Meteorology, Seattle, WA,
Amer. Meteor. Soc., P3C.1. [Available online at https://ams.
confex.com/ams/32BC31R5C/techprogram/paper_64171.htm.]
Kingsmill, D. E., P. J. Neiman, F. M. Ralph, and A. B.White, 2006:
Synoptic and topographic variability of Northern California
precipitation characteristics in landfalling winter storms ob-
served during CALJET. Mon. Wea. Rev., 134, 2072–2094,
doi:10.1175/MWR3166.1.
Koistinen, J., 1991: Operational correction of radar rainfall errors
due to the vertical reflectivity profile. Preprints, 25th Int. Conf. on
Radar Meteorology, Paris, France, Amer. Meteor. Soc., 91–94.
Krajewski, W. F., G. Villarni, and J. A. Smith, 2010: Radar-rainfall
uncertainties: Where are we after thirty years of effort? Bull.
Amer. Meteor. Soc., 91, 87–94, doi:10.1175/2009BAMS2747.1.
Maddox, R., J. Zhang, J. J. Gourley, and K. Howard, 2002:
Weather radar coverage over contiguous United States. Wea.
Forecasting, 17, 927–934, doi:10.1175/1520-0434(2002)017,0927:
WRCOTC.2.0.CO;2.
Martner, B. E., S. E. Yuter, A. B. White, S. Y. Matrosov, D. E.
Kingsmill, and F. M. Ralph, 2008: Raindrop size distributions
and rain characteristics in California coastal rainfall for pe-
riods with and without a radar bright band. J. Hydrometeor., 9,408–425, doi:10.1175/2007JHM924.1.
Matrosov, S. Y., 1997: Variability of microphysical parameters
in high-altitude ice clouds: Results of the remote sens-
ing technique. J. Appl. Meteor., 36, 633–648, doi:10.1175/1520-0450-36.6.633.
——, 2008: Assessment of radar signal attenuation caused by the
melting hydrometeor layer. IEEETrans. Geosci. Remote Sens.,
46, 1039–1047, doi:10.1109/TGRS.2008.915757.
——, K. A. Clark, and D. E. Kingsmill, 2007: A polarimetric radar
approach to identify rain, melting-layer, and snow regions for
applying corrections to vertical profiles of reflectivity. J. Appl.
Meteor. Climatol., 46, 154–166, doi:10.1175/JAM2508.1.
Miller, D. A., D. Kitzmiller, S.Wu, andR. Setzenfand, 2010: Radar
precipitation estimates in mountainous regions: Corrections
FEBRUARY 2014 MATROSOV ET AL . 409
for partial beam blockage and general coverage limitations.
Extended Abstracts, 24th Conf. on Hydrology, St. Louis, MO,
Amer. Meteor. Soc., 7.2. [Available online at https://ams.
confex.com/ams/90annual/techprogram/paper_163622.htm.]
Neiman, P. J., G.A.Wick, F.M. Ralph, B. E.Martner, A. B.White,
and D. E. Kingsmill, 2005: Wintertime nonbrightband rain in
California and Oregon during CALJET and PACJET: Geo-
graphic, interannual, and synoptic variability.Mon.Wea. Rev.,
133, 1199–1223, doi:10.1175/MWR2919.1.
——, L. J. Schick, F. M. Ralph, M. Hughes, and G. A. Wick, 2011:
Flooding in western Washington: The connection to atmo-
spheric rivers. J. Hydrometeor., 12, 1337–1358, doi:10.1175/2011JHM1358.1.
O’Bannon, T., 1997: Using a terrain-based hybrid scan to improve
WSR-88D precipitation estimates. Preprints, 28th Int. Conf. on
Radar Meteorology,Austin, TX, Amer. Meteor. Soc., 506–507.
Ralph, F. M., P. J. Neiman, G. A. Wick, S. I. Gutman, M. D.
Dettinger, D. R. Cayan, and A. B. White, 2006: Flooding on
California’s Russian River: Role of atmospheric rivers. Geo-
phys. Res. Lett., 33, L13801, doi:10.1029/2006GL026689.
——, T. Coleman, P. Neiman, R. Zamora, and M. Dettinger, 2013:
Observed impacts of duration and seasonality of atmospheric-
river landfalls on soil moisture and runoff in coastal north-
ern California. J. Hydrometeor., 14, 443–459, doi:10.1175/
JHM-D-12-076.1.
Smith, J. A., D.-J. Seo, M. Baeck, and M. Hudlow, 1996: An inter-
comparison study of NEXRAD precipitation estimates. Water
Resour. Res., 32, 2035–2045, doi:10.1029/96WR00270.
Westrick, K. J., C. F. Mass, and B. A. Colle, 1999: The limitations
of the WSR-88D radar network for quantitative preci-
pitation measurement over the coastal western United
States.Bull. Amer. Meteor. Soc., 80, 2289–2298, doi:10.1175/1520-0477(1999)080,2289:TLOTWR.2.0.CO;2.
White, A. B., J. R. Jordan, B. E. Martner, F. M. Ralph,
and B. W. Bartram, 2000: Extending the dynamic range
of an S-band radar for cloud and precipitation studies.
J. Atmos. Oceanic Technol., 17, 1226–1234, doi:10.1175/
1520-0426(2000)017,1226:ETDROA.2.0.CO;2.
——, P. J. Neiman, F. M. Ralph, D. E. Kingsmill, and
P. O. G. Persson, 2003: Coastal orographic rainfall pro-
cesses observed by radar during the California land-falling
jets experiment. J. Hydrometeor., 4, 264–282, doi:10.1175/
1525-7541(2003)4,264:CORPOB.2.0.CO;2.
Young, C. B., B. R. Nelson, A. A. Bradly, J. A. Smith, C. D. Peters-
Lidard, A. Kruger, and M. L. Baeck, 1999: An evaluation of
NEXRAD precipitation estimates in complex terrain. J. Geo-
phys. Res., 104 (D16), 19 691–19703, doi:10.1029/1999JD900123.
Zhang, J., C. Langston, and K. Howard, 2008: Brightband identi-
fication based on vertical profiles of reflectivity from theWSR-
88D. J. Atmos. Oceanic Technol., 25, 1859–1872, doi:10.1175/
2008JTECHA1039.1.
——, Y. Qi, D. Kingsmill, and K. Howard, 2012: Radar-based
quantitative precipitation estimation for the cool season in
complex terrain: Case studies from the NOAA Hydrometeo-
rology Testbed. J. Hydrometeor., 13, 1836–1854, doi:10.1175/
JHM-D-11-0145.1.
410 JOURNAL OF HYDROMETEOROLOGY VOLUME 15