quantitative analysis of new generation antidepressants using gas chromatography-mass
TRANSCRIPT

Ghent University Faculty of Pharmaceutical Sciences
Quantitative analysis of new generation antidepressants using gas chromatography-mass
spectrometry
Applications in clinical and forensic toxicology
Sarah Wille Pharmacist
Thesis submitted to obtain the degree of Doctor in Pharmaceutical Sciences
2008
Dean: Promoter : Prof. Dr. Jean-Paul Remon Prof. Dr. Willy Lambert


TABLE OF CONTENTS
Table of contents
Acknowledgements
Copyright
List of Abbreviations
Structure
Chapter I Introduction 1Depression, use of antidepressants, and relevance of antidepressant monitoring
I.1. Foreword 3
I.2. Onset of depression 3
I.3. Action mechanisms of antidepressants 4
I.3.1. Activation of transcription factors 5
I.3.2. Activation of neurotropic pathways 7
I.3.3. Increasing neurogenesis 8
I.4. Classification of antidepressants 8
I.5. Side-effects, drug-drug interactions and toxicity 10
I.6. Relevance of Therapeutic Drug Monitoring 13
I.7. Selection of antidepressants and relevant issues for TDM 14
I.7.1. Citalopram 15
I.7.1.1. Mechanism of action 16
I.7.1.2. Pharmacokinetics 16
I.7.1.3. Drug concentrations and clinical effects 17
I.7.1.4. Drug interactions, side-effects and toxicity 18
I.7.1.5. Analytical Methods 18
I.7.2. Fluoxetine 19
I.7.2.1. Mechanism of action 20
I.7.2.2. Pharmacokinetics 20
I.7.2.3. Drug concentrations and clinical effects 21

I.7.2.4. Drug interactions, side-effects and toxicity 22
I.7.2.5. Analytical Methods 22
I.7.3. Fluvoxamine 23
I.7.3.1. Mechanism of action 24
I.7.3.2. Pharmacokinetics 24
I.7.3.3. Drug concentrations and clinical effects 25
I.7.3.4. Drug interactions, side-effects and toxicity 25
I.7.3.5. Analytical Methods 26
I.7.4. Maprotiline 27
I.7.4.1. Mechanism of action 27
I.7.4.2. Pharmacokinetics 28
I.7.4.3. Drug concentrations and clinical effects 28
I.7.4.4. Drug interactions, side-effects and toxicity 28
I.7.4.5. Analytical Methods 29
I.7.5. Melitracen 30
I.7.6. Mianserin 30
I.7.6.1. Mechanism of action 31
I.7.6.2. Pharmacokinetics 31
I.7.6.3. Drug concentrations and clinical effects 31
I.7.6.4. Drug interactions, side-effects and toxicity 32
I.7.6.5. Analytical Methods 32
I.7.7. Mirtazapine 32
I.7.7.1. Mechanism of action 33
I.7.7.2. Pharmacokinetics 33
I.7.7.3. Drug concentrations and clinical effects 33
I.7.7.4. Drug interactions, side-effects and toxicity 34
I.7.7.5. Analytical Methods 35
I.7.8. Paroxetine 35
I.7.8.1. Mechanism of action 36
I.7.8.2. Pharmacokinetics 36
I.7.8.3. Drug concentrations and clinical effects 37
I.7.8.4. Drug interactions, side-effects and toxicity 38
I.7.8.5. Analytical Methods 38
I.7.9. Reboxetine 39
I.7.9.1. Mechanism of action 40
I.7.9.2. Pharmacokinetics 40

I.7.9.3. Drug concentrations and clinical effects 40
I.7.9.4. Drug interactions, side-effects and toxicity 41
I.7.9.5. Analytical Methods 41
I.7.10. Sertraline 42
I.7.10.1. Mechanism of action 42
I.7.10.2. Pharmacokinetics 42
I.7.10.3. Drug concentrations and clinical effects 43
I.7.10.4. Drug interactions, side-effects and toxicity 44
I.7.10.5. Analytical Methods 44
I.7.11. Trazodone 45
I.7.11.1. Mechanism of action 45
I.7.11.2. Pharmacokinetics 45
I.7.11.3. Drug concentrations and clinical effects 46
I.7.11.4. Drug interactions, side-effects and toxicity 46
I.7.11.5. Analytical Methods 47
I.7.12. Venlafaxine 48
I.7.12.1. Mechanism of action 48
I.7.12.2. Pharmacokinetics 49
I.7.12.3. Drug concentrations and clinical effects 49
I.7.12.4. Drug interactions, side-effects and toxicity 50
I.7.12.5. Analytical Methods 51
I.7.13. Viloxazine 51
I.7.13.1. Mechanism of action 52
I.7.13.2. Pharmacokinetics 52
I.7.13.3. Drug concentrations and clinical effects 52
I.7.13.4. Drug interactions, side-effects and toxicity 52
I.7.13.5. Analytical Methods 53
I.8. Relevance of antidepressant analysis in forensic toxicology 53
I.9. References 54
Chapter II Objectives 75
Chapter III Sample preparation 79 Development and optimization of a solid phase extraction procedure for several biological matrices

III.1. Introduction 81
III.2. Experimental 82
III.2.1. Reagents 82
III.2.2. Stock solutions 83
III.2.3. Mixer, sonicator, vacuum manifold, evaporator 84
and centrifuge
III.2.4. High Pressure Liquid Chromatography (HPLC) 85
III.2.5. Gas chromatography-Mass spectrometry (GC-MS) 85
III.3. Solid phase extraction development 87
III.3.1. Choice of SPE sorbent 87
III.3.2. Choice of loading, washing and eluting conditions 90
III.3.3. Final SPE method of ADs spiked in water samples 93
III.4. Optimization of the SPE procedure for extraction of ADs 95 from biological matrices
III.4.1. SPE optimization for plasma samples 96
III.4.2. SPE optimization for blood samples 98
III.4.3. SPE optimization for brain samples 99
III.4.4. SPE optimization for hair samples 100
III.4.5. Recovery of ADs using SPE from plasma, blood 103
brain tissue
III.5. Conclusion 104
III.6. References 106
Chapter IV Derivatization 109
Development and optimization of a solid phase extraction procedure for several biological matrices
IV.1. Introduction 111
IV.2. Experimental 114
IV.2.1. Reagents 114
IV.2.2. Preparation of standard solutions 114
IV.2.3. Instrumentation 115

IV.2.4. Gas chromatographic parameters 115
IV.2.5. Mass spectrometric parameters 116
IV.3. Acetylation 116
IV.3.1. Optimization of acetylation reaction 116
IV.3.2. Acetylation reaction with antidepressants 116
IV.3.2.1. ADs containing an alcohol function 117
IV.3.2.2. ADs containing a primary amine function 119
IV.3.2.3. ADs containing secondary amine functions 121
IV.3.2.4. Tertiary amines 122
IV.3.3. Conclusion 123
IV.4. Heptafluorobutyrylation 124
IV.4.1. Optimization of HFBI reaction 124
IV.4.1.1. Experimental 124
IV.4.1.2. Results 124
IV.4.2. Optimization of HFBA reaction 126
IV.4.2.1. Experimental 126
IV.4.2.2. Results 126
IV.4.3. Heptafluorobutyrylation of antidepressants 127
IV.4.3.1. ADs containing an alcohol function 128
IV.4.3.2. ADs containing a primary amine function 130
IV.4.3.3. ADs containing secondary amine functions 130
IV.4.3.4. Tertiary amines 131
IV.4.4. Conclusion 131
IV.5. Choice of acylation procedure 133
IV.5.1. Acetylation versus heptafluorobutyrylation 133
IV.5.2. Heptafluorobutyrylimidazole versus heptafluoro- 134
butyric anhydride
IV.5.2.1. Experimental 134
IV.5.2.2. Results 134
IV.5.3. Conclusion 136
IV.6. Final derivatization procedure 137
IV.7. Validation of final derivatization procedure 137

IV.7.1. Precision 137
IV.7.1.1. Experimental 137
IV.7.1.2. Results 137
IV.7.2. Linearity 138
IV.7.2.1. Experimental 138
IV.7.2.2. Results 138
IV.7.3. Stability of the derivatives 139
IV.7.3.1. Experimental 139
IV.7.3.2. Results 139
IV.8. Conclusion 141
IV.9. References 142
Chapter V Gas chromatographic-mass spectrometric 145
method development
V.1. Introduction 147
V.2. Experimental 148
V.2.1. Reagents 148
V.2.2. Stock solutions 149
V.2.3. Equipment 149
V.3. Gas chromatographic parameters 150
V.3.1. Sample introduction 150
V.3.1.1. Cold on-column versus split/splitless injection 150
V.3.1.2. Splitless injection optimization 152
V.3.2. Chromatographic separation 157
V.3.2.1. Column choice 158
V.3.2.2. Choice of carrier gas and flow rate 159
V.3.2.3. Optimization of temperature program 159
V.3.3. Internal standard choice 162
V.3.4. Conclusion: gas chromatographic method 163
V.4. Mass spectrometric parameters 164
V.4.1. Optimization of mass selective detector parameters 167
V.4.2. Spectra of the derivatized ADs after electron 168

ionization
V.4.2.1. Venlafaxine and O-desmethylvenlafaxine 168
V.4.2.2. Viloxazine 170
V.4.2.3. Fluvoxamine 171
V.4.2.4. Fluoxetine, fluoxetine-d6 and desmethylfluoxetine 172
V.4.2.5. Mianserin, mianserin-d3 and desmethylmianserin 175
V.4.2.6. Mirtazapine and desmethylmirtazapine 177
V.4.2.7. Melitracen 179
V.4.2.8. Reboxetine 179
V.4.2.9. Citalopram, desmethylcitalopram and dides- 180
methylcitalopram
V.4.2.10. Maprotiline and desmethylmaprotiline 182
V.4.2.11. Sertraline and desmethylsertraline 184
V.4.2.12. Paroxetine and paroxetine-d6 185
V.4.2.13. Trazodone and m-chlorophenylpiperazine 186
V.4.3. Spectra of the derivatized ADs after positive ion 188
chemical ionization
V.4.3.1. Venlafaxine and O-desmethylvenlafaxine 190
V.4.3.2. Viloxazine 192
V.4.3.3. Fluvoxamine 192
V.4.3.4. Fluoxetine, fluoxetine-d6 and desmethylfluoxetine 193
V.4.3.5. Mianserin, mianserin-d3 and desmethylmianserin 196
V.4.3.6. Mirtazapine and desmethylmirtazapine 198
V.4.3.7. Melitracen 199
V.4.3.8. Reboxetine 200
V.4.3.9. Citalopram, desmethylcitalopram and dides- 201
methylcitalopram
V.4.3.10. Maprotiline and desmethylmaprotiline 204
V.4.3.11. Sertraline and desmethylsertraline 206
V.4.3.12. Paroxetine and paroxetine-d6 207
V.4.3.13. Trazodone and m-chlorophenylpiperazine 209
V.4.4. Spectra of the derivatized ADs after negative ion 210
chemical ionization
V.4.4.1. Venlafaxine and O-desmethylvenlafaxine 212
V.4.4.2. Viloxazine 213
V.4.4.3. Fluvoxamine 214
V.4.4.4. Fluoxetine, fluoxetine-d6 and desmethylfluoxetine 215
V.4.4.5. Mianserin, mianserin-d3 and desmethylmianserin 218
V.4.4.6. Mirtazapine and desmethylmirtazapine 219
V.4.4.7. Melitracen 220
V.4.4.8. Reboxetine 220
V.4.4.9. Citalopram, desmethylcitalopram and dides- 221
methylcitalopram
V.4.4.10. Maprotiline and desmethylmaprotiline 223
V.4.4.11. Sertraline and desmethylsertraline 224
V.4.4.12. Paroxetine and paroxetine-d6 226
V.4.4.13. Trazodone and m-chlorophenylpiperazine 228
V.4.5. Conclusion: mass spectrometric detection 229
V.5. Conclusion 231
V.6. References 232
Chapter VI Validation 235
VI.1. Introduction 237
VI.2. Experimental 238
VI.2.1. Reagents 238
VI.2.2. Preparation of standard solutions and calibrators 239
VI.2.3. Instrumentation 240
VI.2.4. Sample preparation 240
VI.2.5. Gas chromatographic parameters 242
VI.2.6. Mass spectrometric parameters 242
VI.3. Method Validation 243
VI.3.1. Stability 244
VI.3.1.1. Experimental 244
VI.3.1.2. Results and discussion 245
VI.3.2. Recovery 249
VI.3.2.1. Experimental 249
VI.3.2.2. Results and discussion 249
VI.3.3. Selectivity 250
VI.3.3.1. Experimental 250

VI.3.3.2. Results and discussion 250
VI.3.4. Linearity 253
VI.3.4.1. Experimental 253
VI.3.4.2. Results and discussion 254
VI.3.5. Sensitivity 259
VI.3.5.1. Experimental 259
VI.3.5.2. Results and discussion 259
VI.3.6. Precision 261
VI.3.6.1. Experimental 261
VI.3.6.2. Results and discussion 261
VI.3.7. Accuracy 262
VI.3.7.1. Experimental 262
VI.3.7.2. Results and discussion 263
VI.4. Conclusion 264
VI.5. References 266
Chapter VII Therapeutic drug monitoring 271
and pharmacogenetics of antidepressants
VII.1. Foreword 273
VII.2. Introduction 273
VII.2.1. Patient information and qualitative diagnostic 276
tests
VII.2.2. Therapeutic drug monitoring 277
VII.2.3. Genetic variability 279
VII.3. Experimental 282
VII.3.1. Patient selection 282
VII.3.2. Therapeutic drug monitoring 283
VII.3.3. Determination of genetic variability 283
VII.3.3.1. DNA extraction from EDTA-blood samples 286
VII.3.3.2. Pre-amplification of a 1654 bp DNA fragment 287
of cytochrome 2D6
VII.3.3.3. Confirmation of the amplification reaction 288
VII.3.3.4. Real-Time PCR reactions in the LightCycler 288

VII.3.3.5. Sequencing 289
VII.3.3.6. Quality control 290
VII.4. Case Report 291
VII.4.1. Patient information and qualitative diagnostic 291
tests
VII.4.2. Therapeutic drug monitoring 292
VII.4.3. Determination of CYP2D6 polymorphisms 293
VII.4.4. TDM-GEN discussion for the case report 298
VII.5. Conclusion 299
VII.6. References 301
Chapter VIII Monitoring of antidepressants in forensic 305
toxicology
VIII.1. Introduction 307
VIII.1.1. Urine and blood analysis 307
VIII.1.2. Brain tissue 309
VIII.1.3. Hair 311
VIII.2. Experimental 313
VIII.2.1. Samples and reagents 313
VIII.2.2. High Pressure Liquid Chromatography 314
VIII.2.3. Gas Chromatography–Mass Spectrometry 314
VIII.3. Case reports 315
VIII.3.1. Case 1 317
VIII.3.2. Case 2 319
VIII.3.3. Case 3 319
VIII.3.4. Case 4 322
VIII.3.5. Case 5 324
VIII.4. Conclusion 325
VIII.5. References 326
Chapter IX General conclusion 329

Summary
Samenvatting
Curriculum Vitae


ACKNOWLEDGMENTS DANKWOORD
I want to express my gratitude to everyone who directly or indirectly
contributed to the success of this project.
First of all, I want to thank my promoter Prof. Willy Lambert for giving me
the opportunity to start my Ph.D. at his laboratory, for letting me follow my
own ideas concerning my research, for the constructive remarks, for the
opportunities to present my work and much more. I also want to show my
gratitude towards the team of the Laboratory of Toxicology in Antwerp: Prof.
Hugo Neels, Paul Van hee, Mirielle De Doncker, and Liesbeth Daniëls. Thank
you Hugo for helping me contact the psychiatric clinics and for letting me
discover another field of research. A lot of thanks to Paul for demonstrating
the possibilities of the GC and for checking the fragmentation patterns.
Thanks to Myrielle and Liesbeth for the practical support. I sincerely thank
Dr. Ludo Lauwers for sharing information about pharmacoeconomics of the
investigated antidepressants. Several researchers at the Faculty of
Pharmaceutical Sciences, especially Prof. Thienpont, Dr. Stöckl, Prof. De
Smedt, Prof. Demeester and Dr. Stove also deserve gratitude for the
interesting discussions concerning my work. I also want to thank a lot of
people that I met on TIAFT and IATDMCT meetings for giving me ideas,
comments concerning my subject and to keep me motivated.
Of course all of my colleagues should not be forgotten! Thank you for the
interesting discussions concerning my work, for supporting me when yet
another experiment went wrong. Especially thanks for the fun time during the
coffee break, birthday and dinner parties.
Tenslotte wil ik mijn familie, vrienden en Evert bedanken. Bedankt dat jullie
zo jullie best deden om uren naar de uitleg over GC-troubleshooting te
luisteren: het interessantste onderwerp aller tijden ;-)
Bedankt om al die heisa te relativeren en om mij te doen lachen en te laten
ontspannen. Bedankt ook aan mijn ouders om mij te steunen in mijn studies,
en om mij te motiveren. Evert, heel erg bedankt voor alles, dat weet je wel.
Nu is het jouw beurt om ‘te freaken’, ‘te zagen’, urenlang enthousiast over je
congres te praten,…Merci!


COPYRIGHT
The author and promoter give authorization to consult and copy parts of this
thesis for personal use only. Any other use is limited by the laws of
Copyright, especially concerning the obligation to refer to the source
whenever results are cited from this thesis.
De auteur en promotor geven de toelating dit proefschrift voor consultatie
beschikbaar te stellen en delen ervan te kopiëren voor persoonlijk gebruik.
Elk ander gebruik valt onder de beperkingen van het auteursrecht, in het
bijzonder met betrekking tot de verplichting uitdrukkelijk de bron te
vermelden bij het aanhalen van resultaten uit dit proefschrift.
Ghent, 2008,
The promoter, The author,
Prof. Dr. W. Lambert Sarah Wille


LIST OF ABBREVIATIONS
ACN acetonitrile AD antidepressant AGNP arbeitsgemeinschaft für neuropsychopharmakologie und
pharmakopsychiatrie AMP adenosine monophosphate amu atomic mass unit APCI atmospheric pressure chemical ionization
BDNF brain-derived neurotrophic factor
CI confidence interval CI(-mode) chemical ionization CRE cAMP/Ca2+-responsive element CREB cAMP/ Ca2+-responsive element binding protein CRH corticotrophin-releasing hormone CYP cytochrome
DAD diode array detector DDMC didesmethylcitalopram DMC desmethylcitalopram DMFluox desmethylfluoxetine DMMap desmethylmaprotiline DMMia desmethylmianserin DMMir desmethylmirtazapine DMSer desmethylsertraline DNA deoxyribonucleic acid DSM-IV american psychiatric association diagnostic and statistical
manual of mental disorders DRI dopamine reuptake inhibitor
ECD electron capture detector EDTA ethylene diamine tetra-acetic acid EI electron ionization EM extensive metabolizer ESI electrospray ionization eV electron volt
Fd6 hexa-deuterated fluoxetine FDA food and drug administration F19 MRS fluorine magnetic resonance spectroscopy
GABA gamma-aminobutyric acid GC gas chromatography
HAM-D hamilton depression rating scale HFB- heptafluorobutyryl- HFBA heptafluorobutyric anhydride HFBI heptafluorobutyryl imidazole HPA hypothalamic-pituitary-adrenal axis HPLC high pressure liquid chromatography
IM intermediate metabolizer

I.S. internal standard LC liquid chromatography LLE liquid/liquid extraction LOQ limit of quantification
m-cpp m-chlorophenylpiperazine MAOI mono-amine oxidase inhibitor MADRS montgomery and asberg depression rating scale Md3 tri-deuterated mianserin MeOH methanol MRP multidrug resistance associated protein MS mass spectrometry m/z mass-to-charge ratio
NARI selective noradrenaline reuptake inhibitor NaSSA noradrenergic and specific serotonergic antidepressant NICI negative ion chemical ionization NPD nitrogen phosphorus detector
ODMV O-desmethylvenlafaxine
Pd6 hexa-deuterated paroxetine PICI positive ion chemical ionization PKA cAMP-dependent protein kinase A pKa dissociation constant PM poor metabolizer P-gp P-glycoprotein transporter
RE relative error RSD relative standard deviation RSK1-3 ribosomal S6 kinases
SARI serotonin-2 antagonist and reuptake inhibitor SCX strong cation exchanger SIM selected ion monitoring S/N signal to noise ratio SNRI serotonin and noradrenaline reuptake inhibitor SPE solid phase extraction SPME solid phase micro extraction SSRE selective serotonin reuptake enhancer SSRI selective serotonin reuptake inhibitor STA systematic toxicological analysis
TCA tricyclic antidepressantTDM therapeutic drug monitoring TDM-GEN therapeutic drug monitoring combined with genotyping TIAFT the international association of forensic toxicologists trkB tyrosine kinase B receptor
UGT uridine diphosphate glucuronosyltransferase UM ultrarapid metabolizer UV ultraviolet
WCX weak cation exchanger

STRUCTURE
This thesis gives an overview of the development of a gas chromatographic-
mass spectrometric (GC-MS) method for new generation antidepressants
(ADs) and their metabolites. The structure of the manuscript is build up as if
the reader is following the sample analysis.
First a general overview of the ADs and the relevance of monitoring those
compounds in clinical and forensic settings are given in chapter I, while
chapter II gives an overview of the objectives of our research.
Thereafter the method development for sample analysis is described.
Chapter III describes the solid phase extraction development for different
biological matrices such as plasma, blood, brain and hair tissue. Because a
GC-MS configuration was applied, derivatization of the extracts was
evaluated and optimized (chapter IV). After the sample preparation, the
ADs and metabolites are separated and detected using gas chromatography-
mass spectrometry. The chromatographic and mass spectrometric
parameters for three ionization modes (electron ionization, positive and
negative ion chemical ionization) were optimized for each compound as
described in chapter V.
Having established a GC-MS procedure for new generation ADs, this method
was validated based on the FDA guidelines concerning stability, linearity,
sensitivity, selectivity, precision, and accuracy. The validation procedure is
described in chapter VI.
The applicability of the developed and validated method is evaluated in
chapter VII and VIII. Chapter VII describes the usefulness of the
developed method in a clinical setting by describing a project in which the
antidepressant/metabolite plasma concentration will be linked to the
metabolization capacity of the individual patient. Chapter VIII describes the
application of the procedure to post-mortem cases with matrices such as
whole blood, brain tissue and hair.
A general conclusion is given in chapter IX.


Chapter I
Introduction:depression,
use of antidepressants, and relevance of antidepressant monitoring
Based on:Wille SMR, Cooreman SG, Neels HM, Lambert WEE. Relevant issues in the monitoring and the toxicology of old and new antidepressants. Crit. Rev. Clin. Lab. Sci. 2008; 45 (1): 1-66


Chapter I: Introduction: depression, use of antidepressants, and relevance of antidepressant monitoring
3
I.1. Foreword
Depression is a chronic or recurrent mood disorder that affects both
economic and social functions of about 121 million people worldwide.
According to the World Health Organization, depression will be the second
leading contributor to the global burden of disease, calculated for all ages and
both sexes by the year 2020 [1-3]. This common mental disorder presents a
highly variable set of symptoms such as depressed mood, loss of interest or
pleasure, feelings of guilt or low self-esteem, disturbed sleep or appetite, low
energy, and poor concentration. These problems lead to substantial
impairments in an individual's ability to take care of his or her everyday
responsibilities. At its worst, depression can lead to suicide, a tragic fatality
associated with the loss of about 850 thousand lives every year. Depression
can be subdivided in bipolar disorder (manic-depression), dysthymia, and
major depression (unipolar depression). This introduction will focus on major
depression, discussing the onset of depression and the treatment, including
the action mechanisms, side-effects and toxicity of the new generation
antidepressants (ADs). Moreover, the potential value of therapeutic drug
monitoring (TDM) and toxicological assays for these drugs is discussed in
relation to their mode of action, drug interactions, metabolism and
pharmacokinetic properties.
I.2. Onset of depression
Epidemiologic studies show that about 40-50% of the risk of depression is
genetic. However, no specific genes or genetic abnormality have been
identified to date with certainty. In addition, factors such as stress, emotional
trauma, viral infections, and certain processes in brain development also
have an influence on the etiology of depression [4]. The neural circuitry
underlying depression is not yet fully understood. It is likely that several
brain regions (prefrontal and cingulated cortex, hippocampus, striatum,
amygdale and thalamus) mediate the diverse symptoms of depression.
It seems that malfunction of the hypothalamic-pituitary-adrenal (HPA) axis
plays an important role [5]. These malfunctions include an increased

Chapter I: Introduction: depression, use of antidepressants, and relevance of antidepressant monitoring
4
corticotrophin-releasing hormone (CRH) level or an impaired cortisol negative
feedback mechanism, stimulating the release of glucocorticoids from the
adrenal cortex. This release of glycocorticoids leads to damage of the
hippocampal neurons, resulting in impaired hippocampal function which
contributes to some of the cognitive abnormalities of depression.
The evidence that monoamine systems including serotonergic, noradrenergic
and dopaminergic systems are crucial in the pathophysiology of depression
was already known in the early 1950’s. Low serotonin activity and depletion
of catecholamines in the central and peripheral nervous system was
associated with depression. Therefore, several receptors and transporters of
these monoamines became the target of medical treatment of depression.
Neurotrophic factors such as the brain-derived neurotrophic factor (BDNF)
play a role, as they regulate the neural growth and plasticity as well as the
survival of adult neurons and glia. The up-regulation of the expression of
BDNF by ADs could oppose the cell death pathway.
On the other hand, the GABAergic system also seems to be critical as in
depressed patients lower GABA levels are observed in the occipital cortex
using magnetic resonance spectroscopy studies. In addition, the GABAergic
system interacts with the serotonergic system, the noradrenergic system, the
hypothalamic-pituitary-adrenal axis and neurotrophic factors.
I.3. Action mechanisms of antidepressants
Monoamine neurotransmitters such as dopamine, serotonin and
noradrenaline play an important role in the onset and treatment of
depression, as depression can be improved by compounds that increase
synaptic concentrations of these neurotransmitters. These increased
concentrations can be achieved by various mechanisms such as blocking
neurotransmitter transport (reuptake) and neurotransmitter auto-receptors
or by inhibiting the mitochondrial enzyme monoamine oxidase which is
responsible for the oxidative deamination of endogenous and xenobiotic
monoamines [6, 7]. Neurotransmitter transporters and certain receptors are

Chapter I: Introduction: depression, use of antidepressants, and relevance of antidepressant monitoring
5
safety-mechanisms that prevent overstimulation of receptors in the synapse
by either transporting monoamines back into the neuron or diminishing the
nerve impulse to release more neurotransmitter. When these transporters
and receptors are blocked, the negative feed-back mechanism of the neuron
is stopped, leading to a higher concentration of monoamines in the synapse.
These are the action mechanisms of the tricyclic (TCA) and new generation
ADs. However, while TCAs block the transport and receptors of noradrenaline
and serotonin as well as muscarin cholinergic, H1-histaminergic and �1-
adrenergic receptors, the new generation ADs work more selectively.
Consequently, new generation ADs are subdivided on base of their selectivity
for enhancing the synapse concentration of one or more neurotransmitters.
The classic monoamine hypothesis discussed above does not explain why the
AD drug therapy is associated with a delay of a few weeks before a clinical
effect, even though the onset of increased synaptic monoamine
concentrations happens directly [5, 6, 8]. Therefore, the current view is that
chronic adaptations in the brain function rather than acute increases in
synaptic monoamine concentrations lead to the therapeutic effects of ADs.
Thus, while monoamine synapses are still considered the immediate target of
AD drugs, more attention is paid to long-term changes in signal transduction
systems and gene expression, due to chronic use of ADs. Recent theories
postulate a number of mechanisms that could cause these long-term
changes, including activation of transcription factors such as the cAMP/Ca2+-
responsive element binding protein (CREB), but also activation of
neurotrophic pathways and increased hippocampal neurogenesis.
I.3.1. Activation of transcription factors
When a monoamine neurotransmitter binds on its respective receptors, a
signal will be transmitted to the cell interior, mostly through a G-protein.
Once a G-protein is activated, it can regulate the behaviour of potassium or
calcium ion-channels or second messenger systems, which on their turn
regulate kinases. These kinases phosphorylate transcription factors,
controlling gene expression by binding to several short sequences of

Chapter I: Introduction: depression, use of antidepressants, and relevance of antidepressant monitoring
deoxyribonucleic acid (DNA). This reaction results in activation or repression
of the expression of certain genes [9].
Figure I.1. Regulation of cAMP responsive element-binding protein (CREB)
phosphorylation by ADs
Most clinically effective ADs alter noradrenaline or 5-HT neurotransmitter levels by a variety of mechanisms. Cell-surface receptors can respond to these neurotransmitters by altering intracellular second messengers, such as cAMP and Ca2+, in addition to several kinases, such as cAMP-dependent protein kinase (PKA), Ca2+–CaM-dependent kinases (CaMK), mitogen-activated protein kinase (MEK), extracellular signal-regulated protein kinase (ERK) and several forms of ribosomal S6 kinase (RSK1–3). Kinases phosphorylate protein substrates such as the transcription factor CREB. CREB binds to a cAMP responsive element (CRE) in DNA to regulate gene expression. These CREB-target genes might ultimately modulate behavior, endocrine or cellular changes associated with chronic AD treatment. Adapted from [10].
increase BDNF
6
SerotoninDopamineNoradrenaline trkB

Chapter I: Introduction: depression, use of antidepressants, and relevance of antidepressant monitoring
7
There are 3 mechanisms (Figure I.1.) that will result in the phosphorylation
of the transcription factor CREB, which will then bind to a cAMP- and calcium-
responsive element (CRE) in DNA and will result in regulation of gene
expression important for AD effects. CREB regulates genes for
neurotransmitter synthetic enzymes such as tyrosine hydroxylase, which is
the rate-limiting enzyme in the biosynthesis of catecholamines. In addition,
CREB regulates proteins involved in cell neurogenesis [10].
The first mechanism activates adenylyl cyclase through G-protein stimulation,
which leads to an increased production of cAMP, enabling the activation of
cAMP-dependent protein kinase A (PKA). This protein kinase A will then
translocate to the nucleus and will phosphorylate a specific serine residue in
the CREB protein.
The second mechanism is the activation of phospholipase C through �1-
adrenoceptors, leading to mobilization of Ca2+ and subsequent activation of
Ca2+-calmodulin-dependent kinases, which in their turn also phosphorylate
CREB.
Another mechanism is started by neurotropic factors and cytokines that
regulate certain receptors, influencing mitogen-activated protein kinase and
intracellular signal-regulated protein kinase, which phosphorylate CREB
through several forms of ribosomal S6 kinases (RSK1-3) [11-13].
I.3.2. Activation of neurotrophic pathways
There have been reports indicating that chronic administration of ADs can
prevent atrophy of neurons in the hippocampus caused by repeated stress by
increasing the neurotrophic factor BDNF [10, 11, 14]. As BDNF binds to the
tyrosine kinase B receptor (trkB) in the brain, an intracellular signalling
cascade starts, which results in phosphorylation of CREB. In addition, a link
between CREB and BDNF is suggested as enhanced CREB expression might
lead to an upregulation of BDNF, because CREB would target the gene
encoding for BDNF. On the other hand, BDNF would also induce neurogenesis
[5, 9, 10].

Chapter I: Introduction: depression, use of antidepressants, and relevance of antidepressant monitoring
8
I.3.3. Increasing neurogenesis
Chronic AD treatment has shown to reverse the reduced hippocampal cell
volume. This increased neurogenesis is observed in depressed humans using
the Magnetic Resonance Imaging technique and in post-mortem studies. As a
result, a hypothesis was postulated that the increasing neurogenesis could
lead to the therapeutic effects of the ADs. The neurogenesis caused by ADs is
possibly mediated through CREB, BDNF enhancement and the insulin-like
growth factor, another neurotrophic factor.
Although the regulation of CREB and BDNF may be important in the actions
of AD treatment, a lot of research still has to be done in this field, as these
reactions are probably not the only targets of ADs. Therefore, the action
mechanisms of ADs still partly remain unclear [10].
I.4. Classification of antidepressants
Before 1980, depression was treated using tricyclic antidepressants (TCAs)
and monoamine oxidase inhibitors (MAOI). However, their side-effects,
toxicity, and severe drug-drug interactions combined with an advanced
understanding of the central nervous system have led to the introduction of
several ‘new’ ADs [15, 16].
Classes of these ADs are defined by their selectivity towards certain
neurotransmitter transporters and receptors. The reuptake of serotonin and
noradrenaline is selectively blocked by the Selective Serotonin Reuptake
Inhibitors (SSRI) such as fluoxetine, fluvoxamine, sertraline, paroxetine, and
citalopram, and the Selective Noradrenaline Reuptake Inhibitors (NARI)
including reboxetine and viloxazine, respectively. The class of the Serotonin
and Noradrenaline Reuptake Inhibitors (SNRI), however, combines the action
mechanisms of the two previous classes by inhibiting the reuptake of both
serotonin and noradrenaline, leading to dual-acting agents such as
venlafaxine, milnacipran and duloxetine.

Chapter I: Introduction: depression, use of antidepressants, and relevance of antidepressant monitoring
Table I.1. Classification of ADs based on their action mechanism, their
influence on cytochrome P450 isoenzymes and on the neurotransmitter
transporters and receptors
TCAs (tricyclic AD), MAOI (mono amine oxidase inhibitors), SNRI (serotonin and noradrenaline reuptake inhibitors), SSRI (selective serotonin reuptake inhibitors), NARI (selective noradrenaline reuptake inhibitors), SARI (serotonin-antagonist and reuptake inhibitors), NaSSA (noradrenergic and specific serotonergic antidepressants), SSRE (selective serotonin reuptake enhancer), DRI (dopamine reuptake inhibitor). NA (noradrenaline), 5-HT (serotonin), DA (dopamine), H1 (histamine H1 receptor), MA (muscarinic acetylcholine receptor), �lpha1 (�1-adrenergic receptor), �lpha2 (�2-adrenergic receptor). The ++++ means strong interaction with the transporters and receptors, + very low potency, to no potency at all. Antidepressants CYP isoenzymes Neurotransmitter Transporters and Receptors
CYP inhibition CYP metabolism Transporters ReceptorsNA 5-HT DA H1 MA Alpha 1 Alpha 2 5HT
TCA1. Amitriptyline 2D6, 2C19, 2C9, 1A2, 3A4 +++ ++++ + +++++ +++ +++ ++2. Amoxapine +++ +++ + +++ + +++ ++3. Clomipramine 2C19, 3A4, 2D6 +++ ++++ + +++ +++ +++4. Dosulepin ++++ ++++5. Doxepin 2D6, 2C19, 2C9, 1A2 +++ +++ +++++ ++ +++6. Imipramine 2D6, 2C19, 1A2, 3A4 +++ ++++ + ++++ ++ ++7. Maprotiline 2D6, 1A2 ++++ +8. Melitracen ++++ ++++9. Nortriptyline 2D6, 3A4 ++++10. Opipramol11. Trimipramine ++ ++ ++ ++
MAOI1. Moclobemide 2C9, 2D6,1A2 2C192. Phenelzine3. Trancylcypromine
SNRI1. Duloxetine 1A2, 2D6 +++ ++++ + + +2. Milnacipran no inhibition ++++ ++++3. Venlafaxine Minimal: 2D6 2D6, 3A4 ++ ++++ +
SSRI1. Citalopram Minimal: 2D6, 2C19,1A2 2C19, 2D6,3A4 ++++ + +2. Fluoxetine 2D6, 2C9/19, 3A4 2D6, 2C + ++++ + + + +3. Fluvoxamine 1A2, 2C19, 3A4,2C9 1A2,2D6 + ++++ +4. Paroxetine 2D6 2D6 + ++++ + ++5. Sertraline Minimal: 2D6, 2C, 3A4,1A2 2D6, 2C9, 2C19, 3A4 + ++++ ++ + +
NARI1. Reboxetine Minimal: 2D6, 3A4 3A4 ++++ + + +2. Viloxazine 3A4, 2C9, 2C19,1A2 ++++ +
SARI1. Nefazodone 3A4 2D6, 3A4 ++++ +++ ++++2. Trazodone 2D6, 1A2, 3A4 ++++ + +++ ++++
NaSSA1. Mianserin 1A2, 2D6, 3A4 ++++ ++++2. Mirtazapine 1A2, 2D6, 3A4 + + ++++ ++++
SSRE1. Tianeptine 3A ++++
DRI1. Bupropion 2D6 2B6 ++ +++
Mirtazapine and mianserin are receptor antagonists which block the
noradrenaline �2-auto- and hetero-receptors, as well as the 5-HT2/3
receptors. However, mianserin, as in contrast to mirtazapine, has no indirect
5-HT1a stimulating effect through �2-antagonism. Therefore mirtzapine is a
Noradrenergic and Specific Serotonergic antidepressant (NaSSA), but this is
9

Chapter I: Introduction: depression, use of antidepressants, and relevance of antidepressant monitoring
10
not clear for mianserin. Trazodone and nefazodone are Serotonin-2
Antagonists and Reuptake Inhibitors (SARI), combining antagonism of 5-HT2
with serotonin reuptake blockade [3, 11, 15-18]. Bupropion is a dopamine
reuptake inhibitor (Table I.1.).
I.5. Side-effects, drug-drug interactions and toxicity
The differences in side-effects and drug-drug interaction profile of the ADs
are the result of their specific pharmacokinetic properties, interaction with
the cytochrome P450 isoenzymes (CYP 450), and their affinity for different
neurotransmitter sites.
The most relevant pharmacokinetic properties include the non-linear kinetics,
half-life of the compound and its active metabolite (if relevant), as well as
protein binding. Compounds that have non-linear kinetics (e.g. fluvoxamine)
lead to disproportionate increases in drug plasma concentrations when using
higher doses, resulting in a possible increase of side-effects. Due to the long
half-life of compounds such as fluoxetine and especially of its active
metabolite desmethylfluoxetine, attention should be paid to longer wash-out
periods before starting other medication as drug-drug interactions could
occur. Protein binding interactions do not seem to be of great importance for
ADs, probably because basic drugs bind to �1-acid glycoproteins rather than
albumin and as a result do not displace drugs such as warfarin and digoxin
that are tightly bound to albumin [19-21].
A lot of drug-drug interactions occur through the inhibition of CYP 450. The
isoenzymes that are inhibited by ADs and the ones that metabolize the
antidepressant drugs are shown in Table I.1. When evaluating the clinical
significance of a potential interaction, several factors must be considered.
These factors include the potency and the concentration of drug and inhibitor
or inducer at the enzyme active site, the saturation of the CYP enzyme
involved, the extent of metabolism by the drug through this enzyme, the
presence of active metabolites and the therapeutic window of the substrate,
genetic polymorphism, the patient (elderly, liver impairment) and the
probability of concurrent use [22]. As a result of the inhibition, caution is

Chapter I: Introduction: depression, use of antidepressants, and relevance of antidepressant monitoring
11
advised using (co-)medication with narrow therapeutic windows such as
tricyclic antidepressants, theophylline, phenytoin, tolbutamide, carba-
mazepine, terfenadine, astemizole, type 1C antiarrhythmics or antipsychotics
[23].
The differences in side-effects of ADs depend on their potency of interaction
with different transporters and receptors (Table I.1.) such as the
noradrenaline, serotonin and dopamine transporter and the histamine,
muscarinic and adrenergic receptors [6]. Side-effects caused by affinity for
the serotonin transporter are gastrointestinal disturbances and nausea (5-
HT3), sexual dysfunction (5-HT2), and extra pyramidal adverse effects [6,
24]. In addition, coadministration of MAOI with ADs that block the serotonin
transporter can cause the deadly serotonin syndrome [25]. Blockade of the
noradrenaline transporter can result in hypertension, tremors and
tachycardia, while blockade of the dopamine transporter leads to
psychomotor activation and aggravation of psychosis. Other common side-
effects are sedation and weight gain caused by histamine H1 receptor
blockade, and postural hypotension, dizziness, reflex tachycardia caused by
blockade of �1-adrenergic receptors. As a result of muscarinic receptor
binding, dry mouth, constipation, urinary retention, blurred vision, increased
intra-ocular pressure, increased heart rate, disturbances in accommodation
and hyperthermia occur [6, 21]. Cardiovascular symptoms are the most
important side-effects seen for the TCAs and they are mediated by different
mechanisms. Inhibition of �1-noradrenergic receptors causes orthostatic
hypotension, dizziness and possibly reflex tachycardia, while the quinidine-
like effect (blockage of myocardial sodium channels) of the tricyclics is
responsible for disturbances in conduction, which is reflected in changes in
the electrocardiogram [26]. Hypertension and tachycardia may originate from
the hyperadrenergic state which is induced by neurotransmitter reuptake
inhibition. This may be followed by a period of catecholamine depletion,
causing hypotension [26]. In therapeutic doses, most common cardiovascular
effects include orthostatic hypotension and tachycardia, which may be more
severe in elderly patients [27]. In overdose, cardiovascular effects may be
life threatening [26, 28-30]. In patients with cardiovascular disease, the use
of tricyclic antidepressants increases the risk of cardiac morbidity and sudden

Chapter I: Introduction: depression, use of antidepressants, and relevance of antidepressant monitoring
12
cardiac death, particularly in the elderly patients [31-33]. Taking this into
consideration, together with the growing evidence that personality [34] and
depression may adversely affect cardiovascular health [32, 33, 35-37],
several authors conclude that SSRIs may be a better alternative in depressed
patients with concomitant cardiovascular disease [33, 35, 36, 38]. However,
bleeding and cardiovascular effects seem to occur with SSRIs because of the
serotonin effect on vascular smooth muscle. Therefore, there are also good
reasons to believe that �-blockers such as propranolol and pindolol could
interact with SSRI [39].
Thus, while the new generation ADs are almost equipotent as TCAs, they
have less life-threatening side-effects, such as cardiotoxicity and are safer in
overdose. The most reported side-effects are neurological, psychiatric, and
gastrointestinal side-effects [40]. Recently though, it has been suggested
that there might be an association between suicidal thoughts and the use of
SSRIs [41, 42]. However, more research is needed to support this
hypothesis. In addition, the FDA is also concerned about the use of SSRIs in
children. Whittington et al. [43] concluded that risks could outweigh the
benefits of SSRIs (except for fluoxetine) used to treat depression in children
and young people. SSRIs, though, seem rather safe when used during
pregnancy and breastfeeding, although more research and clinical experience
will be needed to confirm this finding [44, 45]. On the other hand, Sanz et al.
published a database analysis in which they concluded that withdrawal
syndromes or neonatal convulsions are seen for all SSRIs, but especially after
paroxetine use [46]. This could be due to the affinity of paroxetine towards
the muscarinic receptors in combination with non-linear kinetics and self-
limiting metabolism [46, 47]. In general, the SSRIs are the group of new
generation ADs of which the side-effects are clearer, as this group is largely
used and studied. For other groups of new generation ADs, more studies and
time will probably be necessary to get a full image of the side-effects that
may occur and the severity of those effects.
Chapter I: Introduction: depression, use of antidepressants, and relevance of antidepressant monitoring
13
I.6. Relevance of Therapeutic Drug Monitoring
The basic principle underlying Therapeutic Drug Monitoring (TDM) is that the
plasma drug-concentration is related to the drug-concentration at the effector
site, producing a certain clinical response. Thus, TDM provides an indirect
estimation of the concentration of ADs in the brain tissue in relation with a
certain effect. TDM is used to avoid drug toxicity, to assess patient
compliance, to enhance drug response, and to increase cost-efficiency. TDM
can be a valid tool to optimize AD pharmacotherapy, but is underutilized in
the field of psychiatry. Among clinicians there is still an under-appreciation of
the degree of pharmacokinetic variability found in patients and how that
might have an impact on the patient’s response to pharmacotherapy [48].
While TDM is used for TCAs as they have narrow therapeutic windows and
can have severe side-effects, use of TDM will not become a standard
procedure for new generation ADs as they have an unclear relationship
between blood concentrations and therapeutic effects. Furthermore,
therapeutic ranges of the new ADs seem quite broad, leading to the generally
accepted notion of low toxicity. These compounds, however, also provide
considerable adverse drug reactions and side-effects. Nowadays, psychiatric
medication is prescribed in all imaginable combinations, increasing the
possibility of drug-drug interactions [49]. Therefore, TDM could be of interest
for monitoring patients with poor or ultrarapid metabolism by CYP 450
isoenzymes, and patients that are co-medicated with inhibitors or inducers of
those isoenzymes. In addition, the side-effects of the new generation ADs
and their delayed therapeutic effect lead to poor patient compliance. As over
40% of patients receiving psychotropic medications are non-compliant,
monitoring of ADs use is crucial to provide an objective compliance check.
For special patient populations such as children, adolescents, elderly and
patients with liver and kidney impairment, TDM could provide valuable
information for a cost-effective and more rational use of psychiatric drugs.
Thus, although it is unlikely that TDM will become a standard procedure for
all AD agents and all patients, it can surely optimize AD treatment for special
patient populations, patients with poor or ultrarapid metabolism due to CYP
450 isoenzymes or it can provide an alternative to a lengthy trial and error

Chapter I: Introduction: depression, use of antidepressants, and relevance of antidepressant monitoring
dose titration process for patients with concomitant drug use. In addition, it
can be used to monitor compliance [48-53]. In the future, advances in TDM
will be made by increasing the knowledge of the brain and the influence of
ADs on the brain, the genetic differences and the influences of those
differences on plasma concentrations.
I.7. Selection of antidepressants and relevant issues for TDM
The ADs monitored in this work were selected based on their importance in
the 7 major antidepressant markets (Japan, USA, France, United Kingdom,
Italy, Spain, Germany) according to the Cognos Plus Study #11 [54] and on
the AGNP-TDM Expert Group Consensus Guidelines [55].
Table I.2. Therapeutic and toxic range of several ADs and their active
metabolites in plasma together with characteristics relevant for therapeutic
drug monitoring
1Information between brackets concerns the metabolite. ActMet: Active metabolite in plasma; Vd: distribution volume; Fb: Fraction bound; pKa: Dissociation constant; Log P: Partition coefficient (octanol/water); T1/2: half-life; Ther.C.: Therapeutic concentration range; Tox.C.: Toxic concentration; (L): Lethal concentration [56]. Compound Mw Vd (l/kg) Fb (%) pKa LogP T1/2 (h) Ther.C (µg/l) Tox.C. (µg/l)Citalopram 324 12-16 50 9.5 3.74 25-40 20-200 (L)500
Fluoxetine 309 20-42 94.5 8.7 (9.37)1 4.05 96-144 (96-384)1 150-500 (100-500)1 1000 (900)1
Fluvoxamine 318 25 77 8.7 0.04 8-28 50-250 650Maprotiline 277 23-70 90 10.5 4.5 20-70 75-250 300-800Melitracen 291 7.05 10-100Mianserin 264 10-29 90 7.1 3.36 6-40 15-70 500-5000Mirtazapine 265 10-14 85 9.9 20-40 20-100 (50-300sum) 1000-2000Paroxetine 329 3-28 95 3.95 12-40 10-75 350-400Reboxetine 313 0.39-2.8 97 13-15 50-160Sertraline 306 20 98 9.45 5.29 26 50-250 290/1600Trazodone 372 0.9-1.5 90 6.7 3.2 4-7 500-2500 4000Venlafaxine 277 4-12 30 9.24 (9.74)1 0.43 4 200-400 1000-1500Viloxazine 237 0.5-1.5 85-90 8.1 1.8 2-5 5000-10000peak
ActMetDesmethylcitalopramDidesmethylcitalopramDesmethylfluoxetine
m-ChlorophenylpiperazineO-desmethylvenlafaxine
Desmethylmaprotliline
DesmethylmianserinDesmethylmirtazapine
Desmethylsertraline
The Cognos Plus Study demonstrates that monoamine oxidase inhibitors and
TCAs (8% European market share 2004) are less frequently prescribed than
SSRIs and SNRIs. In addition, compounds such as nefazodone, duloxetine
and milnacipran were not determined as they were not commercially
available in Belgium, while the TCAs melitracen and maprotiline were
monitored as they are readily prescribed in Belgium. In addition, the (active)
metabolites were monitored as suggested by the AGNP-TDM Expert Group
14

Chapter I: Introduction: depression, use of antidepressants, and relevance of antidepressant monitoring
Consensus Guidelines, as metabolite/compound ratios could provide more
information on the relation between plasma concentration and therapeutic
effects. A summary of relevant information concerning AD drug monitoring is
given in Table I.2. The stability of the ADs will be discussed in chapter III and
VI.
I.7.1. Citalopram
1-[3-(Dimethylamino)propyl]-1-(4-fluorophenyl)-1,3-dihydroisobenzofuran-5-carbo-nitrile: mol. wt., 324.4; pKa, 9.5; usual dose, 20-60 mg/day (escitalopram : 10-20 mg/day); therapeutic plasma concentration, 20 to 200 ng/ml; lethal concentration, 500 ng/ml [56] ; plasma half-life, 33 h [25-40 h]; plasma protein binding, 50%; distribution volume, 12-16 l/kg [57, 58].
ON
CH3
CH3
NC
F
*
Citalopram is a selective inhibitor of neuronal serotonin (5-
hydroxytryptamine) reuptake [40]. This antidepressant is the most selective
serotonin reuptake inhibitor, but is less potent than paroxetine [40, 59].
Citalopram is a racemic mixture (S/R=1) with a blood or plasma ratio of the
S/R form varing between 0.32 and 1.25. The S-enantiomer is
pharmacologically active and accounts for 24 to 49% of the total plasma
citalopram level, while the R-enantiomer appears to be pharmacologically
inactive. Therefore, the S-enantiomer has been isolated and marketed in
2002 as escitalopram [59, 60]. Escitalopram shows greater efficacy than
citalopram using equivalent doses of the S-enantiomer in non-clinical and in
controlled randomised clinical experiments. R-Citalopram appears to exert an
allosteric effect on the 5-HT transporter protein and therefore counteracts the
effect of escitalopram. This could explain the more favourable clinical efficacy
of escitalopram, also in comparison to other comparator antidepressants
[61]. Not only a higher efficacy, but also a higher response and faster onset
of the drug, leading to faster symptom relief, is seen when using
15

Chapter I: Introduction: depression, use of antidepressants, and relevance of antidepressant monitoring
16
escitalopram [60]. TDM could be of interest for patients with liver impairment
and for elderly. Citalopram and also escitalopram have low potency for
clinically important pharmacokinetic drug-drug interactions in comparison
with other SSRI. This is the result of the low capacity of citalopram to inhibit
CYP 450. Thus, citalopram is a good choice for patients who have a multidrug
therapy [62].
I.7.1.1. Mechanism of action
This selective inhibitor of serotonin reuptake has minimal affinity for �1-
adrenoreceptors and has low histamine H1-receptor blocking potency [40].
I.7.1.2. Pharmacokinetics
Citalopram is well absorbed following oral administration with a bioavailability
of approximately 80%. Peak plasma levels of citalopram usually occur within
2-4 hours [59]. After oral administration of doses between 20 and 60
mg/day, plasma levels of racemic citalopram and desmethylcitalopram
ranged between 9 to 200 ng/ml and 10 to 105 ng/ml, respectively [62].
When the enantiomers are measured separately, concentration ranges of 9-
106 ng/ml and 20-186 ng/ml are seen for S- and R-citalopram, while 4-38
ng/ml and 3-75 ng/ml are detected for S- and R- desmethylcitalopram [62].
However, there is considerable inter-individual variation in plasma
concentrations which increases with dose, probably due to genetic factors
[40, 63]. At steady-state, plasma concentrations of desmethylcitalopram and
didesmethylcitalopram are one-half and one-tenth, respectively, of the parent
drug level [64]. The steady-state plasma concentration of escitalopram is 19-
37 ng/ml after treatment with a dose of 10 mg/day [65].
Citalopram is metabolized in the liver by mono- and di-N-demethylation
through CYP2C19, and 2D6, respectively. Citalopram and escitalopram are
also metabolized by CYP3A4 to an important extent [66]. Other
metabolization pathways include oxidative deamination, N-oxide formation
and glucuronidation. The mono-desmethyl metabolite, desmethylcitalopram,
has about 20 to 50% of the pharmacological activity of the parent drug, but
does not contribute to the overall antidepressant activity of citalopram as it
has a poor blood-brain barrier penetration [67]. The metabolism of
escitalopram is similar to that of citalopram. The elimination half-life is 35

Chapter I: Introduction: depression, use of antidepressants, and relevance of antidepressant monitoring
17
hours for citalopram, 50 hours for desmethylcitalopram and 100 hours for
didesmethylcitalopram [59]. The active S-enantiomer is more rapidly
eliminated than the inactive R-enantiomer [62], probably because CYP2C19 is
mainly implicated in the N-demethylation of the S-enantiomer rather than in
that of R-citalopram. Moreover, 12% of a single dose is excreted in 24-hours
urine, as well as an equal amount of desmethylcitalopram and minor
quantities of other metabolites. However, about 65% of a dose is thought to
be excreted via the faeces and small amounts of the drug are also excreted
in breast milk [58]. On the other hand, escitalopram seems to be eliminated
mainly in urine. Citalopram has a low plasma protein binding of about 50%.
Thus, protein binding interactions do not seem to be of great importance
[19].
I.7.1.3. Drug concentrations and clinical effects
The therapeutic concentration for citalopram ranges from 20 to 200 ng/ml
[56]. However, no therapeutic window has been set for citalopram. Hiemke
and Hartter stated that possible relationships between clinical outcome and
serum concentrations might have been masked by the lack of stereospecific
analysis [40]. In the dose range of 10-60 mg/day, citalopram shows linear
pharmacokinetics for single as well as multiple-dose trials [64]. A lower initial
dose should be considered for the elderly. This dose should not exceed 40 mg
per day, because in elderly, for similar doses, average concentrations were
23% higher and the half-life was 31% longer in comparison with the younger
population. Barak et al. [68] report that citalopram-induced bradycardia is
more prevalent among elderly. Moreover, patients with liver impairment or
multiple co-administered medications should also be monitored. On the other
hand, dose adjustment is not required for renal impaired patients. However,
because there are no data on the pharmacokinetics of citalopram in patients
with chronic or severe renal impairment, caution is advisable in this case [59,
69]. Although citalopram is prescribed for children, FDA has not approved its
use in children, as it may increase suicidal thoughts. In addition, Whittington
et al. [43] reported an unfavourable risk-benefit balance for children as there
is no evidence for efficacy, while the risk for suicide increased. Also for
adults, one should monitor the worsening of depression and increased
suicidal thinking [64]. On the other hand, citalopram did not seem to have an

Chapter I: Introduction: depression, use of antidepressants, and relevance of antidepressant monitoring
18
increased effect on the rate of congenital birth defects as compared to those
expected in the general population [45].
I.7.1.4. Drug interactions, side-effects and toxicity
Possible side-effects of citalopram include nausea and vomiting, increased
sweating, headache, dry mouth, tremor, sedation, insomnia, mania, and
sexual problems [59]. According to Bezchlibnyk-Butler et al. [59] and the
FDA [64], the major citalopram-drug interactions involve some TCAs such as
imipramine, but also warfarine, carbamazepine, sumatriptan, metoprolol and
cimetidine. However, these interactions do not seem to have any clinical
consequences. Because citalopram is only a weak inhibitor of CYP1A2, 2D6
and 2C19, the need for a decreased dose of drugs metabolized by those
enzymes seems low [62]. As CYP3A4, 2D6 and 2C19 are involved in the
metabolism of citalopram, potent inhibitors of these isoenzymes may
decrease the clearance of citalopram. However, several reports [64] indicated
that because citalopram is metabolized by multiple enzymes, inhibition of a
single enzyme may not decrease citalopram clearance in an important way
[64]. Patients should be cautioned for the risk of bleeding associated with the
concomitant use of citalopram with NSAIDs, aspirin, or other drugs that
affect coagulation [64]. Citalopram, though, should not be coadministered
with a irreversible monoamine oxidase inhibitor as this can lead to the risk of
serotonin syndrome [70]. In addition, after a MAOI treatment, a delay of 2
weeks before taking citalopram or vice versa should be considered.
Citalopram is considered not to be of importance in fatal poisoning cases as
Jonasson and Saldeen state that fatal blood concentrations range between
2000 and 6200 ng/g and between 600-5200 ng/g in combination with other
drugs [71]. However, according to the TIAFT-list the lethal concentration of
citalopram is 500 ng/ml [56].
I.7.1.5. Analytical Methods
Citalopram is determined with or without its metabolites using thin-layer
chromatography, capillary electrophoresis [72], liquid chromatographic or
gas chromatographic methods. Escitalopram can be determined in human
plasma using LC-ESI-MS [73]. Moreover, several methods can separate the
enantiomers by using a chiral stationary phase [74, 75]. Examples of these

Chapter I: Introduction: depression, use of antidepressants, and relevance of antidepressant monitoring
chiral stationary phases used in liquid chromatography are Chiralcel OD [76],
Chiral AGP [77] and Chirobiotic V [75]. Enantiomeric separation can also be
achieved by using a chiral mobile phase additive such as beta-cyclodextrin
[78]. Derivatization with a chiral reagent to form diastereoisomeric
derivatives is not possible as citalopram is a tertiary amine that can not be
derivatized [79].
In gas chromatography, NPD [80] and mass detectors [81, 82] are used. In
liquid chromatography, UV (absorption at 230 or 240 nm) [75, 83], DAD [84-
86], fluorescence [87-90], and mass detectors are applied. The LC-MS
methods are utilized in both electrospray [73, 91, 92] and atmospheric
pressure chemical ionization mode [93].
Sample preparation mostly consists of a liquid-liquid extraction [73, 76, 84-
86, 88] after alkalinization, although recently a lot of solid phase extraction
methods [76, 83, 87, 90, 92, 94, 95] are published. In addition, solid phase
micro extraction (SPME) can be applied to extract citalopram from urine [82].
I.7.2. Fluoxetine
N-Methyl-3-[4-(trifluoromethyl)phenoxy]-3-phenylpropan-1-amine: mol. wt., 309.3; pKa, 8.7; usual dose, 20 mg/day for depression (and 60 mg/day for bulimia nervosa); max.dose, 80 mg/day; therapeutic concentration, 150 to 500 ng/ml for fluoxetine (100 to 500 ng/ml for desmethylfluoxetine); plasma half-life, 4-6 days (4-16 for desmethylfluoxetine); plasma protein binding, 94.5%; distribution volume, 27 l/kg (20-42 l/kg); bioavailability 60% [56, 58].
O NCH3
F3C
H
*
Fluoxetine is a selective inhibitor of neuronal serotonin reuptake and is
approved by the FDA in 1987. It has been used to treat several disorders
such as major depression, panic, bulimia nervosa, obsessive-compulsive
behaviour, and premenstrual dysphoric disorder [64]. This racemic drug
consists of S- and R-fluoxetine (50/50), which are both clinically relevant
19

Chapter I: Introduction: depression, use of antidepressants, and relevance of antidepressant monitoring
20
[76]. The S-enantiomer, however, is eliminated more slowly and is the
predominant enantiomer present in plasma at steady state. In addition, S-
desmethylfluoxetine is also clinically relevant. TDM could be of interest for
monitoring patients with liver impairment, with co-medication of drugs that
either are metabolized by CYP2D6 or inhibit that enzyme, and for the elderly
population. When using TDM, one has to be aware that changes in dose will
not be fully reflected in plasma for several weeks, because of the long
elimination half-lives of the parent drug and its major active metabolite.
These long elimination half-lives, combined with the fact that fluoxetine
inhibits its own metabolism are of great concern when using co-medication
[64].
I.7.2.1. Mechanism of action
Fluoxetine is a potent and selective inhibitor of serotonin reuptake in the
synapse, with little effect on other monoamine reuptake mechanisms or other
neurotransmitter receptors. Fluoxetine was shown to have only weak affinity
for various receptor systems, namely opiate, serotonergic 5HT1,
dopaminergic, �-adrenergic, �2-adrenergic, histaminergic, �1-adrenergic,
muscarinic, and serotonergic 5HT2 receptors.
I.7.2.2. Pharmacokinetics
Fluoxetine is well absorbed following oral administration and peak plasma
fluoxetine concentrations usually occur within 4-8 hours (range 1.5-12
hours). After oral administration of a single 40-mg dose by healthy adults,
peak plasma concentrations of approximately 15-55 ng/ml are obtained.
However, there appears to be considerable inter-individual variation in
plasma concentrations attained with a given dose. In addition,
coadministration of fluoxetine and food, leads to a slower absorption rate but
does not affect the overall extent of absorption of fluoxetine [76]. Following
daily oral administration of the drug, steady-state plasma fluoxetine and
desmethylfluoxetine concentrations generally are achieved within about 2-4
weeks. Although, the onset of antidepressant activity of fluoxetine usually
occurs within the first 1-3 weeks of therapy, optimum therapeutic effect
usually requires 4 weeks or more of drug administration. Fluoxetine is
extensively demethylated in the liver by CYP2C9, 2C19 and 2D6 to the

Chapter I: Introduction: depression, use of antidepressants, and relevance of antidepressant monitoring
21
primary active metabolite desmethylfluoxetine. The elimination half-life of the
parent drug is 4 to 6 days, but it is increased to 4-16 days for
desmethylfluoxetine. The plasma half-life of fluoxetine exhibits considerable
inter-individual variation, which may be related to genetic differences in the
rate of N-demethylation of the drug in the liver. On the other hand,
fluoxetine inhibits isoenzyme CYP2D6 and thus its own metabolism. Further
metabolism can occur by O-dealkylation, producing p-trifluoromethylphenol
and hippuric acid. The drug and its metabolites are mainly excreted in urine,
but also in the faeces and in breast milk. Due to extensive tissue distribution,
fluoxetine has a high distribution volume of 20-42 l/kg. Fluoxetine is highly
bound to plasma proteins (up to 94.5%), including albumin and �1-acid
glycoprotein. The extent of fluoxetine protein binding does not appear to be
altered substantially in patients with hepatic cirrhosis or renal impairment,
including those undergoing hemodialysis [76, 96].
I.7.2.3. Drug concentrations and clinical effects
The therapeutic concentration for fluoxetine ranges from 150 to 500 ng/ml
and from 100 to 500 ng/ml for desmethylfluoxetine [56]. However, no
consistent relationship has been described between plasma fluoxetine
concentrations and clinical response. In addition, a considerable inter-
individual variation in plasma concentrations attained with a given dose is
observed. Because of the long half-life of fluoxetine and desmethylfluoxetine,
a significant accumulation of these active compounds in chronic use, even
when a fixed dose is used, is observed. Plasma concentrations of fluoxetine
were higher than those predicted by single-dose studies, as fluoxetine’s
metabolism is not proportional to dose. Desmethylfluoxetine, however,
appears to have linear pharmacokinetics [64]. A lower or less frequent dose
should be considered in patients with liver impairment, for elderly patients
and patients using multiple co-administered medications, while this is not
routinely necessary for renal impaired patients. Diabetic patients should be
monitored as fluoxetine can improve glucose tolerance and/or hypoglycaemia
[96]. Fluoxetine use should be avoided by pregnant women in the third
trimester due to increased hemorrhagic tendency and nervousness in infants
[97].

Chapter I: Introduction: depression, use of antidepressants, and relevance of antidepressant monitoring
22
I.7.2.4. Drug interactions, side-effects and toxicity
Possible side-effects of fluoxetine include allergic reactions, mania, weight
loss, sexual problems, nausea, anxiety, and insomnia. Recently, several
publications report the possibility of an increased risk for suicidal behaviour in
patients treated with antidepressant medication. Serum levels of 1960 ng/ml
fluoxetine (420 ng/ml desmethylfluoxetine) have been associated with
seizures, while blood concentrations of 1300 to 6800 ng/ml fluoxetine and
900 to 5000 mg/l for desmethylfluoxetine have been associated with
fatalities.
According to Messiha [98], the major fluoxetine-drug interactions involve the
amino acids L-dopa and L-tryptophan, anorexants, anticonvulsants,
antidepressants, anxiolytics, calcium channel blockers, cyproheptadine,
lithium salts, and drugs of abuse. Fluoxetine should not be coadministered
with a monoamine oxidase inhibitor as this can lead to hyperthermia,
convulsions and coma. In addition, after fluoxetine treatment, a delay of 5
weeks before taking a MAOI should be considered, as fluoxetine and its
metabolite have very long elimination half-lives. This washing out-period is
also necessary for thioridazine, an antipsychotic used by schizophrenic
patients. Thioridazine administration produces a dose-related prolongation of
the QTc interval, which is associated with serious ventricular arrhythmias
such as torsades de pointes-type arrhythmias and sudden death. This risk is
expected to increase with fluoxetine-induced inhibition of thioridazine
metabolism. The need for decreased dose of drugs metabolized by
CYP2C9/19, 3A4 and 2D6 should be considered, as fluoxetine inhibits these
enzymes. Consequently, co-medication with some antiarrhythmics,
antipsychotics, �-blockers, and TCAs should be monitored [64, 96, 99, 100].
I.7.2.5. Analytical Methods
Fluoxetine is determined with or without its active metabolite using gas
chromatographic, liquid chromatographic and micellar electrokinetic capillary
chromatographic [101] methods. Some of these methods can separate the
enantiomers of the compounds after derivatization with a chiral reagent
[102] or by using a chiral stationary phase. Examples of these chiral
stationary phases are hydrodex-beta-6-TBDM fused silica capillary columns
used for GC purposes [103] or Chiralcel ODR, amylase-, beta-cyclodextrin-,

Chapter I: Introduction: depression, use of antidepressants, and relevance of antidepressant monitoring
ovomucoid- and cellulose-based chiral columns [104-108] for liquid
chromatography.
In gas chromatography, NPD [103, 109-111], ECD [76] and mass detectors
in electron ionization mode [102, 112, 113] are used. In liquid
chromatography, UV (absorption 230 nm) [87, 105, 107, 114-119], DAD
[85], fluorescence [108, 120-122] and mass detectors are applied. The LC-
MS methods are utilized in both electrospray ionization [76, 92, 123-126]
and atmospheric pressure chemical ionization mode [127].
Sample preparation mostly consists of a liquid-liquid extraction after
alkalinization [103, 107, 109, 116, 118, 122, 124, 127], although recently a
lot of solid phase extraction methods are published. A large variety of
sorbents such as apolar (C8), ion-exchange (SCX) and polymeric sorbents
(Oasis HLB) [87, 92, 104, 111, 119, 121, 126] are used for extraction of
fluoxetine and its metabolite from biological samples.
Most methods allow quantitative determination in the lower ng/ml range
(LOQ between 1-20 ng/ml), and are thus suitable for therapeutic drug
monitoring purposes [76].
I.7.3. Fluvoxamine
5-Methoxy-1[4-(trifluoromethyl)phenyl]-1-pentanone-O-(2-aminoethyl)oxime: mol. wt., 318.3; pKa, 8.7; usual dose: 100-300 mg/day of fluvoxamine maleate (max. 200 mg for children till 11 years old) [128]; therapeutic plasma concentration is 50-250 ng/ml, while 650 ng/ml results in toxic effects [56]; plasma half-life, 8 – 28 h (mean: 15 h); plasma protein binding, 77%; distribution volume, 25 l/kg [57, 58].
F3C
NO
OCH3
NH2
Fluvoxamine is a selective inhibitor of neuronal serotonin reuptake. The drug
was introduced in 1983 and has been used to treat obsessive-compulsive
disorder (only marked for this disorder in US) as well as depression, panic
disorder, social phobia, post-traumatic stress disorder, eating disorders, and
autism [40, 64, 129]. This compound does not have a chiral center, but the
occurrence of a C=N double bound implies the existence of two isomers, E
23

Chapter I: Introduction: depression, use of antidepressants, and relevance of antidepressant monitoring
24
(entgegen, trans) and Z (zusammen, cis) [130]. TDM could be of interest for
monitoring patient compliance, patients with liver impairment and patients
with co-medication of drugs that are metabolized by CYP1A2, 2C19 or 3A4
[131].
I.7.3.1. Mechanism of action
Fluvoxamine is a potent and selective inhibitor of serotonin reuptake in the
synapse with little effect on other monoamine reuptake mechanisms or other
neurotransmitter receptors, with the exception of �1-receptors [129]. These
�1-receptors have a neuromodulatory role in the brain, which may result in a
relevant response to anxiety, stress, depression, learning and cognitive
processes, neuroprotection and antipsychotic activity [132].
I.7.3.2. Pharmacokinetics
Fluvoxamine is almost completely absorbed after oral administration, but
undergoes an extensive first pass metabolism, resulting in a bioavailability of
about 53%. The time to reach maximum plasma concentration is about 5
hours after a single dose of 100 to 300 mg. A dose proportionality study
showed that patients treated with 100, 200 and 300 mg/day of fluvoxamine
maleate during 10 days had fluvoxamine serum concentrations of 88, 283
and 546 ng/ml, respectively [64]. However, there appears to be considerable
inter-individual variation in plasma concentrations attained with a given dose.
As a result, a therapeutic window has not yet been established. Steady-state
concentrations could be attained within 1 week, due to the relatively short
half-life of 8-28 h. Because fluvoxamine exhibits non-linear kinetics,
increased dosages led to increased half-lives. Consequently, steady-state
conditions may not always be reached before 10 days of continuous
treatment [40]. Fluvoxamine is extensively metabolized in the liver, and less
than 4% is excreted unmetabolized in urine. The main metabolic degradation
in the liver consists of N-acetylation, oxidative deamination and
demethylation, resulting in 11 inactive metabolites, of which 9 could be
structurally identified [40, 130] with the main metabolite identified as the 5-
demethoxylated carboxylic acid [130]. Fluvoxamine is metabolized by the
CYP isoenzymes CYP2D6 and 1A2, while the drug itself is a moderate
inhibitor of CYP3A4, 2C9 and a potent inhibitor of 1A2, resulting in important

Chapter I: Introduction: depression, use of antidepressants, and relevance of antidepressant monitoring
25
pharmacological interactions with other drugs [58, 100, 129]. On the other
hand, fluvoxamine metabolism is increased in smokers [74]. Fluvoxamine has
a distribution volume of 25 l/kg and a moderate plasma protein binding,
mostly to albumin, of approximately 77%. Therefore, it makes drug
interactions with restrictively protein-bound drugs unlikely to occur.
I.7.3.3. Drug concentrations and clinical effects
The therapeutic concentration for fluvoxamine in plasma ranges from 50 to
250 ng/ml [56]. However, no consistent relationship has been described
between plasma fluvoxamine concentrations and clinical response [133]. In
addition, a considerable inter-individual and gender specific variation in
plasma concentrations attained for a given dose is observed [67].
Perhaps the inhibition of CYP1A2 by oral contraceptive drugs is the reason of
the gender specific variation in plasma concentrations of fluvoxamine [74].
Moreover, a 23%-reduction in plasma concentration is seen for smokers as
compared to non-smokers because cigarette smoke induces CYP1A2
metabolism [134].
Fluvoxamine does not appear to have linear pharmacokinetics after repeated
administration of therapeutic dosages [40, 129], but rather an U-shaped
relationship between drug concentrations and therapeutic response, probably
due to auto inhibition of fluvoxamine metabolism [135]. A lower or less
frequent dose should be considered in patients with hepatic cirrhosis, as the
area under the concentration-time curve and the half-life are significantly
increased [136]. On the other hand, dose adjustment is not necessary for the
elderly and renal impaired patients [19]. Moreover, breast feeding during
fluvoxamine treatment is considered safe [45, 137], as the penetration into
breast milk is relatively low, with a milk to plasma concentration ratio of 0.29
[138].
I.7.3.4. Drug interactions, side-effects and toxicity
Possible side-effects of fluvoxamine are nausea, somnolence, asthenia,
headache, dry mouth, and insomnia. It is associated with a low risk of
suicidal behaviour, sexual dysfunction and withdrawal syndrome [129].
Although several fluvoxamine overdoses are reported, up to 12 g of the
maleate salt were ingested without sequelae. According to the FDA [64] and

Chapter I: Introduction: depression, use of antidepressants, and relevance of antidepressant monitoring
26
Perucca et al. [139], the major fluvoxamine-drug interactions involve the
TCAs, MAOI, benzodiazepines, cardioactive drugs, carbamazepine,
methadone, theophylline, warfarin, terfenadine, astemizole, cisapride and
pimozide.
Fluvoxamine inhibits CYP isoenzymes such as CYP2D6, 2C19, 3A4, 1A2, and
2C9. Consequently, co-medication with drugs that are metabolized by one or
more of these enzymes such as TCAs, warfarin, theophylline, propranolol,
benzodiazepines, thioridazine, and neuroleptics such as clozapine and
haloperidol should be monitored [22, 23, 64, 79, 131, 134]. On the other
hand, concomitant use of fluvoxamine with the previous described drugs
could lead to improvement of the therapeutic effects of these drugs [40].
Fluvoxamine should not be coadministered with a monoamine oxidase
inhibitor as this leads to hyperthermia, convulsions and coma. In addition, a
delay of 2 weeks before taking a MAOI should be considered after
fluvoxamine treatment and vice versa [129]. This washing-out period is also
necessary for thioridazine, cisapride and pimozide administration as it
produces a dose-related prolongation of the QTc interval, which is associated
with serious ventricular arrhythmias, such as torsades de pointes-type
arrhythmias, and sudden death.
I.7.3.5. Analytical methods
Fluvoxamine is determined using gas chromatographic and liquid
chromatographic methods in a variety of samples such as serum [91],
plasma [85, 93], blood [140], urine [82, 140, 141], brain tissue [142],
breast-milk [143], amniotic and umbilical fluids [144].
Gas chromatography combined with detectors such as FID [145], NPD [94],
ECD [76, 142] and MSD [39, 76, 82, 141] is used. In liquid chromatography,
the following detectors are applied: UV [76, 83, 84, 143, 144, 146-150], DAD
[85, 86], fluorescence [76, 151, 152] and mass detectors in electrospray
[91] as well as in atmospheric pressure chemical ionization mode [93]. When
using UV detection, fluvoxamine gives a maximum absorption at 254 nm.
Fluorescence detection of fluvoxamine was described after derivatization with
dansylchloride [151] or 4-fluoro-7-nitro-2,1,3-benzoxadiazole [152].
Sample preparation mostly consists of a liquid-liquid extraction after
alkalinization [76, 85, 86, 91, 93, 143, 151], although recently a lot of solid

Chapter I: Introduction: depression, use of antidepressants, and relevance of antidepressant monitoring
phase extraction methods [76, 82, 83, 94, 95, 143, 145-148, 150, 153] are
published. Moreover, methods using SPME [82, 153] and supported liquid
membrane sample pre-treatment [154] are also utilized. Most methods allow
quantitative determination in the lower ng/ml range (LOQ between 1.5-25
ng/ml), and are thus suitable for therapeutic drug monitoring purposes [76].
I.7.4. Maprotiline
N-Methyl-9,10 ethanoanthracene-9(10H)-propanamine: mol. wt., 277.4; pKa, 10.5;
usual dose, 30-150 mg/day; toxic plasma concentration from 300-800 ng/ml;
therapeutic concentration, 75-250 ng/ml (100-600) [56]; plasma half-life, 20-70 h
(36-105); plasma protein binding, 90%; distribution volume, 23-70 l/kg (14-22) [57,
58].
NCH3
H
Maprotiline is a tetracyclic antidepressant, which is distinguished from
conventional tricyclic antidepressants only by an ethylene bridge upon its
molecular skeleton, creating a fourth ring [155]. It has been used in
antidepressant therapy and has sedative as well as anti-aggressive
properties. TDM could be of interest for monitoring patient compliance and
when coadministration of CYP2D6 inhibitors and inducers occurs.
I.7.4.1. Mechanism of action
Maprotiline acts by blocking noradrenaline uptake and appears to have no
influence on serotonin metabolism. In addition, the drug is a weak central
acetylcholine antagonist [155].
27

Chapter I: Introduction: depression, use of antidepressants, and relevance of antidepressant monitoring
28
I.7.4.2. Pharmacokinetics
Maprotiline is slowly, but completely absorbed from the gastrointestinal tract.
The drug undergoes an important first pass metabolism. Mean steady state
plasma concentrations are reached in 1 week. After administration of daily
doses of 50, 100 and 150 mg, maprotiline concentrations were respectively
67, 143, and 216 ng/ml [155].
The main metabolic degradation pathway of the drug is demethylation via
CYP2D6 and 1A2 [156], resulting in the active metabolite N-
desmethylmaprotiline. In addition, N-oxidation into maprotiline N-oxide and
hydroxylation followed by conjugation also occur. The drug is excreted in
urine and faeces, mainly as metabolites. In addition, maprotiline can be
found in the cerebrospinal fluid, even as in breast milk.
I.7.4.3. Drug concentrations and clinical effects
For patients treated with maprotiline, the therapeutic range in plasma is 75-
250 ng/ml, although some authors report therapeutic ranges between 100-
600 ng/ml. The sum of the therapeutic serum concentrations for maprotiline
and desmethylmaprotiline is 100-400 ng/ml [56]. However, there seems to
be a wide inter-individual variation in blood levels, perhaps due to the
difference in individual body weights and CYP2D6 metabolism [155].
Maprotiline is well tolerated by elderly patients and there appears to be no
increase in the incidence and severity of side-effects as compared to younger
patients [155]. In patients with hepatic or renal damage, the drug should be
used with caution. Since the drug is excreted in breast milk, with a level over
200 ng/ml in both breast milk and maternal blood after 5 days of treatment
(50 mg, 3 times daily), the child should also be monitored during maprotiline
therapy [155].
I.7.4.4. Drug interactions, side-effects and toxicity
Adverse effects of maprotiline (drowsiness, dry mouth) are largely the same
as for the tricyclic antidepressants, but there seems to be a higher incidence
of skin rashes [155]. However, most of the side-effects of maprotiline are
mild and usually disappear with continued treatment or after reduction in
dosage. Uncommon side-effects such as hallucinatory episodes, hypomania
or mania, development of grand mal seizures, increase in serum

Chapter I: Introduction: depression, use of antidepressants, and relevance of antidepressant monitoring
29
transaminases and alkaline phosphatase, decreased bilirubin, as well as
severe neutropenia can occur during maprotiline therapy [155].
Since maprotiline is metabolized by enzymes of the CYP 450 family, the most
important being CYP2D6, any other substance influencing this enzyme can
have an effect on the plasma concentrations of maprotiline [157]. Moreover,
coadministration with MAOI should be avoided, because of the risk of
hyperpyretic crisis, convulsions and death. A wash out period of two weeks
should be respected when a MAOI is replaced with maprotiline. A serum
concentration of 1000-5000 ng/ml can be lethal [56]. The characteristic
symptoms of maprotiline overdosage are neuromuscular in nature (tremor,
ataxia, muscular twitching), while respiratory depression, drowsiness,
convulsions, vertigo, hallucinations, confusion, mydriasis and disturbances of
consciousness are also common [155].
I.7.4.5. Analytical Methods
Several methods for the analysis of maprotiline in biological samples have
been published. Gas chromatography is used frequently in combination with a
nitrogen-phosphorus detector [111, 158-160], but an MSD can also be used
[95]. In addition, high pressure liquid chromatography is a frequently used
method for the analysis of maprotiline, using UV [83, 161, 162] , DAD [163],
as well as fluorescence detectors [164]. Moreover, Oztunc et al. described a
TLC screening method using 7,7,8,8-tetracyanoquinodimethane as
derivatization reagent to detect several antidepressants, including maprotiline
[162], while Cakrt et al. published an isotachophoretic determination in
combination with fluorimetric detection [165].
Common to these methods is the need for alkaline extraction from the
biological medium prior to analysis [160, 162-164]. However, several solid
phase extraction methods are also published [83, 95, 111, 161], while Ulrich
and Zollinger described a SPME extraction of maprotiline from plasma
samples [159].

Chapter I: Introduction: depression, use of antidepressants, and relevance of antidepressant monitoring
I.7.5. Melitracen
mol. wt., 291; therapeutic plasma concentration from 10-100 ng/ml
NCH3
CH3
CH3 CH3
Melitracen is a not well documented tricyclic antidepressant that inhibits the
reuptake of noradrenaline and serotonin. The side-effects are less intense in
comparison with the other tricyclic antidepressants and is therefore still
frequently prescribed.
I.7.6. Mianserin
1,2,3,4,10,14b-Hexahydro-2-methyldibenzo(c,f)-pyrazino(1,2-a)azepine: mol. wt., 264.4; pKa, 7.1; usual dose, 30-90 mg/day; max.dose, 200 mg/day; therapeutic concentration, 15 to 70 ng/ml; plasma half-life, 6-40 h; plasma protein binding, 90%; distribution volume, 13 (10-29) l/kg [57, 58].
N
NH3C
*
Mianserin is a noradrenergic and specific serotonergic antidepressant
(NaSSA). Although the drug is not marketed in the USA, it is used to treat
depression in most European countries. This compound is a racemic
tetracyclic antidepressant, with the S-enantiomer being considered more
potent [166]. TDM could be of interest for monitoring patient compliance.
30

Chapter I: Introduction: depression, use of antidepressants, and relevance of antidepressant monitoring
31
I.7.6.1. Mechanism of action
Mianserin enhances noradrenergic and serotonergic neurotransmission
through antagonism of the central �2-adrenergic receptors and by a
postsynaptic blockade of 5-HT2 receptors (not the 5-HT3 receptors).
I.7.6.2. Pharmacokinetics
Mianserin is well absorbed following oral administration, but it undergoes
first-pass metabolism, resulting in a bioavailability of about 70%. After oral
administration of 30 mg of mianserin, the plasma concentrations ranged
between 3-13 ng/ml after 18 hours and 18-34 ng/ml at steady state. In
addition, the concentration of desmethylmianserin ranged from 1-7 ng/ml
and 3-24 ng/ml, respectively [167]. The active metabolite to parent drug
ratio, desmethylmianserin/mianserin is about 0.3-0.4 [138,166]. Mianserin is
metabolized by N-demethylation and 8-hydroxylation, to form the
metabolites N-desmethylmianserin and 8-hydroxymianserin, respectively. N-
oxidation of the drug also occurs but does not form a biologically active
metabolite. Mianserin is metabolized in the liver through CYP2D6, 1A2, and
3A4 [166]. The mean plasma half-life of mianserin is 16 hours but the value
is increased by age. About 30 to 40% of a single dose is excreted in 24
hours urine, mostly as metabolites, since only 5% unchanged drug is found
in urine. Mianserin crosses the blood-brain barrier and the placenta, and is
excreted in breast milk.
I.7.6.3. Drug concentrations and clinical effects
The therapeutic concentration for mianserin ranges from 15 to 70 ng/ml [56],
while it ranges from 40-125 ng/ml for the sum of mianserin and its
metabolite desmethylmianserin. Although the best clinical response was
associated with a plasma concentration of less than 70 ng/ml, there seems to
be no relationship between plasma concentrations and therapeutic response
[138]. Mianserin, desmethylmianserin, and the sum of mianserin and its
metabolite have significant linear kinetics [167]. Plasma concentrations of
mianserin have been reported to increase significantly with age, in contrast
with the metabolite concentrations that decreased, probably due to impaired
demethylation in the elderly [138].

Chapter I: Introduction: depression, use of antidepressants, and relevance of antidepressant monitoring
I.7.6.4. Drug interactions, side-effects and toxicity
The most frequently reported side-effects are drowsiness, convulsions and
sedation [168]. Serious side-effects are the occurrence of blood diseases
such as agranulocytosis, granulocytopenia, leucopenia or pancytopenia [168].
According to Nawishy et al. [169], plasma levels of mianserin are significantly
reduced in epileptic patients treated with phenytoin, phenobarbitone and
carbamazepine. Eap et al. concluded that carbamazepine reduced the plasma
concentration of mianserin as it is an inducer of CYP3A4, which is involved in
the metabolism of mianserin [166].
I.7.6.5. Analytical Methods
Mianserin is determined with or without its metabolites using capillary
electrophoresis [170] and liquid or gas chromatographic methods. Several
methods can separate the enantiomers by using a chiral stationary phase
[171].
Nitrogen-phosphorus [94, 172] and MS detectors [95] are used in gas
chromatography. In liquid chromatography, UV [173, 174], fluorescence
[175], mass [176] and electrochemical [177] detectors are applied.
Liquid-liquid extraction after alkalinization [170] or solid phase extraction is
utilized as sample preparation [94, 95, 174, 177].
I.7.7. Mirtazapine
1,2,3,4,10,14b-Hexahydro-2-methylpyrazino(2,1-a)pyrido(2,3-c)(2)-benzazepine: mol. wt., 265.4; pKa, 7.1; usual dose, 15-45 mg/day; therapeutic concentration, 20 to 100 ng/ml; plasma half-life, 20-40 h; plasma protein binding, 85%; distribution volume, 10-14 l/kg [57, 58].
NN
NCH3
*
Mirtazapine is a noradrenergic and specific serotonergic antidepressant
(NaSSA). The drug has been used to treat depression with or without anxiety
32

Chapter I: Introduction: depression, use of antidepressants, and relevance of antidepressant monitoring
33
symptoms and sleep disturbances [64, 178]. This compound is a racemate
and the S(+)- as well as the R(-)- enantiomer are pharmacologically active
[178]. TDM could be of interest for monitoring patient compliance and
patients with liver impairment.
I.7.7.1. Mechanism of action
Mirtazapine enhances noradrenergic and serotonergic neurotransmission
through antagonism of the central �2-adrenergic receptors and by a
postsynaptic blockade of 5-HT2 and 5-HT3 receptors [178]. It has a weak
affinity for 5-HT1 receptors and very weak muscarinic anticholinergic and
histamine antagonist properties [179].
I.7.7.2. Pharmacokinetics
Mirtazapine is readily absorbed after oral administration, resulting in a
bioavailability of 50% [180]. The time to reach maximum plasma
concentration is about 2 hours and coadministration of food has minor effect
on the rate, but not on the extent of absorption [180]. According to Timmer
et al., the Cmax at steady state ranges from 55 to 89 ng/ml for healthy males
receiving 30 mg mirtazapine per day [180]. Mirtazepine has a plasma half-
life from 20 to 40 hours, with an average of 37 hours in women, and 26
hours in men, while steady-state concentrations could be attained within 5
days [178]. In addition, mirtazapine has linear pharmacokinetics at dosages
of 15-80 mg/day [180].
Mirtazapine is metabolized into its 8-hydroxy-metabolite by cytochrome 2D6
and 1A2. CYP3A4, however, metabolizes mirtazapine into the active N-
desmethylmirtazapine and the inactive N-oxide. Moreover, conjugation of
these metabolites also occurs. Although some metabolites have a
pharmacological activity, they do not contribute significantly to the
therapeutic effect, due to the low plasma concentrations. The drug is
eliminated by excretion in urine and faeces in a few days after a single dose.
I.7.7.3. Drug concentrations and clinical effects
The therapeutic concentration for mirtazapine ranges from 20 to 100 ng/ml
[56]. According to Grasmäder et al. 30 ng/ml is the threshold plasma
concentration, resulting in a response to mirtazapine treatment [181].

Chapter I: Introduction: depression, use of antidepressants, and relevance of antidepressant monitoring
34
Moreover, young males seem to need higher doses to reach the same plasma
concentrations in comparison to female patients or elderly men. However,
because no consistent relationship has been described between plasma
mirtazapine concentrations and effect, the significance of these gender and
age specific variation in plasma concentrations attained for a given dose is
still unknown [180]. A decreased oral clearance and increased peak-plasma
concentration, as well as time to reach that concentration is seen in patients
with moderate or severe renal failure in comparison with the healthy
population [178]. Because hepatic clearance of mirtazapine is reduced in
patients with cirrhosis or hepatic impairment, dosage adjustments should be
performed with caution [178].
I.7.7.4. Drug interactions, side-effects and toxicity
The most common side-effects are somnolence [181], dizziness, dry mouth,
increased appetite and body-weight gain [182]. According to the FDA [64],
following side-effects can also occur: agranulocytosis, increase in plasma
cholesterol and triglycerides, seizures, mania and sexual problems. The
increase in cholesterol and triglycerides is probably due to the increased
appetite. Side-effects such as mania, seizures and agranulocytosis are rather
rare [179, 182]. In addition, sexual dysfunction is less frequently than when
using an SSRI [183].
As mirtazapine is unlikely to inhibit CYPs, the drug-drug interaction profile is
favourable [178]. Moreover, as it is metabolized by several enzymes, it is
unlikely that its metabolism would be affected by coadministration of a
CYP1A2, 2D6 or 3A4-inhibitor [182]. Although coadministration of cimetidine,
paroxetine [184], fluoxetine, carbamazepine and amitriptyline [185]
increases the steady-state plasma concentration of mirtazapine, this increase
was not considered to be clinically relevant [180]. Patients should be
cautioned, though, not to use other central nervous system depressants (e.g.
ethanol or diazepam) in combination with mirtazapine [182]. Mirtazapine
should not be coadministered with a monoamine oxidase inhibitor as this can
lead to hyperthermia, convulsions and coma. In addition, a delay of 2 weeks
before taking a MAOI should be considered after mirtazapine treatment and
vice versa [64].

Chapter I: Introduction: depression, use of antidepressants, and relevance of antidepressant monitoring
I.7.7.5. Analytical methods
Mirtazapine and its metabolites are determined using gas and liquid
chromatographic methods, as well as capillary electrophoresis [186] in a
variety of samples such as plasma [86, 186-194], serum [188, 189], post-
mortem blood [195] and urine [82, 196]. Some methods are able to separate
the enantiomers using a chiral column [192, 193] or a chiral additive in the
eluent such as carboxymethyl-beta-cyclodextrin [186].
Gas chromatography is used combined with an MSD [82, 195, 196]. In liquid
chromatography, the following detectors are applied: fluorescence detectors
[188-190, 194], UV [187, 193, 197], DAD [85, 86] and mass spectrometric
detectors [191, 192].
Sample preparation mostly consists of a liquid-liquid extraction after
alkalinization [85, 86, 187, 190-192, 195, 196]. Moreover, de Santana et al.
published a method using liquid-phase microextraction (LPME) [193].
Recently, solid phase extraction [95, 194, 197] and solid phase
microextraction methods [82] are also published.
Most methods allow quantitative determination in the lower ng/ml range, and
are thus suitable for therapeutic drug monitoring purposes.
I.7.8. Paroxetine
(3S-trans)-3-[(1,3-Benzodioxol-5-yloxy)methyl]-4-(4-fluorophenyl)-piperidine : mol. wt., 329.4; pKa, 9.9; usual dose, 10 up to 60 mg/day (max. 40 mg/day for elderly and patients with kidney or hepatic impairment) [198]; therapeutic concentrations in serum from 10 to 75 ng/ml; toxic serum concentrations from 350 to 400 ng/ml [56]; plasma half-life, 12-40 h; plasma protein binding, 95%; distribution volume, 3 - 28 l/kg [57, 58].
N
O O
O
F
H
* *
Paroxetine is a selective inhibitor of neuronal serotonin reuptake. The drug
was approved in 1992 by the FDA and has been used to treat depression as
35

Chapter I: Introduction: depression, use of antidepressants, and relevance of antidepressant monitoring
36
well as several disorders: panic, obsessive-compulsive disorder,
posttraumatic stress, generalized and social anxiety [64, 199]. Paroxetine
has the most clinical evidence supporting the use for anxiety of all SSRIs.
This compound has two chiral centres, but it is used clinically as pure 3S, 4R-
isomer [19]. TDM could be of interest for monitoring patient compliance,
patients with liver and kidney impairment or for the elderly population. In
addition, patients with co-medication of drugs that are metabolized by
CYP2D6 should also be monitored.
I.7.8.1. Mechanism of action
Paroxetine is a potent and selective inhibitor of presynaptic serotonin
reuptake and enhances serotonergic neurotransmission by prolonging
serotonin activity at its postsynaptic receptors. It is a weak inhibitor of
dopamine and noradrenaline transporters, while it displays some affinity for
the muscarinic receptor, resulting in more anticholinergic symptoms such as
dry mouth and constipation [20, 198, 200, 201].
I.7.8.2. Pharmacokinetics
Paroxetine is well absorbed without being affected by presence of food or
antacids. The absolute bioavailability of paroxetine, though, is about 50%,
due to first pass metabolism [19]. The time to reach maximum plasma
concentration is about 5 hours after a single dose of 30 mg, while steady-
state concentrations could be attained after 7 to 14 days in healthy
volunteers administered 30 mg/day [198]. This dosage leads to an inter-
individual variation in the plasma concentration from less than 1 to more
than 150 ng/ml [138]. In addition, Rasmussen and Brosen reported plasma
concentrations of 1-188 ng/ml in patients treated with paroxetine in doses of
20-60 mg/day [74]. As a result, a therapeutic window has not yet been
established. Moreover, the small numbers of presently available studies do
not suggest the existence of a plasma concentration-clinical response
relationship for paroxetine [79].
Paroxetine is extensively metabolized after oral absorption, mainly by
oxidation and demethylation, followed by conjugation. The CYP2D6
isoenzyme mainly regulates the O-demethylenation, leading to a cathechol
type metabolite [58], which is further O-methylated and conjugated with

Chapter I: Introduction: depression, use of antidepressants, and relevance of antidepressant monitoring
37
glucuronic acid and sulphate. Thus, the extensive metabolism in the liver
leads to inactive glucuronide and sulphate metabolites [201]. On the other
hand, a not yet identified low-affinity enzyme also plays a role in the
paroxetine metabolism [67]. This enzyme is the primary enzyme used by
CYP2D6 poor metabolizers [134].
The drug is widely distributed in the body, even in the central nervous
system and in breast milk. Approximately 64% of a dose is excreted in urine,
while the other 36% is excreted in the faeces. Less than 2% of a dose is
excreted as the parent drug. Paroxetine has a high protein binding rate,
leading to possible interactions with other high protein bound drugs [198].
I.7.8.3. Drug concentrations and clinical effects
The therapeutic concentration for paroxetine ranges from 10 to 75 ng/ml
[56]. However, no consistent relationship has been described between
plasma paroxetine concentrations and clinical response [201]. In addition, a
considerable inter-individual variation in plasma concentrations attained for a
given dose is observed. Paroxetine does appear to have nonlinear
pharmacokinetics after repeated administration of therapeutic doses [79,
198, 201], probably due to saturation of CYP2D6 at higher paroxetine
concentration, leading to further elimination by the lower affinity unidentified
metabolite [100, 134]. A lower or less frequent dose should be considered in
patients with hepatic cirrhosis, renal impairment and the elderly as the area
under the concentration-time curve and the half-life are significantly
increased [198]. Furthermore, paroxetine is not advised during the first three
months of the pregnancy as it increases risk of birth defects, particularly
heart defects [64]. In addition, withdrawal syndromes or neonatal
convulsions are described for paroxetine during pregnancy [46, 47]. This
could be due to the affinity of paroxetine towards the muscarinic receptors in
combination with nonlinear kinetics, self-limiting metabolism and short half-
life. Moreover, breast feeding during paroxetine treatment is considered safe,
although this view should be considered as preliminary due to the lack of
data [137]. Spigset and Hagg have calculated a milk/plasma ratio between
0.4 and 1, resulting in a relative dose of 1 to 3% in the infant [137].

Chapter I: Introduction: depression, use of antidepressants, and relevance of antidepressant monitoring
38
I.7.8.4. Drug interactions, side-effects and toxicity
Possible side-effects of paroxetine are nausea, sexual dysfunction,
somnolence, asthenia, headache, constipation, dizziness, sweating, tremor
and decreased appetite [198]. Toxic effects may occur with concentrations
exceeding 400 ng/ml. Caution is advised when paroxetine is coadministered
with drugs that are metabolized by CYP2D6. As a result, paroxetine AUC are
increased by 50% or decreased by 28%, due to co-medication with
cimetidine or phenytoin, respectively [201]. Moreover, paroxetine may lead
to enhancement of plasma concentrations of TCAs such as desipramine [22],
antipsychotics (e.g. perphenazine [22]), and antiarrhythmics [134, 201]. On
the other hand, paroxetine leads to a decrease in analgesic efficacy of
codeine, oxycodone and hydrocodone as it inhibits their metabolism, leading
to less of their active metabolites [22].
Paroxetine should not be coadministered with a monoamine oxidase inhibitor
as this can lead to hyperthermia, convulsions and coma. In addition, a delay
of 2 weeks before taking an irreversible MAOI and 1 day after treatment with
a reversible MAOI should be considered after paroxetine treatment and vice
versa [198]. This washing out-period is also necessary for thioridazine
administration as it produces a dose-related prolongation of the QTc interval,
which is associated with serious ventricular arrhythmias, such as torsades de
pointes-type arrhythmias, and sudden death.
I.7.8.5. Analytical methods
Paroxetine is determined in a variety of samples such as serum, plasma and
whole blood [87, 111] by using gas chromatographic and liquid
chromatographic methods, as well as micellar electrokinetic capillary
chromatographic methods [140] and TLC [76, 92]. Gas chromatography is
used, combined with detectors such as NPD [76, 80, 111], ECD [202] and
MSD [113]. Paroxetine is derivatized with pentafluorobenzyl carbamate or
heptafluorobutyric anhydride before injection onto a GC-MS in negative ion
chemical ionization mode or on a GC-ECD configuration [202-204]. In liquid
chromatography, the following detectors are applied: UV [87, 146, 148, 205,
206], DAD [86], fluorescence [76, 80, 87, 151, 207, 208], coulometric
detection [209], and mass detectors in electrospray [92, 210, 211] as well as
in atmospheric pressure chemical ionization mode [93]. When using DAD, a

Chapter I: Introduction: depression, use of antidepressants, and relevance of antidepressant monitoring
typical spectrum arises in acidic conditions with absorption at 233, 264, 270
and 293 nm. On the other hand, paroxetine could be determined using
fluorescence detection with or without dansylchloride derivatization [76].
Some methods can separate the enantiomers of the compound after using a
chiral stationary phase such as Chiralcel OD columns [212].
Sample preparation mostly consists of a liquid-liquid extraction after
alkalinization [76, 80, 202, 203, 206, 211, 213], although recently a lot of
solid phase extraction methods [76, 87, 92, 95, 111, 148, 208] are
published.
Most methods allow quantitative determination in the lower ng/ml range
(LOQ between 1-5 ng/ml), and are thus suitable for therapeutic drug
monitoring purposes [76].
I.7.9. Reboxetine
(R,S)-2-((RS)-�-(2 Ethoxyphenoxy))benzylmorpholine: mol. wt., 313.4; usual dose, 8 mg/day; max.dose, 12 mg/day; therapeutic concentration, 50 to 160 ng/ml; plasma half-life, 13-15 h; plasma protein binding, 97%; distribution volume, 0.39-0.92 l/kg (1.9-2.8 l/kg) [57, 58].
H
O
O
CH3
H
H
N
O * *
Reboxetine is a selective noradrenaline reuptake inhibitor (NARI) used in
most European countries to treat depression. This compound is a
antidepressant with two chiral centres, but only the (R,R)-(-) and the (S,S)-
(+)-enantiomer (the most potent enantiomer) exist in commercial products
[214]. TDM could be of interest for monitoring patient compliance, patients
with liver impairment or for the elderly. In addition, monitoring patients who
receive potent CYP3A inhibitors could be valuable [215]. However, it is a drug
with a good tolerability and a low potency for drug-drug interactions.
39

Chapter I: Introduction: depression, use of antidepressants, and relevance of antidepressant monitoring
40
I.7.9.1. Mechanism of action
Reboxetine enhances noradrenergic neurotransmission through inhibition of
the noradrenaline reuptake. It also has a very weak inhibition of serotonin
reuptake, but no inhibition of dopamine reuptake [214]. Reboxetine has no
monoamine oxidase A inhibitory properties, and has very little affinity for �-
adrenergic and muscarinic cholinergic receptors [16].
I.7.9.2. Pharmacokinetics
Reboxetine is rapidly and almost completely absorbed from the
gastrointestinal tract. After oral administration of 4 mg of reboxetine, the
plasma concentration achieved after about 2 hours was 111±28 ng/ml [215].
Peak plasma concentration may be increased in elderly and in patients with
renal and hepatic impairment. Steady-state is achieved within 4 days after
the start of administration [214]. In addition, reboxetine has significant linear
kinetics through a dose of 5 mg [215]. Metabolism of reboxetine includes
dealkylation, hydroxylation of the ethoxyphenoxy ring and morpholine ring
oxidation, followed by conjugation [67, 214]. It is metabolized primarily in
the liver through CYP3A4 [214, 215]. The mean plasma half-life of reboxetine
ranges between 13-15 hours, but the value is increased by age and renal as
well as hepatocellular dysfunction. The greatest part of a single dose is
excreted in urine (about 77% in 5 days), which contains about 5%
unchanged reboxetine, and at least 17 different metabolites. The rest of the
drug is eliminated in the faeces. The drug has a high protein binding rate of
97%, particularly to �1-acid glycoprotein.
I.7.9.3. Drug concentrations and clinical effects
The therapeutic concentration for reboxetine ranges from 50-160 ng/ml.
While gender has no effect on reboxetine pharmacokinetics, plasma
concentrations of the drug have been reported to increase significantly with
age. Moreover, there appears to be a high degree of inter-subject variability
of the pharmacokinetic parameters in the elderly. Therefore, the starting
dose should be reduced by 50% and monitored in this population. Patients
with mild or severe liver impairment should be monitored as the AUC values
for reboxetine are substantially increased. Although reboxetine is cleared
mainly via hepatic metabolism, the AUC and the half-life of reboxetine in

Chapter I: Introduction: depression, use of antidepressants, and relevance of antidepressant monitoring
41
severe renal impaired patients are increased [215]. There are no data on
effects of reboxetine exposure during pregnancy [45].
I.7.9.4. Drug interactions, side-effects and toxicity
The most frequently reported side-effects in short-term reboxetine trials are
dry mouth, constipation, insomnia, increased sweating, tachycardia, vertigo,
urinary hesitancy and/or retention, and impotence. Moreover, an increased
heart rate was associated with reboxetine use, but the clinical significance of
this finding is unknown [16, 216]. Occasional atrical and vertricular ectopic
beats were also reported [217].
Reboxetine is a weak in vitro inhibitor of CYP2D6 and 3A4, but the inhibitory
effect is unlikely to be relevant in vivo because it occurs at concentrations
well above those achieved clinically [100, 218]. Therefore, drug interactions
as seen for the SSRI are not common. Because CYP3A4 is involved in the
metabolism of reboxetine, potent inhibitors of this isoenzyme such as
ketoconazole may increase the plasma concentration of the drug [214, 215].
I.7.9.5. Analytical Methods
Reboxetine is determined with or without its metabolite O-
desmethylreboxetine using capillary electrophoresis, liquid chromatographic
or gas chromatographic methods. While MS detectors [113] are used in gas
chromatography, UV [83, 219, 220], fluorescence [219, 221, 222], and mass
[91] detectors are applied in liquid chromatography. Several methods can
separate the enantiomers of the compound using a chiral stationary phase
such as Chiral CBH (cellobiohydrolase), Chiral AGP (�1-acid-glycoprotein) and
ChiraGrom-2 [223]. Walters and Buist describe a method combining chiral
derivatization and a chiral column to separate the enantiomers [221]. In
addition, capillary electrophoresis is also used to separate reboxetine
enantiomers [224].
Solid phase extraction is mostly used as sample preparation technique [95,
219, 221].

Chapter I: Introduction: depression, use of antidepressants, and relevance of antidepressant monitoring
I.7.10. Sertraline
(1S,4S)-4-(3,4-Dichlorophenyl)-1,2,3,4-tetrahydro-N-methyl-1-naphtalenamine: mol. wt., 306.2 ; pKa, 9.48 � 0.04 (water); usual dose, 50 – 200 mg/day; toxic from 290 ng/ml; therapeutic concentration, 50 to 250 ng/ml; plasma half-life, 26 h; plasma protein binding, 98%; distribution volume, 20 l/kg [57, 58].
HCl
Cl
H N CH3H
*
*
Sertraline is a selective inhibitor of neuronal serotonin reuptake. The drug
has been used to treat depression as well as obsessive-compulsive disorder
(also for children), panic disorder, post-traumatic stress, premenstrual
dysphoric disorder and social anxiety disorder [64, 225]. This compound has
two chiral centres, but the cis 1S, 4S-enantiomer is the most potent and is
the one marketed as pharmaceutical form [40, 225]. TDM could be of interest
for monitoring patient compliance, patients with liver impairment, elderly and
patients with co-medication of drugs that are metabolized by CYP2D6.
I.7.10.1. Mechanism of action
Sertraline is a potent and selective inhibitor of serotonin reuptake in the
synapse with little effect on other monoamine reuptake mechanisms or other
neurotransmitter receptors, with the exception of the dopamine transporter,
which is not considered to be of therapeutic consequence [225].
I.7.10.2. Pharmacokinetics
Sertraline is slowly absorbed from the gastrointestinal tract, resulting in a
bioavailability greater than 44% [225]. The time to reach maximum plasma
concentration is about 4-8 hours and coadministration of food increased peak
plasma concentrations by approximately 25% [225]. Steady-state
42

Chapter I: Introduction: depression, use of antidepressants, and relevance of antidepressant monitoring
43
concentrations could be attained within 1 week, due to the relatively short
half-life of 26 h [226]. The therapeutic concentration for sertraline ranges
from 50 to 250 ng/ml [56]. In addition, the plasma concentration of
desmethylsertraline is higher than the parent drug concentration, with a ratio
of sertraline/desmethylsertraline varying from 0.24 to 0.85 in patients after a
dose of 100-300 mg/day [79]. However, there appears to be considerable
inter-individual variation in steady state plasma concentrations (nearly 15-
fold) attained with a given dose [225].
Sertraline is extensively metabolized in the liver, where it undergoes N-
demethylation to form desmethylsertraline. Both the parent drug and the N-
desmethylderivative are further metabolized by oxidative deamination,
reduction, and hydroxylation followed by glucuronidation [58]. Sertraline is
excreted in urine and faeces and is distributed in breast milk. Sertraline is
metabolized by CYP2D6, 2C9, 2B6, 2C19 and 3A4 [225], while the drug itself
is a moderate inhibitor of CYP2D6.
I.7.10.3. Drug concentrations and clinical effects
The therapeutic concentration for sertraline ranges from 50 to 250 ng/ml
[56]. However, Goodnick describes that a concentration of 10 to 60 ng/ml
may provide the maximal therapeutic benefit [138]. Therefore, there can be
concluded that no consistent relationship has been described between plasma
sertraline concentrations and clinical response. In addition, a considerable
inter-individual and gender specific variation in plasma concentrations
attained for a given dose is observed.
Sertraline appears to have linear pharmacokinetics at dosages of 50-200
mg/day [226]. A decreased clearance and prolonged half-life of sertraline is
seen in the elderly, suggesting a higher steady-state concentration achieved
later during long-term administration. However, the clinical significance of
these effects is still unknown [225]. A prolonged half-life of sertraline is also
seen for patients with liver disease, while the pharmacokinetics of sertraline
did not change after single dose in renal impaired patients. As no data have
been reported after multiple doses or for patients with severe renal
dysfunction, caution is recommended for these groups [225]. Moreover,
several studies reported that plasma concentrations of young men tended to

Chapter I: Introduction: depression, use of antidepressants, and relevance of antidepressant monitoring
44
be lower than for women, probably due to either differences in the tissue
distribution or in the metabolism [40, 226].
I.7.10.4. Drug interactions, side-effects and toxicity
Possible side-effects of sertraline are nausea, decreased libido, tremor,
tachycardia, headaches and dry mouth. Co-medication with drugs that are
metabolized by CYP2D6 should be monitored, as sertraline is a mild to
moderate inhibitor of that enzyme [79]. Sertraline also slightly inhibits
CYP1A2, 3A4, 2C19 and 2C9, while in vitro desmethylsertraline seems to be a
more potent inhibitor of CYP3A4, due to the long half-life of the metabolite.
Therefore, the period for potential drug-drug interactions could be prolonged
after sertraline treatment [131]. However, sertraline appears to have a
favourable drug interaction profile in vivo as compared to the other SSRIs
[22, 100]. Caution is advised when sertraline is coadministered with warfarin
(prothrombin time should be monitored) and when using high dosages of
sertraline in combination with a TCA or vice versa [225].
Sertraline should not be coadministered with a monoamine oxidase inhibitor
as this can lead to hyperthermia, convulsions and coma. In addition, a delay
of 2 weeks before taking a MAOI should be considered after fluvoxamine
treatment and vice versa [64]. This washing out-period is also necessary for
pimozide administration as it produces a dose-related prolongation of the QTc
interval, which is associated with serious ventricular arrhythmias, such as
torsades de pointes-type arrhythmias, and sudden death [64].
I.7.10.5. Analytical methods
Sertraline and its metabolite are determined using gas chromatographic,
liquid chromatographic, as well as micellar electrokinetic capillary
chromatographic methods [227]. Gas chromatography combined with
detectors such as ECD [79], NPD [80], and MSD [76, 82, 113, 195, 228-230]
is used. UV [83, 84, 143, 231], DAD [85, 86], and mass detectors [232, 233]
are applied in liquid chromatographic methods.
Sample preparation mostly consists of a liquid-liquid extraction after
alkalinization [76, 80, 84-86, 151, 195, 230] although recently numerous
solid phase extraction methods [76, 83, 95, 143, 228, 231] are published.
Moreover, methods using SPME [82] were also utilized. Most methods allow

Chapter I: Introduction: depression, use of antidepressants, and relevance of antidepressant monitoring
quantitative determination in the lower ng/ml range (LOQ between 1-10
ng/ml), and are thus suitable for therapeutic drug monitoring purposes [76].
I.7.11. Trazodone
2-(3-(4-(3-Chlorophenyl)-1-piperazinyl)propyl)-1,2,4-triazolo (4,3-a)-pyridine-3 (2H) – one: mol. wt., 371.9; pKa, 6.7; usual dose, 100-300 mg/day; max.dose, 600 mg/day; therapeutic concentration, 500-2500 ng/ml ; plasma half-life, 4-7 h; plasma protein binding, 90%; distribution volume, 0.9-1.5 l/kg [57, 58].
N
NN N N
O
Cl
Trazodone is a serotonin antagonist and reuptake inhibitor. The drug has
been used to treat depression, while it improves anxiety [234] and insomnia
[235].
I.7.11.1. Mechanism of action
Trazodone blocks the reuptake of serotonin and blocks 5-HT2a as well as
noradrenaline �1-receptors. It blocks H1 and noradrenaline �2-receptors less
potently, while it lacks anticholinergic activity [234, 236]. The active
metabolite 1-(3-chlorophenyl)piperazine (m-cpp), has opposite activities, it
releases serotonin and is a 5-HT2c and 5-HT1a receptor agonist [237]. These
actions may contribute to the side-effects and action mechanism of trazodone
[157] and are probably the reason why m-cpp is also encounterd in the drug
scene.
I.7.11.2. Pharmacokinetics
Trazodone is readily and almost completely absorbed after oral
administration. The time to reach maximum plasma concentration is about 1-
2 hours and coadministration of food delays tmax and decreases Cmax [138].
Steady-state plasma levels of trazodone range from 490 to 1210 ng/ml, while
concentrations of m-cpp range from 10 to 30 ng/ml [238, 239]. Trazodone
undergoes extensive hepatic metabolism, mainly through hydroxylation, N-
45

Chapter I: Introduction: depression, use of antidepressants, and relevance of antidepressant monitoring
46
oxidation and N-dealkylation [157]. The two major metabolites are the
pharmacologically active m-cpp, and beta-(3-oxo-s-triazolic(4,3-a)pyridin-2-
yl)propionic acid (TPA). These metabolites are further glucuronated. While m-
cpp is the major plasma metabolite, TPA (20%) is the main metabolite found
in urine. Other urinary metabolites are p-hydroxytrazodone, and a
dihydrodiol derivate (9%), even as their conjugation products. Trazodone is
metabolized by CYP2D6, 1A2, and 3A4 [157].
I.7.11.3. Drug concentrations and clinical effects
The therapeutic concentration for trazodone ranges from 500-2500 ng/ml
serum, while the toxic concentration is about 4000 ng/ml [56]. According to
Otani et al., plasma concentrations of trazodone and m-cpp, after initial
dosing, correlated well with those at steady state. However, there was a
substantial accumulation of m-cpp due to the longer half-life of the
metabolite [240]. Although there appears to be considerable inter-individual
variation in trazodone metabolism and thus in steady state plasma
concentrations attained with a given dose [157, 241], Mihara and Monteleone
et al. have suggested a threshold plasma concentration of 714 ng/ml
trazodone, necessary for a good antidepressant response [241, 242].
Trazodone appears to have linear pharmacokinetics. In addition, a
considerable age and gender specific variation in plasma concentrations
attained for a given dose is observed. The plasma concentrations were higher
in females and in older patients [243]. Moreover, the plasma concentration of
trazodone is lower in smokers compared to non-smokers [244]. Breast
feeding during trazodone treatment is considered safe, as there is a minimal
penetration of trazodone into breast milk (milk/plasma ratio of 0.14) [138].
I.7.11.4. Drug interactions, side-effects and toxicity
Possible side-effects of trazodone are sedation, particularly at high doses,
orthostatic hypotension, nausea, drowsiness, vertigo and sexual dysfunction
[236, 245]. These dysfunctions include increased libido, spontaneous orgasm
and priapism [234]. Several case reports illustrate cardiovascular adverse
effects such as orthostatic hypotension, ventricular arrhythmias, cardiac
conduction disturbances, exacerbation of ischemic attacks and torsades de
pointes [238, 246]. Especially, for the elderly, the side-effects of trazodone

Chapter I: Introduction: depression, use of antidepressants, and relevance of antidepressant monitoring
47
such as sedation, dizziness and cardiotoxic effects raise considerable
concerns. Caution is advised when trazodone is coadministered with
fluoxetine, as excessive sedation has been reported. Moreover, trazodone in
combination with other sedatives such as alcohol or other antidepressants
should be observed carefully [245].
In addition, serotonin syndrome has been reported after coadministration
with SSRIs, MAOI and TCAs [157, 238, 247, 248]. However, Prapotnik et al.
did not observe drug interactions when trazodone was coadministered with
fluoxetine or citalopram [243]. Trazodone should not be coadministered with
a MAOI as this could lead to hyperthermia, convulsions and coma. Moreover,
a few cases of warfarin-trazodone interactions have been reported [249].
Inhibitors of CYP2D6 (thioridazine) or CYP3A4 (ritonavir, ketonazole) increase
the plasma concentration of trazodone in depressed patients [236, 250]. On
the other hand, carbamazepine decreases trazodone plasma concentrations
as it induces CYP3A4 [238]. Although trazodone has a low toxicity level,
fatalities with blood concentrations around 9000 ng/ml and higher are
observed in the literature, while noting the survival of patients even with
significantly higher concentrations [238]. Most of the time, trazodone is
coadministered with other drugs such as antidepressants, especially SSRIs
and it is also used together with drugs of abuse [238, 251].
I.7.11.5. Analytical methods
Trazodone and m-cpp are determined using gas chromatographic and liquid
chromatographic methods. Gas chromatography is mostly combined with an
NPD [111, 252-254], but FID is also used [254]. Caccia et al. determined
trazodone with a GC-NPD in plasma and brain tissues. They also analyzed m-
cpp after heptafluorobutyryl derivatization with ECD and MSD [253]. UV
detectors [173, 255-259] and DAD [260] are applied in liquid
chromatographic methods. Ohkubo et al. combined UV detection for
trazodone with coulometric electrochemical detection of m-cpp [257]. In
addition, Siek [261] reported a high-performance thin-layer chromatographic
method combined with a Camag TLC scanner for fluorescence-reflectance
measurements. Although trazodone can not be detected with immunological
methods, the metabolite of trazodone can be responsible for false-positive

Chapter I: Introduction: depression, use of antidepressants, and relevance of antidepressant monitoring
results for amphetamine using polyclonal antibody assays (EMIT 1, Triage
panel) [262].
Sample preparation mostly consists of a liquid-liquid extraction after
alkalinization [173, 253-256, 258-260], although recently solid phase
extraction methods are also published [111, 257].
I.7.12. Venlafaxine
1-(2-(Dimethylamino)-1-(4-methoxyphenyl]ethyl)cyclohexanol: mol. wt., 277.4; pKa, 9.4; usual dose, 75 mg/day; max.dose, 375 mg/day ; therapeutic concentration, 250 to 750 ng/ml for the sum parent drug and metabolites; toxic concentration, 1000-1500 ng/ml; plasma half-life, 4 h; plasma protein binding, 30%; distribution volume, 6.8 l/kg (4-12 l/kg )[57, 58].
H3CO
N
CH3
H3COH
* *
Venlafaxine is a selective noradrenaline and serotonin inhibitor (SNRI),
introduced in 1993 to treat depression, generalized or social anxiety
disorders. This compound exists as racemic antidepressant with both active
R(+)- and S(-) – enantiomers [263]. TDM could be of interest for monitoring
patient compliance and adjusting the dose for patients with liver and kidney
impairment. However, it is a drug with a low potency for drug-drug
interactions, due to its low protein binding as well as its weak inhibitory effect
on the CYP 450 system.
I.7.12.1. Mechanism of action
Venlafaxine enhances noradrenergic and serotonergic neurotransmission
through inhibition of the noradrenaline and serotonin reuptake. The (-)
enantiomer inhibits reuptake of both serotonin and noradrenaline, while the
(+) enantiomer primarily inhibits serotonin reuptake. Venlafaxine also
inhibits, to a lesser extent, dopamine reuptake. Venlafaxine has no
48

Chapter I: Introduction: depression, use of antidepressants, and relevance of antidepressant monitoring
49
monoamine oxidase inhibitory properties, and has no affinity for histamine,
�2 or �-adrenergic and muscarinic cholinergic receptors [263].
I.7.12.2. Pharmacokinetics
Venlafaxine is absorbed rapidly and almost complete (92%) after oral intake.
The maximum plasma concentration is achieved after about 2 till 4 hours,
while steady-state is achieved within 3 days of multidose therapy. In
addition, venlafaxine and O-desmethylvenlafaxine have linear kinetics over
the total daily dosage range of 75-450 mg. Venlafaxine is subject to an
extensive first-pass metabolism in the liver. The main metabolite, O-
desmethylvenlafaxine, has a pharmacological activity similar to that of the
parent drug. This metabolite, however, has a longer elimination half-life,
being 10 hours instead of 4. Other minor metabolites such as N-
desmethylvenlafaxine and N,O-didesmethylvenlafaxine are also produced.
Venlafaxine is metabolized primarily in the liver via CYP2D6, but also by
CYP3A4 to yield the N-desmethylmetabolite [264]. The mean plasma half-life
of venlafaxine is 4 hours, but is increased in patients suffering from renal and
hepatic impairment. Approximately 87% of a single dose venlafaxine is
excreted in urine within 48 hours, containing about 5% unchanged
venlafaxine, unconjugated and conjugated O-desmethylvenlafaxine
(29/26%), and minor metabolites (27%).
I.7.12.3. Drug concentrations and clinical effects
The therapeutic concentration for the sum of venlafaxine and its active
metabolite O-desmethylvenlafaxine ranges from 250-750 ng/ml [56]. While
gender has no effect on venlafaxine pharmacokinetics, plasma concentrations
of the drug and its active metabolite have been reported to increase with age
[264]. This observation might be due to a higher risk of drug interactions in
the elderly (polypharmacy) and a physiologically age-related lower clearance
[264]. However, no dosage adjustments are necessary in the elderly on the
basis of age alone [265]. On the other hand, dosage of venlafaxine should be
reduced (by 50%) for patients with moderate liver impairment as the hepatic
clearance of both venlafaxine and O-desmethylvenlafaxine is decreased. In
addition, the dosage should be reduced for renal impaired patients because of

Chapter I: Introduction: depression, use of antidepressants, and relevance of antidepressant monitoring
50
the decreased venlafaxine renal clearance and the prolonged elimination half-
life of both the parent drug and its active metabolite [67, 263].
Reis et al. found a reduction in O-desmethyl- and N,O-didesmethyl-
venlafaxine plasma concentrations for smokers, compared to nonsmokers,
indicating that CYP1A2 might have a role in the drug metabolism [264].
Venlafaxine administration seems quite safe during pregnancy and
breastfeeding. Although there are reports of more spontaneous abortions
when using venlafaxine, it did not attain statistical significance in comparison
with pregnant women taking SSRIs or non-teratogenic agents [45]. However,
it should only be used if the benefits clearly outweigh the risks.
I.7.12.4. Drug interactions, side-effects and toxicity
The most frequently reported side-effects of venlafaxine are nausea,
headache, somnolence, dry mouth, insomnia, dizziness and sexual
dysfunction. Moreover, a mild increased blood pressure was occasionally
associated with venlafaxine use. This effect seems to be dose related and
occurs most frequently at dosages of more than 300 mg per day.
Severe adverse arrhythmia is reported in several patients, which were all
poor metabolizers of CYP2D6 and thus had the highest levels of venlafaxine
in plasma [266]. Therefore, Kirchheiner et al. recommend 20% of the
average venlafaxine dose for poor metabolizers. Although there is some
concern about the influence of venlafaxine on the heart rate [267], some
authors conclude that there is no direct effect on cardiac conduction and it is
in fact a relatively safe choice of an antidepressant in people at risk of cardiac
arrhythmias [268]. Venlafaxine has a low toxicity potential, despite the fact
that there were 14 premarketing reports of overdose with venlafaxine, either
alone or in combination with other drugs or alcohol. Seizures and increased
QT intervals were also reported, but all of the patients made full recovery
[268]. According to the TIAFT reference list a serum concentration of 6600
ng/ml is lethal [56].
Because venlafaxine is metabolized by CYP2D6, theoretically competitive
inhibition by other drugs that are metabolized by this enzyme can occur.
However, venlafaxine has a low affinity for inhibiting CYP2D6 and thus will
not have a significant effect on the metabolism of other drugs, but other
drugs (such as cimetidine) may rather affect the metabolism of venlafaxine

Chapter I: Introduction: depression, use of antidepressants, and relevance of antidepressant monitoring
[263]. Moreover, as the drug has a low protein binding rate of 30%, drug
interactions with high-protein bound drugs are not expected [263].
Venlafaxine, though, should not be coadministered with a monoamine
oxidase inhibitor as this can lead to hyperthermia, convulsions and coma.
While after venlafaxine treatment, a delay of 7 days before taking a MAOI
should be considered, it is recommended that venlafaxine should not be used
within 14 days of discontinuing treatment with an MAOI [263]. Moreover,
venlafaxine causes a 70% increase in the AUC of coadministered haloperidol
[100], and a 30% decrease of alprazolam plasma concentration [268].
I.7.12.5. Analytical Methods
Venlafaxine is determined in biological matrices with or without its
metabolites using electrokinetic capillary chromatographic techniques [140,
269], liquid or gas chromatographic methods. NPD [270, 271] and MSD [82]
are used in gas chromatography. In liquid chromatography detectors such as
UV [83, 84, 272-274], DAD [85, 86], fluorescence [275], and mass detectors
[92, 276] are applied. In addition, Rudaz et al. described a capillary
electrophoresis method that separates the enantiomers of the compound
using gamma-cyclodextrin as chiral selector [269].
Solid phase extraction [83, 92, 95, 276] or liquid-liquid extraction [84-86,
272-275] are mostly used as sample preparation techniques, however, solid-
phase micro extraction techniques are also applied [82].
I.7.13. Viloxazine
2-((2-Ethoxyphenoxy) methyl) morpholine: mol. wt., 237.3; pKa, 8.1; usual dose, 100-400 mg/day; max.dose, 400 mg/day; therapeutic concentration, 5000-10000 ng/ml (peak plasma concentration); plasma half-life, 2-5 h; plasma protein binding, 85-90%; distribution volume, 0.5-1.5 l/kg [57, 58].
O
NH
O
O
*
51

Chapter I: Introduction: depression, use of antidepressants, and relevance of antidepressant monitoring
52
Viloxazine is a noradrenaline reuptake blocking antidepressant used to treat
depression [138]. This compound is marketed as a racemate, but the (R)-(+)
is less potent than the (S)-(-)-enantiomer [277]. Viloxazine has a good
tolerability and a low potency for drug-drug interactions.
I.7.13.1. Mechanism of action
Viloxazine enhances noradrenergic neurotransmission through inhibition of
the noradrenaline reuptake. It possibly also inhibits the reuptake of serotonin
very weakly, but does not inhibit dopamine reuptake. In addition, the drug
has no affinity for �-adrenergic and muscarinic cholinergic receptors [278].
I.7.13.2. Pharmacokinetics
The mean plasma half-life of viloxazine ranges between 2-5 hours, while the
drug exhibits linear pharmacokinetics [138]. It is rapidly and almost
completely absorbed from the gastrointestinal tract. Viloxazine is metabolized
through hydroxylation, eventually followed by conjugation. The greatest part
of a single dose is excreted in urine (about 90% in 24 h), which contains
about 12 to 15% unchanged viloxazine, and 3% as its hydroxy metabolites,
while the rest is excreted as glucuronide conjugates of 5-hydroxyviloxazine or
hydroxylated 5-oxo metabolite.
I.7.13.3. Drug concentrations and clinical effects
The peak plasma concentration for viloxazine ranges from 5-10 μg/ml [56].
Steady state plasma concentrations of the drug have been reported to
increase significantly with age, however, this does not seem to have a clinical
impact.
I.7.13.4. Drug interactions, side-effects and toxicity
The most frequently reported side-effects of viloxazine are nausea and
vomiting [279], but also palpitation, anxiety, constipation and dryness of the
mouth are reported [280, 281].
Drug-drug interactions reported with viloxazine include anticonvulsants such
as carbamazepine and phenytoin. In addition, viloxazine decreases the
clearance of theophylline. These drug-drug interactions are due to inhibition
of CYP3A4, 2C9, 2C19 and 1A2 by viloxazine [138, 157].

Chapter I: Introduction: depression, use of antidepressants, and relevance of antidepressant monitoring
53
I.7.13.5. Analytical Methods
Viloxazine is determined by using liquid chromatographic or gas
chromatographic methods. While MSD [95], NPD [271, 282, 283], ECD or
FID are used in gas chromatography, UV [284]/ DAD [85] are applied in
liquid chromatography.
Solid phase extraction [95, 271] or liquid-liquid extractions [282-284] are
used as sample preparation techniques.
I.8. Relevance of antidepressant analysis in forensic toxicology
Although the new generation ADs have a low toxicity profile, analysis of
forensic samples is of interest. Dispite the high suicide rate amoung
depressed patients, acute intoxications with these new generation ADs in
healthy individuals are rare and mostly concern very high concentrations,
thus reflecting large intentional overdoses [39, 285, 286]. These highly
prescribed ADs, however, are frequently coadministered with other legal or
illegal drugs. Therefore, co-medication of these ADs can lead to synergy of
adverse reactions and symptoms, a changed drug concentration due to
inhibition or induction of CYP 450 isoenzymes, or result in a severe and
possible life threatening interaction. The most common lethal intoxication
observed for the new generation ADs is the serotonin syndrome. This
serotonin syndrome leads to agitation, mental status change, diaphoresis,
myoclonus, diarrhea, fever, hyperreflexia, tremor or incoordination and can
eventually lead to death. The syndrome is caused by excessive serotonin
levels that arise from an overdose of a serotonin reuptake inhibitor [287], but
also by therapeutic amounts of multiple drugs with reuptake inhibition of
serotonin, or by co-medication of a serotonin reuptake inhibitor and drugs
that interfere with the metabolism of serotonin such as MAOI [70, 288-290].
Deaths due to serotonin syndrome may also occur due to the presence of
predisposing factors, such as peripheral vascular disease, environmental
hyperthermia, or seizure disorder [39].
In forensics, different matrices are used to determine ADs as compared to
TDM. Blood is the most relevant post-mortem matrix as it gives a direct link

Chapter I: Introduction: depression, use of antidepressants, and relevance of antidepressant monitoring
54
between the compound concentration and the effect. Plasma can not be
obtained in most of the post-mortem cases, as plasma has to be separated
from the blood cells within 2 hours by centrifugation, thus before cell lysis
occurs. Brain tissue also has advantages as it is an isolated compartment in
which putrefaction is delayed. In addition, the metabolic activity is lower,
resulting in a more prominent presence of the original compounds as
compared to degradation products [291]. Urine and hair analysis is a
complementary approach to ADs detection as it yields a picture of long-term
exposure over a time window of several days to several months, respectively.
In addition, hair samples can be stored at room temperature for long periods
without degradation of the compounds inside [292-293].
I.9. References
[1] Murray CJL, Lopez AD. Global burden of disease: a comprehensive assessment of mortality and disability from diseases, injuries, and risk factors in 1990 and projected to 2020, Harvard University Press, Harvard, 1996
[2] Sampson SM. Treating depression with selective serotonin reuptake inhibitors: a practical approach. Mayo Clin. Proc. 2001; 76: 739-744
[3] Uges DRA, Conemans JMH. Antidepressants and antipsychotics. Handbook of Analytical Separations, Elsevier, Amsterdam, 2000, pp. 742
[4] Nestler EJ, Barrot M, DiLeone RJ, Eisch AJ, Gold SJ, Monteggia LM. Neurobiology of depression. Neuron. 2002; 34: 13-25
[5] Taylor C, Fricker AD, Devi LA, Gomes N. Mechanisms of action of antidepressants: from neurotransmitter systems to signaling pathways. Cell Signal. 2005; 17: 549-557
[6] Richelson E. Interactions of antidepressants with neurotransmitter transporters and receptors and their clinical relevance. J. Clin. Psychiatry 2003; 64: 5-12 Suppl. 13
[7] Richelson E. Pharmacology of antidepressants. Mayo Clin. Proc. 2001; 76: 511-527
[8] Schwaninger M, Weisbrod M, Knepel W. Progress in defining the mechanism of action of antidepressants - across receptors and into gene transcription. CNS Drugs 1997; 8: 237-243
[9] Vetulani J, Nalepa I. Antidepressants: past, present and future. Eur. J. Pharmacol. 2000; 405: 351-363
[10] Malberg JE, Blendy JA. Antidepressant action: to the nucleus and beyond. Trends Pharmacol. Sci. 2005; 26: 631-638
[11] Yildiz A, Gönül A, Tamam L. Mechanism of actions of antidepressants: beyond the receptors. Bull. Clin. Psychopharmacol. 2002; 12: 194-200

Chapter I: Introduction: depression, use of antidepressants, and relevance of antidepressant monitoring
55
[12] Frey BN, Rodrigues da Fonseca MM, Machado-Vieira R, Soarese JC, Kapczinski F. Neuropathological and neurochemical abnormalities in bipolar disorder. Rev. Bras. Psiquiatr. 2004; 26: 180-188
[13] Duman RS, Heninger GR, Nestler EJ. A molecular and cellular theory of depression. Arch. Gen. Psychiatry 1997; 54: 597-606
[14] Dwivedi Y, Rizavi HS, Conley RR, Roberts RC, Tamminga CA, Pandey GN. Altered gene expression of brain-derived neurotrophic factor and receptor tyrosine kinase B in postmortem brain of suicide subjects. Arch. Gen. Psychiatry 2003; 60: 804-815
[15] Pacher P, Kohegyi E, Kecskemeti V, Furst S. Current trends in the development of new antidepressants. Curr. Med. Chem. 2001; 8: 89-100
[16] Kent JM. SNaRIs, NaSSAs, and NaRIs: new agents for the treatment of depression. Lancet 2000; 355: 911-918
[17] Kent J. SNaRIs, NaSSAs, and NaRIs: new agents for the treatment of depression. Lancet 2000; 355: 2000-2000
[18] Mann JJ. Drug therapy - The medical management of depression. N. Engl. J. Med. 2005; 353: 1819-1834
[19] Vanharten J. Clinical pharmacokinetics of selective serotonin reuptake inhibitors. Clin. Pharmacokinet. 1993; 24: 203-220
[20] Masand PS, Gupta S. Selective serotonin-reuptake inhibitors: an update. Harv. Rev. Psychiatry 1999; 7: 69-84
[21] Rudorfer MV, Potter WZ. Metabolism of tricyclic antidepressants. Cell. Mol. Neurobiol. 1999; 19: 373-409
[22] Sproule BA, Naranjo CA, Bremner KE, Hassan PC. Selective serotonin reuptake inhibitors and CNS drug interactions - A critical review of the evidence. Clin. Pharmacokinet. 1997; 33: 454-471
[23] Nemeroff CB, DeVane CL, Pollock BG. Newer antidepressants and the cytochrome P450 system. Am. J. Psychiatry 1996; 153: 311-320
[24] Stahl SM. Mechanism of action of serotonin selective reuptake inhibitors - serotonin receptors and pathways mediate therapeutic effects and side effects. J. Affect. Disord. 1998; 51: 215-235
[25] Boyer WF, Shannon M. The serotonin syndrome. N. Engl. J. Med. 2005; 352: 1112-1119
[26] Harrigan RA, Brady WJ. ECG abnormalities in tricyclic antidepressant ingestion. Am. J. Emerg. Med. 1999; 17: 387-393
[27] Hardman J, Limberd L, Molinoff P, Ruddon R. Goodman and Gilman's the pharmacological basis of therapeutics In A. Goodman Gilman, Eds. Goodman and Gilman's the pharmacological basis of therapeutics 9th Ed. pp 1905. New York: McGraw-Hill, 1996
[28] Kerr GW, McGuffie AC, Wilkie S. Tricyclic antidepressant overdose: a review. Emerg. Med. J. 2001; 18: 236-241
[29] Thanacoody HK, Thomas SH. Tricyclic antidepressant poisoning: cardiovascular toxicity. Toxicol. Rev. 2005; 24: 236-241
[30] Glauser J. Tricyclic antidepressant poisoning. Cleve. Clin. J. Med. 2000; 67: 704-706
[31] Ray WA, Meredith S, Thapa PB, Hall K, Murray KT. Cyclic antidepressants and the risk of sudden cardiac death. Clin. Pharmacol. Ther. 2004; 75: 234-241

Chapter I: Introduction: depression, use of antidepressants, and relevance of antidepressant monitoring
56
[32] Roose SP. Treatment of depression in patients with heart disease. Biol. Psychiatry 2003; 54: 262-268
[33] Cohen HW, Gibson G, Alderman MH. Excess risk of myocardial infarction in patients treated with antidepressant medications: Association with use of tricyclic agents. Am. J. Med. 2000; 108: 2-8
[34] Denollet J, Sys SU, Stroobant N, Rombouts H, Gillebert TC, Brutsaert DL. Personality as independent predictor of long-term mortality in patients with coronary heart disease. Lancet 1996; 347: 417-421
[35] Roose SP. Depression, anxiety, and the cardiovascular system: the psychiatrist's perspective. J. Clin. Psychiatry 2001; 62: 19-23
[36] Roose SP. Considerations for the use of antidepressants in patients with cardiovascular disease. Am. Heart J. 2000; 140: 584-588
[37] Glassman AH. Cardiovascular effects of antidepressant drugs: Updated. Int.Clin. Psychopharmacol. 1998; 13: S25-S30
[38] Glassman AH. Cardiovascular effects of antidepressant drugs: Updated. J. Clin. Psychiatry 1998; 59: 13-18
[39] Goeringer KE, Raymon L, Christian GD, Logan BK. Postmortem forensic toxicology of selective serotonin reuptake inhibitors: A review of pharmacology and report of 168 cases. J. Forensic Sci. 2000; 45: 633-648
[40] Hiemke C, Hartter S. Pharmacokinetics of selective serotonin reuptake inhibitors. Pharmacol. Ther. 2000; 85: 11-28
[41] Cipriani A, Barbui C, Geddes JR. Suicide, depression, and antidepressants. BMJ 2005; 330: 373-374
[42] Licinio J, Wong ML. Depression, antidepressants and suicidality: a critical appraisal. Nat. Rev. Drug Discov 2005; 4: 165-171
[43] Whittington CJ, Kendall T, Fonagy P, Cottrell D, Cotgrove A, Boddington E. Selective serotonin reuptake inhibitors in childhood depression: systematic review of published versus unpublished data. Lancet 2004; 363: 1341-1345
[44] Goldstein DJ, Sundell K. A review of the safety of selective serotonin reuptake inhibitors during pregnancy. Hum. Psychopharmacol. 1999; 14: 319-324
[45] Gentile S. The safety of newer antidepressants in pregnancy and breastfeeding. Drug Saf. 2005; 28: 137-152
[46] Sanz EJ, De-las-Cuevas C, Kiuru A, Bate A, Edwards R. Selective serotonin reuptake inhibitors in pregnant women and neonatal withdrawal syndrome: a database analysis. Lancet 2005; 365: 482-487
[47] Ruchkin V, Martin A. SSRIs and the developing brain. Lancet 2005; 365: 451-453
[48] Burke MJ, Preskorn SH. Therapeutic drug monitoring of antidepressants - Cost implications and relevance to clinical practice. Clin. Pharmacokinet. 1999; 37: 147-165
[49] Lundmark J, Bengtsson F, Nordin C, Reis M, Walinder J. Therapeutic drug monitoring of selective serotonin reuptake inhibitors influences clinical dosing strategies and reduces drug costs in depressed elderly patients. Acta Psychiatr. Scand. 2000; 101: 354-359
[50] Mitchell PB. Therapeutic drug monitoring of psychotropic medications. Br. J. Clin. Pharmacol. 2000; 49: 303-312

Chapter I: Introduction: depression, use of antidepressants, and relevance of antidepressant monitoring
57
[51] Mitchell PB. Therapeutic drug monitoring of non-tricyclic antidepressant drugs. Clin. Chem. Lab. Med. 2004; 42: 1212-1218
[52] Eap CB, Sirot EJ, Baumann P. Therapeutic monitoring of antidepressants in the era of pharmacogenetics studies. Ther. Drug Monit. 2004; 26: 152-155
[53] Heller S, Hiemke C, Stroba G, Rieger-Gies A, Daum-Kreysch E, Sachse J, Hartter S. Assessment of storage and transport stability of new antidepressant and antipsychotic drugs for a nationwide TDM service. Ther. Drug Monit. 2004; 26: 459-461
[54] Decision Resources Inc. The Antidepressant Market through 2014 - Focus on emerging therapies and new indications. Cognos Plus Study no 11, Massechussets, 2005; pp 176
[55] Baumann P, Hiemke C, S. U, Eckermann G, Gaertner I, Kuss HJ, Laux G, Müller-Oerlinghausen B, Rao ML, Riederer P, Zernig G. The AGNP-TDM expert group consensus guidelines: therapeutic drug monitoring in psychiatry. Pharmacopsychiatry 2004; 37: 243-265
[56] TIAFT. The international association of forensic toxicologists. Tiaft bulletin 26 1S ( http: //www. tiaft. org/)
[57] Council of the royal pharmaceutical society of Great Britain. Martindale -The extra Pharmacopoeia. In K. Parfitt, A.V. Parsons, S.C. Sweetman, Eds. Martindale -The extra Pharmacopoeia, pp 2363. London: The Pharmaceutical Press, 1993
[58] Moffat AC, Osselton MD, Widdop B. Clarke's analysis of drugs and poisons in pharmaceuticals, body fluids and postmortem material. In Y.G. Laurent, Eds. Clarke's analysis of drugs and poisons in pharmaceuticals, body fluids and postmortem material, 3th Ed. pp 1935. London: Pharmaceutical Press, 2004
[59] Bezchlibnyk-Butler K, Aleksic I, Kennedy SH. Citalopram--a review of pharmacological and clinical effects. J. Psychiatry Neurosci. 2000; 25: 241-256
[60] Sanchez C, Bogeso KP, Ebert B, Reines EH, Braestrup C. Escitalopram versus citalopram: the surprising role of the R-enantiomer. Psychopharmacology 2004; 174: 163-176
[61] Kennedy SH, H.F. A, Lam RW. Efficacy of escitalopram in the treatment of major depressive disorder compared with conventional selective serotonin reuptake inhibitors and venlafaxine XR: a meta-analysis. J. Psychiatry Neurosci. 2006; 31: 122-131
[62] Brosen K, Naranjo C. Review of pharmacokinetic and pharmacodynamic interaction studies with citalopram. Eur. Neuropsychopharmacol. 2001; 11: 275-283
[63] Le Bloc'h Y, Woggon B, Weissenrieder H, Brawand-Amey M, Spagnoli J, Eap CB, Baumann P. Routine therapeutic drug monitoring in patients treated with 10-360 mg/day citalopram. Ther. Drug Monit. 2003; 25: 600-608
[64] FDA. http://www.fda.gov.
[65] Messer T, Schmauss M, Lambert-Baumann J. Efficacy and tolerability of reboxetine in depressive patients treated in routine clinical practice. CNS Drugs 2005; 19: 43-54
[66] Rochat B, Amey M, Gillet M, Meyer UA, Baumann P. Identification of three cytochrome P450 isozymes involved in N-demethylation of citalopram enantiomers in human liver microsomes. Pharmacogenetics 1997; 7: 1-10

Chapter I: Introduction: depression, use of antidepressants, and relevance of antidepressant monitoring
58
[67] Caccia S. Metabolism of the newer antidepressants - An overview of the pharmacological and pharmacokinetic implications. Clin. Pharmacokinet. 1998; 34: 281-302
[68] Barak Y, Swartz M, Levy D, Weizman R. Age-related differences in the side effect profile of citalopram. Prog. Neuropsychopharmacol. Biol. Psychiatry 2003; 27: 545-548
[69] Joubert AF, Sanchez C, Larsen F. Citalopram. Hum. Psychopharmacol. 2000; 15: 439-451
[70] Dams R, Benijts THP, Lambert WE, Van Bocxlaer JF, Van Varenbergh D, Peteghem CV, De Leenheer AP. A fatal case of serotonin syndrome after combined moclobemide-citalopram intoxication. J. Anal. Toxicol. 2001; 25: 147-151
[71] Jonasson B, Saldeen T. Citalopram in fatal poisoning cases. Forensic Sci. Int. 2002; 126: 1-6
[72] Andersen S, Halvorsen TG, Pedersen-Bjergaard S, Rasmussen KE, Tanum L, Refsum H. Stereospecific determination of citalopram and desmethylcitalopram by capillary electrophoresis and liquid-phase microextraction. J. Pharm. Biomed. Anal. 2003; 33: 263-273
[73] Singh SS, Shah H, Gupta S, Jain M, Sharma K, Thakkar P, Shah R. Liquid chromatography-electrospray ionisation mass spectrometry method for the determination of escitalopram in human plasma and its application in bioequivalence study. J. Chromatogr. B Biomed. Sci. Appl. 2004; 811: 209-215
[74] Rasmussen BB, Brosen K. Is therapeutic drug monitoring a case for optimizing clinical outcome and avoiding interactions of the selective serotonin reuptake inhibitors? Ther. Drug Monit. 2000; 22: 143-154
[75] Zheng ZC, Jamour M, Klotz U. Stereoselective HPLC-assay for citalopram and its metabolites. Ther. Drug Monit. 2000; 22 219-224
[76] Eap CB, Baumann P. Analytical methods for the quantitative determination of selective serotonin reuptake inhibitors for therapeutic drug monitoring purposes in patients. J. Chromatogr. B Biomed. Appl. 1996; 686: 51-63
[77] Haupt D. Determination of citalopram enantiomers in human plasma by liquid chromatographic separation on a Chiral-AGP column. J. Chromatogr. B Biomed. Sci. Appl. 1996; 685: 299-305
[78] El-Gindy A, Emara S, Mesbah MK, Hadad GM. Liquid chromatography determination of citalopram enantiomers using beta-cyclodextrin as a chiral mobile phase additive. J. AOAC Int. 2006; 89: 65-70
[79] Baumann P. Pharmacokinetic-pharmacodynamic relationship of the selective serotonin reuptake inhibitors. Clin. Pharmacokinet. 1996; 31: 444-469
[80] Lacassie E, Gaulier JM, Marquet P, Rabatel JF, Lachatre G. Methods for the determination of seven selective serotonin reuptake inhibitors and three active metabolites in human serum using high-performance liquid chromatography and gas chromatography. J. Chromatogr. B Biomed. Sci. Appl. 2000; 742: 229-238
[81] Eap CB, Bouchoux G, Amey M, Cochard N, Savary L, Baumann P. Simultaneous determination of human plasma levels of citalopram, paroxetine, sertraline, and their metabolites by gas chromatography mass spectrometry. J. Chromatogr. Sci. 1998; 36: 365-371
[82] Salgado-Petinal C, Lamas JP, Garcia-Jares C, Llompart M, Cela R. Rapid screening of selective serotonin re-uptake inhibitors in urine samples using

Chapter I: Introduction: depression, use of antidepressants, and relevance of antidepressant monitoring
59
solid-phase microextraction gas chromatography-mass spectrometry. Anal.Bioanal. Chem. 2005; 382: 1351-1359
[83] Frahnert C, Rao ML, Grasmader K. Analysis of eighteen antidepressants, four atypical antipsychotics and active metabolites in serum by liquid chromatography: a simple tool for therapeutic drug monitoring. J. Chromatogr. B Analyt. Technol. Biomed. Life Sci. 2003; 794: 35-47
[84] Tournel G, Houdret N, Hedouin V, Deveaux M, Gosset D, Lhermitte M. High-performance liquid chromatographic method to screen and quantitate seven selective serotonin reuptake inhibitors in human serum. J. Chromatogr. B Biomed. Sci. Appl. 2001; 761: 147-158
[85] Duverneuil C, de la Grandmaison GL, de Mazancourt P, Alvarez JC. A high-performance liquid chromatography method with photodiode-array UV detection for therapeutic drug monitoring of the nontricyclic antidepressant drugs. Ther. Drug Monit. 2003; 25: 565-573
[86] Titier K, Castaing N, Scotto-Gomez E, Pehourcq F, Moore N, Molimard M. High-performance liquid chromatographic method with diode array detection for identification and quantification of the eight new antidepressants and five of their active metabolites in plasma after overdose. Ther. Drug Monit. 2003; 25: 581-587
[87] Kristoffersen L, Bugge A, Lundanes E, Slordal L. Simultaneous determination of citalopram, fluoxetine, paroxetine and their metabolites in plasma and whole blood by high-performance liquid chromatography with ultraviolet and fluorescence detection. J. Chromatogr. B Biomed. Sci. Appl. 1999; 734: 229-246
[88] Macek J, Ptacek P, Klima J. Rapid determination of citalopram in human plasma by high-performance liquid chromatography. J. Chromatogr. B Biomed. Sci. Appl. 2001; 755 279-285
[89] Raggi MA, Pucci V, Mandrioli R, Sabbioni C, Fanali S. Determination of recent antidepressant citalopram in human plasma by liquid chromatography - Fluorescence detection. Chromatographia 2003; 57: 273-278
[90] Meng QH, Gauthier D. Simultaneous analysis of citalopram and desmethylcitalopram by liquid chromatography with fluorescence detection after solid-phase extraction. Clin. Biochem. 2005; 38: 282-285
[91] Gutteck U, Rentsch KM. Therapeutic drug monitoring of 13 antidepressant and five neuroleptic drugs in serum with liquid chromatography-electrospray ionization mass spectrometry. Clin. Chem. Lab. Med. 2003; 41: 1571-1579
[92] He J, Zhou ZL, Li HD. Simultaneous determination of fluoxetine, citalopram, paroxetine, venlafaxine in plasma by high performance liquid chromatography-electrospray ionization mass spectrometry (HPLC-MS/ESI). J.Chromatogr. B Biomed. Sci. Appl. 2005; 820: 33-39
[93] Kollroser M, Schober C. An on-line solid phase extraction - liquid chromatography - tandem mass spectrometry method for the analysis of citalopram, fluvoxamine, and paroxetine in human plasma. Chromatographia 2003; 57: 133-138
[94] Martinez MA, de la Torre CS, Almarza E. A comparative solid-phase extraction study for the simultaneous determination of fluvoxamine, mianserin, doxepin, citalopram, paroxetine, and etoperidone in whole blood by capillary gas-liquid chromatography with nitrogen-phosphorus detection. J. Anal. Toxicol. 2004; 28: 174-180
[95] Wille SMR, Maudens KE, Van Peteghem CH, Lambert WEE. Development of a solid phase extraction for 13 'new' generation antidepressants and their active

Chapter I: Introduction: depression, use of antidepressants, and relevance of antidepressant monitoring
60
metabolites for gas chromatographic-mass spectrometric analysis. J. Chromatogr. A 2005; 1098: 19-29
[96] Cheer SM, Goa KL. Fluoxetine - A review of its therapeutic potential in the treatment of depression associated with physical illness. Drugs 2001; 61: 81-110
[97] Mhanna MJ, Bennet JB, Izatt SD. Potential fluoxetine chloride (Prozac) toxicity in a newborn. Pediatrics 1997; 100: 158-159
[98] Messiha FS. Fluoxetine - adverse-effects and drug-drug interactions. J.Toxicol. Clin. Toxicol. 1993; 31: 603-630
[99] Stokes PE, Holtz A. Fluoxetine tenth anniversary update: the progress continues. Clin. Ther. 1997; 19: 1135-1250
[100] Spina E, Scordo MG, D'Arrigo C. Metabolic drug interactions with new psychotropic agents. Fundam. Clin. Pharmacol. 2003; 17: 517-538
[101] Nevado JJB, Salcedo AMC, Llerena MJV. Micellar electrokinetic capillary chromatography for the determination of fluoxetine and its metabolite norfluoxetine in biological fluids. J. Chromatogr. B Analyt. Technol. Biomed. Life Sci. 2002; 769: 261-268
[102] Eap CB, Gaillard N, Powell K, Baumann P. Simultaneous determination of plasma levels of fluvoxamine and of the enantiomers of fluoxetine and norfluoxetine by gas chromatography mass spectrometry. J. Chromatogr. B Biomed. Appl. 1996; 682: 265-272
[103] Ulrich S. Direct stereoselective assay of fluoxetine and norfluoxetine enantiomers in human plasma or serum by two-dimensional gas-liquid chromatography with nitrogen-phosphorus selective detection. J. Chromatogr. B Analyt. Technol. Biomed. Life Sci. 2003; 783: 481-490
[104] Pichini S, Pacifici R, Altieri I, Pellegrini M, Zuccaro P. Stereoselective determination of fluoxetine and norfluoxetine enantiomers in plasma samples by high-performance liquid chromatography. J. Liq. Chromatogr. Relat. Technol. 1996; 19: 1927-1935
[105] Olsen BA, Wirth DD, Larew JS. Determination of fluoxetine hydrochloride enantiomeric excess using high-performance liquid chromatography with chiral stationary phases. J. Pharm. Biomed. Anal. 1998; 17: 623-630
[106] Yu HW, Ching CB. Kinetic and equilibrium study of the enantioseparation of fluoxetine on a new beta-cyclodextrin column by high performance liquid chromatography. Chromatographia 2001; 54: 697-702
[107] Gatti G, Bonomi I, Marchiselli R, Fattore C, Spina E, Scordo G, Pacifici R, Perucca E. Improved enantioselective assay for the determination of fluoxetine and norfluoxetine enantiomers in human plasma by liquid chromatography. J. Chromatogr. B Analyt. Technol. Biomed. Life Sci. 2003; 784: 375-383
[108] Fukushima T, Naka-aki E, Guo XJ, Li FM, Vankeirsbilck T, Baeyens WRG, Imai K, Toyo'oka T. Determination of fluoxetine and norfluoxetine in rat brain microdialysis samples following intraperitoneal fluoxetine administration. Anal. Chim. Acta. 2005; 531: 163-163
[109] Fontanille P, Jourdil N, Villier C, Bessard G. Direct analysis of fluoxetine and norfluoxetine in plasma by gas chromatography with nitrogen-phosphorus detection. J. Chromatogr. B Biomed. Sci. Appl. 1997; 692: 337-343
[110] Ulrich S. Direct stereoselective assay of fluoxetine and norfluoxetine enantiomers in human plasma by two-dimensional gas chromatography with nitrogen-phosphorus selective detection. Pharmacopsychiatry 2002; 35: XI-XI

Chapter I: Introduction: depression, use of antidepressants, and relevance of antidepressant monitoring
61
[111] Martinez MA, de la Torre CS, Almarza E. A comparative solid-phase extraction study for the simultaneous determination of fluoxetine, amitriptyline, nortriptyline, trimipramine, maprotiline, clomipramine, and trazodone in whole blood by capillary gas-liquid chromatography with nitrogen-phosphorus detection. J. Anal. Toxicol. 2003; 27: 353-358
[112] Lefebvre M, Marchand M, Horowitz JM, Torres G. Detection of fluoxetine in brain, blood, liver and hair of rats using gas chromatography mass spectrometry. Life Sci. 1999; 64: 805-811
[113] Fathi M, Duparc MT, Morch F, Jayo M, Martin C, Hochstrasser D. Simultaneous determination of fluoxetine, norfluoxetine, paroxetine, sertraline and reboxetine in serum as acetvlated derivatives by gas chromatography-selected ion monitoring mass spectrometry (GC-SIM-MS). Ther. Drug Monit. 2005; 27: 217-218
[114] Holladay JW, Dewey MJ, Yoo SD. Quantification of fluoxetine and norfluoxetine serum levels by reversed-phase high-performance liquid chromatography with ultraviolet detection. J. Chromatogr. B Biomed. Sci. Appl. 1997; 704: 259-263
[115] Alvarez JC, Bothua D, Colignon I, Advenier C, Spreux-Varoquaux O. Determination of fluoxetine and its metabolite norfluoxetine in serum and brain areas using high-performance liquid chromatography with ultraviolet detection. J. Chromatogr. B Biomed. Sci. Appl. 1998; 707: 175-180
[116] Meineke I, Schreeb K, Kress I, Gundert-Remy U. Routine measurement of fluoxetine and norfluoxetine by high-performance liquid chromatography with ultraviolet detection in patients under concomitant treatment with tricyclic antidepressants. Ther. Drug Monit. 1998; 20: 14-19
[117] Molander P, Thomassen A, Kristoffersen L, Greibrokk T, Lundanes E. Simultaneous determination of citalopram, fluoxetine, paroxetine and their metabolites in plasma by temperature-programmed packed capillary liquid chromatography with on-column focusing of large injection volumes. J.Chromatogr. B Analyt. Technol. Biomed. Life Sci. 2002; 766: 77-87
[118] Llerena A, Dorado P, Berecz R, Gonzalez A, Norberto MJ, de la Rubia A, Caceres M. Determination of fluoxetine and norfluoxetine in human plasma by high-performance liquid chromatography with ultraviolet detection in psychiatric patients. J. Chromatogr. B Analyt. Technol. Biomed. Life Sci. 2003; 783: 25-31
[119] Li KM, Thompson MR, McGregor IS. Rapid quantitation of fluoxetine and norfluoxetine in serum by micro-disc solid-phase extraction with high-performance liquid chromatography-ultraviolet absorbance detection. J.Chromatogr. B Analyt. Technol. Biomed. Life Sci. 2004; 804: 319-326
[120] Clausing P, Rushing LG, Newport GD, Bowyer JF. Determination of D-fenfluramine, D-norfenfluramine and fluoxetine in plasma, brain tissue and brain microdialysate using high-performance liquid chromatography after precolumn derivatization with dansyl chloride. J. Chromatogr. B Biomed. Sci Appl. 1997; 692: 419-426
[121] Raggi MA, Mandrioli R, Casamenti G, Bugamelli F, Volterra V. Determination of fluoxetine and norfluoxetine in human plasma by high-pressure liquid chromatography with fluorescence detection. J. Pharm. Biomed. Ana.l 1998; 18: 193-199
[122] Vlase L, Imre S, Leucuta S. Determination of fluoxetine and its N-desmethyl metabolite in human plasma by high-performance liquid chromatography. Talanta 2005; 66: 659-663

Chapter I: Introduction: depression, use of antidepressants, and relevance of antidepressant monitoring
62
[123] Moraes MO, Lerner FE, Corso G, Bezzerra FAF, Moraes MEA, De Nucci G. Fluoxetine bioequivalence study: Quantification of fluoxetine and norfluoxetine by liquid chromatography coupled to mass spectrometry. J. Clin. Pharmacol. 1999; 39: 1053-1061
[124] Sutherland FCW, Badenhorst D, de Jager AD, Scanes T, Hundt HKL, Swart KJ, Hundt AF. Sensitive liquid chromatographic-tandem mass spectrometric method for the determination of fluoxetine and its primary active metabolite norfluoxetine in human plasma. J. Chromatogr. A 2001; 914: 45-51
[125] Li C, Ji ZH, Nan FJ, Shao QX, Liu P, Dai JY, Zhen J, Yuan H, Xu F, Cui J, Huang B, Zhang MY, Yu C. Liquid chromatography/tandem mass spectrometry for the determination of fluoxetine and its main active metabolite norfluoxetine in human plasma with deuterated fluoxetine as internal standard. RapidCommun. Mass Spectrom. 2002; 16: 1844-1850
[126] Green R, Houghton R, Scarth J, Gregory C. Determination of fluoxetine and its major active metabolite norfluoxetine in human plasma by liquid chromatography-tandem mass spectrometry. Chromatographia 2002; 55: S133-S136
[127] Shen ZZ, Wang S, Bakhtiar R. Enantiomeric separation and quantification of fluoxetine (Prozac ®) in human plasma by liquid chromatography/tandem mass spectrometry using liquid-liquid extraction in 96-well plate format. Rapid Commun. Mass Spectrom. 2002; 16: 332-338
[128] Cheer SM, Figgitt DR. Spotlight on fluvoxamine in anxiety disorders in children and adolescents. CNS Drugs 2002; 16: 139-144
[129] Figgitt DP, McClellan KJ. Fluvoxamine - An updated review of its use in the management of adults with anxiety disorders. Drugs 2000; 60: 925-954
[130] Spigset O, Axelsson S, Norstrom A, Hagg S, Dahlqvist R. The major fluvoxamine metabolite in urine is formed by CYP2D6. Eur. J. Clin. Pharmacol. 2001; 57: 653-658
[131] Richelson E. Pharmacokinetic drug interactions of new antidepressants: a review of the effects on the metabolism of other drugs. Mayo Clin. Proc. 1997; 72: 835-847
[132] Carrasco JL, Sandner C. Clinical effects of pharmacological variations in selective serotonin reuptake inhibitors: an overview. Int. J. Clin. Pract. 2005; 59: 1428-1434
[133] Hartter S, Wetzel H, Hammes E, Torkzadeh M, Hiemke C. Serum concentrations of fluvoxamine and clinical effects - A prospective open clinical trial. Pharmacopsychiatry 1998; 31: 199-200
[134] Preskorn SH. Clinically relevant pharmacology of selective serotonin reuptake inhibitors - An overview with emphasis on pharmacokinetics and effects on oxidative drug metabolism. Clin. Pharmacokinet. 1997; 32: 1-21
[135] Devries MH, Raghoebar M, Mathlener IS, Vanharten J. Single and Multiple Oral Dose Fluvoxamine Kinetics in Young and Elderly Subjects. Ther. Drug Monit. 1992; 14: 493-498
[136] Vanharten J, Duchier J, Devissaguet JP, Vanbemmel P, Devries MH, Raghoebar M. Pharmacokinetics of fluvoxamine maleate in patients with liver-cirrhosis after single-dose oral-administration. Clin. Pharmacokinet. 1993; 24: 177-182
[137] Spigset O, Hagg S. Excretion of psychotropic drugs into breast milk - pharmacokinetic overview and therapeutic implications. CNS Drugs 1998; 9: 111-134

Chapter I: Introduction: depression, use of antidepressants, and relevance of antidepressant monitoring
63
[138] Goodnick PJ. Pharmacokinetic optimization of therapy with newer antidepressants. Clin. Pharmacokinet. 1994; 27: 307-330
[139] Perucca E, Gatti G, Spina E. Clinical pharmacokinetics of fluvoxamine. Clin. Pharmacokinet. 1994; 27: 175-190
[140] Labat L, Deveaux M, Dallet P, Dubost JP. Separation of new antidepressants and their metabolites by micellar electrokinetic capillary chromatography. J.Chromatogr. B Analyt. Technol. Biomed. Life Sci. 2002; 773: 17-23
[141] Maurer HH, Bickeboeller-Friedrich J. Screening procedure for detection of antidepressants of the selective serotonin reuptake inhibitor type and their metabolites in urine as part of a modified systematic toxicological analysis procedure using cas chromatography-mass spectrometry. J. Anal. Toxicol. 2000; 24: 340-347
[142] Rotzinger S, Todd KG, Bourin M, Coutts RT, Baker GB. A rapid electron-capture gas chromatographic method for the quantification of fluvoxamine in brain tissue. J. Pharmacol. Toxicol. Methods 1997; 37: 129-133
[143] Hostetter AL, Stowe ZN, Cox M, Ritchie JC. A novel system for the determination of antidepressant concentrations in human breast milk. Ther.Drug Monit. 2004; 26: 47-52
[144] Hostetter A, Ritchie JC, Stowe ZN. Amniotic fluid and umbilical cord blood concentrations of antidepressants in three women. Biol. Psychiatry 2000; 48: 1032-1034
[145] Rodriguez J, Berzas JJ, Contento AM, Cabello MP. Capillary gas chromatographic determination of tamoxifen in the presence of a number of antidepressants in urine. J. Sep. Sci. 2003; 26: 915-922
[146] Bagli M, Rao ML, Sobanski T, Laux G. Determination of fluvoxamine and paroxetine in human serum with highperformance liquid chromatography and ultraviolet detection. J. Liq. Chromatogr. Relat. Technol. 1997; 20: 283-295
[147] Palego L, Marazziti D, Biondi L, Giannaccini G, Sarno N, Armani A, Lucacchini A, Cassano GB, Dell'Osso L. Simultaneous plasma level analysis of clomipramine, N-desmethylclomipramine, and fluvoxamine by reversed-phase liquid chromatography. Ther. Drug Monit. 2000; 22: 190-194
[148] Skibinski R, Misztal G, Olajossy M. High performance liquid chromatographic determination of fluvoxamine and paroxetine in plasma. Chem. Analityczna 2000; 45: 815-823
[149] Dallet P, Labat L, Richard M, Langlois MH, Dubost JP. A reversed-phase HPLC method development for the separation of new antidepressants. J. Liq. Chromatogr. Relat. Technol. 2002; 25: 101-111
[150] Ohkubo T, Shimoyama R, Otani K, Yoshida K, Higuchi H, Shimizu T. High-performance liquid chromatographic determination of fluvoxamine and fluvoxamino acid in human plasma. Anal. Sci. 2003; 19: 859-864
[151] Lucca A, Gentilini G, Lopez-Silva S, Soldarini A. Simultaneous determination of human plasma levels of four selective serotonin reuptake inhibitors by high-performance liquid chromatography. Ther. Drug Monit. 2000; 22: 271-276
[152] Higashi Y, Matsumura H, Fujii Y. Determination of fluvoxamine in rat plasma by HPLC with pre-column derivatization and fluorescence detection using 4-fluoro-7-nitro-2,1,3-benzoxadiazole. Biomed. Chromatogr. 2005; 19: 771-776
[153] Lamas JP, Salgado-Petinal C, Garcia-Jares C, Llompart M, Cela R, Gomez M. Solid-phase microextraction-gas chromatography-mass spectrometry for the analysis of selective serotonin reuptake inhibitors in environmental water. J.Chromatogr. A 2004; 1046: 241-247

Chapter I: Introduction: depression, use of antidepressants, and relevance of antidepressant monitoring
64
[154] Barri T, Jonsson JA. Supported liquid membrane work-up of blood plasma samples coupled on-line to liquid chromatographic determination of basic antidepressant drugs. Chromatographia 2004; 59: 161-165
[155] Pinder RM, Brogden RN, Speight TM, Avery GS. Maprotiline - Review of Its Pharmacological Properties and Therapeutic Efficacy in Mental Depressive States. Drugs 1977; 13: 321-352
[156] Brachtendorf L, Jetter A, Beckurts KT, Holscher AH, Fuhr U. Cytochrome P-450 enzymes contributing to demethylation of maprotiline in man. Pharmacol. Toxicol. 2002; 90: 144-149
[157] Rotzinger S, Bourin M, Akimoto Y, Coutts RT, Baker GB. Metabolism of some "second"- and "fourth"-generation antidepressants: Iprindole, viloxazine, bupropion, mianserin, maprotiline, trazodone, nefazodone, and venlafaxine. Cell. Mol. Neurobiol. 1999; 19: 427-442
[158] Drebit R, Baker GB, Dewhurst WG. Determination of Maprotiline and Desmethylmaprotiline in Plasma and Urine by Gas-Chromatography with Nitrogen Phosphorus Detection. J. Chromatogr. B 1988; 432: 334-339
[159] Ulrich S, Martens J. Solid-phase microextraction with capillary gas-liquid chromatography and nitrogen-phosphorus selective detection for the assay of antidepressant drugs in human plasma J. Chromatogr. B 1997; 696 217-234
[160] Keller T, Zollinger U. Gas chromatographic examination of postmortem specimens after maprotiline intoxication. Forensic Sci. Int. 1997; 88: 117-123
[161] Bakkali A, Corta E, Ciria JI, Berrueta LA, Gallo B, Vicente F. Solid-phase extraction with liquid chromatography and ultraviolet detection for the assay of antidepressant drugs in human plasma. Talanta 1999; 49: 773-783
[162] Oztunc A, Onal A, Erturk S. 7,7,8,8-Tetracyanoquinodimethane as a new derivatization reagent for high-performance liquid chromatography and thin-layer chromatography: rapid screening of plasma for some antidepressants. J. Chromatogr. B 2002; 774: 149-155
[163] Aymard G, Livi P, Pham YT, Diquet B. Sensitive and rapid method for the simultaneous quantification of five antidepressants with their respective metabolites in plasma using high-performance liquid chromatography with diode-array detection. J. Chromatogr. B 1997; 700: 183-189
[164] Waschgler R, Hubmann MR, Conca A, Moll W, Konig P. Simultaneous quantification of citalopram, clozapine, fluoxetine, norfluoxetine, maprotiline, desmethylmaprotiline and trazodone in human serum by HPLC analysis. Int. J. Clin. Pharmacol. Ther. 2002; 40: 554-559
[165] Cakrt M, Buzinkaiova T, Polonsky J, Korinkova V. Spectrofluorimetric and isotachophoretic determination of maprotiline in human blood serum. Electrophoresis 2000; 21: 2834-2838
[166] Eap CB, Yasui N, Kaneko S, Baumann P, Powell K, Otani K. Effects of carbamazepine coadministration on plasma concentrations of the enantiomers of mianserin and of its metabolites. Ther. Drug Monit. 1999; 21: 166-170
[167] Otani K, Mihara K, Okada M, Tanaka O, Kaneko S, Fukushima Y. Prediction of plasma-concentrations of mianserin and desmethylmianserin at steady-state from those after an initial dose of mianserin. Ther. Drug Monit. 1993; 15: 118-121
[168] Wakeling A. Efficacy and side-effects of mianserin, a tetracyclic anti-depressant. Postgrad. Med. J. 1983; 59: 229-231
[169] Nawishy S, Hathway N, Turner P. Interactions of anticonvulsant drugs with mianserin and nomifensine. Lancet 1981; 2: 871-872

Chapter I: Introduction: depression, use of antidepressants, and relevance of antidepressant monitoring
65
[170] Eap CB, Powell K, Baumann P. Determination of the enantiomers of mianserin and its metabolites in plasma by capillary electrophoresis after liquid-liquid extraction and on-column sample preconcentration. J. Chromatogr. Sci. 1997; 35: 315-320
[171] Tybring G, Otani K, Kaneko S, Mihara K, Fukushima Y, Bertilsson L. Enantioselective determination of mianserin and its desmethyl metabolite in plasma during treatment of depressed japanese patients. Ther. Drug Monit. 1995; 17: 516-521
[172] Vink J, Vanhal HJM. Simplified method for determination of the tetracyclic anti-depressant mianserin in human-plasma using gas-chromatography with nitrogen detection. J Chromatogr 1980; 181: 25-31
[173] Wong SHY, Waugh SW, Draz M, Jain N. Liquid-chromatographic determination of 2 antidepressants, trazodone and mianserin, in plasma. Clin. Chem. 1984; 30: 230-233
[174] Hefnawy MM, Aboul-Enein HY. Fast high-performance liquid chromatographic analysis of mianserin and its metabolites in human plasma using monolithic silica column and solid phase extraction. Anal. Chim. Acta 2004; 504: 291-297
[175] Wolf C, Schmid R. Liquid-chromatographic determination of mianserin in plasma by fluorescence detection after online photochemical-reaction. J.Pharm. Biomed. Anal. 1990; 8: 1059-1061
[176] Chauhan B, Rani S, Guttikar S, Zope A, Jadon N, Padh H. Analytical method development and validation of mianserin hydrochloride and its metabolite in human plasma by LC-MS. J. Chromatogr. B Analyt. Techno.l Biomed. Life Sci. 2005; 823: 69-74
[177] Brown LW, Hundt HKL, Swart KJ. Automated high-performance liquid-chromatographic method for the determination of mianserin in plasma using electrochemical detection. J. Chromatogr. 1992; 582: 268-272
[178] Holm KJ, Markham A. Mirtazapine - A review of its use in major depression. Drugs 1999; 57: 607-631
[179] Fawcett J, Barkin RL. Review of the results from clinical studies on the efficacy, safety and tolerability of mirtazapine for the treatment of patients with major depression. J. Affect. Disord. 1998; 51: 267-285
[180] Timmer CJ, Sitsen JMA, Delbressine LP. Clinical pharmacokinetics of mirtazapine. Clin. Pharmacokinet. 2000; 38: 461-474
[181] Grasmader K, Verwohlt PL, Kuhn KU, Frahnert C, Hiemke C, Dragicevic A, von Widdern O, Zobel A, Maier W, Rao ML. Relationship between mirtazapine dose, plasma concentration, response, and side effects in clinical practice. Pharmacopsychiatry 2005; 38: 113-117
[182] Puzantian T. Mirtazapine, an antidepressant. Am. J. Health Syst. Pharm. 1998; 55: 44-49
[183] Kasper S, PraschakRieder N, Tauscher J, Wolf R. A risk-benefit assessment of mirtazapine in the treatment of depression. Drug Saf. 1997; 17: 251-264
[184] Ruwe FJL, Smulders RA, Kleijn HJ, Hartmans HLA, Sitsen JMA. Mirtazapine and paroxetine: a drug-drug interaction study in healthy subjects. Hum.Psychopharmacol. 2001; 16: 449-459
[185] Sennef C, Timmer CJ, Sitsen JAA. Mirtazapine in combination with amitriptyline: a drug-drug interaction study in healthy subjects. Hum.Psychopharmacol. 2003; 18: 91-101

Chapter I: Introduction: depression, use of antidepressants, and relevance of antidepressant monitoring
66
[186] Mandrioli R, Pucci V, Sabbioni C, Bartoletti C, Fanali S, Raggi MA. Enantioselective determination of the novel antidepressant mirtazapine and its active demethylated metabolite in human plasma by means of capillary electrophoresis. J. Chromatogr. A 2004; 1051: 253-260
[187] Romiguieres T, Pehourcq F, Matoga M, Begaud B, Jarry C. Determination of mirtazapine and its demethyl metabolite in plasma by high-performance liquid chromatography with ultraviolet detection. J. Chromatogr. B Analyt. Technol. Biomed. Life Sci. 2002; 775: 163-168
[188] Morgan PE, Tapper J, Spencer EP. Rapid and sensitive analysis of mirtazapine & normirtazapine in plasma/serum by HPLC with fluorescence detection. J.Psychopharmacol. 2002; 16: A64-A64
[189] Shams M, Hartter S, Hiemke C. Column switching and high performance liquid chromatography [HPLC] with fluorescence detection for automated analysis of venlafaxine, mirtazapine and demethylated metabolites in blood serum or plasma. Pharmacopsychiatry 2002; 35: X-X
[190] Ptacek P, Klima J, Macek J. Determination of mirtazapine in human plasma by liquid chromatography. J. Chromatogr. B Analyt. Technol. Biomed. Life Sci 2003; 794: 323-328
[191] Pistos C, Koutsopoulou M, Panderi I. A validated liquid chromatographic tandem mass spectrometric method for the determination of mirtazapine and demethylmirtazapine in human plasma: application to a pharmacokinetic study. Anal. Chim. Acta 2004; 514: 15-26
[192] Paus E, Jonzier-Perey M, Cochard N, Eap CB, Baumann P. Chirality in the new generation of antidepressants - Stereoselective analysis of the enantiomers of mirtazapine, N-demethylmirtazapine, and 8-hydroxymirtazapine by LC-MS. Ther. Drug Monit. 2004; 26: 366-374
[193] de Santana FJM, de Oliveira ARM, Bonato PS. Chiral liquid chromatographic determination of mirtazapine in human plasma using two-phase liquid-phase microextraction for sample preparation. Anal. Chim. Acta 2005; 549: 96-103
[194] Mandrioli R, Mercolini L, Ghedini N, Bartoletti C, Fanali S, Raggi MA. Determination of the antidepressant mirtazapine and its two main metabolites in human plasma by liquid chromatography with fluorescence detection. Anal.Chim. Acta 2006; 556: 281-288
[195] Paterson S, Cordero R, Burlinson S. Screening and semi-quantitative analysis of postmortem blood for basic drugs using gas chromatography/ion trap mass spectrometry. J. Chromatogr. B Analyt. Technol. Biomed. Life Sci. 2004; 813: 323-330
[196] Bickeboeller-Friedrich J, Maurer HH. Screening for detection of new antidepressants, neuroleptics, hypnotics, and their metabolites in urine by GC-MS developed using rat liver microsomes. Ther. Drug Monit. 2001; 23: 61-70
[197] Dodd S, Burrows GD, Norman TR. Chiral determination of mirtazapine in human blood plasma by high-performance liquid chromatography. JChromatogr B Biomed Sci Appl 2000; 748: 439-443
[198] Wagstaff AJ, Cheer SM, Matheson AJ. Paroxetine: an update of its use in psychiatric disorders in adults (vol 62, pg 655, 2002). Drugs 2002; 62: 1461-1461
[199] Wagstaff AJ, Cheer SM, Matheson AJ, Ormrod D, Goa KL. Spotlight on paroxetine in psychiatric disorders in adults. CNS Drugs 2002; 16: 425-434
[200] Caley CF, Weber SS. Paroxetine- a selective reuptake inhibiting antidepressant. Ann. Pharmacother. 1993; 27: 1212-1222

Chapter I: Introduction: depression, use of antidepressants, and relevance of antidepressant monitoring
67
[201] Gunasekara NS, Noble S, Benfield P. Paroxetine - an update of its pharmacology and therapeutic use in depression and a review of its use in other disorders. Drugs 1998; 55: 85-120
[202] Lai CT, Gordon ES, Kennedy SH, Bateson AN, Coutts RT, Baker GB. Determination of paroxetine levels in human plasma using gas chromatography with electron-capture detection. J. Chromatogr. B Biomed. Sci. Appl. 2000; 749: 275-279
[203] Leis HJ, Windischhofer W, Raspotnig G, Fauler G. Stable isotope dilution negative ion chemical ionization gas chromatography-mass spectrometry for the quantitative analysis of paroxetine in human plasma. J. Mass Spectrom. 2001; 36: 923-928
[204] Leis HJ, Windischhofer W, Fauler G. Improved sample, preparation for the quantitative analysis of paroxetine in human plasma by stable isotope dilution negative ion chemical ionisation gas chromatography-mass spectrometry. J.Chromatogr. B Analyt. Technol. Biomed. Life Sci. 2002; 779: 353-357
[205] Foglia JP, Sorisio D, Kirshner M, Pollock BG. Quantitative determination of paroxetine in plasma by high-performance liquid chromatography and ultraviolet detection. J. Chromatogr. B Biomed. Sci. Appl. 1997; 693: 147-151
[206] Zainaghi IA, Lanchote VL, Queiroz RHC. Determination of paroxetine in geriatric depression by high-performance liquid chromatography. Pharmacol. Res. 2003; 48: 217-221
[207] Shin JG, Kim KA, Yoon YR, Cha IJ, Kim YH, Shin SG. Rapid simple high-performance liquid chromatographic determination of paroxetine in human plasma. J. Chromatogr. B Biomed. Sci. Appl. 1998; 713: 452-456
[208] Lopez-Calull C, Dominguez N. Determination of paroxetine in plasma by high-performance liquid chromatography for bioequivalence studies. J. Chromatogr. B Biomed. Sci. Appl. 1999; 724: 393-398
[209] Schatz DS, Saria A. Simultaneous determination of paroxetine, risperidone and 9-hydroxyrisperidone in human plasma by high-performance liquid chromatography with coulometric detection. Pharmacology 2000; 60: 51-56
[210] Zhu ZM, Neirinck L. High-performance liquid chromatography-mass spectrometry method for the determination of paroxetine in human plasma. J. Chromatogr. B Analyt. Technol. Biomed. Life Sci. 2002; 780: 295-300
[211] Segura M, Ortuno J, Farre M, Pacifici R, Pichini S, Joglar J, Segura J, de la Torre R. Quantitative determination of paroxetine and its 4-hydroxy-3-methoxy metabolite in plasma by high-performance liquid chromatography/electrospray ion trap mass spectrometry: application to pharmacokinetic studies. Rapid Commun. Mass Spectrom. 2003; 17: 1455-1461
[212] Vivekanand VV, Kumar VR, Mohakhud PK, Reddy GO. Enantiomeric separation of the key intermediate of paroxetine using chiral chromatography. J. Pharm. Biomed. Anal. 2003; 33: 803-809
[213] Weng ND, Eerkes A. Development and validation of a hydrophilic interaction liquid chromatography-tandem mass spectrometric method for the analysis of paroxetine in human plasma. Biomed. Chromatogr. 2004; 18: 28-36
[214] Fleishaker JC. Clinical pharmacokinetics of reboxetine, a selective norepinephrine reuptake inhibitor for the treatment of patients with depression. Clin. Pharmacokinet. 2000; 39: 413-427

Chapter I: Introduction: depression, use of antidepressants, and relevance of antidepressant monitoring
68
[215] Hajos M, Fleishaker JC, Filipiak-Reisner JK, Brown MT, Wong EHF. The selective norepinephrine reuptake inhibitor antidepressant reboxetine: Pharmacological and clinical profile. CNS Drug Rev. 2004; 10: 23-44
[216] Olver JS, Burrows GD, Norman TR. Third-generation antidepressants - Do they offer advantages over the SSRIs? CNS Drugs 2001; 15: 941-954
[217] Versiani M. Reboxetine, the first selective noradrenaline reuptake inhibitor antidepressant: efficacy and tolerability in 2613 patients. Int. J. Psychiat. Clin. 2000; 4: 201-208
[218] Gottweiss M, Hiemke C, Nenadic I, Wagner G, Kohler S, Schlosser R, Balogh A, Sauer H. Comparative study of reboxetine on CYP2D6 activity in patients and healthy volunteers. Eur. J. Clin. Pharmacol. 2005; 61: 706-707
[219] Raggi MA, Mandrioli R, Casamenti G, Volterra V, Pinzauti S. Determination of reboxetine, a recent antidepressant drug, in human plasma by means of two high-performance liquid chromatography methods. J. Chromatogr. A 2002; 949: 23-33
[220] Hartter S, Weigmann H, Hiemke C. Automated determination of reboxetine by high-performance liquid chromatography with column-switching and ultraviolet detection. J. Chromatogr. B 2000; 740: 135-140
[221] Walters RR, Buist SC. Improved enantioselective method for the determination of the enantiomers of reboxetine in plasma by solid-phase extraction, chiral derivatization, and column-switching high-performance liquid chromatography with fluorescence detection. J; Chromatogr. A 1998; 828: 167-176
[222] Frigerio E, Pianezzola E, Benedetti MS. Sensitive Procedure for the Determination of Reboxetine Enantiomers in Human Plasma by Reversed-Phase High-Performance Liquid-Chromatography with Fluorometric Detection after Chiral Derivatization with (+)-1-(9-Fluorenyl)Ethyl Chloroformate. J.Chromatogr. A 1994; 660: 351-358
[223] Ohman D, Norlander B, Peterson C, Bengtsson F. Simultaneous determination of reboxetine and O-desethylreboxetine enantiomers using enantioselective reversed-phase high-performance liquid chromatography. J. Chromatogr. A 2002; 947: 247-254
[224] Raggi MA, Mandrioli R, Sabbioni C, Parenti C, Cannazza G, Fanali S. Separation of reboxetine enantiomers by means of capillary electrophoresis. Electrophoresis 2002; 23: 1870-1877
[225] DeVane CL, Liston HL, Markowitz JS. Clinical pharmacokinetics of sertraline. Clin. Pharmacokinet. 2002; 41: 1247-1266
[226] Mauri MC, Laini V, Cerveri G, Scalvini ME, Volonteri LS, Regispani F, Malvini L, Manfre S, Boscati L, Panza G. Clinical outcome and tolerability of sertraline in major depression - A study with plasma levels. Prog. Neuropsychopharmacol. Biol. Psychiatry 2002; 26: 597-601
[227] Lucangioli SE, Hermida LG, Tripodi VP, Rodriguez VG, Lopez EE, Rouge PD, Carducci CN. Analysis of cis-trans isomers and enantiomers of sertraline by cyclodextrin-modified micellar electrokinetic chromatography. J. Chromatogr. A 2000; 871: 207-215
[228] Rogowsky D, Marr M, Long G, Moore C. Determination of sertraline and desmethylsertraline in human serum using copolymeric bonded-phase extraction, liquid-chromatography and gas-chromatography mass-spectrometry. J. Chromatogr. B Biomed. Appl. 1994; 655: 138-141
[229] Eap CB, Bouchoux G, Amey M, Cochard N, Savary L, Baumann P. Simultaneous determination of human plasma levels of citalopram,

Chapter I: Introduction: depression, use of antidepressants, and relevance of antidepressant monitoring
69
paroxetine, sertraline, and their metabolites by gas chromatography mass spectrometry. J. Chromatogr. Sci. 1998; 36: 365-371
[230] Kim KM, Jung BH, Choi MH, Woo JS, Paeng KJ, Chung BC. Rapid and sensitive determination of sertraline in human plasma using gas chromatography-mass spectrometry. J. Chromatogr. B Analyt. Technol. Biomed. Life Sci. 2002; 769: 333-339
[231] Casamenti G, Mandrioli R, Sabbioni C, Bugamelli F, Volterra V, Raggi MA. Development of an HPLC method for the toxicological screening of central nervous system drugs. J. Liq. Chromatogr. Relat. Technol. 2000; 23: 1039-1059
[232] Jain DS, Sanyal M, Subbaiah G, Pande UC, Shrivastav P. Rapid and sensitive method for the determination of sertraline in human plasma using liquid chromatography-tandem mass spectrometry (LC-MS/MS). J. Chromatogr. B Analyt. Technol. Biomed. Life Sci. 2005; 829: 69-74
[233] He LJ, Feng F, Wu J. Determination of sertraline in human plasma by high-performance liquid chromatography-electrospray ionization mass sprectrometry and method validation. J. Chromatogr. Sci. 2005; 43: 532-535
[234] Mir S, Taylor D. The adverse effects of antidepressants. Curr. Opin. Psychiatr. 1997; 10: 88-94
[235] Becker PM. Trazodone as a hypnotic in major depression. Sleep Med. 2004; 5: 7-8
[236] Saletu-Zyhlarz GM, Anderer P, Arnold O, Saletu B. Confirmation of the neurophysiologically predicted therapeutic effects of trazodone on its target symptoms depression, anxiety and insomnia by postmarketing clinical studies with a controlled-release formulation in depressed outpatients. Neuropsychobiology 2003; 48: 194-208
[237] Rotzinger S, Fang J, Coutts RT, Baker GB. Human CYP2D6 and metabolism of m-chlorophenylpiperazine. Biol. Psychiatry 1998; 44: 1185-1191
[238] Goeringer KE, Raymon L, Logan BK. Postmortem forensic toxicology of trazodone. J. Forensic Sci. 2000; 45: 850-856
[239] Suckow RF. A Simultaneous Determination of Trazodone and Its Metabolite 1-M-Chlorophenylpiperazine in Plasma by Liquid-Chromatography with Electrochemical Detection. J. Liq. Chrom. 1983; 6: 2195-2208
[240] Otani K, Mihara K, Yasui N, Ishida M, Kondo T, Tokinaga N, Ohkubo T, Osanai T, Sugawara K, Kaneko S. Plasma concentrations of trazodone and M-chlorophenylpiperazine at steady state can be predicted from those after an initial dose of trazodone. Prog. Neuro-Psychopharmacol. Biol. Psychiatry 1997; 21: 239-244
[241] Mihara K, Yasui-Furukori N, Kondo T, Ishida M, Ono S, Ohkubo T, Osanai T, Sugawara K, Otani K, Kaneko S. Relationship between plasma concentrations of trazodone and its active metabolite, m-chlorophenylpiperazine, and its clinical effect in depressed patients. Ther. Drug Monit. 2002; 24: 563-566
[242] Monteleone P, Gnocchi G, Delrio G. Plasma Trazodone Concentrations and Clinical-Response in Elderly Depressed-Patients - a Preliminary-Study. J. Clin. Psychopharmacol. 1989; 9: 284-287
[243] Prapotnik M, Waschgler R, Konig P, Moll W, Conca A. Therapeutic drug monitoring of trazodone: are there pharmacokinetic interactions involving citalopram and fluoxetine? Int. J. Clin. Pharmacol. Ther. 2004; 42: 120-124
[244] Mihara K, Kondo T, Suzuki A, Yasui-Furukori N, Ono S, Otani K, Kaneko S. Effects of genetic polymorphism of CYP1A2 inducibility on the steady-state

Chapter I: Introduction: depression, use of antidepressants, and relevance of antidepressant monitoring
70
plasma concentrations of trazodone and its active metabolite m-chlorophenylpiperazine in depressed Japanese patients. Pharmacol. Toxicol. 2001; 88: 267-270
[245] Brogden RN, Heel RC, Speight TM, Avery GS. Trazodone - a Review of Its Pharmacological Properties and Therapeutic Use in Depression and Anxiety. Drugs 1981; 21: 401-429
[246] Mendelson WB. A review of the evidence for the efficacy and safety of Trazodone in insomnia. J. Clin. Psychiatry 2005; 66: 469-476
[247] McCue RE, Joseph M. Venlafaxine- and trazodone-induced serotonin syndrome. Am. J. Psychiat. 2001; 158: 2088-2089
[248] Adson DE, Erickson-Birkedahl S, Kotlyar M. An unusual presentation of sertraline and trazodone overdose. Ann. Pharmacother. 2001; 35: 1375-1377
[249] Small NL, Giamonna KA. Interaction between warfarin and trazodone. Ann.Pharmacother. 2000; 34: 734-736
[250] Greenblatt DJ, von Moltke LL, Harmatz JS, Fogelman SM, Chen GS, Graf JA, Mertzanis P, Byron S, Culm KE, Granda BW, Daily JP, Shader RI. Short-term exposure to low-dose ritonavir impairs clearance and enhances adverse effects of trazodone. J. Clin. Pharmacol. 2003; 43: 414-422
[251] de Meester A, Carbutti G, Gabriel L, Jacques JM. Fatal overdose with trazodone: Case report and literature review. Acta Clin. Belg. 2001; 56: 258-261
[252] Rifai N, Levtzow CB, Howlett CM, Parker NC, Phillips JC, Cross RE. The Determination of Trazodone by Capillary Column Gc with N-Selective Detection. Clin. Chem. 1988; 34: 1258-1258
[253] Caccia S, Ballabio M, Fanelli R, Guiso G, Zanini MG. Determination of plasma and brain concentrations of trazodone and its metabolite, 1-m-chlorophenylpiperazine, by gas-liquid-chromatography. J. Chromatogr. 1981; 210: 311-318
[254] Anderson WH, Archuleta MM. The capillary gas-chromatographic determination of trazodone in biological specimens. J. Anal. Toxicol. 1984; 8: 217-219
[255] Waschgler R, Hubmann MR, Conca A, Moll W, Konig P. Simultaneous quantification of citalopram, clozapine, fluoxetine, norfluoxetine, maprotiline, desmethyl-maprotiline, and trazodone in human serum by HPLC analysis. Pharmacopsychiatry 2002; 35: XI-XI
[256] Vatassery GT, Holden LA, Hazel DK, Dysken MW. Determination of trazodone and its metabolite, 1-m-chlorophenyl-piperazine, in human plasma and red blood cell samples by HPLC. Clin. Biochem. 1997; 30: 149-153
[257] Ohkubo T, Osanai T, Sugawara K, Ishida M, Otani K, Mihara K, Yasui N. High-performance liquid-chromatographic determination of trazodone and 1-m-chlorophenylpiperazine with ultraviolet and electrochemical detector. J. Pharm. Pharmacol. 1995; 47: 340-344
[258] Dorey RC, Narasimhachari N. HPLC analysis of the new antidepressants, amoxapine and trazodone. Clin. Chem. 1984; 30: 1035-1035
[259] Mayol RF, Gammans RE, Labudde JA. Simultaneous determination in plasma of trazodone and its metabolite m-chlorophenylpiperazine using a new hplc method after single and multiple oral dosing in man. J. Clin. Pharmacol. 1984; 24: 406-406
[260] Brown P, Tribby P. Analysis of trazodone by normal phase liquid-chromatography. Clin. Chem. 1990; 36: 1045-1045

Chapter I: Introduction: depression, use of antidepressants, and relevance of antidepressant monitoring
71
[261] Siek TJ. Determination of trazodone in serum by instrumental thin-layer chromatography. J. Anal. Toxicol. 1987; 11: 225-227
[262] Roberge RJ, Luellen JR, Reed S. False-positive amphetamine screen following a trazodone overdose. J. Toxicol. Clin. Toxicol. 2001; 39: 181-182
[263] Morton WA, Sonne SC, Verga MA. Venlafaxine - a structurally unique and novel antidepressant. Ann. Pharmacother. 1995; 29: 387-395
[264] Reis M, Lundmark J, Bjork H, Bengtsson F. Therapeutic drug monitoring of racemic venlafaxine and its main metabolites in an everyday clinical setting. Ther. Drug Monit. 2002; 24: 545-553
[265] Ereshefsky L, Dugan D. Review of the pharmacokinetics, pharmacogenetics, and drug interaction potential of antidepressants: Focus on venlafaxine. Depress. Anxiety 2000; 12: 30-44
[266] Kirchheiner J, Brosen K, Dahl ML, Gram LF, Kasper S, Roots I, Sjoqvist F, Spina E, Brockmoller J. CYP2D6 and CYP2C19 genotype-based dose recommendations for antidepressants: a first step towards subpopulation-specific dosages. Acta Psychiatr. Scand .2001; 104: 173-192
[267] Roseboom PH, Kalin NH. Neuropharmacology of venlafaxine. Depress. Anxiety 2000; 12: 20-29
[268] Burnett FE, Dinan TG. Venlafaxine. Pharmacology and therapeutic potential in the treatment of depression. Hum. Psychopharmacol. 1998; 13: 153-162
[269] Rudaz S, Calleri E, Geiser L, Cherkaoui S, Prat J, Veuthey JL. Infinite enantiomeric resolution of basic compounds using highly sulfated cyclodextrin as chiral selector in capillary electrophoresis. Electrophoresis 2003; 24: 2633-2641
[270] Martinez MA, de la Torre CS, Almarza E. Simultaneous determination of viloxazine, venlafaxine, imipramine, desipramine, sertraline,and amoxapine in whole blood: comparison of two extraction/cleanup procedures for capillary gas chromatography with nitrogen-phosphorus detection. J. Anal. Toxicol. 2003; 27: 8A-8A
[271] Martinez MA, de la Torre CS, Almarza E. Simultaneous determination of viloxazine, venlafaxine, imipramine, desipramine, sertraline, and amoxapine in whole blood: comparison of two extraction/cleanup procedures for capillary gas chromatography with nitrogen-phosphorus detection. J. Anal. Toxicol. 2002; 26: 296-302
[272] Hicks DR, Wolaniuk D, Russell A, Cavanaugh N, Kraml M. A high-performance liquid-chromatographic method for the simultaneous determination of venlafaxine and O-desmethylvenlafaxine in biological-fluids. Ther. Drug Monit. 1994; 16: 100-107
[273] Matoga M, Pehourcq F, Titier K, Dumora F, Jarry C. Rapid high-performance liquid chromatographic measurement of venlafaxine and O-desmethylvenlafaxine in human plasma - application to management of acute intoxications. J. Chromatogr. B Biomed. Sci. Appl. 2001; 760: 213-218
[274] Raut BB, Kolte BL, Deo AA, Bagool MA, Shinde DB. A rapid and sensitive HPLC method for the determination of venlafaxine and O-desmethylvenlafaxine in human plasma with UV detection. J. Liq. Chromatogr. Relat. Technol. 2003; 26: 1297-1313
[275] Waschgler R, Moll W, Konig P, Conca A. Quantification of venlafaxine and O-desmethylvenlafaxine in human serum using HPLC analysis. Int. J. Clin. Pharmacol. Ther. 2004; 42: 724-728

Chapter I: Introduction: depression, use of antidepressants, and relevance of antidepressant monitoring
72
[276] Bhatt J, Jangid A, Venkatesh G, Subbaiah G, Singh S. Liquid chromatography-tandem mass spectrometry (LC-MS-MS) method for simultaneous determination of venlafaxine and its active metabolite O-desmethyl venlafaxine in human plasma. J. Chromatogr. B Analyt. Technol. Biomed. Life Sci. 2005; 829: 75-81
[277] Baker GB, Prior TI. Stereochemistry and drug efficacy and development: relevance of chirality to antidepressant and antipsychotic drugs. Ann. Med. 2002; 34: 537-543
[278] Greenwood DT. Viloxazine and Neurotransmitter Function. Adv. Biochem. Psychopharmacol. 1982; 31: 287-300
[279] Ban TA, McEvoy JP, Wilson WH. Viloxazine - a Review of the literature. Int.Pharmacopsychiatry 1980; 15: 118-123
[280] Altamura AC, Mauri MC, Guercetti G. Age, therapeutic milieu and clinical outcome in depressive patients treated with viloxazine - a study with plasma-levels. Progr. Neuro. Psychopharmacol. Biol. Psychiatr. 1986; 10: 67-75
[281] Maistrello I, Grassi G, Bertolino A, Valerio P, Pistollato G, Soverini S. Recognition of adverse drug-reactions in depressed-patients treated with viloxazine (Vicilan). Adv. Biochem. Psychopharmacol. 1982; 32: 369-373
[282] Fazio A, Crisafulli P, Primerano G, Dagostino AA, Oteri G, Pisani F. A sensitive gas-chromatographic assay for the determination of serum viloxazine concentration using a nitrogen phosphorus-selective detector. Ther. Drug Monit. 1984; 6: 484-488
[283] Groppi A, Papa P. One-step extraction procedure for gas-chromatographic determination of viloxazine as its acetyl derivative in human-plasma. J.Chromatogr. 1985; 337: 142-145
[284] Thomare P, Kergueris MF, Bourin M, Thomas L, Larousse C. Sensitive one-step extraction procedure for high-performance liquid-chromatographic determination of viloxazine in human plasma. J. Chromatogr. B 1990; 529: 494-499
[285] Kincaid RL, McMullin MM, Crookham SB, Rieders F. Report of a fluoxetine fatality. J. Anal. Toxicol. 1990; 14: 327-329
[286] Wenzel S, Aderjan R, Mattern R, Pedal I, Skopp G. Tissue distribution of mirtazapine and desmethylmirtazapine in a case of mirtazapine poisoning. Forensic Sci. Int. 2006; 156: 229-236
[287] Luchini D, Morabito G, Centini F. Case report of a fatal intoxication by citalopram. Am. J. Forensic Med. Pathol. 2005; 26: 352-354
[288] Rogde S, Hilberg T, Teige B. Fatal combined intoxication with new antidepressants. Human cases and an experimetnal study of postmortem moclobemide redistribution. Forensic Sci. Int. 1999; 100: 109-116
[289] Singer PP, Jones GR. An uncommon fatalilty due to moclobemide and paroxetine. J. Anal. Toxicol. 1997; 21: 518-520
[290] McIntyre IM, King VK, Staikos V, Gall J, Drummer OH. A fatality involving moclobeemide, sertraline, and pimozide. J. Forensic Sci. 1997; 42: 951-953
[291] Stimpfl T, Reichel S. Distribution of drugs of abuse with specific regions of the human brain. Forensic Sci Int. 2007; 170: 179-182
[292] Musshoff F, Madea B. Analytical pitfalls in hair testing. Anal Bioanal Chem. 2007; 388: 1475-1494

Chapter I: Introduction: depression, use of antidepressants, and relevance of antidepressant monitoring
73
[293] Pragst F, Balikova MA. State of the art in hair analysis for detection of drug and alcohol abuse. Clin. Chim Acta. 2006; 370: 17-49


Chapter II
Objectives


Chapter II: Objectives
77
New generation antidepressants are highly prescribed drugs worldwide.
Moreover, the use of antidepressant drugs will still increase as this mental
disorder will become the second leading contributor to the global burden of
disease, calculated for all ages and both sexes by the year 2020 according to
the World Health Organization. As a result, analytical methods for the
determination of new generation antidepressants gain more and more
importance in the clinical and forensic field.
The general aim of this thesis was to develop and validate a gas
chromatographic-mass spectrometric method for the simultaneous
identification and quantification of new generation antidepressants and their
metabolites in biological matrices. This method must be sensitive and
straightforward, in such a manner that application in a routine laboratory can
be easily performed. In addition, the method had to be useful for clinical as
well as forensic applications. Therefore, the method was adapted for several
matrices such as plasma, whole blood, brain tissue, and hair.
A second aim was to evaluate the applicability of the developed method for
therapeutic drug monitoring of depressed patients. Individually guided dosing
of antidepressants is not routinely applied in psychiatric clinics, but can be
interesting in special patient populations which do not seem to benefit from
antidepressant therapy. For these patients, a preliminary study was set-up to
determine the link between the antidepressant/metabolite ratio in plasma,
the metabolization profile of the individual patient and the final outcome of
the antidepressant therapy.
The last aim of this thesis was to evaluate the usefulness of the gas
chromatographic-mass spectrometric antidepressant determination method
for forensic purposes. Although, new generation antidepressants are
considered as less toxic (as compared to tricyclic antidepressants), they are
often co-administered with other drugs which can result in interactions.
Matrices such as blood and hair from forensic cases were analyzed to
determine the antidepressant concentrations and the time of antidepressant
use. In addition, brain concentrations were also measured as the brain is the
target of antidepressant treatment.


Chapter III
Sample preparation: Development and optimization of a solid phase
extraction procedure for several biological matrices
Based on:Wille SMR, Maudens KE, Van Peteghem CH, Lambert WE. Development of a solid phase extraction for 13 ‘new’ generation antidepressants and their active metabolites for gas chromatographic-mass spectrometric analysis. J.Chromatogr. A, 2005; 1098:19-29


Chapter III: Sample preparation
-81-
III.1. Introduction
An important step in the development of an analytical method is the
extraction of the compounds of interest from the biological matrix as this will
have implications on the overall sensitivity and selectivity of the method.
Sample preparation will not only lead to highly concentrated extracts, but can
remove potential interfering matrix compounds, resulting in enhanced
selectivity and a more reproducible method independent of variations in the
sample matrix. Conventionally, liquid-liquid and solid-phase extraction
methods (LLE and SPE) are chosen.
In liquid-liquid extraction the objective is to transfer the desired solutes from
one liquid solution to another nonmiscible liquid. Liquid-liquid extraction is
still frequently used in analytical toxicology, especially for (urgent) screening
purposes when analysis of a wide range of (unknown) compounds instead of
a target analysis is aimed. In addition, development of a LLE procedure is
less time-consuming. The standard procedure for extracting antidepressants
(ADs) is based on a LLE after alkalinization (pH ±9) with potassium borate or
hydroxide, sodium carbonate, or sodium hydroxide. A variety of organic
solvents is used such as heptane-isoamylalcohol, n-butyl chloride, diethyl
ether or n-heptane-ethylacetate [1-9]. Sometimes a back extraction under
acidic conditions (HCl) is applied, followed by a direct injection on the HPLC
system [5, 7]. For GC-purposes, the ADs are extracted as above followed by
an additional extraction step into an organic solvent after alkalinization [4,
6]. The back extraction technique leads to better removal of interfering
compounds such as cholesterol, but for GC-MS the different extraction steps
lead to loss of ADs, due to incomplete recovery. Thus, sensitivity is reduced
and leads to detection problems for several ADs even in their therapeutic
range. In addition, LLE is labourous, requires high-purity solvents and can
result in the formation of emulsions with incomplete phase separation, the
latter leading to impure extracts. Moreover, safe disposal of toxic solvents
may be problematic and expensive [10].
Solid phase extraction (SPE) extracts and concentrates analytes from a liquid
matrix by partitioning these analytes between a solid and a liquid phase. SPE
aims to remove interfering compounds and to concentrate the analytes, with

Chapter III: Sample preparation
-82-
good recovery and reproducible results. In addition, it should facilitate the
rapid and efficient simultaneous processing of multiple samples [11]. SPE
also has disadvantages including the cost of SPE material and the labourous
optimization of the procedure. A SPE procedure consists of four consecutive
steps: column conditioning, sample loading, column washing and elution of
the compounds. When developing such procedure, suitable sorbent material,
washing and eluting solvents have to be selected, according to the
characteristics of the analytes and the matrix, and of the purpose of the
analysis (screening or target analysis).
III.2. Experimental
III.2.1. Reagents
Venlafaxine.HCl and O-desmethylvenlafaxine maleate (ODMV) were kindly
provided by Wyeth (New York, NY, USA). Mianserin.HCl, desmethyl-
mianserin.HCl (DMMia), mirtazapine and desmethylmirtazapine maleate
(DMMir) were a gift from Organon (Oss, The Netherlands). Sertraline.HCl,
desmethylsertraline maleate (DMSer) and reboxetine methanesulphonate
were a gift from Pfizer (Groton, CT, USA). Citalopram.HBr, desmethyl-
citalopram.HCl (DMC), didesmethylcitalopram tartrate (DDMC), and
melitracen.HCl were kindly provided by Lundbeck (Valby, Denmark). ACRAF
(Roma, Italy) donated trazodone.HCl and its metabolite m-chlorophenyl-
piperazine.HCl (m-cpp), while paroxetine.HCl hemihydrate was donated by
GlaxoSmithKline (Erembodegem, Belgium). Viloxazine.HCl was a kind gift
from AstraZeneca (Brussels, Belgium). Novartis Pharma (Basel, Switzerland)
donated maprotiline.HCl and desmethylmaprotiline (DMMap). Fluvoxamine
maleate was donated by Solvay Pharmaceuticals (Weesp, The Netherlands).
Fluoxetine.HCl and desmethylfluoxetine.HCl (DMFluox) were purchased from
Sigma-Aldrich (Steinheim, Germany).
Methanol, acetonitrile and water were all of HPLC-grade (Merck, Darmstadt,
Germany). Ammonia-solution 25%, orthophosphoric acid (85%), NaOH (5
M), glycine and sodium dihydrogen phosphate monohydrate were also from
Merck. Formic acid was purchased from Riedel-de Haën (Seelze, Germany).
Phosphate buffer (25 mM) pH 2.5 was made by adding approximately 6.7 g

Chapter III: Sample preparation
-83-
of NaH2PO4.H2O to 2.7 l of HPLC-water and adjusting the pH by adding
phosphoric acid. The phosphate buffer (25 mM) pH 6.5 was made by
dissolving 2.8 g in 1 l of HPLC-grade water and adjusting the pH with 5 M
NaOH. The glycine HCl-buffer was made by adding 4.1 ml 0.2 M HCl to 50 ml
of 0.1-M glycine solution (0.75 g/100 ml) and then diluting with water till 100
ml.
Fluoxetine-d6 oxalate (Fd6), mianserin-d3 (Md3) and paroxetine-d6 maleate
(Pd6) (100 μg/ml MeOH) were purchased from Promochem (Molsheim,
France) and were used as internal standards. Toluene (Suprasolv quality,
Merck, Darmstadt, Germany) and 1- (heptafluorobutyryl) imidazole (HFBI)
(Fluka, Bornem, Belgium) were applied for derivatization. Vials, glass inserts
and viton crimp-caps were purchased from Agilent technologies (Avondale,
PA, USA).
Blood was taken from healthy volunteers in dipotassium EDTA Vacutainers
(Novolab, Geraardsbergen, Belgium). If plasma had to be obtained, the tubes
were centrifuged at 1200 g for 10 minutes within 2 hours of the blood
collection. After the plasma was removed, it was stored at -20°C. Drug-free
hair was obtained from volunteers. Drug-free post-mortem brain tissue was
obtained from the department of forensic medicine (Ghent University,
Belgium).
III.2.2. Stock solutions
Stock solutions were prepared in methanol at a concentration of 1 mg/ml for
each compound individually and stored at -20°C. Two mixtures of compounds
were made due to the overlap of some compounds in the HPLC-method.
Mixture 1 contained DMMir, ODMV, DMC, DDMC, reboxetine, paroxetine,
maprotiline, fluoxetine, DMFluox and m-cpp. Mixture 2 contained
mirtazapine, viloxazine, DMMia, citalopram, mianserin, fluvoxamine, DMSer,
sertraline, melitracen, venlafaxine and trazodone. During the SPE
development, a concentration of 1 μg/ml of each ADs was spiked in 1 ml
HPLC-grade water.
Chapter III: Sample preparation
-84-
For the protein binding disruption test, the same mixtures as for the SPE
method development were used, but the compounds were spiked in
therapeutic concentrations. A mixture of 100 ng DMMir, 150 ng ODMV, 30 ng
DMC, 10 ng DDMC, 80 ng reboxetine, 75 ng paroxetine, 125 ng maprotiline,
250 ng fluoxetine, 500 ng DMFluox and 10 ng m-cpp (mixture 1) or a
mixture of 100 ng mirtazapine, 100 ng viloxazine, 20 ng DMMia, 100 ng
citalopram, 35 ng mianserin, 125 ng fluvoxamine, 125 ng DMSer , 125 ng
sertraline, 50 ng melitracen, 375 ng venlafaxine and 100 ng trazodone
(mixture 2) was spiked to 1 ml of plasma by evaporating the mixtures at
40°C with nitrogen and adding the plasma afterwards.
For the GC-MS experiments, a standard mixture was obtained by mixing the
individual primary stock solutions and by further diluting with methanol until
a concentration of 0.05 – 0.125 mg/ml, depending on the therapeutic range
of the compound. After preparation, it was stored protected from light at
approximately -20°C. Further dilution of the standard mixture with methanol
resulted in working solutions with concentrations of 0.1, 1 or 10 μg/ml.
Primary stock solutions of the internal standards (I.S.) fluoxetine-d6,
mianserin-d3 and paroxetine-d6 were prepared in methanol at a concentration
of 10 μg/ml and were stored protected from light at 4°C. Twenty μl of each
I.S. solution were spiked to 1 ml of plasma.
III.2.3. Mixer, sonicator, vacuum manifold, evaporator, and
centrifuge
An Ultra Turrax mixer IKA T18 basic (Staufen, Germany) was used to
homogenize the tissue samples. Sonication of samples was done using a
‘Brandson 1510’ (Brandson UL Transonics corporation, Danbury, CT, USA). A
Visiprep TM Disposable liner vacuum manifold (Supelco, Bornem, Belgium)
controlled the flow during the solid phase extraction procedure. Evaporation
under nitrogen was conducted in a TurboVap LV evaporator from Zymark
(Hopkinton, MA, USA). The centrifuge was a Mistral MSE 200 BRS
(Drogenbos, Belgium).

Chapter III: Sample preparation
-85-
III.2.4. High Pressure Liquid Chromatography (HPLC)
A LaChrom Elite HPLC (Merck-Hitachi, Darmstadt, Germany), consisting of a
L2100 micro-pump, a L2200 autosampler, a L2300 column oven and a L2450
DAD, was used to monitor the SPE optimization and the protein binding
disruption test. A LiChroCART 4-4 guard column combined with a C18
endcapped Purospher Star (Merck, Darmstadt, Germany) LiChroCART 125-3
(5 μm) column was used. The oven was set at 40 °C and the gradient run
started at 85% phosphate buffer (25 mM, pH 2.5) and 15 % acetonitrile. At
20 minutes the organic phase contribution was 40 %, and at 25 minutes 50
%. From 25.1 until 35 minutes the column equilibrated under starting
conditions. The flow rate of the mobile phase was held at 0.5 ml/min. The
DAD measured from 210 till 380 nm and the chromatograms were integrated
at 220 nm, except for mirtazapine and desmethylmirtazapine (300 nm).
Aqueous solutions (wash solutions) were injected directly into the HPLC,
while organic solvents (eluent) was evaporated to dryness under nitrogen at
40 °C and redissolved in 0.5 ml of the acetonitrile (15 %)-phosphate buffer
mixture. A 50-μl aliquot was injected on the HPLC-column.
III.2.5. Gas chromatography – Mass spectrometry (GC-MS)
A HP 6890 GC system was used, equipped with a HP 5973 mass selective
detector, a HP 7683 split/splitless auto injector and a G1701DA Chem
Station, version D.02.00 data processing unit (Agilent Technologies,
Avondale, PA, USA).
Chromatographic separation was achieved on a 30m x 0.25mm I.D., 0.25-μm
J&W-5ms column from Agilent Technologies (Avondale, PA, USA). The initial
column temperature was set at 90°C for 1 min, ramped at 50°C/min to
180°C where it was held for 10 min, whereafter the temperature was ramped
again at 10°C/min to 300°C.
The pulsed splitless injection temperature was held at 300°C while purge
time and injection pulse time were set at 1 and 1.5 min, respectively.
Meanwhile, the injection pulse pressure was 170 kPa and 1 μl of the sample,

Chapter III: Sample preparation
resolved in 50 μl of toluene, was injected. Ultrapure Helium with a constant
flow of 1.3 ml/min was used as carrier gas.
The mass selective detector temperature conditions were 230°C for the EI-
source, 150°C for the quadrupole and 300°C for the transferline, whereas an
electron voltage of 70 eV was used. The spectra were monitored in selected
ion monitoring (SIM) mode for quantification (Table III.1.).
Table III.1. Monitored ions in SIM mode
The use of internal standards fluoxetine-d6, mianserin-d3, paroxetine-d6 are indicated by 1, 2, and 3, respectively.
Compounds M-ion M-ion HFBQuant ion 1 ion 2
Venlafaxine 2 277 259 58 259 121m-cpp 1 196 392 392 166 394Viloxazine 1 237 433 433 240 296DMFluox 1 295 491 330 117 226Fluvoxamine 1 318 514 258 240 514ODMV 2 263 441 58 245Fluoxetine 1 309 505 344 117 486Fluoxetine-d6 315 511 350 123 492Mianserin 2 264 264 264 193 220Mianserin-d3 267 267 267 193 220Mirtazapine 2 265 265 195 208 265Melitracen 2 291 291 58 202 291DMMia 2 250 446 446 193 249DMSer 3 291 487 274 487 489DMMir 2 251 447 447 250 195Reboxetine 3 313 509 371 138 509Citalopram 3 324 324 58 238 324DMMap 3 263 459 431 191 459Maprotiline 3 277 473 445 191 473Sertraline 3 305 501 274 501 503DDMC 3 296 492 238 208 474DMC 3 310 506 238 208 488Paroxetine 3 329 525 525 138 388Paroxetine-d6 332 531 531 138 394Trazodone 371 371 205 371 356
EI
For the GC-MS method the ADs had to be derivatized after SPE. Thus, after
evaporation of the solid phase extracts under nitrogen at 40°C, 50 μl of HFBI
was added and the sample was heated at 85°C for 30 min. Thereafter, 0.5 ml
of HPLC-water and 2 ml of toluene were added. After vortexing and
centrifuging the sample at 1121 g for 10 min, the toluene layer was
transferred and evaporated at 40°C [12]. The evaporated extract was
resolved in 50 μl of toluene.
-86-

Chapter III: Sample preparation
-87-
III.3. Solid phase extraction development
The development of a solid phase extraction for new generation ADs is
described in the first section of this chapter. In the second part, the
developed method was optimized for different matrices. The method was
developed by extracting AD spiked water samples, using a high pressure
liquid chromatographic method with diode array detection (HPLC-DAD) as
monitoring technique. The advantage of this monitoring technique is the
ability to analyze aqueous phases without a drying or extraction step. In
addition, no derivatization was necessary. Thus, the choice of sorbent, the
conditioning step, loading step, washing and eluting step were optimized
using HPLC. However, during the initial development procedure, we always
considered the implications of our choice for the final gas chromatographic-
mass spectrometric (GC-MS) method.
III.3.1. Choice of SPE sorbent
There is a range of SPE sorbents, all with different kinds of interactions
occurring between the analytes of interest and the active sites on the sorbent
[10]. These interactions include both hydrophobic interactions such as Van
Der Waals forces and hydrophilic interactions such as dipole-dipole, induced
dipole-dipole, hydrogen bonding and �-� interaction. Other mechanisms
include electrostatic attractions between charged groups on the compound
and on the sorbent surface, as well as molecular recognition mechanisms
[13]. The SPE sorbents that involve only one of the above interactions are
reversed phase, normal phase, ion-exchange, immuno-affinity and
molecularly imprinted polymers, while mixed modes combine several
interaction mechanisms.
The choice of the interaction mode depends on the demands of the method
such as screening or target analysis, the aimed sensitivity, and final
composition of the extract (organic or aqueous (GC versus HPLC)). Not only
the chemical characteristics of the functional groups on the sorbent are
relevant, but also the characteristics of the back-bones on which these
functional groups are attached. These back-bones are either silica-or polymer
based. The silica-based sorbents have a large variation of functional groups

Chapter III: Sample preparation
-88-
available, are relatively inexpensive and are stable within a pH range of
approximately 2 to 7.5. The polymer-sorbents (styrene-divinylbenzene) are
more hydrophobic, more retentive and stable within a pH range of 0 to 14.
The tested SPE sorbents were selected because of their potential interaction
with the ADs. Four different categories of SPE sorbents were selected. The
silica based apolar sorbents (reversed phase sorbents) are tested as they
extract rather apolar compounds from polar matrices such as plasma, using
hydrophobic interaction mechanisms. The apolar sorbents studied were Bond
Elut C18 (200 mg tubes, Varian, Middelburg, The Netherlands), Empore HD C8
(6 ml, 10 nm, Chrompack-Varian, Middelburg, The Netherlands) and RP-
select B Lichrolut (200 mg tubes, Merck, Darmstadt, Germany). Polymeric
sorbents were of interest because of their combined polar and apolar
properties. They do not always require a conditioning step and are able to
extract analytes over a large polarity range. Therefore, they could lead to a
better extraction of the more polar metabolites in combination with the ADs.
The SPE-tubes Focus (50 mg, Varian), Strata X (200 mg, Phenomenex,
Bester, Amstelveen, The Netherlands) and Oasis HLB (200 mg, Waters,
Milford, MA, USA) were selected. Ion-exchange sorbents were selected as
they focus on ionic interactions between the analytes of interest and the
functional groups on the sorbent. Based on this mechanism, the positively
charged ADs can be extracted from a biological matrix using a cation
exchange sorbent. When using a cation exchange mode, the choice between
a weak (carboxylic acid with pKa 4.8) or a strong cation exchanger (sulphonic
acid with pKa <1) can be made. The strong and weak cation exchangers (200
mg) from Phenomenex were evaluated as ion-exchange sorbents. Cerify
Bond Elut (130 mg, Varian) and Strata XC (200 mg, Phenomenex) were two
mixed modes combining cation-exchange properties with, respectively, a
hydrophobic C8 phase or a styrene-divinylbenzene polymer.
The choice of sorbent depends on the ability to have a selective, high and
reproducible retention of the ADs. In addition, the ease of use in combination
with the final chromatographic technique, thus GC-MS, is essential.

Chapter III: Sample preparation
Figure III.1. Decision scheme for the SPE development
Silica based apolar Bond Elut C18 Empore HD C8 RP-select B
Do the sorbents retain the antidepressants?
Yes
No water residues, thus shorter drying time ?
Yes No
SCXStrata XC
Silica based apolar, Strata X, Certify, WCX
High reproducible recovery? Yes
�SCX.
Ion-exchange SCX WCX
Polymeric Oasis HLB Focus Strata XPolymeric
mixed mode Strata XC (Strata X-SCX)
Silica based apolar, ion-exchange, mixed modes, and Strata X
Oasis HLB Focus
No irreproducible secondary interactions? Able to wash with MeOH (considerable shorter drying time)? An adequate eluent available? Yes
Yes No
Silica based mixed mode Certify (C8-SCX)
The decision scheme in Figure III.1. was used to select the best SPE sorbent
for our purposes. The retention onto the SPE sorbents was examined first.
Water samples, spiked with 1 μg/ml of each AD, were loaded onto the
conditioned columns. Then 2 ml of HPLC-grade water was loaded to wash the
column. The wash solution was collected and analyzed by HPLC. In addition,
the compounds were eluted with methanol-2% formic acid or methanol-5%
ammonia for the SCX and Strata XC phase. The eluent was analyzed to -89-

Chapter III: Sample preparation
-90-
evaluate the retention onto the column. The eluent was evaporated under
nitrogen at 40 °C and redissolved in 1 ml of the mobile phase (starting
conditions) of the HPLC. Fifty μl of this extract was injected onto the HPLC.
All sorbents retained the ADs, however, two of the polymeric sorbents (Focus
and Oasis HLB) also retained a lot of water, probably due to their hydrophilic
character. This necessitates a longer drying step, especially if gas
chromatography is used as the final analytical method, because derivatization
requires moisture free extracts [11, 14]. Therefore, these two phases were
not used for further experiments. Because all sorbents retained the ADs very
well, the further selection of sorbents was done during the optimization of the
loading, washing and eluting conditions. As shown in Figure III.1. several
findings during optimization of the SPE method (discussed in paragraph
III.3.2) lead to the conclusion that the strong-cation exchangers gave the
best results.
III.3.2. Choice of loading, washing and eluting conditions
Before loading the sample onto a SPE sorbent, a conditioning step is
necessary for reproducible interaction with the compounds. This conditioning
step consists of solvation of the SPE sorbent with methanol and the same
aqueous solution as in the loading step to ensure the same environment
during sample load. Before conditioning, the final eluent was passed through
the column, to elute possible contaminants of the column. Thus, the column
was conditioned with 3 ml of eluent, 2 ml of methanol, followed by 3 ml
aqueous solution.
The loading conditions were optimized according to the SPE sorbent. When
loading the samples on the silica based apolar phases, three different pH
values were used. The ADs were spiked (1 μg/ml) in HPLC-grade water, in a
water-formic acid mixture with pH 2.89 or a water-ammonia mixture with pH
of 10.80. For the C18, C8 and RP Select B, a slight difference was observed in
retention at different pH’s. Silica based apolair sorbents may still contain a
limited number of unreacted or ‘free’ silanols. These silanols provide polar,
acidic patches on the column surface capable of binding amines through
hydrogen bonding and cation exchange mechanisms. Since the ionization of

Chapter III: Sample preparation
-91-
the ADs depends on the loading conditions, interactions with these residual
silanols may cause an enhanced retention. These secondary interactions
could be interesting, but are not reproducible as the degree of endcapping,
and thus the number of free silanol functions can change from batch to
batch. When evaluating ion-exchange phases, the pH during the loading and
eluting step is again very important. For these sorbents a phosphate buffer
with pH 6.5 or 2.5 was used to load and retain the compounds onto the
sorbent. The pH during the loading step should be two pH units lower than
the pKa of the compounds and two pH units higher than the sorbent. At this
pH, approximately 99% of the groups are charged. A loading pH of 6.5 or 2.5
was chosen, according to the choice of a weak cation- (carboxyl pKa is 4.8)
or a strong cation exchanger (sulphonic acid pKa < 1). Especially for
trazodone and mirtazapine, a loading pH of 2.5 resulted to a better retention
onto the strong cation exchanger (SCX).
A wash step was introduced and optimized to elute as much as possible
interfering matrix compounds, without eluting the ADs. Methanol/water
(50/50, 70/30, 90/10, by vol.) and pure methanol were tested by washing
with 5 ml after sample load. The washing solvent, as well as the elution
solvent were analyzed. While pure methanol eluted several compounds
(especially trazodone) from the C18, C8, RP Select B, WCX, Certify and Strata
X sorbents, it did not elute any compound from the strong ion-exchangers.
Certify is a mixed mode of C8 and a strong cation exchanger, however,
methanol did elute ADs from the sorbent, perhaps because of the slightly
lower bed mass and the higher contribution of apolar processes as compared
to ion-exchange mechanisms. The WCX, in contrast to the strong cation
exchangers, gave a slight elution of some compounds, probably because the
ionic interaction of the sorbent with the ADs is weaker (Figure III.2.A). The
use of pure organic solvents for washing is interesting as it shortens the
drying time before elution and leads to clean and moisture free extracts.
Several possibilities for eluting the compounds were also studied.
Conditioning and loading of the samples were done as described above. After
drying, two times 1.2 ml (5 bed volumes) of eluent were added, collected
separately and analyzed. The tested eluting solvents were pure methanol,
methanol-2% formic acid, methanol-2% ammonia and methanol-5%

Chapter III: Sample preparation
ammonia. A fast, reproducible elution with a limited volume of solvent is the
most interesting. Therefore, it is advantageous if elution happens with the
first 1.2 ml of the eluent. Methanol-2% formic acid and methanol with 2%
ammonia gave good results for most of the sorbents. For the strong cation
exchangers 5% ammonia in methanol gave the highest elution within 5
bedvolumes (Figure III.2.B). Methanol-acid and methanol-base work on the
secondary interactions of the silica based phases. Under acidic conditions the
silanol functions are not charged, while under basic conditions the ADs are
not. For the strong cation exchangers acidic conditions were not successful,
as even at low pH the sulphonic groups remain negatively charged.
Figure III.2. Comparison of washing (A) and eluting (B) conditions for the
SPE sorbents
A
Comparison of washing conditions for different sorbent types
0
10
20
30
40
50
60
70
80
50/50 70/30 90/10 100% MeOH
washing conditions
aver
age
reco
very
in w
ashi
ngso
lutio
n fo
r all
AD
s (%
)
Silica based apolar Ionic mixed + WCX Polymeric
B
Comparison of eluent conditions for different sorbent types
0
20
40
60
80
100
120
MeOH MeOH 2% acid MeOH 2% base MeOH 5% base
eluting conditions
aver
age
reco
very
in e
luen
t fo
r all
AD
s (%
)
Silica based apolar Ionic mixedWCX Polymeric
-92-

Chapter III: Sample preparation
III.3.3. Final SPE method of ADs spiked in water samples
During the optimization of the loading, washing and eluting conditions, a final
selection of the most useful SPE sorbent was made (Figure III.1.).
Consequently, SPE tubes that retained water, SPE tubes that had
irreproducible secondary interactions (silica based) and/or loss of compounds
during the methanol wash were all left out for further investigation. Only the
SCX and Strata XC sorbent were selected. Because the ‘new’ generation ADs
have an amine-function a cation exchange mechanism was plausible.
Retention on both the SCX and Strata XC phases is based on this mechanism,
but Strata XC being a mixed-mode phase combining ion-exchange and a
styrene-divinylbenzene polymer, shows hydrophobic and aromatic
interactions as well. Combining different interaction mechanisms can be
interesting to extract a variety of compounds, but can also lead to co-
extraction of matrix compounds that are not of interest, leading to higher
background in the final analysis.
Table III.2. Recovery of ADs by a strong cation exchanger (SCX) or Strata XC
from water samples as determined by HPLC-DAD
Compound SCX Strata XC Compound SCX Strata XC Compound SCX Strata XCVenlafaxine 105 100 Mianserin 91 81 Citalopram 90 82m-cpp 115 105 Mirtazapine Maprotiline 92 78Viloxazine 85 67 Melitracen 88 80 Sertraline 84 73DMFluox 103 121 DMMia 87 75 DDMC 97 65Fluvoxamine 93 87 DMSer 86 68 DMC 96 92ODMV 108 94 DMMir Paroxetine 90 84Fluoxetine 89 94 Reboxetine 98 96 Trazodone 83 81
Recovery %
The recoveries for both columns were high and comparable as demonstrated
in Table III.2. However, the recoveries were slightly, but constantly lower
using Strata XC as compared to SCX. This result was also confirmed when
analyzing plasma samples (n=5) by GC-MS using the two SPE tubes as
described in our publication about the development of this solid phase
extraction [12]. Perhaps, the difference in recoveries can be explained due to
the domination of the ion-exchange mechanism on the retention. When using
a mixed-mode, the ion-exchange groups are less numerous. On the other
hand, methanol is not a good disruptor of hydrophobic and dipolar
-93-

Chapter III: Sample preparation
interactions [15]. Therefore, a small percentage of acetonitrile in the
methanol-ammonia eluent would probably neutralize these non-ionic
interactions during elution, leading to enhanced recovery yields for the Strata
XC.
Thus we decided to use the strong cation exchanger SCX for the further SPE
procedure. It consisted of a conditioning step with 3 ml of eluent, 2 ml of
methanol and 3 ml of phosphate buffer pH 2.5 followed the sample load.
After a wash step (4 ml of methanol) using –20 kPa vacuum, the column was
dried for 2 minutes at -50 kPa. Finally, the compounds were eluted with 2 ml
of 5% ammonia in methanol. The solid phase tubes were again dried for 1
minute using –50 kPa vacuum.
Figure III.3. HPLC chromatogram of AD mixture 1 and 2 after SPE extraction
from water using SCX
Mixture 1 contains in order of elution: ODMV, m-cpp, venlafaxine, DDMC, DMC, reboxetine, paroxetine, maprotiline, DMFluox, and fluoxetine. Mixture 2 contains in order of elution: viloxazine, trazodone, DMMia, citalopram, mianserin, fluvoxamine, DMSer, sertraline, and melitracen.
M ix tu r e 1
4 6 8 1 0 1 2 1 4 1 6 1 8 2 0 2 2 2 4 R e t e n t i o n t i m e ( m in u t e s )
m A U 6 0
3 0
0
M ix tu r e 2
4 6 8 1 0 1 2 1 4 1 6 1 8 2 0 2 2 2 4
R e t e n t i o n t i m e ( m in u t e s )
m A U 6 0
3 0
0
-94-

Chapter III: Sample preparation
-95-
III.4. Optimization of the SPE procedure for extraction of ADs
from biological matrices
The developed SPE procedure was now optimized for biological matrices such
as plasma, blood, brain tissue and hair samples, as the extraction of ADs
from these matrices is of interest in the field of clinical toxicology (plasma)
and forensic toxicology (blood, brain, hair).
For plasma and blood, the developed SPE method had to be optimized due to
their protein content. Most new generation ADs are highly bound to the
plasma proteins, mainly to �1-glycoprotein and to a lesser extent to albumin
and lipoproteins. ADs bind to �1-glycoprotein due to ionic interactions and
their lipophilicity. Albumin preferably binds the hydrophobic and anionic
compounds, thus less the positively charged ADs [16-20]. When using SPE as
sample preparation, protein binding can lower the analyte recovery, as the
active sites of the compounds that would normally interact with the sorbent
are not available for this interaction. Another problem caused by protein
binding is that proteins, as large molecules, prohibit penetration in the
sorbent pores. As a result, the drug is carried through the sorbent bed by the
protein instead of being retained [21].
For brain tissue, the sample preparation had to be adapted because of its
solid nature. In addition, the lipophilic ADs are not easily extracted from the
brain, as this matrix contains proteins and has a high lipid content.
Hair samples also have a solid nature, and can not just pass the SPE sorbent.
Moreover, ADs are incorporated in the hair structure during the process of
keratinization, preferentially in the cell membrane complex of the hair cortex
containing proteins and a protein-lipid structure [22]. Thus, the ADs had to
be extracted from the hair shafts prior to the SPE procedure.
While the protein binding disruption in plasma was studied using an HPLC-
DAD system, the optimization of SPE for blood, brain and hair was done using
a GC-MS configuration (paragraph III.2.5.). The recoveries for the different
optimized methods were all obtained using the final GC-MS configuration.

Chapter III: Sample preparation
-96-
III.4.1. SPE optimization for plasma samples
Because most of the ADs are highly bound to plasma proteins, a disruption of
this protein binding is necessary to obtain high recoveries from the SPE
sorbent. There are several ways to disrupt the binding. Dilution in
combination with a slow sorbent pass-through of the sample is used to
decrease the protein binding of drugs. In addition, before loading onto the
SPE sorbent bed a sonication or centrifugation step is often applied [23-27].
On the other hand, changes in protein binding depend on temperature, pH,
protein content and molecules that compete for the same sites on the
protein. Thus, change of pH or addition of salt can also modify the protein
binding. Denaturation of the protein by adding organic solvents to the sample
is another method used. The above mentioned protein binding disruption
methods were tested. However, as an ion-exchange procedure is used,
addition of salts was not tested as they could interact with the SPE sorbent,
leading to lower recovery of the compounds of interest.
Plasma samples (1 ml) were spiked with therapeutic concentrations of ADs
and equilibrated overnight at 4°C, to simulate the protein binding. Afterwards
the spiked plasma was submitted to SCX SPE-tubes after a deproteinization
with different reagents. Standard mixtures were also analyzed as these
represent 100% of free ADs. Acid (2% H3PO4), glycine-buffer, methanol and
acetonitrile were tested for their capacity to break the protein bond. Dilution
of the sample with phosphate buffer (pH 2.5; 25 mM) in combination with
slow pass-through of the sample was also tested. The procedures for the
acid/buffer and for the organic solvents involved addition of 3 ml of the
substances to the plasma, and a vortex step followed by centrifugation for 10
minutes at 1121 g. The glycine-buffer required an extra 10 minutes
equilibration-stirring time before centrifugation. The top layer was then
removed and, respectively, 4 to 6 ml of phosphate buffer was added to the
acid/buffer top layer and the organic top layer. The diluting procedure was
achieved by adding 4 ml of phosphate buffer buffer pH 2.5 to the plasma, a
vortex and centrifugation step.
When testing the different methods, it seemed that the organic solvents such
as methanol and acetonitrile gave the worst results. Organic solvents lead to

Chapter III: Sample preparation
a quick protein denaturation, but also to co-precipitation of the ADs and thus
loss of these ADs. The glycine buffer and dilution method gave the best
results (Figure III.4.).
Figure III.4. Comparison of protein binding disruption methods
The average recovery of all ADs was calculated for the different protein binding
disruption methods (n=5 for each method and each AD). The lowest and highest
recovery value (for a specific AD) obtained for each method are indicated.
Protein binding disruption
76
62
73
8988
0
20
40
60
80
100
120
glycin dilution acid acetonitrile meoh
aver
age
reco
very
(%)
It was clear that a pH change of the sample led to a higher amount of
unbound ADs. At pH 3 the proteins (iso-electric point of �1-glycoprotein:
3.53) [28] will carry less negative charges than under physiological
conditions, thus the ADs that are positively charged in those conditions, will
show less ionic interactions [17]. In addition, at the iso-electric point there is
no net charge and thus the solubility of the protein decreases, leading to a
fractional protein precipitation. Not only the pH was of importance as a
significant difference in ADs liberation was seen between the acid method
and the glycine or dilution method when using an ANOVA-test (p<0.02,
except for DMSer and DDMC). Glycine wil compete with ADs for the binding
sites on the �1-glycoproteins. Dilution will change the equilibration status of
bound and unbound ADs; thus will weaken the protein-drug binding.
Moreover, dilution increases the time of eventual contact of the drugs with
the adsorbent. Because of practical considerations, the method of choice for
protein binding disruption was dilution of the plasma samples (1 ml) with
-97-

Chapter III: Sample preparation
phosphate buffer pH 2.5 (4 ml, 25 mM) and a centrifugation step at 1200 g
for 10 minutes. The sample was thereafter transferred to the SPE procedure.
III.4.2. SPE optimization for blood samples
For the blood samples, dilution of the sample with the phosphate buffer pH
2.5 resulted in a disruption of the protein binding of the ADs and in an ideal
loading pH for the SPE as for the plasma samples. However, in contrast to
plasma samples, the diluted blood sample was not centrifuged as it leads to
irreproducible and lower extraction efficiencies (Table III.3.).
Table III.3. Differences in recovery after centrifugation or sonication of the
diluted blood sample (n=6, *n=5)
Low, 20 ng/ml; Mid, 200 ng/ml; High, 500 ng/ml
compoundLow Mid High Low Mid High
Venlafaxine 38 (38) 99 (16) 99 (8) 51* (21) 101 (14) 93 (7)m-cpp 52 (46) 83 (5) 80 (21) 92 (14) 93 (9) 101 (7)Viloxazine 76 (31) 87 (5) 79 (15) 91 (8) 97 (10) 105 (7)DMFluox 71 (38) 64 (9) 62 (17) 93 (12) 93 (6) 100 (6)Fluvoxamine 86 (22) 81 (6) 72 (16) 95 (13) 99 (18) 104 (9)ODMV 82 (29) 62 (24) 100 (15) 95 (30) 103 (20)Fluoxetine 42 (34) 62 (7) 64 (14) 80 (9) 89 (7) 100 (5)Mianserin 73 (7) 75 (9) 75 (5) 87 (6) 99 (8) 104 (3)Mirtazapine 89 (7) 84 (11) 84 (3) 79 (10) 98 (8) 99 (4)Melitracen 62 (10) 75 (9) 63 (11) 80 (8) 100 (9) 101 (5)DMMia 42 (14) 84 (11) 78 (16) 82 (16) 102 (13) 92 (7)DMSer 54 (32) 34 (28) 51 (25) 94* (15) 92 (11) 102 (5)DMMir 67 (12) 116 (9) 97 (12) 83 (12) 103 (12) 94 (6)Reboxetine 73 (14) 67 (13) 87 (16) 87 (12) 92 (8) 105 (7)Citalopram 94 (17) 60 (13) 75 (9) 84 (21) 89 (14) 106 (13)DMMap 66 (38) 48 (10) 60 (23) 91* (14) 79 (23) 96 (14)Maprotiline 44 (35) 51 (16) 67 (19) 83 (14) 76 (14) 96 (5)Sertraline 25 (46) 30 (15) 30 (23) 73 (18) 82 (17) 93 (17)DDMC 102 (38) 76 (6) 80 (13) 85 (15) 87 (19) 97 (10)DMC 60 (37) 69 (6) 79 (17) 84 (15) 82 (13) 96 (5)Paroxetine 42 (34) 59 (9) 67 (17) 92 (18) 81 (12) 95 (4)
Recovery (%) (RSD%) Blood centrifugated Blood sonicated
The separation of supernatant from the cell debris was not very clear and
probably leads to these irreproducible results. Moreover, co-precipitation of
ADs with the red blood cell fragments can lead to recovery loss, because ADs
are bound to red blood cell membranes due to their amphiphilic character.
ADs are also bound to proteins attached in the bilayer structure of this
membrane [29, 30]. Thus, before the sample was transferred to the SPE
-98-

Chapter III: Sample preparation
-99-
procedure, 1 ml of blood was diluted with 4 ml of a 25-mM phosphate buffer
pH 2.5 and sonicated for 15 minutes.
III.4.3. SPE optimization for brain samples
For brain tissue, the sample preparation had to be adapted due to the lipid
content of the brain and the lipophilic ADs (Table III.4.). Brain tissue (1 g)
was spiked with 500 ng of each AD and was mixed after addition of 2 ml of
acetonitrile, or a mixture of acetonitrile (2 ml) and 0.5 ml potassium
carbonate buffer (1M pH 9.5). After centrifugation for 15 minutes at 1850 g,
the top-layer was removed. The top-layer was then evaporated and
redissolved in phosphate buffer (pH 2.5; 25 mM) or diluted with this buffer.
After dilution of the acetonitrile phase with phosphate buffer, the pH was 6-7.
Therefore, compounds such as mirtazapine, mianserin and Md3 with a pKa of
about 7.05 will not be positively charged and thus not trapped by the cationic
phase. The pH of the diluted sample was thus adapted to 2-3 with
orthophosphoric acid before it was submitted to the SPE-procedure.
Table III.4. indicates that extraction with acetonitrile is necessary to have
high and reproducible extraction efficiencies. Acetonitrile disrupts the
hydrophobic and dipolar interactions and extracts the ADs from the lipid rich
matrix. An evaporation step of the acetonitrile phase seemed unnecessary
and even led to a higher variation. Therefore the acetonitrile phase could be
diluted before SPE leading to a shorter analysis time. The potassium
carbonate buffer in combination with acetonitrile lead to higher extraction
efficiencies, especially for melitracen, desmethylmianserin, desmethyl-
mirtazapine, sertraline and desmethylsertraline.
In conclusion, before the sample was transferred to the SPE procedure, 1 g of
brain tissue was mixed with 2 ml of acetonitrile and 0.5 ml of potassium
carbonate buffer (1M pH 9.5). After centrifugation, the top layer was diluted
with 4 ml of 25-mM phosphate buffer pH 2.5.

Chapter III: Sample preparation
Table III.4. Differences in SPE recovery of ADs from brain tissue using a
phosphate buffer (pH 2.5; 25 mM), acetonitrile (ACN) and phosphate buffer,
ACN and evaporation, and ACN with a potassium carbonate buffer as sample
pre-treatment
compound buffer* ACN + buffer ACN ACN + baseVenlafaxine 74 (11) 67 (6) 83 (21) 90 (18)m-cpp 32 (42) 76 (3) 67 (15) 84 (6)Viloxazine 61 (16) 80 (6) 63 (12) 83 (13)DMFluox 8 (68) 60 (6) 39 (14) 75 (11)Fluvoxamine 18 (49) 66 (5) 43 (7) 77 (10)ODMV 73 (23)Fluoxetine 8 (68) 71 (5) 47 (21) 70 (6)Mianserin 13 (63) 71 (7) 66 (35) 90 (15)Mirtazapine 42 (27) 67 (1) 65 (26) 78 (20)Melitracen 17 (124) 49 (8) 63 (30) 100 (13)DMMia 12 (99) 48 (10) 68 (30) 95 (6)DMSer 4 (58) 36 (2) 21 (34) 71 (3)DMMir 39 (70) 63 (6) 76 (26) 98 (9)Reboxetine 33 (42) 86 (7) 44 (30) 70 (4)Citalopram 35 (30) 66 (12) 36 (23) 62 (15)DMMap 5 (63) 43 (14) 25 (28) 61 (20)Maprotiline 6 (63) 56 (17) 37 (33) 66 (20)Sertraline 4 (80) 47 (1) 45 (34) 107 (6)DDMC 22 (35) 78 (5) 54 (18) 77 (15)DMC 27 (33) 84 (4) 56 (23) 74 (10)Paroxetine 5 (68) 58 (3) 31 (30) 60 (9) n=3*n=5
Recovery (%) (RSD%)
III.4.4. SPE optimization for hair samples
ADs have to be extracted from the solid hair strains before SPE. The most
common procedures involve the use of methanol or aqueous acids, and
solubilization of the hair by digestion of the hairshaft with aqueous sodium
hydroxide or specific enzymes [22].
Methanol is used together with sonication to liberate the drugs from the
swelling hair through diffusion. While this method is very useful for neutral
and lipophilic compounds, it seems that AD drugs are not easily liberated
from hair with this method [31]. Extraction of basic drugs from hair using
aqueous acids or buffer solutions is based on protonation. Digestion of the
hair with sodium hydroxide leads to solubilization of the hair and to a high
extraction efficiency for basic compounds. Enzymatic digestion by pronase
and proteinase K can hydrolyze hair proteins and reduce disulfide bonds in -100-
Chapter III: Sample preparation
-101-
the hair. However, most of the time enzymatic extracts have a very high
impurity level. Moreover, Couper et al. [31, 32] found that TCAs were better
extracted using sodium hydroxide as compared to methanol, enzymatic
digestion or an aqueous acid.
Tuhe first concern before extracting ADs from hair is their stability in the
extraction solutions. ADs were spiked in concentrations around 500 ng/ml in
different extraction media. Stability in methanol was not determined at this
point, as the ADs stock solutions in methanol (1 mg/ml) were stable for at
least 3 months. The stability in sodium hydroxide at different concentrations,
temperature and contact time was tested. Indeed, Uges and Conemans [1]
described that most ADs (TCAs) are not stable under alkaline conditions in
daylight. Several conditions were selected whereby the hair samples were
fully dissolved. Temperature seemed critical for hair solubilization, and a
higher temperature allowed a shorter contact time with the sodium
hydroxide. The sodium hydroxide concentration varied from 0.25 to 1 M, the
temperatures used were 55, 80 and 100°C, and the duration for
solubilization, depending on the NaOH concentration and temperature ranged
from 10 till 90 minutes. The stability of the compounds was also tested in a
0.1-M HCl medium and in a phosphate buffer (pH 2.5, 25 mM) for 18 hours
at 55°C. These conditions were chosen according to the extraction methods
seen in literature [31].
Digesting hair (±20 mg) at 100°C during 10 minutes with 1 M NaOH gave
good results and was preferred because of the short contact time. However,
as depicted in Figure III.5., it is clear that some compounds are not stable in
this alkaline medium under these conditions. Instability was observed for
venlafaxine (30% loss), citalopram, DMC and DDMC (60-93% loss). No
degradation was observed in acidic environment, except for fluvoxamine
when 0.1 M HCl was used.
Because of stability reasons it would be better to select the extraction with
phosphate buffer. In addition, this method results in an easy sample handling
as the extraction solution can be transferred to the SPE sorbent directly.
However, according to Couper et al. [32] the extraction efficiency by an
aqueous acid is about 50% as compared to the sodium hydroxide digestion

Chapter III: Sample preparation
method. Indeed, when hair is solubilized, the matrix is totally destroyed and
the analytes are liberated from the hair. Extraction with an aqueous acid or
buffer will only recover the analytes in the outher layers and will not
penetrate the core of the hair shaft. Because of sensitivity and stability issues
the two procedures were necessary for post-mortem hair analysis.
Figure III.5. Stability of ADs during extraction from hair samples (n=2)
Stability of ADs
020406080
100120140160180200
m-cpp
DMFluox
fluvo
xamine
viloxa
zine
fluox
etine
mianse
rine
venla
faxine
mirtaza
pine
melitra
cen
DMMia
DMMir
reboxe
tine
DMSer
sertra
line
citalo
pram
DMMap
maprot
ilineDDMC
DMC
parox
etine
trazo
done
Antidepressants
% R
ecov
ery
55°C 1M 50' 80°C 0.25M 90' 80°C 1M 30' 100°C 1M 10'100°C 0.25M 20' HCl 0.1M phosphate buffer
The final sample preparation for hair samples consisted of a wash step in
HPLC-grade water for 5 minutes, and a rinse with 3 times 1 ml of methanol
to remove possible external contamination and dirt from the surface of the
hair. Thereafter, hair samples were cut in segments of approximately 2 cm.
The hair segments were digested in a sodium hydroxide solution (1 M, 1 ml)
for 10 minutes at 100°C. Before SPE, the samples were diluted with
phosphate buffer and the pH was adapted to 2-3 with orthophosphoric acid.
If compounds were not stable in the sodium hydroxide solution such as
citalopram, DMC, DDMC and venlafaxine, hair segments were soaked in 4 ml
of the phosphate buffer (pH 2.5; 25 mM) for 18 hours at 55°C and sonicated
for 1 hour.
-102-

Chapter III: Sample preparation
III.4.5. Recovery of ADs using SPE from plasma, blood, brain tissue
The recovery for each analyte was determined at low (20 ng), medium (200
ng) and high (500 ng) or super high (1000 ng) concentration. Therefore,
standard working solutions were spiked in blank samples before (extraction
samples) or after sample preparation (control samples). Each experiment
was repeated six times. Outliers were eliminated when the obtained results
deviated more than ± 3 standard deviations from the mean (*n=5). Since
quantification was performed by the peak area ratios of the target analytes
and the internal standard, the internal standards were always added after
sample pre-treatment, before derivatization, and the resultant peak area
ratios were compared. The recovery was expressed by its average and
relative standard deviation (RSD).
Recovery of ADs from hair is not determined as spiked samples do not reflect
reality. Compounds are incorporated in the interior of the hair through
diffusion from blood, sweat or sebum. When samples are spiked, the
compounds are spiked onto the hair, and this would lead to false high
recoveries.
Table III.5. SPE recovery of ADs from plasma, blood and brain tissue (n=6)
compound
Venlafaxine 104 (3) 95 (4) 95 (2) (21) 101 (14) 93 (7) 38 (19) 46 (17) 45* (13)m-cpp 91 (4) 92 (7) 96 (5) 92 (14) 93 (9) 101 (7) 85 (16) 99 (8) 80 (9)DMFluox 107* (12) 91 (7) 91* (5) 93 (12) 93 (6) 100 (6) 82 (12) 79 (5) 69 10)Viloxazine 104 (14) 96 (5) 92 (5) 91 (8) 97 (10) 105 (7) 58 (7) 62 (4) 56* (8)Fluvoxamine 102 (2) 104 (8) 97 (18) 95 (13) 99 (18) 104 (9) 44 (16) 43 (7) 35* (10)Fluoxetine 98 (12) 94 (2) 96 (2) 80 (9) 89 (7) 100 (5) 75 (8) 71 (5) 73 (6)Mianserin 95 (4) 94 (3) 94 (3) 87 (6) 99 (8) 104 (3) 81 (11) 80 (5) 81 (7)Mirtazapine 95 (6) 92 (3) 93 (3) 79 (10) 98 (8) 99 (4) 77 (11) 78 (7) 85 (5)Melitracen 101 (5) 93 (3) 93 (3) 80 (8) 100 (9) 101 (5) 75 (13) 83 (6) 80* (8)DMMia 101 (4) 98 (4) 91 (2) 82 (16) 102 (13) 92 (7) 70 (9) 81 (10) 78* (15)DMSer 98 (11) 88 (7) 104 (10) 94* 15) 92 (11) 102 (5) 77 (6) 70 (11) 76 (6)DMMir 99 (4) 95 (2) 92 (3) 83 (12) 103 (12) 94 (6) 74 (12) 78 (8) 78 (11)Reboxetine 99 (3) 97 (3) 95 (1) 87 (12) 92 (8) 105 (7) 51 (18) 60 (8) 59* (4)Citalopram 88 (8) 87 (9) 94 (5) 84 (21) 89 (14) 106 (13) 61 (16) 73 (5) 78* (4)Maprotiline 72* (14) 88 (3) 90 (6) 83 (14) 76 (14) 96 (5) 54 (12) 59 (8) 81 (6)DMMap 92 (15) 86 (5) 86 (6) 91* (14) 79 (23) 96 (14) 51 (15) 57 (10) 78 (4)Sertraline 82 (6) 89 (11) 96 (5) 73 (18) 82 (17) 93 (17) 90 (16) 73 (3) 82* (11)DDMC 94* (11) 85 (7) 88 (6) 85 (15) 87 (19) 97 (10) 69 (10) 69 (5) 74 (8)DMC 80 (13) 88 (4) 90 (5) 84 (15) 82 (13) 96 (5) 66 (4) 69 (3) 68* (4)Paroxetine 94 (11) 91 (2) 95 (2) 92 (18) 81 (12) 95 (4) 72 (11) 73 (7) 80 (6)*n=5
BrainMid High S.High
Recovery (%) (RSD%)
Low 51*
Mid HighLow Mid HighPlasma Blood
Table III.5. indicates high, reproducible and concentration independent
recoveries ranging from 82-105% for all ADs from plasma. The recoveries for
ODMV and trazodone are not shown in this table as they are not reproducible
using GC-MS as detection technique, due to an irreproducible derivatization -103-

Chapter III: Sample preparation
-104-
(chapter IV) and problematic chromatography (chapter V), respectively. The
SCX extraction leads to reproducible and high recovery from blood for most
compounds if no centrifugation step is included (Table III.3.). Recoveries
from blood range between 73-106 %, except for venlafaxine (51%). The
recoveries from blood samples are comparable to these from plasma.
ADs recoveries from plasma and blood were determined at low (20 ng/ml),
mid (200 ng/ml) and high (500 ng/ml) concentrations, while brain tissue
recoveries were determined at mid, high and super high concentration (1000
ng/g). This was chosen as brain concentrations found in literature were much
higher than blood or plasma concentrations [33-35]. The extraction
efficiencies for brain tissue are slightly lower than for plasma and blood.
Especially venlafaxine and fluvoxamine gave low extraction efficiencies.
However, recovery of the ADs from brain tissue is reproducible.
III.5. Conclusion
A solid phase extraction using a strong cation exchanger was developed for
the new generation ADs and their metabolites. The final SPE procedure
conditioned the sorbent with 3 ml of eluent, 2 ml of methanol and 3 ml of
phosphate buffer pH 2.5 followed by the sample load. After a wash step (4 ml
of methanol) using –20 kPa vacuum, the column was dryed for 2 minutes at -
50 kPa. Finally, the compounds were eluted with 2 ml of 5% ammonia in
methanol. The solid phase tubes were again dried for 1 minute using –50 kPa
vacuum.
The sample treatment before the load procedure onto the SPE sorbent was
optimized for several biological matrices such as plasma, blood, and brain
tissue as they have a different protein and lipid content. The samples were
always diluted with 4 ml of the 25-mM phosphate buffer pH 2.5 and the pH
was adapted with orthophosphoric acid if necessary, before loading onto the
strong cation exchanger. In addition, plasma was centrifuged at 1200 g for
10 minutes, while blood was sonicated for 15 minutes. Brain tissue had to be
treated by an acetonitrile/K2CO3 (2/0.5 ml/g) mixture before dilution with the
buffer, due to the lipophilic matrix. Solubilization of the hair was necessary
before SPE extraction. 1M NaOH at 100°C during 10 minutes was used for

Chapter III: Sample preparation
this purpose. For instable compounds such as venlafaxine, citalopram and its
metabolites, hair was extracted using phosphate buffer (pH 2.5; 25mM)
during 18 hours at 55°C and sonication for 1 hour.
Figure III.6. Sample preparation scheme
-105-
Plasma (1ml)
Blood (1ml)
Brain (1g)
Hair (± 20mg)
Top layer
Top layer
Addition 2 ml ACN/ 0.5 ml
K2CO3
Mixing sample
Centrifugation 1200g 10’
Dilution mM4 ml of 25-
phosphate buffer pH 2.5
pH adjusting
orthophosphoric acid
Dilution mM4 ml of 25-
phosphate buffer pH 2.5
Centrif ationu1200
gg
10’
Dilution mM4 ml of 25-
phosphate buffer pH 2.5
Sonication 15’
Destruction 1 M NaOH 100 °C 10’
Diffusion- mM4 ml of 25
phosphate b fferu pH 2.5
55 °C 18 h
Sonication 1 h
Dilution mM4 ml of 25-
phosphate buffer pH 2.5
pH adjusting
orthophosphoric acid
Centrif ationu1200
gg
10’
Top layer
Solid phase extraction
Strong cation exchange
Column conditioning
3 ml of eluent
2 ml of MeOH 3 ml of 25-mM
phosphate buffer pH 2.5
Sample load
Column Wash
4 x 1 ml of MeOH
Eluting step
2 x 1 ml of 5% ammonia in MeOH
Sample pre-treatment

Chapter III: Sample preparation
-106-
When these procedures were followed as indicatied in Figure III.6., the
recoveries for the ADs from the different matrices were high and
reproducible.
III.6. References
[1] Uges DRA, Conemans JMH. Antidepressants and antipsychotics. Handbook of Analytical Separations, Elsevier, Amsterdam, 2000, pp. 742
[2] Goeringer KE, Raymon L, Christian GD, Logan BK. Postmortem forensic toxicology of selective serotonin reuptake inhibitors: A review of pharmacology and report of 168 cases. J. Forensic Sci. 2000; 45: 633-648
[3] Kim KM, Jung BH, Choi MH, Woo JS, Paeng KJ, Chung BC. Rapid and sensitive determination of sertraline in human plasma using gas chromatography-mass spectrometry. J. Chromatogr. B 2002; 769: 333-339
[4] Eap CB, Bouchoux G, Amey M, Cochard N, Savary L, Baumann P. Simultaneous determination of human plasma levels of citalopram, paroxetine, sertraline, and their metabolites by gas chromatography mass spectrometry. J. Chromatogr. Sci. 1998; 36: 365-371
[5] Titier K, Castaing N, Scotto-Gomez E, Pehourcq F, Moore N, Molimard M. High-performance liquid chromatographic method with diode array detection for identification and quantification of the eight new antidepressants and five of their active metabolites in plasma after overdose. Ther. Drug Monit. 2003; 25: 581-587
[6] Lacassie E, Gaulier JM, Marquet P, Rabatel JF, Lachatre G. Methods for the determination of seven selective serotonin reuptake inhibitors and three active metabolites in human serum using high-performance liquid chromatography and gas chromatography. J. Chromatogr. B 2000; 742: 229-238
[7] Duverneuil C, de la Grandmaison GL, de Mazancourt P, Alvarez JC. A high-performance liquid chromatography method with photodiode-array UV detection for therapeutic drug monitoring of the nontricyclic antidepressant drugs. Ther. Drug Monit. 2003; 25: 565-573
[8] Gutteck U, Rentsch KM. Therapeutic drug monitoring of 13 antidepressant and five neuroleptic drugs in serum with liquid chromatography-electrospray ionization mass spectrometry. Clin. Chem. Lab. Med. 2003; 41: 1571-1579
[9] Gupta RN. Drug level monitoring-antidepressants. J. Chromatogr. 1992; 576: 183-211
[10] Walker V, Mills GA. Solid-phase extraction in clinical biochemistry. Ann. Clin. Biochem. 2002; 39: 464-477
[11] Huck CW, Bonn GK. Recent developments in polymer-based sorbents for solid-phase extraction. J. Chromatogr. A 2000; 885: 51-72
[12] Wille SMR, Maudens KE, Van Peteghem CH, Lambert WEE. Development of a solid phase extraction for 13 'new' generation antidepressants and their active metabolites for gas chromatographic-mass spectrometric analysis. J. Chromatogr. A 2005; 1098: 19-29
[13] Van Horne KC. Sorbent extraction technology. Analytichem International, 1985, pp. 142
[14] Pyrzynska K. Novel selective sorbents for solid-phase extraction. Chem. Anal. 2003; 48: 781-795

Chapter III: Sample preparation
-107-
[15] Snyder LR, Kirkland JJ, Glajch JL. Practical HPLC method development. John Wiley and sons, Inc., Hoboken, 1997, pp. 765
[16] Kratochwil NA, Huber W, Müller F, Kansy M, Gerber PR. Predicting plasma protein binding of drugs: a new approach. Biochem. Pharmacol. 2002; 64: 1355-1374
[17] Fournier T, Medjoubi N, Porquet D. Alpha-1-acid glycoprotein. Biochim. Biophys. Acta 2000; 1482: 157-171
[18] Bertucci C, Domenici E. Reversible and covalent binding of drugs to human serum albumin: Methodological approaches and physiological relevance Curr.Med. Chem. 2002; 9: 1463-1481
[19] Pike E, Skuterud B, Kierulf P, Bredesen JE, Lunde PKM. The relative importance of alubmin, lipoproteins and orosomucoid for drug serum binding. Clin. Pharmacokinet. 1984; 9: 84-85 S81
[20] Piafsky KM. Disease-induced changes in the plasma binding of basic drugs. Clin. Pharmacokinet. 1980; 5: 246
[21] Varian. Handbook of sorbent extraction technology. 1998; pp. 138
[22] Pragst F, Balikova M. State of the art in hair analysis for detection of drug and alcohol abuse. Clin. Chim. Acta 2006; 370: 17-49
[23] Martinez MA, de la Torre CS, Almarza E. A comparative solid-phase extraction study for the simultaneous determination of fluvoxamine, mianserin, doxepin, citalopram, paroxetine, and etoperidone in whole blood by capillary gas-liquid chromatography with nitrogen-phosphorus detection. J. Anal. Toxicol. 2004; 28: 174-180
[24] Frahnert C, Rao ML, Grasmader K. Analysis of eighteen antidepressants, four atypical antipsychotics and active metabolites in serum by liquid chromatography: a simple tool for therapeutic drug monitoring. J. Chromatogr. B 2003; 794: 35-47
[25] Molander P, Thomassen A, Kristoffersen L, Greibrokk T, Lundanes E. Simultaneous determination of citalopram, fluoxetine, paroxetine and their metabolites in plasma by temperature-programmed packed capillary liquid chromatography with on-column focusing of large injection volumes. J.Chromatogr. B 2002; 766: 77-87
[26] Bakkali A, Corta E, Ciria JI, Berrueta LA, Gallo B, Vicente F. Solid-phase extraction with liquid chromatography and ultraviolet detection for the assay of antidepressant drugs in human plasma. Talanta 1999; 49: 773-783
[27] Lai CK, Lee T, Au KM, Chan AYW. Uniform solid-phase extraction procedure for toxicological drug screening in serum and urine by HPLC with photodiode-array detection. Clin. Chem. 1997; 43: 312-325
[28] Pruvost A, Ragueneau I, Ferry A, Jaillon P, Grognet JM, Benech H. Fully automated determination of eserine N-oxide in human plasma using on-line solid-phase extraction with liquid chromatography coupled with electrospray ionization tandem mass spectrometry. J. Mass Spectrom. 2000; 35: 625-633
[29] Fisar Z, Fuksova K, Sikora J, Kalisova L, Velenovska M, Novotna M. Distribution of antidepressants between plasma and red blood cells. Neuroendocrinol. Lett. 2006; 27: 307-313
[30] Hinderling PH. Red blood cells: a neglected compartment in pharmacokinetics and pharmacodynamics. Pharmacol. Rev. 1997; 49: 279-295
[31] Couper FJ, McIntyre IM, Drummer OH. Extraction of psychotropic drugs from human scalp hair. J. Forensic Sci. 1995; 40: 83-86

Chapter III: Sample preparation
-108-
[32] Couper FJ, McIntyre IM, Drummer OH. Detection of Antidepressant and Antipsychotic-Drugs in Postmortem Human Scalp Hair. J. Forensic Sci. 1995; 40: 87-90
[33] Martin A, Pounder DJ. Postmortem Toxicokinetics of Trazodone. Forensic Sci. Int. 1992; 56: 201-207
[34] Bolo NR, Hode Y, Nedelec JF, Laine E, Wagner G, Macher JP. Brain pharmacokinetics and tissue distribution in vivo of fluvoxamine and fluoxetine by fluorine magnetic resonance spectroscopy. Neuropsychopharmacol. 2000; 23: 428-438
[35] Wenzel S, Aderjan R, Mattern R, Pedal I, Skopp G. Tissue distribution of mirtazapine and desmethylmirtazapine in a case of mirtazapine poisoning. Forensic Sci. Int. 2006; 156: 229-236

Chapter IV
Derivatization

Chapter IV: Derivatization
- 111 -
IV.1. Introduction
Derivatization is a common sample preparation technique before gas
chromatographic analysis. This reaction modifies the chemical functionality of
a compound to increase its volatility and stability. In addition, it reduces
analyte adsorption onto the column, leading to less tailing and thus an
improved peak shape. Furthermore, it can improve detector response by
adding specific functional groups onto the compounds and it can facilitate the
separation of the compounds-of-interest from other substances present in the
extract. The choice of derivatizing reagent depends on the functional groups
of the compounds-of-interest and the demands of the user [1, 2].
Gas chromatographic analysis of free (underivatized) amines such as ADs is
generally unsatisfactory due to adsorption and decomposition of the analytes
on the column. These effects increase from tertiary to secondary amines and
are the worst for primary amines. Therefore, the predominant reason for
derivatization of the ADs is the improvement of their chromatographic
characteristics by decreasing their polarity. The antidepressants (ADs)
monitored in this work can be chemically classified as ADs containing an
alcohol, a primary, secondary or tertiary amine. These ADs, except for the
tertiary amine group, contain active hydrogens which can be derivatized
(Figure IV.1.)
The three most applied derivatization reactions are silylation, alkylation and
acylation.
Silylation replaces active hydrogens by a silyl group and reduces the polarity
and hydrogen bonding of the compound. However, the excess of
derivatization product will also be injected onto the gas chromatographic
system which leads to contamination of the whole system and in-situ
derivatization of all injected compounds. In addition, silicium dioxide deposits
in the ion source can affect the mass selective detector [3, 4]. Therefore, a
gas chromatographic system reserved only for silylated samples is necessary
and this was not an option in the laboratory.

Chapter IV: Derivatization
Figure IV.1. Structures of ADs with indication of the replaced hydrogen
functions during derivatization (italic functions)
Bold functions are those that are demethylated in the metabolization process. The arrow indicates the N-dealkylation of the piperazinyl nitrogen resulting in the formation of m-chlorophenylpiperazine. 1: Venlafaxine, 2: Fluvoxamine, 3: Sertraline, 4: Maprotiline, 5: Trazodone, 6: Citalopram, 7: Paroxetine, 8: Viloxazine, 9: Fluoxetine, 10: Reboxetine, 11: Mirtazapine, 12: Mianserin, 13: Melitracen.
- 112 -
Alkylation involves replacement of active hydrogens by an alkyl group. In this
case the polarity of the compound will be decreased and the volatility will
increase.
The acylation reaction converts compounds that contain active hydrogens
(NH, OH, SH groups) into amides, esters or thioesters through the action of
an activated carboxylic acid. Besides advantages such as decreased polarity,
OHN
OCH3
CH3
CH3
F3C
NO
O CH3
NH2
NH
Cl
Cl
CH3
NH
CH3
N NN
NN
O
Cl
OCN
N
F
CH3
CH3
F3C
O NH
CH3
N
NCH3
CH3OO
ONH
NN
NCH3
NH
F
O
O
O
NH
OO
O CH3
CH3 CH3
NCH3
CH3
1 2 3
54
76
1098
1211
13
Chapter IV: Derivatization
- 113 -
increased volatility and stability, another advantage of acylation can be the
increased sensitivity of the derivative with electron capture or negative ion
chemical ionization mass detection due to the combination of halogen atoms
and the carbonyl group. Moreover, acylation benefits the formation of
fragmentation-directing derivatives for gas chromatographic-mass
spectrometric analysis. Therefore, the acylation reaction was chosen as most
promising derivatization reaction for the monitored ADs.
The two acylation reactions tested were the acetylation reaction, using acetic
anhydride and pyridine, and heptafluorobutyrylation. Derivatization with
acetic anhydride was the first choice, as this reagent is largely used in
systematic toxicological analysis [5-8]. However, when negative ion chemical
ionization became an option during the research period, 1-(heptafluoro-
butyryl) imidazole (HFBI) and heptafluorobutyric anhydride (HFBA) became
first choice because of detection and sensitivity issues [1, 2].
Pentafluorobenzyl chloroformate was another interesting option as it
contained fluorine atoms which would increase sensitivity in negative ion
chemical ionization mode such as for the HFB-reagents, but in addition, it is
directly applicable in an aqueous environment and it could derivatize tertiary
amines [9]. However, as our aim was to analyze ADs and their demethylated
metabolites pentafluorobenzyl chloroformate could not be applied. No
difference would be observed between the derivatized parent compound and
its demethylated metabolite as the reagent rather replaces the hydrogen
atom than the methyl group on the nitrogen-function in the metabolite
structure.
Thus acetic anhydride (acetylation), heptafluorobutyric anhydride and hepta-
fluorobutyryl imidazole (heptafluorobutyrylation) were used as derivatization
reagents and their respective optimized derivatization procedures for the ADs
are discussed in this chapter.

Chapter IV: Derivatization
- 114 -
IV.2. Experimental
IV.2.1. Reagents
ADs standards used during optimization of the derivatization were the same
as described in chapter III (III.2.1.). Pyridine, acetic anhydride, and
heptafluorobutyric anhydride (HFBA) were purchased from Sigma-Aldrich
(Steinheim, Germany), while 1-(heptafluorobutyryl) imidazole (HFBI) was
purchased at Pierce (Perbio, Erembodegem, Belgium). Promochem
(Molsheim, France) delivered mianserin-d3 (100 μg/ml MeOH). Water (HPLC-
grade), ammonia-solution 25%, triethylamine and toluene (Suprasolv) were
purchased from Merck (Darmstadt, Germany).
IV.2.2. Preparation of standard solutions
Primary stock solutions of each individual AD were prepared in methanol at a
concentration of 1 mg/ml and stored at -20°C. A standard mixture 0.1 mg/ml
was obtained by mixing these individual primary stock solutions.
Depending on the type of experiment, the ADs concentrations were chosen.
For determination of spectra primary stock solutions were used. For
comparison of the different derivatization reagents, 40 ng on-column was
used to detect underivatized compounds in scan mode. For comparison of
HFB-reagents, 4 ng was injected onto the column and monitored in selected
ion monitoring mode.
When validating the final derivatization procedure, a standard mixture was
obtained by mixing the individual primary ADs stock solutions and by further
diluting with methanol until a concentration of 0.05-0.125 mg/ml, depending
on the therapeutic range of the compound. After preparation, it was stored
protected from light at approximately -20°C. Further dilution of the standard
mixture with methanol resulted in working solutions with concentrations of
0.1, 1 or 10 μg/ml.

Chapter IV: Derivatization
- 115 -
IV.2.3. Instrumentation
All experiments were carried out on a HP 6890 GC system, equipped with a
HP 5973 mass selective detector and a G1701DA Chem Station, version
D.02.00 data processing unit (Agilent Technologies, Avondale, PA, USA). The
first experimental set-up contained a HP 7683 on-column auto injector. Later
on the injector was changed to a HP 7683 split/splitless auto injector due to
practical considerations as described in chapter V.
Evaporation under nitrogen was conducted in a TurboVap LV evaporator from
Zymark (Hopkinton, MA, USA). The heater was a multi-block from Lab-line
(Tiel, The Netherlands).
IV.2.4. Gas chromatographic parameters
Chromatographic separation was achieved on a 30m x 0.25mm I.D., 0.25-μm
J&W-5ms column from Agilent Technologies (Avondale, PA, USA). The start
condition of the column temperature was set depending on the injector type
and injection solvent (chapter V.3.). For the on-column (methanol) and
split/splitless injector (toluene), a starting temperature of 50 °C for 1 min or
90 °C for 1 min was applied, respectively. Thereafter the temperature of the
column was ramped at 50°C/min to 180°C where it was held for 10 min,
whereafter the temperature was ramped again at 10°C/min to 300°C.
Ultrapure helium at a constant flow of 1.3 ml/min was used as carrier gas.
When the split/splitless auto injector was used, the pulsed splitless injection
temperature was held at 300°C, the purge time and pulse activation time
were set at 1 and 1.5 min, respectively. Meanwhile, the injection pulse
pressure was 170 kPa.
For each injection type 1 μl of the sample, redissolved in 50 μl toluene or
methanol, was injected. While toluene was used as injection solvent during
the further development and validation of the GC-MS method (chapter V),
methanol was used as redissolving and injection solvent for determination of
several spectra in the beginning of our research.

Chapter IV: Derivatization
- 116 -
IV.2.5. Mass spectrometric parameters
The mass selective detector temperature conditions were 230°C for the EI-
source, 150°C for the quadrupole and 300°C for the transferline, whereas an
electron voltage of 70 eV was used. The mass selective detector was used in
scan mode for optimization of the derivatization reactions. When comparing
the heptafluorobutyrylation reagents and validating the final derivatization
method, the mass selective detector was used in selected ion monitoring
mode as described in chapter III (III.2.5. Table III.1.)
IV.3. Acetylation
IV.3.1. Optimization of acetylation reaction
The acetylation procedure was not optimized for ADs. The chosen acetylation
conditions were already successfully applied in our laboratory for
benzodiazepines and were tested for ADs [10,11]. The evaporated
methanolic AD stock-solution was acetylated with a mixture of 200 μl of
acetic anhydride and 200 μl of pyridine. The derivatization occurred at room
temperature after 30 minutes.
IV.3.2 Acetylation reaction with antidepressants
Acetylation occurs for alcohols, secondary and primairy amines, but not for
tertiary amines. The alcohol and amine functions react with acetic anhydride,
and this reaction is catalyzed by pyridine that acts as an acceptor for the
acidic byproduct formed during the reaction. This reaction is a result of an
nucleophilic mechanism, leading to a carbonyl addition intermediate followed
by elimination of acetic acid (byproduct) and resulting in the acetylated AD
[1]. The reaction scheme is depicted in Figure IV.2. After derivatization the
moleculair mass gain is 42 amu, as a free hydrogen atom is replaced by an
acetylgroup.

Chapter IV: Derivatization
Figure IV.2. Acetylation reaction scheme
O
O O
NR OH
R NH
R
R NH2
R N
OR
R NH
O
R O
O
RT30 min
O
O O
NR
RH
O
N+
O
O
RHR
OH
NO
O
RR
O
NR
R OH
O+
IV.3.2.1. ADs containing an alcohol function
Venlafaxine and its metabolite O-desmethylvenlafaxine (ODMV) are the only
monitored compounds that contain at least one alcohol function. The
structure of venlafaxine containing one hydroxyl-function is shown in Figure
IV.3.A. Venlafaxine is demethylated to its metabolite ODMV which then
contains 2 alcohol functions that can possibly be derivatized.
After the acetylation procedure, two peaks were detected in the
chromatograms of both acetylated venlafaxine and its metabolite ODMV.
Figure IV.3. gives the example of venlafaxine. When studying the spectra
before and after derivatization, a mass gain of 42 amu is observed for one of
the two peaks in the chromatogram (B) after derivatization. Therefore,
successful acetylation of the alcohol function could be concluded. However,
for the other peak a loss of 18 amu is observed and dehydration of the
molecule is suspected (C).
ODMV acetylation occurs in the same way as its parent compound. Maurer et
al. [5] describe an acetylation reaction for ODMV as for venlafaxine, but on
the demethylated oxygen atom (underlined), leaving the other alcohol
function underivatized. The second ODMV-peak after derivatization is the
acetylated compound without the aliphatic alcohol, as this function is
dehydrated.
- 117 -

Chapter IV: Derivatization
Acetylation of venlafaxine and ODMV does not lead to one derivative,
resulting in the problem of possibly irreproducible quantitative results. This
effect should be kept in mind during validation of the method.
Figure IV.3. Derivatization of venlafaxine with acetic anhydride
Chromatogram and corresponding mass spectra of underivatized venlafaxine (A, black trace) and venlafaxine after acetylation (red trace): derivatized (B) and dehydrated (C)
- 118 -
Abundance
40 60 80 100 120 140 160 180 200 220 240 260 2800
100000
200000
300000
400000
500000
600000
700000
800000
900000
1000000
1100000
m/z-->
Abundance
58
134
91 119 17942 77 148 162103 202 219 232190 257 277
NOH
MeO
A B
C
A
8.00 10.00 12.00 14.00 16.00 18.00 20.00 22.00 24.00 26.00 28.00 30.00 32.00
20000400006000080000
100000120000140000160000180000200000220000240000
Time-->

Chapter IV: Derivatization
B Abundance
- 119 -
IV.3.2.2. ADs containing a primary amine function
Fluvoxamine is the only AD that contains a primary amine function. However,
the demethylated metabolites of sertraline, maprotiline and fluoxetine, and
the didesmethylated metabolite of citalopram also contain a primary amine
function. During acetylation of these compounds one of the free hydrogen
atoms on the nitrogen atom acts as leaving group.
After the acetylation procedure, the retention times of the peaks are
increased and spectra have a molecular ion mass gain of 42 amu (Table
IV.1.). This leads to the conclusion that primary amines are easily derivatized
with acetic anhydride and pyridine.
40 60 80 100 120 140 160 180 200 220 240 260 280 300 3200
20000400006000080000
100000120000140000160000180000200000220000240000260000280000300000320000
m/z-->
58
202
121 13443 91 159 17377 214147108 187 259 281 319242228
NO
O
MeO
C Abundance
60 80 100 120 140 160 180 200 220 240 2600
5000
10000
15000
20000
25000
30000
35000
40000
45000
50000
55000
m/z-->
58N
MeO
21477 25912191 159 171141 200102 185131

Chapter IV: Derivatization
Figure IV.4. Derivatization of fluvoxamine with acetic anhydride
A: mass spectrum underivatized; B: derivatized
A Abundance
- 120 -
B
For fluvoxamine (shown in Figure IV.4.), it seems that an addition of 61 amu
occurs after acetylation as the molecular ion of underivatized fluvoxamine is
299, while the derivatized form is 360 amu. However, using the theoretical
molecular weight of fluvoxamine, which is 318, an addition of 42 amu is
demonstrated. The difference of 61 amu according to the spectra shown
above is explained by the fragmentation pattern of underivatized fluvoxamine
40 60 80 100 120 140 160 180 200 220 240 260 280 3000
200
400
600
800
1000
1200
1400
1600
1800
2000
2200
2400
2600
2800
3000
m/z-->
45 187
O
NH2
F
FF
N
OMe
71172
145
200
276
22795 121 159 244 29958 214
Abundance
40 60 80 100 120 140 160 180 200 220 240 260 280 300 320 340 360020000
60000
100000
140000
180000
220000
260000
300000
340000
380000
420000
m/z-->
86
O
NH
N
OMe
O
F
F
102
60
18745
172145
226 258126 212 244 341 360276 301
F

Chapter IV: Derivatization
that looses a fluorine atom (loss of 19 amu) resulting in the monitored ion of
299 amu in stead of 318 amu.
IV.3.2.3. ADs containing secondary amine functions
Figure IV.5. Derivatization of secondary amines with acetic anhydride with
spectra before (A) and after (B) derivatization. Viloxazine is given as an
example
A Abundance
- 121 -
B
Several ADs discussed in this work are secondary amines. These ADs are
fluoxetine, viloxazine, maprotiline, reboxetine, sertraline, and paroxetine. In
40 60 80 100 120 140 160 180 200 220 240 260 2800
50000
100000
150000
200000
250000
300000
350000
400000
450000
m/z-->
Abundance
100
142
4356
86
27912170
170 236156 264222206 250181 194
O
N
O
O
O
40 50 60 70 80 90 100 110 120 130 140 150 160 170 180 190 200 210 220 230 240
56
0
1000
2000
3000
4000
5000
6000
7000
8000
9000
10000
11000
12000
13000 100
m/z-->
138
110
70 8141 237121
22291
O
NH
O
O

Chapter IV: Derivatization
addition, several metabolites also contain a secondary amine function,
leading to a free and thus replacable hydrogen atom: desmethylcitalopram,
desmethylmirtazapine, desmethylmianserin and m-cpp.
As demonstrated in Table IV.1. a mass gain of 42 amu is seen for these
compounds, concluding that the derivatization reaction is successful. Figure
IV.5. demonstrates the acetylation of viloxazine as an example.
IV.3.2.4. Tertiary amines
Several ADs contain tertiary amine functions that can not be derivatized
using acetic anhydride and pyridine. These ADs are citalopram, mirtazapine,
mianserin, melitracen and trazodone. Spectra before and after derivatization
are identical for these compounds (Figure IV.6.), therefore we can conclude
that the compounds are stable during the derivatization conditions. This is
important in forensic analysis as the content of the sample is unknown and
every sample will be analyzed identically and thus will undergo the
derivatization reaction.
Figure IV.6. Mass spectrum of mianserin after passing the derivatization
procedure
Abundance
- 122 -
60 80 100 120 140 160 180 200 220 240 2600
2000
4000
6000
8000
10000
12000
14000
16000
18000
20000
22000
24000
26000193
N
N264
72 165178 220
24958 89 204152132115
102 235
m/z-->

Chapter IV: Derivatization
IV.3.3. Conclusion
Most ADs and their metabolites can be derivatized using pyridine and acetic
anhydride at room temperature after 30 minutes as demonstrated in Table
IV.1. This derivatization procedure results in a much better peak shape,
leading to an enhanced sensitivity.
ADs containing tertiary amines in their structure can not be derivatized, but
their peak shape is already satisfactory as tertiary amines show less
adsorption onto the analytical column.
Acetylation of venlafaxine and its metabolite ODMV results in two
derivatization products; an acetylated and a dehydrated product, which can
lead to irreproducible quantitative results.
Table IV.1. Retention time (tr) and molecular ion of each AD before and after
acetylation
ADs M+-ion theor. tr M+-ion monitored tr M+-ion monitoredmin. amu min. amu
AlcoholsVenlafaxine 277.41 16.4 277 12.6 259 (-H2O)
17.3 319 (AC)ODMV 263.38 18.9 263 16.5 287 (AC-H2O)
19.1 305 (AC)
Primary aminesFluvoxamine 318.34 11.2 299 18.9 360DMFluox 295.30 9.6 295 19.7 327DMMap 263.38 19.6 263 24.3 305DMSer 292.20 20.1 292 24.1 334DDMC 296.34 20.9 296 25.4 338
Secondary aminesFluoxetine 309.33 10.2 309 19.0 351Maprotiline 277.41 19.9 277 24.2 319Paroxetine 329.37 22.8 329 25.9 371Reboxetine 313.40 21.0 313 23.6 355Sertraline 306.23 20.3 306 24.3 348Viloxazine 237.30 10.4 237 18.6 279DMC 310.37 21.0 310 25.3 352DMMia 250.34 19.2 250 23.3 292DMMir 251.33 19.9 251 23.9 293m-cpp 196.70 7.7 196 17.9 238
Tertiary aminesCitalopram 324.40 20.7 324 20.7 324Melitracen 291.44 19.3 291 19.3 291Mianserin 264.37 18.2 264 18.2 264Mirtazapine 265.36 18.9 265 18.9 265Trazodone 371.87 29.8 371 29.8 371
Before derivatization After acetylation
- 123 -

Chapter IV: Derivatization
- 124 -
IV.4. Heptafluorobutyrylation
For the heptafluorobutyrylation two reagents, 1-(heptafluorobutyryl)
imidazole (HFBI) and heptafluorobutyric anhydride (HFBA), were tested.
Because our first GC-MS configuration was equipped with a cold on-column
injector, HFBI was used. This derivatization reagent results in the formation
of the non aggressive byproduct imidazole, while the acid HFBA can result in
column damage. However, later on, the injector in our GC-MS system was
changed to a split/splitless configuration and the HFBA reagent was re-
evaluated.
IV.4.1. Optimization of HFBI reaction
IV.4.1.1. Experimental
The derivatization step was optimized in duration, temperature and quantity
of HFBI. Derivatization parameters such as temperature were changed from
45-105°C and duration from 15-60 minutes. Quantities of HFBI were varied
from 20 till 200 μl. In addition, an extraction was optimized using toluene
and water to remove excess of the HFBI derivatization reagent and by-
products. The ratio of water/toluene was varied from 0.5/1 till 0.5/2. These
parameters were optimized through peak height and area, variation and
completeness of the reaction.
Twenty μl of a 0.1-mg/ml ADs mix was evaporated to dryness and
derivatized under different conditions. Before injection of the samples,
mianserin-d3 (200 ng / 50 μl) was added, as this I.S. can be analyzed
without derivatization.
IV.4.1.2. Results
For derivatization of the analytes of interest with HFBI, addition of 20 μl of
reagent resulted in a complete reaction. No significant difference (T-test
p>0.05) was seen between the different amounts of HFBI. However, because
a 50-μl volume ensured adequate moistening of the reaction vial, this
amount of HFBI was chosen.
The reaction at 85°C during 30 minutes gave the highest yield with an
acceptable variation. Although, there was no significant difference in

Chapter IV: Derivatization
temperature, 85°C was necessary to get a complete derivatization of
sertraline.
The duration of the derivatization did not affect the procedure significantly.
Therefore, 30 minutes were selected as this resulted in the least variation for
an acceptable derivatization reaction time.
Usually, the excess of derivatization reagent and byproducts are removed
after derivatization, as they can damage the GC-column. Due to the inert
imidazole byproduct of HFBI, damage of the column is minimized, however,
the injection needle can still be clogged. Moreover, when using NICI-MS
detection, the excess of reagent must be eliminated to minimize detector
noise and to obtain adequate sensitivity. Evaporation of the excess of HFBI
was not an option as it led to crystallization of the derivatization product.
Therefore, a simple extraction step was applied, resulting in the transfer of
the derivatized compounds in the toluene layer, while the excess of reagent
and byproducts remain in the aqueous phase. When 2 ml of toluene and 0.5
ml of water were used, the underivatized compounds were extracted more
efficiently into the toluene layer. The toluene phase was evaporated with
nitrogen at 40°C and the extract was redissolved in 50 μl of toluene.
Figure IV.7. Optimization of HFBI derivatization (n=3)
Errorflags indicate ± one standard deviation
HFBI
5085
105
6545
60
200
100
20
3015
0.5/2
0.5/1
1/1
2
3
4
5
6
0 20 40 60 80 100 120 140 160 180 200 220
mea
n ar
ea ra
tio A
Ds/
Md
3
Amount HFBI (µl) Temperature (°C)Reaction time (min) Ratio water/toluene
- 125 -

Chapter IV: Derivatization
- 126 -
IV.4.2. Optimization of HFBA reaction
IV.4.2.1. Experimental
The derivatization step was optimized in duration, temperature and quantity
of HFBA. Derivatization parameters such as temperature were changed from
45-105°C and duration from 15-60 minutes. HFBA was diluted with
chloroform or toluene in concentrations of 10-50%. These parameters were
optimized through peak height and area, variation and completeness of
reaction.
Twenty μl of a 0.1-mg/ml ADs mix was evaporated to dryness and
derivatized under different conditions. Before injection of the samples,
mianserin-d3 was added, as this I.S. can be analyzed without derivatization.
IV.4.2.2. Results
Heptafluorobutyric anhydride was dissolved in chloroform or mixed with
toluene at percentages varying from 10-50%. Chloroform and toluene were
chosen, respectively because ADs and the HFBA solution are easily dissolved
in chloroform, while HFB-derivatives are highly soluble in toluene. In
addition, due to the derivatization temperature, a low percentage of HFBA
can be dissolved in the toluene fraction. As depicted in Figure IV.7. a mix of
10% HFBA in toluene (total volume of 100 μl) resulted in the best
derivatization results. The percentage of HFBA can be kept low. This is an
advantage as the anhydride can damage the column and can lead to higher
background especially when the mass analyzer is used in negative ion
chemical ionization mode.
A derivatization temperature of 105 °C was selected as this resulted in the
highest reaction yield. Although higher variation was seen at this
temperature, 105 °C was necessary for the derivatization reactions of
venlafaxine and its metabolite. Heptafluorobutyrylation reactions with amines
generally proceed at low temperature, while hydroxyl derivatizations are
slower and thus heat is recommended [1]. However, the reaction yield for
venlafaxine and ODMV was still not complete and in addition, dehydration
products were noticed (IV.4.3.1.).
The ADs were derivatized during 5 minutes as this resulted in the best signal
with the least variation for most compounds. No significant difference in

Chapter IV: Derivatization
signal was seen between 5 and 15 minutes of reaction time (T-test: p=0.36).
After longer reaction times some compounds showed a decrease in signal,
possibly due to degradation.
The excess of derivatization reagent was evaporated by nitrogen at 40°C and
the extract was redissolved in 50 μl of toluene.
Figure IV.8. Optimization of HFBA derivatization (n=3)
Errorflags indicate ± one standard deviation
HFBA
2010585
6545
60
30
15
5
50
10
0
5
10
15
20
25
0 20 40 60 80 100
mea
n ar
ea ra
tio A
Ds/M
d3
Temperature (°C) Reaction time (min)Amount HFBA in toluene (%) Amount HFBA in chloroform (%)
IV.4.3. Heptafluorobutyrylation of antidepressants
The acylation reaction with both HFBI and HFBA replaces a labile hydrogen
atom attached to the nitrogen atom, for a less polar, stable group. HFB-
acylation occurs for alcohols, secondary and primairy amines, but not for
tertiary amines. The alcohol and amine functions react with heptafluoro-
butyrylimidazole and heptafluorobutyric anhydride, forming a carbonyl
addition intermediate and finally resulting in heptafluorobutyrylated ADs and
their respective byproducts, the neutral imidazole or heptafluorobutyric acid.
The reaction scheme is depicted in Figure IV.9. After derivatization the
molecular mass gain is 196 amu, as a free hydrogen atom is replaced by a
heptafluorobutyryl-group.
- 127 -
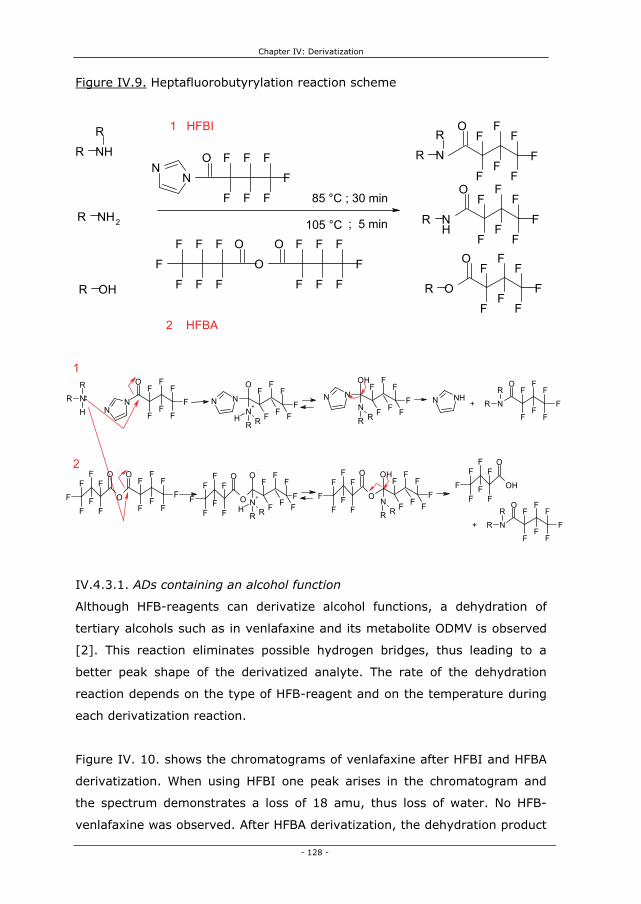
Chapter IV: Derivatization
Figure IV.9. Heptafluorobutyrylation reaction scheme
- 128 -
NR
RH
NN
OF
F
F
F
F
F
F N NF
FF
F
O
N+
RH R F FF
N NF
FF
F
OH
NR R F FF N
OF
FF
F
F
F
F
R
R
F F
N
OF
FF
F
F
F
F
R
R
OF
F
F
F
F
F
FO
OF
F
F
F
F
F
F FO
OF
F
F
F
F
F
F
FF
FO
N+
RH R F F
O
OF
F
F
F
F
F
F
FF
FF
OH
NR R F F
OH
OF
F
F
F
F
F
F
N NH+
+
IV.4.3.1. ADs containing an alcohol function
Although HFB-reagents can derivatize alcohol functions, a dehydration of
tertiary alcohols such as in venlafaxine and its metabolite ODMV is observed
[2]. This reaction eliminates possible hydrogen bridges, thus leading to a
better peak shape of the derivatized analyte. The rate of the dehydration
reaction depends on the type of HFB-reagent and on the temperature during
each derivatization reaction.
Figure IV. 10. shows the chromatograms of venlafaxine after HFBI and HFBA
derivatization. When using HFBI one peak arises in the chromatogram and
the spectrum demonstrates a loss of 18 amu, thus loss of water. No HFB-
venlafaxine was observed. After HFBA derivatization, the dehydration product
NHR
R
NH2R
OHR
NN
O F
F
F
F F
F
F NR
RO F1 HFBI
FF
FF
F
F
NH
O FFF
FF
F
FR
O
OF
F
F
F
F
F
FR
F
F
F
F
F
F
F
O
O
O F
F
F
F
F
F
F
85 °C ; 30 min
; 5 min105 °C
2 HFBA
1
2

Chapter IV: Derivatization
was also observed, but in combination with a large underivatized venlafaxine
peak. Again, no HFB-venlafaxine was observed, leading to the conclusion that
venlafaxine can not be heptafluorobutyrylated. In addition, the dehydration
seems to result in a higher reaction yield when using HFBI. The spectra of
underivatized and dehydrated venlafaxine were already shown in Figure
IV.3., as heptafluorobutyrylation and acetylation result in the same
dehydrated venlafaxine peak.
Figure IV.10. Derivatization of venlafaxine with heptafluorobutyrylimidazole
(red trace) and heptafluorobutyric anhydride at 105 °C (black trace)
A, underivatized venlafaxine; B, dehydrated venlafaxine
- 129 -
8.00 10.00 12.00 14.00 16.00 18.00 20.00 22.00 24.00 26.00 28.00 30.00 32.00
1000000
2000000
3000000
4000000
5000000
6000000
7000000
8000000
9000000
1e+07
Time-->
Abundance
A
B
B
For ODMV a similar dehydration reaction as for venlafaxine was observed. In
addition, for both reagents a HFB-derivative could be suspected, however,
due to pronounced fragmentation of the compound in electron ionization
mode the spectra were difficult to interprete. During the further optimization
of our GC-MS method, the formation of both the HFB-derivative and its
dehydrated form was confirmed in the PICI mode. However, heptafluoro-
butyrylation of ODMV led to irreproducible derivatization results. Moreover,
for the HFBI reagent the dehydrated underivatized ODMV reaction seemed to
be favourable, while the HFBA derivatization led to the derivatized
dehydrated ODMV molecule. However this reaction was uncomplete.

Chapter IV: Derivatization
IV.4.3.2. ADs containing a primary amine function
Primary amines such as fluvoxamine and the metabolites desmethyl-
maprotiline, as well as desmethylsertraline are all heptafluorobutyrylated as
observed in the spectra by a mass gain of 196 and a retention time shift. The
mass spectrum of HFB-fluvoxamine is shown in Figure IV. 11., while the
spectrum of underivatized fluvoxamine was already shown in Figure IV.4.A.
Figure IV.11. Spectrum of heptafluorobutyrylated fluvoxamine
Abundance
- 130 -
Didesmethylcitalopram is also heptafluorobutyrylated, however, a mass gain
of 178 amu is observed instead of 196 amu. This phenomenon is due to
water loss after the tetrahydrofurane-ring opening during fragmentation in
the ion source.
Derivatization of desmethylfluoxetine with HFB-reagents probably leads to
HFB-desmethylfluoxetine, but this reaction can not be confirmed using the
spectra before and after derivatization as a mass gain of only 35 amu is
noticed. The derivatized molecule is fragmented very easily and therefore the
molecular ion is not detected (Table IV.2.).
IV.4.3.3. ADs containing secondary amine functions
The derivatization reaction was successful for all secondary amines, as a
mass gain of 196 amu was observed in the spectra after derivatization.
However, for fluoxetine a gain of 177 amu was noticed in stead of 196, due
to a loss of a fluorine atom (19 amu) during fragmentation.
50 100 150 200 250 300 350 400 450 5000
100000
200000
300000
400000
500000
600000
700000
800000
900000
m/z-->
O
NH
F
FF
N
OMe
OF
FF
F
F
FF
71
226258
198
145 172
95 495125 51451 442288 313 339 363

Chapter IV: Derivatization
Figure IV.12. gives the spectrum of HFB-viloxazine as an example
(underivatized viloxazine is shown in Figure IV.5.A). As demonstrated by this
example, it is clear that heptafluorobutyrylation can increase the selectivity
through more abundant higher m/z-fragments as compared to underivatized
or acetylated viloxazine.
Figure IV.12. Derivatization with HFB-reagents of the secondary amines.
Spectrum of heptafluorobutyrylated viloxazine
- 131 -
IV.4.3.4. Tertiary amines
Tertiary amines such as citalopram, mirtazapine, mianserin, melitracen and
trazodone are not derivatized through heptafluorobutyrylation. Spectra
before and after derivatization are identical for these compounds. The
compounds showed no degradation under HFB-derivatization conditions.
IV.4.4. Conclusion
Most ADs and their metabolites can be heptafluorobutyrylated using 50 μl of
HFBI at 85 °C during 30 minutes or 10% HFBA in toluene (100 μl) at 105 °C
during 5 minutes. Heptafluorobutyrylation leads to a better peak shape for
most ADs and a mass gain of the molecular ion with 196 amu (Table IV.2.).
40 60 80 100 120 140 160 180 200 220 240 260 280 300 320 340 360 380 400 4200
5000
10000
15000
20000
25000
30000
35000
40000
45000
50000
55000
60000
65000
m/z-->
Abundance
O
N
O
O
OF
F
F
F
FF
F110 240
138
296 433
56
16981
266
192 210 394366

Chapter IV: Derivatization
The improved peak shape results in higher sensitivity, while the mass gain
can result in higher selectivity.
While primary and secondary amines are derivatized, ADs containing tertiary
amines can not be derivatized, but their peak shape is satisfactory as tertiary
amines show less adsorption onto the analytical column.
Venlafaxine and its metabolite ODMV both contain an alcohol function and
result in different derivatization yields when using HFBA or HFBI. Both
reagents lead to dehydration of venlafaxine. ODMV is dehydrated
simultaneously with a heptafluorobutyrylation of the phenolic function.
However, when applying the HFBI reagent, non-derivatized but dehydrated
ODMV is also observed and is even the main derivatization product.
Table IV.2. Retention time (tr) and molecular ion of each AD before and after
heptafluorobutyrylation
ADs M+-ion theor. tr M+-ion monitored tr M+-ion monitoredmin. amu min. amu
AlcoholsVenlafaxine 277.41 16.4 277 12.6 259 (-H2O)
ODMV 263.38 18.9 263 10.3 441 (HFB-H2O)
14.6 245 (-H2O)
Primary aminesFluvoxamine 318.34 11.2 299 14.9 514DMFluox 295.30 9.6 295 14.5 330DMMap 263.38 19.6 263 21.2 459DMSer 292.20 20.1 292 20.6 487DDMC 296.34 20.9 296 22.7 474
Secondary aminesFluoxetine 309.33 10.2 309 15.9 486Maprotiline 277.41 19.9 277 21.9 473m-cpp 196.70 7.7 196 13.1 392Paroxetine 329.37 22.8 329 23.2 525Reboxetine 313.40 21.0 313 20.7 509Sertraline 306.23 20.3 306 21.9 501Viloxazine 237.30 10.4 237 14.5 433DMC 310.37 21.0 310 22.7 506DMMia 250.34 19.2 250 20.2 446DMMir 251.33 19.9 251 20.6 447
Tertiary aminesCitalopram 324.40 20.7 324 20.7 324Melitracen 291.44 19.3 291 19.3 291Mianserin 264.37 18.2 264 18.2 264Mirtazapine 265.36 18.9 265 18.9 265Trazodone 371.87 29.8 371 29.8 371
Before derivatization After Heptafluorobutyrylation
- 132 -

Chapter IV: Derivatization
IV.5. Choice of acylation procedure
IV.5.1. Acetylation versus heptafluorobutyrylation
When comparing the three optimized acylation procedures, the acetylation
procedure was not selected because of three reasons.
The first reason is the option of NICI monitoring. HFBI or HFBA are excellent
derivatization agents for NICI as they contain seven fluorine atoms, resulting
in detectability of the derivatized ADs when using this highly sensitive
ionization mode. When HFB-derivatization is used, only one sample
preparation would be necessary to analyze the ADs in the 3 ionization modes,
namely electron ionization, positive and negative ion chemical ionization.
The second reason is the volatility of the heptafluorobutyryl-derivatives. HFB-
acylation was chosen as derivatization reaction in EI as it leads to a
quantitative formation of stable derivatives, which are more volatile than
their acetylated forms, resulting in a considerable shorter retention time
(Table IV.1. and IV.2.). Moreover, HFB-derivatization leads to enhanced
sensitivity as seen in Figure IV.13.
Figure IV. 13. Comparison of an underivatized (black trace), acetylated (red
trace) and heptafluorobutyrylated (green trace) ADs mix (40 ng on-column).
Abundance
- 133 -
8.00 10.00 12.00 14.00 16.00 18.00 20.00 22.00 24.00 26.00 28.00 30.00 32.000
1000000
2000000
3000000
4000000
5000000
6000000
7000000
8000000
9000000
1e+07
1.1e+07
Time-->

Chapter IV: Derivatization
- 134 -
The final reason was the difference in mass gain after acetylation (42 amu)
and heptafluorobutyrylation (196 amu). The shift of the main fragment ions
to high mass ranges, mostly results in a lower background when analyzing
biological samples. High-mass ions have greater diagnostic value, since they
are more specific than low-mass ions, which can be easily affected by
interference from the fragment ions of contaminants and/or column bleeding
[12]. Thus a higher mass gain leads to more selectivity.
IV.5.2. Heptafluorobutyrylimidazole versus heptafluorobutyric an-
hydride
IV.5.2.1. Experimental
The optimized derivatization HFB-procedures were compared by
derivatization of ADs mixtures containing 200 ng of each AD. Mianserin-d3
was used as I.S. (200 ng) and was added before injection (before
evaporating and redissolving the sample). The samples were evaporated
under nitrogen and redissolved in 50 μl of toluene. The extracts were
analyzed in EI in SIM mode after injection of 1 μl.
IV.5.2.2. Results
When evaluating both optimized derivatization procedures, the ratio between
the peak area of the ADs and the I.S. as well as the variation on this ratio
were compared (Figure IV.14.). A T-test was performed and a significant
difference (p�0.05) with higher ratios for the HFBA derivatization was seen
for ODMV, sertraline, desmethylsertraline, fluvoxamine and desmethyl-
maprotiline. For the other ADs, the ratio was higher with HFBI derivatization
or not significantly different as compared to HFBA derivatization. Especially
for the non-derivatized tertiary ADs, HFBA derivatization conditions resulted
in a decreased signal. This decrease is observed for mianserin, mirtazapine,
melitracen, and citalopram and will lead to sensitivity problems for the
determination of those compounds at low therapeutic concentrations.

Chapter IV: Derivatization
Figure IV.14. Comparison of the optimized HFBA and HFBI derivatization
procedures (n = 5)
Error bars indicate ± one standard deviation
HFBI versus HFBA ratio
0
1
2
3
4
5
6
Venlafax
inem-cp
p
Viloxazine
DMFluox
Fluvoxa
mineODMV
Fluoxeti
ne
Mianse
rin
Mirtaza
pine
Melitrace
nDMMia
DMSer
DMMir
Reboxe
tine
Citalop
ram
DMMap Map Ser
DDMCDMC
Paroxet
ine
ratio
ADs
/Md3
HFBA HFBI
HFBI versus HFBA absolute
0
2000000
4000000
6000000
8000000
10000000
12000000
14000000
Venlafax
inem-cp
p
Viloxazine
DMFluox
Fluvoxa
mineODMV
Fluoxeti
ne
Mianseri
n
Mirtaza
pine
Melitrac
enDMMia
DMSer
DMMir
Reboxetin
e
Citalop
ramDMMap Map Ser
DDMCDMC
Paroxetin
eMd3
area
ADs
HFBA HFBI
Because the I.S. mianserin-d3 is also a tertiary amine, the ratio ADs versus
I.S. will lead to a different conclusion than plotting absolute peak areas
(Figure IV.14.). A possible cause of the decreased sensitivity for tertiary
amines could be a decreased solubility, due to the acidic environment of the
HFBA derivatization, which leads to the formation of quaternary amines that
are much less soluble in organic phases. In addition, some of the acidic
derivatization product may still remain in the extract, leading to degradation
of the column film or activity in the injector or possible instability of the ADs.
Therefore, addition of triethylamine during derivatization with HFBA was
- 135 -

Chapter IV: Derivatization
- 136 -
tested to increase the reaction yield and to neutralize the acidic byproduct.
For mianserin and mirtazapine slighty better results were observed, however,
triethylamine was not used as it led to problems during evaporation of the
HFBA extract. Addition of ammonia (5% in methanol) also resulted in higher
areas for the tertiary amines. However, the yield of derivatized ADs was
lower, probably due to methanol decreasing the stability of the derivatives.
Another difference between HFBA and HFBI is the way the excess of reagent
is removed. Moreover, both derivatization reagents produce byproducts that
need to be removed before injection onto the column. The acidic byproduct of
HFBA is aggressive for the column phase. However, the byproduct and the
excess of reagent can be evaporated under nitrogen after derivatization,
leading to a shorter and less labour intensive derivatization. The HFBI by-
product is the neutral imidazole and is not aggressive for the column. It is,
however, still better to remove this byproduct and left-over HFBI to increase
the sensitivity by diminishing analytical noise especially under NICI
conditions. For this procedure, an extraction step with 0.5 ml of water and 2
ml of toluene is necessary, whereby the toluene is evaporated and the
extract is redissolved in 50 μl of toluene before injection onto the analytical
column (1 μl). This efficient clean-up procedure is, however, more time
demanding. In addition, although the derivatives are stable in case of
amines, they are susceptible to hydrolysis in the case of alcohols. Because of
this extraction step, a difference in reaction yield is observed for the
derivatization rate of ODMV when using HFBA or HFBI.
IV.5.3. Conclusion
HFB acylation was chosen instead of acetylation because it leads to a
quantitative formation of stable derivatives, which are more volatile than
acetyl-derivatives, resulting in a considerable shorter retention time. In
addition, heptafluorobutyrylation increases sensitivity in NICI mode and
results in one sample preparation for the 3 ionization modes used in GC-MS.
Both heptafluorobutyrylation reagents have their pros and cons: HFBA leads
to a shorter procedure, while HFBI does not result a decreased signal for ADs

Chapter IV: Derivatization
- 137 -
containing a tertiary amine. Because we wanted to screen and quantitate as
much ADs as possible in one run, HFBI derivatization was chosen, despite the
longer procedure and the pronounced hydrolysis of ODMV.
IV.6. Final derivatization procedure
The final derivatization procedure was as follows: after evaporation of the
solid phase extracts under nitrogen at 40°C, 50 μl of HFBI was added and the
sample was heated at 85°C for 30 min. Thereafter, 0.5 ml of HPLC-grade
water and 2 ml of toluene were added. After vortexing and centrifuging the
sample at 1121 g for 10 min, the toluene layer was removed and evaporated
at 40°C.
IV.7. Validation of final derivatization procedure
Intra- and inter batch precision, and linearity of the derivatization reaction as
well as stability of the HFB-derivatives were evaluated as these parameters
are important for a successful derivatization.
IV.7.1. Precision
IV.7.1.1. Experimental
Precision was evaluated at three different levels, i.e. 0.2-0.4 (low), 2-4
(medium), and 5-15 ng/μl (high), depending on the compound. Mianserin-d3
(4 ng/μl) was used as internal standard and was added before injection.
Intra- and inter batch precision was assessed by five determinations per
concentration in one day or on five separate days, respectively, and was
measured using RSD.
IV.7.1.2. Results
The precision of the derivatization reaction is acceptable for most
compounds. The intra- and inter batch precision of ODMV after derivatization
is not acceptable for the low concentration. While citalopram has a rather
high intra batch variation, the inter batch variation fulfilled the limit of 15%

Chapter IV: Derivatization
RSD. The inter batch precision of fluvoxamine and desmethylsertraline was
also slightly elevated.
Table IV.3. Precision data of the HFB-derivatization procedure (n=5)
Low Mid High Low Mid High Low Mid HighVenlafaxine 0.4 4 10 8 4 2 5 6 7m-cpp 0.4 4 10 14 13 4 12 9 5Viloxazine 0.2 2 5 8 7 3 14 7 3ODMV 0.4 4 10 17 10 13 25 9 6DMFluox 0.5 5 15 2 4 3 11 5 3Fluvoxamine 0.5 5 15 4 5 3 17 5 3Fluoxetine 0.5 5 15 3 5 3 8 6 4Mianserin 0.4 4 10 4 4 3 6 4 3Mirtazapine 0.4 4 10 2 5 6 9 5 9Melitracen 0.2 2 5 6 3 2 5 4 3DMMia 0.4 4 10 1 5 3 9 5 3DMSer 0.4 4 10 4 5 3 6 18 3DMMir 0.4 4 10 3 5 3 7 7 3Reboxetine 0.2 2 5 4 5 3 5 5 4Citalopram 0.4 4 10 16 3 5 14 6 4DMMap 0.25 2.5 6 3 4 5 4 4 5Maprotiline 0.25 2.5 6 2 5 3 7 4 3Sertraline 0.5 5 15 2 6 3 12 4 3DDMC 0.2 2 5 7 5 2 12 7 3DMC 0.2 2 5 14 7 5 9 5 3Paroxetine 0.2 2 5 4 5 2 16 4 3
Concentration on-column (ng/µl) Intra batch precision Inter batch precisionPrecision (% RSD)
IV.7.2. Linearity
IV.7.2.1. Experimental
The linearity of the derivatization reaction was determined by analyzing
samples ranging from ± 0.2 till ± 10 ng/μl of the individual ADs. Mianserin-d3
(4 ng/μl) was used as internal standard and was added before injection. The
slope, the range for the intercept and the coefficient of determination were
evaluated.
IV.7.2.2. Results
Overall the derivatization reaction is quantitative, leading to linear responses.
For ODMV and mirtazapine the reaction is not linear as seen by their
coefficient of determination 0.968 and 0.954, respectively. Mirtazapine is a
tertiary amine and is not derivatized, perhaps the extraction step in toluene
leads to the non-linearity. However, this is not seen for other tertiary
compounds such as mianserin and citalopram. ODMV is dehydrated; perhaps
- 138 -

Chapter IV: Derivatization
this reaction depends on the concentration of the metabolite. During
validation of the method in different matrices ODMV derivatization led to
irreproducible results as already discussed before.
Table IV.4. Linearity data of the HFB-derivatization procedure (n=5)
best fit cv% min max R2
Venlafaxine 0.02602 7 -0.1492 0.1071 0.997m-cpp 0.00440 6 -0.0207 0.0051 0.997Viloxazine 0.00124 4 -0.0032 0.0085 0.998ODMV 0.01090 5 -0.2346 0.0171 0.968DMFluox 0.00480 4 -0.0023 0.0079 0.998Fluvoxamine 0.00466 4 -0.0340 -0.00004 0.998Fluoxetine 0.01096 5 0.0492 0.0800 0.998Mianserin 0.00512 4 0.0249 0.0462 0.998Mirtazapine 0.01080 11 0.3748 0.4974 0.954Melitracen 0.01494 5 0.0175 0.1232 0.997DMMia 0.00402 4 0.0088 0.0300 0.998DMSer 0.00964 4 -0.0621 0.0814 0.993DMMir 0.00250 3 0.0060 0.0413 0.996Reboxetine 0.00320 5 0.0112 0.0269 0.999Citalopram 0.01986 4 -0.0049 0.0997 0.997DMMap 0.01088 6 0.0138 0.0903 0.999Maprotiline 0.00568 4 0.0397 0.0761 0.998Sertraline 0.00502 5 -0.0538 0.0198 0.996DDMC 0.01412 5 -0.0984 -0.0275 0.997DMC 0.01366 3 0.0030 0.0489 0.999Paroxetine 0.00120 6 -0.0036 0.0074 0.998
Slope Y-intercept Coeficient of determinationLinearity
IV.7.3. Stability of the derivatives
IV.7.3.1. Experimental
The stability of the HFB-derivatives was evaluated by analyzing a sample at
low and at high concentration directly after derivatization (day 0) and leaving
that sample in the autosampler tray for four days. The peak area of the
compounds was analyzed and compared each day. No internal standard was
used as this could compensate for losses, leading to erroneous conclusions.
IV.7.3.2. Results
At low concentration, it seems that the derivatized extracts are concentrated
during their stay in the autosampler tray. On day 1 a loss of 5 and 34% is
observed for HFB-didesmethylcitalopram and dehydrated ODMV. The loss of
didesmethylcitalopram is acceptable, but not the loss of ODMV (Figure
IV.15.A). - 139 -

Chapter IV: Derivatization
A loss is observed for underivatized mirtazapine after 2 days. All other
compounds and HFB-derivatives are stable for 4 days in the autosampler
(loss below 13%). The concentration of ODMV and desmethylcitalopram
seems to increase after several days. The only explanation that could be
given is that degradation products of other compounds interfere in the
measurement of those two compounds (Figure IV.15.B).
In conclusion, it seems that the HFB-derivatives are stable at least for 24
hours at room temperature for most compounds. The dehydrated ODMV is
demonstrated to be unstable. In addition, it is susceptable to wrongful
quantitation due to degradation products of other ADs.
Figure IV.15. Stability of heptafluorobutyrylated ADs at low and high
concentration
A
Stability 0.4 ng / µl
0
200000
400000
600000
800000
1000000
1200000
1400000
1600000
day 0 day 1 day 2 day 3 day 4
days in autosampler tray
area
Venlafaxine
m-cpp
Viloxazine
ODMV
DMFluox
Fluvoxamine
Fluoxetine
Mianserin
Mirtazapine
Melitracen
DMMia
DMSer
DMMir
Reboxetine
Citalopram
DMMap
Maprotiline
Sertraline
DDMC
DMC
Paroxetine
Md3
- 140 -

Chapter IV: Derivatization
B
Stability 10 ng / µl
0
5000000
10000000
15000000
20000000
25000000
day 0 day 1 day 2 day 3 day 4
days in autosampler tray
area
Venlafaxine
m-cpp
Viloxazine
ODMV
DMFluox
Fluvoxamine
Fluoxetine
Mianserin
Mirtazapine
Melitracen
DMMia
DMSer
DMMir
Reboxetine
Citalopram
DMMap
Maprotiline
Sertraline
DDMC
DMC
Paroxetine
Md3
IV.8. Conclusion
In this chapter we selected the best derivatization procedure for the new
generation ADs. It is, however, clear that every derivatization reaction has its
pros and cons and the final choice of reagent and procedure depends on the
demands of the analyst.
Structural information of the ADs led to the conclusion that acylation was a
promising technique, leading to an improvement of peak shape for most ADs.
The choice of acylation reagent was less straightforward.
Acylation using acetic anhydride and pyridine resulted in a good
derivatization for all ADs containing primary or secondary amines. However,
as a single sample preparation for three possible ionization modes including
negative ion chemical ionization was required, it was not reached.
Heptafluorobutyrylation was an option to avoid this drawback of acetylation.
This reaction results in high sensitivity when using negative ion chemical
ionization due to the addition of the seven fluorine atoms in combination with
- 141 -

Chapter IV: Derivatization
- 142 -
the carbonylgroup after derivatization. Moreover, heptafluorobutyrylation led
to more volatile derivatives, leading to a shorter analysis time.
Heptafluorobutyrylimidazole and heptafluorobutyric anhydride were
compared as heptafluorobutyrylation reagents. Although HFBI led to a longer
derivatization procedure and a clean-up step including water and toluene was
necessary, this procedure was selected. The main reason was the loss of
tertiary amines during the HFBA procedure due to solubility problems, leading
to losses in sensitivity for citalopram, meltiracen, mianserin, and mirtazapine.
However, it is clear that depending on the specific ADs and needs of the
analyst, both heptafluorobutyryl reagents have their specific benefits. We
selected HFBI as derivatization reagent for our further method development,
because derivatization of most compounds is reproducible and resulted in
stable derivatives. Moreover, a linear response was observed. Only the
reaction of ODMV was characterized by various reaction products, instability
and non-linearity.
IV.9. References
[1] Blau K, King G. Handbook of derivatives for chromatography. London: Heyden, 1978, pp 576.
[2] Watson D. Gaschromatography: a practical approach. Oxford: Oxford University Press, 1993,pp 456.
[3] Preu M, Guyot D, Petz M. Development of a gas chromatography–mass spectrometry method for the analysis of aminoglycoside antibiotics using experimental design for the optimisation of the derivatisation reactions J. Chromatogr. A 1998; 818: 95-108
[4] Preu M, Petz M. Development and optimisation of a new derivatisation procedure for gas chromatographic–mass spectrometric analysis of dihydrostreptomycin Comparison of multivariate and step-by-step optimisation procedures J. Chromatogr. A 1999; 840: 81-91
[5] Maurer HH, Pfleger K, Weber AA. Mass Spectral and GC Data of drugs, poisons, pesticides, pollutants and their metabolites (Vol.2). Weinheim: Wiley-VCH Verlag, 2007, pp 201.
[6] Maurer HH, Bickeboeller-Friedrich J. Screening procedure for detection of antidepressants of the selective serotonin reuptake inhibitor type and their metabolites in urine as part of a modified systematic toxicological analysis procedure using cas chromatography-mass spectrometry. J. Anal. Toxicol. 2000; 24: 340-347
[7] Bickeboeller-Friedrich J, Maurer HH. Screening for detection of new antidepressants, neuroleptics, hypnotics, and their metabolites in urine by GC-MS developed using rat liver microsomes. Ther. Drug Monit. 2001; 23: 61-70

Chapter IV: Derivatization
- 143 -
[8] Baker GB, Coutts RT, Holt A. Derivatization with acetic anhydride: applications to the analysis of biogenic amines and psychiatric drugs by gas chromatography and mass spectrometry. J. Pharmacol. Toxicol. Meth. 1994; 31: 141-148
[9] Kataoka H. Derivatization reactions for the determination of amines by gas chromatography and their applications in environmental analysis. J.Chromatogr. A 1996; 733: 19-34
[10] Borrey D, Meyer E, Lambert W, Van Calenbergh S, Van Peteghem C, De Leenheer A. Sensitive gas chromatographic-mass spectrometric screening of acetylated benzodiazepines J. Chromatogr. A 2001; 910: 105-118
[11] Borrey D, Meyer E, Lambert W, Van Peteghem C, De Leenheer A. Simultaneous determination of fifteen low-dosed benzodiazepines in human urine by solid-phase extraction and gas chromatography-mass spectrometry. J. Chromatogr. B 2001, 765: 187-197
[12] Segura J, Ventura R, Jurado C. Derivatization procedures for gas chromatographic-mass spectrometric determination of xenobiotics in biological samples, with special attention to drugs of abuse and doping agents. J.Chromatogr. B 1998; 713: 61-90


Chapter V
Gas chromatographic-mass spectrometric method development

Chapter V: Gas chromatographic-mass spectrometric method development
- 147 -
V.1. Introduction
Over the years, several chromatographic methods have been developed for
the determination of antidepressants (ADs) in biological matrices. A lot of
determination methods describe the analysis of one single or a mixture of a
few ADs. Moreover, several multi-analysis methods are described in the
literature. Chapter I gives an overview of these methods including capillary
electrophoresis [1, 2], high performance liquid chromatography with UV [3-
6], fluorescence [7, 8] or mass spectrometric detection [9-12], as well as gas
chromatography combined with nitrogen-phosphorus [13, 14] or mass
detection (GC-MS) [15-18].
Our aim was to develop a quantitative multi-ADs method for the new
generation ADs and their metabolites in biological materials. The ADs
monitored in this work were selected based on their importance in the 7
major AD markets (Japan, USA, France, United Kingdom, Italy, Spain,
Germany) according to the Cognos Plus Study #11 [19]. In addition, the
(active) metabolites were monitored as suggested by the AGNP-TDM Expert
Group Consensus Guidelines [20], as metabolite/compound ratios could
provide more information on the relation between plasma concentration and
therapeutic effects. In conclusion, a quantitative chromatographic method
was developed for citalopram, fluoxetine, fluvoxamine, maprotiline,
melitracen, mianserin, mirtazapine, paroxetine, reboxetine, sertraline,
trazodone, viloxazine, and venlafaxine and their metabolites (desmethyl-
citalopram, didesmethylcitalopram, desmethylfluoxetine, desmethyl-
maprotiline, desmethylmianserin, desmethylmirtazapine, desmethyl-
sertraline, m-chlorophenylpiperazine, and O-desmethylvenlafaxine).
The method of choice was a gas chromatographic-mass spectrometric
method, as it is sensitive and selective, providing the best separation power
for compounds that are volatile under GC conditions. The major success of
the application of modern GC in clinical and forensic toxicology is firstly due
to the very high efficiencies of separation which can be achieved with
capillary columns, secondly to the high sensitivity of the detection and finally
to the precision and accuracy of the data from quantitative analyses of very

Chapter V: Gas chromatographic-mass spectrometric method development
complex mixtures. In contrast, LC-MS methods have the great advantage
that no derivatization is needed, leading to shorter sample preparation times
and thus higher-throughput. However, the absence of ion suppression effect
observed in LC-MS, availability, high separation power and comparative low
cost of the equipment still make GC-MS instruments very attractive in many
laboratories.
In this chapter, the choice of sample introduction, the parameters for the
separation on the analytical column and the detector conditions will be
discussed (Figure V.1.). All of these optimized parameters will result in a GC-
MS method for ADs that will be evaluated and validated in chapter VI. For
validation, internal standards will be used and therefore, the choice of the
internal standards will also be discussed in this chapter.
Figure V.1. The gas chromatographic system
1, the gas supply; 2, the injector; 3, the oven containing the column; 4, the mass selective detector.
1
2
43
V.2. Experimental
V.2.1. Reagents
ADs standards used during optimization of the gas chromatographic-mass
spectrometric method were the same as described in chapter III (III.2.1.).
- 148 -

Chapter V: Gas chromatographic-mass spectrometric method development
- 149 -
Fluoxetine-d6 oxalate (Fd6), mianserin-d3 (Md3) and paroxetine-d6 maleate
(Pd6) (100 μg/ml MeOH) were purchased from Promochem (Molsheim,
France) and were used as internal standards. Toluene (Suprasolv quality,
Merck, Darmstadt, Germany) and 1-(heptafluorobutyryl) imidazole (HFBI)
(Fluka, Bornem, Belgium) were applied for derivatization. Vials, glass inserts
and viton crimp-caps were purchased from Agilent technologies (Avondale,
PA, USA).
V.2.2. Stock solutions
Stock solutions were prepared in methanol at a concentration of 1 mg/ml for
each compound individually and stored at -20°C. These stock solutions were
further diluted with methanol to working solutions of 0.1 mg/ml. For
detection of mass spectra 20 μl of this solution was derivatized and
redissolved in 50 μl of toluene of which 1 μl was injected.
The stock solutions were also used to prepare a standard mixture by mixing
the individual primary stock solutions and by further diluting with methanol
until a concentration of 0.05 – 0.125 mg/ml was obtained, depending on the
therapeutic range of the compound. After preparation, it was stored
protected from light at approximately -20°C. This mixture was used to
optimize the gas chromatographic parameters. Twenty μl of this mixture was
derivatized and redissolved in 50 μl of toluene of which 1 μl was injected.
V.2.3. Equipment
A HP 6890 GC system was used, equipped with a HP 5973 mass-selective
detector, and a G1701DA Chem Station, version D.02.00 data processing unit
(Agilent Technologies, Avondale, PA, USA). The mass selective detector was
used in scan to determine the injection conditions, the separation parameters
and the mass spectra.
Evaporation under nitrogen was conducted in a TurboVap LV evaporator from
Zymark (Hopkinton, MA, USA). The heater was a multi-block from Lab-line
(Tiel, The Netherlands).

Chapter V: Gas chromatographic-mass spectrometric method development
V.3. Gas chromatographic parameters
V.3.1. Sample introduction
V.3.1.1. Cold on-column versus split/splitless injection
A very important step in gas chromatography is the introduction of the
sample onto the capillary column. There are two basic types of injectors for
capillary columns: vaporization (Figure V.2.A) and cold-on column (Figure
V.2.B) [21].
Vaporization injectors include split and splitless injectors and are the most
common injector types. All vaporization injectors function basically in the
same manner. A syringe is used to pierce the septum and introduce the
sample into the vaporization chamber. This vaporization chamber contains a
heated glass liner in which the volatile components of the sample are rapidly
vaporized due to the high temperature. A carrier gas line supplies carrier gas
to the interior of the injector body and usually enters near the top of the
injector. This carrier gas mixes with the sample vapours and the vaporized
volatiles are introduced into the column by the movement of the carrier gas.
Figure V.2. Schematic overview of vaporization (A) and cold on-column
injectors
A. Split/Splitless injector
- 150 -
Rubber septum
Septum purge outlet
Split outlet
Vaporization chamber
Column
Glass liner
Carrier gas inlet
Heated metal block
B. Cold on-column injector
Rubber septum
Duckbill
Carrier gas inlet
Column

Chapter V: Gas chromatographic-mass spectrometric method development
- 151 -
The difference between a split and splitless injector is the amount of sample
introduced onto the column. While splitless injectors do not split the sample,
introducting most of the vaporized sample onto the column, split injectors
split the vaporized sample into two unequal portions with the smaller fraction
going to the column and the larger fraction being discarded through the split
outlet. The discarded fraction is determined by the split ratio. Split injectors
are used for highly concentrated samples (0.1-10 μg/μl), because only a
limited amount of sample finally reaches the column, preventing column
overloading. Splitless injectors are, on the contrary, suitable for trace level
analyses, as no portion of the sample is discarded, resulting in introduction of
most of the volatiles onto the column [21, 22].
The cold on-column injector eliminates the vaporization proces as it injects
the sample directly onto the capillary column. The injector is usually kept at
ambient temperature since immediate sample vaporization is not required.
The characteristics of a cold on-column injector make it ideal for high boiling
point compounds as they are directly injected onto the column and are not
vaporized. In addition, this injection technique is ideal for heat sensitive
compounds. However, as the whole sample is introduced onto the column,
non-volatile compounds can result in pronounced column contamination [21,
23].
Our first GC configuration contained a cold on-column injector. Although this
injector resulted in highly reproducible results, it was not robust due to the
use of a retention gap. The retention gap was necessary to enlarge the
lifetime of the analytical column and it was connected to the analytical
column by a press-fit connection. These connections can result in small
airleaks if not installed properly or after several injections. In addition,
matrices such as plasma, whole blood and brain tissue are dirty matrices
leading to column contamination and thus a high maintenance level of the GC
configuration. The major field of application of vaporization injectors,
however, is the analysis of ‘dirty’ samples, because the involatile material is
deposited inside the injector and not on the column as with cold-on column
injectors [22]. Therefore, the injector type was changed to a vaporization
injector. The splitless mode was preferred because of sensitivity issues as
concentrations of picograms or nanograms per injection volume (1 μl) would
be monitored.

Chapter V: Gas chromatographic-mass spectrometric method development
- 152 -
V.3.1.2. Splitless injection optimization
Choice of injection solvent
Methanol was used as injection solvent in the beginning of our research as a
lot of compounds of interest in clinical and forensic applications are easily
dissolved in this rather polar solvent. Later on, toluene was used for several
reasons.
First of all, the HFB-derivatives are very soluble in toluene. Secondly, the
vapour volume generated by methanol is much higher as compared to
toluene. This vapour volume should be taken into account when optimizing
the sample introduction as a high vapour volume can lead to backflush of the
vaporized sample in the injector. This backflush leads to loss of the sample
and possible injector contamination. According to Grob [22], the volumes of
undiluted vapour generated by 1 μl of toluene or methanol, calculated for an
injector at 250 °C and a carrier gas inlet pressure of 28 kPa are respectively,
260 and 750 μl. As a result of this large difference in vapour volume, a larger
volume of the sample redissolved in toluene can be injected as compared to
methanol before the effect of backflush occurs. In addition, injection of 1 μl
of toluene leads to a short and homogeneous flooded zone onto the apolar
stationary phase, while injection of polar solvents leads to a poor wettability
of the column, thus formation of droplets and a long and inhomogeneous
flooded zone, which can result in peak broadening or distortion [24]. Finally,
the boiling point of toluene is 110.6 instead of 64.7 °C, which leads to higher
possible starting column temperatures when using a cold on-column or
splitless injection technique, resulting in a shorter analysis time.
Choice of inlet liner
A splitless single tapered (taper down) inlet liner (4 mm I.D.) containing
deactivated glass wool was chosen. While glass wool can lead to adsorption
of some compounds, it has several advantages. If dirty samples such as
plasma, blood and brain tissue extracts are injected, non-evaporating
material is retained on the glass wool and will not be transferred to the
column. In addition, deposition of the sample liquid onto the wool prevents
wild movement through the vaporizing chamber during the vaporization of
the sample.

Chapter V: Gas chromatographic-mass spectrometric method development
Injection temperature
The injector temperature should be high enough to evaporate the compounds
instantly without any degradation. Excessively low injector temperatures may
cause incomplete vaporization of the sample, especially for high boiling
compounds, leading to broad or tailing peaks and discrimination [21, 25].
The injection temperature was varied from 200 till 300 °C for the injection of
an extracted sample (40 ng/μl for each AD; n=3).
As depicted in Figure V.3., 200 °C was adequate for full vaporization of most
compounds. However, for the high boiling compounds, such as trazodone,
300 °C resulted in a faster evaporation and thus a better sample transfer
onto the column. Therefore, an injection temperature of 300 °C was chosen
for our final analysis.
Figure V.3. Influence of injection temperature on sample transfer onto the
column. Errorbars indicate ± one standard deviation
Injection Temperature
0
2000000
4000000
6000000
8000000
10000000
12000000
14000000
200 250 300
Temperature (°C)
area
mean venlafaxine mianserin trazodone
Inlet Pressure
The inlet pressure during injection is important for a rapid transfer of the
vaporized sample into the column. A rapid sample transfer results in a high
efficiency and less sample backflush. According to Grob [22], the vapour plug
in the liner is steadily growing during sample transfer as a result of diffusion.
At low gas flow rates, this broadening is more pronounced than the transfer
to the column. This effect leads to incomplete sample transfer and broad
- 153 -

Chapter V: Gas chromatographic-mass spectrometric method development
- 154 -
peaks. High carrier gas flows create a rapid sample transfer and a short initial
sample band onto the column leading to narrow peaks. Therefore, it would be
interesting to use high carrier gas flows. However, a continuous high carrier
gas flow will result in high carrier gas linear velocities and thus reduced
resolution. As a result, the carrier gas pressure is increased during injection,
and thereafter reduced to an ideal gas flow during separation of the sample
compounds on the column. This short pressure increase during injection is
called pulsed injection [21].
Pulsed splitless injections with very high flow rates improve sample transfer
dramatically, however, because column flow rates are much less for a gas
chromatograph with mass spectrometric detection, the improvements with
pulsed injection are less drastic for these GC-MS configurations [22, 26]. The
pulsed splitless injection also leads to a shorter residence time in the liner,
leading to less time for adsorption onto the active sites in the injector and
less time for degradation of the analytes.
Pulsed splitless injection can also result in less matrix-induced response
enhancement. Erney et al. [27] and Poole [28] describe the increase of
sample transfer from hot vaporizing injectors because of matrix compounds
as these reduce the thermal stress and mask active sites in the injector
responsible for adsorption and decomposition of the monitored analytes. This
is a problem that mostly occurs for thermally labile compounds and
compounds that are predisposed to adsorb on surfaces encountered by the
sample during its transfer to the column. Because pulsed splitless injection
leads to shorter contact time between sample and active sites in the injector
this matrix enhancement is reduced. In contrast, Grob [22] describes a
response decrease due to the matrix and residual ‘dirt’ in the injector
because of evaporation problems. It is thus clear that the matrix-effect in the
vaporization injector is not straightforward and a pulsed injection will not
always diminish these problems. Therefore, all our sample calibration will
occur in the same matrix as the actual samples and the pulsed splitless
injection was mainly used to provide rapid sample transfer to the column and
thus lead to sharper peaks in the chromatogram.
For the optimization of the inlet pressure, a mixture of ADs (40 ng/μl) was
extracted from plasma and derivatized before injection at various inlet
pressures from 10.7 (1.3 ml/min He flow) to 30 psi. When comparing the

Chapter V: Gas chromatographic-mass spectrometric method development
areas at different inlet pressures, an increase of compound transfer onto the
column is seen for the high boiling compounds as demonstrated in Figure
V.4. An inlet pressure of 25 psi was selected as this led to less discrimination
of the high boiling points and to a smaller variation as compared to 30 psi.
Figure V.4. Influence of inlet pressure during splitless injection
Errorbars indicate ± one standard deviation
Inlet pressure
0
2000000
4000000
6000000
8000000
10000000
12000000
14000000
10,7 20 25 30
pressure (psi)
area
mean venlafaxine mianserin trazodone
Purge activation time
During splitless injection, purge and split valves are closed, to ensure that
the sample mixed with carrier gas will flow into the column. After a certain
time, the valves are opened and the carrier gas flow that previously flowed
into the column, will now be swept out of the injector through the slit line.
The purge activation time, the time whereafter the purge of the splitless
injector is opened, needs to be chosen carefully as a short purge activation
time will lead to sample loss, while too long purge activation can result in an
increased solvent front, a higher ratio of compound degradation and
adsorption. The best purge activation time depends on the carrier gas flow
rate and the volatility of the sample compounds. Typical purge activation
times are 15-90 seconds [21, 22].
The purge activation and splitless activation time was optimized. ADs (40 ng/
μl) were injected after sample preparation with a purge activation time of
0.5-1.5 minutes. These conditions were chosen by calculating the theoretical
- 155 -

Chapter V: Gas chromatographic-mass spectrometric method development
purge activation time. The purge activation time should occur when at least
1.5 volumes of carrier gas have swept the injector. The sweep rate of the
liner is calculated by deviding the liner volume (1.01 cm3) through the
column flow rate (2.6 ml/min during injection). The sweep rate is 0.39
minutes or 23 seconds, thus as a result the purge activation time should be
at least 35 seconds [21]. A purge activation time of 1 minute was selected
experimentally, because no gain in peak area was observed after 1.5 minutes
(Figure V.5.).
Figure V.5. Influence of purge activation time during splitless injection (n=3)
Errorbars indicate ± one standard deviation
Purge activation time
0
1000000
2000000
3000000
4000000
5000000
6000000
7000000
8000000
0.5 1.0 1.5
time (min.)
area
mean venlafaxine mianserin trazodone
Pulse time
The pulse time is a parameter that must be optimized when applying a
pulsed splitless injection type. It is the time whereafter the inlet pressure is
dropped to the carrier gas pressure necessary for the separation step. During
injection the pressure is high to ensure almost complete and fast sample
transfer onto the column. However, this inlet pressure will create a too high
linear velocity and thus less resolution. Therefore a time is set at which the
pressure is decreased.
The pulse time should be 0.1 to 0.5 minutes longer then the purge activation
time [29]. Therefore, a pulse time of 1.1 and 1.5 minutes was tested during
the injection of a mixture of ADs (40 ng/μl).
- 156 -

Chapter V: Gas chromatographic-mass spectrometric method development
Especially for the high boiling compounds an increase in signal was observed
if the inlet pressure stayed high for 1.5 minutes. As a result, the pulse time
was set for that period.
Figure V.6. Influence of pulse time during splitless injection (n=3)
Errorbars indicate ± one standard deviation
Pulse time
0
1000000
2000000
3000000
4000000
5000000
6000000
7000000
8000000
9000000
1/1.1 1/1.5
activation time (min.)
area
mean venlafaxine mianserin trazodone
V.3.2. Chromatographic separation
The chromatographic separation of the ADs mixture occurs on a capillary
column residing in an oven whose temperature is controlled. The vaporized
compounds move through the column at the same rate as the carrier gas.
However, as the column wall is coated with a thin film of polymeric material
(stationary phase) compounds will react in a different way with this film,
resulting in a slowed down movement of the compounds. This retention onto
the column will be different for each compound due to their differences in
chemical structures and physical properties. In addition, the length and
diameter of the column, the chemical structure and amount of stationary
phase, the column temperature all will affect the compound retention. As
result each compound will leave the column at a different time and will be
measured separately by the detector.
- 157 -

Chapter V: Gas chromatographic-mass spectrometric method development
- 158 -
V.3.2.1. Column choice
The 5% phenylmethylpolysiloxane phase was applied as it is the most
common general purpose column which is used a lot in clinical and forensic
routine laboratories. Non-polar stationary phases are preferable to use,
because they have higher maximum temperatures, are more durable, and
result in less column bleed. The 5% phenylmethylpolysiloxane phase will
interact with the ADs through strong dispersion interaction and a weak
hydrogen bonding interaction. Dispersion is the primary separation
mechanism and it is related to the intermolecular attraction between the
compound and stationary phase. The polarization property of the compound
and its solubility in the stationary phase plays a major role in this type of
interaction. This interaction can be related to the vapour pressure of the
compound, or simplified to the boiling points of compounds: the higher the
boiling point of a compound, the more retention onto the column. Due to the
5% of phenyl groups onto the methylpolysiloxane backbone, hydrogen
bonding can also occur with the ADs containing amine functions.
The capillary column dimensions selected were the standard dimensions. A
column length of 30 meter results in a good resolution and acceptable
retention times. The column has a diameter of 0.25 mm, which is the largest
diameter that can be applied for GC-MS systems because the mass
spectrometer has a maximum pumping capacity of 1-2 ml/min carrier gas.
Carrier gas volumes of columns with inner diameters of 0.32 mm or greater
exceed this flow rate. Columns with internal diameters smaller than 0.25 mm
result in higher efficiency and resolution, however, the column capacity will
decrease. A 0.25-mm ID column was chosen as this column still has an
acceptable efficiency and resolution, but also has a higher capacity range
[21, 30]. The film thickness of the stationary phase is 0.25 μm, resulting in a
high efficiency, an acceptable capacity and acceptable column bleed. Thinner
column films whould result in higher efficiencies and shorter retention times,
however, slightly thicker films shield compounds from active sites on the
surface of the tubing, reducing peak tailing [21].
In conclusion, a “common” column was used due to practical considerations
in a routine forensic and clinical laboratory. This column was a 30 m x 0.25
mm I.D. x 0.25 μm film 5% phenylmethylpolysiloxane column (5-MS J&W
column from Agilent technologies, Avondale, PA, USA). On this column

Chapter V: Gas chromatographic-mass spectrometric method development
- 159 -
several analyses can be performed without a column switch. This reduces the
number of columns needed, and thus reduces complexity and cost. Of course
some dimensions could be better to create a higher throughput
(filmthickness, I.D., column length). However, the column that was chosen
provides acceptable retention, separation and peak shape.
V.3.2.2. Choice of carrier gas and flow rate
Helium was provided as carrier gas for the GC-MS configurations in our
laboratory. A constant helium flow rate was prefered over a constant
pressure of the carrier gas during analysis due to the sensitivity of mass
selective detectors to flow changes. A constant flow helps to establish a
constant pressure in the mass ion source, thereby normalizing ion
fragmentation patterns across the range of column temperatures [31].
The flow rate was chosen according to the Van Deemter curve and the speed
of analysis. The recommended average linear velocity of helium in our
analytical column (30 m, 0.25 μm film, 0.25 mm I.D.) ranges from 30-40
cm/sec [21]. Therefore, the flow rate was varied from 0.7-1.6 ml/min. A flow
of 0.7 results in a linear velocity of 31 cm/sec for our analytical column,
which is near the minimum of the Van Deemter curve, leading to the best
separation power. A flow of 1.6 ml/min results in a linear velocity of 47
cm/sec and leads to shorter retention times onto the column, but results in
less resolution. Finally, a constant flow rate of 1.3 ml/min was chosen as this
resulted in an acceptable separation for most compounds and an exceptable
analysis time for the late eluting compounds such as trazodone.
V.3.2.3. Optimization of temperature program
In common practical gas chromatographic separations using splitless
injection as sample introduction, the sample is introduced at a column
temperature below the boiling point of the solvent. Under these conditions,
the injected vaporized sample will condense and form a liquid droplet on the
column, which then forms a flooded zone that is short and homogeneous. As
the column temperature is increased, the solvent starts to evaporate from
the front of the flooded zone. Eventually, only a small droplet of solvent
remains at the end of the flooded zone which traps the highly volatile
compounds. When the solvent and highly volatile solutes have started their

Chapter V: Gas chromatographic-mass spectrometric method development
- 160 -
chromatographic process, the moderately volatile and high-boiling
compounds are distributed over the length of the original flooded zone. They
are dissolved in the stationary phase as long as the column temperature is
low. As the column temperature is increased, they will evaporate, and
chromatography will start over the length of the flooded zone. The length of
this zone will determine the initial band width: short flooded zones mean
small initial bands and no broadening. Long and inhomogeneous zones mean
large initial bands and peak broadening. For an effective solvent effect of the
low-boiling compounds, the initial oven temperature should be at least 20 °C
lower than the boiling point of the solvent. For effective thermal focusing of
high-boiling compounds, the initial oven temperature should be at least 80 °C
lower than the elution temperature of the solutes [24].
In our case, an initial column temperature of 90 °C was chosen to create a
small flooded zone after injection of 1 μl of toluene, as this temperature is
20°C lower than the boiling point of toluene. In addition, most compounds
start to elute at about 180 °C, and this is 90 °C higher than the starting
conditions, resulting in a thermal focusing effect of these compounds.
The dependence of GC retention on vapour pressure means that mixtures
containing compounds with a wide range of boiling points cannot be
separated satisfactory in an isothermal run. The more volatile components
may be well enough resolved, but the higher boiling materials will only be
eluted with long retention times and very broad peaks [30]. Due to the
choice of the temperature gradient the analysis time was reduced and a
better peak shape and detection was observed for the late eluting compounds
such as paroxetine and trazodone [32]. Several temperature gradients were
applied for the ADs mixture and the final temperature program was as
follows: the initial column temperature was set at 90 °C for 1 min, ramped at
50 °C/min to 180 °C where it was held for 10 min, whereafter the
temperature was ramped again at 10 °C/min to 300 °C (5’). However,
chromatographic problems were observed for trazodone during further
analysis and therefore the run-time during validation was shortend by cooling
the column down directly after it reached the temperature of 300 °C.
Trazodone did not elute in a reproducible way from the column (sometimes it
eluted, sometimes not) probably due to adsorption onto the liner, inlet seal,
and onto the aging column.

Chapter V: Gas chromatographic-mass spectrometric method development
Figure V. 7. Chromatographic separation of 13 new generation ADs and 8 of
their metabolites
Compounds indicated in red are not fully separated. Compounds in order of elution are venlafaxine, m-cpp, norfluoxetine, viloxazine, fluvoxamine, fluoxetine, mianserin, mirtazapine, melitracen, DMMia, DMMir, reboxetine, DMSer, DMMap maprotiline, sertraline, DDMC, DMC, paroxetine, and trazodone
- 161 -
8.0 10.0 12.0 14.0 16.0 18.0
Figure V.7. shows the compounds in order of their retention times. Not all
compounds are base-line separated. Viloxazine and desmethylfluoxetine
coelute, while desmethylsertraline, desmethylmirtazapine, reboxetine and
citalopram elute very close to each other. Maprotiline and sertraline also have
a slight overlap. Although a base-line separation is still state of the art, due
Time20.0 22.0 24.0 26.0 28.0 30.0
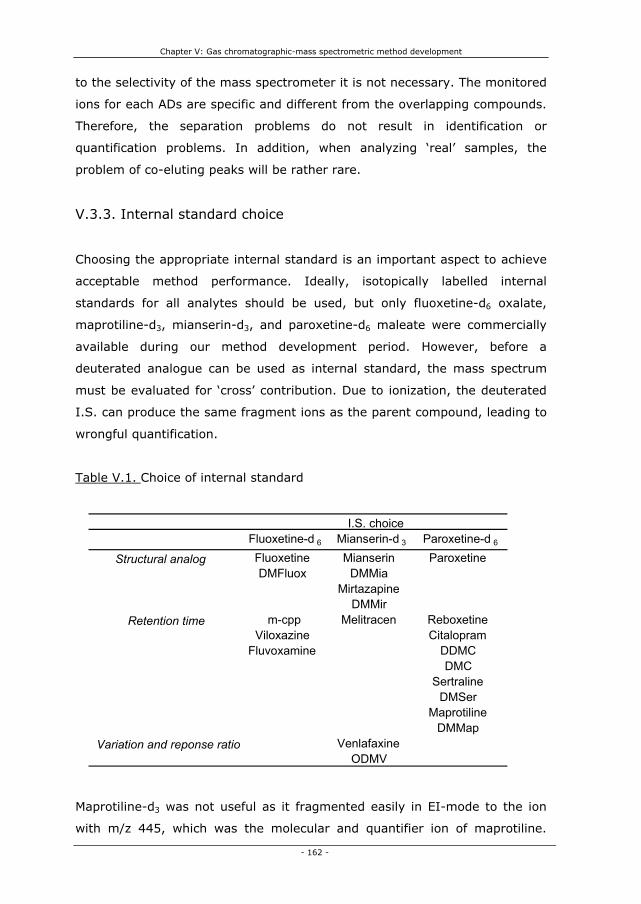
Chapter V: Gas chromatographic-mass spectrometric method development
to the selectivity of the mass spectrometer it is not necessary. The monitored
ions for each ADs are specific and different from the overlapping compounds.
Therefore, the separation problems do not result in identification or
quantification problems. In addition, when analyzing ‘real’ samples, the
problem of co-eluting peaks will be rather rare.
V.3.3. Internal standard choice
Choosing the appropriate internal standard is an important aspect to achieve
acceptable method performance. Ideally, isotopically labelled internal
standards for all analytes should be used, but only fluoxetine-d6 oxalate,
maprotiline-d3, mianserin-d3, and paroxetine-d6 maleate were commercially
available during our method development period. However, before a
deuterated analogue can be used as internal standard, the mass spectrum
must be evaluated for ‘cross’ contribution. Due to ionization, the deuterated
I.S. can produce the same fragment ions as the parent compound, leading to
wrongful quantification.
Table V.1. Choice of internal standard
Fluoxetine-d 6 Mianserin-d 3 Paroxetine-d 6
Fluoxetine Mianserin Paroxetine DMFluox DMMia
Mirtazapine DMMi
- 162 -
Maprotiline-d3 was not useful as it fragmented easily in EI-mode to the ion
with m/z 445, which was the molecular and quantifier ion of maprotiline.
rm-cpp Melitracen Reboxetine
Viloxazine Citalopram Fluvoxamine DDMC
DMCSertraline
DMSerMaprotiline
DMMapVenlafaxine
ODMVVariation and reponse ratio
I.S. choice
Structural analog
Retention time
Chapter V: Gas chromatographic-mass spectrometric method development
- 163 -
Therefore, only 3 I.S.s were used for the validation process. The I.S.s used,
were selected on structural analogy (deuterated versus their cold products),
retention time, and on base of the response ratio of the compound versus
I.S. and its variation. In addition, for the metabolites always the same I.S.
was used as for the parent compound. A concentration of 200 ng/ml of each
I.S. was chosen as this concentration was in the mid range of the monitored
therapeutic window.
V.3.4. Conclusion: gas chromatographic method
During optimization of the gas chromatographic method a lot of attention was
paid to the sample introduction. Splitless vaporization injection was chosen
due to sensitivity and robustness concerns. However, as incomplete sample
transfer from the injector liner to the column, discrimination, and poor peak
focussing on the top of the column are the most widely observed problems in
splitless injections, this injection type was evaluated concerning inlet
temperature, purge activation time and inlet pressure to ensure minimal
negative effects. In order to accelerate and maximize the sample transfer, a
pulsed splitless injection was selected in which the high inlet pressure was
used to increase the mass transfer to the column and to reduce the band
spreading. In addition, an initial oven temperature was selected 20 °C lower
than the boiling point of the solvent, resulting in accelerated sample transfer
due to the vacuum created upon recondensation of the solvent in the column
and a better peak shape due to solvent trapping. The discrimination of high
boiling compounds was diminished due to optimization of the injection
temperature, the purge activation time and an increase in inlet pressure.
The separation occurred on a non-polar 5% phenylmethylpolysiloxane column
with general purpose dimensions to avoid GC-MS downtime due to column
switching in the forensic or clinical routine laboratory. Although not all
compounds were base-line separated, the choice of column and temperature
program resulted in adequate separation and an acceptable retention time for
most compounds. Although a lot of parameters were optimized for high
boiling point compounds such as trazodone, this compound did not lead to

Chapter V: Gas chromatographic-mass spectrometric method development
- 164 -
reproducible chromatographic results. Trazodone demonstrates adsorption
probably onto an older column, a ‘dirty’ liner and probably onto the inlet seal.
Therefore, this compound was not monitored during validation.
The final gas chromatographic method conditions were as follows: the pulsed
splitless injection temperature was held at 300 °C, while purge time and
injection pulse time were set at 1 and 1.5 min, respectively. Meanwhile, the
injection pulse pressure was 25 psi and 1 μl of the sample, redissolved in 50
μl of toluene, was injected. Ultrapure Helium with a constant flow of 1.3
ml/min was used as carrier gas. Chromatographic separation was achieved
on a 30 m x 0.25 mm i.d., 0.25-μm J&W-5ms column from Agilent
Technologies (Avondale, PA, USA). The initial column temperature was set at
90 °C for 1 min, ramped at 50 °C/min to 180 °C where it was held for 10
min, whereafter the temperature was ramped again at 10 °C/min to 300°C.
The separation of the ADs and their active metabolites was achieved in 24.8
minutes.
V.4. Mass spectrometric parameters
Once the compounds are separated on the GC capillary column, the
vaporized compounds leave the column and enter the mass selective detector
(MSD). The mass analyzer will ionize the sample, filter the ions and finally
detect the ions. The mass analyzer consists of three essential parts: the ion
source, the quadrupole and the detector (Figure V.8.).
The sample molecules will first enter the ion source, which is the part of the
analyzer where sample molecules are ionized and fragmented. There are
different types of ion sources as vaporized sample compounds can be ionized
and fragmented using electron ionization or chemical ionization. An ion
source that operates by electron ionization (EI) will ionize and fragment
sample molecules through high energy electrons (70 eV) emitted by a
filament. In the chemical ionization (CI) modes the energy of the
fragmentation reaction is diminished by adding a reaction gas such as
methane (133 Pa) into the ion source. This reagent gas is ionized in electron
ionization to the primary ions CH4+. and CH3
+. These primary ions react with

Chapter V: Gas chromatographic-mass spectrometric method development
the excess of methane to give secondary ions which will then react with the
sample molecules [33]. Thus in chemical ionization modes bimolecular
processes are used to generate analyte ions and involve the transfer of an
electron, a proton or other charged species between the reactants. After the
ionization step in EI or CI, the voltage on the repeller will then push the ions
through several electrostatic lenses that will lead the ions in a thight beam
towards the mass filter (Figure V.9.).
Electron ionization is the traditional method as toxicological libraries use this
70 eV EI mode. However, EI mass spectra suffer from frequent absence of
the molecular ion due to extensive fragmentation. Chemical ionization is a
softer ionization technique and often results in highly abundant quasi-
molecular ions.
Figure V.8. Mass analyzer consisting of an ion source, quadrupole mass filter,
detector and heaters (adapted from Agilent Technologies)
- 165 -

Chapter V: Gas chromatographic-mass spectrometric method development
Figure V.9. Disassembly of an EI ion source (adapted from Agilent
technologies)
Positive ion fragments to
mass filter Electrons (70 ev)
Sample molecules from GC column
The mass filter, which is a quadrupole in our GC-MS configuration, filters and
separates ions according to their mass-to-charge ratio (m/z). The quadrupole
consists of four hyperbolic surfaces creating a complex electric field
necessary for mass selection. The mass filter can work in scan mode,
monitoring a whole range of m/z values, or in selected ion monitoring (SIM)
mode, whereby only a few selected m/z values are measured (Figure V.10.).
Once the fragments pass the quadrupole, they reach the detector which
consists of a high energy conversion dynode coupled to an electron
multiplier. The high energy dynode attracts the positive ions and when a
positive ion hits the dynode, electrons are emitted. These electrons are
attracted to the positive electron multiplier horn, in which they cascade
through, liberating more and more electrons as they go. At the end of the
horn, the current generated by the electrons is carried towards a signal
amplifier board and towards the data processor (Figure V.10.).
- 166 -

Chapter V: Gas chromatographic-mass spectrometric method development
Figure V. 10. Fragment selection through mass filter and detection
1: quadrupole mass filter; 2: high energy dynode; 3: electron multiplier
Non-resonant, not detected ion
Resonant positive ions to detector
1
- 167 -
V.4.1. Optimization of mass selective detector parameters
The mass parameters for the electron ionization mode (EI) were not
optimized, as the ‘traditional’ conditions in which the spectra of the
commercially available libraries were obtained were chosen. In EI, the mass-
selective detector temperature conditions were 230 °C for the EI-source, 150
°C for the quadrupole and 300 °C for the transferline, whereas an electron
voltage of 70 eV was used.
For the chemical ionization modes another ion source was used and
parameters such as temperature of the source and quadrupole were
optimized. The manufacture guidelines were followed and the abundances of
the quasi-molecular ions were compared. The mass selective detector
temperature conditions in positive ion chemical ionization (PICI) were as in
EI, except for the ion source temperature, which was 250 °C. The methane
reagent gas entered the ion source at a constant flow of 1 ml/min. For the
MSD conditions in negative ion chemical ionization (NICI) special attention
was paid to optimize ion source temperature and ion focus potential as these
parameters have the most effect on the abundance of the molecular ions in
Positive ion fragments from ion source
+-
-+
+ + + 2
e- e-
3
Dataprocessor

Chapter V: Gas chromatographic-mass spectrometric method development
- 168 -
NICI mode [34]. For NICI-mode the transferline was kept at 280 °C, the ion
source at 150 °C and the quadrupole at 106 °C, with an electron energy of
170 eV. The electron emission (100 μA) was optimized to give best peak
intensity, as this parameter is compound specific. Methane was used as
reagent gas with a flow of 2 ml/min.
Parameters for the repeller, ion focus and entrance lens were not optimized,
but adapted as indicated by the weekly tuning reports.
V.4.2. Spectra of the derivatized ADs after electron ionization
The result of the impact of the high-energy electron beam onto molecules in
vapour fase results in a spectrum of positive ions separated on the basis of
mass/charge (m/z). The positive fragment ions in combination with the
molecular ion will be plotted against their abundance and these spectra
exhibit a characteristic pattern for each specific compound. The spectra
obtained in the electron ionization (EI) mode give structural information and
it is the traditional ionization technique applied in chromatographic methods
for comprehensive screening procedures in clinical and forensic toxicology.
Because of the robustness of the system, ionization occurs very precise,
allowing identification of unknown compounds by comparison of their mass
spectrum with a large collection of reference mass spectra in commercially
available libraries.
In this paragraph, the spectra for the different (heptafluorobutyrylated) ADs
obtained in EI are shown. The spectra were obtained in scan mode, and the
selected fragments (V.4.5., Table V.1.) for the selected ion mode will be
discussed.
V.4.2.1. Venlafaxine and O-desmethylvenlafaxine
The fragments selected for venlafaxine were m/z 259, the molecular ion of
the dehydrated venlafaxine molecule, 121 and 58. The last two fragments are
not specific as demonstrated in Figure V. 11. The fragment with m/z 58 was
chosen as quantifier due to its high abundance. HFBI derivatization of O-
demethylvenlafaxine leads to a dehydrated product and a derivatized

Chapter V: Gas chromatographic-mass spectrometric method development
dehydrated product. Both of these products are severly fragmented in EI,
especially to the highly abundant m/z 58 ion that is typical for dimethylated
tertiary amines.
Figure V.11. Spectra and fragmentation pattern of venlafaxine (A) and O-
desmetylvenlafaxine (B) after HFB-derivatization
- 169 -
A
B
50 60 70 80 90 100 110 120 130 140 150 160 170 180 190 200 210 220 230 240 2500
200000
400000
600000
800000
1000000
1200000
1400000
m/z-->
Abundance
58
10777 91 157145131120 186 20067 171 245226214
60 80 100 120 140 160 180 200 220 240 2600
5000
10000
15000
20000
25000
30000
35000
40000
45000
50000
55000
m/z-->
Abundance
58
12191 214159 17114177 200102 185 259131
N
MeO
NCH2
CH2
MeO
N
MeO
OH
m/z = 259
. +
+
m/z = 277 m/z = 58
+
m/z = 121
N
OH
OHNCH2
N
OHm/z = 263
+
m/z = 58m/z = 245
+.

Chapter V: Gas chromatographic-mass spectrometric method development
- 170 -
V.4.2.2. Viloxazine
Heptafluorobutyrylated viloxazine has a high abundant molecular ion at m/z
433 even when using EI. Fragment m/z 296 is formed by a heterolytic
cleavage of the O-C binding indicated by the red trace in Figure V.12. The
fragment m/z 240 is probably a result of two homolytical cleavages
(demonstrated by the green trace) due to the oxygen and nitrogen
heteroatoms in the ringstructure, finally resulting in a positive charge on the
nitrogen atom.
Figure V.12. Spectrum and fragmentation pattern of HFB-viloxazine
40 60 80 100 120 140 160 180 200 220 240 260 280 300 320 340 360 380 400 420 4400
40000
80000
120000
160000
200000
240000
280000
m/z-->
Abundance
115 16914191 303275 341 382 440186 236 360207 410255
N
OH
OH
NCH2
N
O
OF
FF
F
F
F
F
m/z = 263
+
m/z = 58
+.
m/z = 441
58
O
N
O
O
OF
F
F
F
FF
F
O
NCH2
OF
F
F
F
FF
F
N+
OF
F
F
F
F
FF
+
m/z = 433 m/z = 296
m/z = 240
+
.

Chapter V: Gas chromatographic-mass spectrometric method development
Abundance
- 171 -
V.4.2.3. Fluvoxamine
Figure V.13. Spectra and fragmentation pattern of HFB-fluvoxamine
50 100 150 200 250 300 350 400 450 5000
100000
200000
300000
400000
500000
600000
700000
800000
900000
m/z-->
Abundance
71
226258
198
172145
95 49512551 442288 514363313 339
40 60 80 100 120 140 160 180 200 220 240 260 280 300 320 340 360 380 400 420
11065000 240
60000
55000
5000013845000
40000 296 43335000
5630000
25000 1698120000
15000
26610000
5000192 210 3943660
m/z-->
ON
FF
F
OMe
N
O
FF
F
FF
FH
F
NF
F
F
OMe
CH2
N
O
FF
F
FF
FH
F
m/z = 514
+.
+
m/z = 258
+
m/z = 240
Chapter V: Gas chromatographic-mass spectrometric method development
- 172 -
For heptafluorobutyryl-fluvoxamine the molecular ion m/z 514 was selected
because of the selectivity. In addition, the fragments 258 and 240 were
chosen based on their m/z values and for the abundance of the two
fragments. Both fragment ions, m/z 258 and 240, were formed by a
heterolytic cleavage as indicated in Figure V.13. Ion m/z 240 is not that
specific as it consists largely of the HFB-function, thus a lot of derivatized
products could lead to such a fragment. However, ions m/z 226 (fragment
240 amu – CH2) and ion 198 (HFB) are also related to the derivatization
product. No selectivity problems, however, occurred during validation of this
method with the selected ions for fluvoxamine. In addition, according to the
NCCLS-guidelines [35], one of the selected ions may originate from the
derivatization product.
V.4.2.4. Fluoxetine, fluoxetine-d6 and desmethylfluoxetine
For heptafluorobutyrylated fluoxetine, the m/z 344 fragment was chosen as
quantification ion because it has a relative high abundance and is more
specific than ion m/z 240 or 117. The molecular ion is only seen in low
abundance. Ion m/z 344 is a result of a heterolytic cleavage, in which a pair
of electrons ‘moves’ together towards the charged oxygen atom. The 117
amu fragment is achieved by a McLafferty rearrangement followed by a
heterolytic cleavage leaving the charge on the carbon after the cleavage of
the C-O bound (Figure V.14. A). Fragment m/z 117 was preferred over 240
as it gave more structural information, as fragment m/z 240 mostly
contained the HFB-part. In addition, ion m/z 117 resulted in a higher
abundance. The fragmentation pattern of derivatized fluoxetine-d6 results in
the same fragments but with 6 amu difference due to the deuterated
functions. Fragmentation of desmethylfluoxetine occurs in the same manner
as for its parent compound.

Chapter V: Gas chromatographic-mass spectrometric method development
Figure V.14. Spectra and fragmentation patterns of heptafluorobutyrylated
fluoxetine (A), fluoxetine-d6 (B) and desmethylfluoxetine (C)
A
F
F
- 173 -
50 100 150 200 250 300 350 400 4500
200000
400000
600000
800000
1000000
1200000
1400000
m/z-->
Abundance
117
240
344
169
916942145 212 382193 311277 486
FO FO
N
FF
FF
FF
F
FO
N
OF
F
F
F
F
FF
C+
N
OF
F
F
F
F
FF
C+
HH
CH2 N+
OF
F
F
F
F
FF
m/z = 505
- F +
m/z = 117
m/z = 486
m/z = 240
m/z = 344

Chapter V: Gas chromatographic-mass spectrometric method development
B
- 174 -
50 100 150 200 250 300 350 400 4500
50000
100000
150000
200000
250000
300000
350000
400000
450000
m/z-->
Abundance
F
FF O
N
OF
F
F
F
F
FF
D
D
DD
D
D
F
FO
N
OF
F
F
F
F
FF
D
D
D D
D
D
C+
N
OF
F
F
F
F
FF
D
D
D
D D
D
C+
HH
DD
D
D
D
D
m/z = 511
+
m/z = 492
m/z = 350
m/z = 123
- F
123 240
350169
6997 145
50 492212188 382282 311 331259

Chapter V: Gas chromatographic-mass spectrometric method development
C
F
F
- 175 -
V.4.2.5. Mianserin, mianserin-d3 and desmethylmianserin
Mianserin and deuterated mianserin have the same fragment ions, only their
molecular ion has a difference of 3 amu due to the deuterium atoms.
Fragment m/z 193 and 220 are products of heterolytic and homolytical
cleavages due to the nitrogen atoms. In the spectrum of desmethylmianserin
ion m/z 193 is also the base peak. However, the derivatized metabolite has a
highly abundant molecular ion of m/z 446 and is fragmented to ion m/z 249
(Figure V.15)
40 60 80 100 120 140 160 180 200 220 240 260 280 300 320 340 360 380 400 420 440 4600
200000
600000
1000000
1400000
1800000
2200000
2600000
m/z-->
Abundance
117
330
22691 16969 143 20651 251 310277187 386357 472
FO FO
N
FF
FF
FF
F
FO
N
OF
F
F
F
F
FF
C+
N
OF
F
F
F
F
FF
H
C+
H
m/z = 491
- F+
H
m/z = 117m/z = 472
m/z = 330

Chapter V: Gas chromatographic-mass spectrometric method development
Figure V.15. Spectra and fragmentation patterns of mianserin (A), mianserin-
d3 (B) and HFB-desmethylmianserin (C)
- 176 -
A
B
60 80 100 120 140 160 180 200 220 240 2600
2000
4000
6000
8000
10000
12000
14000
16000
18000
20000
22000
24000
26000
m/z-->
Abundance
193
264
16572 178 220
24920415213258 11589
102 235
40 60 80 100 120 140 160 180 200 220 240 2600
500
1500
2500
3500
4500
5500
6500
7500
8500
9500
m/z-->
Abundance
193
267
7546
165178
220
8961 206115
N
NCR3
N+
N+
CH2
.+
R= H m/z = 264m/z = 220m/z = 267R= D
m/z = 193

Chapter V: Gas chromatographic-mass spectrometric method development
C
- 177 -
V.4.2.6. Mirtazapine and desmethylmirtazapine
Figure V.16. Spectra and fragmentation patterns of mirtazapine (A), and
HFB-desmethylmirtazapine (B)
A
40 60 80 100 120 140 160 180 200 220 240 260 280 300 320 340 360 380 400 420 440
5500
6500
7500
8500
9500
ndance
0500
1500
2500
3500
4500
m/z-->
Abu
193
249446
56
165
220
91 115 427139267 311
N
N
O
F
FF
F
F
F
F
N+
N
N+
O
m/z = 193
+
m/z = 446 m/z = 249
.
NN
N
NN
+
NN
CH2+
+
m/z = 195
m/z = 208m/z = 265
.

Chapter V: Gas chromatographic-mass spectrometric method development
- 178 -
B
Mirtazapine is not derivatized and the molecular ion is cleary observed in its
EI spectrum. Fragments m/z 195 and 208 are observed due to heterolytic
cleavages next to the nitrogen atoms and homolytic cleavage of the ß-bound
of the nitrogen atoms. Desmethylmirtazapine is derivatized with HFBI and the
40 60 80 100 120 140 160 180 200 220 240 260 2800
100000
200000
300000
400000
500000
600000
700000
800000
900000
1000000
1100000
m/z-->
Abundance
195
20843 167 18071 111139 152 26522156 89 127 250100 234
40 60 80 100 120 140 160 180 200 220 240 260 280 300 320 340 360 380 400 420 4400
2000
4000
6000
8000
10000
12000
14000
16000
18000
Abundance
m/z-->
195
250
56
447
111
221167
139
89 278 428
NN
N
OF
FF
F
F
F
F
NN
+
NN
N+
O
+
m/z = 195
m/z = 447 m/z = 250
.

Chapter V: Gas chromatographic-mass spectrometric method development
fragmentation pattern is also determined by cleavage of the ring structure
due to the N-atoms.
V.4.2.7. Melitracen
Melitracen is extensively fragmented in EI to the unspecific ion m/z 58.
Figure V.17. Spectrum and fragmentation pattern of melitracen
- 179 -
V.4.2.8. Reboxetine
For HFB-reboxetine the molecular ion of 509 amu was selected as well as
fragment m/z 371, due to its selectivity and relative high abundance, and
m/z 138. Fragment 91 amu was not selected as this ion represents a
tropylium ion and is not specific. Fragment m/z 371 was obtained from a
heterolytic cleavage as indicated in Figure V.18, while fragment m/z 138 was
obtained after a rearrangement of a H-atom.
40 60 80 100 120 140 160 180 200 220 240 260 2800
20000
60000
100000
140000
180000
220000
260000
300000
m/z-->
Abundance
58
2022158342 189101 165 178152 22911571 139127 274247 291
N
N+
CH2
C
m/z = 291
+
m/z = 58
m/z = 202
+
.

Chapter V: Gas chromatographic-mass spectrometric method development
Figure V.18. Spectra and fragmentation pattern of HFB-reboxetine
- 180 -
V.4.2.9. Citalopram, desmethylcitalopram and didesmethylcitalopram
Citalopram was highly fragmented to ion 58 amu, which is common for
dimethyl tertiary amines. In addition, due to C-C cleavage next to the O-
heteroatom a stable 238 amu fragment is formed. This fragment is also
noticed in the spectra of desmethyl- and didesmethylcitalopram. In addition,
for the metabolites of citalopram a loss of 18 amu, thus water, was observed
in the spectra.
50 100 150 200 250 300 350 400 450 5000
50000
100000
150000
200000
250000
300000
350000
400000
450000
500000
m/z-->
Abundance
91
371
138
56 240115 174 294197 509268 342220 315
O
N
O O
OFF
FFFF
F
H O+
O
C+
O
NO
FFFF
FFF
+
m/z = 509
m/z = 138
m/z = 371
.

Chapter V: Gas chromatographic-mass spectrometric method development
Figure V.19. Spectra and fragmentation patterns of citalopram (A), and its
heptafluorobutyrylated metabolites desmethylcitalopram (B) and dides-
methylcitalopram (C)
- 181 -
A
40 60 80 100 120 140 160 180 200 220 240 260 280 300 3200
20000
60000
100000
140000
180000
220000
260000
300000
340000
m/z-->
Abundance
58
23820871 19095 32442 109 221123 140 170157 295281260
O+
F
CN
O
F
N
CN
O
F
F
F
F
F
FF
R
CH3
C+
C
C
F
N
CN
O
F
F
F
F
R
C+
C
F
CN
m/z = 506
m/z = 492
m/z = 238 m/z = 208
R =
R = H
m/z = 488
m/z = 474
O
F
N
CN
O+
F
CN
N+
CH2
.+
m/z = 58
m/z = 324
m/z = 238

Chapter V: Gas chromatographic-mass spectrometric method development
B
- 182 -
C
V.4.2.10. Maprotiline and desmethylmaprotiline
Maprotiline was monitored by the low abundance molecular ion, the m/z 445
fragment, which is a result of a retro-Diels-Alder rearrangement and a m/z
191 fragment resulting from the rearrangement and a homolytic cleavage of
the ß-bond from the 3-ring complex. For desmethylmaprotiline the same
fragmentation pattern occurs.
50 100 150 200 250 300 350 400 4500
10000
20000
30000
40000
50000
60000
70000
80000
90000
100000
m/z-->
Abundance
238
208
18369 109 28144 474262133 16388 341 429305
50 100 150 200 250 300 350 400 450 5000
10000
20000
30000
40000
50000
60000
70000
80000
90000
100000
110000
120000
m/z-->
Abundance
238
20816973
42 109 281147 341 488429261 399

Chapter V: Gas chromatographic-mass spectrometric method development
Figure V.20. Spectra and fragmentation patterns of HFB-maprotiline (A) and
HFB-desmethylmaprotiline (B)
A
- 183 -
B
50 100 150 200 250 300 350 400 450 5000
20000
40000
60000
80000
100000
120000
140000
160000
180000
200000
m/z-->
Abundance
191
445
169 21824069
44 95 117 138 281 341 473304 407261
N
O
F
F
F
F
F
FF
. + +F F
NF
F
OF
FF
m/z = 473 m/z = 445
+CH2
m/z = 191
N
O
F
F
F
F
F
FF
N
O
F
F
F
F
F
FF
CH2
+
m/z = 459
+
m/z = 431
+
m/z = 191
.
A
50 100 150 200 250 300 350 400 450020000
60000
100000
140000
180000
220000
260000
300000
340000
380000
420000
m/z-->
bundance
191
431
95 165 2176912941 261 459290 382240 411321

Chapter V: Gas chromatographic-mass spectrometric method development
V.4.2.11. Sertraline and desmethylsertraline
Sertraline contains two chlorine atoms and therefore isotopes were
monitored, viz. m/z 501 and 503. The most specific high abundant ion was
m/z 274 and is a result of a McLafferty rearrangement. For
desmethylsertraline, the same fragmentation pattern and isotopes were
monitored (m/z 274, 487, 489)
Figure V.21. Spectra and fragmentation patterns of derivatized sertraline (A)
and desmethylsertraline (B)
N
ClCl
OF
FF
F
F
F
F
R
Cl
Cl
CH3
+
m/z = 501
+
m/z = 274R =
R = H m/z = 487
.
AAbundance
- 184 -
50 100 150 200 250 300 350 400 450 5000
10000
20000
30000
40000
50000
60000
70000
80000
90000 238
274
159
129
10169 203
501
33230442 183
474355 429399
m/z-->

Chapter V: Gas chromatographic-mass spectrometric method development
B
- 185 -
V.4.2.12. Paroxetine and paroxetine-d6
The fragmentation of paroxetine and paroxetine-d6 occurs in the same way.
Fragments m/z 388 and 394 are products of a heterolytic cleavage next to
the O atom. The m/z 138 fragment is a result of a ß-bond cleavage next to
the substituted aromatic ring.
Figure V.22. Spectra and fragmentation patterns of derivatized paroxetine
(A) and paroxetine-d6 (B)
50 100 150 200 250 300 350 400 4500
500
1500
2500
3500
4500
5500
6500
7500
8500
9500
m/z-->
Abundance
274
128
159101
69 204 239
315178 48744 341
F
N
O
O
O
RR R
R
R R
F
OF
FF
FF
F
F
NRR
R
C+
R
R
R
O+
O
O
F
OF
FF
FF
F
+.
m/z = 388
m/z = 531 m/z = 394
m/z = 138
R = H m/z = 525
R = D

Chapter V: Gas chromatographic-mass spectrometric method development
AAbundance
- 186 -
B
V.4.2.13. Trazodone and m-chlorophenylpiperazine
Ionization and fragmentation of trazodone and its heptafluorobutyrylated
metabolite occur through heterolytical and homolytical cleavage due to the
nitrogen atoms in the piperazine ring. For trazodone, the ‘ion-cluster’ around
the base peak of 205 amu is caused by several fragments as indicated in
Figure V.23. Fragment 207 amu probably results from fragment m/z 209 by
loss of 2 hydrogen atoms in the piperazine ring to ensure stability. Because
of the chlorine atom, isotope peaks can occur, however, the fragmentation
50 100 150 200 250 300 350 400 450 5000
500
1000
1500
2000
2500
3000
3500
4000
4500
5000
5500
6000
6500
m/z-->
138
109
41525
175
73 207266
388240
503341292 429
50 100 150 200 250 300 350 400 450 5000
500100015002000250030003500400045005000550060006500700075008000850090009500
m/z-->
Abundance
138
111
53145
18069
272394
244

Chapter V: Gas chromatographic-mass spectrometric method development
pattern that would result in a fragment with the chlorine atom and a m/z 205
(207) was not found.
Figure V.23. Spectra and fragmentation patterns of trazodone (A) and HFB-
m-chlorophenylpiperazine (B)
- 187 -
A
B
40 60 80 100 120 140 160 180 200 220 240 260 280 300 320 340 3600
5000
15000
25000
35000
45000
55000
65000
75000
85000
m/z-->
Abundance
205
70
176
138
23127811196
42356
154 371329250 308
40 60 80 100 120 140 160 180 200 220 240 260 280 300 320 340 360 3800
2000
6000
10000
14000
18000
22000
26000
30000
m/z-->
Abundance
56
166
139
195
392
111
75
41 91 350223 373240
NN N
NNO
Cl
NN N
C+
NO
NN N
N
C+
NO
Cl
.N
+
N Cl
+
m/z = 209
m/z = 371
m/z = 205
m/z = 356
N
N Cl
OF
F
F
F
F
FF
N Cl
. ++
m/z = 166m/z = 392

Chapter V: Gas chromatographic-mass spectrometric method development
V.4.3. Spectra of the derivatized ADs after positive ion chemical ionization
Electron ionization led to extensive fragmentation of several ADs. Therefore,
positive ion chemical ionization (PICI) was applied as this ionization
technique leads to less fragmentation and often gives molecular mass
information. For this reason, PICI could provide more selectivity.
Figure V.24. Positive ion chemical ionization reaction using methane gas [36]
Formation of major reagent gas ions when using methane gas
CH4 + e- � CH4+. + 2 e-
� CH3+ + H. + 2 e-
CH4 + CH4+. � CH5
+ + CH3.
CH4 + CH3+ � C2H5
+ + H2
Formation of sample ions
Proton transfer
CH5+ + M � [M—H]+ + CH4 m/z = M+1
Hydride abstraction
CH5+ + M � [M - H]+ + CH4 + H2 m/z = M-1
Addition
C2H5+ + M � [M— C2H5]+ m/z = M+29
C3H5+ + M � [M— C3H5]+ m/z = M+41
Methane is used as reagent gas in our chemical ionization MSD configuration.
At first, the methane gas is ionized through electron ionization due to
electrons emerging from the filaments of the ion source. This electron impact
reaction combined with ion-molecule reactions results in the creation of - 188 -

Chapter V: Gas chromatographic-mass spectrometric method development
- 189 -
several reagent gas ions (CH5+ and C2H5
+). To ensure a high reaction yield
and reproducible ionization condition, the pressure in the CI-ion source is set
at about 133 Pa. The last step of the ionization process is the reaction of the
reagent gas ions with the sample molecules, resulting in stable sample ions
(Figure V.24.).
For a reaction to occur between a reactant ion and a sample molecule, the
reaction must be exothermic. The more exothermic a reaction is, the more
fragmentation will occur. There are three types of interaction between the
methane reagent gas ions and the sample molecules in the ion source:
proton transfer, hydride abstraction, and addition.
Proton transfer occurs if the proton affinity of the analyte is greater than that
of the reagent gas. In that case, the protonated reagent gas will transfer its
proton onto the analyte, forming a positively charged analyte ion with an
additional weight of 1 amu. Because methane has a low proton affinity (127
kcal/mol) most of the analytes will have a higher proton affinity and the
proton transfer reaction will be exothermic.
During the formation of reagent ions, various reactant ions can be formed
that have high hydride-ion affinities. If the hydride-ion affinity of a reactant
ion is higher than the hydride-ion affinity of the ion formed, then the analyte
will loose a H-. This process is called hydride abstraction and usually occurs
for saturated hydrocarbons when using methane gas.
However, for many analytes, proton-transfer and hydride-abstraction
chemical ionization reactions are not thermodynamically favourable. In these
cases, reagent gas ions are often reactive enough to combine with the
analyte molecules by condensation or association. These reactions are the
addition reactions (Figure V.24.).
In this paragraph, the spectra for the different (heptafluorobutyrylated) ADs
obtained in PICI with methane gas are shown. The spectra were obtained in
scan mode, and the fragments chosen for the selected ion mode will be
discussed.

Chapter V: Gas chromatographic-mass spectrometric method development
V.4.3.1. Venlafaxine and O-desmethylvenlafaxine
Dehydrated venlafaxine (A) and O-desmethylvenlafaxine (B indicated in red)
are ionized in the same way. Protonation, hydride abstraction and addition of
C2H5+ result in ions with m/z 260 (246), 258 (244) and 288 (274),
respectively. The same reactions are also observed for heptafluoro-
butyrylated O-desmethylvenlafaxine (C indicated in green), leading to ions
with m/z 442, 440, and 470.
Figure V. 25. PICI spectrum and fragmentation of venlafaxine (A, black trace)
and dehydrated O-desmethylvenlafaxine (B, red) and heptafluorobutyrylated
ODMV (C, green)
N N+
RO
H
N
RO
N+
RO
C2H5
RO
C4F7O
m/z = 259
protonation
hydride abstraction
addition- H
+
R =
- 190 -
m/z = 245
m/z = 288
m/z = 274
m/z = 258
m/z = 244
m/z = 260 CH3R = H m/z = 246
m/z = 441R = m/z = 442
m/z = 440m/z = 470

Chapter V: Gas chromatographic-mass spectrometric method development
A
- 191 -
60 80 100 120 140 160 180 200 220 240 260 280 3000
1000
2000
3000
4000
5000
6000
7000
8000
9000
Abundance
260
58
215288152
69 121 201109 2439583 135 300229163 178 189 274
z-->m/
BAbundance
C
60 80 100 120 140 160 180 200 220 240 260 280
246
0500
1500
2500
3500
4500
5500
6500
7500
8500
9500
58
152 201183 274229107 2869569 13312183 164 21 260
m/z-->
A
50 100 150 200 250 300 350 400 4500
500
1500
2500
3500
4500
5500
6500
7500
8500
9500
m/z-->
bundance
442
58
470
179246159 19995 397 422121 317 367345228 291139

Chapter V: Gas chromatographic-mass spectrometric method development
V.4.3.2. Viloxazine
Although PICI is a soft ionization technique, viloxazine is still fragmented to
ion m/z 296 as with EI. In addition, a fragment m/z 414 is noticed which
demonstrates the loss of a fluorine atom from the derivatization moiety. In
addition to these fragmentation reactions, the protonation of the viloxazine
molecule is also observed.
Figure V. 26. PICI spectrum and fragmentation of HFB-viloxazine
OO FF F
- 192 -
V.4.3.3. Fluvoxamine
Heptafluorobutyrylated fluvoxamine is fragmentated to m/z 258 and m/z
495, respectively, due to heterolytic cleavage of the N-O bound and a C-F
bound. Due to a protonation reaction the quasi-molecular ion m/z 515 is
formed.
50 100 150 200 250 300 350 400 450 5000
500
1500
2500
3500
4500
5500
6500
7500
8500
9500
m/z-->
Abundance
434
296
462414139
111 256177 394374218 277237 3543248156 196 493158
O
N
O
OF
F
FF
FF
O
N+
O
O
H F
FF
FF
protonation
O
N
O
O
OF
F
F
FC
+F
F
O
NCH2
OF
F
F
F
FF
F
m/z = 434m/z = 433
+
m/z = 296
m/z = 414

Chapter V: Gas chromatographic-mass spectrometric method development
Figure V. 27. PICI spectrum and fragmentation of HFB-fluvoxamine
+
- 193 -
V.4.3.4. Fluoxetine, fluoxetine-d6 and desmethylfluoxetine
Even in PICI, the molecular ion of heptafluorobutyrylated fluoxetine,
fluoxetine-d6 and desmethylfluoxetine is not observed. The addition of C2H5+
is thermodynamically favourable and leads to m/z 534 and 540 for fluoxetine
and fluoxetine-d6, respectively. Other reactions are fragmentation reactions
as in EI. These reactions are heterolytical cleavages.
50 100 150 200 250 300 350 400 450 5000
1000
2000
3000
4000
5000
6000
7000
8000
9000
m/z-->
Abundance
258
495
226
71286172
54351620097 329127 463151 442404358 383307
N+
FF
F
OMe
ON
FF
F
OMe
N
O
FF
F
FF
F F
ON
FF
F
OMe
N
O
FF
F
FF
F F
+ H
protonation
ON
FF
F
OMe
N
O
C+
F
F
FF
F F
m/z = 514 m/z = 515
m/z = 258
m/z = 495

Chapter V: Gas chromatographic-mass spectrometric method development
Figure V. 28. PICI spectra and fragmentation patterns of heptafluoro-
butyrylated fluoxetine (A), fluoxetine-d6 (B) and desmethylfluoxetine (C)
F
FF O
N
OF
F
F
F
F
FF
R
R
R
R
R
R
F
FO
N C+
OF
F
F
F
F
F
F R
R
R
R R
R
F
FO
N+
OF
F
F
F
F
F
F
C2H5
R
R
R
R R
R
C+
N
OF
F
F
F
F
FF
R
R
RR
R
R
addition
m/z = 534R = H m/z = 505
- 194 -
A
50 100 150 200 250 300 350 400 450 5000
1000
2000
3000
4000
5000
6000
7000
8000
9000
m/z-->
Abundance
344
117
143240 534486382306191 268 42857 16491 216 406 449 508
m/z = 492
m/z = 344
R = D m/z = 511
m/z = 350
m/z = 540
m/z = 486

Chapter V: Gas chromatographic-mass spectrometric method development
BAbundance
- 195 -
C
50 100 150 200 250 300 350 400 450 500 550
350
9000
8000
7000
6000
5000
4000
3000
2000
1231000
540492163 312240191 29157 377 42997 454270215 4030
m/z-->
50 100 150 200 250 300 350 400 450 500
9500
Abundance
0500
1500
2500
3500
4500
5500
6500
7500
8500
m/z-->
330
117
143
163
57 358 391226191 252 29291 419272 472 520443
F
FF O
N
OF
F
F
F
F
FF
C+
N
OF
F
F
F
F
FF
H
F
FF O
N
OC
+
HH
m/z = 491m/z = 330
+
m/z = 358m/z = 117

Chapter V: Gas chromatographic-mass spectrometric method development
V.4.3.5. Mianserin, mianserin-d3 and desmethylmianserin
Figure V. 29. PICI spectra and fragmentation patterns of mianserin (A),
mianserin-d3 (B) and HFB-desmethylmianserin (C)
N
NCR3
N
N+
CR3H
N
N+
CR3C2H5N
N+
CR3C3H5
R = H m/z 264
protonation
R = H m/z 265additionR = D m/z 267 R = D m/z 268
addition
R = H m/z 293
R = D m/z 296
R = H m/z 305
R = D m/z 308
A
- 196 -
60 80 100 120 140 160 180 200 220 240 260 280 300 320 3400
1000
2000
3000
4000
5000
6000
7000
8000
9000
m/z-->
Abundance
265
29357
71 97 193111 208 222125 165151 179 279236 30625184 319138 333

Chapter V: Gas chromatographic-mass spectrometric method development
B
- 197 -
C
50 100 150 200 250 300 350 400 4500
500
1500
2500
3500
4500
5500
6500
7500
8500
9500
m/z-->
Abundance
268
296
20875 331236120 368146 180 48945154 407
50 100 150 200 250 300 350 400 450 5000
500
1500
2500
3500
4500
5500
6500
7500
8500
9500
ndance
m/z-->
Abu
447
475
427249 387
407367208 311277141 33118216169 50391 113
N
N
O
F
FF
F
F
F
F
N
N
O
F
FF
F
F
F
F
N
N
O
F
FF
F
F
F
F
C2H5
N
N
O
F
F
F
F
C+
F
F
m/z = 446
protonation
+H
m/z = 447addition
++
+
m/z = 475m/z = 427

Chapter V: Gas chromatographic-mass spectrometric method development
For analytes such as mianserin, PICI leads to a proton transfer and addition
reaction, and not to severe fragmentation. The reagent gas ions C2H5+ and
C3H5+ are added to the mianserin and deuterated mianserin molecule. For
heptafluorobutyrylated desmethylmianserin protonation and addition also
occurs. In addition, fragmentation with a loss of a fluorine atom is also
observed resulting in an ion with m/z 427.
V.4.3.6. Mirtazapine and desmethylmirtazapine
For mirtazapine and desmethylmirtazapine the same reactions are noticed as
for mianserin and desmethylmianserin due to their structural analogy.
Figure V. 30. PICI spectra and fragmentation patterns of mirtazapine (A), and
HFB-desmethylmirtazapine (B)
+
- 198 -
A
60 80 100 120 140 160 180 200 220 240 260 280 300 320 3400
1000
2000
3000
4000
5000
6000
7000
8000
9000
m/z-->
Abundance
266
294195
208 22372 251 30757 180 237100 167 28085 139123 153 320 334
NN
N
NN
N
protonation
+ Haddition
m/z = 265 m/z = 266
+
NN
N
hydride abstraction
+
C2H5
NN
N
+
m/z = 294- H
m/z = 264

Chapter V: Gas chromatographic-mass spectrometric method development
B
NN
N
O
F
FF
F
F
F
F
NN
N
O
F
FF
F
F
F
F
C2H5N
N
N
O
F
FF
F
F
F
FNN
N
O
C+
F
F
F
F
F
F
protonation
addition
+
+
+
m/z = 447
+ H
m/z = 448
m/z = 476
m/z = 428Abundance
- 199 -
V.4.3.7. Melitracen
Melitracen undergoes protonation, addition and hydride abstraction resulting
in ions with m/z 292, 320 and 290, respectively.
50 100 150 200 250 300 350 400 450 5000
500
1500
2500
3500
4500
5500
6500
7500
8500
9500
m/z-->
448
476
428250
388195 408221170 278 36857 14111185 312 332 504

Chapter V: Gas chromatographic-mass spectrometric method development
Figure V. 31. PICI spectrum and fragmentation of melitracen
- 200 -
V.4.3.8. Reboxetine
Reboxetine is fragmentated in PICI to ion m/z 372 and 490 due to heterolytic
cleavage of the bound next to a heteroatom. For ion m/z 372 the heterolytic
cleavage is followed by a loss of water. In addition to these fragments, the
protonated quasi-molecular ion 510 amu is also noticed with acceptable
abundance in the mass spectrum.
60 80 100 120 140 160 180 200 220 240 260 280 300 320 340 3600
1000
2000
3000
4000
5000
6000
7000
8000
9000
m/z-->
Abundance
292
58
320
247
275 33323321984 203 306157119105 349262143
N HN+
protonation
N+ C2H5
m/z = 292additionm/z = 291
hydride abstraction
+
Nm/z = 320
- H
m/z = 290

Chapter V: Gas chromatographic-mass spectrometric method development
Figure V. 32. PICI spectrum and fragmentation of HFB-reboxetine
+
- 201 -
V.4.3.9. Citalopram, desmethylcitalopram and didesmethylcitalopram
Ionization in positive ion chemical ionization mode of citalopram occurs by
protonation, addition of C2H5+ reagent gas ion and abstraction of a fluorine
atom. Desmethylcitalopram and didesmethylcitalopram ionize through
protonation and addition. Moreover, loss of water (-18 amu) and protonation
result in fragment ions with m/z 489 and 475.
50 100 150 200 250 300 350 400 450 5000
1000
2000
3000
4000
5000
6000
7000
8000
9000
m/z-->
Abundance
372
253 510
53813991
294167400334227 470202117 44870 426
O
N
O O
OFF
FFFF
F
O
NO
FFFF
FFF
O
N
OO
OFF
FFFF
F
O
N
O O
O
C+
FFFF
FF
protonation
+ H
m/z = 510m/z = 509
+
+ H
m/z = 490 m/z = 372

Chapter V: Gas chromatographic-mass spectrometric method development
Figure V. 33. PICI spectra and fragmentations of citalopram (A), HFB-
desmethylcitalopram (B) and HFB-didesmethylcitalopram (C)
A
+
- 202 -
60 80 100 120 140 160 180 200 220 240 260 280 300 320 340 360 380 400 4200500
1500
2500
3500
4500
5500
6500
7500
8500
9500
m/z-->
Abundance
325
353
30522958 262 28086 184165 210118 381 399 429144 245
O
F
N
CN
O
F
N
CN
protonation
+ H
addition m/z = 325
O
F
N
CN
C2H5
C+
ON
m/z = 324
+
CN
+
m/z = 353m/z = 305

Chapter V: Gas chromatographic-mass spectrometric method development
O
F
N
CN
O
F
F
F
F
F
FF
R
CH3
O
F
N
CN
O
F
F
F
F
F
FF
R
C2H5
O
F
N
CN
O
F
F
F
F
F
FF
R
C+ C
C
F
N
CN
O
F
F
F
F
F
FF
R
m/z = 506
protonation+ H
m/z = 507R = additionm/z = 493m/z = 492R = H
+
+
m/z = 535m/z = 489 m/z = 521m/z = 475
BAbundance
- 203 -
50 100 150 200 250 300 350 400 450 500 550 600 6500
100000
200000
300000
400000
500000
600000
700000
800000
900000
1000000
1100000
1200000
1300000
1400000262 489
535
290 411109
22857 162135 61583 575 650321 449190 351 383
m/z-->

Chapter V: Gas chromatographic-mass spectrometric method development
CAbundance
- 204 -
V.4.3.10. Maprotiline and desmethylmaprotiline
Ionization of heptafluorobutyrylated maprotiline and its metabolite are a
result of protonation, and losses of fluorine atoms as indicated in Figure V.34.
For HFB-desmethylmaprotiline, a fragment of m/z 431 is observed due to a
retro-Diels-Alder rearrangement.
Figure V. 34. PICI spectra and fragmentations of heptaflurobutyrylated
maprotiline (A) and desmethylmaprotiline (B)
A
50 100 150 200 250 300 350 400 450 500
475
0
1000
2000
3000
4000
5000
6000
7000
8000
9000
521262
57 12597 151 179 497 549238214 437397290 363323
m/z-->
F F F FN
F
OF
FF
F N+
OF
F
FF
F
N C+
O
F
F
F
F
F
F
Hprotonation
m/z = 474m/z = 473
+F
N
OF
F
m/z = 396
m/z = 454

Chapter V: Gas chromatographic-mass spectrometric method development
Abundance
- 205 -
B
50 100 150 200 250 300 350 400 450 500
4749500
0500
1500
2500
3500
4500
5500
6500
7500
8500
396
502445247
275169 19157 424223 35812597 304 329147 528
m/z-->
50 100 150 200 250 300 350 400 450 500
9500
ndance
0500
1500
2500
3500
4500
5500
6500
7500
8500
m/z-->
Abu
460
382
48843157 247111 344191139 16985 410221 267 290 363313 507
N
O
F
F
F
F
F
FF
H
N
O
F
F
F
F
F
FF
H
N+
O
F
F
F
F
F
FF
H
H
N
O
F
FF
H
m/z = 459
protonation
m/z = 431
m/z = 460
+ H
+
m/z = 382
+
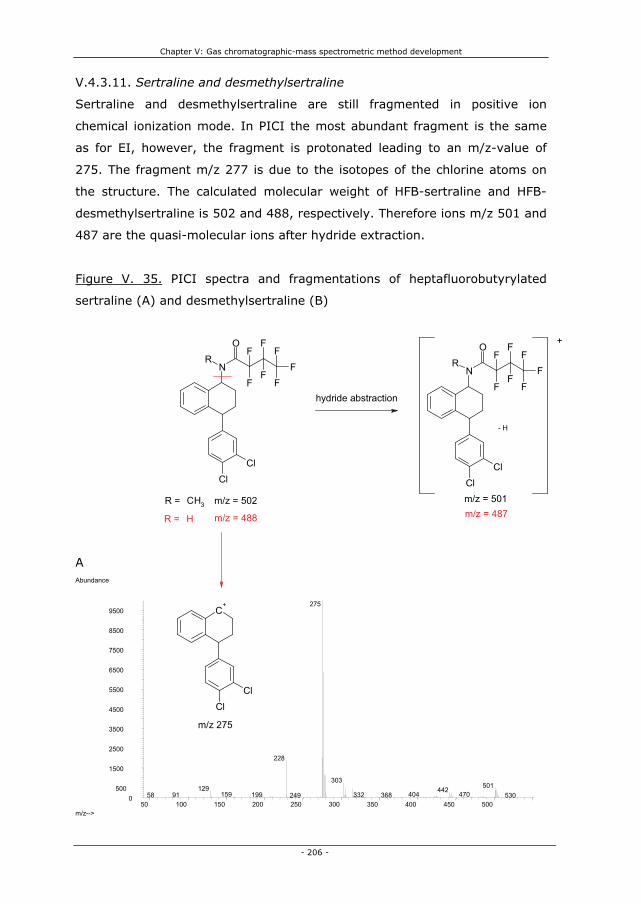
Chapter V: Gas chromatographic-mass spectrometric method development
V.4.3.11. Sertraline and desmethylsertraline
Sertraline and desmethylsertraline are still fragmented in positive ion
chemical ionization mode. In PICI the most abundant fragment is the same
as for EI, however, the fragment is protonated leading to an m/z-value of
275. The fragment m/z 277 is due to the isotopes of the chlorine atoms on
the structure. The calculated molecular weight of HFB-sertraline and HFB-
desmethylsertraline is 502 and 488, respectively. Therefore ions m/z 501 and
487 are the quasi-molecular ions after hydride extraction.
Figure V. 35. PICI spectra and fragmentations of heptafluorobutyrylated
sertraline (A) and desmethylsertraline (B)
+
- 206 -
A
50 100 150 200 250 300 350 400 450 5000
500
1500
2500
3500
4500
5500
6500
7500
8500
9500
m/z-->
Abundance
275
228
303501129 442
470159 404199 3329158 368249 530
N
ClCl
OF
FF
F
F
F
F
R
C+
ClCl
CH3
H
N
ClCl
O FFF
R
FF
FF
hydride abstraction
- H
m/z = 501m/z = 502R = m/z = 487m/z = 488R =
m/z 275

Chapter V: Gas chromatographic-mass spectrometric method development
B
- 207 -
V.4.3.12. Paroxetine and paroxetine-d6
Protonation and addition of paroxetine during positive ion chemical ionization
leads to ion m/z 526 and 554. Loss of 19 amu due to loss of a fluorine atom
results in ion m/z 506. These reactions also occur for paroxetine-d6, resulting
in ions with 6 amu more than nondeuterated paroxetine.
Figure V. 36. PICI spectra and fragmentation patterns of heptafluoro-
butyrylated paroxetine (A) and paroxetine-d6 (B)
A
50 100 150 200 250 300 350 400 450 5000
500
1500
2500
3500
4500
5500
6500
7500
8500
9500
m/z-->
Abundance
275
241214 303
129487159 351 4539157 187 432 508 538329 394
50 100 150 200 250 300 350 400 450 5000
1000
2000
3000
4000
5000
6000
7000
8000
9000
m/z-->
Abundance
526
372
139 486400278188 330109 218 448167 308 35123957 42685 548

Chapter V: Gas chromatographic-mass spectrometric method development
F
N
O
O
O
RR R
R
R R
F
N
O
O
O
RR R
R
R R
O
FF
F
FF
F F
O
FF
F
F
F
F
F
F
N
O
O
O
RR R
R
R R
C2H5
O
FF
F
F
F
F
F
C+
N
O
O
O
RR R
R
R R
O
FF
F
F
F
F
F
m/z = 531R = D
+
protonation
+ Haddition
m/z = 532
m/z = 526R = H m/z = 525
+
+
m/z = 560
- 208 -
B
50 100 150 200 250 300 350 400 450 500 550 6000
1000
2000
3000
4000
5000
6000
7000
8000
9000
m/z-->
Abundance
m/z = 554
m/z = 506
m/z = 512
532
560139 39411157
195167 27585 223 335 492309249 359 422 453 626594

Chapter V: Gas chromatographic-mass spectrometric method development
V.4.3.13. Trazodone and m-chlorophenylpiperazine
Ionization of trazodone occurs through protonation, addition and
fragmentation. Fragmentation occurs at the C-Cl bound, resulting in a loss of
a chlorine atom (Figure V.37). Heptafluorobutyrylated m-chlorophenyl-
piperazine is protonated and fragmented by loss of fluorine atoms.
Figure V. 37. PICI spectra and fragmentations of trazodone (A) and HFB-m-
cpp (B)
A
NN N
NNO
Cl
NN N
NNO
Cl
NN N
NNO
Cl
C2H5C+
NN N
NNO
m/z = 371+ H
+
protonationm/z = 372
addition
+
+
m/z = 400m/z = 336
- 209 -
50 100 150 200 250 300 350 400 450 500 5500
1000
2000
3000
4000
5000
6000
7000
8000
9000
m/z-->
Abundance
372
336
400
27820523757 95 176140 308 471 513 543429118
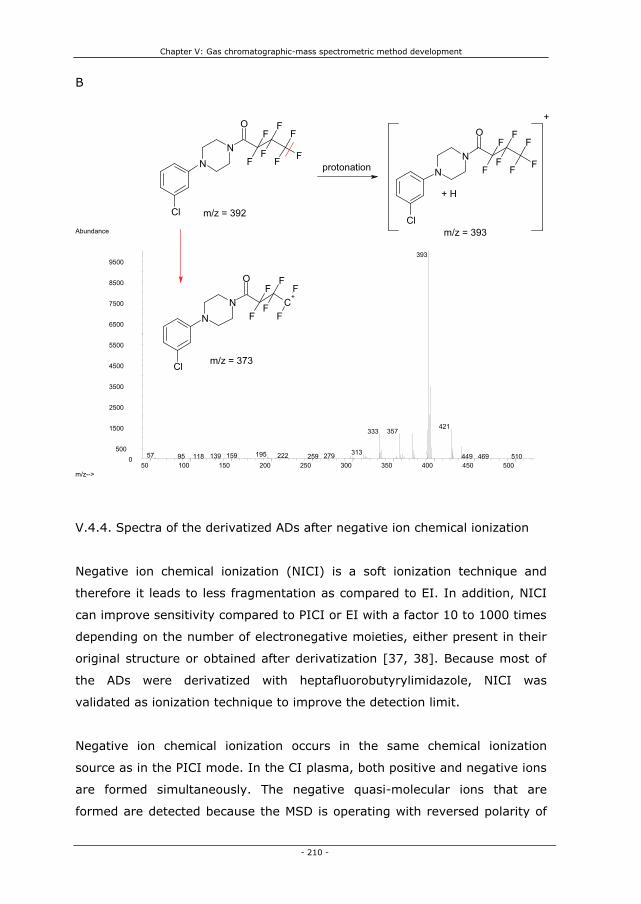
Chapter V: Gas chromatographic-mass spectrometric method development
B
- 210 -
V.4.4. Spectra of the derivatized ADs after negative ion chemical ionization
Negative ion chemical ionization (NICI) is a soft ionization technique and
therefore it leads to less fragmentation as compared to EI. In addition, NICI
can improve sensitivity compared to PICI or EI with a factor 10 to 1000 times
depending on the number of electronegative moieties, either present in their
original structure or obtained after derivatization [37, 38]. Because most of
the ADs were derivatized with heptafluorobutyrylimidazole, NICI was
validated as ionization technique to improve the detection limit.
Negative ion chemical ionization occurs in the same chemical ionization
source as in the PICI mode. In the CI plasma, both positive and negative ions
are formed simultaneously. The negative quasi-molecular ions that are
formed are detected because the MSD is operating with reversed polarity of
50 100 150 200 250 300 350 400 450 5000
500
1500
2500
3500
4500
5500
6500
7500
8500
9500
m/z-->
Abundance
393
421357333
31319557 222159 27913995 118 259 449 469 510
NN
Cl
OF
F F
F
F
F
FN
N
Cl
OF
F F
F
F
F
F
+
NN
Cl
O
C+F
F
F
F
F
F
protonation
+ H
m/z = 392
m/z = 393
m/z = 373

Chapter V: Gas chromatographic-mass spectrometric method development
all the analyzer voltages, thus extracting negative ions from the source and
not the positive ions as in PICI or EI.
Figure V.38. Negative ion chemical ionization reaction using methane gas
Formation of reagent gas ions when using methane gas
CH4 + e-(230 eV) � CH4
+. + 2 e-(thermal)
Formation of sample ions
Electron capture:
MX + e-(thermal 0-2 eV) � MX.-
Dissociative electron capture:
MX + e-(thermal 0-15 eV) � M. + X-
Ion pair formation
MX + e-(thermal) � M+ + X- + e-
The reagent gas, methane in our case, is bombarded with high energy
electrons from a filament. As a result, lower energy electrons called thermal
electrons are produced and these electrons are then captured by the sample
analytes. There are several chemical mechanisms for negative ion chemical
ionization. The three most common mechanisms are electron capture,
dissociative electron capture, and ion pair formation. The electron capture
reaction is the primary mechanism in negative ion chemical ionization. When
the sample molecule fragments or dissociates afer the electron capture
reaction, the reaction is called dissociative electron capture. The dissociative
electron capture reaction leads to a lower quasi-molecular ion and sensitivity
as compared to the electron capture reaction. Ion pair formation seems
similar to dissociative electron capture, however, the electron is not captured
by the created fragments. During ion pair formation, the molecule fragments
in such way that the electrons are distributed unevenly and positive as well
as negative ions are generated. Another unwanted reaction can occur during
NICI: ion-molecule reactions. These reactions compete with the electron - 211 -

Chapter V: Gas chromatographic-mass spectrometric method development
capture reactions, resulting in decreased sensitivity. Ion-molecule reactions
are a result of traces of water, oxygen or other contaminants that are ionized
by electrons from the filament and react with the sample molecules through
addition.
In the following paragraph, the spectra for the different (heptafluoro-
butyrylated) ADs obtained in NICI with methane gas are discussed. The
spectra were obtained in scan mode, and the fragments chosen for the
selected ion mode will be discussed.
V.4.4.1. Venlafaxine and O-desmethylvenlafaxine
Dehydrated venlafaxine and O-demethylvenlafaxine are not detected in NICI
mode as they do not contain the highly electronegative moiety containing 7
fluorine atoms after the heptafluorobutyrylimidazole derivatization
(IV.4.3.1.). ODMV can be derivatized, however, this derivatization reaction is
irreproducible as discussed in chapter IV. The spectrum of derivatized ODMV
in NICI mode shows extensive fragmentation to the heptafluorobutyryl-
reagent fragment (Figure V.39.).
Figure V.39. NICI spectrum and fragmentation of HFB-ODMV
N
O
OF
FF
F
F
F
F
N
RO
CO
F
FF
F
F
F
F
- H
m/z = 441
m/z = 440
-
m/z = 197
-
- 212 -

Chapter V: Gas chromatographic-mass spectrometric method development
- 213 -
V.4.4.2. Viloxazine
Heptafluorobutyrylated viloxazine shows a very low abundant molecular ion
in NICI. Several losses of 20 amu are observed resulting in fragments with
m/z 413, 393 and 373. These losses indicate a loss of hydrogen and a
fluorine atom.
Figure V. 40. NICI spectrum and fragmentation of HFB-viloxazine
O
N
O
O
OF
F
F
F
FF
F
O
N
O
O
OF
F
F
F
F
F
O
N
O
O
OF
F
F
F
O
N
O
OF
OF
F
F
F
m/z = 433
-
-HF
-HF
-HF- -
-
m/z = 413 m/z =393
m/z = 373
-H -H
-H
80 0 120 140 160 180 200 0 2 260 0 2 340 0 400 42010 22 40 28 300 3 0 360 38 4400
400000
800000
1200000
1600000
2000000
2400000
2800000
3200000
m/z-->
Abundance
197
178
160 403112 12893 422213 375 440244 274 290 309 326 358

Chapter V: Gas chromatographic-mass spectrometric method development
- 214 -
V.4.4.3. Fluvoxamine
Figure V. 41. NICI spectrum and fragmentation of HFB-fluvoxamine
60 80 100 120 140 160 180 200 220 240 260 280 300 320 340 360 380 400 420 4400
500
1500
2500
3500
4500
5500
6500
7500
8500
9500
m/z-->
Abundance
413
137
393
373236 296
18859 160 217 257 355275 32993 433112
F
ON
FF
F
OMe
N
O
FF
F
FF
F
ON
FF
F
OMe
N
O
F
F
FF
F F
F
O
N
O
FF
F
FF
F
F
O
N
O
F
F
FF
F
m/z = 514
m/z = 494
- H
-
-HF
-
m/z = 256
-HF
-
m/z = 237

Chapter V: Gas chromatographic-mass spectrometric method development
Abundance
- 215 -
No electron capture reaction is observed for fluvoxamine in NICI mode.
Dissociative electron capture reactions result in ions with m/z 494 (loss of
HF), 256 and 237. The last two ions demonstrate fragmentation even in the
‘soft’ NICI ionization technique.
V.4.4.4. Fluoxetine, fluoxetine-d6 and desmethylfluoxetine
The molecular ion of fluoxetine, fluoxetine-d6 and desmethylfluoxetine is
observed and is a result of the electron capture reaction during negative
ionization. For fluoxetine and fluoxetine-d6 two times a loss of HF is observed
in addition to the molecular ion. For desmethylfluoxetine, again, a loss of HF
is observed together with a fragment m/z 329.
120 140 160 180 200 220 240 260 280 300 320 340 360 380 400 420 440 460 480
2569500
0500
1500
2500
3500
4500
5500
6500
7500
8500
225
112 169 494145 199
m/z-->

Chapter V: Gas chromatographic-mass spectrometric method development
Figure V. 42. NICI spectra and fragmentations of heptafluorobutyrylated
fluoxetine (A), fluoxetine-d6 (B) and desmethylfluoxetine (C)
F
FF O
NCH3
OF
F
F
F
F
FF
R
R
RR
R
R
F
FF O
NR2
OF
F
F
F
F
F
R
R
RR
R
R
F
FF O
NR2
OF
F
F
FF
R
R
RR
R
R
-
m/z = 505R = H
m/z = 511R = D
-HF--
-HF-H -H
m/z = 465m/z = 485m/z = 471m/z = 491
A
- 216 -
50 100 150 200 250 300 350 400 450 5000
500
1500
2500
3500
4500
5500
6500
7500
8500
9500
m/z-->
Abundance
485
161
465181 445 505140 360264 285 325226 305 42540593 20759

Chapter V: Gas chromatographic-mass spectrometric method development
B
- 217 -
C
50 100 150 200 250 300 350 400 450 5000
500
1500
2500
3500
4500
5500
6500
7500
8500
9500
m/z-->
Abundance
491
161
471511451181 366291140 331226 269 311 430205 4109359
140 160 180 200 220 240 260 280 300 320 340 360 380 400 420 440 460 4800
500
1500
2500
3500
4500
5500
6500
7500
8500
9500
ndance
m/z-->
Abu
471
161
329
491
271225
433 453178 395 415253 311205 286
F
FF O
N
OF
F
F
F
F
FF N
OF
F
F
F
F
FF
F
FF O
N
OF
F
F
F
F
F
m/z = 491m/z = 329
-HF
-H
-
m/z = 471
-

Chapter V: Gas chromatographic-mass spectrometric method development
V.4.4.5. Mianserin, mianserin-d3 and desmethylmianserin
Mianserin and mianserin-d3 are not derivatized and are not detected in NICI
mode. Desmethylmianserin demonstrates losses of 20 amu, thus loss of HF.
Figure V. 43. NICI spectra and fragmentation of HFB-desmethylmianserin
N
N
O
F
FF
F
F
F
F
N
N
OF
F
F
F
F
N
N
O
F
F
F
F
m/z = 446
-
- 2 HF
-
- 2 H
- HF
-
- H
m/z = 406 m/z = 386
- 218 -
60 80 100 120 140 160 180 200 220 240 260 280 300 320 340 360 380 400 420 4400
500
1500
2500
3500
4500
5500
6500
7500
8500
9500
m/z-->
Abundance
386
406
179426160
140 36659 44628622593 337122 252

Chapter V: Gas chromatographic-mass spectrometric method development
V.4.4.6. Mirtazapine and desmethylmirtazapine
Mirtazapine is not derivatized and is thus not detected in NICI mode.
Desmethylmirtazazpine shows the same ionization pattern as desmethyl-
mianserin as it is a structural analogue.
Figure V. 44. NICI spectrum and fragmentation of HFB-desmethylmirtazapine
NN
N
O
F
FF
F
F
F
F
NN
N
OF
F
F
F
F
NN
N
O
F
F
F
F
m/z = 447
- 2 HF
-
- 2 H
- HF
-
- H
m/z = 407 m/z = 387Abundance
- 219 -
60 80 100 120 140 160 180 200 220 240 260 280 300 320 340 360 380 400 420 440 460 4800
500
1500
2500
3500
4500
5500
6500
7500
8500
9500
m/z-->
407
387
179 427
160447
14036759 33893 225 288 487

Chapter V: Gas chromatographic-mass spectrometric method development
V.4.4.7. Melitracen
Melitracen is a tertiary amine that is not derivatized and thus not detected in
NICI mode.
V.4.4.8. Reboxetine
The molecular ion of heptafluorobutyrylated reboxetine is not detected in the
spectrum of reboxetine. Losses of 20 amu due to loss of HF can be observed
in the spectrum and ion m/z 489 is chosen as this fragment results in the
highest m/z ratio and is the most abundant ion in the spectrum. Reboxetine
is still fragmented in NICI mode, and therefore two fragments with m/z 296
and 312 are chosen because of their structural information.
Figure V. 45. NICI spectrum and fragmentation of HFB-reboxetine
O
N
O O
OFF
FFFF
F
O
N
O O
OFF
FFFF
O
N
O O
O
NO
FFFF
FFF
C
m/z = 509
- HF-
- H
m/z = 489
m/z = 312
m/z = 296
-
- 220 -

Chapter V: Gas chromatographic-mass spectrometric method development
Abundance
- 221 -
V.4.4.9. Citalopram, desmethylcitalopram and didesmethylcitalopram
Although citalopram contains one fluorine atom in its underivatized structure,
its electron affinity is too low for the molecule to be detected in NICI mode.
The derivatized metabolites of citalopram, however, can be detected.
Figure V. 46. NICI spectra and fragmentations of HFB-desmethyl- (A) and
didesmethylcitalopram (B)
50 100 150 200 250 300 350 400 450
4892969500
0500
1500
2500
3500
4500
5500
6500
7500
8500
137
471449178
59 160 409387
225 429353333243 278 315197
m/z-->
-
O
F
CNR FFN
FF
OF
FF
CH3m/z = 506R =
R = H m/z = 492
- HF
--
O
F
N
CNF
F
F
F
F
FO
RO
F
CNR FN
F
OF
FF- HF
m/z = 466m/z = 486m/z = 452m/z = 472

Chapter V: Gas chromatographic-mass spectrometric method development
AAbundance
- 222 -
B
For didesmethylcitalopram a clear negative molecular ion (482 amu) is
detected as a result of electron capture. The molecular ion of
desmethylcitalopram (506 amu) is less abundant, and this metabolite is more
stable after a loss of HF. For the two metabolites of citalopram the
dissociative electron capture reaction during negative ion chemical ionization
leads to most of the fragment ions in the spectra.
80 100 120 140 160 180 200 220 240 260 280 300 320 340 360 380 400 420 440 460 480 500
4869500
0500
1500
2500
3500
4500
5500
6500
7500
8500
466
426446361168
208 506408140 277 322188 237 38993 341304122
m/z-->
Abundance
120 140 160 180 200 220 240 260 280 300 320 340 360 380 400 420 440 460 480
4929500
0500
1500
2500
3500
4500
5500
6500
7500
8500
472
454416 434212 396261160 178 194 374292140 237112
m/z-->

Chapter V: Gas chromatographic-mass spectrometric method development
V.4.4.10. Maprotiline and desmethylmaprotiline
Dissociative electron capture is the dominant reaction type occurring during
negative ion chemical ionization of maprotiline and desmethylmaprotiline as
indicated in Figure V.47.
Figure V. 47. NICI spectra and fragmentations of HFB-maprotiline (A) and
HFB-desmethylmaprotiline (B)
A
N
O
F
F
F
F
F
FF
N
O
F
F
F
F
F
F
N
O
F
F
F
F
F
m/z = 473
m/z = 453
-
-HF
-H- HF
-H
-
m/z = 433
-
Abundance
- 223 -
60 80 100 120 140 160 180 200 220 240 260 280 300 320 340 360 380 400 420 440 460
4539500
0500
1500
2500
3500
4500
5500
6500
7500
8500
413 433
59 140 393 473168 28784 205
m/z-->

Chapter V: Gas chromatographic-mass spectrometric method development
B
- 224 -
V.4.4.11. Sertraline and desmethylsertraline
Heptafluorobutyrylated sertraline demonstrates losses of HF and leads to ions
with m/z 501, 481, 461, 441 as the highest abundant ions. Negative
ionization of the HFB-derivative of the desmethylsertraline also results in a
loss of HF (m/z 467). In addition a loss of one chlorine atom in combination
with a fluorine atom can be suspected (Figure V.48).
180 200 220 240 260 280 300 320 340 360 380 400 420 440 4600
1000
2000
3000
4000
5000
6000
7000
8000
9000
m/z-->
Abundance
439
401
178 383 459363289
N
O
F
F
F
F
F
FF
H
N
O
F
F
F
F
F
F
HN
O
F
F
F
F
H
m/z = 459
m/z = 439
-
- HF
-
-H- 2 F
-
m/z = 401

Chapter V: Gas chromatographic-mass spectrometric method development
Figure V. 48. NICI spectra and fragmentations of heptafluororbutyrylated
sertraline (A) and desmethylsertraline (B)
A
- 225 -
50 100 150 200 250 300 350 400 450 5000
500
1500
2500
3500
4500
5500
6500
7500
8500
9500
m/z-->
Abu
N
Cl
Cl
OF
FF
F
F
F
F
CH3
N
Cl
Cl
OF
F
F
F
F
F
CH3 N
Cl
Cl
O F
F
F
F
CH3
m/z = 501
-
- HF
-
- H
m/z = 481
- 2 HF
-
m/z = 441ndance
441
421
461 481
226160401 50136618859 301 330122 259

Chapter V: Gas chromatographic-mass spectrometric method development
B
- 226 -
V.4.4.12. Paroxetine and paroxetine-d6
Dissociative electron capture is the dominant reaction type occurring during
negative ion chemical ionization of paroxetine and paroxetine-d6 as indicated
in Figure V.49.
160 180 200 220 240 260 280 300 320 340 360 380 400 420 440 460 4800500
1500
2500
3500
4500
5500
6500
7500
8500
9500
m/z-->
Abundance
487
433
467
395 451192 212 413173 377288 359155
N
Cl
Cl
OF
FF
F
F
F
F
HN
Cl
OF
F
F
F
F
F
H
N
Cl
Cl
OF
F
F
F
F
F
H
m/z = 487
-
- HF
-
- H
m/z = 467
- F
- Cl
-
m/z = 433

Chapter V: Gas chromatographic-mass spectrometric method development
Figure V. 49. NICI spectra and fragmentation patterns of HFB-paroxetine (A)
and HFB-paroxetine-d6 (B)
F
N
O
O
O
RR R
R
R R
O
FF
F
F
F
F
F
N
O
O
O
RR R
R
R R
F
O
F
F
F
F
F
F
F
N
O
O
O
RR R
R
R R
OF
F
F F
F
N
O
O
O
RR R
R
R R
OF
FF
F F
m/z = 531R = D
-
- H
R = H m/z = 526 m/z = 570m/z = 565
m/z = 505
- HF- RF
- -
- HF
- H - R
m/z = 490m/z = 510m/z = 485
AAbundance
- 227 -
50 100 150 200 250 300 350 400 450 500
4859500
0500
1500
2500
3500
4500
5500
6500
7500
8500
465157
137
296 505
327
258 44534917959 93 218
372 425116 525238
m/z-->

Chapter V: Gas chromatographic-mass spectrometric method development
BAbundance
- 228 -
V.4.4.13. Trazodone and m-chlorophenylpiperazine
Trazodone is not detected in NICI mode as this tertiary amine can not be
derivatized using heptafluorobutyrylimidazole. The metabolite of trazodone,
m-chlorophenylpiperazine, can be heptafluorobutyrylated and demonstrates
losses of 20 amu due to loss of HF fragments.
Figure V. 50. NICI spectrum and fragmentation of of HFB-m-cpp
50 100 150 200 250 300 350 400 450 500 550
490
9000
8000
7000
6000
5000
4000
3000 137 296
2000 331450
1000 161 258
60 93354
192 5705420512
420394220
m/z-->
O -
NN
Cl
F OF
F FF
F
F
NN
Cl
OF
F
F
F
F
F NN
Cl
O
F
F
F
F
F
NN
Cl
F
F
F
F
- Hm/z = 392
m/z = 332
- HF- HF
--
- HF
- H- H
m/z = 352m/z = 372

Chapter V: Gas chromatographic-mass spectrometric method development
- 229 -
V.4.5. Conclusion: mass spectrometric detection
The enormous benefit of a mass analyzer is the identification of compounds
not only on basis of their retention time, but in combination with the spectra
of the compounds. Fragment masses can be selected which allow the
detection and determination of the corresponding compounds undisturbed by
the presence of other species within the mixture to be analyzed, even without
complete separation.
The mass analyzer can be used in scan or in SIM (selected ion monitoring)
mode. In scan mode a whole range of mass to charge ratios are detected,
while in SIM only specific m/z ratios are monitored. Because low
concentrations (ng/ml range) of ADs had to be monitored, SIM should be
used as this method results in high sensitivity as compared to scan mode.
When working in SIM mode, the relative ion abundance ratios of three ions
can be used to identify a compound. The selection of the monitored ions
depends on their abundance and their selectivity. In general, ions of higher
abundance are selected due to their greater reproducibility and lower limit of
detection. The selected ions must be diagnostic of the structure of the
compound to increase method selectivity. Structurally significant ions should
be selected over ions that have greater abundance but are not diagnostic. If
sufficiently abundant, the molecular ion should be selected as this ion gives a
60 80 100 120 140 160 180 200 220 240 260 280 300 320 340 3600
1000
2000
3000
4000
5000
6000
7000
8000
9000
m/z-->
Abundance
332
352
372
17916014059 314220 29893 283201122 240

Chapter V: Gas chromatographic-mass spectrometric method development
lot of information concerning the detected compound. Sometimes ions from
the derivatization moiety are monitored, but only one of the three selected
ions should be originating from this group. The spectra of each AD were
discussed in the previous paragraph (V.4.) and the monitored ions for each
compound are summarized in Table V. 1.
Table V.1. Selected ions for each antidepressant in electron and positive or
negative ion chemical ionization
( ), Relative intensity %; 1,2,3, numbers indicate the I.S. used for this compound (respectively, fluoxetine-d6, mianserin-d3, paroxetine-d6)
Compounds Time window M-ion M-ion HFB EI PICI NICI(min.) Quant ion 1 ion 2 Quant ion 1 ion 2 Quant ion 1 ion 2
ODMV 2 (HFB) 6.00 - 14.00 263 441 58 440 (0.1) 441 (0.02) 442 440 (46) 470 (44) 197 440 (0.02) 441 (0.005)Venlafaxine 2 277 259 58 259 (0.38) 121 (2.9) 260 258 (56) 288 (10) not detectedm-cpp 1 196 392 392 166 (64) 394 (34) 393 395 (33) 373 (9.6) 332 372 (21) 352 (48)Viloxazine 1 14.00-15.50 237 433 433 240 (112) 296 (82) 434 296 (63) 414 (10) 413 393 (24) 373 (20)DMFluox 1 295 491 330 117 (337) 226 (0.20) 330 358 (6.6) 117 (36) 471 491 (29) 329 (39)Fluvoxamine 1 318 514 258 240 (93) 514 (1.9) 495 258 (304) 515 (65) 256 237 (11) 494 (1.6)ODMV 2 (-H2O) 263 441 58 245 (1.2) 246 244 (53) 274 (5.5) not detectedFluoxetine 1 15.50 - 17.00 309 505 344 117 (197) 486 (0.23) 344 486 (3.2) 534 (4.0) 485 505 (2.4) 465 (7.1)Fluoxetine-d6 315 511 350 123 (200) 492 (0.27) 350 492 (4.8) 540 (5.6) 491 511 (1.9) 471 (7.7)Mianserin 2 17.00 - 18.50 264 264 264 193 (166) 220 (43) 265 293 (18) 305 (2.4) not detectedMianserin-d3 267 267 267 193 (245) 220 (58) 268 296 (19) 308 (3.8) not detectedMirtazapine 2 18.50 - 19.50 265 265 195 208 (16) 265 (6.2) 266 264 (31) 294 (17) not detectedMelitracen 2 291 291 58 202 (7.8) 291 (0.10) 292 290 (45) 320 (20) not detectedDMMia 2 19.50 - 21.00 250 446 446 193 (57) 249 (72) 447 427 (7.4) 475 (14) 386 406 (20) 446 (4.3)DMSer 3 291 487 274 487 (9.9) 489 (6.8) 275 277 (67) 487 (1.1) 487 467 (24) 433 (35)DMMir 2 251 447 447 250 (123) 195 (81) 448 428 (7.3) 476 (13) 407 387 (68) 447 (13)Reboxetine 3 313 509 371 138 (21) 509 (2.2) 372 510 (6.6) 490 (5.3) 296 489 (83) 312 (18)Citalopram 3 21.00 -21.30 324 324 58 238 (6.4) 324 (4.6) 325 305 (10) 353 (22) not detectedDMMap 3 263 459 431 191 (93) 459 (0.90) 460 382 (56) 431 (10) 439 459 (5.9) 401 (28)Maprotiline 3 21.30 - 22.05 277 473 445 191 (77) 473 (0.80) 474 454 (11) 396 (37) 453 473 (3.3) 433 (11)Sertraline 3 305 501 274 501 (32) 503 (22) 275 277 (66) 501 (3.0) 441 481 (20) 501 (4.1)DDMC 3 22.05 - 23.00 296 492 238 208 (8.5) 474 (1.5) 475 521 (20) 493 (4.0) 492 472 (43) 452 (2.6)DMC 3 310 506 238 208 (7.2) 488 (1.4) 489 507 (5.7) 535 (21) 486 466 (27) 506 (6.2)Paroxetine 3 23.00 - 24.80 329 525 525 138 (186) 388 (25) 526 506 (15) 554 (17) 485 465 (45) 505 (45)Paroxetine-d6 332 531 531 138 (164) 394 (27) 532 512 (16) 560 (18) 490 470 (89) 510 (27)Trazodone 24.80 - 31.00 371 371 205 371 (4.9) 356 (10) 372 400 (23) 336 (36) not detected
Electron ionization is the traditional ionization method and results in
compound specific fragments. However, for compounds such as citalopram,
melitracen, venlafaxine, and ODMV, the extreme fragmentation results in the
aspecific high abundance quantifier ion at m/z 58 and inherent loss of
specificity. The chemical ionization mass spectra are characterized by less
fragmentation. When applying positive ion chemical ionization, the quasi-
molecular MH+ ion, due to the proton affinity of the compound will be
monitored in most cases. Moreover, addition reactions are constantly
monitored in the spectra of the ADs. Although the ‘softer’ positive ion
chemical ionization mode is used, some compounds such as fluoxetine still
fragment easily. According to the NCCLS guidelines [35], the ion derived
from the intact molecule or an ion closely related to the molecular species
- 230 -

Chapter V: Gas chromatographic-mass spectrometric method development
- 231 -
should be monitored. Therefore protonated molecular ions and ions created
through addition were first choice for our SIM method. When using negative
ion chemical ionization, compounds that are not derivatized such as
venlafaxine, citalopram, melitracen, mianserin, mirtazapine and trazodone
are not detected. Although, some of these compounds contain
electronegative moieties, they are still not detected as one or two
heteroatoms do not result in sufficient electron affinity for NICI-detectability.
For the derivatized ADs, the electron capture reaction does not occur in a
high abundance. The dissociative electron capture reaction, however, leads to
high abundant fragment ions for which in most cases a constant loss of HF-
fragments is observed. Some compounds are still fragmented and result in
the same fragment-ions as in EI.
The final mass-spectral determination occurred in SIM mode in different time
frames as indicated in Table V.1. Within each time frame, several ions were
monitored at a dwell time of at least 30 msec to ensure enough monitoring
cycles per minute for a good peak shape. Because detection of ADs is based
on the ratio of the selected ions (Table V.1.) attention must be paid to the
variation of these ion ratios. Since the ionization process of the chemical
ionization is based on the kinetics of chemical reactions, the reproducibility of
ion-relative abundances in chemical ionization is somewhat lower than for EI.
Therefore, ion ratios compared to a standard run in the same batch should be
within 25% variation and not within 20% as for EI.
V.5. Conclusion
A GC-MS method for the simultaneous determination of ‘new’ ADs
(venlafaxine, viloxazine, fluvoxamine, fluoxetine, mianserin, mirtazapine,
melitracen, reboxetine, citalopram, maprotiline, sertraline, and paroxetine)
and their active metabolites was developed. The metabolite of venlafaxine,
O-desmethylvenlafaxine, was not included in the analyzed mixture due to
derivatization problems discussed in chapter IV. In addition, fragmentation in
all three ionization modes led to aspecific fragment ions or very low abundant
(quasi)molecular ions. Because of irreproducible chromatographic results for
trazodone this compound was not analyzed as this would lead to problems
during quantification.

Chapter V: Gas chromatographic-mass spectrometric method development
- 232 -
The final gaschromatographic-mass spectrometric method conditions were as
follows: the pulsed splitless injection temperature was held at 300°C, while
purge time and injection pulse time were set at 1 and 1.5 min, respectively.
Meanwhile, the injection pulse pressure was 25 psi and 1 μl of the sample,
redissolved in 50 μl of toluene, was injected. Ultrapure Helium with a
constant flow of 1.3 ml/min was used as carrier gas. Chromatographic
separation was achieved on a 30m x 0.25mm i.d., 0.25-μm J&W-5ms column
from Agilent Technologies (Avondale, PA, USA). The initial column
temperature was set at 90°C for 1 min, ramped at 50°C/min to 180°C where
it was held for 10 min, whereafter the temperature was ramped again at
10°C/min to 300°C. The separation of the ADs and their active metabolites
was achieved in 24.8 minutes. Identification and quantification were based on
selected ion monitoring in electron (EI) and chemical ionization (CI) modes.
For each AD the most specific and high abundance ions were selected in the
three ionization modes.
V.6. References
[1] Labat L, Deveaux M, Dallet P, Dubost JP. Separation of new antidepressants and their metabolites by micellar electrokinetic capillary chromatography. J.Chromatogr. B 2002; 773: 17-23
[2] Andersen S, Halvorsen TG, Pedersen-Bjergaard S, Rasmussen KE. Liquid-phase microextraction combined with capillary electrophoresis, a promising tool for the determination of chiral drugs in biological matrices. J. Chromatogr. A 2002; 963: 303-312
[3] Raggi MA, Mandrioli R, Casamenti G, Volterra V, Pinzauti S. Determination of reboxetine, a recent antidepressant drug, in human plasma by means of two high-performance liquid chromatography methods. J. Chromatogr. A 2002; 949: 23-33
[4] Llerena A, Dorado P, Berecz R, Gonzalez A, Norberto MJ, de la Rubia A, Caceres M. Determination of fluoxetine and norfluoxetine in human plasma by high-performance liquid chromatography with ultraviolet detection in psychiatric patients. J. Chromatogr. B 2003; 783: 25-31
[5] Hostetter AL, Stowe ZN, Cox M, Ritchie JC. A novel system for the determination of antidepressant concentrations in human breast milk. Ther.Drug Monit. 2004; 26: 47-52
[6] Titier K, Castaing N, Scotto-Gomez E, Pehourcq F, Moore N, Molimard M. High-performance liquid chromatographic method with diode array detection for identification and quantification of the eight new antidepressants and five of their active metabolites in plasma after overdose. Ther. Drug Monit. 2003; 25: 581-587
[7] Lacassie E, Gaulier JM, Marquet P, Rabatel JF, Lachatre G. Methods for the determination of seven selective serotonin reuptake inhibitors and three active

Chapter V: Gas chromatographic-mass spectrometric method development
- 233 -
metabolites in human serum using high-performance liquid chromatography and gas chromatography. J. Chromatogr. B 2000; 742: 229-238
[8] Suckow RF, Zhang MF, Cooper TB. Sensitive and selective liquid-chromatographic assay of fluoxetine and norfluoxetine in plasma with fluorescence detection after precolumn derivatization. Clin. Chem. 1992; 38: 1756-1761
[9] Goeringer KE, McIntyre IM, Drummer OH. LC-MS analysis of serotonergic drugs. J. Anal. Toxicol. 2003; 27: 30-35
[10] Kollroser M, Schober C. Simultaneous determination of seven tricyclic antidepressant drugs in human plasma by direct-injection HPLC-APCI-MS-MS with an ion trap detector. Ther. Drug Monit. 2002; 24: 537-544
[11] Kirchherr H, Kuhn-Velten WN. Quantitative determination of forty-eight antidepressants and antipsychotics in human serum by HPLC tandem mass spectrometry: a multi-level, single-sample approach. J. Chromatogr. B 2006; 843: 100-113
[12] Sauvage FL, Gaulier JM, Lachatre G, Marquet P. A fully automated turbulent-flow liquid chromatography-tandem mass spectrometry technique for monitoring antidepressants in human serum. Ther. Drug Monit. 2006; 28:123-130
[13] Ulrich S, Martens J. Solid-phase microextraction with capillary gas-liquid chromatography and nitrogen-phosphorus selective detection for the assay of antidepressant drugs in human plasma. J. Chromatogr. B 1997; 696: 217-234
[14] Martinez MA, de la Torre CS, Almarza E. Simultaneous determination of viloxazine, venlafaxine, imipramine, desipramine, sertraline, and amoxapine in whole blood: Comparison of two extraction/cleanup procedures for capillary gas chromatography with nitrogen-phosphorus detection. J. Anal. Toxicol.2002; 26: 296-302
[15] Maurer HH, Bickeboeller-Friedrich J. Screening procedure for detection of antidepressants of the selective serotonin reuptake inhibitor type and their metabolites in urine as part of a modified systematic toxicological analysis procedure using cas chromatography-mass spectrometry. J. Anal. Toxicol.2000; 24: 340-347
[16] Bickeboeller-Friedrich J, Maurer HH. Screening for detection of new antidepressants, neuroleptics, hypnotics, and their metabolites in urine by GC-MS developed using rat liver microsomes. Ther. Drug Monit. 2001; 23: 61-70
[17] Eap CB, Bouchoux G, Amey M, Cochard N, Savary L, Baumann P. Simultaneous determination of human plasma levels of citalopram, paroxetine, sertraline, and their metabolites by gas chromatography mass spectrometry. J. Chromatogr. Sci. 1998; 36: 365-371
[18] Goeringer KE, Raymon L, Christian GD, Logan BK. Postmortem forensic toxicology of selective serotonin reuptake inhibitors: A review of pharmacology and report of 168 cases. J. Forensic Sci. 2000; 45: 633-648
[19] Cognos Plus Study nr.11, Massachusetts: Decision Resources Inc, 2005, pp.176
[20] Baumann P, Hiemke C, S. U, Eckermann G, Gaertner I, Kuss HJ, Laux G, Müller-Oerlinghausen B, Rao ML, Riederer P, Zernig G. The AGNP-TDM expert group consensus guidelines: therapeutic drug monitoring in psychiatry. Pharmacopsychiatry 2004; 37: 243-265
[21] Rood D. A practical guide to the care, maintenance, and troubleshooting of capillary gas chromatographic systems. Weinheim: Wiley-VCH, 1999, pp 323.

Chapter V: Gas chromatographic-mass spectrometric method development
- 234 -
[22] Grob K. Split and splitless injection in capillary gas chromatography. Heidelberg: Hüthig Buch Verlag, 1993, pp 547.
[23] Grob K. On-column injection in capillary gas chromatography: basic technique, retention gaps, solvent effects. Heidelberg: Hüthig Buch Verlag, 1991, pp 591.
[24] David F, Sandra P, Stafford SS. Application of retention gaps for optimized capillary GC. Application note Hewlett Packard 1994; Note 228-245
[25] Wang FS, Shanfield H, Zlatkis A. Injection temperature effects using on-column and Split sampling in capillary gas chromatography. J. High Resolut. Chrom. Chrom. Comm. 1983; 6: 471-479
[26] Wylie PL, Uchiyama K. Improved gas chromatographic analysis of organophosphorus pesticides with pulsed splitless injection. J. AOAC Int. 1996; 79: 571-577
[27] Erney DR, Gillespie AM, Gilvydis DM, Poole CF. Explanation of the matrix-induced chromatographic response enhancement of organophosphorus pesticides during open-tubular column gas-chromatography with splitless or hot on-column injection and flame photometric detection. J. Chromatogr.1993; 638: 57-63
[28] Poole CF. Matrix-induced response enhancement in pesticide residue analysis by gas chromatography. J. Chromatogr. A 2007; 1158: 241-250
[29] Agilent. Operating manual: Inlets. Wilmington: Agilent Technologies, 2000, pp 254
[30] Bartle KD, Tipler A, Dawes PA, Baugh PJ, Watson D, Flanagan RJ, Taylor DR, Best GA, Dawson JP, Harriman GE, Evershed RP, Jackson P. Gas Chromatography: a practical approach. Oxford: Oxford university press, 1993, pp 427
[31] Hinshaw JV. GC connections. Computer-Controlled Pneumatics. LC-GC 1995;8: 634
[32] Deelder RS, De Jong GJ, van den Berg JHM. Chromatografie. Houten: Bohn Stafleu Van Loghum, 1994
[33] Silverstein R, Webster F. Spectrometric identification of organic compounds. New York: John Wiley and sons, 1998, pp 482.
[34] Stemmler EA, Hites RA. A systematic study of instrumental parameters affecting electron capture negative ion mass spectra. Biomed. Environ. Mass Spectrom. 1988; 15: 659-667
[35] NCCLS. Gas chromatography/mass spectrometry (GC/MS) confirmation of drugs; approved guideline. Wayne: National Committe on Clinical Laboratory Standards, 2001, pp 32
[36] Harrison AG. Chemical ionization mass spectrometry. Boca Raton: CRC Press, 1992, pp 208
[37] Maurer HH, Kraemer T, Kratzsch C, Peters FT, Weber AA. Negative ion chemical ionization gas chromatography-mass spectrometry and atmospheric pressure chemical ionization liquid chromatography-mass spectrometry of low-dosed and/or polar drugs in plasma Ther. Drug Monit. 2002; 24: 117-124
[38] Maurer HH. Role of gas chromatography-mass spectrometry with negative ion chemical ionization in clinical and forensic toxicology, doping control, and biomonitoring. Ther. Drug Monit. 2002; 24: 247-254

Chapter VI
Validation
Based on:
Wille SMR, Van hee P, Neels HM, Van Peteghem CH, Lambert WE. Comparison of electron and chemical ionization modes by validation of a quantitative gas chromatographic-mass spectrometric assay of new generation antidepressants and their active metabolites in plasma. J. Chromatogr. A, 2007; 1176: 236-245


Chapter VI: Validation
- 237 -
VI.1. Introduction
Depression is a chronic or recurrent mood disorder that affects economic and
social functions of about 121 million people worldwide, and can eventually
lead to suicidal behaviour. According to the World Health Organization,
depression will be the second leading contributor to the global burden of
disease, calculated for all ages and both sexes by the year 2020 [1, 2].
Therefore, the prescription rate of antidepressants (ADs) will increase,
resulting in a growing interest for determination methods in the clinical and
forensic field. Detection and quantification of ADs in plasma is a valid tool to
optimize AD pharmacotherapy for special patient populations and for
monitoring patient compliance [3-8]. Analytical methods for the detection of
ADs in blood and tissues are of interest in the field of forensic toxicology as
they are often involved in intoxications [9-14]. Validation of these methods is
necessary to demonstrate the validity of the assay’s performance and to be
sure that the obtained results are reliable.
The ADs that we monitored are the ‘new’ generation ADs as these are the
most prescribed AD drugs in the seven major markets (Japan, USA, France,
United Kingdom, Italy, Spain, Germany) nowadays, according to the Cognos
Plus Study 11 [15]. The ‘new’ generation ADs include the Selective Serotonin
Reuptake Inhibitors (SSRIs: fluoxetine, fluvoxamine, sertraline, paroxetine
and citalopram), the Selective Noradrenaline Reuptake Inhibitors (reboxetine
and viloxazine), the Serotonin and Noradrenaline Reuptake Inhibitors
(venlafaxine), the Noradrenergic and Specific Serotonergic ADs (mirtazapine
and mianserin), and the Serotonin-2 antagonists and Reuptake Inhibitors
such as trazodone [16-21]. These ADs are monitored in combination with
their (active) metabolites as the latter can also contribute to the overall
therapeutic and toxic effect. In addition, metabolites can give extra
information about the time of ingestion, the metabolic capacity, and
compliance. These metabolites, i.e. desmethylmirtazapine, O-desmethyl-
venlafaxine, m-chlorophenylpiperazine, desmethylcitalopram, didesmethyl-
citalopram, desmethylmianserin, desmethylfluoxetine, desmethylsertraline,
desmethylmaprotiline, were chosen according to the AGNP-TDM expert group
consensus guidelines [22].

Chapter VI: Validation
- 238 -
Over the years, several chromatographic methods have been developed for
the determination of these ADs in biological matrices. These methods include
capillary electrophoresis [23, 24], high performance liquid chromatography
with ultra-violet (UV) [25-28], fluorescence [29, 30] or mass spectrometric
detection [31-33], as well as gas chromatography combined with nitrogen-
phosphorus [34, 35] or mass detection (GC-MS) [12, 36-38]. In clinical
toxicology, GC-MS is still the method of choice as it is sensitive and selective,
providing the best separation power for compounds that are volatile under
GC conditions. Electron ionization (EI) is the traditional method for
comprehensive screening procedures, allowing identification of unknown
compounds by comparison of their mass spectrum with a large collection of
reference mass spectra in commercially available libraries. In addition, EI
leads to a number of fragment ions providing additional structural
information. However, due to the extensive fragmentation of some ADs in the
EI-mode, the positive ion chemical ionization mode (PICI) provides more
selectivity as this technique often gives molecular mass information. Negative
ion chemical ionization (NICI) can improve sensitivity as compared to PICI or
EI for the determination of compounds with electronegative moieties, either
present in their original structure or obtained after derivatization [39, 40]. In
this chapter a comparison between EI mode and the chemical ionization
modes (CI, both PICI and NICI) was made during validation of the developed
GC-MS method for the simultaneous quantification of most new generation
ADs and their metabolites in plasma. Moreover, the same GC-MS method was
validated for blood and brain tissue in PICI mode for post-mortem
investigation purposes.
VI.2. Experimental
VI.2.1. Reagents
Venlafaxine.HCl was provided by Wyeth (New York, NY, USA). Organon (Oss,
The Netherlands) donated mianserin.HCl, desmethylmianserin.HCl,
mirtazapine, and desmethylmirtazapine maleate, while sertraline.HCl,
desmethylsertraline maleate, and reboxetine methanesulphonate were a gift
from Pfizer (Groton, CT, USA). Lundbeck (Valby, Denmark) offered

Chapter VI: Validation
- 239 -
citalopram.HBr, desmethylcitalopram.HCl, didesmethylcitalopram tartrate
hydrate (DDMC), and melitracen.HCl. ACRAF (Roma, Italy) provided
trazodone.HCl and its metabolite m-chlorophenylpiperazine.HCl, whereas
paroxetine.HCl hemi-hydrate was donated by GlaxoSmithKline
(Erembodegem, Belgium) and viloxazine.HCl by AstraZeneca (Brussels,
Belgium). Fluvoxamine maleate and maprotiline.HCl were provided by Solvay
Pharmaceuticals (Weesp, The Netherlands) and Novartis Pharma (Basel,
Switzerland), respectively. Fluoxetine.HCl, desmethylfluoxetine.HCl and 1-
(heptafluorobutyryl) imidazole (HFBI) were purchased from Sigma-Aldrich
(Steinheim, Germany). Promochem (Molsheim, France) delivered fluoxetine-
d6 oxalate, mianserin-d3, maprotiline-d3 and paroxetine-d6 maleate (100
μg/ml in MeOH). The following reagents were purchased from Merck
(Darmstadt, Germany): ammonia-solution 25%, orthophosphoric acid (85%),
sodium dihydrogenium phosphate monohydrate, methanol and water (HPLC
grade), and toluene (Suprasolv).
The strong cation exchanger (Strata SCX with 200 mg sorbent mass) was
obtained from Phenomenex (Bester, Amstelveen, The Netherlands). Vials,
glass inserts and viton crimp-caps were purchased from Agilent technologies
(Avondale, PA, USA).
Drug-free blood and hair were obtained from healthy volunteers. EDTA
plasma was harvested from the blood within 2 hours after a 10-min
centrifugation period at 1200 g. Drug-free post-mortem brain tissue samples
were obtained from the department of forensic medicine (Ghent University,
Belgium).
VI.2.2. Preparation of standard solutions and calibrators
Primary stock solutions of each individual AD were prepared in methanol at a
concentration of 1 mg/ml and stored at -20°C. A standard mixture was
obtained by mixing these individual primary stock solutions and by further
diluting with methanol to a concentration of 0.05 – 0.125 mg/ml, depending
on the therapeutic range of the compound. After preparation, it was stored
protected from light at approximately -20°C. Further dilution of the standard

Chapter VI: Validation
- 240 -
mixture with methanol resulted in working solutions with concentrations of
0.1, 1 or 10 μg/ml. For the preparation of sample calibrators, 20 to 100 μl of
a working solution were spiked to 1 ml of plasma or blood to have a
concentration range from 10 till 500 ng/ml. For NICI mode only 250 μl of the
1 ml spiked plasma was used. When spiking brain tissue (1 g), a 50-μl
Hamilton injection needle was used to introduce the compounds directly into
the tissue. A concentration range from 50 to 1000 ng/g was used for brain
tissue samples.
Samples were equilibrated at 4°C overnight. Primary stock solutions of the
internal standards (I.S.) fluoxetine-d6, mianserin-d3 and paroxetine-d6 were
prepared in methanol at a concentration of 10 μg/ml and were stored
protected from light at 4°C. Twenty μl of each I.S. solution were spiked to 1
ml of plasma, blood or 1 g of brain tissue.
VI.2.3. Instrumentation
All experiments were carried out on a HP 6890 GC system, equipped with a
HP 5973 mass-selective detector, a HP 7683 split/splitless auto injector and a
G1701DA Chem Station, version D.02.00 data processing unit (Agilent
Technologies, Avondale, PA, USA).
An Ultra Turrax mixer IKA T18 basic (Staufen, Germany) was used to
homogenize the tissue samples. Sonication was done using a ‘Brandson 1510’
(Brandson UL Transonics corporation, Danbury, CT, USA). A Visiprep TM
Disposable liner vacuum manifold (Supelco, Bornem, Belgium) controlled the
flow during the solid phase extraction. Evaporation under nitrogen was
conducted in a TurboVap LV evaporator from Zymark (Hopkinton, MA, USA).
The heater was a multi-block from Lab-line (Tiel, The Netherlands).
VI.2.4. Sample preparation
A short résumé of the sample preparation is given in this paragraph. The
optimization of the sample preparation is described in chapter III, and the
sample preparation according to each matrix is schematically presented in

Chapter VI: Validation
- 241 -
Figure III.6. (chapter III, p 105). The derivatization procedure is described in
detail in chapter IV. I.S.s (200 ng in EI, PICI and 50 ng in NICI / ml plasma)
were added to the samples. Thereafter, samples were prepared for the
loading step onto the SPE tube according to the matrix. Plasma samples were
diluted with 4 ml of phosphate buffer (pH 2.5; 25 mM), centrifuged and
submitted to the solid phase extraction procedure (SPE). Blood samples were
also diluted with the phosphate buffer, sonicated for 15 minutes and
transferred to the SPE without centrifugation. Brain tissue was mixed after
addition of 2 ml of acetonitrile and 0.5 ml of potassium carbonate buffer (1M
pH 9.5) and centrifuged for 15 minutes at 1850 g. The top-layer was
removed and diluted with phosphate buffer (pH 2.5; 25 mM). The pH of the
diluted sample was adapted to 2-3 with orthophosphoric acid before it was
submitted to the SPE-procedure. Hair samples were washed in HPLC-water (5
minutes), and rinsed 3 times with 1 ml of methanol. Thereafter, they were
cut in segments of approximately 2 cm. The hair fragments were digested in
a sodium hydroxide solution (1M, 1 ml) for 10 minutes at 100°C or they were
soaked in 4 ml of phosphate buffer (pH 2.5; 25 mM) for 18 hours at 55°C
and sonicated for 1 hour. Then the samples were diluted with phosphate
buffer and the pH was adapted to 2-3 with orthophosphoric acid if necessary.
The SPE procedure consisted of conditioning the strong cation exchanger with
3 ml of the final eluting solvent, 2 ml of methanol and 3 ml of phosphate
buffer, followed by loading of the sample. Then, a wash step with 4 times 1
ml of methanol followed using –20 kPa vacuum. After 2 minutes drying time
at -50 kPa, the compounds were eluted with 2 ml of 5% ammonia in
methanol. Finally, a vacuum of -50 kPa was used during 1 minute to collect
all the eluting solvent.
After evaporation of the solid phase extracts under nitrogen at 40°C, 50 μl of
HFBI was added and the sample was heated at 85°C for 30 min. Thereafter,
0.5 ml of HPLC-grade water and 2 ml of toluene were added. After vortexing
and centrifuging the sample at 1121 g for 5 min, the toluene layer was
transferred and evaporated at 40°C [41]. The residue was dissolved in 50 μl
of toluene.

Chapter VI: Validation
- 242 -
VI.2.5. Gas chromatographic parameters
The pulsed splitless injection temperature was held at 300°C, while purge
time and injection pulse time were set at 1 and 1.5 min, respectively.
Meanwhile, the injection pulse pressure was 170 kPa and 1 μl of the sample,
redissolved in 50 μl toluene, was injected. Chromatographic separation was
achieved on a 30m x 0.25mm ID, 0.25-μm J&W-5ms column from Agilent
Technologies (Avondale, PA, USA). The initial column temperature was set at
90°C for 1 min, ramped at 50°C/min to 180°C where it was held for 10 min,
whereafter the temperature was ramped again at 10°C/min to 300°C.
Ultrapure helium with a constant flow of 1.3 ml/min was used as carrier gas.
VI.2.6. Mass spectrometric parameters
In EI mode, the mass selective detector temperature conditions were 230°C
for the EI-source, 150°C for the quadrupole and 300°C for the transferline,
whereas an electron voltage of 70 eV was used. The mass parameters for the
electron ionization mode were not optimized, as the ‘traditional’ conditions in
which the spectra of the commercially available libraries were obtained were
chosen.
The mass selective detector temperature conditions in PICI were as in EI,
except for the ion source temperature (PICI/NICI source), which was 250°C,
and the electron energy (140 eV). Ion source temperature and ion focus
potential have the highest effect on the abundance of the molecular ions in
NICI mode [42]. These parameters were optimized according to Agilent’s
guidelines and weekly tuning parameters. For NICI-mode the transferline was
kept at 280°C, the ion source at 150°C and the quadrupole at 106°C, with an
electron energy of 170 eV. The electron emission (100 μA) was optimized to
give best peak intensity, as this parameter is compound specific. Methane
was used as reagent gas with a flow of 1 and 2 ml/min for PICI and NICI,
respectively. The spectra were monitored in selected ion monitoring (SIM)
mode for quantification (Table VI.1.).

Chapter VI: Validation
Table VI.1. Quantifier and qualifier ions of the ADs in electron and chemical
ionization mode
Relative intensity of ions as compared to the quantifier ion are shown between brackets. I.S.: 1 (Fluoxetine-d6); 2 (Mianserin-d3); 3 (Paroxetine-d6)
Compounds Time window M-ion M-ion HFB(min.) Quant ion 1 ion 2 Quant ion 1 ion 2 Quant ion 1 ion 2
Venlafaxine 2 6.00 - 14.00 277 259 58 259 (0.38) 121 (2.9) 260 258 (56) 288 (10) not detectedm-cpp 1 196 392 392 166 (64) 394 (34) 393 395 (33) 373 (9.6) 332 372 (21) 352 (48)Viloxazine 1 14.00-15.50 237 433 433 240 (112) 296 (82) 434 296 (63) 414 (10) 413 393 (24) 373 (20)DMFluox 1 295 491 330 117 (337) 226 (0.20) 330 358 (6.6) 117 (36) 471 491 (29) 329 (39)Fluvoxamine 1 318 514 258 240 (93) 514 (1.9) 495 258 (304) 515 (65) 256 237 (11) 494 (1.6)Fluoxetine 1 15.50 - 17.00 309 505 344 117 (197) 486 (0.23) 344 486 (3.2) 534 (4.0) 485 505 (2.4) 465 (7.1)Fluoxetine-d6 315 511 350 123 (200) 492 (0.27) 350 492 (4.8) 540 (5.6) 491 511 (1.9) 471 (7.7)Mianserin 2 17.00 - 18.50 264 264 264 193 (166) 220 (43) 265 293 (18) 305 (2.4) not detectedMianserin-d3 267 267 267 193 (245) 220 (58) 268 296 (19) 308 (3.8) not detectedMirtazapine 2 18.50 - 19.50 265 265 195 208 (16) 265 (6.2) 266 264 (31) 294 (17) not detectedMelitracen 2 291 291 58 202 (7.8) 291 (0.10) 292 290 (45) 320 (20) not detectedDMMia 2 19.50 - 21.00 250 446 446 193 (57) 249 (72) 447 427 (7.4) 475 (14) 386 406 (20) 446 (4.3)DMSer 3 291 487 274 487 (9.9) 489 (6.8) 275 277 (67) 487 (1.1) 487 467 (24) 433 (35)DMMir 2 251 447 447 250 (123) 195 (81) 448 428 (7.3) 476 (13) 407 387 (68) 447 (13)Reboxetine 3 313 509 371 138 (21) 509 (2.2) 372 510 (6.6) 490 (5.3) 296 489 (83) 312 (18)Citalopram 3 21.00 -21.30 324 324 58 238 (6.4) 324 (4.6) 325 305 (10) 353 (22) not detectedDMMap 3 263 459 431 191 (93) 459 (0.90) 460 382 (56) 431 (10) 439 459 (5.9) 401 (28)Maprotiline 3 21.30 - 22.05 277 473 445 191 (77) 473 (0.80) 474 454 (11) 396 (37) 453 473 (3.3) 433 (11)Sertraline 3 305 501 274 501 (32) 503 (22) 275 277 (66) 501 (3.0) 441 481 (20) 501 (4.1)DDMC 3 22.05 - 23.00 296 492 238 208 (8.5) 474 (1.5) 475 521 (20) 493 (4.0) 492 472 (43) 452 (2.6)DMC 3 310 506 238 208 (7.2) 488 (1.4) 489 507 (5.7) 535 (21) 486 466 (27) 506 (6.2)Paroxetine 3 23.00 - 24.80 329 525 525 138 (186) 388 (25) 526 506 (15) 554 (17) 485 465 (45) 505 (45)Paroxetine-d6 332 531 531 138 (164) 394 (27) 532 512 (16) 560 (18) 490 470 (89) 510 (27)
EI PICI NICI
VI.3. Method Validation
The developed GC-MS method was validated in plasma, blood and brain
tissue based on the FDA guidelines [43]. Bioanalytical method validation
includes all of the procedures that demonstrate that a particular method used
for quantitative measurement of analytes in a given biological matrix is
reliable and reproducible for the intended use. The fundamental parameters
for validation include accuracy, precision, selectivity, sensitivity,
reproducibility, linearity and stability. In plasma, validation parameters such
as stability and recovery were evaluated only in EI mode, while parameters
such as sensitivity, selectivity, linearity, intra and inter batch precision, and
accuracy were analyzed and compared in the three ionization modes (EI,
PICI, NICI). Validation parameters were re-evaluated for blood and brain
tissue, while only selectivity was checked for hair samples. The validation
parameters for the post-mortem matrices, (whole blood, brain tissue and
hair) were obtained using the PICI mode.
- 243 -

Chapter VI: Validation
- 244 -
VI.3.1. Stability
VI.3.1.1. Experimental
Stability of compounds or their derivatives is very important during method
validation. Compounds should be stable in their matrix to allow correct
analytical data and interpretation of the results. In addition, compounds
should be stable during sample handling (stable at certain temperatures, in
the solvents used,…) and finally if derivatization occurs, the derivatized
compounds should be stable during the analytical run. Therefore, the analyte
stability determinations comprised of stock solution stability, stability of the
compounds in their matrix and stability of the heptafluorobutyryl-derivatives.
Stability of ADs in plasma, blood and brain tissue was determined as long-
term stability (2 months, -20°C), short-term stability (4 hours, room
temperature), and freeze-thaw cycle stability (3 cycles). The stability of HFB-
derivatives was checked after a period of 14 days at -20°C and after 24
hours at room temperature in the autosampler.
For all stability determinations, except for the autosampler stability, the
concentrations of the analytes were calculated from daily calibration curves
and an acceptance interval of 85-115% was applied for the ratio of the mean
stability sample concentration versus the mean control concentration.
Moreover, an acceptance interval of 80-120% of the control sample means
was applied for the 90% confidence interval of the stability samples. All
analyte stability determinations and storage stability tests of the derivatized
extracts were determined at low, mid and high concentrations, except for the
long-term stability (low and high), with 6 repetitions for plasma and 5
repetitions for blood and brain tissue. Controls and stability samples were
prepared at the same time and analyzed before and after treatment.
Autosampler stability of the derivatives was evaluated at low and high
concentration over a period of 24 hours. Ten samples of each concentration
were extracted and derivatized. Thereafter, the extracts obtained at each
concentration were pooled and redivided in 10 aliquots to be transferred to
10 autosampler vials, leaving each vial reinjected after 4 hours and 8
minutes under the conditions of a regular analytical run. The absolute peak
areas corresponding to each compound were plotted at each concentration
versus injection time. The slopes of the obtained curves were determined

Chapter VI: Validation
- 245 -
whereby a negative slope would indicate instability. The concentration at time
zero as well as after 24 hours was calculated from these curves. The
percentage loss was determined from these results.
VI.3.1.2. Results and discussion
Stock solutions in methanol (1 mg/ml) are stable for at least 3 months. In
addition, these new ADs seem to be stable in blood and plasma samples
[44]. According to our experiments (Table VI.2.), long-term instability was
seen for venlafaxine, melitracen and citalopram at low and high and for
sertraline at high concentrations in plasma. However, short-term stability was
no problem as the ADs were stable in plasma after 4 hours at room
temperature, because the ratio of the mean stability sample concentrations
versus mean control concentrations as well as their 90% confidence interval
(CI) fulfilled the acceptance criteria. The freeze-thaw stability for most
compounds also fulfilled the acceptance criteria, except for maprotiline,
desmethylmaprotiline and sertraline who showed a decrease in concentration
at the low level (70-77%, 90% CI 61-81%). Overall, the stability of
compounds in plasma is acceptable.
As observed in Table VI.2., the short-term and freeze-thaw stability of ADs at
low concentration was better in plasma than in blood. Compounds such as m-
cpp, viloxazine, desmethyfluoxetine, melitracen, desmethylsertraline,
reboxetine, citalopram, desmethylmaprotiline and maprotiline did not fulfil
the acceptance criteria; however, this instability was not seen for medium
and high ADs concentrations in blood. For long-term storage, an instability
was observed for venlafaxine and sertraline (low and high concentrations)
and for melitracen and citalopram (low concentration). Thus the same
compounds show a decrease in concentration in plasma and blood after long-
term storage.
In brain tissue, freeze-thaw instability was seen for m-cpp and citalopram,
while short-term instability was only seen for m-cpp. ADs at low
concentrations are not stable in brain tissue after long-term storage. At high
concentrations, only m-cpp showed significant losses.
Overall, the stability of ADs is acceptable in plasma and blood. However,
long-term instability for citalopram, venlafaxine, sertraline and melitracen is
problematic if samples have to be stored for long period. In brain tissue, the

Chapter VI: Validation
stability is dependent on the spiked concentration, and especially the long-
term storage led to degradation.
Table VI.2. Stability data of ADs and their HFB-derivatives in plasma, blood
and brain tissue
% IV, percentage of initial value; 90%CI, 90 percent confidence interval
% IV 90% CI % IV 90% CI % IV 90% CI % IV 90% CI % IV 90% CI % IV 90% CI % IV 90% CI % IV 90% CI % IV 90% CIVenlafaxine 16 15-18 58 36-80 13 13-14 75 72-79 107 103-110m-cpp 96 87-104 88 86-99 46 15-77 90 88-93 93 89-97 64 60-67Viloxazine 96 93-99 86 77-95 94 91-97 92 91-92 88 84-92DMFluox 87 83-90 90 85-96 86 83-89 100 99-100 99 97-100Fluvoxamine 98 95-100 127 121-135 96 93-99 104 103-105 110 105-114Fluoxetine 111 107-114 98 94-101 18 13-22 90 86-93 91 91-92 91 90-92Mianserin 96 93-99 99 94-105 88 85-90 91 90-91 90 89-91Mirtazapine 91 88-95 94 79-109 37 33-41 74 72-76 90 89-91 86 83-89Melitracen 15 14-15 43 32-55 13 12-13 89 87-91 91 87-95DMMia 116 113-118 97 92-102 101 99-102 77 71-82 83 73-93DMSer 86 76-95 105 97-113 115 87-143 87 83-92 103 98-108 97 96-98DMMir 129 124-135 80 71-88 102 100-104 78 73-82 83 77-89Reboxetine 101 99-104 96 95-98 89 88-90 90 87-94 116 108-123Citalopram 22 21-23 23 12754 11 10-11 95 91-99 115 92-137DMMap 89 86-93 131 123-139 45 35-55 103 99-106 110 105-114 111 104-118Maprotiline 113 109-117 102 99-105 47 33-60 99 98-101 94 92-97 100 95-105Sertraline 131 117-144 82 77-87 124 79-169 77 75-80 65 58-73 158 130-185DDMC 94 91-97 94 89-98 89 86-92 108 102-114 99 90-109DMC 97 95-98 103 93-112 85 85-86 91 88-95 92 88-96Paroxetine 86 80-92 108 104-112 12 7-17 94 93-96 91 89-92 85 83-86
Long-term stabilityStability
plasma blood brainMedium concentration High concentrationLow concentration
plasma blood brainbrain plasma blood
% IV 90% CI % IV 90% CI % IV 90% CI % IV 90% CI % IV 90% CI % IV 90% CI % IV 90% CI % IV 90% CI % IV 90% CIVenlafaxine 117 113-121 129 107-151 165 89-241 102 98-105 106 95-117 98 91-105 98 96-101 93 84-101 101 88-113m-cpp 94 90-97 87 78-96 55 51-58 97 93-101 92 90-94 98 88-108 95 92-99 102 100-104 74 53-95Viloxazine 98 95-101 70 63-77 93 90-95 97 95-99 94 93-95 88 85-91 99 98-99 106 104-108 94 91-97DMFluox 89 85-93 77 65-88 94 83-105 109 101-117 96 93-99 85 81-89 104 99-110 112 111-113 113 105-122Fluvoxamine 85 82-88 94 86-102 113 108-119 108 98-118 99 94-104 92 87-97 106 99-112 111 109-112 126 121-132Fluoxetine 103 100-106 99 97-102 95 88-101 100 98-102 101 100-102 103 102-104 102 99-106 101 100-102 101 93-95Mianserin 105 102-107 107 97-117 92 85-98 99 96-103 103 101-105 98 94-101 101 100-102 100 99-101 94 95-101Mirtazapine 103 101-106 96 91-101 112 107-117 101 98-104 104 100-107 91 88-94 98 97-100 99 98-100 98 80-96Melitracen 112 108-117 77 74-80 149 140-159 98 95-101 102 97-106 85 76-94 97 95-99 99 98-100 88 80-98DMMia 116 113-120 158 123-194 81 76-86 103 100-105 106 101-110 87 76-99 95 93-97 92 87-97 89 92-116DMSer 104 100-108 79 74-84 88 82-94 102 96-108 92 90-96 109 100-119 96 85-102 112 109-115 104 88-105DMMir 115 110-119 134 105-162 91 84-98 105 102-107 107 101-112 92 81-102 96 94-98 94 87-101 97 94-114Reboxetine 102 99-105 58 52-64 153 133-173 96 94-99 96 93-98 128 123-134 102 99-106 105 103-107 104 94-114Citalopram 92 87-97 67 56-78 179 145-213 94 88-99 95 89-102 94 82-106 99 94-104 109 103-114 87 80-93DMMap 90 87-92 66 59-73 100 96-103 107 101-113 92 89-95 112 101-123 99 96-103 110 106-114 118 97-139Maprotiline 103 102-105 80 76-83 94 89-99 97 95-99 93 92-94 105 96-113 97 95-99 99 98-100 96 89-103Sertraline 94 85-104 118 100-135 135 129-141 86 82-90 111 104-117 114 101-126 131 124-137 81 76-86 124 111-137DDMC 90 87-92 158 137-179 178 153-202 106 100-113 95 92-98 107 100-114 95 92-99 109 107-112 113 107-120DMC 105 102-109 88 82-93 113 105-121 93 92-94 99 97-101 100 96-105 97 96-99 99 98-101 102 93-112Paroxetine 100 98-102 94 93-96 103 102-105 100 97-102 98 97-99 100 99-101 101 101-102 101 100-102 93 92-94
blood brainplasma blood brain plasma
Short-term stabilityLow concentration
blood brainplasmaMedium concentration High concentration
% IV 90% CI % IV 90% CI % IV 90% CI % IV 90% CI % IV 90% CI % IV 90% CI % IV 90% CI % IV 90% CI % IV 90% CIVenlafaxine 113 110-115 104 82-125 165 118-212 106 102-109 95 85-105 103 95-112 103 98-108 103 99-106 93 88-97m-cpp 111 105-118 83 78-89 67 55-79 103 98-108 93 87-99 99 82-115 102 95-108 108 105-112 61 55-67Viloxazine 103 102-105 70 60-79 101 79-123 100 97-103 92 86-99 90 86-95 96 95-98 112 110-114 97 95-98DMFluox 96 86-107 80 70-90 94 90-98 93 88-99 97 92-102 86 83-89 101 98-105 118 115-121 108 101-114Fluvoxamine 96 85-107 98 74-122 98 91-105 95 88-101 100 94-106 94 90-98 103 98-108 116 113-119 121 117-124Fluoxetine 97 96-99 99 98-100 100 95-105 99 94-104 102 100-105 101 100-102 97 93-101 103 102-103 105 100-109Mianserin 104 98-110 108 98-119 99 95-103 102 97-108 107 104-109 96 95-98 102 95-110 102 101-102 96 94-99Mirtazapine 98 91-104 97 92-101 99 84-115 108 102-114 101 95-107 87 83-91 100 93-107 101 100-102 99 97-101Melitracen 96 91-101 79 74-83 135 124-147 105 101-108 96 87-106 82 79-85 102 97-106 101 98-105 97 95-99DMMia 105 101-109 114 93-136 85 78-92 109 105-113 97 88-106 109 98-119 103 98-108 97 94-99 110 106-114DMSer 101 87-115 85 79-92 108 97-119 86 82-91 101 97-105 111 106-117 95 87-103 117 115-119 92 93-101DMMir 105 102-108 104 79-130 86 77-85 110 103-116 98 88-108 104 95-113 108 100-115 99 97-102 111 108-114Reboxetine 109 106-112 63 55-70 128 105-152 102 99-106 100 93-107 132 118-145 97 95-99 110 109-112 101 93-108Citalopram 103 99-108 80 70-89 103 71-135 100 94-105 97 90-105 83 77-90 95 91-98 113 110-117 76 71-81DMMap 70 61-79 70 64-75 97 92-101 94 91-97 96 93-99 100 94-106 103 100-106 112 108-116 89 82-63Maprotiline 78 74-82 80 70-90 98 91-105 110 94-126 97 93-101 101 96-106 96 92-101 100 98-102 86 83-89Sertraline 73 63-82 119 112-126 159 134-184 138 126-150 102 89-114 105 96-113 95 89-101 79 72-86 114 102-126DDMC 106 98-114 147 120-174 128 113-143 101 96-106 100 96-103 95 89-101 101 98-104 114 111-117 96 89-103DMC 86 82-90 91 78-105 98 90-105 99 98-100 104 100-108 100 98-101 95 94-96 102 100-104 108 104-112Paroxetine 92 88-96 90 86-93 104 100-108 98 94-102 101 99-103 102 101-102 95 91-99 104 102-105 95 93-97
plasma blood brainplasma blood brain
Freeze-thaw stabilityMedium concentration High concentration
brainLow concentration
plasma blood
- 246 -

Chapter VI: Validation
% IV 90% CI % IV 90% CI % IV 90% CI % IV 90% CI % IV 90% CI % IV 90% CI % IV 90% CI % IV 90% CI % IV 90% CIVenlafaxine 113 110-116 104 101-107 96 95-97m-cpp 133 130-138 111 105-106 106 102-110Viloxazine 117 114-120 113 111-115 106 104-108DMFluox 91 85-98 102 95-110 94 90-98Fluvoxamine 94 89-99 100 92-109 95 92-98Fluoxetine 114 111-116 106 104-108 100 96-103Mianserin 106 101-111 103 99-107 99 96-101Mirtazapine 109 106-111 107 104-110 96 94-98Melitracen 104 99-109 102 99-106 95 94-96DMMia 111 105-117 114 111-118 105 104-106DMSer 96 85-107 110 103-117 108 102-114DMMir 114 110-119 118 114-121 109 106-111Reboxetine 109 106-112 103 100-105 96 95-96Citalopram 125 119-130 95 92-99 82 80-83DMMap 94 87-101 103 96-109 101 94-105Maprotiline 117 111-123 110 107-112 105 103-108Sertraline 110 96-124 80 77-84 78 75-81DDMC 95 90-100 113 108-118 98 94-102DMC 118 112-123 101 99-103 99 98-100Paroxetine 107 100-113 103 100-106 99 97-101
plasma blood brain plasma plasma blood brainblood brain
Freeze stability HFB-derivativesLow concentration High concentrationMedium concentration
The autosampler stability overnight of the analytes at high concentrations
showed tolerable losses (less than 11%) after 24 hours, except for DMMap
(16%) (Figure VI.1.). At low concentration, the resulting positive slopes for
all compounds indicated a concentration effect of the extract due to
evaporation during analysis. This concentration effect masked the stability
results. Special Viton caps and glass inserts were used to prevent the
evaporation of toluene, but still a concentration effect was observed, this was
more pronounced for low concentration extracts according to Raoult’s law (Pi
(vapour pressure of solvent with added solute) = xi (mole fraction).Pi*
(vapour pressure of pure solvent). The higher the amount of solute that is
added to a pure solvent, the more the vapour pressure of that solvent will be
depressed. During this experiment no internal standards were used, however,
internal standards will compensate for this concentration effect when
analyzing real samples.
The derivatives were also preserved at -20°C, to check if derivatized extracts
could be analyzed after 2 weeks. This is of interest, when the ion source has
to be switched from EI to PICI and NICI mode. No degradation of the
derivates was observed even after 2 weeks of storage at -20°C, except for
sertraline (mid and high) (Table VI.2.)
- 247 -

Chapter VI: Validation
Figure VI.1. Autosampler stability at low and high therapeutic AD
concentration
% IV, percentage of initial value
Autosampler stability at 20 ng/ml
0
100000
200000
300000
400000
500000
600000
0 200 400 600 800 1000 1200 1400 1600 1800
Time (minutes)
area
m-cppVenlafaxineDM FluoxViloxazineFluvoxamineFluoxetineM ianserinM irtazapineM elitracenDM M iaDM M irReboxetineDM SerCitalopramM apro tilineDM M apSertralineDDM CDM CParoxetine
Stability curve low % IV low after 24 hours Stability curve high % IV high after 24 hoursm-cpp y = 15.694x + 77737 130 m-cpp y = -157x + 3338834 93Venlafaxine y = 133.63x + 293263 167 Venlafaxine y = -680x + 13960186 93DMFluox y = 18.944x + 86151 133 DMFluox y = -198x + 4165379 93Viloxazine y = 6.8955x + 30501 133 Viloxazine y = -89x + 1486308 91Fluvoxamine y = 8.1224x + 33332 136 Fluvoxamine y = -95x + 1873421 93Fluoxetine y = 18.293x + 106066 125 Fluoxetine y = -238x + 4531469 92Mianserin y = 36.887x + 98957 155 Mianserin y = -239x + 4453838 92Mirtazapine y = 92.967x + 208715 166 Mirtazapine y = -546x + 9644458 92Melitracen y = 66.024x + 136504 171 Melitracen y = -527x + 7909464 90DMMia y = 23.82x + 101287 135 DMMia y = -310x + 4732498 90DMMir y = 16.303x + 67311 136 DMMir y = -201x + 3142142 91Reboxetine y = 12.764x + 72432 126 Reboxetine y = -198x + 3427683 91DMSer y = 18.807x + 98952 128 DMSer y = -266x + 4105396 90Citalopram y = 110.85x + 138287 218 Citalopram y = -736x + 10346314 90Maprotiline y = 20.035x + 122051 247 Maprotiline y = -360x + 4885553 89DMMap y = 17.919x + 94866 128 DMMap y = -404x + 3720341 84Sertraline y = 5.5116x + 46215 118 Sertraline y = -127x + 1798923 90DDMC y = 57.253x + 124531 168 DDMC y = -339x + 7330348 93DMC y = 52.103x + 197707 139 DMC y = -579x + 8820070 90Paroxetine y = 5.6402x + 37896 122 Paroxetine y = -79x + 1430291 92
Autosampler stability at 500 ng/ml
0
2000000
4000000
6000000
8000000
10000000
12000000
14000000
16000000
0 200 400 600 800 1000 1200 1400 1600 1800
Time (minutes)
area
m-cppVenlafaxineDM FluoxViloxazineFluvoxamineFluoxetineM ianserinM irtazapineM elitracenDM M iaDM M irReboxetineDM SerCitalopramM apro tilineDM M apSertralineDDM CDM CParoxetine
- 248 -

Chapter VI: Validation
VI.3.2. Recovery
VI.3.2.1. Experimental
The recovery for each analyte was determined at low, medium and high
concentration (n=6). Therefore, standard working solutions were spiked in
blank matrix samples before (extraction samples) or after sample preparation
(control samples). Since quantification was performed by the peak area ratios
of the target analytes and the internal standard, the internal standards were
always added after sample pretreatment, before derivatization, and the
resulting peak area ratios were compared. The recovery was expressed by its
average and relative standard deviation (RSD).
VI.3.2.2. Results and discussion
The SCX extraction leads to reproducible and high recovery from blood for
most compounds if no centrifugation step is included (Table VI.3.) and range
between 73-106 %, except for venlafaxine (51%). The recoveries from blood
samples are comparable to the recovery from plasma.
Table VI.3. Recovery of ADs from plasma, blood and brain tissue
compound
Venlafaxine 104 (3) 95 (4) 95 (2) (21) 101 (14) 93 (7) 38 (19) 46 (17) 45* (13)m-cpp 91 (4) 92 (7) 96 (5) 92 (14) 93 (9) 101 (7) 85 (16) 99 (8) 80 (9)DMFluox 107* (12) 91 (7) 91* (5) 93 (12) 93 (6) 100 (6) 82 (12) 79 (5) 69 10)Viloxazine 104 (14) 96 (5) 92 (5) 91 (8) 97 (10) 105 (7) 58 (7) 62 (4) 56* (8)Fluvoxamine 102 (2) 104 (8) 97 (18) 95 (13) 99 (18) 104 (9) 44 (16) 43 (7) 35* (10)Fluoxetine 98 (12) 94 (2) 96 (2) 80 (9) 89 (7) 100 (5) 75 (8) 71 (5) 73 (6)Mianserin 95 (4) 94 (3) 94 (3) 87 (6) 99 (8) 104 (3) 81 (11) 80 (5) 81 (7)Mirtazapine 95 (6) 92 (3) 93 (3) 79 (10) 98 (8) 99 (4) 77 (11) 78 (7) 85 (5)Melitracen 101 (5) 93 (3) 93 (3) 80 (8) 100 (9) 101 (5) 75 (13) 83 (6) 80* (8)DMMia 101 (4) 98 (4) 91 (2) 82 (16) 102 (13) 92 (7) 70 (9) 81 (10) 78* (15)DMSer 98 (11) 88 (7) 104 (10) 94* 15) 92 (11) 102 (5) 77 (6) 70 (11) 76 (6)DMMir 99 (4) 95 (2) 92 (3) 83 (12) 103 (12) 94 (6) 74 (12) 78 (8) 78 (11)Reboxetine 99 (3) 97 (3) 95 (1) 87 (12) 92 (8) 105 (7) 51 (18) 60 (8) 59* (4)Citalopram 88 (8) 87 (9) 94 (5) 84 (21) 89 (14) 106 (13) 61 (16) 73 (5) 78* (4)Maprotiline 72* (14) 88 (3) 90 (6) 83 (14) 76 (14) 96 (5) 54 (12) 59 (8) 81 (6)DMMap 92 (15) 86 (5) 86 (6) 91* (14) 79 (23) 96 (14) 51 (15) 57 (10) 78 (4)Sertraline 82 (6) 89 (11) 96 (5) 73 (18) 82 (17) 93 (17) 90 (16) 73 (3) 82* (11)DDMC 94* (11) 85 (7) 88 (6) 85 (15) 87 (19) 97 (10) 69 (10) 69 (5) 74 (8)DMC 80 (13) 88 (4) 90 (5) 84 (15) 82 (13) 96 (5) 66 (4) 69 (3) 68* (4)Paroxetine 94 (11) 91 (2) 95 (2) 92 (18) 81 (12) 95 (4) 72 (11) 73 (7) 80 (6)*n=5
Recovery (%) (RSD%)
Low 51*
Mid HighLow Mid HighPlasma Blood Brain
Mid High S.High
ADs recoveries from plasma and blood are determined at low (20 ng/ml), mid
(200 ng/ml) and high (500 ng/ml) concentrations, while brain tissue
recoveries were determined at mid, high and super high concentration (1000
ng/g). This super high level was chosen as brain concentrations found in
literature were much higher than blood or plasma concentrations [45-47].
- 249 -

Chapter VI: Validation
- 250 -
The extraction efficiencies for brain tissue are slightly lower than for plasma
and blood. Especially venlafaxine and fluvoxamine gave low extraction
efficiencies. However, recovery of the ADs from brain tissue is reproducible.
Recovery of ADs from hair is not determined as spiked samples do not reflect
reality. Compounds are incorporated in the interior of the hair through
diffusion from blood, sweat or sebum. When samples are spiked, the
compounds are spiked onto the hair and this would lead to false high
recoveries.
VI.3.3. Selectivity
VI.3.3.1. Experimental
Selectivity, defined as the ability to differentiate and quantify the analyte in
the presence of other components in the sample, was evaluated by analyzing
blank plasma samples of 10 different individuals to observe possible co-
eluting interferences in EI, PICI, and NICI. Blank samples of whole blood
were obtained from five healthy volunteers. For brain tissue three individuals
were tested at six different locations, i.e. cerebellum, the brain stem, the
frontal, temporal, parietal, and occipital lobe. These locations were selected
as the structure of the lobes, cerebellum and brain stem differ from each
other. Two blank hair samples were also checked. The selectivity of the post-
mortem matrices was analyzed in PICI mode only.
In addition, zero samples (I.S. spiked to blank plasma) were analyzed to
check for absence of analyte ions in the peak of the I.S.
VI.3.3.2. Results and discussion
Ten blank plasma samples were checked for interferences and thus selectivity
of the method. In EI, a lot of endogenous compounds are seen in the
chromatogram, but most of them are chromatographically separated and
they do not interfere with quantification. However, only 10 blank samples
were screened for interferences, and these are most likely to occur for
compounds with the ion m/z 58 as quantifier ion as this ion is very unspecific.
The CI-techniques have more selectivity; however, in PICI an interference
was seen for venlafaxine in plasma, blood and brain tissue. In NICI, no
interferences were detected.

Chapter VI: Validation
Figure VI.2. Overlays of blank chromatograms with a trace of a low
concentration mixture (20 ng / 200 ng for brain tissue) in plasma (A), whole
blood (B), brain tissue (C). For hair samples (D) blanks in the 2 extraction
modes are shown.
Aa, plasma in PICI; Ab, plasma in NICI; Ac plasma in EI. D; full line: blank hair using sodium hydroxide; dotted line, blank hair using phosphate buffer. Chromatograms are set to the same scale to compare in selectivity and sensitivity, except for Ac. Total ion currents of all monitored ions in SIM are shown in the chromatograms. 1, venlafaxine; 2, m-chlorophenylpiperazine; 3, desmethylfluoxetine; 4, viloxazine; 5, fluvoxamine, 6, fluoxetine, 7, fluoxetine-d6, 8, mianserin, 9, mianserin-d3; 10, mirtazapine, 11, melitracen, 12, desmethylmianserine, 13, desmethylsertraline; 14, desmethyl-mirtazapine; 15, reboxetine; 16, citalopram; 17, desmethylmaprotiline; 18, maprotiline; 19, sertraline; 20, didesmethylcitalopram; 21, desmethylcitalopram; 22, paroxetine; 23, paroxetine-d6
A
- 251 -
Aa
13,14,15,16
8.00 10.00 12.00 14.00 16.00 18.00 20.00 22.00 24.000
500
1000
1500
2000
2500
3000
3500
4000
4500
5000
5500
6000
6500
7000
7500
8000
8500
9000
9500
10000
10500
11000
Time-->
bundance
1
2
3, 4
5
6, 7
8,9
10 11
12
22, 23
20 21 17
19 18
A
A
8.00 10.00 12.00 14.00 16.00 18.00 20.00 22.00 24.000
500
1000
1500
2000
2500
3000
3500
4000
4500
5000
5500
6000
6500
7000
7500
8000
8500
9000
9500
10000
10500
bundance
Ab 6,7
Time-->
2 3, 4
5
12 14
15
17
18,19,20,21
13 22, 23

Chapter VI: Validation
- 252 -
8.00 10.00 12.00 14.00 16.00 18.00 20.00 22.00 24.00
20000
40000
60000
80000
100000
120000
140000
160000
180000
200000
220000
240000
260000
280000
300000
320000
Time -- >
Abundance
2 13,
4
5
6,7
8,9
10 11
22, 23
13,14,15,16
12
17,18,19, 20,21
Ac
B
8.00 10.00 12.00 14.00 16.00 18.00 20.00 22.00 24.00
500
1000
1500
2000
2500
3000
3500
4000
4500
5000
5500
6000
6500
7000
7500
8000
8500
9000
9500
10000
Time-->
Abundance
1
2
3, 4 5
6, 7
8, 9
10 11
22, 23
20 21
18 19 17
12
13,14,15,16
C
8.00 10.00 12.00 14.00 16.00 18.00 20.00 22.00 24.00
0
500
1000
1500
2000
2500
3000
3500
4000
4500
5000
5500
6000
6500
7000
7500
8000
8500
9000
9500
10000
bundanceA
Time-->
6, 7
8,
1
25
910
11
22, 23
2021
18,19
17
12
13,14,15,16
Frontal lobe
Parietal lobe
Occipital lobe 3,4
Cerebellum Temporal lobe
Brain stem

Chapter VI: Validation
D
8.00 10.00 12.00 14.00 16.00 18.00 20.00 22.00 24.00
0
500
1000
1500
2000
2500
3000
3500
4000
4500
5000
5500
6000
6500
7000
7500
8000
8500
9000
9500
10000
10500
Time-->
Abundance
22, 23
6,7
2
3,4
518, 19
8,9
10
12,13,14,15,16
Zero-plasma samples spiked with each I.S. separately were analyzed for
analyte ions. The fragmentation patterns of the deuterated standard were
checked for the molecular ion of their non-deuterated analogues. The spectra
of fluoxetine-d6, paroxetine-d6 and mianserin-d3 contained respectively 0.75,
0.26 and 1.88 % of the quantifier ion of their non-deuterated analogue in EI
mode. In PICI mode, the fluoxetine-d6 spectrum contained 0.4% of the
quasi-molecular ion of fluoxetine, while the paroxetine-d6 spectrum contained
0.2% of its non-deuterated form. These low percentages of non-deuterated
forms did not interfere with the quantification. However, mianserin-d3
fragmentation led to a relative high abundant quasi-molecular ion of
mianserin (9.8%), which was demonstrated by the positive intercept of the
calibration curve for mianserin. In NICI mode, mianserin-d3 is not detected
as it contains no electronegative moieties. Fluoxetine-d6 and paroxetine-d6
fragmentation resulted in 0.02 and 0.06 % of their non-deuterated analogue
in their spectrum, respectively.
VI.3.4. Linearity
VI.3.4.1. Experimental
Quantification was based on target ion/I.S. ratios (Table VI.1.). Therefore,
seven-point curves for plasma, whole blood or hair and 6 point-curves for
brain tissue were constructed using internal standardization. Calibration
- 253 -

Chapter VI: Validation
- 254 -
ranged from the sub therapeutic (10 ng/ml) till high therapeutic
concentration (500 ng/ml) of the individual ADs in plasma and blood. For
brain tissue, calibration ranged from 50 till 1000 ng/g. Calibrator samples
were fortified blank matrix samples and were treated in a way similar to the
unknowns. Hair samples were quantitated using a calibration curve from pure
standards ranging from 10 till 500 ng/ml.
The weighting factor and regression type were applied to the data of plasma
samples through the least percentage relative error (%RE), which is the
regressed concentration minus the nominal standard concentration divided by
the nominal standard concentration. The sum of the squares of the %RE of
all data points for a given curve estimation was calculated, in order to
facilitate comparison [48, 49].
VII.3.4.2. Results and discussion
For determination of the most appropriate calibration curve, both calibration
curve equation type (linear versus quadratic) and weighting factor were
considered. Primarily, data heteroscedasticity was shown for all analytes by a
F-test on the lowest and the highest concentration level, at the 99%
confidence level. Secondly, the most appropriate calibration curve equation
was determined by calculating the percent relative error at each calibrator
level and for each compound.
The %RE is the percent deviation of the experimental value calculated with
the Chemstation software from the nominal value. At each of the 7 calibrator
levels, three %RE values were obtained, originating from the experiment
being performed in triplicate. All %RE values were converted into positive
values if necessary and the sum of the squares of the 3 values was calculated
for each calibrator. These 3 values were summed up for all compounds at all
levels, and this final sum for each calibrator type is shown in Table VI.4. The
calibration type with the lowest value is considered to be the best fit for our
data.

Chapter VI: Validation
Table VI.4. Sum of % Relative Error for each type of calibration curve in the
different ionization modes
EI PICI NICIlinear 5069 46907 23323linear, 1/x 3305 17680 6662linear, 1/x2 3153 11335 4561
quadratic / 21324 15299quadratic, 1/x / 7274 4629quadratic, 1/x2 / 4909 3695
Ionization modeCalibration curveSum % Relative Error
A linear curve with a 1/x2-weighting factor was applied for the EI results. For
PICI and NICI, a second-order polynomial function with a weighting factor of
1/x2 provided better equations and resulted in least sum of residual squares.
Especially for PICI, a large difference was seen in the sum of residual
squares. Small deviations from linearity caused by curvature are often
noticed for data obtained by chromatographic analysis. Nevertheless,
traditionally, linear curves are more commonly used as compared to
quadratic curves. This is mainly because of the level of complexity of the
latter, especially from a historical point of view, as the appropriate software
to perform the complicated calculation was not available. Nowadays, most
analytical software includes the option of quadratic calibration and statistical
software is more accessible. Thus, quadratic calibration curves provide a tool
to account for curvature and can provide higher quality data when used
appropriately. In addition, Kirkup and Mulholland conclude that a slight
curvature in calibration data is often noticed and the choice of calibration
curves depends upon the analyst’s requirements and desired constraints
about quantities as the prediction interval for estimated analyte
concentrations [49]. Although the deviations from linearity for most
compounds are small in PICI and NICI, as can be derived from the low
quadratic term representing the bending of the curve (Table VI.5.), quadratic
regression resulted in a lower %RE. In NICI, quadratic regression resulted in
better inter batch precision and accuracy for highly concentrated samples. In
- 255 -

Chapter VI: Validation
EI, no curvature is detected as seen in Figure VI.3., and therefore the
simplest approach, thus the linear regression was chosen.
Figure VI.3. Representative calibration curves in EI, PICI and NICI for
desmethylmirtazapine
Each curve has a weighting factor of 1/x2
Calibration curve desmethylmirtazapine EI
y = 0,0052x + 0,008R2 = 0,9998
0
0,5
1
1,5
2
2,5
3
0 100 200 300 400 500 600
Concentration (ng/ml)
Area
/I.S
. rat
io
Calibration curve desmethylmirtazapine PICI
y = 0,0086x - 0,2765R2 = 0,9856
y = 7E-06x2 + 0,005x - 0,0813R2 = 0,9976
-1
0
1
2
3
4
5
0 100 200 300 400 500 600
Concentration (ng/ml)
Are
a/I.S
. rat
io
Calibration curve desmethylmirtazapine NICI
y = 0,0015x - 0,028R2 = 0,9763
y = 2E-06x2 + 0,0007x + 0,0005R2 = 0,9974
-0,1
0
0,1
0,2
0,3
0,4
0,5
0,6
0,7
0,8
0,9
0 100 200 300 400 500 600
Concentration (ng/ml)
Are
a/I.S
. rat
io
- 256 -

Chapter VI: Validation
- 257 -
It seems that the slight curvature in the calibration data is dependent on the
type of ionization. Chaler et al. also described polynomial calibration data for
the chemical ionization modes and these data seem to depend on the type of
mass spectrometer, i.e. differences in ion source construction (such as path
length of the ion source), the eventual contamination of the ion source, and
tuning parameters [50]. Moreover, variations in CI mass spectra resulting
from changes in sample concentration and from co-eluting electron capturing
agents have been observed [42, 51]. These variations are not caused by
increased pressure in the source while the compounds pass through, but
probably because of an increase in the residence time of ions within the
source due to electronegative compounds. Rudewicz et al. [51] state that
under the conditions of high pressure and high electron current, positive ions
and negative particles diffuse together at the ambipolar diffusion rate (to the
source walls). When electron capturing compounds enter the source, the
rapidly moving electrons are converted into much more slowly moving
negative ions, thus decreasing the ambipolar diffusion rate and increasing the
residence time of ions within the source. This enhances positive reagent ion
abundance and an increase in the extent of conversion of reactant ions to
sample ions. Perhaps, this phenomenon could explain the non-linear
response seen in CI mode as HFBI-derivatized sample compounds and
endogenous compounds are strong electronegative substances.
Finally, for assessment of the correct weighting factor the strategy reported
by Almeida and co-workers [48] was followed. The choice of the weighting
factor was based on the sum of all %RE values. After comparison of 1/x and
1/x2 weighted regressions, 1/x2 was chosen because it resulted in improved
calibration results.
Best fit calibration curves and the variations are indicated in Table VI.5. While
EI calibration curves are stable for at least one week and show less variation,
daily calibration curves for chemical ionization modes are suggested as
differences in source contamination can lead to different results.

Chapter VI: Validation
Table VI.5. Calibration curve data obtained in plasma (EI, PICI and NICI
mode; n=7), blood and brain tissue (PICI mode; n=5)
Linearity Electron Ionizationplasma linear curve 1/x2
best fit 95% CI CV% best fitVenlafaxine 0.019479 0.018763 - 0.020194 5 0.027357 0.007274 - 0.047441m-cpp 0.004428 0.004213 - 0.004643 7 -0.001340 -0.011150 - 0.008464Viloxazine 0.003513 0.003382 - 0.003646 5 0.0010533 -0.000827 - 0.002934DMFluoxetine 0.004072 0.003781 - 0.004363 10 0.004882 -0.001530 - 0.011296Fluvoxamine 0.001666 0.001493 - 0.001840 14 -0.000121 -0.003096 - 0.002853Fluoxetine 0.005009 0.004940 - 0.005077 2 0.010610 0.005668 - 0.015552Mianserin 0.004731 0.004610 - 0.004851 3 0.018086 0.016214 - 0.019957Mirtazapine 0.014250 0.014049 - 0.014451 2 0.019407 0.007985 - 0.030829Melitracen 0.021836 0.021469 - 0.022202 2 0.008699 -0.008410 - 0.004479DMMia 0.006421 0.006186 - 0.006657 5 0.011116 0.006672 - 0.023142DMSer 0.006643 0.006308 -0.006978 7 0.012372 -0.000543 - 0.017786DMMir 0.003883 0.003757 - 0.004009 4 0.005640 0.001475 - 0.009831Reboxetine 0.011757 0.011574 - 0.011940 2 0.005197 0.001367 - 0.009067Citalopram 0.016250 0.015027 - 0.017473 10 0.030432 -0.057140 - -0.012050DMMap 0.009857 0.009153 - 0.010561 10 0.009317 0.006165 - 0.019969Maprotiline 0.014071 0.013691 - 0.014451 4 0.010312 0.011314 - 0.026592Sertraline 0.002588 0.002342 - 0.002833 13 0.006739 -0.004163 - 0.005821DDMC 0.01630 0.0151060 - 0.17540 10 0.016748 -0.013366 - 0.011448DMC 0.032779 0.032313 - 0.033244 2 0.028201 -0.013220 - 0.028559Paroxetine 0.005024 0.004945 - 0.005102 2 0.002290 0.004639 - 0.008032
Slope y-intercept95% CI
0.9940.996
0.9930.9940.9890.991
0.9930.9920.9960.991
0.9940.9960.9950.992
0.9920.9930.9920.995
C of determinationR2
0.9900.987
Linearity Positive Chemical Ionizationplasma quadratic curve 1/x2
best fit best fit best fitVenlafaxine 0.00000124 0.00000108 - 0.0000139 0.000350 0.000301 - 0.000399 0.001622 0.000183 - 0.003062m-cpp 0.00000599 0.00000540 - 0.00000658 0.002810 0.002615 - 0.003005 0.004799 -0.002278 - 0.011876Viloxazine 0.00000755 0.00000672 - 0.00000839 0.001280 0.001155 - 0.001405 0.000354 0.000268 - 0.000976DMFluoxetine 0.00000338 0.00000276 - 0.00000401 0.001863 0.001618 - 0.002108 -0.000720 -0.004651 - 0.003212Fluvoxamine 0.00000029 0.00000023 - 0.00000036 0.000132 0.000109 - 0.000155 0.000107 -0.000281 - 0.000495Fluoxetine 0.00000560 0.00000512 - 0.00000608 0.004262 0.004090 - 0.004435 0.010023 0.005497 - 0.014549Mianserin 0.00000091 0.00000051 - 0.00000130 0.004821 0.004630 - 0.005012 0.094671 0.089759 - 0.099584Mirtazapine 0.00000309 0.00000287 - 0.00000332 0.001851 0.001753 - 0.001949 -0.004877 -0.006333 - -0.003421Melitracen 0.00000181 0.00000164 - 0.00000198 0.000345 0.000322 - 0.000368 0.000310 0.000193 - 0.000426DMMia 0.00000532 0.00000456 - 0.00000608 0.002545 0.002308 - 0.002782 -0.002524 -0.005076 - 0.000028DMSer 0.00000415 0.00000300 - 0.00000531 0.003621 0.003165 - 0.004077 0.003413 -0.003691 - 0.010516DMMir 0.00000586 0.00000494 - 0.00000678 0.002836 0.002529 - 0.003144 -0.012370 -0.016769 - -0.007971Reboxetine 0.00000796 0.00000573 - 0.00001019 0.004611 0.004327 - 0.004894 -0.005180 -0.006864 - -0.003496Citalopram 0.00000974 0.00000879 - 0.00001068 0.003192 0.002840 - 0.003544 -0.011306 -0.015282 - -0.007330DMMap 0.00000187 0.00000102 - 0.00000272 0.002013 0.001790 - 0.002236 0.000678 -0.000771 - 0.002126Maprotiline 0.00000485 0.00000425 - 0.00000545 0.002860 0.001881 - 0.003839 -0.002086 -0.003656 - -0.000515Sertraline 0.00000179 0.00000146 - 0.00000212 0.001966 0.001610 -0.002323 0.002327 -0.003762 - 0.008416DDMC 0.00000362 0.00000253 - 0.00000470 0.000730 0.000593 - 0.000867 0.002276 0.000893 - 0.001899DMC 0.00000653 0.00000596 - 0.00000710 0.000796 0.000728 - 0.000863 0.001396 0.000675 - 0.003876Paroxetine 0.00000625 0.00000486 - 0.00000765 0.004128 0.003996 - 0.004260 0.004914 0.003462 - 0.006367
blood quadratic curve 1/x2
linear term best fit best fit best fit
Venlafaxine 0.00000103 0.00000093 - 0.00000113 0.000319 0.002002m-cpp 0.00000866 0.00000632 - 0.00001099 0.005981 0.005188Viloxazine 0.00001303 0.00001000 - 0.00001605 0.002719 -0.001006DMFluoxetine 0.00000669 0.00000495 - 0.00000843 0.003852 -0.027780Fluvoxamine 0.00000140 0.00000097 - 0.00000183 0.000463 0.004456Fluoxetine 0.00000742 0.00000725 - 0.00000758 0.005361 0.012036Mianserin 0.00000345 0.00000292 - 0.00000397 0.008010 0.094540Mirtazapine 0.00000467 0.00000426 - 0.00000507 0.001804 -0.004271 -0.006270 - -0.002270Melitracen 0.00000188 0.00000173 - 0.00000203 0.000372 0.000429 0.000235 - 0.000622DMMia 0.00000455 0.00000417 - 0.00000492 0.002424 0.000273 -0.00128 - 0.001823DMSer 0.00000946 0.00000446 - 0.00001446 0.011540 -0.000324 0.033720 - 0.033071DMMir 0.00000573 0.00000464 - 0.00000681 0.002898 -0.009352 -0.015360 - -0.003340Reboxetine 0.00000957 0.00000660 - 0.00001253 0.006910 0.008584 0.000886 - 0.016283Citalopram 0.00001299 0.00000987 - 0.00001611 0.006000 -0.021860 -0.025960 - -0.017760DMMap 0.00001179 0.00000840 - 0.00001517 0.008950 -0.001574 -0.011080 - 0.007928Maprotiline 0.00000826 0.00000756 - 0.00000896 0.005222 0.003592 0.000290 - 0.007479Sertraline -0.00000022 0.00000090 - 0.00000045 0.001708 0.001398 - 0.002017 0.010198 0.005693 - 0.014702DDMC 0.00004633 0.00002980 - 0.00006286 0.006266 0.020052 0.001870 - 0.041978DMC 0.00000469 0.00000384 - 0.00000554 0.001603 0.004016 0.003204 - 0.004828Paroxetine 0.00001082 0.00000963 - 0.00001200 0.005560 0.005766 0.003255 - 0.008277
brain quadratic curve 1/x2
linear term best fit best fit best fit
Venlafaxine 0.00000042 0.000609 0.032960m-cpp 0.00000288 0.008320 0.056070Viloxazine 0.00001150 0.008520 -0.043620DMFluoxetine 0.00000220 0.005503 -0.077520Fluvoxamine 0.00000050 0.008020 -0.012876Fluoxetine 0.00000235 0.006700 0.054920Mianserin 0.00000071 0.008860 0.186140Mirtazapine 0.00000074 0.003870 -0.036960Melitracen 0.00000155 0.001565 0.004534DMMia 0.00000053 0.011500 -0.101060DMSer 0.00000641 0.005388 0.046900DMMir 0.00000186 0.006671 -0.078248Reboxetine -0.00000089 0.009475 0.099175Citalopram -0.00000243 0.015560 -0.039100DMMap -0.00000138 0.008380 -0.304200Maprotiline 0.00000103 0.005790 0.012388Sertraline 0.00000511 0.004626 0.137914DDMC 0.00001924 0.003069 0.088974DMC 0.00001098 0.002382 0.047000Paroxetine 0.00000471 0.006440 0.018180
y-intercept
quadratic term
quadratic term
y-intercept
95% CIlinear term
95% CIy-intercept
95% CIquadratic term
-0.006630 - 0.0155450.007663 - 0.0164090.088443 - 0.100637
0.001985 - 0.002779
0,005567 - 0.006013
0.013387 - 0.017733
0.005749 - 0.007594
0.010078 - 0.012922
0.003448 - 0.004292
0.006330 - 0.007070
0.9940.006230 - 0.006650 0.997
0.035464 - 0.0585360.011024 - 0.025336
0.9950.983
0.001658 - 0.004480 0.9960.002931 - 0.006321
0.010343 - 0.0144330.053785 - 0.2220430.036594 - 0.141354
0.008009 -0,008751 0.994-0.401209 - 0.323009-0.047738 - -0.013102
0.009037 - 0.009913 0.991-0.190940 - 0.0344450.078130 - 0.120220
0.004925 - 0.005851 0.992 -0.233092 - 0.0309720.020888 - 0.072912
0.001388 - 0.001742 0.994-0.057910 - -0.016010-0.001701 - 0.010769
0.008351 - 0.009369 0.9960.030333 - 0.0795070.110836 - 0.261444
0.004466 - 0.006540 -0.106269 - -0.048771 0.9970.000599 - 0.001005 0.996-0.022395 - -0.003357
0.007644 - 0.008996 0.9840.007662 - 0.009378 0.989-0.061838 - -0.025402
-0.007817 - 0.119957
95% CI 95% CI R2
0.000273 - 0.000944 0.018082 - 0.047838 0.99095% CI
0.00000018 - 0.00000067
0.994
C of determination
0.998
0.995
0.992
0.990
0.988
0.9890.9570.9950.995
0.9950.9810.9760.975
C of determination
0.9860.9860.9960.9910.9860.9920.9950.993
R2
0.9930.9830.985
0.9890.9960.9940.995
0.9890.9810.9870.988
0.9930.9910.9960.995
0.9890.9940.9940.990
0.9880.9910.9920.990
C of determinationR2
0.001089 - 0.002916-0.011320 - 0.021699
-0.072980 - 0.017421
95% CI0.000288 - 0.000350
0.003193 - 0.0045110.002173 - 0.003265
95% CI
-0.005990 - 0.003983
0.000324 - 0.0004200.001948 - 0.002900
0.002031 - 0.003765
0.000260 - 0.0006670.005129 - 0.0055930.007907 - 0.0081130.001658 - 0.001950
95% CI
0.004532 - 0.0080000.001422 - 0.0017840.005494 - 0.005626
0.005037 - 0.006925
0.006756 - 0.0070640.005002 - 0.0069980.008548 - 0.009352
0.007503 - 0.015577
0.004956 - 0.005488
0.00000115 - 0.000004610.00000970 - 0.000012390.00000192 - 0.000002480.00000042 - 0.000000580.00000166 - 0.000003040.00000028 - 0.000001150.00000032 - 0.000001160.00000121 - 0.00000190-0.00000093 - 0.000002000.00000554 - 0.000007270.00000087 - 0.00000285
-0.00000150 - -0.00000028-0.00000435 - -0.00000051-0.00000227 - -0.000000500.00000032 - 0.000001740.00000361 - 0.000006610.00001491 - 0.000023570.00001002 - 0.000011940.00000393 - 0.00000548
- 258 -

Chapter VI: Validation
Linearity Negative Chemical Ionizationplasma quadratic curve 1/x2
best fit best fit best fitm-cpp 0.00000147 0.0034 0.002967 - 0.003833 0.000465 -0.000629 - 0.001559Viloxazine 0.00000199 0.000755 0.000718 - 0.000792 0.000298 0.000041 - 0.000554DMFluoxetine 0.00000051 0.0010 0.000896 - 0.001133 0.000760 0.000148 - 0.001372Fluvoxamine 0.00000036 0.0044 0.004062 - 0.004732 0.001318 -0.000498 - 0.003134Fluoxetine 0.00000068 0.0042 0.003917 - 0.004483 0.045971 0.001915 - 0.007279DMMia 0.00000364 0.001106 0.001050 - 0.001161 0.000211 -0.000185 - 0.000607DMSer 0.00002343 0.023086 0.020551 - 0.025620 0.015154 -0.000808 - 0.031117DMMir 0.00000271 0.000514 0.000484 - 0.000544 0.000196 -0.000048 - 0.000441Reboxetine 0.00000700 0.002714 0.002430 - 0.002998 0.001684 0.000267 - 0.003101DMMap 0.00000274 0.001682 0.001508 - 0.001856 0.000369 -0.000165 - 0.000902Maprotiline 0.00001386 0.005251 0.005017 - 0.005486 0.002071 -0.000108 - 0.004249Sertraline 0.00000392 0.002794 0.002552 - 0.003036 0.005209 0.002161 - 0.008256DDMC 0.00008010 0.036670 0.024920 - 0.048420 -0.005964 -0.018890 - 0.006963DMC 0.00002294 0.014074 0.012949 - 0.015200 0.001354 -0.001767 - 0.004475Paroxetine 0.00000583 0.005757 0.005406 - 0.006108 0.001710 0.000559 - 0.002862
quadratic term linear term y-intercept
0.992
0.9880.9730.9870.992
0.9890.9900.9860.987
0.9920.9890.9960.991
R2
0.9900.991
C of determination95% CI
0.00000343 - 0.00000384 0.00001349 - 0.00003337 0.00000250 - 0.00000292
0.00000067 - 0.00000227 0.00000191 - 0.00000207 0.00000039 - 0.00000064 -0.00000021 - 0.00000093
0.00005262 - 0.00010757 0.00002040 - 0.00002548 0.00000493 - 0.00000674
95% CI95% CI
0.00000606 - 0.00000794 0.00000207 - 0.00000342 0.00001266 - 0.00001506 0.00000223 - 0.00000561
0.00000345 - 0.00000446
VI.3.5. Sensitivity
VI.3.5.1. Experimental
The sensitivity of the method was evaluated by determining the limit of
quantification (LOQ). LOQ was defined as the lowest standard, spiked to the
matrix, with a signal-to-noise ratio � 10, an acceptable precision (RSD less
than 20%) and accuracy (80-120%). This parameter was evaluated in SIM
total ion mode (quantifier and qualifiers monitored). Six or five repetitions
were applied in plasma and post-mortem samples (blood and brain),
respectively.
VI.3.5.2. Results and discussion
All LOQs indicated in Table VI.6. gave a S/N > than 10. In addition, the
precision and accuracy were also determined for these concentrations in
plasma, blood and brain tissue. The LOQs in plasma ranged from 5 till 12.5
ng/ml, however, for mianserin and sertraline the accuracy did not meet the
criteria and therefore the LOQs should be 20 and 25 ng/ml. The LOQs of all
ADs show that the sensitivity even for subtherapeutic concentrations is
adequate when monitoring plasma concentrations. The LOQ value for the
compounds in PICI is not better than in EI, because in addition to the quasi-
molecular ions, only low abundance fragment ions are created, leading to a
loss in sensitivity as the qualifiers are not detected anymore. NICI is much
more sensitive as compared to EI and PICI. The sample loaded on the SPE-
tubes was downsized from 1 ml to 250 μl, because of the enhanced
sensitivity of the system. This can be an advantage in clinical analysis where
sample volume can be a limiting factor. The sensitivity for plasma samples is,
however, worse than for pure standards, probably due to derivatization of
endogenous molecules, increasing the background signal. While the - 259 -

Chapter VI: Validation
concentrations shown in Table VI.6. for NICI mode gave a S/N> 10 and an
acceptable intra batch precision and accuracy, the inter batch precision
results for most compounds did not fulfil the <20% variation criterion. A LOQ
of 2.5-6.25 ng/ml depending on the compound would give better inter batch
precision results.
Table VI.6. Limit of quantification in plasma, blood and brain tissue * n-1
Blood (ng/ml) Brain (ng/g) Blood (ng/ml) Brain (ng/g)compound EI PICI NICI PICI PICI EI (n=6) PICI (n=6) NICI (n=6) PICI (n=5) PICI (n=5)venlafaxine 10 10 20 50 92 93* 109 85m-cpp 10 10 2 10 50 101 101* 85 107 103viloxazine 5 5 1 5 25 98 101 90 115 102DMFluox 12.5 12.5 2.5 12.5 62.5 100 97 104 109 101fluvoxamine 12.5 12.5 2.5 12.5 62.5 91 86* 86 105 101fluoxetine 12.5 12.5 2.5 12.5 62.5 94 98 97 111 98mianserin 10 10 20 50 131 134 79 99mirtazapine 10 10 10 50 92 100 110 103melitracen 5 5 10 25 104 95 110 100DMMia 10 10 2 20 50 89 93 95 98 99DMSer 10 10 2 10 50 91 104* 112 75 100DMMir 10 10 2 20 50 117 118 101 96 107reboxetine 5 5 1 5 25 92 99 81 111 96citalopram 10 10 10 50 103 104 101 81DMMap 6 6 1.2 6 30 113 102 105 114 104maprotiline 6 6 1.2 6 30 89 99 112 108 97sertraline 12.5 12.5 2.5 25 62.5 108 103 85 117 100DDMC 5 5 1 10 25 135 118 80 83 100DMC 5 5 1 5 25 95 79 83 113 102paroxetine 5 5 1 5 25 101 100 97 106 99
Blood (ng/ml) Brain (ng/g) Blood (ng/ml) Brain (ng/g)compound EI (n=5) PICI (n=5) NICI (n=5) PICI (n=5) PICI EI (n=6) PICI (n=6) NICI (n=6) PICI (n=5) PICI (n=5)venlafaxine 9 13 15 15 17 23* 14 3m-cpp 7 13 7 14 10 20 16* 33 3 2viloxazine 4 9 9 12 15 7 8 25 9 3DMFluox 5 4 5 8 11 15 19 28 6 1fluvoxamine 5 7 6 10 10 19 17 27 3 2fluoxetine 1 4 7 3 3 9 8 24 1 0.5mianserin 10 4 2 4 12 11 10 2mirtazapine 7 10 12 9 8 9 7 1melitracen 4 18 8 17 9 19 14 3DMMia 11 10 4 14 21 19 15 20 6 2DMSer 6 6 7 11 17 12 22* 22 4 2DMMir 9 8 5 22 12 9 14 25 9 3reboxetine 2 4 13 9 27 14 14 35 3 16citalopram 11 8 13 23 17 5 3 4DMMap 4 6 10 14 13 1 33 11 4 6maprotiline 2 6 4 14 8 9 18 40 4 7sertraline 8 14 13 11 15 27 37 26 16 8DDMC 8 16 2 18 6 18 30 20 9 6DMC 3 9 4 16 7 19 32 43 5 5paroxetine 2 2 4 11 4 13 16 12 3 1
LOQ Accuracy (%)
Intra batch precision (RSD%)Plasma (ng/ml)
Inter batch precision (RSD%)
Plasma (ng/ml)Spiked concentration
Plasma (ng/ml)
Plasma (ng/ml)
While the LOQs in blood are higher for some compounds than in plasma,
sensitivity, even for subtherapeutic concentrations, is adequate for most
compounds. For brain tissue, citalopram and reboxetine demonstrated a
variation in precision at the LOQ level above 20% at the indicated spiked
concentrations (25-62.5 ng/g). However, the concentration in brain tissue is
- 260 -

Chapter VI: Validation
- 261 -
usually much higher in patients with therapeutic drug levels in blood, thus
sensitivity for most compounds will not be a problem. LOQ was not checked
for hair samples as spiking onto hair does not reflect the incorporation in the
hair structure.
VI.3.6. Precision
VI.3.6.1. Experimental
Precision was evaluated over the linear dynamic range at three different
levels, i.e. 20 (low), 200 (medium), and 500 ng (high) for 1 ml plasma and
blood. For brain tissue the concentrations were 200, 500 and 1000 ng/g.
Intra and inter batch precision in plasma was assessed by six determinations
per concentration in one day or on six separate days, respectively, and was
measured using RSD. For the post-mortem matrices, 5 repetitions for intra
and inter batch precision were performed.
VI.3.6.2. Results and discussion
The intra batch precision in plasma of all compounds fulfilled the acceptance
criteria for all concentrations in EI as well as CI modes. For inter batch
precision, venlafaxine gave bad results in PICI, possibly due to interference
of a co-eluting peak. m-Chlorophenylpiperazine showed a high variation at
low concentration, but fulfilled the criteria at medium and high concentrations
in EI and CI modes. The inter batch precision for sertraline and DDMC was
not acceptable over the total concentration range in NICI mode.
In blood, the intra and inter batch precision was acceptable for all
compounds, however, the inter batch variation for sertraline is rather high.
Intra batch precision for brain tissue samples was acceptable, except the
intra batch precision for citalopram at low concentration.

Chapter VI: Validation
Table VI.7. Precision data *n-1
Plasma Low Mid High EI PICI NICI EI PICI NICI EI PICI NICI EI PICI NICI EI PICI NICI EI PICI NICI
Venlafaxine 20 200 500 3 7 5 8 1 8 14 30 5 24 9 4m-cpp 20 200 500 3 6 6 7 7 10 6 4 3 18 31 14 9 11 15 11 10 17Viloxazine 10 100 250 3 5 6 3 2 9 3 2 8 10 11 13 6 5 7 5 4 6DMFluox 25 250 625 11 11 11 12 11 11 6 4 10 12 10 13 14 14 11 10 14 12Fluvoxamine 25 250 625 10 11 11 14 13 14 5 4 9 12 12 14 12 12 9 9 14* 12Fluoxetine 25 250 625 4 3 3 4 4 5 5 4 3 7 6 8 5 6 5 2 4 6Mianserin 20 200 500 4 5 5 5 3 3 6 5 6 8 3 5Mirtazapine 20 200 500 4 3 5 3 3 2 6 7 7 7 2 3Melitracen 10 100 250 7 10 5 6 1 4 5 11 4 10 2 4DMMia 20 200 500 8 6 4 4 3 11 1 2 8 13 9 11 7 7 9 5 6 6DMSer 20 200 500 7 12 13 9 12 11 8 7 4 10 15* 12 6 26 15 15 7* 17DMMir 20 200 500 6 6 2 4 4 10 2 2 11 14 7 11 8 9 8 5 4 10Reboxetine 10 100 250 4 4 5 3 5 6 1 4 8 7 8* 16 5 6 6 3 5 7Citalopram 20 200 500 11 7 8 4 3 4 10 13 8 14* 7 5DMMap 12 125 300 3 11 7 8 12 7 5 6 7 12 12 9 12 15 13 11 12* 15Maprotiline 12 125 300 5 7 3 3 6 3 3 4 5 8 9 8 7 9 4 4 6 7Sertraline 25 250 625 8 10 10 7 10 7 7 8 9 13 10* 31 12 15* 33 12 14* 38DDMC 10 100 250 7 10 11 9 12 9 5 9 8 14 10 43 9 10* 37 8 11* 52DMC 10 100 250 7 9 7 2 3 4 1 3 3 12 9 8 5 7 6 4 3 7Paroxetine 10 100 250 6 7 3 4 4 8 2 3 6 11 5 12 5 7 7 1 4 5
Blood Low Mid High
Venlafaxine 20 200 500m-cpp 20 200 500Viloxazine 10 100 250DMFluox 25 250 625Fluvoxamine 25 250 625Fluoxetine 25 250 625Mianserin 20 200 500Mirtazapine 20 200 500Melitracen 10 100 250DMMia 20 200 500DMSer 20 200 500DMMir 20 200 500Reboxetine 10 100 250Citalopram 20 200 500DMMap 12 125 300Maprotiline 12 125 300Sertraline 25 250 625DDMC 10 100 250DMC 10 100 250Paroxetine 10 100 250
Brain Low Mid High
Venlafaxine 200 500 1000m-cpp 200 500 1000Viloxazine 100 250 500DMFluox 250 625 1250Fluvoxamine 250 625 1250Fluoxetine 250 625 1250Mianserin 200 500 1000Mirtazapine 200 500 1000Melitracen 100 250 500DMMia 200 500 1000DMSer 200 500 1000DMMir 200 500 1000Reboxetine 100 250 500Citalopram 200 500 1000DMMap 125 300 600Maprotiline 125 300 600Sertraline 250 625 1250DDMC 100 250 500DMC 100 250 500Paroxetine 100 250 500
Precision
9
9
8
Mid (n=6)
Intra batch (RSD%)High (n=5)
High (n=6)
Low (n=5)PICI
614
10
117
8
11 9 8
4
1315 10
2111
7
13
10
7
12
1118
7
10
9
112
8
6
9
9
5
Low (n=5)Intra batch (RSD%)
15 7
12
PICI
6
22
5113
3
4
2
10
16
10
3
8
53
13
9
349
513
1
5
61911
3
822
8
11
Inter batch (RSD%)
51
High (n=5)PICIPICIPICI
14 14
14
612
Mid (n=5)
32
123
14
Spiked concentration (ng/ml)
Spiked concentration (ng/ml)
Mid (n=5)PICI
13
14
49
Inter batch (RSD%)Low (n=6) Mid (n=6)
3
45
0.5
123
6
Spiked concentration (ng/g)
6
3
8
12
49
High (n=6)
11
4
13
Low (n=5)
2248
14
High (n=5) Low (n=5)
22
8
5
Inter batch (RSD%)
7
Intra batch (RSD%)
312
Mid (n=5) High (n=5)PICI PICI PICI PICI PICI PICI
Low (n=5) Mid (n=5)
14 110 15 7 4 7 3
5 113 156 13 11 2
9 5
3 8 9 11
10 17 7 8 6
13 13 1
5 44 3
11 5 7 47 10
3 6 5 6
3 614 3 13 2
5 32 4
13 28 109 3 12 12
14 6
11 7 12 15
4 312 11 12 10
9 710 3
6 216 134 8 14 12
15 4
4 2 9 7
3 0.56 7 15 7
7 110 3
6 115 1314 11 10 5
12 4
13 12 2 5 14
VI.3.7. Accuracy
VI.3.7.1. Experimental
Accuracy was evaluated with separately prepared individual primary stock
solutions, mixtures and working solutions of all standards. It was calculated
over the linear dynamic range at three different concentration levels, i.e. low,
medium, and high. The analyte concentrations were calculated from daily
- 262 -

Chapter VI: Validation
calibration curves and the accuracy was calculated by the ratio of this
calculated concentration versus the spiked concentration.
VI.3.7.2. Results and discussion
The low concentrations were underestimated for most of the compounds in
EI, PICI and NICI mode in plasma. While didesmethylcitalopram was
overestimated in plasma at mid and high concentrations in EI and PICI mode,
it was underestimated in NICI mode. However, an acceptable accuracy was
seen for most compounds in all three matrices and ionization modes (Table
VI.8.).
In blood, the low concentrations were again underestimated. This
phenomenon was not seen in brain tissue. Maybe the underestimated values
for the low concentration samples in plasma and blood are due to the surface
of the laboratory glassware, which is slightly acidic and can adsorb ADs as
they are amines. Therefore, silanized glassware could be used or a small
amount of an alcohol such as butanol (1%) could be added to the
redissolving solvent to reduce this adsorption by competition for the
adsorptive sites on the glass surface.
Table VI.8. Accuracy data *n-1
Low Mid High Low Mid High EI PICI NICI EI PICI NICI EI PICI NICI
Venlafaxine 20 200 500 81 76 98 102 106 97m-cpp 20 200 500 88* 101 83 106 110 92 114 108 108Viloxazine 10 100 250 85 85 75 105 106 85 110 102 91DMFluox 25 250 625 89 83 84 104 107* 98 105 99 100Fluvoxamine 25 250 625 84 78 80 107 92 93 107 107* 100Fluoxetine 25 250 625 82 83 89 93 93 95 99 98 101Mianserin 20 200 500 112 114* 127 128 135 132Mirtazapine 20 200 500 82 76 89 93 94 90Melitracen 10 100 250 87 82 101 96 105 98DMMia 20 200 500 86 81 83 99 99 88 103 101 94DMSer 20 200 500 88* 77* 90 101* 86 108 99 98* 98DMMir 20 200 500 103 91 86 107 107 87 113 107 93Reboxetine 10 100 250 83 76* 77 98 100 90 104 99 91Citalopram 20 200 500 77 76 98 96* 105 85DMMap 12 125 300 116* 87 81 112 108 100 106 108 89Maprotiline 12 125 300 84 79 82 89 90 100 94 90* 101Sertraline 25 250 625 91* 94* 94 99 94* 85 123 115* 94DDMC 10 100 250 116 113 55 138 125* 64 139 128* 54DMC 10 100 250 86* 81 80 97 88 92 99 95 96Paroxetine 10 100 250 93 89 81 97 99 89 105 104 93
Plasma Spiked concentration (ng/ml) (n=7; NICI n=6)
- 263 -

Chapter VI: Validation
Low Mid High
Venlafaxine 20 200 500m-cpp 20 200 500Viloxazine 10 100 250DMFluox 25 250 625Fluvoxamine 25 250 625Fluoxetine 25 250 625Mianserin 20 200 500Mirtazapine 20 200 500Melitracen 10 100 250DMMia 20 200 500DMSer 20 200 500DMMir 20 200 500Reboxetine 10 100 250Citalopram 20 200 500DMMap 12 125 300Maprotiline 12 125 300Sertraline 25 250 625DDMC 10 100 250DMC 10 100 250Paroxetine 10 100 250
BloodSpiked concentration (ng/ml)
High PICIPICI PICI
Low Mid
71 102 95109 106 101
78 102 94
83 104 94
86 99 9879 98 959211098
96
99100105
10391
93
9775 95
83
109
103101
101
79
8297
109110
85109107
100 98
117
96
99
9510098
83 99 94
(n=5)
74 103 94
75 96
Low Mid High
Venlafaxine 200 500 1000m-cpp 200 500 1000Viloxazine 100 250 500DMFluox 250 625 1200Fluvoxamine 250 625 1200Fluoxetine 250 625 1200Mianserin 200 500 1000Mirtazapine 200 500 1000Melitracen 100 250 500DMMia 200 500 1000DMSer 200 500 1000DMMir 200 500 1000Reboxetine 100 250 500Citalopram 200 500 1000DMMap 125 300 600Maprotiline 125 300 600Sertraline 250 625 1200DDMC 100 250 500DMC 100 250 500Paroxetine 100 250 500
BrainSpiked concentration (ng/g) (n=5)
Low Mid High PICI PICI PICI97 104 10086 96 9688 101 9992 95 9993 102 9890 96 9994 101 9787 94 9794 104 10289 105 10091 100 9590 98 10192 100 10193 105 10094 106 9791 104 98105 104 99115 105 111108 105 10889 98 99
VI.4. Conclusion
A gas chromatographic-mass spectrometric method (GC-MS) for the
simultaneous determination of the ‘new’ ADs (mirtazapine, viloxazine,
venlafaxine, trazodone, citalopram, mianserin, reboxetine, fluoxetine,
fluvoxamine, sertraline, maprotiline, melitracen, paroxetine) and their active
metabolites (desmethylmirtazapine, O-desmethylvenlafaxine, m-chloro-
- 264 -

Chapter VI: Validation
- 265 -
phenylpiperazine, desmethylcitalopram, didesmethylcitalopram, desmethyl-
mianserin, desmethylfluoxetine, desmethylsertraline, desmethylmaprotiline)
is validated in plasma, blood and brain tissue using different ionization
modes.
Sample preparation consisted of a strong cation exchange mechanism and
derivatization with heptafluorobutyrylimidazole. The GC separation was
performed in 24.8 minutes. Identification and quantification were based on
selected ion monitoring in electron and chemical ionization modes. Calibration
by linear and quadratic regression for electron and chemical ionization,
respectively, utilized deuterated internal standards and a weighting factor
1/x2. Limits of quantitation were established between 5-12.5 ng/ml in EI and
positive ion chemical ionization (PICI), and 1-6.25 ng/ml in negative ion
chemical ionization (NICI) for plasma. For blood the limit of quantification
ranged from 5-20 ng/ml in PICI, while the limit of quantification in brain
tissue ranged from 25-62.5 ng/g.
During validation stability, sensitivity, precision, accuracy, recovery, linearity
and selectivity were evaluated for each ionization mode and were
demonstrated to be acceptable for most compounds. While it is clear that not
all compounds can be quantitated either due to irreproducible validation
results and chromatographic problems (trazodone) or due to derivatization
problems (O-desmethylvenlafaxine), this method can quantitate most new
ADs in the therapeutic range in plasma in different ionization modes, and in
blood and brain tissue.
Electron ionization is the traditional method for comprehensive screening
procedures due to the easy library search mechanism. This ionization,
however, leads to high fragmentation of citalopram, melitracen, and
venlafaxine, resulting in the aspecific high abundance quantifier ion at m/z 58
and inherent loss of specificity, especially for demanding matrices such as
post-mortem blood and brain tissue. Chemical ionization (CI) is a ‘softer’
ionization technique, thus providing more selectivity through molecular mass
information. However, due to less fragmentation, the qualifier ions had low
abundancy, leading to loss of sensitivity. NICI leads to improved sensitivity

Chapter VI: Validation
- 266 -
due to heptafluorobutyrylimidazole derivatization, allowing smaller sample
volumes. However, efficient sample preparation stays necessary because of
detectable derivatized endogenous compounds. On the other hand,
underivatized tertiary amines such as citalopram, melitracen, mianserin, and
mirtazapine are not detected.
Chemical ionization modes can surely provide advantages, however, the
system is less robust and harder to optimize. The presence of impurities in
the reagent gas, radical species in the ion source plasma (formed by trace
amounts of oxygen, water or chlorinated solvents), air leaks and interactions
with the ion source walls can lead to variations in spectra and thus difficulties
during analysis. In addition, in routine clinical analysis, changing the EI and
CI source can be time consuming. Therefore, EI is still the ionization mode of
choice in clinical analysis due to time concerns. For routine toxicological
analyses, PICI mode can be of interest when highly fragmented compounds
such as citalopram, venlafaxine and melitracen have to be monitored, but
interferences are still seen for venlafaxine. While the NICI mode leads to loss
of information because it does not detect the underivatized tertiary amine
ADs, it leads to remarkably enhanced sensitivity for the derivatized ADs. This
could be very interesting in clinical analysis and TDM of samples from
children where often only a limited amount of sample is available.
VI.5. References
[1] Murray CJL, Lopez AD. Global burden of disease: a comprehensive assessment of mortality and disability from diseases, injuries, and risk factors in 1990 and projected to 2020, Harvard University Press, Harvard, 1996 (WHO: http://www.who.int/mental_health.)
[2] Sampson SM. Treating depression with selective serotonin reuptake inhibitors: a practical approach. Mayo Clin. Proc. 2001; 76: 739-744
[3] Lundmark J, Bengtsson F, Nordin C, Reis M, Walinder J. Therapeutic drug monitoring of selective serotonin reuptake inhibitors influences clinical dosing strategies and reduces drug costs in depressed elderly patients. Acta Psychiatr. Scand. 2000; 101: 354-359
[4] Burke MJ, Preskorn SH. Therapeutic drug monitoring of antidepressants - Cost implications and relevance to clinical practice. Clin. Pharmacokinet. 1999; 37: 147-165
[5] Mitchell PB. Therapeutic drug monitoring of psychotropic medications. Br. J. Clin. Pharmacol. 2000; 49: 303-312

Chapter VI: Validation
- 267 -
[6] Mitchell PB. Therapeutic drug monitoring of non-tricyclic antidepressant drugs. Clin. Chem. Lab. Med. 2004; 42: 1212-1218
[7] Eap CB, Sirot EJ, Baumann P. Therapeutic monitoring of antidepressants in the era of pharmacogenetics studies. Ther. Drug Monit. 2004; 26: 152-155
[8] Heller S, Hiemke C, Stroba G, Rieger-Gies A, Daum-Kreysch E, Sachse J, Hartter S. Assessment of storage and transport stability of new antidepressant and antipsychotic drugs for a nationwide TDM service. Ther. Drug Monit. 2004; 26: 459-461
[9] de Meester A, Carbutti G, Gabriel L, Jacques JM. Fatal overdose with trazodone: Case report and literature review. Acta Clin. Belg. 2001; 56: 258-261
[10] Azaz-Livshits T, Hershko A, Ben-Chetrit E. Paroxetine associated hepatotoxicity: A report of 3 cases and a review of the literature Pharmacopsychiatry 2002; 35: 112-115
[11] Goeringer KE, McIntyre IM, Drummer OH. Postmortem tissue concentrations of venlafaxine. Forensic Sci. Int. 2001; 121: 70-75
[12] Goeringer KE, Raymon L, Christian GD, Logan BK. Postmortem forensic toxicology of selective serotonin reuptake inhibitors: A review of pharmacology and report of 168 cases. J. Forensic Sci. 2000; 45: 633-648
[13] Kelly CA, Dhaum N, Laing WJ, Strachan FE, Good AM, Bateman DN. Comparative toxicity of citalopram and the newer antidepressants after overdose. J. Toxicol.-Clin. Toxicol. 2004; 42: 67-71
[14] Adson DE, Erickson-Birkedahl S, Kotlyar M. An unusual presentation of sertraline and trazodone overdose. Ann. Pharmacother. 2001; 35: 1375-1377
[15] Decision Resources Inc. The Antidepressant Market through 2014 - Focus on emerging therapies and new indications. Cognos Plus Study no 11, Massachussets, 2005; pp 176
[16] Yildiz A, Gönül A, Tamam L. Mechanism of actions of antidepressants: beyond the receptors. Bull. Clin. Psychopharmacol. 2002; 12: 194-200
[17] Uges DRA, Conemans JMH. Antidepressants and antipsychotics. Handbook of Analytical Separations, Elsevier, Amsterdam, 2000, pp. 742
[18] Pacher P, Kohegyi E, Kecskemeti V, Furst S. Current trends in the development of new antidepressants. Curr. Med. Chem. 2001; 8: 89-100
[19] Kent JM. SNaRIs, NaSSAs, and NaRIs: new agents for the treatment of depression. Lancet 2000; 355: 911-918
[20] Kent J. SNaRIs, NaSSAs, and NaRIs: new agents for the treatment of depression. Lancet 2000; 355: 2000
[21] Mann JJ. Drug therapy - The medical management of depression. N. Engl. J. Med. 2005; 353: 1819-1834
[22] Baumann P, Hiemke C, S. U, Eckermann G, Gaertner I, Kuss HJ, Laux G, Müller-Oerlinghausen B, Rao ML, Riederer P, Zernig G. The AGNP-TDM expert group consensus guidelines: therapeutic drug monitoring in psychiatry. Pharmacopsychiatry 2004; 37: 243-265
[23] Labat L, Deveaux M, Dallet P, Dubost JP. Separation of new antidepressants and their metabolites by micellar electrokinetic capillary chromatography. J.Chromatogr. B 2002; 773: 17-23
[24] Andersen S, Halvorsen TG, Pedersen-Bjergaard S, Rasmussen KE. Liquid-phase microextraction combined with capillary electrophoresis, a promising

Chapter VI: Validation
- 268 -
tool for the determination of chiral drugs in biological matrices. J. Chromatogr. A 2002; 963: 303-312
[25] Raggi MA, Mandrioli R, Casamenti G, Volterra V, Pinzauti S. Determination of reboxetine, a recent antidepressant drug, in human plasma by means of two high-performance liquid chromatography methods. J. Chromatogr. A 2002; 949: 23-33
[26] Llerena A, Dorado P, Berecz R, Gonzalez A, Norberto MJ, de la Rubia A, Caceres M. Determination of fluoxetine and norfluoxetine in human plasma by high-performance liquid chromatography with ultraviolet detection in psychiatric patients. J. Chromatogr. B 2003; 783: 25-31
[27] Hostetter AL, Stowe ZN, Cox M, Ritchie JC. A novel system for the determination of antidepressant concentrations in human breast milk. Ther.Drug Monit. 2004; 26: 47-52
[28] Titier K, Castaing N, Scotto-Gomez E, Pehourcq F, Moore N, Molimard M. High-performance liquid chromatographic method with diode array detection for identification and quantification of the eight new antidepressants and five of their active metabolites in plasma after overdose. Ther. Drug Monit. 2003; 25: 581-587
[29] Lacassie E, Gaulier JM, Marquet P, Rabatel JF, Lachatre G. Methods for the determination of seven selective serotonin reuptake inhibitors and three active metabolites in human serum using high-performance liquid chromatography and gas chromatography. J. Chromatogr. B 2000; 742: 229-238
[30] Suckow RF, Zhang MF, Cooper TB. Sensitive and selective liquid-chromatographic assay of fluoxetine and norfluoxetine in plasma with fluorescence detection after precolumn derivatization. Clin. Chem. 1992; 38: 1756-1761
[31] Goeringer KE, McIntyre IM, Drummer OH. LC-MS analysis of serotonergic drugs. J. Anal. Toxicol. 2003; 27: 30-35
[32] Kirchherr H, Kuhn-Velten WN. Quantitative determination of forty-eight antidepressants and antipsychotics in human serum by HPLC tandem mass spectrometry: a multi-level, single-sample approach. J. Chromatogr. B 2006; 843: 100-113
[33] Sauvage FL, Gaulier JM, Lachatre G, Marquet P. A fully automated turbulent-flow liquid chromatography-tandem mass spectrometry technique for monitoring antidepressants in human serum. Ther. Drug Monit. 2006; 28: 123-130
[34] Ulrich S, Martens J. Solid-phase microextraction with capillary gas-liquid chromatography and nitrogen-phosphorus selective detection for the assay of antidepressant drugs in human plasma. J. Chromatogr. B 1997; 696: 217-234
[35] Martinez MA, de la Torre CS, Almarza E. Simultaneous determination of viloxazine, venlafaxine, imipramine, desipramine, sertraline, and amoxapine in whole blood: Comparison of two extraction/cleanup procedures for capillary gas chromatography with nitrogen-phosphorus detection. J. Anal. Toxicol. 2002; 26: 296-302
[36] Maurer HH, Bickeboeller-Friedrich J. Screening procedure for detection of antidepressants of the selective serotonin reuptake inhibitor type and their metabolites in urine as part of a modified systematic toxicological analysis procedure using cas chromatography-mass spectrometry. J. Anal. Toxicol 2000; 24: 340-347

Chapter VI: Validation
- 269 -
[37] Bickeboeller-Friedrich J, Maurer HH. Screening for detection of new antidepressants, neuroleptics, hypnotics, and their metabolites in urine by GC-MS developed using rat liver microsomes. Ther. Drug Monit. 2001; 23: 61-70
[38] Eap CB, Bouchoux G, Amey M, Cochard N, Savary L, Baumann P. Simultaneous determination of human plasma levels of citalopram, paroxetine, sertraline, and their metabolites by gas chromatography mass spectrometry. J. Chromatogr. Sci. 1998; 36: 365-371
[39] Maurer HH, Kraemer T, Kratzsch C, Peters FT, Weber AA. Negative ion chemical ionization gas chromatography-mass spectrometry and atmospheric pressure chemical ionization liquid chromatography-mass spectrometry of low-dosed and/or polar drugs in plasma Ther. Drug Monit. 2002; 24: 117-124
[40] Maurer HH. Role of gas chromatography-mass spectrometry with negative ion chemical ionization in clinical and forensic toxicology, doping control, and biomonitoring Ther. Drug Monit. 2002; 24: 247-254
[41] Wille SMR, Maudens KE, Van Peteghem CH, Lambert WEE. Development of a solid phase extraction for 13 'new' generation antidepressants and their active metabolites for gas chromatographic-mass spectrometric analysis. J. Chromatogr. A 2005; 1098: 19-29
[42] Stemmler EA, Hites RA. A systematic study of instrumental parameters affecting electron capture negative ion mass spectra. Biomed. Environ. Mass Spectrom. 1988; 15: 659-667
[43] US Department of Health and Human Services Food and Drug Administration-Center for Drug Evaluation and Research (CDER), Guidance for Industry, Bioanalytical Method Validation, Rockville, 2001
[44] Heller S, Hiemke C, Stroba G, Rieger-Gies A, Daum-Kreysch E, Sachse J, Hartter S. Assessment of storage and transport stability of new antidepressant and antipsychotic drugs for a nationwide TDM service Ther. Drug Monit. 2004; 26: 459-461
[45] Martin A, Pounder DJ. Postmortem Toxicokinetics of Trazodone. Forensic Sci. Int. 1992; 56: 201-207
[46] Bolo NR, Hode Y, Nedelec JF, Laine E, Wagner G, Macher JP. Brain pharmacokinetics and tissue distribution in vivo of fluvoxamine and fluoxetine by fluorine magnetic resonance spectroscopy. Neuropsychopharmacol. 2000; 23: 428-438
[47] Wenzel S, Aderjan R, Mattern R, Pedal I, Skopp G. Tissue distribution of mirtazapine and desmethylmirtazapine in a case of mirtazapine poisoning. Forensic Sci. Int. 2006; 156: 229-236
[48] Almeida AM, Castel-Branco MM, Falcao AC. Linear regression for calibration lines revisited: weighting schemes for bioanalytical methods. J. Chromatogr. B 2002; 774: 215-222
[49] Kirkup L, Mulholland M. Comparison of linear and non-linear equations for univariate calibration. J. Chromatogr. A 2004; 1029: 1-11
[50] Chaler R, Villanueva J, Grimalt JO. Non-linear effects in the determination of paleotemperature Uk'37 alkenone ratios by chemical ionization mass spectrometry. J. Chromatogr. A 2003; 1012: 87-93
[51] Rudewicz P, Feng T, Blom K, Munson B. Effect of electron capture agents in chemical ionization mass spectrometry. Anal. Chem. 1984; 56: 2610-2611


Chapter VII
Therapeutic drug monitoring and pharmacogenetics of antidepressants


Chapter VII: Therapeutic drug monitoring and pharmacogenetics of antidepressants
273
VII.1. Foreword
This chapter describes a preliminary study concerning personalized anti-
depressant (AD) treatment. So far most compelling evidence in
pharmacogenetics of ADs has been gathered for an effect of CYP2D6
polymorphisms (i.e. variations in a specific metabolic enzyme) on AD drug
plasma levels [1]. Therefore, in this study, therapeutic drug monitoring
(TDM) is combined with CYP2D6 genotyping (GEN) to ensure a good medical
treatment. Despite the low toxicity of ADs, physicians must be aware that
depression is a chronic disease leading to a long period of drug intake. In
addition, these patients mostly use a whole range of drugs, which increases
the risk of adverse effects. There are no clear guidelines to get an optimized
therapy, especially because a lot of factors (environmental, genetic) will
influence the final outcome. Nowadays, AD treatment is largely based on trial
and error combined with the experience of the physician. At first, we wanted
to link the genotype of a large group of depressed patients with their plasma
concentration and effects; however, it was hard to gather enough patients for
a significant large scale study. Moreover, blood samples are not taken on a
routine base in psychiatric clinics. Therefore, as an example of the TDM-GEN
procedure, we will discuss a case report in which a healthy volunteer showed
adverse effects after intake of a single dose of mianserin (30 mg/day). In
addition, the TDM-GEN procedure that would be used for depressed patients
will be described.
VII.2. Introduction
In spite of the enormous progress in the knowledge of depression and the
design of ADs during the past decades, treatment of depression is far from
being optimal. There is a delayed time of onset of clinical improvement,
remission rates are high and a significant number of patients, about 30-50
%, have an insufficient response or do not respond at all. In addition, side-
effects are often noticed and about 40 % of all patients are non-compliant,
probably largely due to these side-effects [1-8].
In the psychiatric clinic, depression is treated with ‘optimal doses’ of ADs that
are defined through population-based dose-effect relationships, thus doses

Chapter VII: Therapeutic drug monitoring and pharmacogenetics of antidepressants
274
are based on the average plasma levels of the drug obtained in the
population at a certain dosage. However, a large inter-individual variability
between dose, plasma concentrations and final effects are observed during
treatment with ADs. Variability of the ADs plasma concentrations is
determined by different factors such as environmental (e.g. compliance, co-
medication, diet, smoking habit) and physiological factors (e.g. age, sex, liver
disease, impared kidney function), as wel as by genetic variability of
pharmacokinetic (metabolism) or pharmacodynamic (transporters, targets)
parameters (Figure VII.1.) [1, 4, 5, 8-10].
One of the most important factors of the inter-individual variability of AD
plasma concentrations and effects is the metabolism of ADs due to
cytochrome P450 isoenzymes. Especially CYP2D6 is of interest, as this
enzyme (partially) metabolizes about 25 % of all drugs. Polymorphisms (i.e.
variations) in the genetic sequence may result in a lack of this enzyme (gene
deletion), a partially functional enzyme (mutation of a single nucleotide) or a
high amount of active enzyme (gene amplification) and thus lead to
differences in drug metabolism. Based on these genetic variations, different
patient groups can be distinguished from poor (PM) to ultrarapid (UM)
metabolizers. For these patients the ‘optimal average dose’ used in clinical
practice can lead to problems. For poor metabolizers, a lot of side-effects
may occur as high ADs plasma concentrations are reached because of the
slower rate of metabolism. Ultrarapid metabolizers, on the other hand, often
do not respond to AD treatment, because their high rate of metabolism leads
to subtherapeutic concentrations [11].
In the clinical field, therapeutic drug monitoring (TDM) is known to be a valid
tool to optimize pharmacotherapy as it enables the clinician to adjust the
dosage of drugs according to the pharmacokinetic characteristics of the
individual patient. The usefulness of TDM for the new generation ADs is,
however, under discussion because of the low toxicity profile, the large
therapeutic window and the poor plasma concentration-effect relationship. In
addition, dose adjustments based on TDM can only occur at steady-state of
the drug, thus only after a couple of weeks of treatment, and these first
weeks of treatment are crucial for patient compliance [12, 13]. As a result,

Chapter VII: Therapeutic drug monitoring and pharmacogenetics of antidepressants
275
for optimal and rational use of ADs, all factors of variability should be
considered and if possible monitored during (a problematic) therapy. As the
variability of the ADs plasma concentrations is due to environmental factors,
underlying diseases as well as genetic variables, TDM combined with
pharmacogenetics (TDM-GEN) and qualitative diagnostic tests could give a
better idea of the individual patient’s response to a drug and can finally result
in a personalized medicine [5].
Figure VII.1. Schematic overview of the drug route towards site of action,
with indication of factors influencing drug plasma concentration and effect
A, after drug intake, plasma concentrations for one dose differ due to compliance, environmental, physiological and genetic factors. The genetic variability for CYP2D6 metabolism is indicated. B, for one plasma concentration, a different brain concentration can occur due to genetic variation of the transport system. C, variations also occur in receptors, transporters, and biosynthesis enzymes resulting in a different effect. Adapted from [10, 14]. Drug
Plasma compartment
Protein-bound drug
Free drug
Metabolites
Patient compliance
Pysiological factors
Environmental factors
Genetic factors
Genetic variability
Pysiological factors
Environmental factors
A
Liver
Metabolites
Kidney
Excretion
Pysiological factors
Environmental factors
Site of a ction
Genetic variability
B
Receptor-bound
Pharmacologic response
Genetic variability
C

Chapter VII: Therapeutic drug monitoring and pharmacogenetics of antidepressants
276
VII.2.1. Patient information and qualitative diagnostic tests
The diagnosis of depression is done by depression rating scales as no
objective parameters such as plasma concentration of certain markers can
indicate the state of the depression. The three most popular rating scales are
the Hamilton Depression Rating Scale (HAM-D), the Montgomery and Asberg
Depression Rating Scale (MADRS) and the American Psychiatric Association
Diagnostic and Statistical Manual of Mental Disorders (DSM-IV).
The HAM-D is a multiple choice questionnaire originally published in 1960 by
Max Hamilton, which rates the severity of symptoms observed in depression
such as low mood, insomnia, agitation, anxiety and weight-loss. The total
scores range between 0-52 and are interpreted as follows: 0-7 = normal
/not-depressed; 8-13 = possibly/mildly depressed mood; 14-15 moderately
depressed; 19-27 severely depressed; > 27 very severely depressed [15].
The MADRS is a commonly used scale to determine the severity of depression
in elderly patients without dementia. It rates the severity of depression by
observing symptoms such as low mood, insomnia, appetite, concentration
problems, agitation, negative and suicidal thoughts. A score of 20 leads to
the conclusion of a slightly depressed mood, while a score higher than 30
means a severely depressed state of the patient.
The DSM rating scale was first published in 1952 by the American Psychiatric
Association and the last revision DSM-IV was published in 1994. This
publication is a categorical classification system of 297 mental health
disorders into five levels. The first level (axis 1) includes clinical disorders,
including major mental disorders, as well as developmental and learning
disorders. This is the category in which depression is situated. Depression is
categorized as a recurrent or single episode mental disorder and is
subdivided in mild, moderate, or severe depression with or without psychotic
features [16].
The results of these qualitative diagnostics should be linked to quantitative
TDM results to link the state of the patient to the obtained plasma
concentrations [16]. In addition, information concerning the patient’s
physiology, habits (e.g. smoking, diet), co-medication, comorbidity and
genetic parameters should be obtained to get as much information as
Chapter VII: Therapeutic drug monitoring and pharmacogenetics of antidepressants
277
possible to ensure a good interpretation of the TDM-GEN results in order to
finally result in an individualized and adequate therapy without side-effects.
VII.2.2. Therapeutic drug monitoring
Therapeutic drug monitoring of ADs in plasma is the only way to estimate the
brain concentration and thus the concentration at the effector-site of the
drugs. However, as discussed above, there is a large variability in AD plasma
concentrations and it is difficult to link a plasma concentration to an effect
due to inter-individual variations as a result of environmental, physiological
and genetic factors [5]. Therefore, the interdisciplinary TDM group of the
Arbeitsgemeinschaft für Neuropsychopharmakologie und Pharmakopsychiatrie
(AGNP) has worked out consensus guidelines to assist psychiatrists and
laboratories to optimize the use of TDM of psychotropic drugs. Five research-
based levels of recommendation were defined with regard to routine
monitoring of plasma concentrations of 65 psychoactive drugs. For new
generation ADs, TDM is recommended or useful to detect non-compliance, for
patients with a lack of clinical response or adverse effects at recommended
doses, and when interactions are suspected. Moreover, for special patient
groups such as children, adolescents, pregnant women and elderly,
monitoring could be of interest because of variations in pharmacokinetic
behaviour. As ADs can be used chronically, monitoring can be used to
prevent relapse or recurrence [2, 13].
TDM is only useful if therapeutic windows are postulated, to link plasma
concentrations to effects. Both TIAFT [17] and the AGNP-group [13] have
proposed therapeutic windows for several ADs and these were already
discussed in chapter I of this thesis. During TDM, high plasma concentrations
can indicate adverse effects and toxicity due to poor metabolism or
interactions, while low plasma concentrations could lead to a suspicion of
ultrarapid metabolism or non-compliance. TDM demonstrates the effect of all
possible pharmacokinetic variables, and can result in dose adjustments, but it
does not show the underlying problem such as genetic variations or co-
medication. However, there are also reports that demonstrate the usefulness
of TDM for phenotyping purposes. Through the plasma concentration ratio of

Chapter VII: Therapeutic drug monitoring and pharmacogenetics of antidepressants
278
an AD and its metabolite, the pharmacokinetic phenotype of an individual can
be measured. Van der Weide et al. [12] and Veefkind et al. [18] have
demonstrated a difference in metabolic ratio between the phenotypes for
venlafaxine, and used these data to optimize AD therapy. Based on these
studies, individuals can be classified as poor, intermediate, extensive and
ultrarapid metabolizers. The reseach group of Kirchheiner even went a step
further and gave dose recommendations for extensive, intermediate and poor
metabolizers of CYP2D6 for 16 ADs based on their plasma concentrations [8,
19]. Figure VII.2. demonstrates that dose adjustments for citalopram and
sertraline will not be necessary for the different CYP 2D6 phenotypes, while
the importance of personalized AD treatment increases from trazodone,
mianserin, venlafaxine, paroxetine to maprotiline treatment [19]. It is
therefore clear, that TDM of ADs can be of interest to determine the patient’s
phenotype and to adjust AD dosages based on their plasma concentrations.
Figure VII.2. Dose adjustment of ADs according to their CYP2D6 phenotype
[19]

Chapter VII: Therapeutic drug monitoring and pharmacogenetics of antidepressants
279
VII.2.3. Genetic variability
Genetic factors are believed to play a major role in the variation of treatment
response and the incidence of adverse effects to medication. Genetic
variability occurs in enzymes playing a role in drug metabolism, at the target
sites [8, 9, 20, 21] and in transport proteins located in the intestinal mucosa
and in the blood-brain barrier, such as P-glycoprotein [8, 21-24].
During the past 30 years, a lot of research has been done concerning
cytochrome P450 isoenzymes polymorphisms. Especially polymorphisms of
CYP2D6, encoding the debrisoquine hydroxylase enzyme, are of high clinical
relevance for the metabolism and thus plasma concentration of ADs [9]. The
CYP2D6 gene is located on chromosome 22, and over 70 functionally
different alleles have been reported for this enzyme. However, only 15
encode an enzyme with ‘abnormal’ functionality [1]. The differences are due
to gene deletion, gene duplication or mutations and result in defective,
qualitatively altered, diminished or enhanced rates of drug metabolism [9].
In general, four phenotypes can be identified: poor metabolizers (PM),
lacking the functional enzyme; intermediate metabolizers (IM), who are
heterozygous for one deficient allele or carry two alleles that cause reduced
activity; extensive metabolizers (EM), who have two normal alleles; and
ultrarapid metabolizers (UM), who have multiple gene copies [11]. The
distribution of these four phenotypes is different for different ethnic groups
(Figure VII.3.). Although the incidence of PM or UM is not so high, readily 35-
50 million people in Europe are expected to exhibit problems during therapy
with a CYP2D6 substrate [9]. However, it is clear that the extent of these
potential problems largely depends on the relative contribution of the
respective CYP enzyme to the total elimination of the drug and the
therapeutic index of the drug [19].

Chapter VII: Therapeutic drug monitoring and pharmacogenetics of antidepressants
280
Figure VII.3. Ethnic variability in the frequency of CYP2D6 polymorphism
Adapted from [9]. Red trace indicates frequency of poor metabolizers, black trace the
ultrarapid metabolizers
10%
1-2%0-20%
10%
The number of known CYP2D6 gene variants is growing. However,
genotyping for only the 6 most common defective alleles will predict the
CYP2D6 phenotype (poor, ultrarapid or normal metabolism) with about 95-
99% certainty [9, 25]. Therefore, CYP2D6*3, *4, *5, *6, *7, *8, and CYP2D6
duplications were monitored in our CYP genotyping assays (Figure VII.4.).
There are different mechanisms that lead to total loss of function. Several
alleles have single base pair mutations or small insertions and deletions that
interrupt the reading frame or that interfere with correct splicing, ultimately
leading to prematurely terminated protein products (CYP2D6*3, *4, *6, *8).
CYP2D6*7, on the other hand, encodes a full-length but non-functional
protein, while CYP2D6*5 refers to CYP2D6 gene deletion. Poor metabolizers
are homozygous for one of these alleles or heterozygous for 2 of these non-
functional alleles. Ultrarapid metabolizers are detected by determining alleles
with increased function, thus gene duplications. Patients having at least one
decreased or normal functioning allele are intermediate or extensive
metabolizers, and their metabolization patterns are not clinically relevant for
AD therapy [4, 26].

Chapter VII: Therapeutic drug monitoring and pharmacogenetics of antidepressants
281
Figure VII.4. Structure of functional and non-functional CYP2D6 alleles and
their influence on final protein activity
Adapted form [9, 26]. The 9 exons are indicated by numbered boxes with DNA
polymorphisms indicated on top (del deletion, ins insertion). Predicted amino acid
changes and translation termination (ter) codons are indicated below. Frequencies of
variation in the Caucasian population are indicated in red.
1-2% 20% 2-7% 1%
1-2% 1-2% 8-20%

Chapter VII: Therapeutic drug monitoring and pharmacogenetics of antidepressants
282
*5
*3,*4, *6,*7,*8
VII.3. Experimental
VII.3.1. Patient selection
The TDM-GEN method described in this chapter can be used for any
depressed patient treated with a novel AD that is metabolized by CYP2D6
(Table VII.1.). In this preliminary study, we will focus on mianserin and
therefore, a 30 mg dose of Lerivon® was administered to a healty volunteer.
This volunteer gave an informed consent for the study, which was supervised
by a medical doctor. Lerivon® was purchased from a local pharmacist by the
research group.
Table VII.1. List of ADs that are (partially) metabolized by CYP2D6, their
influence on CYP 450, transporters and receptors (summary of chapter I)
Antidepressants
CYP metabolism CYP inhibition ReceptorsNA 5-HT DA P-glycoprotein H1 MA Alpha 1 Alpha 2 5HT
Citalopram 2C19, 2D6,3A4 (Minimal: 2D6, 2C19,1A2) ++++ substrate + +Fluoxetine 2D6, 2C 2D6, 2C9/19, 3A4 + ++++ inhibitor + + + +Fluvoxamine 1A2,2D6 1A2, 2C19, 3A4,2C9 + ++++ substrate/inhibitor +Maprotiline 2D6, 1A2 ++++ +Mianserin 1A2, 2D6, 3A4 ++++ ++++Mirtazapine 1A2, 2D6, 3A4 no effects + + ++++ ++++Paroxetine 2D6 2D6 + ++++ + substrate/inhibitor ++Sertraline 2D6, 2C9, 2C19, 3A4 Minimal: 2D6, 2C, 3A4,1A2 + ++++ ++ inhibitor + +Trazodone 2D6, 1A2, 3A4 ++++ inducer + +++ ++++Venlafaxine 2D6, 3A4 Minimal: 2D6 ++ ++++ + substrate/inhibitor
TransportersCYP isoenzymes Neurotransmitter Transporters and Receptors
Chapter VII: Therapeutic drug monitoring and pharmacogenetics of antidepressants
283
VII.3.2. Therapeutic drug monitoring
TDM is based on trough steady-state plasma concentrations, and therefore
blood should be collected at least 5 drug intakes after changes of dose. As
the average half-life of mianserin is about 16 hours, this implies that blood
should be collected after at least 4 days of therapy. In clinical practice, the
appropriate sampling time for most psychoactive drugs is one week after
stable daily dosing. In addition, TDM blood samples should be taken at
minimum steady-state concentrations, just before intake of the daily dose or
at least 12-17 hours after the last dosage [2].
For our preliminary study, 5 ml of blood was drawn into an EDTA tube 15
hours after intake of the daily dose (30 mg mianserin). The blood samples
were centrifuged within two hours at 1200 g for 10 minutes. The harvested
plasma was stored at -20 °C before analysis with the GC-MS method with
electron ionization as described in chapter VI (VI.2.).
VII.3.3. Determination of genetic variability
The method development for CYP2D6 genotyping was done in the Laboratory
of Molecular Biology at ‘Erasmus ziekenhuis Antwerpen’ by Ph. Liesbeth
Daniels, under the supervision of Prof. Dr. Hugo Neels, whom we both
gratefully acknowledge.
DNA was extracted from whole blood collected in EDTA-tubes. First, strong
detergents were added to distroy the cell membrane and to inactivate the
nucleases of the blood cells. This was followed by repeated extractions with
phenol, resulting in discharge of the denaturated proteins and nucleic acids.
Ethanol is added to precipitate and separate the smaller molecules from the
nucleic acids, and to separate DNA from RNA due to differences in solubility.
In addition, during the extraction, specific enzymes were used to discharge
unwanted nucleic acids such as RNA.
After extraction of DNA, specific fragments of the double stranded DNA
molecule were amplified by polymerase chain reactions (PCR), as only these

Chapter VII: Therapeutic drug monitoring and pharmacogenetics of antidepressants
284
fragments are of interest. PCRs are in fact copying reactions of single DNA
strands using thermal cycle programs. First, the double stranded DNA is
denatured into two single strands at a relatively high temperature.
Thereafter, at lower temperatures, primers will anneal to complementary,
specific and defined sequences on each of the two single DNA strands. These
primers are extended (elongation reaction) with nucleotides complementary
to the single stranded DNA template by a DNA polymerase, resulting in a
copy of the desired sequence. For each step of the copying reaction
(annealing and elongation step), specific temperatures are used. After
making the first copy, the temperature increases again to obtain single DNA
strands and the procedure is started all over. As a result, another copy of the
input DNA strand but also of the short copy made in the first round of
synthesis is made and these reactions finally lead to a logarithmic
amplification of the desired DNA sequence. These amplification reactions are
checked by analyzing the amplified sequences with gelelectrophoresis using
ethidiumbromide, a DNA intercalating UV-active compound, as detection
reagent.
The PCR reaction used for the determination of CYP2D6 polymorphisms in
this thesis is the Real-Time PCR in combination with melting curve analysis,
using a LightCycler. A classical PCR reaction is used for pre-amplification of a
1654 bp fragment of the CYP2D6 gene for analysis of polymorphisms
*3,*4,*6,*7 and *8. This PCR reaction occurs before the actual Real-Time
PCR to circumvent interferences due to the highly homologous CYP2D7 and
CYP2D8 pseudogenes [26]. The difference between Real-Time PCR and
ordinary PCR reactions is that the former enables detection and quantification
of the DNA amplification in ‘real time’ due to fluorescent dyes on
hybridization probes that bind to a specific sequence. For each DNA
fragment, two hybridization probes are used that will bind on specific
sequences next to each other. One probe will be excited in the LightCycler
and will transfer energy (FRET, fluorescence resonance energy transfer) to
the other (acceptor) probe. This acceptor probe will also be excitated, leading
to fluorescence detection.

Chapter VII: Therapeutic drug monitoring and pharmacogenetics of antidepressants
285
Figure VII. 5. PCR reaction in combination with melting curve analysis
A, PCR reaction: denaturation of the double stranded DNA, annealing of primers and elongation step by the DNA polymerase are shown; B, hybridization probes anneal at specific sequences, the donor probe excites the acceptor probe, which leads to fluorescence. A melting curve is constructed by measuring fluorescence with increasing temperatures. At a certain point (the melting point) the probes will be denatured and loose their fluorescence. Based on [27].
The final detection of the different CYP2D6 polymorphisms was done by
melting curve analysis after the Real-Time PCR. A melting curve is obtained
by increasing the temperature, which results in disruption of the double
stranded DNA and loss of hybridization probe binding, thus loss in
fluorescence. DNA strands are linked by hydrogen bonds with weaker bonds
between the nucleotides adenine and thymine, 2 hydrogen bonds, than
between guanine and cytosine (3 hydrogen bonds). As a result, differences in
the melting profile will occur for the different polymorphisms of CYP2D6
(Figure VII.5.B.).
Another reaction used for the determination of CYP2D6 polymorphisms is the
sequencing reaction. This reaction determines the nucleotide order (guanine,

Chapter VII: Therapeutic drug monitoring and pharmacogenetics of antidepressants
286
cytosine, thymine and adenine) of a specific DNA fragment. The sequencing
reaction can be compared with a classical PCR, thus a single stranded DNA is
used as template, primers anneal to initiate the reaction, DNA polymerase
will elongate the primers with nucleotides, etc. However, dideoxynucleotides
labeled with different dyes, exciting at a different wavelength, are also added
during the PCR. These dideoxynucleotides will terminate the DNA strand
elongation as they lack a 3’-OH group required for the formation of a
phosphodiester bond between two nucleotides during elongation, resulting in
DNA fragments that vary in length. All the produced DNA fragments will then
be separated based on their length, and because the four kinds of
dideoxynucleotides are labelled with a different fluorescent molecule, the
sequence of the DNA fragment is obtained (Figure VII.6.)
Figure VII.6. DNA sequencing
Adapted from [28].
VII.3.3.1. DNA extraction from EDTA-blood samples
DNA was extracted from the EDTA-supplemented blood with a QiAmp DNA
Blood Mini Kit (QIAGEN, Venlo, The Netherlands). Two hundred μl of blood
sample was added to 20 μl QIAGEN protease in a 1.5-ml eppendorf tube.
Thereafter, 200 μl lysis-buffer was added, vortexed for 15 seconds and then
incubated for 10 minutes at 56 °C. After incubation, 200 μl of ethanol (96-

Chapter VII: Therapeutic drug monitoring and pharmacogenetics of antidepressants
287
100 %) was added and mixed. The final mixture was loaded onto a QIAamp
spin column and this column was centrifuged for 1 minute at 3585 g. The
spin column was thereafter washed; first with 500 μl AW1 buffer and then
with AW2 buffer. After both washing steps the column was centrifuged and
the wash solutions were disposed off. Finally, the DNA was eluted from the
spin column by adding 200 μl of elution buffer. The elution buffer was allowed
to soak the phase during 5 minutes at room temperature before collection of
the eluate through centrifugation of the tube at 3585 g during 1 minute. This
eluate was stored at 4°C.
VII.3.3.2. Pre-amplification of a 1654 bp DNA fragment of cytochrome 2D6
For gene deletion and duplication, purified DNA obtained in VII.3.3.1 was
used for the Real-Time polymerase chain reactions. For the analysis of alleles
*3,*4,*6,*7, and *8, a 1654 bp pre-amplified fragment of CYP2D6 was used
as template. The GeneAmp PCR (Applied Biosystems, Toronto, Canada)
equipment was used for pre-amplification of this fragment.
Table VII.2. Primers and probes used for determination of CYP2D6
duplication, deletion, and allelic variations [29-31]
SitePrimer
1654bp-F 30761654bp-R 4702
Del-F 17307Del-R -3518
Dup-F -595Dup-R 13524
*3 primer-F 4100*3 primer-R 4560
*4 primer-F 3283*4 primer-R 3533
Probe
Reb Sens -2272 / 15062Reb Anch -2298 / 15035
*3 Sens 3460*3 Anch 3436
*4 Sens 3319*4 Anch 3291
*6 Sens 4161*6 Anch 4135
5'-CCTCGGTCACCCACTGCTCCAGC-Fluorescein-3'5'-LCRed640-CTTCTTGCCCAGGCCCAAGTTGC-phosphate-3'
5'-TCCCAGGTCATCCGTGCTCA-Fluorescein-3'5'-LCRed670-TTAGCAGCTCATCCAGCTGGGTCAG-phosphate-3'
5'-CGACCCCTTACCCGCATCTCCC-Fluorescein-3'5'-LCRed640-CCCCAAGACGCCCCTTT-phosphate-3'
5'-TGCTGCCTCCCACTCTGCAGTGCTC-Fluorescein-3'5'-LCRed640-ATGGCTGCTCAGTTGGACCCACGCT-phosphate-3'
5'-TGGCTGGCAAGGTCCTACG-3'5'-TGGGCTCACGCTGCACATT-3'
5'-AGAGGCGCTTCTCCGTGTC-3'5'-CAGGTGAGGGAGGCGATCA-3'
5'-CACGTGCAGGGCACCTAGAT-3'
5'-ACCGGGCACCTGTACTCCTCA-3'
5'-CCCTCAGCCTCGTCACCTCAC-3'
Sequence
5'-GCATGAGCTAAGGCACCCAGAC-3'
5'-CAAGGTGGATGCACAAAGAGT-3'5'-ACACTCCTTCTTGCCTCCTAT-3'

Chapter VII: Therapeutic drug monitoring and pharmacogenetics of antidepressants
288
The 1654 bp fragment was amplified using the 1654bp forward (F) and
reverse (R) primers (Table VII.2.) at a concentration of 0.25 and 0.5 μM,
respectively. For the amplification, AmpliTaq Gold Polymerase (1.5 U, Applied
Biosystems), deoxynucleotide triphosphates (0.3 mM), magnesium chloride
(1.7 mM), PCR gold buffer and DNA (125 ng) were added and mixed together
with the primer to get a final volume of 50 μl. The thermal cycler programme
started at 95 °C for 3 min. Thereafter, 35 cycles of 30 sec at 95 °C, 30 sec at
62 °C, and 1:30 min at 72 °C were applied for amplification of the 1654 bp
fragment. The final elongation occurred for 6 min at 72 °C. The amplified
fragment was stored at 4 °C.
VII.3.3.3. Confirmation of the amplification reaction
The correct amplification of the 1654 bp fragment was confirmed by gel
electrophoresis. PCR products were resolved by a 0.8 % agarose gel and
ethidiumbromide staining. The 0.8 % agarose gel was obtained by adding 2.4
g of agarose to 300 ml 1 x Tris-EDTA buffer. This solution was heated, mixed
and stored in a hot water bath at 56 °C for at least 15 minutes. Thereafter,
10 μl ethidiumbromide was added to the mixture and the gel could be
poured. A DNA ladder (1 kb) was resolved on the gel simultaneously with the
PCR products.
VII.3.3.4. Real-Time PCR reactions in the LightCycler
A LightCycler system from Roche (Brussels, Belgium) was used to determine
gene deletion and duplication or allelic variations by using Real-Time PCR and
melting-curve analysis. In this paragraph, the primers, hybridization probes,
content of the reaction mixtures, as well as PCR cycle and melting curve
conditions are described.
The primers (Del-F/Del-R; Dup-F/Dup-R) for the gene deletion and
duplication were obtained from Eurogentec S.A. (Seraing, Belgium) and their
sequences are indicated in Table VII.2. Detection of the DNA fragments was
realized by using one common pair of hybridization probes (Rep Sens and
Rep Anch), both corresponding to sequences in the second half of the large
direct repeats immediately downstream of CYP2D6 and CYP2D7. The reaction
mixtures for gene deletion and duplication were prepared separately. The
Expand Long Template PCR System enzyme mixture and its buffer (1.3 U,

Chapter VII: Therapeutic drug monitoring and pharmacogenetics of antidepressants
289
Roche) were used in a final volume of 20 μl for both reactions.
Deoxynucleotide triphosphates (0.3 mM) and 125 ng of DNA were also added
to the mixture. The concentration of the forward primers was always 0.5 μM,
while the concentration of the reverse primers was 0.5 or 1 μM for
duplication and deletion, respectively. The concentration of the hybridization
probes was 0.2 μM for forward and 0.4 μM for reverse probes. The following
amplification program was used: 2 minutes at 95 °C, followed by 32 cycles,
each comprising 10 sec at 95°C and 133 sec at 68°C. Before melting curve
analysis, a final elongation at 68 °C occurred for 7 minutes. The melting
curve analysis started at 55 °C and finished at 78 °C with a ramp speed of
1.2 °C/sec [29].
Two pairs of primers, purchased from Eurogentec S.A., were used for the
detection of CYP2D6*3,*4, and *6 (Table VII.2.). One pair (*3 primers) was
used for the determination of *3, while the other pair (*4 primers) were used
for *4, and *6. For each allelic variation, different hybridization probes (Tib
MolBiol, Berlin, Germany) were used (Table VII.2.). The reaction mixtures for
*3 and for *4 - *6 were separately prepared as different primers and probes
are necessary for these reactions. The LC480 genotyping master kit from
Roche was used in a final volume of 20 μl for both reactions. The
concentration of primers and hybridization probes was always 0.5 μM and 0.2
μM, respectively. Five μl of a 1/400 dilution of the 1654 bp fragment of
CYP2D6, obtained as described in VII.3.3.2, was added to this mixture. The
following cycle program was used: 5 minutes at 95 °C, followed by 30
amplification cycles for the *3 analysis and 35 cycles for the *4 - *6 reaction.
Each amplification cycle comprised 5 sec at 95°C, 10 sec at 60 °C (*3) or 65
°C (*4 - *6), and 2:12 minutes at 72 °C. Thereafter, melting curve analysis
started at 95 °C for 1 min., then 60 °C for 20 seconds and finally a
temperature gradient from 40 to 75 °C with a ramp speed of 1.5 °C/sec [30].
VII.3.3.5. Sequencing
If the result of the Real-Time PCR and melting curve analysis were not
straightforward or for analysis of the *7 and *8 allelic variations, sequencing
was applied. First, the amplified 1654 bp fragment (VII.3.3.2.) was purified
with a QIAquick PCR purification Kit (Westburg, Leusden, The Netherlands).
Thus, 50 μl of the PCR fragment is mixed with 250 μl of PB-buffer and

Chapter VII: Therapeutic drug monitoring and pharmacogenetics of antidepressants
290
vortexed. This mixture was transferred to a QIAquick spin column, which
thereafter was centrifuged at 3595 g during 1 minute. The eluent was
transferred to the waste and the spin column was washed with 750 μl
washing buffer and centrifuged. Finally, the purified DNA fragment was eluted
in an eppendorf tube with 30 μl of elution buffer and a centrifugation step of
1 min at 3595 g.
This purified DNA fragment was then diluted 1/10 and used for the
sequencing reaction. Two μl of the diluted sample was added to 1 μl of primer
(*3 or *4 F/R Table VII.2.) and 17 μl of a sequencing mix to obtain a reaction
volume of 20 μl. The sequencing mix used for the cycle reaction was
prepared as follows: 4 μl of a ready reaction mix (Big Dye Terminator
Sequencing kit, Applied Biosystems) and 2 μl of a sequencing buffer were
added to 11 μl of HPLC-water.
The next step in the sequencing reaction is a purification step, leading to a
loss of excess of reagents by the use of a DyeEx Spin Kit (Westburg). The
DyeEx Spin column has to be prepared by centrifugation at 3595 g for 3
minutes before the cycle sequencing reaction mix (20 μl) is added to the gel
surface of the spin column. Thereafter, the eluate is collected through
centrifugation (3 minutes, 3595 g) and devided over the cups of the reaction
plate. The reaction plate was heated at 96 °C until full evaporation of the
sample. The extract was then redissolved in 20 μl of deionized formamide
and heated again at 96 °C for 3 minutes. After this clean-up step, the DNA
can finally be sequenced by the ABI PRISM 310 Genetic Analyzer (Applied
biosystems).
VII.3.3.6. Quality control
During the analysis of CYP2D6 polymorphisms, positive and negative controls
were also analyzed as quality control. For the negative control water was
analyzed in the same way as the samples. The positive controls CYP2D6*3,
*4, and *6 were obtained from ParagonDX (Morrisville, USA), while DNA
obtained from a patient positive for gene duplication was applied as positive
control for the gene duplication reaction.

Chapter VII: Therapeutic drug monitoring and pharmacogenetics of antidepressants
291
VII.4. Case Report
VII.4.1. Patient information and qualitative diagnostic tests
Figure VII.7. Patient information sheet
Antidepressant TDM: Patient information 25 march 2008
Patient X
Antidepressant therapy Lerivon (mianserin 30 mg/day) Therapy duration 1 day Last administration 22:30 24 march Blood draw 13:30 25 march
Psyiological factors
Gender female
Co morbidity (e.g. liver, kidney) /
Environmental factors
Diet /
Co-medication Desorelle 20 mg
Qualitative Test
HAM-D score /
Side-effects, complaints OVERDOSE: seizures, unsteady walk, unconsciousness
CYP 2D6 phenotype intermediate metabolism
TDM result 9 ng/ml mianserin 5 ng/ml desmethylmianserin
Results interpretation: Stop mianserin medication: intermediate metabolism and drug interaction
The patient information sheet of the volunteer is shown in Figure VII.7. This
volunteer was a young female without depression symptoms. She had no
liver or kidney impairment, and the only co-medication was an oral
contraceptive. The HAM-D score was not taken as the volunteer was not
depressed. A dose of 30 mg was administered as mianserin dosages range
from 30-90 mg per day for depressed patients. Nine hours after the intake of
30 mg of mianserin, severe adverse reactions were noticed. Although this
dose is a normal daily dosage of depressed patients, overdose symptoms

Chapter VII: Therapeutic drug monitoring and pharmacogenetics of antidepressants
292
such as queasiness, dizziness, unsteady walking, and finally seizures and
unconsciousness were observed. A blood sample was drawn 15 hours after
the drug intake for monitoring purposes. Due to the severe adverse
reactions, intake of mianserin was immediately stopped.
VII.4.2. Therapeutic drug monitoring
A blood sample drawn 15 hours after a single adiminstration of 30 mg
mianserin was analyzed with the developed GC-MS method. However,
because of the low plasma concentrations in the sample, extrapolation was
necessary and resulted in a semi-quantitative analysis. A plasma
concentration of 9 ng/ml mianserin and 5 ng/ml desmethylmianserin was
observed.
According to TIAFT [17], the therapeutic window ranges from 15-70 ng/ml
mianserin in steady state conditions. Otani et al. [32] monitored the plasma
concentration after 18 hours of a single mianserin (30 mg) intake and
concluded that the concentrations ranged from 3-13 ng/ml for mianserin and
1-7 ng/ml for desmethylmianserin. In this study, however, plasma
concentrations were not linked to an effect and in addition, differences in
metabolism and thus differences in plasma concentrations for poor versus
rapid metabolisers were not discussed. Therefore, although the results
obtained from the current case are situated in this range, the plasma
concentration of this case cannot be interpreted unambiguously. In addition,
interpretation of the plasma concentration – effect relationship is even harder
as desmethylmianserin retains pharmacological properties indicative of
antidepressant activity. The metabolite is slightly less potent than the parent
compound as a noradrenaline uptake inhibitor and antagonist at pre-synaptic
adrenoreceptors, but is more active as a serotonin uptake inhibitor [33]. The
side-effects observed in this case report, such as queasiness and dizziness,
would be a result of 5HT3- and �1-receptors blockage, however, mianserin
blocks 5HT2- and �2-receptors quite selectively according to recent
knowledge and literature (chapter I; I.4-I.5.-I.7.6.).

Chapter VII: Therapeutic drug monitoring and pharmacogenetics of antidepressants
293
From this case report, we can conclude that a dose of 30 mg mianserin can
result in a mianserin plasma concentration of about 9 ng/ml 15 hours after
intake and that this concentration was determined after adverse reactions
indicative of overdose.
Figure VII.8. Chromatogram of the plasma sample obtained from a volunteer
taking 30 mg of mianserin
8.00 10.00 12.00 14.00 16.00 18.00 20.00 22.00 24.00
5000
15000
25000
35000
45000
55000
65000
75000
85000
Time-->
Abundance
Mianserin + Mianserin-d3
Desmethylmianserin
16.00 16.50 17.00 17.50 18.00 18.50 19.00 19.500
500
1000
1500
2000
2500
3000
3500
Time-->
Abundance
Ion 264.00 (263.70 to 264.70): 08032814.D\data.ms
16.00 16.50 17.00 17.50 18.00 18.50 19.00 19.500
500
1000
1500
2000
2500
3000
3500
Time-->
Abundance
VII.4.3. Determination of CYP2D6 polymorphisms
Mianserin is metabolized by CYP1A2, CYP2D6 and CYP3A4. However, only
CYP2D6 polymorphisms (duplication, deletion, *3, *4, *6, *7 and *8) were
determined as these variations were monitored in the Laboratorium of our
co-workers (Molecular Biology, Erasmus Ziekenhuis, Antwerp). Duplication,
deletion, *3,*4 and *6 were determined using Real-Time PCR. In addition,
for duplication and deletion, the DNA fragments were separated and detected
using gelelectrophoresis. Sequencing reactions were done to check *7 and *8
and to confirm the Real-Time PCR results of *3, *4 and *6.
The volunteer was homozygous wildtype (no polymorphisms) for the
CYP2D6*3 and *6 variations (Figure VII.9.) as the melting peak of the
subject overlapped with that of the wildtype control. For *4, however, the
Ion 267.00 (266.70 to 267.70): 08032814.D\data.ms
Mianserin Mianserin-d3

Chapter VII: Therapeutic drug monitoring and pharmacogenetics of antidepressants
294
melting peaks of the Real-Time PCR demonstrated that the subject was
heterozygous for the *4 variation as two peaks were observed, one
corresponding with the wildtype and one with the *4 variant (Figure VII.9.B).
This result was confirmed by sequencing of the 1654 bp fragment as both a
guanine and adenine were identified on the 1934 position (Figure VII.9.C).
Sequencing also confirmed that the volunteer was homozygous wildtype for
the *6, *7 and *8 variations.
Figure VII. 9. Real-Time PCR and melting curve analysis of CYP2D6*3 (A),
*4, *6 (B) and sequencing result for CYP2D6*4 (C).
A
Amplification curve Melting curve
*3 *3
Volunteer & Wild type
Volunteer &
Wild type
Blank Blank
Melting peaks Volunteer
Wild type Volunteer is homozygous wildtype for *3
*3 hetero- zygous
Blank

Chapter VII: Therapeutic drug monitoring and pharmacogenetics of antidepressants
295
B
Blank Blank
Amplification curve Melting curve
Volunteer Wild type *4
Volunteer
Wild type
*4
Volunteer
*4 hetero- zygous
Blank
Wild type
Volunteer is heterozygous for *4
Volunteer is homozygous wildtype for *6
Melting peaks

Chapter VII: Therapeutic drug monitoring and pharmacogenetics of antidepressants
296
C
Figure VII.10. shows the ethidiumbromide-stained gel for analysis of CYP2D6
deletion and duplication. While in the controls for CYP2D6 duplication and
deletion, 3.5 and 3.2 kbp fragments were amplified, respectively, no bands
corresponding to these sizes were observed for the volunteer. This result was
confirmed by using Real-Time PCR and melting curve analysis (results not
shown).
Figure VII.10. Gelelectrophoresis of gene deletion and duplication fragments
of CYP2D6

Chapter VII: Therapeutic drug monitoring and pharmacogenetics of antidepressants
297
Determination of deletion, duplication, *3, *4, *6, *7, and *8 led to the
conclusion that the volunteer has at least one non-functional allelic (*4)
variant for CYP2D6. The prevalence of non-functional allelic variants for
CYP2D6 was found to be 20.7% in a healthy Dutch population according to
Tamminga et al. [34]. In addition, the most frequently observed null allele
was CYP2D6*4, which accounted for 89% of all null alleles.
Determination of the phenotype of CYP2D6 through the determined genotype
results is described in Table VII.3. Because the volunteer has at least one
non-functional allele, the phenotype of the subject likely corresponds to an
intermediate metabolizer [25, 35].
Table VII.3. Genotype translation into phenotype
*gene-activity 0 (non-active allel) = *3 - 8; *11 - 16; *19 - 21; *38, *40, *42gene-activity 0.5 (decreased activity allel)= *9, *10, *17, *29, *36, *41gene-activity 1 (active allel)= *1, *2, *33, *35
Gene-activity*ultrarapid
extensive
intermediate
1- nX1 (gene duplication)Phenotype
poor
1-11-0.5
1-00.5-0.50.5-0
0-0
VII.4.4. TDM-GEN discussion for the case report
The volunteer appears to be an intermediate metabolizer of CYP2D6
substrates as determined by the Real-Time PCR method in combination with
melting curve analysis, gelelectrophoresis and sequencing. According to
Kirchheiner et al. [19], the therapy of this phenotype would benefit with a
slightly lower dose (90%), thus a dose of 27 mg. However, normal dosages
should not lead to severe adverse reactions. In addition, Mihara et al. [36]
conclude that 30 mg is the ideal dose for intermediate metabolizers, while it

Chapter VII: Therapeutic drug monitoring and pharmacogenetics of antidepressants
298
was suboptimal for normal metabolizers. As a result, the intermediate
metabolism of CYP2D6 substrates by the volunteer is not likely to be the
underlying cause of the overdose reaction that occurred in the case report.
However, Otani et al. [32] calculates the required dose of mianserin after 18
hours of a single intake of 30 mg of mianserin through the sum of mianserin
and desmethylmianserin plasma concentrations. For the case report, Otani et
al. would suggest a dose of 20 mg/day.
Mianserin is not only metabolized by CYP2D6. The study of Mihara et al. [36]
suggests that the CYP2D6 enzyme plays a major role in metabolization of the
S-mianserin enantiomer, while metabolization of the R-enantiomer is
catalyzed by CYP1A2 and CYP3A4. Moreover, while for CYP2D6 genetic
determinants prevail over environmental factors such as smoking, use of oral
contraceptive steroids or caffeine consumption [37, 38], CYP1A2 is inhibited
by oral contraceptives [37, 39]. In case of inhibition of an enzyme, extensive
or intermediate metabolizers may be converted to poor metabolizers of
substrates of that particulary enzyme [6]. Thus, in the case report, mianserin
metabolization by CYP2D6 is slower due to the genetic variation CYP2D6*4,
while the other metabolization route via CYP1A2 is possibly inhibited by the
intake of Desorelle®, an oral contraceptive, possibly leading to slightly
elevated plasma concentrations and finally to the severe side-effects.
When analyzing the blood samples, plasma concentrations of about 9 ng/ml
mianserin and 5 ng/ml desmethylmianserin were found. As already
mentioned, comparison of these results with the ones obtained by Otani et al.
[32] reveals that these can be considered as normal therapeutic
concentrations. However, the plasma concentration for mianserin after one
intake of 30 mg ranged from 3-13 and no indication of metabolism rate was
suggested. Moreover, we must be aware that the mianserin in our case
report was measured after 15 hours of intake and no toxic symptoms were
observed at that point of time. The mianserin plasma concentrations
observed in our case are not extremely high, and no reports have been found
that linked such plasma concentrations with the observed side-effects.

Chapter VII: Therapeutic drug monitoring and pharmacogenetics of antidepressants
299
In this case, the developed TDM-GEN does not provide an answer with
respect to the cause of the adverse reactions. Probably it will be the result of
the co-medication and the genetic variations in the metabolism of mianserin,
combined with (genetic) variability of the targets in the brain and the
serotonin transporter. Variability in the P-glycoprotein transporter is probably
not so important in the case of mianserin, as for mirtazapine, a structural
analogue, no variations in concentrations due to P-glycoprotein poly-
morphism were observed [1, 40].
VII.5. Conclusion
The applicability of the developed TDM-GEN method is demonstrated in this
chapter and it is clear that this method may support the therapy of a subset
of psychiatric patients with new generation ADs, especially patients suffering
from side-effects or not responding to therapy or special patient populations
such as the elderly, children, patients with liver and kidney impairment, or
patients with a lot of co-medication.
Retrospective genotyping can explain many cases of non-response or adverse
drug reactions in patients treated with CYP2D6 substrates. However, the
genotyping of patients is probably of most interest when therapy is started.
The advantage of genotyping is that it needs to be performed only once in a
lifetime for each patient. The genotype and its resulting phenotype, together
with the information concerning the patient’s depressed state, co-medication
and co-morbidity can lead to a more rational choice of AD therapy and
necessary dose. Once therapy is started, TDM can be used to monitor
compliance and to link plasma concentrations to the clinical effect and side-
effects in the patient (Figure VII.11).
However, the interpretation of results obtained from the developed TDM-GEN
method still needs to overcome some problems and more research has to be
done before personalized AD treatment will be state of the art.
First of all, dose recommendations based on differences in pharmacokinetics
are not automatically helpful for prediction of treatment response, since

Chapter VII: Therapeutic drug monitoring and pharmacogenetics of antidepressants
300
correlation between plasma concentrations and efficacy is very poor in AD
therapy. Therefore, more research should be done concerning the link
between dose, plasma concentration, brain concentration and effect, and
between plasma concentrations and genetic, environmental and physiological
factors.
Figure VII.11. TDM-GEN procedure in clinical practice.
Adapted from [8, 19].
Determination of genotype
Therapeutic drug monitoring
Specific indication
lack of response, insufficient response, side effects at therapeutic doses, potential drug interaction, relapse, genetic polymorphism
Diagnosis of depression
Initiation of drug therapy based on phenotype
Interpretation of patient’s condition and TDM results
Optimization of drug treatment
Plasma ratio
Monitoring time 1 2 3 4
Therapeutic window
Side-effects
depressed
Secondly, it needs to be kept in mind that determination of CYP2D6 genotype
and phenotype will definitely not always result in a straightforward answer
Chapter VII: Therapeutic drug monitoring and pharmacogenetics of antidepressants
301
concerning the final pharmacokinetic effects. The pharmacokinetic effects of
the polymorphous isoenzyme finally depends on several factors such as the
importance of that specific enzyme for the metabolism of the ADs, and the
potency of the AD and its metabolite [4]. In addition, the enzyme can be
induced by co-administered drugs and variations in other CYP enzymes that
partially metabolize the substrate can also influence the pharmacokinetic
effects. Moreover, due to the complexity of drug response, single mutations
in one gene, such as the CYP2D6, are unlikely to cause the observed
variability in response. Therefore, more information should be obtained
concerning polymorphisms of other CYP isoenzymes, metabolizing enzymes
(UGT), variations in transporters (P-gp, MRP2) and targets.
Finally, the developed TDM-GEN method should be applied to a large group of
psychiatric patients to determine its value, to link plasma concentration ratios
of ADs and their metabolites to a phenotype and, if possible, to their (side-)
effects. Eventually, dose adjustments for each phenotype could be postulated
for the new generation ADs.
VII.6. References
[1] Binder E, Holsboer F. Pharmacogenomics and antidepressant drugs. Ann. Med. 2006; 38: 82-94
[2] Baumann P, Hiemke C, S. U, Eckermann G, Gaertner I, Kuss HJ, Laux G, Müller-Oerlinghausen B, Rao ML, Riederer P, Zernig G. The AGNP-TDM expert group consensus guidelines: therapeutic drug monitoring in psychiatry. Pharmacopsychiatry 2004; 37: 243-265
[3] Oscarson M. Pharmacogenetics of drug metabolising enzymes: importance for personalised medicine. Clin. Chem. Lab. Med. 2003; 41: 573-580
[4] Bondy B. Pharmacogenomics in depression and antidepressants. DialoguesClin. Neurosci. 2005; 7: 223-230
[5] Eap CB, Sirot EJ, Baumann P. Therapeutic monitoring of antidepressants in the era of pharmacogenetics studies. Ther. Drug Monit. 2004; 26: 152-155
[6] Mitchell PB. Therapeutic drug monitoring of psychotropic medications. Br. J. Clin. Pharmacol. 2000; 49: 303-312
[7] Kirchheiner J, Seeringer A. Clinical implications of pharmacogenetics of cytochrome P450 drug metabolizing enzymes. Biochim. Biophys. Acta 2007; 1770: 489-494
[8] Kirchheiner J, Nickchen K, Bauer M, Wong ML, Licinio J, Roots I, Brockmöller J. Pharmacogenetics of antidepressants and antipsychotics: the contribution of allelic variations to the phenotype of drug response. Mol. Psychiat. 2004; 9: 442-473

Chapter VII: Therapeutic drug monitoring and pharmacogenetics of antidepressants
302
[9] Ingelman-Sundberg M, Oscarson M, McLellan RA. Polymorphic human cytochrome P450 enzymes: an opportunity for individualized drug treatment Trend. Pharmacol. Sci. 1999; 20: 342-349
[10] Eichelbaum M, Ingelman-Sundberg M, Evans WE. Pharmacogenomics and individualized drug therapy. Ann. Rev. Med. 2006; 57: 119-137
[11] Ingelman-Sundberg M. Pharmacogenetics of cytochrome P450 and its applications in drug therapy: the past, present and future. Trend. Pharmacol. Sci. 2004; 25: 193-200
[12] Van der Weide J, Van Baalen-Benedek EH, Kootstra-Ros JE. Metabolic ratios of psychotropics as indication of cytochrome P450 2D6/2C19 genotype. Ther.Drug Monit. 2005; 27: 478-483
[13] Baumann P, Ulrich S, Eckermann G, Gerlach M, Kuss HJ, Laux G, Müller-Oerlinghausen B, Rao ML, Riederer P, Zernig G, Hiemke C. The AGNP-TDM expert group consensus guidelines: focus on therapeutic monitoring of antidepressants. Dialogues Clin. Neurosci. 2005; 7: 231-247
[14] Pippenger CE. Principles of drug utilization. Palo Alto: Syva Co., 1978
[15] Hamilton M. A rating Scale for depression. J. Neurol. Neurosurg. Psychiat. 1960; 23: 56-62
[16] Bengtsson F. Therapeutic drug monitoring of psychotropic drugs (TDM nouveau). Ther. Drug Monit. 2004; 26: 145-151
[17] TIAFT. The international association of forensic toxicologists. Tiaft bulletin 26 1S ( http: //www. tiaft. org/).
[18] Veefkind AH, Haffmans PMJ, Hoencamp E. Venlafaxine serum levels and CYP2D6 genotype. Ther. Drug Monit. 2000; 22: 202-208
[19] Kirchheiner J, Brosen K, Dahl ML, Gram LF, Kasper S, Roots I, Sjoqvist F, Spina E, Brockmoller J. CYP2D6 and CYP2C19 genotype-based dose recommendations for antidepressants: a first step towards subpopulation-specific dosages. Acta Psychiatr. Scand. 2001; 104: 173-192
[20] Kirchheiner J, Bertilsson L, Bruus H, Wolff A, Roots I, Bauer M. Individualized medicine-implementation of pharmacogenetic diagnostics in antidepressant drug treatment of major depressive disorders. Pharmacopsychiatry 2003; 36: S235-S243
[21] Bishop JR, Ellingrod VL. Neuropsychiatric pharmacogenetics: moving toward a comprehensive understanding of predicting risks and response. Pharmacogenomics 2004; 5: 463-477
[22] Ejsing TB, Linnet K. Influence of P-glycoprotein inhibition on the distribution of the tricyclic antidepressant nortriptyline over the blood-brain barrier. Hum.Psychopharmacol. Clin. Exp. 2005; 20: 149-153
[23] Uhr M, Grauer MT, Holsboer F. Differential enhancement of antidepressant penetration into the brain in mice with abcb1ab (mdr1ab) P-glycoprotein gene disruption. Biol. Psychiat. 2003; 54: 840-846
[24] Abou El Ela A, Härtter S, Schmitt U, Hiemke C, Spahn-Langguth H, Langguth P. Identification of P-glycoprotein substrates and inhibitors among psychoactive compounds - implications for pharmacokinetics of selected substrates. Pharm. Pharmacol. 2004; 56: 967-975
[25] Ingelman-Sundberg M, Sim SC, Gomez A, Rodriguez-Antona C. Influence of cytochrome P450 polymorphisms on drug therapies: pharmacogenetic, pharmacoepigenetic and clinical aspects. Pharmacol. Therapeut. 2007; 116: 496-526

Chapter VII: Therapeutic drug monitoring and pharmacogenetics of antidepressants
303
[26] Zanger U, Raimundo S, Eichelbaum M. Cytochrome P450 2D6: overview and update on pharmacology, genetics, biochemistry. Naunyn-Schmiedebergs Arch. Pharmacol. 2004; 369: 23-37
[27] Chiou CC, Luo JD, Chen TL. Single-tube reaction using peptide nucleic acid as both PCR clamp and sensor probe for the detection of rare mutations. Nat. Protocols 2007; 1: 2604-2612
[28] DNA sequencing race hots up. New Scientist magazine 2005; 2495: 10
[29] Müller B, Zöpf K, Bachofer J, Steimer W. Optimized strategy for rapid cytochrome P450 2D6 genotyping by real-time long PCR. Clin. Chem. 2003; 49: 1624-1631
[30] Stamer UM, Bayerer B, Wolf S, Hoeft A, Stüber F. Rapid and reliable method for cytochrome P450 2D6 genotyping. Clin. Chem. 2002; 48: 1412-1417
[31] BLAST (PubMed). http:// www. ncbi.nlm.nih.gov/blast/Blast.cgi
[32] Otani K, Mihara K, Okada M, Tanaka O, Kaneko S, Fukushima Y. Prediction of plasma-concentrations of mianserin and desmethylmianserin at steady-state from those after an initial dose of mianserin. Ther. Drug Monit. 1993; 15: 118-121
[33] Otani K, Kaneko S, Sasa H, Tsuyoshi K, Fukushima Y. Is there a therapeutic window for plasma concentratin of mianserin plus desmethylmianserin? Hum.Psychopharmacol. Clin. Exp. 1991; 6: 243-248
[34] Tamminga WJ, Wemer J, Oosterhuis B, de Zeeuw RA, De Leij LFMH, Jonkman JHG. The prevalence of CYP2D6 and CYP 2C19 genotypes in a population of healthy dutch volunteers. Eur. J. Clin. Pharmacol. 2001; 57: 717-722
[35] WINAp, Pharmacogenomics, lecture POAKC, Rotterdam, 2007
[36] Mihara K, Otani K, Tybring G, Dahl ML, Bertilsson L, Kaneko S. The CYP2D6 genotype and plasma concentrations of mianserin enantionmers in relation to therapeutic response to mianserin in depressed Japanese patients. J. Clin. Psychopharmacol. 1997; 17: 467-471
[37] Bock KW, Schrenk D, Forster A, Griese EU, Mörike K, Brockmeier D, Eichelbaum M. The influence of environmental and genetic factors on CYP2D6, CYP1A2 and UDP-glucuronosyltransferases in man using sparteine, caffeine, and paracetamol as probes. Pharmacogenetics 1994; 4: 209-218
[38] Tamminga WJ, Wemer J, Oosterhuis B, Wieling J, Wilffert B, De Leij LFM, de Zeeuw RA, Jonkman JHG. CYP2D6 and CYP2C19 activity in a large population of dutch healthy volunteers: indications for oral contraceptive-related gender differences. Eur. J. Clin. Parmacol. 1999; 55: 177-184
[39] Callahan MM, Robertson RS, Branfman AR, McComish MF, Yesair DW. Comparison of caffeine metabolism in three nonsmoking populations after oral administration of radiolabeled cafeine. Drug Metab. Dispos. 1983; 11: 211-217
[40] Sandson NB, Armstrong SC, Cozza KL. An overview of psychotropic drug-drug interactions. Psychosomatics 2005; 46: 464-494


Chapter VIII
Monitoring of antidepressants in forensic toxicology


Chapter VIII: Monitoring of antidepressants in forensic toxicology
307
VIII.1. Introduction
In forensic toxicology, analysis of a wide range of unknown compounds is
aimed, to situate the cause of death. Although the new generation ADs have
a low toxicity profile, they are often screened in forensic cases. Acute
intoxications with new generation ADs are rare and frequently follow an
intentional ingestion of a huge amount of these substances [1-9]. These
highly prescribed drugs, however, are frequently used together with other
legal or illegal drugs and can result in synergy of symptoms. In addition, drug
interactions can lead to adjusted drug concentrations due to inhibition of
cytochrome P450 isoenzymes. Furthermore severe, life-threatening
interactions such as the serotonin syndrome have been described [10-13].
The new generation ADs are often used by drug addicts under a methadone
maintained treatment because of their safety profile [14, 15], thus ADs can
be detected in these overdoses as well. Therefore, analytical methods for the
detection of ADs in blood and tissues are of interest in the field of forensic
toxicology as they are often involved in various kinds of intoxications [3, 6-9,
16].
VIII.1.1. Urine and blood analysis
Urine gives an indication of the history of drug use, while blood is the main
post-mortem matrix as it gives a direct link between the compound
concentration and the effect. However, interpretation of the blood
concentrations in post-mortem cases is not always straightforward. Several
problems have to be addressed such as changed concentrations due to post-
mortem redistribution, blood loss and trauma, stability of ADs, genetic factors
influencing metabolism, and place of blood sampling (femoral, cardial). In
addition, for the interpretation of the AD blood concentrations, reference
values in of plasma or serum are used [17]. However, it is clear that whole
blood AD concentrations can slightly differ from their plasma concentration
due to binding of amphiphilic ADs onto the red blood cell membranes.
Moreover, ADs are also stored in the cytoplasm of the red blood cells.
Partitioning of drugs into red blood cells, however, depends on their protein
binding, as only free drugs can enter the cell, and on the structure of the

Chapter VIII: Monitoring of antidepressants in forensic toxicology
compound [18, 19]. Therefore, the difference between blood and plasma
concentrations will not differ a lot for the highly plasmabound ADs. Although
TIAFT has good reference values of ADs in serum, Reis et al. [20] determined
the femoral toxic blood concentrations for several ADs. In this study, 8591
post-mortem cases were analyzed, however, only a few percentages of these
cases, involved intoxications with a single AD. This study gives an idea about
toxic ADs concentrations in blood. One must keep in mind, though, that the
described concentrations are not cut-off levels for toxicity of ADs. The
comparison of the serum concentrations (TIAFT) and concentrations in whole
blood as described by Reis et al. [20] is shown in Table VIII.1. In addition,
other parameters such as post-mortem interval (stability issues) and post-
mortem redistribution, thus place of blood collection, can make the
interpretation even harder.
Table VIII.1. Toxic and lethal blood concentrations
AD: antidepressant; Met.: metabolite; % Intox: percentage of post-mortem cases in which only one AD caused the intoxication; TIAFT: toxic or lethal (L) ADs concentrations in serum described by The International Association of Forensic Toxicologists; * case report; REIS: range of lethal ADs concentrations in blood according to Reis et al. [20].
AD Met. % Intox TIAFT (µg/ml) REIS (µg/g)Serum Blood
Citalopram 2 L 0.5 1.5-27 / mean 6.5DMC 0.2-1.3 / mean 0.5DDMC
Fluoxetine 3 1.5-2 1.5-6.1 / mean 2.2DMFluox 0.4 / L 0.9-5 0.4-1.2 / mean 0.5
Fluvoxamine 3 0.65 5.4-16Maprotiline 11 0.3-0.8 / L 1-5 2.3-16 / mean 5.1
DMMap sum 0.75-1Melitracen Mianserin 1 0.5-5 1.6-8.6 / mean 2.8
DMMia sum 0.3-0.5 /L 2 1.4-1.9 / mean 1.5Mirtazapine 1 1-4.3 / mean 2.3
DMMir sum 1 0.2-2.5 / mean 0.7Paroxetine 1 0.3 1.2-4.2 / mean 2.2ReboxetineSertraline 1 0.29* ; 1.6* 1.1-2.5 / mean 1.4
DMSer 0.4-3 / mean 1.6Trazodone 4 / L 12-15
m-cppVenlafaxine 3 6.7-95 / mean 31
ODMV sum 1-1.5 / L 6.6* 1.3-12 / mean 2.9Viloxazine
308
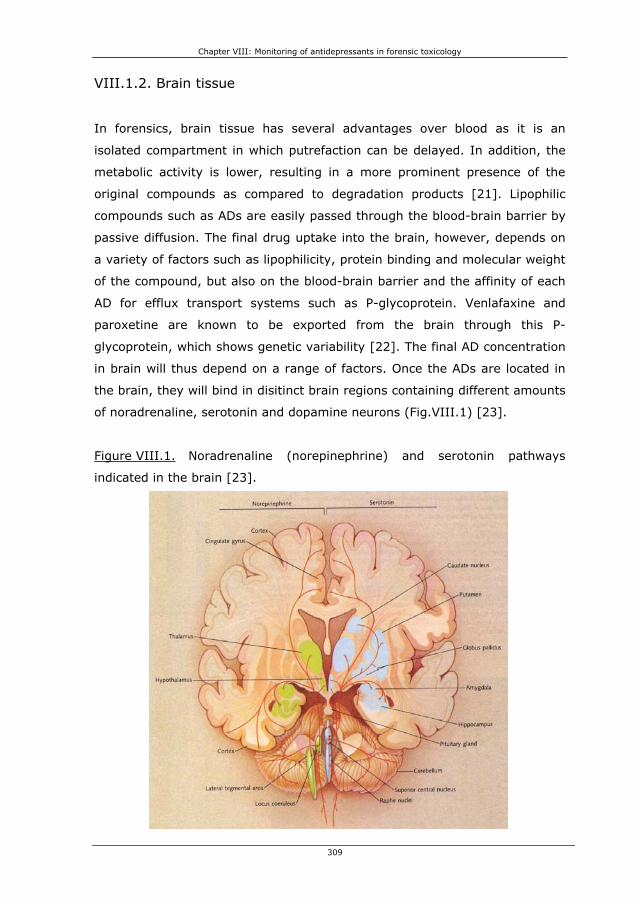
Chapter VIII: Monitoring of antidepressants in forensic toxicology
VIII.1.2. Brain tissue
In forensics, brain tissue has several advantages over blood as it is an
isolated compartment in which putrefaction can be delayed. In addition, the
metabolic activity is lower, resulting in a more prominent presence of the
original compounds as compared to degradation products [21]. Lipophilic
compounds such as ADs are easily passed through the blood-brain barrier by
passive diffusion. The final drug uptake into the brain, however, depends on
a variety of factors such as lipophilicity, protein binding and molecular weight
of the compound, but also on the blood-brain barrier and the affinity of each
AD for efflux transport systems such as P-glycoprotein. Venlafaxine and
paroxetine are known to be exported from the brain through this P-
glycoprotein, which shows genetic variability [22]. The final AD concentration
in brain will thus depend on a range of factors. Once the ADs are located in
the brain, they will bind in disitinct brain regions containing different amounts
of noradrenaline, serotonin and dopamine neurons (Fig.VIII.1) [23].
Figure VIII.1. Noradrenaline (norepinephrine) and serotonin pathways
indicated in the brain [23].
309
Chapter VIII: Monitoring of antidepressants in forensic toxicology
310
Since concentration of drugs of abuse found in the brain better reflect drug
concentration at their site of action, brain specimens could be useful in the
determination of the role of ADs and other drugs in the cause of death. In
order to analyze brain specimens in routine forensic analysis, a
comprehensive database with reliable reference values concerning ADs
concentrations and their effects should be created. However, literature data
concerning brain concentrations of new generation ADs are scarce. Martin
and Pounder [24] describe two cases of trazodone intoxication in combination
with alcohol. The blood concentrations were respectively 14.4 and 15.5
μg/ml, while the brain concentrations were 48.6 and 20.9 μg/g. Wenzel et al.
[2] observed a mirtazapine overdosage in combination with sertraline, and
amitriptyline. A femoral blood concentration of 1.03 μg/ml mirtazapine and
0.88 μg/ml sertraline was detected in combination with a brain concentration
of 0.56 μg/g for mirtazapine, 4.95 μg/g for desmethylmirtazapine and 2.57
μg/g for sertraline. Bolo et al. [25] did not analyze post-mortem cases, but
used Fluorine Magnetic Resonance Spectroscopy (F19 MRS) to analyze steady-
state brain concentration in depressed patients. Patients with a plasma
concentration of 0.356 ± 0.099 μg/ml fluvoxamine and 0.534 ± 0.309 μg/ml
fluoxetine demonstrated a steady-state brain concentration of 3.816 ± 1.59
and 4.017 ± 2.163 μg/g, respecitively. Renshaw et al. [26] also used F19 MRS
to determine fluoxetine brain levels. Their conclusion was that brain
concentrations of fluoxetine and desmethylfluoxetine were 2.6 times higher
than their plasma concentrations, this in contrast with the above mentioned
study of Bolo et al. [25] in which the ratio was 10.
It is clear that more study is definetely needed before a link between AD
brain concentrations and their effect will be established. However, brain
tissue is of interest in forensic investigation as the detection window of ADs
will be longer due to the isolation of the matrix. Moreover, determination of
ADs drug concentrations in brain tissue can also be helpful in ADs research.
The main principle of TDM is to monitor a blood or plasma concentration, to
estimate the drug concentration at the site of action [27]. However, as the
final action site of ADs is the brain, brain concentrations can lead to a better
understanding of ADs effects. More information could help solving questions
such as the unclear blood concentration-effect relationship, the action

Chapter VIII: Monitoring of antidepressants in forensic toxicology
311
mechanisms of the ADs, and the delayed therapeutic effect of ADs. Other
questions about the regional distribution, and possible accumulation of these
drugs in the brain could also be studied.
VIII.1.3. Hair
Hair analysis is a complementary approach for the detection of ADs as it
yields a picture of long-term (chronic) exposure over a time window. This
time window depends on the length of the hair, with each 0.6 to 1.4 cm of
hair describing the use per month. In addition, the sample can be stored at
room temperature for a long time without degradation [28, 29].
The hair shaft germinates from the papilla in the highly vascularized hair
follicles embedded in the dermis of the skin. The hair shafts consists of an
outer cuticle, an inner medulla and a central cortex and is composed of lipids,
trace elements, polysaccharides, water and fibrous proteins, as well as
keratinocytes and melanocytes (pigment), both generated from the basal
membrane of the hair follicles. Drugs are incorporated in the hair by passive
diffusion from blood capillaries into the growing hair cells, before final
keratinization of the hair follicle. Besides incorporation from blood during the
germination stage of the hair, ADs can also be incorporated from surrounding
tissues or from sebum and sweat during further growth of the hair. Several
factors influence the drug incorporation; the melanin content (pigmentation
of the hair), as well as the lipophilicity and the basicity of the drug. Because
the intracellular pH of keratinocytes is more acidic than plasma, ADs are
trapped into the keratinocytes and thus in the hairstructure. First non-ionized
AD molecules will diffuse across the cell membrane because of their lipophilic
characteristics; thereafter they will partially ionize and form ionic interactions
with the keratinocytes (isoelectric point ± 6). In addition, melanocytes have
a pH of 3-5, and will also trap the charged AD. Uncharged AD will bind to
melanin in the melanocytes (Figure VIII.2.) through ionic and Van der Waals
interactions. Binding to melanin and is an important mechanism, as
concentration of basic drugs is ten times higher in pigmented hair.

Chapter VIII: Monitoring of antidepressants in forensic toxicology
Figure VIII.2. Structure of the hair shaft and the incorporation mechanisms
1-4 are the incorporation mechanisms of drugs in hair: 1, incorporation from blood; 2, sebum; 3, sweat, 4; delayed incorporation from surrounding tissues. Adapted from [29].
3, 4
2
4
312
Few articles deal with the extraction of new generation ADs from hair. Smyth
et al. [30] described an LC-MS method for determination of sertraline and
paroxetine in hair. The obtained concentrations were 1.9 ng sertraline / mg
and 0.25 ng paroxetine / mg. Another LC-MS method for maprotiline,
citalopram and their metabolites was optimized by Müller et al. [31]. A hair
1
blood ADH+��AD (pH=7) AD��ADH+
(pH <5)

Chapter VIII: Monitoring of antidepressants in forensic toxicology
313
sample analyzed from a suicide case after a maprotiline overdose contained
3.1 ng maprotiline per milligram hair. The hair sample containing citalopram
was obtained from a depressed patient in therapy during the past 4 months.
In the latter hair sample, concentrations of 1107 ng/mg in the first segment
of 2 cm and 557 ng/mg in the second segment (2 cm) were obtained for
citalopram. One case of mianserin detection in hair using a GC-MS was
described by Couper et al. [32], this case represented a concentration of 9.2
ng/mg hair. Pragst et al. [33] analyzed maprotiline in hair and were the only
authors that linked the hair concentration with plasma concentrations. A hair
concentration of 1.4 till 40 (with a mean of 7.4) ng/mg maprotiline was
found, while the plasma concentration varied from 0.05 till 0.24 (with a mean
of 0.14). However, they concluded that ‘there is no way to estimate the daily
dose or steady state plasma concentration from the hair concentration or to
conclude, whether the drug really was taken every day or the prescribed
dose was taken.’
Interpretation of the ADs concentrations in hair are very difficult, due to
variations in hair growth (depending on race, sex, age and state of health
[29]), but also due to differences in sampling place, possible external hair
contamination, cosmetic hair treatment, and individual hair pigmentation
[34]. Moreover, the link between blood/plasma and hair concentration is not
yet described. This link is difficult to establish because of variations in drug
metabolism, but also because the lack of knowledge concerning drug
incorporation tendency into the hair. Therefore, more research should be
done, regarding the link between hair and plasma concentration. Untill then,
the different segments of the hair can only give an idea of the time of
consumption of several ADs.
VIII.2. Experimental
VIII.2.1. Samples and reagents
The case report samples were obtained from the department of forensic
medicine (Ghent University, Belgium). The reagents necessary for sample
preparation are described in Chapter III. The derivatization reagent 1-

Chapter VIII: Monitoring of antidepressants in forensic toxicology
314
(heptafluorobutyryl) imidazole (HFBI) was purchased from Sigma-Aldrich
(Steinheim, Germany). Promochem (Molsheim, France) delivered the internal
standards fluoxetine-d6 (Fd6) oxalate, mianserin-d3 (Md3) and paroxetine-d6
maleate (Pd6) (100 μg/ml in MeOH). Vials, glass inserts and viton crimp caps
were purchased from Agilent technologies (Avondale, PA, USA).
VIII.2.2. High Pressure Liquid Chromatography (HPLC)
A LaChrom HPLC (Merck-Hitachi, Darmstadt, Germany), consisting of a
L1700 pump, a L7200 autosampler, a L7360 column oven and a L7455 DAD
was used. A PurospherStar RP-8 endcapped 4 x 4 mm guard column
combined with a C8 endcapped PurospherStar (Merck, Darmstadt, Germany)
LiChroCART 125 mm – 4 mm I.D. (5 μm) column was used for the analysis of
trazodone and m-cpp using a HPLC-DAD configuration. The gradient run
started at 95% A (860 ml of water / 40 ml of phosphate buffer 250 mM, pH
2.3 / 100 ml of methanol) and 5% B (40 ml of phosphate buffer / 210 ml of
water/ 750 ml of methanol). At 8 minutes, the B phase contribution was
25%, and at 16 minutes 55%. Then, during 8 minutes the gradient switched
to 95% B. After 5 minutes, the run was switched to the starting conditions
and equilibrated for 12 minutes before the next injection. The DAD measured
from 220 till 350 nm and chromatograms were integrated at 230 nm. This
method was used for analysis of trazodone and m-cpp, with a total run time
of 30 minutes and m-cpp and trazodone eluting, respectively, at 11.25 and
15.16 minutes.
VIII.2.3. Gas Chromatography – Mass Spectrometry (GC-MS)
Chromatographic separation was achieved on a 30m x 0.25mm i.d., 0.25-μm
J&W-5ms column from Agilent Technologies (Avondale, PA, USA). The initial
column temperature was set at 90°C for 1 min, ramped at 50°C/min to
180°C where it was held for 10 min, whereafter the temperature was ramped
again at 10°C/min to 300°C.
The pulsed splitless injection temperature was held at 300°C, while purge
time and injection pulse time were set at 1 and 1.5 min, respectively.

Chapter VIII: Monitoring of antidepressants in forensic toxicology
Meanwhile, the injection pulse pressure was 25 psi and 1 μl of the sample,
resolved in 50 μl toluene, was injected. The separation of the derivatized ADs
and their active metabolites was achieved in 24.8 minutes. The helium flow
was constantly delivered at 1.3 ml/min during analysis.
The mass selective detector temperature conditions were 250°C for the
source, 150°C for the quadrupole and 300°C for the transferline. Methane
was used as reagent gas in PICI mode with a flow of 1 ml/min. The spectra
were monitored in selected ion monitoring (SIM) mode for quantification
(Table VIII.2.). This method was validated for plasma, blood, and brain tissue
and is discussed in detail in chapters V and VI.
Table VIII.2. Ions monitored in PICI SIM
Compounds M-ion M-ion HFB PICIQuant ion 1 ion 2
Venlafaxine 2 277 259 260 258 (56) 288 (10)m-cpp 1 196 392 393 395 (33) 373 (9.6)Viloxazine 1 237 433 434 296 (63) 414 (10)DMFluox 1 295 491 330 358 (6.6) 117 (36)Fluvoxamine 1 318 514 495 258 (304) 515 (65)ODMV 2 (-H2O) 263 441 246 244 (53) 274 (5.5)Fluoxetine 1 309 505 344 486 (3.2) 534 (4.0)Fluoxetine-d6 315 511 350 492 (4.8) 540 (5.6)Mianserin 2 264 264 265 293 (18) 305 (2.4)Mianserin-d3 267 267 268 296 (19) 308 (3.8)Mirtazapine 2 265 265 266 264 (31) 294 (17)Melitracen 2 291 291 292 290 (45) 320 (20)DMMia 2 250 446 447 427 (7.4) 475 (14)DMSer 3 291 487 275 277 (67) 487 (1.1)DMMir 2 251 447 448 428 (7.3) 476 (13)Reboxetine 3 313 509 372 510 (6.6) 490 (5.3)Citalopram 3 324 324 325 305 (10) 353 (22)DMMap 3 263 459 460 382 (56) 431 (10)Maprotiline 3 277 473 474 454 (11) 396 (37)Sertraline 3 305 501 275 277 (66) 501 (3.0)DDMC 3 296 492 475 521 (20) 493 (4.0)DMC 3 310 506 489 507 (5.7) 535 (21)Paroxetine 3 329 525 526 506 (15) 554 (17)Paroxetine-d6 332 531 532 512 (16) 560 (18)
Relative intensity % between bracketsIS: 1 (fluoxetine-d6); 2 (mianserin-d3); 3 (paroxetine-d6)
VIII.3. Case reports
Five post-mortem cases are discussed to demonstrate the usefulness of the
optimized and validated GC-MS method in forensic toxicology. Urine, stomach
content and blood were screened using our laboratory systematic
toxicological screening (STA) system to situate each case. Matrices such as
whole blood, brain tissue and hair were thereafter analyzed using our
315

Chapter VIII: Monitoring of antidepressants in forensic toxicology
developed GC-MS method. Femoral blood was obtained, while six different
locations were analyzed in the brain tissue, i.e. frontal, parietal, temporal and
occipital lobe, the cerebellum and the brainstem. Hair samples were sampled
at the vertex site of the head and cut into segments of approximately 2 cm
after a wash to eliminate external contamination. However, for case 1 and 2
there was not enough blood to perform the GC-MS analysis. Hair samples
were only available for case 3 and 4.
ADs were extracted from these matrices by an optimized solid phase
extraction as discussed in Chapter III. The optimization and validation of the
GC-MS method was extensively discussed in chapters V and VI. The GC-MS
method with electron ionization is the preferred technique for drug analysis in
forensics allowing identification of unknown compounds by comparison of
their mass spectrum with a large collection of reference mass spectra in
commercially available libraries. However, due to the extensive
fragmentation of several ADs in the EI-mode, the positive ion chemical
ionization mode (PICI) was chosen to evaluate the post-mortem cases as this
technique provides more selectivity in complex matrices such as brain tissue.
Trazodone and its metabolite m-chlorophenylpiperazine were analyzed using
a HPLC-DAD method due to chromatographic problems of trazodone in the
GC-MS analysis.
Table VIII.3. Summary of the AD concentrations found in blood, brain and
hair for the different cases
nd, not detected; italic, concentration < LOQ
Case 1 4 5Sex male female male male femaleAge 39 40 27 43 92Brain weight (g) 1400 1220 1550 1700 1135Cause of death hanging respiratory depression respiratory depression arrhythmias and respiratory depression sudden cardiac death
Compound Ser / DMSer Fluox / DMF Fluox / DMF Traz / mcpp Ser / DMSer Traz / mcpp Cit / DMC Cit/DMCBlood conc. (ng/ml) 600 / nd 1640 / nd 93 / 185 nd 191 / 104 14 /18Brain conc. (ng/g) Temporal lobe 11781 / 4336 127 / 63 4454 /3762 75 / 26 1466 / 3624 492 / 112 53 / 64 27 /24
Parietal lobe 9684 / 2909 306 / 159 4611 / 3800 85 / 50 1924 / 4517 119 / nd 95 / 59 187/43Occipital lobe 10858 / 3294 135 / 76 4673 / 4228 115 / 34 2008 / 4280 661 / 138 251 / 72 148/43Frontal lobe 8544 / 2893 63 / 49 4979 / 4312 90 / 21 1750 / 4392 556 / 139 196 / 54 30 /22
Stem 9297 / 1955 106 / 68 4822 / 4515 82 / nd 1671 / 3172 77 / nd 174 / 62 107/35Cerebellum 11002 / 3391 18 / nd 3656 / 2556 108 / 24 993 / 2319 85 / nd 162 / 55 125/31
Hair conc. (ng/mg) segment 1 - / - 0.6 / 0.5 2.5 / 1.9segment 2 / 0.4 0.8 / 1.4 - / -segment 3 / 0.8 1.6 / 2.6
2 3
316

Chapter VIII: Monitoring of antidepressants in forensic toxicology
317
VIII.3.1. Case 1
A 39-year old male committed suicide by hanging. After screening, sertraline
(600 ng/ml) was found in blood in combination with caffeine and cotinine.
After analysis of the urine and stomach contents using HPLC-DAD, a
concentration of 2600 and 1100 ng/ml was measured, respectively.
According to The International Association of Forensic Toxicologists [17], the
therapeutic range of sertraline in plasma ranges from 50-250 ng/ml, but
therapeutic concentrations of 500 ng/ml are also observed. Toxic
concentrations vary between 290 and 1600 ng/ml. The observed sertraline
concentration in this case is above the therapeutic range and could lead to
side-effects, but is not the cause of death. Because of the urine and stomach
contents concentration, we can suggest a regular intake of sertraline and in
addition, a recent intake before the patient’s death. Thus, probably a peak
steady-state concentration is observed in this case.
Sertraline concentrations were determined in six different locations in the
brain. While sertraline binds on specific binding sites in the brain to create an
effect, it is clear that in this case it is homogeneously distributed over the
brain tissue as shown in Table VIII.3. In this case, the brain concentration of
sertraline is 17 times higher than the plasma concentration. Bolo et al. [25]
examined the brain/plasma concentration relationship for other SSRI’s
(fluoxetine and fluvoxamine) in vivo through 19F magnetic resonance
spectroscopy. They concluded that the steady-state brain concentration of an
SSRI is about 10 times higher than its plasma concentration. This ratio is
compatible with the reported distribution volumes of the compounds,
indicating a considerable uptake of the SSRI into tissue spaces. We must
point out, however, that because of the amphiphilic character of ADs a
comparison between brain/blood and brain/plasma ratios is not
straightforward as ADs bind to the membranes of red blood cells [18, 19].
In the brain tissue, a small amount of fluoxetine and desmethylfluoxetine was
also determined, while these compounds were not detected in blood. This
leads to the conclusion that fluoxetine was administered for a certain time in

Chapter VIII: Monitoring of antidepressants in forensic toxicology
the past, explaining the lower concentration in the brain tissue.
Unfortunately, no hair samples were provided in this case.
Figure VIII.3. GC-MS chromatogram of the six different brain tissue samples
(frontal, temporal, parietal, and occipital lobe, cerebellum and stem) in case
1
Sertraline and desmethylsertraline can be observed in high concentrations. In the enlargement, fluoxetine, desmethylfluoxetine and the internal standard Fd6 (200 ng) can be detected
318
14.00 15.00 16.00 17.00 18.00 19.00 20.00 21.00 22.00 23.00 24.00
200000
400000
600000
800000
1000000
1200000
1400000
1600000
1800000
2000000
2200000
2400000
bundance
TIC: Frontal lobe
A
TIC: Temporal lobeTIC: Parietal lobeTIC: Occipital lobeTIC: CerebellumTIC: Stem
ime-->
DMSer
Sertraline
T
14.60 14.80 15.00 15.20 15.40 15.60 15.80 16.00 16.20 16.40 16.600
1000
2000
3000
4000
5000
6000
7000
8000
9000
10000
11000
12000
13000
14000
15000
bundance
TIC: Frontal lobe
A
TIC: Temporal lobeTIC: Parietal lobeTIC: Occipital lobeTIC: CerebellumTIC: Stem
DMFluox
Fluoxetine
Fd6
ime-->T

Chapter VIII: Monitoring of antidepressants in forensic toxicology
319
VIII.3.2. Case 2
The cause of death in this case was a polydrug intoxication, namely a
combination of bromazepam (160 ng/ml), lorazepam (50 ng/ml), morphine
(38 ng/ml), acetaminophen (1430 ng/ml), ethanol (1.36 g/l), clotiapine (600
ng/ml) and fluoxetine (1640 ng/ml). Due to the combined presence of these
products in the blood, central nervous system suppression occurred, with a
resultant lethal cardio-respiratory depression. The urinary level of fluoxetine
was 4750 ng/ml, while in the stomach contents fluoxetine reached the level
of 260 ng/ml. Fluoxetine and desmethylfluoxetine were homogenously
distributed in the brain with a mean concentration of 4532 and 3862 ng/g,
respectively.
The fluoxetine blood concentration is toxic, but not lethal, as the therapeutic
concentration ranges between 100 and 450 ng/ml, while toxic concentrations
range from 1500 to 2000 ng/ml [17]. According to Bolo et al. [25], the
steady-state brain concentration of the sum of fluoxetine and its active
metabolite desmethylfluoxetine ranges from 1800 to 6000 ng/g, and is lower
than the sum of 8394 ng/g in this case. In addition, the brain concentration
of desmethylfluoxetine is almost as high as the fluoxetine concentration
which might be explained by the elimination half-life difference, 4 to 6 days
for the parent drug and 4-16 days for the metabolite [35]. The brain/blood
fluoxetine ratio of 2.8 in our case is comparable to the brain/plasma
correlation of 2.6 for the sum of fluoxetine and desmethylfluoxetine found by
Renshaw et al. [26]. However, the ratio is much lower than the ratio of 10
described by Bolo et al. [25]. This ratio is compatible with the reported
distribution volumes of the compounds, indicating a considerable uptake of
the SSRI into tissue compartments. However, as ADs can bind to red blood
cell membranes due to their amphiphilic character [18, 19], it is clear that
the comparison between brain/blood and brain/plasma results is not obvious.
VIII.3.3. Case 3
The cause of death of this person was a polydrug intoxication, in which high
morphine levels were found and thus this decease did in fact not immediately

Chapter VIII: Monitoring of antidepressants in forensic toxicology
320
relate to the ADs concentrations, but was due to a suppression of the central
nervous system, with cardio-respiratory depression caused by high amounts
of opiates (2.4 μg/ml) in the blood. Sertraline and desmethylsertraline
(DMSer) were found in blood at a level of 93 and 185 ng/ml, respectively.
The mean brain concentration was 1635 ng/g for sertraline and 3717 ng/g for
DMSer. Trazodone and m-cpp were also detected in brain tissue. The
quantification of these compounds occurred using HPLC-DAD. A mean
concentration of 93 and 31 ng/g was found for trazodone and m-cpp,
respectively. In urine, a trazodone concentration of 142.7 ng/ml was
monitored, while trazodone was not detected in blood.
In addition, hair samples were analyzed for this case. A hair sample with a
length of 5.5 cm was taken from the vertex and cut into 2 fragments of 2 cm
and one of 1.5 cm, giving a time window of approximately 2 months per
segment. The first fragment, thus closest to the scalp (20 mg) contained 0.6
ng sertraline / mg and 0.5 ng DMSer / mg. The second fragment (61.2 mg)
contained 0.8 ng sertraline / mg, 1.4 ng DMSer / mg and 0.4 ng mcpp / mg.
The third fragment contained 1.6, 2.6, and 0.8 ng/mg of sertraline, DMSer,
and m-cpp, respectively.
According to The International Association of Forensic Toxicologists [17], the
therapeutic range of sertraline in plasma ranges from 50-250 ng/ml, but
therapeutic concentrations of 500 ng/ml are also observed. Toxic
concentrations vary between 290 and 1600 ng/ml. The observed sertraline
concentration in this case is thus within the lower therapeutic range.
Sertraline was not present in urine nor in the stomach contents and
therefore, a non-compliance of the prescribed therapy must be suspected.
Sertraline concentrations were determined in 6 different locations in the
brain. While sertraline binds on specific binding sites in the brain to create an
effect, it is clear that in this case it is homogeneously distributed over the
brain tissue as shown in Table VIII.3. Calculation of the brain/blood sertraline
ratio provided a value of 17.6. This value is higher, but in the range of the
proposed ratio of 10 for SSRI’s by Bolo et al. [25]. The ratio of
sertraline/DMSer in hair is 1.2 in the first segment, while it was 0.5 and 0.6
for segment 2 and 3, maybe due to stability issues. It is clear from the hair

Chapter VIII: Monitoring of antidepressants in forensic toxicology
and urine analysis, that there was a regular but not daily intake of sertraline
during the past six months.
Figure VIII.4. GC-MS chromatograms obtained from a blood (A), brain tissue
(B) and hair extract (C) for case 3
DMSer, desmethylsertraline; m-cpp, m-chlorophenylpiperazine; Fd6, deuterated fluoxetine internal standard; Md3, deuterated mianserin internal standard; Pd6,deuterated paroxetine internal standard
A
321
Abundance
TIC: Femoral blood case 3
13.00 14.00 15.00 16.00 17.00 18.00 19.00 20.00 21.00 22.00 23.00
5000
10000
15000
20000
25000
30000
Time-->
Pd6
Sertraline
DMSer
Fd
Md3
6
B
13.00 14.00 15.00 16.00 17.00 18.00 19.00 20.00 21.00 22.00 23.00
100000
200000
300000
400000
500000
600000
700000
800000
900000
1000000
1100000
bundance
TIC: Brain tissue parietal lobe case 3
A
DMSer
Sertraline
Pd6
Time-->
Md3
Fd6
12.00 12.50 13.00 13.50 14.00 14.50
400
500
600
700
800
900
1000
1100
1200
1300
1400
Time-->
Abundance
TIC: 07081020.D\data.ms
m-cpp

Chapter VIII: Monitoring of antidepressants in forensic toxicology
C
13.00 14.00 15.00 16.00 17.00 18.00 19.00 20.00 21.00 22.00 23.000
5000
10000
15000
20000
25000
30000
35000
40000
45000
50000
55000
60000
65000
70000
75000
80000
Time-->
Abundance
TIC: Methanol wash case 3 TIC: Hair segment 1 case 3TIC: Hair segment 2 case 3TIC: Hair segment 3 case 3
Fd6
Md3
Pd6
12.60 12.80 13.00 13.20 13.40 13.60 13.80 14.000
200
400
600
800
1000
1200
1400
1600
1800
2000
2200
2400
Time-->
Abundance
m-cpp
20.20 20.40 20.60 20.80 21.00 21.20 21.40 21.60 21.80 22.000
500
1000
1500
2000
2500
3000
3500
4000
4500
5000
5500
6000
6500
7000
7500
8000
8500
9000
9500
10000
10500
Time-->
Abundance
Sertraline
DMSer
The level of trazodone in brain tissue was 200 to 500 times lower than
concentrations found by Martin and Pounder [24]. These authors described
intoxications in which about 700 mg of trazodone was ingested, leading to a
blood level of 15 000 ng/ml and a urine level of 20 000 ng/ml. In our case,
however, neither trazodone nor its metabolite was found in blood. The
urinary concentration of trazodone, and the presence of its metabolite m-cpp
in hair leads to the conclusion that trazodone was administered at a more
postponed point in time, explaining the lower concentration in the brain
tissue. This case demonstrates that ADs can still be determined in brain
tissue, even when they are no longer present in blood, providing information
about the treatment and administration of AD drugs before death.
VIII.3.4. Case 4
In this case large amounts of cocaine (3.43 μg/ml), amphetamine (4.5
μg/ml) and morphine (167 ng/ml) were found in blood which could induce
death due to cardiac arrhythmias (cfr. stimulants) and/or respiratory
depression (cfr. opiates). Other compounds found in blood were ethanol
(0.22 g/l), acetaminophen (1.23 μg/ml), and caffeine (2.6 μg/ml). The urine
contained other drugs such as citalopram (5.38 μg/ml), ibuprofen (218
ng/ml), fentanyl (5.6 ng/ml), trazodone metabolites (6.95 μg/ml) and
benzodiazepines (1.8 μg/ml). The stomach contents contained morphine
322

Chapter VIII: Monitoring of antidepressants in forensic toxicology
323
(5.56 μg/ml), cocaine (500 μg/ml), trazodone (115 μg/ml), citalopram (1.12
μg/ml), alprazolam (236 ng/ml), acetaminophen (19.4 μg/ml) and caffeine
(0.6 μg/ml). This drug addict had used illegal substances (such as cocaine,
amphetamines, and heroin), in combination with ethanol and the ADs,
trazodone and citalopram.
Trazodone and m-cpp were detected in brain tissue although they were not
found in blood. A mean concentration of 332 ng/g was found for trazodone,
while a mean of 130 ng/g was found for m-cpp in the frontal, occipital and
temporal lobe. Citalopram and its demethylated metabolite were found in
brain tissue with a mean concentration of 155 and 61 ng/g, respectively.
Blood concentrations as determined by GC-MS were 194 and 104 ng/ml,
respectively.
Dark brown hair with a length of 6 cm was taken from the vertex and cut into
2 fragments of 3 cm because of the limited amount available. The first
fragment (closest to the scalp; 23.2 mg) contained 2.5 ng citalopram / mg
and 1.9 ng DMC / mg. The second fragment (27.3 mg) did not contain any
AD.
ADs use in illegal polydrug abuse (such as cocaine, heroin) is often found.
Drug addicts under methadone treatment are often depressed and treated
with the low toxic new generation ADs [14, 15]. As trazodone and citalopram
were found in the stomach contents, it can be presumed that the drugs were
ingested in the hours prior to death leading to an incomplete absorption of
the substances. Trazodone was not found in blood, however, it was detected
in combination with its metabolite m-cpp in brain tissue and its metabolites
were found in urine. Therefore, occasional use of trazodone by this subject is
suspected.
Citalopram was detected in blood, brain, urine and stomach contents. The
presence of citalopram in the brain could be due to rapid migration and
storage in this compartment or rather be an indication of previously
consumed citalopram. Moreover, the brain/blood ratio is quite low (0.8) as
compared to case 5, which could be explained by the recent and irregular

Chapter VIII: Monitoring of antidepressants in forensic toxicology
324
intake in drug addict, while for case 5 a steady-state AD therapy was
presumed. The DMC/Citalopram ratio ranges from 0.3-1.2 with a mean of
0.51, with the highest ratio observed in the temporal lobe. The
DMC/Citalopram ratio is comparable to case 5.
Referring to the citalopram concentrations substantiated in the hair
fragments, we can conclude that the use of citalopram occurred during the
past 3 months.
VIII.3.5. Case 5
A 92-year old lady died suddenly and unexpectedly during admission in
hospital. As her death was unforeseen, a forensic autopsy was ordered. This
old-age woman was known to be depressive and tired of her life; therefore
she received an AD. In urine, 315 ng/ml citalopram was detected, while 114
ng/ml caffeine was measured during screening of the post-mortem blood
sample. Analysis of the blood sample with the GC-MS method resulted in a
citalopram concentration of 14.1 ng/ml and a desmethylcitalopram (DMC)
concentration of 18.3 ng/ml. The mean brain concentration was 104 ng
citalopram/g.
The blood levels of citalopram and its metabolite desmethylcitalopram are
subtherapeutic as therapeutic concentrations range from 20 till 200 ng/ml
[17]. The brain concentrations of these substances were sampling-
dependent, with the highest concentrations in the parietal and occipital lobe,
and in the cerebellum. The DMC/citalopram ratio ranged from 0.3 till 0.9 with
a mean of 0.45. The highest ratio is seen in the temporal lobe. The same
ratio is seen in case 4 were DMC/Citalopram ranged from 0.3-1.2 with a
mean of 0.51 and again the highest ratio is observed in the temporal lobe.
Referring to the brain/blood ratio of 7, it can be concluded that citalopram
penetrates the brain rather easily. In addition, it can be presumed by these
data that the detection of citalopram and his metabolite might still be
possible when these substances are below limit of quantitation in blood.

Chapter VIII: Monitoring of antidepressants in forensic toxicology
325
VIII.4. Conclusion
The developed solid phase extraction and GC-MS method in PICI mode for
the simultaneous determination of several new generation ADs and their
active metabolites in brain tissue was validated and tested on post-mortem
samples. Several ADs were detected and quantified in six brain regions.
Although ADs are selectively bound to receptors located in specific brain
regions, it was clear that the ADs spread rather homogeneously over the
total brain content in most cases. It cannot be excluded that this distribution
is also increased due to post-mortem redistribution of the ADs, following
liberation from their binding sites. Therefore, in post-mortem analysis, a
detailed location of a brain sample is in fact of no importance for the
quantitative result as shown by the case reports. However, more case reports
with different types of antidepressants should be analyzed in the future to
confirm this finding.
A possible advantage of post-mortem toxicological brain analysis is that ADs
can still be determined in brain tissue, even when they are no longer present
in blood, providing information about the treatment and administration of AD
drugs in those cases. However, as described in chapter VI long term stability
of low concentrations of ADs is lower as compared to their stability in blood
or plasma.
The link between blood levels and the drug-concentration at the effector site
(the brain) for a specific clinical response is of importance. For 2 cases, a
brain/blood ratio of approximately 17 was seen for sertraline. However, due
to the small number of cases, this link could not be determined. In addition,
variables such as P-glycoprotein polymorphism, interval between the last
time of ingestion and death, treatment period, and patient compliance could
alter the brain/blood ratio.
The quantitative results from hair samples are hard to interpret as the link
between incorporation in the hair and blood level / effect is not known. In
addition, incorporation of the ADs in hair also depends on the type of hair
pigmentation and physical state.
Chapter VIII: Monitoring of antidepressants in forensic toxicology
326
However, hair analysis can give more information of the long-term exposure
of ADs. While blood is still the preferred matrix to link concentration and
effect, analysis of brain tissue and hair can provide additional information.
These matrices are certainly of interest to investigate decayed corpses, or to
have a longer detection window. Especially, hair samples give information on
the consumption pattern of the ADs in the past.
VIII.5. References
[1] Kincaid RL, McMullin MM, Crookham SB, Rieders F. Report of a fluoxetine fatality. J. Anal. Toxicol. 1990; 14: 327-329
[2] Wenzel S, Aderjan R, Mattern R, Pedal I, Skopp G. Tissue distribution of mirtazapine and desmethylmirtazapine in a case of mirtazapine poisoning. Forensic Sci. Int. 2006; 156: 229-236
[3] Goeringer KE, Raymon L, Christian GD, Logan BK. Postmortem forensic toxicology of selective serotonin reuptake inhibitors: A review of pharmacology and report of 168 cases. J. Forensic Sci. 2000; 45: 633-648
[4] Keller T, Zollinger U. Gas chromatographic examination of postmortem specimens after maprotiline intoxication. Forensic Sci. Int. 1997; 88: 117-123
[5] Luchini D, Morabito G, Centini F. Case report of a fatal intoxication by citalopram. Am. J. Forensic Med. Path. 2005; 26: 352-354
[6] de Meester A, Carbutti G, Gabriel L, Jacques JM. Fatal overdose with trazodone: Case report and literature review. Acta Clin. Belg. 2001; 56: 258-261
[7] Azaz-Livshits T, Hershko A, Ben-Chetrit E. Paroxetine associated hepatotoxicity: A report of 3 cases and a review of the literature Pharmacopsychiatry 2002; 35: 112-115
[8] Goeringer KE, McIntyre IM, Drummer OH. Postmortem tissue concentrations of venlafaxine. Forensic Sci. Int. 2001; 121: 70-75
[9] Kelly CA, Dhaum N, Laing WJ, Strachan FE, Good AM, Bateman DN. Comparative toxicity of citalopram and the newer antidepressants after overdose. J. Toxicol.-Clin. Toxicol. 2004; 42: 67-71
[10] Rogde S, Hilberg T, Teige B. Fatal combined intoxication with new antidepressants. Human cases and an experimental study of postmortem moclobemide redistribution. Forensic Sci. Int. 1999; 100: 109-116
[11] Singer PP, Jones GR. An uncommon fatalilty due to moclobemide and paroxetine. J. Anal. Toxicol.1997; 21: 518-520
[12] McIntyre IM, King VK, Staikos V, Gall J, Drummer OH. A fatality involving moclobeemide, sertraline, and pimozide. J. Forensic Sci. 1997; 42: 951-953
[13] Dams R, Benijts THP, Lambert WE, Van Bocxlaer JF, Van Varenbergh D, Peteghem CV, De Leenheer AP. A fatal case of serotonin syndrome after combined moclobemide-citalopram intoxication. J. Anal. Toxicol. 2001; 25: 147-151

Chapter VIII: Monitoring of antidepressants in forensic toxicology
327
[14] Hamilton SP, Nunes EV, Janal M, Weber L. The effect of sertraline on methadone plasma levels in methadone-maintenance patients. AM. J. Addict.2000; 9: 63-69
[15] Petrakis I, Carroll KM, Nich C, Gordon L, Kosten T, Rounsaville B. Fluoxetine treatment of depressive disorders in methadone-maintained opioid addicts. Drug Alcohol Depend. 1998; 50: 221-226
[16] Adson DE, Erickson-Birkedahl S, Kotlyar M. An unusual presentation of sertraline and trazodone overdose. Ann. Pharmacother. 2001; 35: 1375-1377
[17] TIAFT. The international association of forensic toxicologists: http: //www. tiaft. org/. Tiaft bulletin 26 1S
[18] Fisar Z, Fuksova K, Sikora J, Kalisova L, Velenovska M, Novotna M. Distribution of antidepressants between plasma and red blood cells. Neuroendocrinol. Lett. 2006; 27: 307-313
[19] Hinderling PH. Red blood cells: a neglected compartment in pharmacokinetics and pharmacodynamics. Pharmacol. Rev. 1997; 49: 279-295
[20] Reis M, Ahlner J, Druid H. Reference concentrations of antidepressants. A compilation of postmortem and therapeutic levels. J. Anal. Toxicol. 2007; 31: 254-264
[21] Stimpfl T, Reichel S. Distribution of drugs of abuse with specific regions of the human brain. Forensic Sci. Int. 2007; 170: 179-182
[22] Löscher W, Potschka H. Role of drug efflex transporters in the brain for drug disposition and treatment of brain diseases. Prog. Neurobiol. 2005; 76: 22-76
[23] Snyder SH. Drugs and the brain. New York: WH. Freeman and Company, 1999, pp 228.
[24] Martin A, Pounder DJ. Postmortem Toxicokinetics of Trazodone. Forensic Sci. Int. 1992; 56: 201-207
[25] Bolo NR, Hode Y, Nedelec JF, Laine E, Wagner G, Macher JP. Brain pharmacokinetics and tissue distribution in vivo of fluvoxamine and fluoxetine by fluorine magnetic resonance spectroscopy. Neuropsychopharmacol.2000; 23: 428-438
[26] Renshaw PF, Guimaraes AR, Fava M, Rosenbaum JF, Pearlman JD, Flood JG, Puopolo PR, Clancy K, Gonzalez RG. Accumulation of fluoxetine and norfluoxetine in human brain during therapeutic administration. Am. J. Psychiatry 1992; 148: 1592-1594
[27] Burke MJ, Preskorn SH. Therapeutic drug monitoring of antidepressants - Cost implications and relevance to clinical practice. Clin. Pharmacokinet. 1999; 37: 147-165
[28] Musshoff F, Madea B. Analytical pitfalls in hair testing. Anal. Bioanal. Chem.2007; 388: 1475-1494
[29] Pragst F, Balikova M. State of the art in hair analysis for detection of drug and alcohol abuse. Clin. Chim. Acta 2006; 370: 17-49
[30] Smyth WF, Leslie JC, McClean S, Hannigan B, McKenna HP, Doherty B, Joyce C, O'Kane E. The characterisation of selected antidepressant drugs using electrospray ionisation with ion trap mass spectrometry and with quadrupole time-of-flight mass spectrometry and their determination by high-performance liquid chromatography/electrospray ionisation tandem mass spectrometry. Rapid Commun. Mass Spectrom. 2006; 20: 1637-1642

Chapter VIII: Monitoring of antidepressants in forensic toxicology
328
[31] Müller C, Vogt S, Goerke R, Kordon A, Weinmann W. Identification of selected psychopharmaceuticals and their metabolites in hair by LC/ESI-CID/MS and LC/MS/MS. Forensic Sci. Int. 2000; 113: 415-421
[32] Couper FJ, McIntyre IM, Drummer OH. Detection of antidepressant and antipsychotic-drugs in postmortem human scalp hair. J. Forensic Sci. 1995; 40: 87-90
[33] Pragst F, Rothe M, Hunger J, Thor S. Structural and concentration effects on the deposition of tricyclic antidepressants in human hair. Forensic Sci. Int.1997; 84: 225-236
[34] Srogi K. Hair analysis as method for determination of level of drugs and pharmaceutical in human body: review of chromatographic procedures. Anal.Lett. 2007; 39: 231-258
[35] Moffat AC, Osselton MD, Widdop B. Clarke's analysis of drugs and poisons in pharmaceuticals, body fluids and postmortem material. 3th Ed. London: Pharmaceutical Press, 2004, pp 1935.

Chapter IX
General conclusion

Chapter IX: General Conclusion
331
According to the World Health Organization, depression will be the second
leading contributor to the global burden of disease, calculated for all ages and
both sexes by the year 2020. Therefore, the prescription rate of
antidepressants will increase, resulting in a growing interest for
determination methods in the clinical and forensic field. As a result, in this
thesis, a gas chromatographic-mass spectrometric method for the
determination of thirteen new generation antidepressants and their
metabolites was developed, validated and applied in clinical as well as
forensic settings.
The major part of this work is the optimization of the analytical aspects of the
method. Because the method had a broad range of possible applications, this
thesis reflects possible pros en cons during the different stages in the
development and optimization of the method. Antidepressants were extracted
using solid phase extraction from different matrixes such as plasma, whole
blood, brain and hair tissues for clinical or forensic applications. The mass
spectrometric conditions, especially conditions concerning ionization, were
thoroughly investigated. While the traditional electron ionization mode is
most useful in clinical settings, it is clear that positive ion chemical ionization
has its benefits for demanding matrices in forensic settings, while negative
ion chemical ionization can lead to extreme sensitivities if necessary. After
the optimization of the gas chromatographic-mass spectrometric method, it
was validated based on the FDA guidelines to ensure good quantification
results. Finally, the usefulness of the method was demonstrated by a
preliminary study concerning monitoring of antidepressants in combination
with CYP2D6 genotyping and by analyzing five post-mortem cases.
Although it is clear that not all antidepressants and their metabolites are
adequately quantified with this method, we are sure that this thesis can be a
helpful guideline to develop a specific method for a specific antidepressant in
a specific setting. In addition, it is clear that this method is able to determine
antidepressants in different forensic matrices, leading to more information
concerning the case. However, in the future, more research should be
performed concerning the relationship between antidepressant blood and
brain concentrations and the final effect, before interpretation of brain

Chapter IX: General Conclusion
332
antidepressant concentrations can be straightforward. Moreover, it is also
clear that this method has its purpose in psychiatric clinics as demonstrated
by the preliminary study combining the gas chromatographic-mass
spectrometric method to determine antidepressant plasma concentrations
and the genotyping of the antidepressant metabolizing enzyme CYP2D6.
However, we sincerely hope that in the near future, the TDM-GEN method, as
described in chapter VII, will be applied in a large scale psychiatric clinic, to
evaluate its use.


SUMMARY
This work describes the optimization, validation and application of a gas
chromatographic-mass spectrometric method for the quantification of new
generation antidepressants and their active metabolites in plasma, blood,
brain tissue and hair samples.
In chapter I an overview is given of the published literature concerning the
new generation antidepressants. This introduction discusses the onset of
depression and the treatment, including the action mechanisms, side-effects
and toxicity of antidepressants in general. Moreover, the potential values of
therapeutic drug monitoring and toxicological assays for these drugs are
discussed in relation to their mode of action, drug interactions, metabolism
and pharmacokinetic properties. We must not forget that depression affects
both economic and social functions of about 121 million people worldwide,
leading to substantial impairment in an individual’s ability to take care of his
or her everyday responsibilities and at its worst can lead to suicide. Although
the serious progress in antidepressant drug therapy, there still are a number
of problems such as non-responding therapy, poor patient compliance and
serious side-effects. Therefore, development of analytical methods to monitor
plasma concentration during antidepressant therapy, to investigate forensic
cases or to do fundamental research concerning their site of action is of
interest.
This work focuses on the development of an analytical method for the
quantification of new generation antidepressants and their metabolites. The
monitored antidepressants were selected based on their importance in the
seven major antidepressant markets (Japan, USA, France, United Kingdom,
Italy, Spain, Germany) according to the Cognos Plus Study #11 and on the
AGNP-TDM Expert Group Consensus Guidelines. The following anti-
depressants and metabolites were monitored: citalopram, fluoxetine,
fluvoxamine, maprotiline, melitracen, mianserin, mirtazapine, paroxetine,
reboxetine, sertraline, trazodone, venlafaxine, viloxazine, desmethyl-
citalopram, didesmethylcitalopram, desmethylfluoxetine, desmethyl-
maprotiline, desmethylmianserin, desmethylmirtazapine, desmethyl-
sertraline, m-chlorophenylpiperazine, and O-desmethylvenlafaxine.

Chapter II summarizes the objectives of this work. These objectives were
first of all the development of a quantitative GC-MS method for the new
generation antidepressants, secondly its applicability in clinical as well as
forensic settings.
The analytical development of the gas chromatographic-mass spectrometric
method was the core of the research subject. The analytical development was
discussed in chapters III, IV, and V.
A very important step in the development of an analytical method is the
extraction of the compounds of interest from the biological matrix as this will
have implications on the overall sensitivity and selectivity of the method.
Therefore, extraction of antidepressants using a solid phase extraction (SPE)
was throughout discussed in chapter III. The SPE was developed by
extracting antidepressant spiked water samples, using a high pressure liquid
chromatographic method with diode array detection as monitoring technique.
Thereafter, the developed SPE procedure was optimized, using the final gas
chromatographic method, for biological matrices such as plasma, blood, brain
tissue and hair samples, as the extraction of antidepressants from these
matrices is of interest in the field of clinical and forensic toxicology. During
this optimization factors such as matrix consistence, lipophilicity, protein
content and stability were considered to obtain an optimal SPE method for
each matrix, finally resulting in high and reproducible antidepressant
extraction recoveries.
In chapter IV, derivatization of antidepressants was discussed.
Derivatization is a common sample preparation technique before gas
chromatographic analysis to improve the volatility, peak shape and detector
response of the analyte. Different acylation reagents and procedures were
compared in this chapter. Heptafluorobutyrylation of antidepressants and
their metabolites using heptafluorobutyrylimidazole was finally chosen as this
led to a reproducible derivatization with good peak shapes for most
antidepressants. In addition, heptafluorobutyrylation led to a single sample
preparation for the three possible ionization modes, with a highly sensitive
analysis using negative ion chemical ionization because this type of
derivatization led to the addition of the seven fluorine-atoms in combination
with the carbonyl group after derivatization of the antidepressants. Finally,

heptafluorobutyrylation also led to more volatile derivatives, resulting in a
shorter analysis time.
Gas chromatographic and mass spectrometric parameters were optimized in
chapter V. The separation of the 13 antidepressants and their active
metabolites occurred on a non-polar 5% phenylmethyl-polysiloxane column
with general purpose dimensions to avoid GC-MS downtime due to column
switching in the forensic or clinical routine laboratory. During optimization of
the gas chromatographic method most attention was paid to the sample
introduction. Splitless vaporization injection was chosen due to sensitivity and
robustness concerns. However, as incomplete sample transfer from the
injector liner to the column, discrimination, and poor peak focussing on the
top of the column are the most widely observed problems in splitless
injections, this injection type was evaluated concerning inlet temperature,
purge activation time and inlet pressure to ensure minimal negative effects.
In order to accelerate and maximize the sample transfer, a pulsed splitless
injection was selected in which the high inlet pressure was used to increase
the mass transfer to the column and to reduce the band spreading. The
discrimination of high boiling compounds was diminished due to optimization
of the injector temperature, column temperature, the purge activation time
and an increase in inlet pressure during injection.
For the mass spectrometric conditions, optimization and comparison of
different ionization modes was of most interest. The second part of chapter V
therefore describes the comparison of electron, positive and negative ion
chemical ionization and discusses the fragmentation patterns of the
antidepressants and their metabolites in these ionization modes. Electron
ionization is still the traditional method for comprehensive screening
procedures due to the easy library search mechanism. This ionization,
however, leads to high fragmentation of citalopram, melitracen, venlafaxine,
and O-desmethylvenlafaxine, resulting in the aspecific high abundance
quantifier ion at m/z 58 and inherent loss of specificity, especially for
demanding matrices such as post-mortem blood and brain tissue. Chemical
ionization is a ‘softer’ ionization technique, thus providing more selectivity
through molecular mass information. Negative ion chemical ionization leads
to improved sensitivity due to heptafluorobutyrylimidazole derivatization,
allowing smaller sample volumes. This could be very interesting in clinical
analysis and TDM of samples from children where often only a limited amount

of sample is available. On the other hand, underivatized tertiary amines such
as citalopram, melitracen, mianserin, and mirtazapine are not detected.Thus
every ionization method has its specific pros and cons and this chapter tries
to give a guideline for the choice of ionization modes and parameters to
obtain the ideal conditions for a specific antidepressant in a specific setting.
In chapter VI the developed GC-MS method for the 13 new generation
antidepressants and their metabolites was validated in plasma using different
ionization modes according to the FDA guidelines. For blood and brain tissue
samples, validation occurred in positive ion chemical ionization mode
according to the same guidelines. During validation stability, sensitivity,
precision, accuracy, recovery, linearity and selectivity were evaluated.
Identification and quantification were based on selected ion monitoring in
electron and chemical ionization modes. Calibration by linear and quadratic
regression for electron and chemical ionization, respectively, utilized
deuterated internal standards and a weighting factor 1/x2. Limits of
quantitation were established between 5-12.5 ng/ml in electron and positive
ion chemical ionization, and 1-6.5 ng/ml in negative ion chemical ionization
for plasma. For blood the limit of quantification ranged from 5-20 ng/ml,
while the limit of quantification in brain tissue ranged from 25-62.5 ng/g.
Accuracy, precision and stability were within the limits set by the guidelines
(less than 15 % deviation from target value, less than 15 % relative standard
deviation, except at the quantification limit where deviation and RSD of 20 %
is allowed) for each ionization mode and for most compounds. While it is
clear that not all compounds can be quantified either due to irreproducible
validation results and chromatographic problems (trazodone) or due to
derivatization problems (O-desmethylvenlafaxine), this method can quantify
most new antidepressants in the therapeutic range in plasma in different
ionization modes, and in blood and brain tissue.
After the development and validation of the GC-MS method for the new
generation antidepressants and their metabolites, the method was evaluated
for its usefulness for clinical and forensic toxicological analyses, as described
in chapter VII and VIII.
Chapter VII describes a preliminary study concerning personalized anti-
depressant treatment. In this study, the developed GC-MS method with
electron ionization is combined with CYP2D6 genotyping to ensure a good
medical treatment. Although the low toxicity of antidepressants, physicians
must be aware that depression is a chronic disease leading to a long period of
drug intake, in addition, these patients mostly use a whole range of drugs,
which increases the risk of adverse effects. Finally, a large variety in
therapeutic plasma concentrations due to environmental, physiological and
genetic factors occur with antidepressant treatment and identical plasma
concentrations often result in different responses to treatment. So far the
most of compelling evidence in pharmacogenetics of antidepressants is for an
effect of CYP2D6 polymorphisms on antidepressant drug plasma levels,
therefore this enzyme was monitored in combination with plasma
concentration measurement. A case report was applied to demonstrate the
usefulness of the developed GC-MS method and to demonstrate the
possibilities of this method in a realistic clinical setting. It also demonstrates
that the developed methods work and can be applied. The genotyping of
patients is probably of most interest when therapy is started. The phenotype,
together with the information concerning the patients depressed state, co-
medication and comorbidity can lead to a rational choice of antidepressant
therapy and necessary dose. Once therapy is started, TDM can be used to
monitor compliance, and to link plasma concentrations with the clinical effect
and side-effects of the patient. However, more research has to be done
before personalized AD treatment will be state of the art. First of all, dose
recommendations based on differences in pharmacokinetics are not
automatically helpful for prediction of treatment response, since correlation
between plasma concentrations and efficacy is very poor in antidepressant
therapy. Secondly, due to the complexity of drug response, single mutations
in one gene, such as the CYP2D6, are unlikely to cause the continuous
variability in response. As result, more information should be obtained
concerning polymorphisms of other CYP isoenzymes, variations in targets and
transporters. In addition, the proposed method should be evaluated on a
large scale population.
In Chapter VIII the developed GC-MS method using positive ion chemical
ionization is used to quantification of the new generation antidepressants in
whole blood, brain tissue and hair samples for interpretation of post-mortem
cases. Several antidepressants such as fluoxetine, sertraline and citalopram
were detected and quantified in different brain regions. Although

antidepressants are selectively bound to receptors located in specific brain
regions, it was clear that the antidepressants spread rather homogeneously
over the total brain content in most cases. Therefore, in post-mortem
analysis, a detailed location of a brain sample is in fact of no importance for
the quantitative result. Analysis of the post-mortem cases also led to the
conclusion that a possible advantage of post-mortem toxicological brain
analysis is the longer detection window of antidepressants in brain tissue as
compared to blood. Because the link between blood levels and the drug-
concentration at the effector site (the brain) for a specific clinical response is
of importance, blood levels and brain levels were compared in the five cases.
For 2 cases, a brain/blood ratio of approximately 17 was seen for sertraline.
However, due to the small number of cases, this link could not be
determined. In addition, variables such as P-glycoprotein polymorphism,
interval between the last time of ingestion and death, treatment period, and
patient compliance could alter the brain/blood ratio. Hair samples were also
analyzed, especially to confirm the use of antidepressants for a longer period
and thus the results of the brain tissue. The quantitative results from hair
samples, however, are hard to interpret as the link between incorporation in
the hair and blood level / effect is not known. In addition, incorporation of
the ADs in hair also depends on the type of hair pigmentation and physical
state.
Finally, in chapter IX a general conclusion is given. It is clear that the major
part of this work is the optimization of the analytical aspects of the method.
Because the method has a broad range of possible applications, we hope this
thesis can be a guideline for the use of GC-MS analyses for a specific
antidepressant in a specific setting. In addition, this work describes the
usefulness of the developed GC-MS method for forensic and clinical
applications. However, we sincerely hope that in the near future, the
developed method will be applied in a large scale forensic or psychiatric
clinical setting for further development and evaluation.

SAMENVATTING
Dit doctoraatswerk beschrijft de optimalisatie, validatie en applicatie van een
gaschromatografische massaspectrometrische methode voor de bepaling van
nieuwe generatie antidepressiva en hun actieve metabolieten in plasma,
bloed, hersenweefsel en haar.
In het eerste hoofdstuk wordt een overzicht gegeven van de reeds
gepubliceerde literatuur omtrent de nieuwe generatie antidepressiva. Deze
introductie behandelt de oorzaken van depressie, de mogelijke
behandelingen, evenals actiemechanismen, mogelijke nevenwerkingen en
toxiciteit van de nieuwe generatie antidepressiva. Daarenboven wordt het
belang van antidepressiva plasma spiegel bepaling en van toxicologische
analyses voor deze groep geneesmiddelen geargumenteerd. Depressie is
immers een ernstige psychische stoornis die het economische en sociale
leven van 121 miljoen mensen aantast en kan leiden tot zelfdoding. Ondanks
de enorm toegenomen kennis over depressie en de behandelingswijzen zijn
er nog heel wat problemen gedurende de medicamenteuze behandeling van
depressies zoals slechte therapietrouw, een groot aantal niet-effectieve
behandelingen en ernstige bijwerkingen.
Ons onderzoek is voornamelijk gericht op de ontwikkeling van een
analytische methode voor de kwantificatie van nieuwe generatie
antidepressiva en hun metabolieten. De antidepressiva waarvoor we in dit
werk een bepalingsmethode zullen optimaliseren zijn gekozen op basis van
hun belang in de zeven landen met het grootste verkoopscijfer van
antidepressiva volgens het Cognos Plus Study #11 en het AGNP-TDM Expert
Group rapport (Japan, Verenigde Staten, Frankrijk, Verenigd Koninkrijk,
Italië, Spanje en Duitsland). De finale selectie omvat citalopam, fluoxetine,
fluvoxamine, maprotiline, melitraceen, mianserine, mirtazapine, paroxetine,
reboxetine, sertraline, trazodone, venlafaxine, viloxazine, desmethyl-
citalopram, didesmethylcitalopram, desmethyfluoxetine, desmethyl-
maprotiline, desmethylmianserine, desmethylmirtazapine, desmethyl-
sertraline, m-chlorophenylpiperazine en O-desmethylvenlafaxine.
Hoofdstuk II vat de beoogde objectieven voor deze scriptie samen. Eerst en
vooral werd de ontwikkeling van een kwantitatieve GC-MS methode voor

nieuwe generatie antidepressiva en hun metabolieten beoogd. Daarnaast
moest deze methode zijn nut bewijzen voor zowel forensische als klinische
toepassingen.
De analytiek is dus de kern van het onderzoek. De optimalisatie van de
analytische methode werd besproken in hoofdstukken III, IV en V.
Eén van de belangrijkste stappen in de ontwikkeling van een analytische
methode is de extractie van de componenten die moeten bepaald worden
vanuit de biologische matrix. Deze extractiestap zal een invloed hebben op
de finale gevoeligheid en selectiviteit van de detectiemethode. Daarom wordt
de extractie van de antidepressiva via een vaste fase extractie procedure
uitvoerig besproken in hoofdstuk III. Eerst werd de keuze van vaste fase,
evenals de was- en elutiestap van de extractieprocedure geoptimaliseerd
door waterstalen waaraan antidepressiva werden toegevoegd te analyseren
via vloeistofchromatografie met diode-array detectie. Nadien werd deze
geoptimaliseerde vaste fase extractiemethode aangepast voor matrices zoals
plasma, volbloed, hersenweefsel en haarstalen. Er moest vooral rekening
gehouden worden met de consistentie, de lipofiliciteit, de proteïnen-
concentratie van het staal en ook met de stabiliteit van de componenten
gedurende de extractieprocedure om een aangepaste extractiemethode te
bekomen voor iedere matrix. Finaal werd voor iedere matrix een
reproduceerbaar en hoog extractierendement bekomen.
In hoofdstuk IV wordt een ander deel van de staalvoorbereiding
beschreven, namelijk de derivatisatieprocedure. Derivatisatie wordt gebruikt
om de vluchtigheid, de piekvorm en de detectorrespons van een component
te verbeteren. Verschillende acyleringsreacties en producten worden
vergeleken in dit hoofdstuk. Finaal werd gekozen voor heptafluorobutyrylatie
van de antidepressiva en hun metabolieten via het derivatisatiereagens
heptafluorobutyryl imidazol omdat dit product resulteerde in een
reproduceerbare reactie met goede piekvormen voor de meeste
antidepressiva. Daarenboven kon men via deze derivatisatiereactie zeven
fluor-atomen in combinatie met een carbonyl groep toevoegen aan de
structuur van de antidepressiva om zo een hogere gevoeligheid te bekomen
in de negatieve chemische ionisatiemodus. Heptafluorobutyrylatie resulteerde
ook in vluchtige derivaten en dus een kortere analysetijd.

Gaschromatografische massaspectrometrische parameters worden
geoptimaliseerd in hoofdstuk V. De scheiding van de componenten
gebeurde op een niet-polaire 5% phenylmethylpolysiloxaan kolom met
algemene kolomdimensies om kolomwisselingen in forensische en klinische
laboratoria tot een minimum te beperken. Gedurende de optimalisatie van de
methode werd heel wat aandacht besteed aan de staal- introductie op de
kolom. Er werd voor de ‘splitless vaporization’ injectie- techniek geopteerd
omdat deze robuuste techniek de nodige gevoeligheid kon verzekeren. Toch
werd deze injectietechniek geoptimaliseerd qua injectietemperatuur,
inlaatdruk en kolomtemperatuur. Deze optimalisatie was nodig aangezien er
een incomplete staaltransfer naar de kolom, discriminatie van hoogkokende
componenten en een slechte piekvorm kan ontstaan bij ‘splitless’ injecties.
Het finale resultaat was een ‘pulsed splitless’ injectie waarbij de inlaatdruk
tijdens de injectie, dus voor een korte periode, verhoogd wordt.
Na de scheiding van de antidepressiva op de kolom worden deze
gedetecteerd door een massaspectrometer. De condities van deze detector
en de verschillende ionisatietechnieken worden beschreven in het tweede
deel van hoofdstuk V. De fragmentatiepatronen van alle antidepressiva onder
de verschillende ionisatiecondities worden eveneens besproken. Electron-
ionisatie is nog steeds de traditionele ionisatietechniek omdat het resulteert
in reproduceerbare spectra die kunnen opgezocht worden in commerciële
spectrabibliotheken. Deze ionisatietechniek leidt echter wel tot een zeer
sterke fragmentatie van componenten zoals citalopram, melitraceen,
venlafaxine en O-desmethylvenlafaxine. Dit extreme fragmentatieproces zal
leiden tot aspecifieke fragment ionen zoals m/z 58 en dus resulteren in een
verlies aan selectiviteit vooral in matrices zoals volbloed en hersenweefsel.
Chemische ionisatie kan dit probleem verhelpen omdat het een zachtere
ionisatie techniek is en dus resulteert in minder fragmentatie. Hierdoor wordt
er meer selectiviteit verkregen via informatie omtrent het moleculair gewicht.
De positieve chemische ionisatietechniek boet wel wat in qua gevoeligheid
doordat minder hoog abundante fragmentionen gevormd worden. Negatieve
chemische ionisatie daarentegen resulteert in een enorme gevoeligheid door
de heptafluorobutyryl imidazol derivatisatie. Het grote voordeel van deze
enorme gevoeligheid is de mogelijkheid om een kleinere hoeveelheid staal te
analyseren. Dit voordeel kan zeker benut worden voor analyses bij kinderen,
waar meestal een beperkte hoeveelheid bloed afgenomen wordt. Het is wel

zo dat ongederivatiseerde componenten, zoals de tertiaire amines citalopram,
melitraceen, mianserine en mirtazapine, niet gedetecteerd worden in deze
ionisatiemode.
In hoofdstuk VI wordt de geoptimaliseerde GC-MS methode voor de 13
nieuwe generatie antidepressiva en hun metabolieten gevalideerd in plasma,
bloed en hersenweefsel in de verschillende ionisatiemethodes. Hiervoor wordt
de FDA regelgeving gevolgd. Tijdens de validatie procedure werden de
stabiliteit, gevoeligheid, precisie, accuraatheid, extractierendement, lineariteit
en selectiviteit geëvalueerd. Identificatie en kwantificatie van componenten
was gebaseerd op het monitoren van enkele specifieke fragmentionen na
electron- en chemische ionisatie. Calibratie gebeurde via een lineaire of
kwadratische regressiecurve, respectievelijk voor electron- en chemische
ionisatie. Gedeutereerde interne standaarden en een wegingsfactor van 1/x2
werden steeds toegepast. Kwantificatie limieten voor de antidepressiva in
plasma werden vastgezet tussen 5-12,5 ng/ml voor electron en positieve
chemische ionisatie, terwijl ze tussen 1-2,5 ng/ml lagen voor negatieve
chemische ionisatie. De kwantificatie limieten verhoogden naar 5-20 en 25-
62,5 ng/ml voor positieve chemische ionisatie in bloed en hersenweefsel.
Accuraatheid, precisie, en stabiliteit waren voor de meeste componenten
binnen de limieten vastgesteld door de FDA: niet meer dan 15% verschil met
de doelwaarde, minder dan 15% variatie, tenzij voor de kwantificatie limiet
waarbij een verschil van 20% aanvaard wordt. De meeste antidepressiva en
hun metabolieten voldoen aan deze criteria en kunnen dus adequaat
gekwantificeerd worden via deze methode. Enkel trazodone en O-
desmethylvenlafaxine kunnen niet gekwantificeerd worden omwille van
chromatografische- of derivatisatieproblemen.
Deze gevalideerde methode werd geïmplementeerd in forensische en
klinische toepassingen.
Hoofdstuk VII beschrijft een preliminaire studie waarbij de gevalideerde
GC-MS methode met electron ionisatie wordt gekoppeld aan een cytochroom
2D6 bepaling om zo de antidepressivatherapie te optimaliseren. Ondanks de
lage toxiciteit van de huidige generatie antidepressiva, moeten de
behandelende artsen er zich van bewust zijn dat depressie een chronische
ziekte is waarbij medicatie heel lang nodig is. Daarenboven worden deze

patiënten met een waaier aan geneesmiddelen behandeld wat kan leiden tot
neveneffecten en interacties. Momenteel is er een groeiende interesse naar
de variabiliteit in plasmaspiegels en het finaal effect in relatie tot
fysiologische, genetische en omgevingsfactoren. De meest bestudeerde factor
is het effect van de cytochroom 2D6 polymorfismen op de antidepressiva-
plasmaconcentraties. Daarom zal deze genotypering gekoppeld worden aan
de ontwikkelde GC-MS methode. Een casus werd besproken in dit hoofdstuk
om de haalbaarheid en bruikbaarheid van deze methodes te demonstreren in
een reële klinische omgeving. Genotypering van de patiënt gebeurt best
voordat een therapie ingesteld wordt. De informatie omtrent het fenotype
kan dan tezamen met informatie rond co-medicatie en co-morbiditeit
resulteren in een rationele keuze van therapie en dosering. Eens de therapie
is opgestart kan het bepalen van plasmaspiegels informatie bezorgen rond
therapietrouw en kan er een link gelengd worden tussen plasmaconcentraties
en effect. Aan de andere kant zal er meer onderzoek moeten gebeuren om
een goed beeld te krijgen over de relatie tussen doseringen,
plasmaconcentraties en effect om zo een optimale gepersonaliseerde therapie
mogelijk te maken. Daarnaast zal vooral de genotyperingsmethode verder
geoptimaliseerd moeten worden aangezien niet alleen het CYP 2D6 enzyme
polymorfisme verantwoordelijk is voor de variaties in plasmaconcentraties,
maar een hele waaier aan polymorfismen van enzymes en
geneesmiddelentransporters.
Een tweede toepassingsgebied van de ontwikkelde methode, in casu het
forensische luik, wordt beschreven in hoofdstuk VIII. De GC-MS methode
werd gebruikt in positive chemische ionisatiemode om antidepressiva op te
sporen in volbloed, hersenweefsel en haarstalen in vijf post-mortem
casussen. Een aantal antidepressiva waaronder fluoxetine, citalopram en
sertraline werden gekwantificeerd in verschillende hersen-regionen. Hieruit
bleek dat locatie van staalname geen belang heeft bij antidepressiva analyse
en dat de detecteerbaarheid van antidepressiva langer is in hersenweefsel
dan in bloed. We hadden graag een verband kunnen aantonen tussen bloed-
en hersenconcentraties om zo vat te krijgen op het verband tussen
bloedconcentraties en effect. Door het kleine aantal casussen was dit echter
onmogelijk. Daarenboven kunnen variabelen zoals P-glycoproteïne poly-
morfisme, het tijdsinterval tussen inname en dood, therapieperiode en
therapietrouw aanleiding geven tot een andere hersen/bloed concentratie-

ratio. Haar werd ook geanalyseerd om een idee te hebben over therapietrouw
en om de resultaten in het hersenweefsel te confirmeren.
Tenslotte wordt in hoofdstuk IX een algemene conclusie gegeven. Het is
duidelijk dat de kern van het onderzoek de ontwikkeling en validatie van een
GC-MS methode voor nieuwe generatie antidepressiva en hun metabolieten
inhield. Daarnaast werd het nut van deze methode aangetoond door een
klinische en forensische toepassing. Laten we hopen dat de door ons
geoptimaliseerde methode in de nabije toekomst in grootschaligere
forensische en klinische studies verder zal geëvalueerd worden en zal leiden
tot nieuwe inzichten voor antidepressiva therapieën.
CURRICULUM VITAE
Sarah Wille
Pharmacist
Born in Gent on 3 March 1979
Married with Evert Vandeweghe
Education and work experience
2008-……..: Juridical expert at the National Institute of Criminalistics and
Criminology in Brussels.
2002-2008: Ph.D. student at the Laboratory of Toxicology, Faculty of
Pharmacy, Ghent University under the direction of Prof. Willy
Lambert
1997-2002: Pharmacist degree obtained at Ghent University with great
distinction.
1991-1997: Science-Maths high school degree at Sint-Jozef Instituut Aalst.
A1 Publications (status 23/08/2008)
2008: Sarah M.R. Wille, Els A. De Letter, Michel H.A. Piette, Lien K. Van Overschelde, Carlos H. Van Peteghem, Willy E.E. Lambert, Determination of new generation antidepressants in human post-mortem blood, brain tissue and hair using a gas chromatographic-mass spectrometric method in positive chemical ionization mode. International Journal of Legal Medicine (accepted) Impact factor: 3.030
Sarah M.R. Wille, Sarah G. Cooreman, Hugo M. Neels, Willy E.E. Lambert, Relevant issues in the monitoring and the toxicology of old and new antidepressants. Critical Reviews in Clinical Laboratory Sciences 45 (1), 1-66 (2008) Impact factor: 5.037 Times cited: 1

2007: Sarah M.R. Wille, Paul Van hee, Hugo M. Neels, Carlos H. Van Peteghem, Willy E. Lambert, Comparison of electron and chemical ionization modes by validation of a quantitative gas chromatographic-mass spectrometric assay of new generation antidepressants and their active metabolites in plasma. Journal of Chromatography A 1176, 236-245 (2007) Impact factor: 3.641
Sarah M.R. Wille and Willy E.E. Lambert, Recent developments in extraction procedures relevant to analytical toxicology. Analytical and Bioanalytical Chemistry 388, 1381-1391 (2007) Impact factor: 2.867 Times cited: 1
Kristof E. Maudens, Sarah M.R. Wille and Willy E.E. Lambert, Traces of phosgene in chloroform: Consequences for extraction of anthracyclines. Journal of Chromatography B 848, 384-390 (2007)Impact factor: 2.935
2005: Sarah M.R. Wille, Kristof E. Maudens, Carlos H. Van Peteghem and Willy E.E. Lambert, Development of a solid phase extraction for 13 ‘new’ generation antidepressants and their active metabolites for gas chromatographic-mass spectro-metric analysis. Journal of Chromatography A 1098, 19-29 (2005)
Impact factor: 3.096 Times cited: 24
2004: Sarah M.R. Wille and Willy E.E. Lambert, Volatile substance abuse-post-mortem diagnosis. Forensic Science International 142, 135-156 (2004) Impact factor: 1.388 Times cited: 9
Sarah M.R. Wille and Willy E.E. Lambert, Phenmetrazine or Ephedrine? Fooled by library search. Journal of Chromatography A 1045, 259-262 (2004) Impact factor: 3.595 Times cited: 4
Newsletters Publications
2007: Active as reporter for the IATDMCT Newsletter during the 10th
International Congress of Therapeutic Drug Monitoring and Clincal Toxicology, Nice, France, Sept 9-14, 2007

2006: Sarah M.R. Wille, Solid Phase Extraction in Clinical and Forensic Toxicology. IATDMCT Young Scientists Scientific Issues Series in IATDMCT Newsletter.
Referee
Referee of several publications for Journal of Chromatography A and B, Analytical and Bioanalytical Chemistry, Clinical Chemistry and Laboratory Medicine, Journal of Pharmaceutical and Biomedical Analysis and Journal of Separation Science.
Congress Presentations
2008: Oral presentation at the 46th meeting of The International Association of Forensic Toxicologists (TIAFT), Martinique, French West Indies, June 2-8, 2008 Quantification of new generation antidepressants using a gas chromatographic-mass spectrometric method. Applications in clinical toxicology (Sarah M.R. Wille, Paul Van hee, Hugo M. Neels, Carlos H. Van Peteghem, Willy E. E. Lambert)
Oral presentation at the BLT scientific meeting, Brussels, March 11, 2008Case reports: determination of new generation antidepressants in human post-mortem blood, brain tissue and hair using a gas chromatographic-mass spectrometric method in positive chemical ionization mode (Sarah M.R. Wille, Els A. De Letter, Michel. H.A. Piette, Lien K. Van Overschelde, Carlos H. Van Peteghem, Willy E.E. Lambert)
Poster presentation at the 46th meeting of The International Association of Forensic Toxicologists (TIAFT), Martinique, French West Indies, June 2-8, 2008 Determination of new generation antidepressants in human post-mortem blood, brain tissue and hair using a gas chromatographic-mass spectrometric method in positive chemical ionization mode (Sarah M.R. Wille, Els A. De Letter, Michel H.A. Piette, Lien K. Van Overschelde, Carlos H. Van Peteghem, Willy E.E. Lambert)
2007: Oral Presentation at the 10th International Congress of Therapeutic Drug Monitoring and Clincal Toxicology, Nice, France, Sept 9-14, 2007 Validation and comparison of a gas chromatographic-mass spectrometric method in electron ionization (EI) and positive chemical ionization mode (PICI) for the simultaneous determination of 13 antidepressants and their active metabolites in plasma (Sarah M.R. Wille, Carlos H. Van Peteghem and Willy E.E. Lambert)

Poster Presentation at the Joint Meeting of International Council on Alcohol, Drugs, and Traffic Safety (ICADTS), The International Association of Forensic Toxicologists (TIAFT), and the 8th Ignition Interlock Symposium (IIS), Seattle, Washington, USA, Aug. 26-30, 2007. Validation of a GC-MS method for the simultaneous determination of 12 antidepressants and their active metabolites in plasma and application to whole blood, and brain tissue. (Sarah M. Wille, Carlos H. Van Peteghem, Willy E. Lambert)
2005: Oral Presentation at the 43 International Meeting of the International Association of Forensic Toxicologists (TIAFT)
th
,Seoul, Korea, Aug 29-Sept 2, 2005. Development of a solid phase extraction for 13 ‘new’ generation antidepressants and their active metabolites for gas chromatographic-mass spectrometric analysis (Sarah M.R. Wille, Kristof E. Maudens, Carlos H. Van Peteghem and Willy E.E. Lambert)
2004: Poster Presentation at the FBI Laboratory Symposium on Forensic Toxicology and Joint Meeting of the Society of Forensic Toxicologists (SOFT) & The International Association of Forensic Toxicologists (TIAFT), Washington, District of Columbia, USA, Aug. 29-Sept 4, 2004. Phenmetrazine or Ephedrine? Fooled by library search (Sarah M. Wille, Carlos H. Van Peteghem, Willy E. Lambert)
Memberships
TIAFT (The International Association of Forensic Toxicologists)
BLT (The Toxicological Society of Belgium and Luxembourg)
IATDMCT (International Association of Therapeutic Drug Monitoring and
Clinical Toxicology)