quantitative analysis of monoclonal antibody formulations
TRANSCRIPT

0
Quantitative Analysis of Monoclonal Antibody
Formulations Using Image and Fluorescence
Correlation Spectroscopies
A thesis submitted to the University of Manchester for the degree of
Doctor of Philosophy in the Faculty of Biology, Medicine and Health
2018
Maryam Shah
School of Health Sciences
1
List of Contents
LIST OF TABLES 5
LIST OF FIGURES 6
LIST OF ABBREVIATIONS 8
GENERAL ABSTRACT 10
DECLARATION 11
COPYRIGHT STATEMENT 12
CONTRIBUTIONS TO THESIS CHAPTERS 13
ACKNOWLEDGEMENTS 14
CHAPTER 1:
1 : INTRODUCTION................................................................................................. 15
Introduction .......................................................................................................................... 16
1.1 Monoclonal Antibodies as Therapeutics ................................................................... 16
1.2 Protein Aggregation .................................................................................................. 19
1.2.1 Protein Aggregation Consequences ................................................................... 19
1.2.2 Mechanisms of Protein Aggregation ................................................................. 19
1.2.3 Industrial Production of Therapeutic mAbs ....................................................... 20
1.2.4 Accelerated stability testing ............................................................................... 22
1.2.5 Factors contributing to protein aggregation ....................................................... 23
1.3 Analytical Approaches Utilised in the Detection and Characterisation of Protein
Aggregation .......................................................................................................................... 38
1.3.1 Light Scattering Methods ................................................................................... 39
1.3.2 Resonance Mass Measurement (Archimedes) ................................................... 43
1.3.3 Microscopic Methods......................................................................................... 45
1.4 Fluorescence-based Approaches ............................................................................... 47
1.4.1 Concept of Fluorescence .................................................................................... 47
1.4.2 Fluorescent Probes ............................................................................................. 49
1.4.3 Fluorescence Correlation Spectroscopy (FCS) .................................................. 56
1.4.4 Confocal Laser Scanning Microscopy and Imaging .......................................... 60
1.5 References ................................................................................................................. 68

2
CHAPTER 2
2 : AIMS AND OBJECTIVES .................................................................................. 82
2.1 Aims and Objectives ................................................................................................. 83
CHAPTER 3:
3 : EVALUATION OF AGGREGATE AND SILICONE OIL COUNTS IN PRE-
FILLED SILICONIZED SYRINGES: AN ORTHOGONAL STUDY
CHARACTERISING THE ENTIRE SUBVISIBLE SIZE RANGE ................................ 85
3.1 Abstract ..................................................................................................................... 87
3.2 Introduction ............................................................................................................... 88
3.3 Materials and Methods .............................................................................................. 90
3.3.1 Materials ............................................................................................................ 90
3.3.2 Methods.............................................................................................................. 91
3.4 Results ....................................................................................................................... 93
3.4.1 Fluorescent dye selection for proteinaceous aggregates and silicone oil droplets
for RICS analysis .............................................................................................................. 93
3.4.2 Assessment of mAb Aggregation in Siliconized PFS........................................ 94
3.4.3 Characterisation of Dispersed Silicone oil in PFS ............................................. 97
3.5 Discussion ............................................................................................................... 102
3.5.1 Considerations Regarding the Different Techniques ....................................... 102
3.5.2 Agitation in Siliconized PFS Increases Aggregation Formation ..................... 104
3.5.3 PS-20 limits the Formation of Aggregates in Siliconized PFS following
Agitation ......................................................................................................................... 105
3.6 Conclusions ............................................................................................................. 106
3.7 Acknowledgements ................................................................................................. 107
3.8 References ............................................................................................................... 108
CHAPTER 4:
4 : SELF-DIFFUSION IN HIGHLY CONCENTRATED PROTEIN
SOLUTIONS MEASURED BY FLUORESCENCE CORRELATION
SPECTROSCOPY ............................................................................................................... 112
4.1 Abstract ................................................................................................................... 114
4.2 Introduction ............................................................................................................. 115
4.2.1 Effects of molecular crowding ......................................................................... 115
4.2.2 Measuring solution viscosity - diffusion of tracer particles............................. 115
4.3 Materials and Methods ............................................................................................ 118

3
4.3.1 Materials .......................................................................................................... 118
4.3.2 Methods............................................................................................................ 118
4.4 Results ..................................................................................................................... 121
4.4.1 Candidate dye for solution viscosity ................................................................ 121
4.4.2 Self-diffusion in highly concentrated protein solutions ................................... 125
4.5 Discussion ............................................................................................................... 132
4.5.1 Applicability of the GSE relation .................................................................... 132
4.5.2 Van Blaaderen’s model and exponential model .............................................. 133
4.5.3 Size and charge of the tracer ............................................................................ 133
4.6 Conclusion ............................................................................................................... 135
4.7 References ............................................................................................................... 136
CHAPTER 5:
5 : INVESTIGATING POLYSORBATE MICELLE FORMATION BY
FLUORESCENCE CORRELATION SPECTROSCOPY .............................................. 139
5.1 Abstract ................................................................................................................... 141
5.2 Introduction ............................................................................................................. 142
5.2.1 Polysorbates prevent surface-induced protein aggregation ............................. 142
5.2.2 Importance of surfactant concentration and the cmc ....................................... 142
5.2.3 Experimental detection of micelles .................................................................. 143
5.3 Materials and Methods ............................................................................................ 144
5.3.1 Materials .......................................................................................................... 144
5.3.2 Methods............................................................................................................ 144
5.4 Results and Discussion ............................................................................................ 146
5.4.1 Validation of SYPRO® Orange to determine the cmc .................................... 146
5.4.2 Determining the cmc by FCS with SYPRO® Orange ..................................... 147
5.4.3 FCS / SYPRO® Orange micelle detection in mAb solutions .......................... 152
5.5 Conclusion ............................................................................................................... 157
5.6 References ............................................................................................................... 158
CHAPTER 6:
6 : VISCOSITY CHANGE FOLLOWING AGGREGATION DEVELOPMENT:
CONFOCAL MICROSCOPY SYSTEM FOR ASSESSING AGGREGATION
DEVELOPMENT AND VISCOSITY SEQUENTIALLY ............................................... 161
6.1 Abstract ................................................................................................................... 163
6.2 Introduction ............................................................................................................. 164
4
6.2.1 Protein aggregation and viscosity issues of biopharmaceutical products ........ 164
6.2.2 Relation between aggregation development and change in solution viscosity 164
6.2.3 Analytical Techniques to assess viscosity change following aggregation....... 165
6.3 Materials and Methods ............................................................................................ 167
6.3.1 Materials .......................................................................................................... 167
6.3.2 Methods............................................................................................................ 167
6.4 Results ..................................................................................................................... 171
6.4.1 Viscosity change with aggregation development following agitation of low
mAb concentrated solutions (1mg/ml) – effect of probe size on assessing changes in
viscosity 171
6.4.2 Viscosity change with aggregation development following agitation - high mAb
concentrated solutions (100mg/ml) ................................................................................ 178
6.5 Discussion ............................................................................................................... 180
6.5.1 Measuring microrheology using probes ........................................................... 180
6.5.2 How much agitation is needed to impact protein stability? ............................. 181
6.5.3 Protein aggregation at the air-water interface .................................................. 181
6.6 Conclusion ............................................................................................................... 183
6.7 References ............................................................................................................... 184
CHAPTER 7:
7 : FINAL CONCLUSIONS .................................................................................... 189
7.1 Final Conclusions .................................................................................................... 190
7.2 References ............................................................................................................... 193
LIST OF APPENDICES
APPENDIX 1: SUPPLEMENTARY INFORMATION FOR CHAPTER 1 ....................... 194
APPENDIX 2: SUPPLEMENTARY INFORMATION FOR CHAPTER 3 ....................... 196
APPENDIX 3: SUPPLEMENTARY INFORMATION FOR CHAPTER 4 ....................... 206
APPENDIX 4: SUPPLEMENTARY INFORMATION FOR CHAPETR 6 ....................... 215
APPENDIX 5: COMMENTARY ......................................................................................... 218
Word Count: 67,343

5
LIST OF TABLES
CHAPTER 1:
Table 1.1: Comparison of techniques reported for protein characterisation (aggregation) ..... 39
Table 1.2: Guidelines for nano- and micro- sensor use (information provided by Malvern). . 44
Table 1.3: Comparison of fluorescence dyes in their applicability to study protein aggregation
with confocal microscopy. ....................................................................................................... 53
CHAPTER 3:
Table 3.1: Common terminology used for various protein aggregate size ranges ................... 89
Table 3.2 Measured protein concentrations in buffer-filled PFS solutions determined by MFI.
................................................................................................................................................ 100
CHAPTER 4:
Table 4.1: Available information of the three candidate dyes. .............................................. 122
Table 4.2: Log P values of Azure-B, ATTO-465 and ATTO-Rho6G. .................................. 123
Table 4.3: Diffusion times of Azure-B, ATTO-465 and ATTO-Rho6G. .............................. 123
Table 4.4: Calculated 𝑘1 and 𝑘2 for BSA samples measured by FCS and the RheoChip. ... 129
Table 4.5: Calculated 𝑘1 and 𝑘2 measured by FCS and the RheoChip. ............................... 130
CHAPTER 5:
Table 5.1: FCS parameters and PS: protein ratio of mAb solutions in presence of SYPRO®
Orange. ................................................................................................................................... 153
CHAPTER 6:
Table 6.1: FCS determined diffusion times and number of particles of 10mg/ml COE-08
solutions shaken at 500rpm for 4hrs, in presence of IgG-AF. ............................................... 175
Table 6.2: FCS determined diffusion times and number of particles of 10mg/ml COE-08
solutions agitated via rotation for 24hrs, in presence of IgG-AF. ......................................... 176

6
LIST OF FIGURES
CHAPTER 1:
Figure 1.1: Structure of a Monoclonal Antibody. .................................................................... 17
Figure 1.2: Size ranges and types of protein aggregates. ......................................................... 20
Figure 1.3: Downstream process for mAbs production. .......................................................... 21
Figure 1.4: Potential energy diagram illustrating the interaction energy over the distance
between two molecules. ........................................................................................................... 24
Figure 1.5: Analytical capabilities of protein aggregation detection methods. ....................... 43
Figure 1.6: Jablonski diagram illustrating the energy states of a molecule. ............................ 48
Figure 1.7: Chemical structures of commonly used fluorescent dyes. .................................... 54
Figure 1.8: FCS typical fluorescence signal and autocorrelation curve. ................................. 58
Figure 1.9: Basic set-up of a confocal microscope. ................................................................. 61
Figure 1.10: Systematic diagram of Raster Image Correlation Spectroscopy (RICS). ........... 64
CHAPTER 3:
Figure 3.1: Schematic diagram of RICS and labelling of dyes SYPRO® Red and SYPRO®
Orange. ..................................................................................................................................... 94
Figure 3.2: Protein particle counts in mAb PFS solutions measured by RICS, RMM and MFI.
.................................................................................................................................................. 96
Figure 3.3: Silicone oil droplet counts in buffer-filled PFS solutions measured by RICS,
RMM and MFI. ........................................................................................................................ 98
Figure 3.4: Silicone oil droplet counts in mAb PFS solution measured by RMM and MFI. 101
CHAPTER 4:
Figure 4.1: Inverse relative viscosity comparison between Vilastic-3 and FCS (with ATTO-
Rho6G and IgG-AF) of control samples. ............................................................................... 124
Figure 4.2: Normalised FCS autocorrelation function for IgG-AF solutions. ....................... 125
Figure 4.3: Variations of the ratio of diffusion times as a function of mAb concentration,
measured by FCS, of tracers IgG-AF and ATTO-Rho6G over different buffer conditions. . 126
Figure 4.4: Variation of ratio of diffusitives of different-sized fluorescent tracers compared
with the relative macro-viscosity as a function of protein concentration. ............................. 127
Figure 4.5: Relation between interaction parameter (kD) and the exponential coefficient (k).
................................................................................................................................................ 131
CHAPTER 5:
Figure 5.1: INT determined by spectrofluorometry of PS-20 solutions in water, in the
presence of SYPRO® Orange, in order to determine the cmc. ............................................. 146
Figure 5.2: INT determined by spectrofluorometry of PS-20 solutions in histidine/sucrose
buffer, in the presence of SYPRO® Orange, in order to determine the cmc......................... 147

7
Figure 5.3: FCS-determined parameters of TX100 solutions in the presence of R123, in order
to determine the cmc. ............................................................................................................. 149
Figure 5.4: FCS-determined parameters of TX100 solutions in the presence of SYPRO®
Orange in order to determine the cmc.................................................................................... 149
Figure 5.5: FCS-determined parameters of PS-80 solutions in the presence of SYPRO®
Orange in water, in order to determine the cmc. .................................................................... 150
Figure 5.6: FCS-determined parameters of PS-20 solutions in the presence of SYPRO®
Orange in water in order to determine the cmc. ..................................................................... 151
Figure 5.7: FCS-determined parameters of PS-20 solutions in the presence of SYPRO®
Orange in histidine/sucrose buffer, in order to determine the cmc. ....................................... 151
Figure 5.8: Viscosity (cone plate method) plotted against the FCS diffusion times of
concentrated mAb solutions. .................................................................................................. 154
Figure 5.9: Isothermal titration calorimetry thermogram recorded for injection of 0.1% w/v
PS-20 into PBS. ..................................................................................................................... 155
Figure 5.10: Isothermal calorimetry results for injection of 0.1% w/v PS-20 into 10mg/ml
COE-03. ................................................................................................................................. 155
CHAPTER 6:
Figure 6.1: RICS (with SYPRO Red) determined protein particle counts for agitated 1mg/ml
COE-08 solutions. .................................................................................................................. 171
Figure 6.2: FCS relative diffusion time of ATTO-Rho6G 1mg/ml COE-08 agitated solutions.
................................................................................................................................................ 172
Figure 6.3: RICS (with SYPRO Red) determined protein particle counts for 4 hour shaken (at
500rpm) 10mg/ml COE-08 solutions..................................................................................... 174
Figure 6.4: RICS (with SYPRO Red) determined protein particle counts for 24 hour rotation
10mg/ml COE-08 solutions. .................................................................................................. 175
Figure 6.5: RICS (with SYPRO Red) determined protein particle counts for agitated 1mg/ml
COE-08 solutions. .................................................................................................................. 177
Figure 6.6: FCS relative diffusion of IgG-AF 1mg/ml COE-08 agitated solutions. ............. 178
Figure 6.7: RICS (with SYPRO Red) determined protein particle counts for agitated
100mg/ml COE-08 solutions. ................................................................................................ 179
Figure 6.8: FCS relative diffusion of IgG-AF 100mg/ml COE-08 agitated solutions........... 180

8
LIST OF ABBREVIATIONS
ACF Autocorrelation Function
ANOVA Analysis of Variance
AUC Analytical Ultracentrifugation
APD Avalanche Photodiode
BSA Bovine Serum Albumin
CLSM Confocal Laser Scanning Microscopy
cmc Critical micelle concentration
Da Daltons
DLS Dynamic light scattering
DMSO Dimethyl Sulfoxide
DNA Deoxyribonucleic Acid
DVLO Derjaguin-Landau-Verwey-Overbeek
FCS Fluorescence Correlation Spectroscopy
FDA Food and Drug Administration
FRAP Fluorescence Recovery After Photobleaching
FT Fourier Transform
GFP Green Fluorescent Protein
HIAC High Accuracy liquid particle counter
HR Hard-sphere
HSA Human Serum Albumin
ICS Image Correlation Spectroscopy
IFABP Intestinal Fatty Acid Binding Protein
IgA Immunoglobulin A
IgG Immunoglobulin G
IgM Immunoglobulin M
IL
INT
Interleukin
Intensity
KCl Potassium Chloride
kICS k-space Image Correlation Spectroscopy
LOD Limit of Detection
MALLS Multi Angle Laser Light Scattering
MFI Micro-Flow Imaging

9
MS Mass Spectrometry
MSD Mean Square Displacement
NaCl Sodium Chloride
NMR Nuclear Magnetic Resonance
NTA Nanoparticle Tracking Analysis
PBS Phosphate-Buffered Saline
PGSL Probabilistic Global Search Lausanne
PMT Photomultiplier Tube
PPI Protein-Protein Interactions
PSF Point Spread Function
PS-20 Polysorbate-20
PS-80 Polysorbate-80
RA Rheumatoid Arthritis
RICS Raster Image Correlation Spectroscopy
RMM Resonance Mass Measurement
ROI Region of Interest
SI Supplementary Information
St. dev. Standard Deviation
SEC Size Exclusion Chromatography
SLS Static Light Scattering
SNR Signal to Noise Ratio
SPT Single Particle Tracking
STICS Spatiotemporal Image Correlation Spectroscopy
TEM Transmission Electron Microscopy
TICS Temporal Image Correlation Spectroscopy
TNF Tumour Necrosis Factor
Trp Tryptophan
UV Ultra Violet
2D Two Dimensional
3D Three-Dimensional

10
GENERAL ABSTRACT
Biopharmaceuticals (e.g. monoclonal antibodies (mAbs)) must comply with regulations (i.e.
United States Pharmacopeia (USP) <788>) regarding their characterisation and stability.
mAbs contain hydrophilic and hydrophobic areas (the latter normally buried inside the bio-
macromolecule). Stress conditions (such as high temperature, freezing, shaking etc.) or high
concentrations may lead to the exposure of hydrophobic surfaces (i.e. following unfolding)
and subsequently lead to the formation of protein aggregates. Furthermore, high concentrated
mAb products (i.e. >100mg/ml) have the increased risk of intermolecular interactions which
is correlated with high viscosity. These issues pose significant challenges to the economic
manufacture of safe and effective protein therapeutics. Current technologies in characterising
protein formulations possess limitations in regards to size ranges, specificity, interacting with
solution components and concentration; thus there is a current drive in the development of
novel applications. This thesis studies the application of two fluorescence-based techniques in
characterising mAb solutions, in the context of downstream processing and formulation:
Raster image correlation spectroscopy (RICS) analyses to assess aggregation propensity; and
fluorescence correlation spectroscopy (FCS) in retrieving viscosity information. An important
step for both methods is the identification of appropriate (non-covalent) fluorescent probes.
To validate the application of RICS in charactering mAb aggregates in industrially relevant
formulations, particle formation (size and counts) in pre-filled syringes was evaluated as a
function of polysorbate-20 (PS-20) concentration, following agitation stress. PS-20 limited
agitation-induced aggregation whilst increasing the amount of silicone oil sloughing. Thus no
correlation between silicone oil and aggregation was observed. Following extrinsic labelling
of aggregates by hydrophobic dye SYPRO Red, RICS demonstrated its high specificity to
aggregates in mAb solutions containing surfactant and silicone oil. An improved selectivity
was observed in comparison to resonance mass measurement (RMM) and micro-flow
imaging (MFI), covering a broader size range and using small sample volumes.
Although nonionic surfactants such as PS-20 are widely used, their mechanisms in mAb
solutions are poorly understood. This is partly due to analytical limitations of current
technologies. The application of FCS with utilising SYPRO Orange is validated in accurately
determining the critical micelle concentration of (three) nonionic surfactants, along with the
micelle size. Moreover, the FCS/SYPRO Orange application is used to detect polysorbate
micelles in the presence of high concentration mAb and thus provides scope to assess micelle
behaviour in highly concentrated mAb formulations.
As an additional method to measure the microviscosity of mAb solutions, FCS was utilised in
measuring the self-diffusion of tracers in a wide range of mAb formulations, over a broad
concentration range. The diffusion of different sized tracers was investigated and compared
against bulk rheometry measurements. It was established a probe of size equal or larger than
the mAb gave relatable information to bulk rheometry.
RICS and FCS were (sequentially) applied to mAb solutions subjected to various forms of
agitation stress. A correlation was established between aggregation development (size and
counts) and changes in solution viscosity. Additionally an inverse relationship of agitation-
induced aggregation and protein concentration was observed. The potential of measuring
aggregation propensity and solution viscosity using the same system set-up is of great interest
to the industry due to small sample material and minimal operating time. Thus the combined
application of RICS and FCS has the potential to stand as a tool in the characterisation of
mAb (aggregate) solutions, particularly in relation to early formulation development.

11
DECLARATION
No portion of the work referred to in the thesis has been submitted in support of an
application for another degree or qualification of this or any other university or other institute
of learning.

12
COPYRIGHT STATEMENT
The author of this thesis (including any appendices and/or schedules to this thesis) owns
certain copyright or related rights in it (the “Copyright”) and s/he has given The University of
Manchester certain rights to use such Copyright, including for administrative purposes.
Copies of this thesis, either in full or in extracts and whether in hard or electronic copy, may
be made only in accordance with the Copyright, Designs and Patents Act 1988 and
regulations issued under it or, where appropriate, in accordance with licensing agreements
which the University has from time to time. This page must form part of any such copies
made.
The ownership of certain Copyright, patents, designs, trademarks and other intellectual
property (the “Intellectual Property”) and any reproductions of copyright works in the thesis,
for example graphs and tables (“Reproductions”), which may be described in this thesis, may
not be owned by the author and may be owned by third parties. Such Intellectual Property
and Reproductions cannot and must not be made available for use without the prior written
permission of the owner(s) of the relevant Intellectual Property and/or Reproductions.
Further information on the conditions under which disclosure, publication and
commercialisation of this thesis, the Copyright and any Intellectual Property University IP
Policy (see http://documents.manchester.ac.uk/display.aspx?DocID=24420), in any relevant
Thesis restriction declarations deposited in the University Library, The University Library’s
regulations (see http://www.library.manchester.ac.uk/about/regulations/) and in The
University’s policy on Presentation of Theses.

13
CONTRIBUTIONS TO THESIS CHAPTERS
Primary supervisor Alain Pluen, provided guidance and feedback for the Introduction
(Chapter 1), Aims and Objectives (Chapter 2) and Final Conclusions (Chapter 7).
Chapter 3
Maryam Shah, Zahra Rattray and Alain Pluen planned the study.
Maryam Shah performed the experiments with assistance from Katie Day.
Maryam Shah analysed the data.
Maryam Shah and Zahra Rattray prepared the manuscript, with comments from Alain Pluen,
Chris van der Walle, Robin Curtis, Katie Day and Shahid Uddin.
Chapter 4
Maryam Shah, Alain Pluen and Robin Curtis planned the study.
Maryam Shah, Aisling Roche and Peter Davis prepared the protein samples with guidance
from Katie Day.
Maryam Shah performed the FCS measurements.
Aisling Roche and Peter Davis performed the Rheochip measurements.
Maryam Shah and Alain Pluen analysed the data with modelling input from Daniel Corbett.
Maryam Shah and Alain Pluen prepared the manuscript, with comments from Robin Curtis,
Chris Van der Walle and Shahid Uddin.
Chapter 5
Maryam Shah and Alain Pluen planned the study.
Maryam Shah performed all the experiments and analysis of data except ITC; which was
conducted and analysed by Tom Jowitt.
Maryam Shah prepared the manuscript with comments from Alain Pluen, Chris Van der
Walle, Robin Curtis, Katie Day and Shahid Uddin.
Chapter 6
Maryam Shah and Alain Pluen planned the study.
Maryam Shah performed the experiments and completed all the data analysis.
Maryam Shah prepared the manuscript with comments from Alain Pluen, Chris Van der
Walle, Robin Curtis, Katie Day and Shahid Uddin.

14
ACKNOWLEDGEMENTS
I would like to express my gratitude to The University of Manchester for the PhD
opportunity, along with MedImmune and the BBSRC for sponsoring this project.
Additionally, there is a list of people to which I would like to extend my appreciation to:
Firstly I would like to thank my main supervisor, Alain Pluen, for his invaluable continuous
support over the last four years – not only with my PhD work but with everything else I took
on (i.e. conferences, workshops, placements). For allowing me to walk through the door and
let off steam, for giving me sometimes strong words to get the best out of me and providing
me with advice that I will take with me for the rest of my career.
My secondary supervisor and industrial supervisors: Robin Curtis, Chris Van der Walle,
Katie Day and Shahid Uddin - for their continuous encouragement throughout the years, for
supporting me and believing in me.
The additional opportunities given to me by my supervisory team have enhanced my skills,
personality and motivation. I would not have achieved my accomplishments without you and
I will forever be indebted to you all.
Academics in the School of Pharmacy, particularly Elena and Doug, for their words of
wisdom and comforting chats (in the office and in corridors) - I hope you realise the impact
of our little conversations in keeping me going.
My colleagues/friends at the University – Amal, Halah, Kathryn, Farrah, Shaun, Cat, James,
Alfredo, Rose – thank you for your support and I wish you all the very best in your journeys.
I would like to thank my family - my mother, my sisters, my brother, my grandparents, my
uncles, my mother-in-law, my father-in-law, sister-in-law’s and brother-in-law’s, my outlaw,
my niece and my nephews. You are my entire world and my underlying motivation, for my
career and my life. We have seen some tough times but I truly believe that together we can
accomplish anything.
My son, Riyad Shah, who came into this world in the final year of my PhD - you gave me
love and a reason to smile through the darkest of nights - even if it did add to the
sleeplessness! Having a baby and completing a thesis was definitely challenging, but I would
not have had it any other way.
Finally, last but certainly not the least, to a very special person who has been there for me
through the highs and the lows, who gave me the confidence to reach heights I thought I
would only dream of, who gave me the self-assurance be to true to who I am, my best friend,
my partner in crime, my soulmate, my husband,
Hanif Shah to you I dedicate this thesis.

15
1 : INTRODUCTION
16
Introduction
Over the recent decades mAbs products have taken a leading role in the bio-pharmaceutics
division. Since the 1980s to (May) 2017, the Food and Drug Administration (FDA) have
approved 66 mAbs for clinical use against a variety of illnesses including cancer and
autoimmune diseases. Their high demand and continuous research is due to their extremely
high specificity alongside minimal side effects.1-3
Nevertheless, these drugs may be unstable
and prone to aggregation. The presence of aggregates needs to be controlled as they may lead
to an immune response in the patient. Thus biopharmaceuticals must comply with regulations
(e.g. United States Pharmacopeia (USP) <788>) regarding their characterisation and
stability. However, detecting aggregates, evaluate the role of excipients in their formation or
the influence of protein-protein interactions especially at high mAb concentrations remains
an issue.
1.1 Monoclonal Antibodies as Therapeutics
Currently there are over 250 clinical trials for certifying already established mAbs for other
therapies and for the validation of new candidates. A few examples are: a humanised IgG3
(named 3F8) is in phase II trials for locating and killing tumour cells in patients with high-
risk neuroblastoma; an IgG1 (named MEDI-551), is in phase I trials directed against CD19 in
adult subjects with relapsed or refractory advanced B-cell malignancies; another IgG1,
Trastuzumab, is in phase III trials as a short duration preoperative therapy in patients with
HER2-neu positive operable breast cancer. These are just a representation of the large list of
clinical trials, and their success is reflected through passing the clinical trials stages leading to
their potential use in treatments. However, this is not always the case. For example,
alemtuzumab was being assessed on serum IL-6, IL-10, and IL-13 levels in patients with
relapsed and resistant classical NHL, but the phase II stage was terminated due to slow
accrual.4
The high specificity of mAbs is owing to their structure (See Figure 1.1). Antibodies are Y-
shaped quaternary structures with a molecular weight of around 150kDa. The structure can be
split into four polypeptide chains which are covalently linked (i.e. disulfide bonds); two
heavy chains and two light chains, where each heavy chain (around 50kDa) has about twice
the number of amino acids as each light chain (around 25kDa). The structure can also be split
into two halves as two fragment antigen binding (Fab) regions and the fragment crystalline
(Fc) region. The Fab regions comprise constant and variable domains where the variable
domains are situated at the amino terminal ends. These variable domains contain the

17
complementary determining regions (CDRs), which vary within different antibodies, and
determine the high diversity of mAbs and their high specificity to the antigen. Monoclonal
antibodies are mono-specific antibodies possessing affinity for the same antigen (i.e. have
identical CDRs) as they are made by identical immune cells that are all clones of a unique
parent cell. In contrast, polyclonal antibodies are made from several different immune cells.5-
7
Figure 1.1: Structure of a Monoclonal Antibody.
Structure of a monoclonal antibody split into four polypeptide chains, consisting of two heavy chains
and two light chains. Structure can also be split into the Fab region (comprising the variable domains
which contain the CDRs) and the Fc region. Adapted from Shukla et al.8
The Fc region serves as the binding site for complement components and leukocytes. The
structure contains only constant domains and determines the type of immunoglobulin (Ig)
isotype; IgA, IgD, IgE, IgG or IgM. Each Ig class has its own structure and function with
IgA consisting alpha heavy chains, IgD with delta heavy chains, IgE having epsilon heavy
chains, IgG having gamma heavy chains and IgM with Mu heavy chains.5 Furthermore, the
classes can be split into subclasses based on slight differences in the amino acid sequence in
the constant region of the heavy chains i.e. IgA contains two subclasses (IgA1 and IgA2) and
IgG contains four subclasses (IgG1, IgG2, IgG3 and IgG4). IgG is the most common isotype
used for therapeutic drugs. It is the only class that can promote antibody-dependent cellular
cytotoxicity (ADCC), the only class that can cross the placenta in humans and is the most

18
stable. It is important to note, however, that the different subclasses differ in their
effectiveness, for example, IgG4 does not fix complement.9,10
Immunoglobulins ultimately work in three different ways; by triggering an immune response
to attack, by blocking signals, or by acting as a transporter carrying drugs to cells. IgGs used
in cancer treatment can be split into two types; naked IgGs and conjugated IgGs. Naked IgGs
work independently whereas conjugated IgGs act as homing devices through being joined to
a chemotherapy drug, a radioactive particle or a toxin thereby transporting these substances to
the target cancer cells. Antigens that are expressed by human cancers have revealed a broad
collection of targets for therapy that are over-expressed, mutated, or selectively expressed
compared with normal tissues. One of the first malignant diseases with successful IgG
treatment was non-Hodgkin lymphoma (NHL), using rituximab. Rituximab is an IgG1 that
targets the CD20 antigen on B-lymphocytes and has shown to cause rapid depletion of
malignant CD20+ B-lymphocytes from the blood, bone marrow and lymph nodes in patients.
Rituximab treatment has been enhanced with combined cytokine treatment, for example, with
IFN--2 which increases the CD20-antigen expression on lymphoma cells thereby
enhancing the immune response.11
Zevalin and Bexxar are examples of conjugated
(radiolabelled) IgGs which are also used for NHL treatment. They both target the CD20
antigen on B-cells carrying different radiolabeled particles. Zevalin consists of rituximab
followed by ibritumomab tiuxetan and Bexxar consists of tositumomab.12
Another example
of an established IgG1 is trastuzumab, approved by the FDA in 1998. Trastuzumab is used in
breast cancer therapy targeting the over-expressed proto-oncogene, human epidermal growth
factor receptor 2 (HER2), thereby blocking the protein’s activity.5 Since 1997, 12 IgGs have
been approved by the FDA just for the treatment of solid tumours and haematological
malignancies.11
As well as cancer, IgG therapy is also used for other chronic diseases/illnesses. Rheumatoid
arthritis (RA) is the most common systemic autoimmune condition worldwide and is
characterized by remittent systemic autoimmune inflammation and painful progressive joint
deterioration.13
Numerous IgGs have been used to target tumour necrosis factor (TNF), a key
inflammatory cytokine in RA, which promotes inflammation by stimulating the release of
other cytokines such as IL-1, IL-6 and granulocyte macrophage-colony stimulating factor
(GM-CSF). Inhibition of TNF activity has shown to significantly reduce inflammation and
joint damage in RA patients. IgGs targeting TNF for RA therapy include infliximab,
19
adalimumab and golimumab. Rituximab is also used in RA therapy, through targeting B-cells
and blocking TNF activity.14-16
1.2 Protein Aggregation
1.2.1 Protein Aggregation Consequences
Protein aggregation can occur in vivo as pathological aggregation (in disease) and in vitro in
the industrial production of proteins. In vivo (in cells) uncontrolled aggregation has been
associated with a number of diseases, grouped as amyloidosis including Alzheimer’s disease,
Parkinson’s disease and Huntington’s disease. During biopharmaceutical production, protein
aggregates are typically net irreversible under the conditions they form and their levels must
be tightly controlled and limited for regulatory and safety reasons.17,18
Structural changes in
proteins resulting from aggregation reduce the efficiency of the product and could also
increase its immunogenicity i.e. increasing the risk of unwanted autoimmune responses
leading to inactivation of the drug and possibly adverse effects. Therefore, aggregates
detected during product production have to be removed, which increases costs due to reduced
product yield, and thereby reduces the efficiency of the bio-processing stages.19
1.2.2 Mechanisms of Protein Aggregation
Protein aggregation is essentially a major side reaction of protein folding. Functional proteins
typically fold into their 3-dimentional structure where - simplistically - their shell is
hydrophilic and core is hydrophobic. Synthesised proteins may not fold correctly or folded
proteins may unfold exposing the hydrophobic core. These exposed hydrophobic regions
becoming attracted to each other and consequently form intermolecular structures i.e. protein
aggregates.20
The aggregation process can occur through a variety of mechanisms. Five main mechanisms
have been postulated, but it should be noted that these mechanisms are not mutually
exclusive and more than one can occur at different stages21
: (1) reversible self-
complementary native monomer-monomer association forming small oligomers, these can
develop into larger oligomers leading to aggregates becoming irreversible; (2) changes in
conformation or partial folding promoted by stress mechanisms, leading to altered monomers
to associate; (3) changes in conformation initiated by a difference in covalent structure,
usually caused by chemical degradation, resulting in the new complementary structures to
aggregate; (4) nucleotide-controlled aggregation which is common for visible particles; when
an aggregate of sufficient size develops, the growth is called ‘critical nucleus’, where

20
addition of monomers and formation is rapid; (5) surface induced aggregation where
aggregation starts via native monomer binding to a surface resulting in conformational
change (to increase contact area with surface), this can then be followed by mechanisms (2)-
(4). Mechanism 1 aggregates are native-like; hence, if large aggregates induce immune
responses then it is more likely that these proteins will cross-react the native monomer.
Mechanisms 2 to 5 are primarily made from non-native monomers thus it is more likely that
they will have altered potency as well as altered immunogenicity (as altered monomers
present different epitopes). Examples of conditions where these aforementioned mechanisms
occur will be given in the subsequent sections. From these mechanisms, various types of
aggregates can develop. Although there is no uniform terminology for aggregate types,
classification systems have been introduced based on their size and their structure, illustrated
in Figure 1.2: (1) reversible noncovalent small aggregates (e.g. dimers, trimers; nanometre
particles); (2) irreversible noncovalent aggregates (tend to be in the submicron size range);
(3) large aggregates which can be reversible if noncovalent (with a diameter up to around
3m) and (4) large irreversible aggregates (which can become visible >100 m).
Figure 1.2: Size ranges and types of protein aggregates.
Size ranges and types of protein aggregate structures. The different structures are not limited to
certain size ranges and can overlap. Figure not to scale. Adapted from Philo et al.22
and Weinbuch et
al.23
1.2.3 Industrial Production of Therapeutic mAbs
MAbs are susceptible to a variety of degradation routes which they are exposed to at various
points in their life-time. The overall stages of protein biopharmaceutical development consist
of cell culture, manufacture, storage, and administration. The manufacturing process, or the
downstream process, is a vital part of biopharmaceutical production as it is essentially the
purification process, and protein aggregation has been reported at levels of 30% in the cell

21
culture.1 The downstream process is outlined in a schema in Figure 1.3 and consists of a
capture stage, polishing chromatography steps for the removal of impurities, steps for viral
clearance, and ends with ultrafiltration/diafiltration to formulate and concentrate the product.
The steps are monitored to keep the protein in optimal conditions involving pH, temperature,
ionic strength and salts, resulting in a stable product that is able to carry out the functions
intended.8
Figure 1.3: Downstream process for mAbs production.
Downstream process for mAb production consists of various stages initiating from cell culture and
ending with formulating the product into the desired concentration. Adapted from Shukla et al. 24
The downstream purification process usually initiates with ‘Protein A affinity
chromatography’ as the capture step. It is based on the specific binding affinity between the
Fc region of mAbs and the immobilized ‘protein A ligand’. The step involves the cell culture
supernatant to be loaded on the column followed by product elution from the column at low
pHs, thereby removing contaminants;24
glycine-hydrochloric acid is an example of an elution
buffer with pH 2.8.25
At the end of this step the purity of samples needs to reach 98%.
Unfortunately this step has several limitations; one is the high cost and the second, and most
importantly, is the low pH used. The low pH can result in the formation of soluble aggregates
and precipitates. This then adds burden to the polishing steps as insoluble aggregates can be
ultimately formed from the aforementioned species. Another consequence of aggregation at
this stage is the increased risk of reducing the column’s lifetime due to clogging of the
chromatography column.24
Strategies have been developed to address the aggregation
problem at this stage. For example, pre-treatment of the solution buffer to remove
precipitating impurities through using stabilizing additives; optimising the temperature; and
working on the slope of transition from wash to elution8 – these are discussed later.
The polishing steps aim to reduce the product-process impurities such as high molecular
weight aggregates. There are at least two polishing steps during the downstream process and
various methods are used such as cation-exchange chromatography (CEX), anion-exchange
chromatography (AEX), hydrophobic interaction chromatography (HIC) and hydroxyapatite.
One of the two steps usually uses AEX and HIC which are flow-through modes i.e. where the

22
product does not bind to the column. To assist in viral clearance, there are also at least two
dedicated steps of viral inactivation and size-based viral removal by viral filtration. The last
step in the downstream process is ultrafiltration/diafiltration (UF/DF) which reduces the
storage volume and exchanges the product into the formulation buffer to produce the drug
substance.8,24
1.2.4 Accelerated stability testing
The FDA and ICH guidelines state the requirements of stability testing data to assess how the
product changes over time.26
Therapeutic proteins need to retain their efficacy during long
periods of storage over multiple years. However, stability issues have shown to arise; a
common degradation route is aggregation development over time. Stability tests are carried
out to confirm that a drug remains active and does not create degradation products. The data
required from stability testing is an important requirement for regulatory approval on the drug
and is utilised to create recommendations on shelf life and storage conditions – including
temperature and the storage device.27
Real-time stability studies are time-consuming, with a minimum study time of 12 months.
The product is stored at room temperature, under natural light and expected levels of
humidity where the drug will be kept/sold.28,29
As an alternative measure, rapid testing is
carried out in the form of accelerated stability testing with a testing time of around 6 months,
with suggested sampling times of 0, 3, and 6 months.30
Accelerated stability testing is used by
formulation scientists early on in formulation development to assess the optimal formulation
conditions for the product. Hence, it is classed a predictive tool of protein stability.
Accelerated stability testing involves situating formulations under several high temperatures
to force degradation. At least four different stress temperatures are recommended in order to
retrieve a statistically viable result. Guidelines state the accelerated storage condition must be
> 15 C above the ambient storage condition; usually around the 40
C mark. Stress
conditions are applied that may influence the products stability post-production such as
moisture, light, pH, agitation and packaging, to test the robustness of the protein
formulation.31
Here, the stages are mimicked, for example, agitation stress can be mimicked
using shaking experiments. The rates of degradation pathways under these accelerated
conditions, such as aggregation, are used to predict what the rates would be under real-time
storage conditions i.e. how long it would take to have an unacceptable amount of aggregates

23
in the product. Following stress, the samples are refrigerated and then assayed
simultaneously.32
1.2.5 Factors contributing to protein aggregation
The environmental stressors leading to, or accelerating, protein aggregation, through the
mechanisms outlined above (section 1.2.2), include temperature, pH, ionic strength, salts and
material interfaces. These potential stressors need to be controlled during production and they
also need to be kept stable after production, where the risk of protein aggregation is
heightened during transport and storage via mechanical and/or agitation stress. Thus, these
are not only classed as ‘stressors’, but also ‘controls’ as they can be manipulated to help
reduce unwanted protein-protein interactions (PPIs); which have been associated with an
increased risk of protein aggregation. Additionally, these factors are used in accelerated
stability studies, to assess aggregation development and develop aggregation models. This
section introduces protein-protein interactions and protein aggregation stressors.
1.2.5.1 Protein-protein interactions (PPIs)
In relation to the development of protein aggregates, there has been a vast amount of studies
dedicated to understanding and controlling non-specific protein-protein interactions (PPIs).
PPIs are linked to problems in product development such as protein aggregation and
viscosity, due to the close proximity of protein molecules particularly at high protein
concentrations (discussed later – section 1.2.5.6).33
Therefore, dedicated areas of study
include (i) mechanisms of PPIs; (ii) the driven forces leading to/changing the nature
(attraction or repulsion) of PPIs and (iii) methods/techniques to measure PPIs.
Interactions between protein molecules (in solution) can be explained by a basic model
involving electrostatics (contributing to repulsion) and Van der Waal forces (contributing
towards attraction). The model is with respect to the distance between the molecules (Figure
1.4).34,35
Common formulation parameters i.e. pH, ionic strength, and nature and
concentration of excipients (discussed further in subsequent sections) have been known to
affect conformational stability of proteins and aggregation mechanism rates (aggregation
mechanism one – section 1.2.2).36-38
For example, pH and NaCl concentration has been
shown to mediate protein-protein electrostatic repulsions.34
Van der Waals interactions are
weak interactions that occur between molecules in close proximity to each other. As the
molecules move further apart, the potential energy due to repulsion decreases. In the potential
energy diagram (Figure 1.4), the minimum potential energy point correlates with the Van der

24
Waals distance whereby the interaction energy greatly increases when the distance between
two atoms is smaller than 3.8A.
Figure 1.4: Potential energy diagram illustrating the interaction energy over the distance between
two molecules.
Potential energy diagram illustrating the interaction energy over the distance between two molecules,
whereby electrostatics contribute towards repulsion and van der Waals forces contribute towards
attraction. Adapted from Barnett et al. and Lund et al.34,35
Measuring PPIs has shown strong utilisation in aiding in the development of optimal
formations. The osmotic second viral coefficient (B22) is a well-established measure of weak
protein-protein interactions. The measure provides a direct link to the pair protein potential or
the mean force of interaction: the free energy of the system when two protein molecules are
held at some specified separation, relative to when they are infinitely far apart, averages with
respect to all possible configurations of the solvent molecules and usually with respect to the
orientation of the protein molecules: for PPIs, two protein molecules must be within the range
of spatial attraction and must be correctly orientated so the hydrophobic patches are face-to-
face. A positive B22 value indicates net repulsion between protein molecules such that
protein-solvent interactions are superior to PPIs, whereas, a negative B22 indicates net
attraction between protein molecules and the solvent is classed as a ‘poor solvent’. B22 has
been utilised in many applications; for example, it has shown to be utilised in tailoring
experimental conditions to result in protein-protein attractions leading to protein
crystallisation.39-41
Furthermore, a strong correlation between the B22 and protein solubility
25
has been demonstrated with the level and nature of PPI been proposed to predict the change
in protein solubility.42
With the development of analytical technologies, a more efficient way
of measuring PPIs has been developed through the interaction parameter (kD). The use of kD
is heightening in studies as it is amendable to high throughput. As a linear relationship
between the two parameters has been established this, there is a robust case of using kD
instead of B22.43,44
Nevertheless, a strong correlation measuring PPI (i.e. through the B22) at dilute
concentrations and protein aggregation at high concentrations is proving difficult to
establish45,46
and so alternative measures / models to predict aggregation are still an important
area of focus.
1.2.5.2 Temperature
High temperatures are known to induce protein denaturation through breakage of hydrogen
bonds in the proteins secondary structure. Subsequently, proteins unfold which exposes the
hydrophobic regions that are normally protected. Consequently this may lead to aggregation
in order to decrease the amount of exposed hydrophobic surfaces. Irreversible aggregation
development due to high temperatures has been demonstrated through spectroscopy methods.
For example, the amide I band (which is the backbone of polypeptides) becomes well defined
at high temperatures and the band has shown to remain intense after cooling; thereby
representing the development of irreversible aggregates at the high temperatures.47
Another
major process in the early stages of aggregation, caused by thermal stress, is the unfolding of
the -helix. This unfolding of the native structures (of the protein) was shown to occur at
temperatures of 40-45C, and the unfolding became clearer after 55C (which is regarded as
the melting temperature, Tm, at which half of the protein is in an unfolded state). Here, the
highly solvent exposed regions unfolded first and was the origin of aggregates, and the buried
region still maintained the regular structure in aggregates, and underwent a further unfolding
at the later aggregation stage.48
Cold denaturation has been reported to result in a loss of functional activity. Therapeutic
drugs are often stored frozen at temperatures ranging from -20C to -80C to maintain their
ability and reduce the chances of microbial growth. However, aggregation has shown to
develop through destabilization from the cryo-concentration (the concentration of chemical
constituents in a liquid due to freezing) of the protein and co-solutes leading to denaturation
at the water interface (i.e. mechanism (2) and mechanism (5) – section 1.2.2). Similarly,

26
aggregation can arise during freeze-thaw procedures.49
Freezing an aqueous solution slowly
results in pure crystals of water forming (because the freezing temperature of water is
higher). This slow rate of cooling has a large impact on protein stability as it increases the
time the protein is exposed to the high salt concentrations and the destabilizing pH
conditions, prior to the temperature becoming sufficiently low so that protein degradation is
limited. In addition, the large surface area of the small crystals can increase aggregation
through surface denaturation of the protein (i.e. mechanism (5) - section 1.2.2). As an
alternative, flash freezing is too fast for the water to form pure crystals resulting in no
precipitation. However, a rapid cooling rate does not ensure optimal protein stability.
Henceforth, it is a widespread rule not to freeze the same batch of protein twice.50
Studies have debated whether the individual domains of mAbs (CH3, CH2, CH1, VH, CL and
VL) (Figure 1.1) have intrinsic thermodynamic stabilities, or whether the thermodynamic
stability of the individual domains does not render to the thermodynamic stability of the full
protein. In the latter case, there may be additional stability components due to inter-domain
interactions. Properties of the individual domains of mAbs have been investigated. For
example, Lazar et al. reported that the CH3 domain on IgG1s have a higher Tm compared to
the other domains thereby making CH3 less resistant to cold denaturation.49
Recent work on a
study into a human-like single chain antibody fragment (scFv) has highlighted the limitations
with using conformational stability, following thermal stress acceleration studies, as
predictors of aggregation propensity.51
Further work is necessary on the kinetics of denaturation for long-term storage at low
temperatures, especially since the thermodynamic ability varies with different mAbs and
different proteins. Subsequently, the thermodynamic stability of each mAb needs to be
considered independently.
1.2.5.3 pH
mAbs are exposed to low (acidic) pHs at several stages during production i.e. during affinity
chromatography and viral clearance in the downstream process, and post-downstream with
freeze-thaw steps, exposure to UV radiation and mechanical stress. Low pH values have been
shown to convert IgG1 antibodies to soluble reversible aggregates due to destabilizing both
the Fc and Fab regions thereby decreasing the conformational stability. Additionally,
increasing the temperature resulted in the transition to the irreversible aggregate state.52

27
Meanwhile, during IgG4 development the transition in pH has shown to induce protein
aggregation rather than exposure to low pH - implying that there should be no concern over
prolonged incubation at low pH for viral clearance during downstream processing. The
aggregation problem arises during changes from low to high or from high to low pH. During
the transition in pH, aggregates became irreversible at neutral pH; indicating that they
became kinetically trapped in an altered conformation and would require a substantial energy
barrier to resume to the normal conformation. Increasing the temperature gave enough energy
to revert the sample to its native conformation; nevertheless, this was only the case with
hIgG4-A antibody - thereby, demonstrating the different properties between the subclasses.
In addition, the ionic strength also affected the stability of the IgG4s in this study, but ionic
strength alone did not induce significant changes in conformation.53
1.2.5.4 Excipients
1.2.5.4.1 Buffers and salts
The buffer and added salts are classed as the main excipients in protein formulations. The pH
and ionic strength of solutions is mainly modified by the addition of organic salts which has
an effect on protein stability, PPIs and protein solubility.54,55
Each buffer composition has its own advantages and disadvantages and their compatibility
varies with different analytes and experimental applications. For example, Tris buffer is
known to be sensitive to changes in temperatures (in terms of pH changes) whereas
phosphate’s pH is not dependent on temperature but has shown to inhibit kinases.56
As well
as deciding on the buffer composition prior to purification, the ionic strength of the buffer
may be changed during the purification steps i.e. to prevent nonspecific interactions between
proteins and the (chromatography) column.54
For instance, NaCl is an ionic stabiliser used to
enhance protein solubility. In ion exchange chromatography a low concentration of NaCl is
used for loading the protein onto the column (5-25mM) and a high concentration (or change
in pH) is used for elution. In other types of chromatographic separations, such as gel filtration
and affinity columns, the NaCl concentration is greatly increased; cases have gone up to 500
mM NaCl to help prevent the nonspecific interactions between proteins and the column.56
Salts have a strong effect on protein solubility thus there is the need to understand salt-protein
interactions as well as salts’ effect on protein-protein interactions (PPIs). Changes in ionic
strength have shown to affect the rate of aggregation significantly: proteins with high
hydrophobic content on their surfaces, from unfolding, tend to have low solubility in aqueous

28
solutions. Charged amino acid residues can interact with the ionic groups in the solvent (i.e.
salts) and increase/decrease the solubility of the protein.52,57
At low salt concentrations (<
0.1M) the proteins behave as charged colloids interacting with the surrounding salt ions
resulting in an electrical double-layer force between the proteins. The net ion concentration in
the double layer surrounding the protein is greater than in the bulk solution and when the
protein double layer overlaps, a repulsive force is created. With increasing the ion
concentration, the PPIs become attractive (less repulsive) due to the range of the double layer
decreasing (explained by the DLVO theory). At higher salt concentrations (> 1M) the salt
induced attraction cannot be explained by the electrical double layer because the range of the
attraction is very small in concentrated solutions. Here, solubility is reduced due to attractive
PPIs originating from salting-out effects, which are related to the position of the ion in the
Hofmeister series.40
Proteins are most stable when they are hydrated. Once a certain ionic
strength is reached, the water molecules are no longer able to form a protective hydration
barrier around the protein surface leading to a decrease in solubility, thus, precipitation and/or
aggregation could follow. Hence, the greatest salting-out effect is from the most strongly
hydrated anions. Before protein chromatography, salting out was the major method used to
purify proteins.58,59
1.2.5.4.2 Other excipients
Other types of excipients include sugars (such as sucrose and trehalose) which prevent
unfolding during lyophilisation (dehydration), hydrophilic polymers (such as hydroxyl ethyl
starch), non-ionic surfactants that protect from surface-induced agitation stress (such as
polysorbate 80 (PS-80) and polysorbate 20 (PS-20)), amino acids (such as histidine, arginine
and glycine), and preservatives to prevent microbial growth (such as benzyl alcohol and
phenol).60,61
Around 80% of commercially available mAbs contain either PS-20 or PS-80 in the
formulation. They are also known through their trade names of Tween 20® and Tween 80
®,
respectively.62
Polysorbates are amphiphilic surfactants composed of fatty acid esters of
polyoxyethylene sorbitan.63
The hydrophobic nature is provided by the hydrocarbon chain
and the hydrophilic part is provided by the ethylene oxide units. PS-20 and PS-80 have a
common backbone and only differ in the structures of the fatty acid chains. Both PS-20 and
PS-80 have proven very efficient at preventing aggregation at the air/water interface,
particularly following agitation. Two main mechanisms of polysorbates have been postulated.
The first is preventing aggregation through polysorbate directly interacting with hydrophobic

29
regions of the proteins. However, this mechanism requires further understanding, particularly
in relation to polysorbate interaction with mAbs and more so in high concentrated mAb
solutions; as the current literature is quite conflicting.64
The second mechanism for protection
by polysorbates is competitive binding to surfaces (such as glass, air,); this mechanism is
proposed to be the main mechanism in mAb solutions. Due to their amphipathic nature,
polysorbate monomers accumulate at interfaces where they orient themselves to minimise
exposure of the hydrophobic parts to the aqueous solution (known as the hydrophobic effect:
adsorption of polysorbate at solid interfaces results in removal of the hydrophobic surface
from the water molecules as water prefers to hydrogen bond with itself).64,65
The surfactant concentration is an important parameter affecting surfactant behaviour in
solution. A sufficient amount is required in order to carry out their protective properties. The
critical micelle concentration (cmc), defined as the concentration at which micelles start to
form, is related to surface saturation by surfactant monomers. As the surfactant concentration
increases and the surfaces become saturated, the surfactant monomers form micelles in the
solution to evade the hydrophilic environment. Initially micelles are spherical aggregates with
the hydrophilic tails pointing outwards into the solution. The surfactant concentration chosen
in formulations tends to be just above the cmc. The formulation scientist cannot just simply
pick a high surfactant concentration (above the cmc) as Agarkhed et al. demonstrated
destabilising effects with PS-80 at high concentrations.66
Additionally, too high concentration
can be detrimental as surfactant-protein complexes can form. These complexes may be
immunogenic to patients.67,68
The cmc is a thermodynamic equilibrium and affected by
factors such as temperature and solutes, thus the cmc needs to be determined for the specific
formulation.65,69,70
Therefore determining the cmc and the optimal surfactant concentration
per protein formulation is strongly recommended. Fluorescence-based techniques and surface
tension for determining the cmc have been used for many years.71-74
However, one reason for
the lack of understanding and the scarce data in the literature on polysorbate-protein
interaction is the lack of technologies which can effectively characterise surfactant in the
presence of protein. Thus the development of techniques is required in order to assess micelle
behaviour in presence of other solution component, including protein.
Polysorbates do need to be used with caution, as cases have been found where degraded
polysorbate can lead to chemically modifying proteins. Additionally, opposite effects of
polysorbate have been observed where presence of PS-20 enhanced aggregation in thermal
stress experiments.63,69,75
30
1.2.5.5 Mechanical / Agitation stress
After product formulation, the final step is product filling i.e. into vials or syringes. There are
no further purification steps after the fill; hence, it is essential that compatibility of the protein
formulation with the filling equipment is assessed before this stage. Mechanical stress can
ensue at this stage due to the use of pumps.1 Post-production, agitation stress can impact
protein stability during transport/shipping. The effect of agitation on protein aggregation has
been assessed extensively and is well documented.76-78
Mechanical/agitation stress can lead
to/or accelerate aggregation through the increased occurrence of interactions at air-liquid
interfaces and material surfaces due to shear forces and local thermal effects - leading to
spontaneous adsorption of the protein molecules to the interfaces leading to protein unfolding
and aggregation. During the engagement of proteins to the air-liquid interface, the exposure
of protein to air increases with the increased development of irreversible aggregates (i.e.
aggregation mechanisms (5) and (3) – section 1.2.2).77
79
In addition, the materials used may have an impact on protein aggregation such as glass from
vials, rubber from stoppers and silicone oil from syringes. The level of adsorption between
different interfaces e.g. syringe surfaces such as glass, silicone oil80-82
is a growing area of
research, along with the combined effect of agitation stress; the mechanisms still need to be
fully explored. Additionally, the use of excipients i.e. polysorbates at preventing surface
induce aggregation is a focus area. Such studies are based on methods which mimic real-life
mechanical/agitation stress that the protein solution experiences during manufacture or
shipping; such as pumps, stirrers and horizontal or vertical shakers.83,84
1.2.5.5.1 Silicone oil in Syringes
Pharmaceutical companies are increasingly using pre-filled syringes (PFS) as an alternative
to vials for subcutaneous injection. A developing challenge that has come under the attention
of the biopharmaceutical industry is silicone oil particle formation.85
The majority of PFS are
made from glass and silicone oil is needed as a lubricant for their functionality i.e. to
facilitate smooth and easy movements of plungers with barrels and also in hypodermic
needles to reduce frictional drag and pain. Silicone oil also prevents adsorption of solution
components (e.g. protein) on the glass surface.86
Silicone oil has been used for over fifty
years in industrial applications. It is similar to traditional hydrocarbon oil except that its
molecular chain replaces carbon units with siloxane units. For siliconization, trimethylsiloxy
end-blocked polydimethylsiloxane (PDMS) in various viscosities is generally used. For
primary packaging components e.g. PFS the most commonly used silicone oil is DOW

31
CORNING® 360 Medical Fluid.87
Characteristics making PDMS suitable for pharmaceutical
applications include high thermal stability (at very hot and cold temperatures), low sensitivity
to UV radiation or oxidation agents and it is non-toxic.88
The PDMS molecule is spiral
shaped therefore easily compressible and is surrounded by methyl groups which are
responsible for the chemical properties of PDMS i.e. low interaction and low viscosity. These
chemical properties aid the effective distribution of PDMS on surfaces (homogenous
siliconization) thus making it an effective lubricant. The hydrophobicity of the methyl groups
make PDMS insoluble in water, and preferential binding to surfaces.87,88
A sufficient quantity of silicone oil is needed to create a homogeneous coating. However,
increasing the amount of silicone oil has been associated with silicone oil particles in the
solution. Particle formation during transport has been suggested to accelerate protein
aggregation. Silicone oil contamination was first reported in 1985 where elevated blood
glucose levels were reported in patients who were administered cloudy insulin from syringes;
later analysis revealed protein-particle formation from silicone oil.89
Another case where
aggregation became a problem during transport and administration came through the reports
of sustained elevation of intraocular pressure (IOP) and inflammation; after the intravitreal
use of bevacizumab and ranibizumab. Characterization of the particles, from bevacizumab
repackaged in the same types of plastic syringes as those used by external compounding
companies, showed that indeed nearly all the particles were silicone oil micro-droplets.
Additionally, from controlled lab experiments inflicting mechanical shock, there was an
increase in silicone oil droplets in the bevacizumab formulation, indicating that silicone oil
contaminants could indeed be responsible for the IOP elevations. Reports on IOP spikes from
ranibizumab are significantly fewer, and this could be due to the fact that ranibizumab are
stored in glass vials and are only exposed to the syringe for a brief time. Thus, the risk of
protein aggregation with silicone oil droplets is relatively lower compared to bevacizumab
repackaged in plastic syringes.27
It has been strongly suggested that silicone oil released into
the IgG solution can provide a nucleation site for aggregation of the proteins after
destabilizing the protein formulation.82
Based on such studies, is questioned whether silicone
oil itself has impact on aggregation, or whether the solution needs to be disturbed first.
There is a lack of knowledge on the effects of silicone oil on mAb products, and with the
growing number of mAbs in development and the increasing use of PFS, the area requires
further consideration. It is not currently possible to predict the sensitivity of different proteins
to silicone-oil induced aggregation. The study by Thirumangalathu et al. is one of the first

32
reported investigations in the literature on silicone oil induced aggregation of mAbs,
assessing anti-streptavidin IgG1. Silicone oil greatly enhanced the loss of soluble monomeric
protein during agitation compared to agitation alone. Moreover, agitations at higher speeds
lead to accelerated monomer loss. An interesting and very useful finding was that PS-20
completely inhibited silicone oil-induced loss of IgGs during agitation. The predominant
mechanism is assumed to be competition with the protein for adsorption to the air-water
interface (mechanism (5)).85
In another study, it was demonstrated that increasing the ionic
strength through the addition of salts (KCl and NaCl) reduces IgG1 protein aggregation at the
silicone oil water interface.90
Due to the strong correlation between particle counts and mechanical/agitation stress in
silicone-lubricated syringes, further studies are necessary to create the ideal shipping
guidelines for therapeutic products - in terms of storage and handling. It is also substantial to
find an analytical technology which is able to differentiate between protein, silicone oil and
protein-silicone particles; this is a current area of interest. Raman spectroscopy has shown the
capability to do this but requires further validation.91
Flow cytometry or FACS (fluorescence-
activated cell sorting) has also been proposed to differentiate between the groups. However,
data analysis did underline the lack of sensitivity / inconsistency of FACS to smaller
particles.92
Syringes are siliconized by either (i) spraying pure liquid silicone oil on the interior of the
surfaces of the syringe barrel or by (ii) baking on a layer that is sprayed as an emulsion of
silicone oil and water. The latter results in a layer that adheres to the surface and is far less
prone to silicone oil droplets breaking into the protein solution.87
Published literature has
ultimately focused on silicone oil particles (using spiking studies) and particle formation,
leaving research on the impact of the layer limited. A recent study focused on this method
through evaluating IgG1 solutions with the immobilized silicone oil water interface;
represented through covalently siliconized borosilicate glass beads. During agitation, through
end-over-end rotation, the glass beads remained stationary and the IgG1 solution passed over
them resulting in protein aggregation. It was suggested that if there was no air gap in the
syringes then aggregation could be minimal due to the minimised transport of the protein
solution over the silicone oil water interface. Nevertheless, this method of analysis allowed
the measurement of protein particle formation or aggregation without the interference of
silicone oil droplet particles while still assessing the effects of silicone oil induced
aggregation. Hence, standard aggregation detection techniques could be used to analyse the

33
aggregates (size exclusion chromatography and micro flow imaging), without the concern of
identifying silicone oil particles.93
To overcome the silicone oil-aggregation problem it has been suggested to substitute silicone
oil with another lubricant. However, the suggested replacements so far, such as Teflon, may
also cause problems - hydrophobic surfaces on Teflon have also been associated with protein
aggregation due to adsorption of its water interface.85
Further understanding on the
mechanisms and development of protein aggregation in the presence of silicone oil and
agitation effects is required in order to develop ways to minimise the unwanted
developments. By this means, facilitating a long term stabilized formulation which can
withstand the agitation and mechanical stress during handling and transportation of the
therapeutic drugs. To do this, as mentioned, technologies are required which can characterise
and differentiate between particles, i.e. protein and silicone oil, in the solution.
1.2.5.6 High Protein Concentrations and Viscosity Issues
1.2.5.6.1 High mAb dose requirements
Problems associated with protein stability are often amplified at high protein concentrations;
the close proximity between protein molecules promotes protein-protein interactions, leading
to elevated aggregation tendency.94
The development of high protein concentration
formulations are often needed to meet dose requirements of therapeutic drugs. Doses of 100-
300mg are often necessary to achieve significant clinical effects. This is not much of an issue
via intravenous routes; however, intravenous routes require the aid of health care
professionals, which can be an inconvenience for patients requiring regular administration
and also costs the healthcare sector substantial expenses. Thus, subcutaneous routes are
increasingly being used to enable patient self-administration. However, due to the doses of
mAb required, along-side the volume restrictions of subcutaneous injections (less than
1.5mL), highly concentrated drugs formulations are required (i.e. hundreds of mg/mL).95
As well as stability issues, using high protein concentrations, there are also delivery and
analytical challenges. Analytical challenges are in relation to the concentration limits of many
analytical techniques i.e. many techniques cannot characterise protein aggregates at high
mAb concentrations (see section 1.3). Delivery challenges are related to viscosity issues
when administering the drug through injection – discussed in the next section (1.2.5.6.2).

34
1.2.5.6.2 Issues with high viscosity in therapeutics
Regulations give guidance on the evaluation of syringe performance.96
This is often
addressed assessing the ‘syringeability’ and the ‘injectability’ of the therapeutic solution.
Syringeability refers to the ability of a solution to pass easily through a hypodermic needle
and includes factors such as ease of withdrawal and accuracy of dose measurements. It is
often assessed as the force required for the injection at a given injection rate. Injectability
refers to the performance of the formulation during injection and includes factors such as
force required for injection and evenness of flow.97
Both aspects should be characterised and
understood during product development. High viscosity leads to poor syringeability due to
high injection force required.98
The viscosity of solutions increases as a function of protein
concentration. At high concentrations (i.e. > 100mg/ml) viscosities often reach above the ~20
cP limit for subcutaneous injection, which would require a high injection force of more than
30 N over a suitable injection time of around 1 minute. High injection force is undesirable as
linked with high injection pain in patients.99,100
Many aspects have been assessed in order to address problems with syringeability such as the
needle geometry i.e. length, diameter. Although wider needles will aid syringeability, fine
needles reduce pain of injection; typical configurations for prefilled syringes are 25 G and 27
G.101
Thus, based on patient’s comfort and compliance and necessities of the syringe system,
the needle geometry is quite restricted. Once the syringe system and mAb concentration has
been chosen, the formulation scientist can only influence the viscosity by formulation
parameters such as pH, ionic strength, salts and types of excipients. It is known that the
material’s viscosity is a physical property that is sensitive to material’s characteristics i.e. the
protein itself and to the properties of the surrounding environment i.e. solution
components102,103
Thus, these aforementioned parameters are investigated to ensue optimised
delivery.98
The link between viscosity and PPI is a developing research area, with studies showing high
solution viscosity can result from protein self-association / aggregation. However, methods
(or models) for predicting the viscosity behaviour of concentrated solutions from dilute
solutions still require understanding and development. Such studies often assess the
properties of different formulations (i.e. effect of ionic strength and pH) which can reduce
solution viscosity and can also act as models for relating viscosity behaviour between dilute
and concentrated mAb solutions.43,104-106

35
1.2.5.6.3 Measuring and predicting viscosity – the study of flow
It is essential to measure solution viscosity during early stages of formulation, due to the
potential issues with viscosity which can develop (as discussed in the previous chapter). To
understand viscosity and the fundamentals principles of rheology techniques it is important to
understand the difference between Newtonian and non-Newtonian fluids. A simple linear
relation is described between shear stress and shear rate, known as Newton’s Law of
viscosity (this is now the fundamental principal in rheology techniques as described above):
the viscosity (η) is linearly proportional to the shear stress over the shear rate, for Newtonian
fluids. Examples of Newtonian fluids include water, organic solvents and honey. Low protein
concentration solutions have also shown to displace Newtonian behaviour.107
Non-Newtonian
fluids have a viscosity which is not fixed. It shows a ‘shear thinning’ or ‘shear thickening’
behaviour where viscosity decreases or increases, respectively, with applied shear rate. Shear
thinning behaviour has been observed with high mAb concentration solutions and following
aggregation. Studies have indicated aggregation causing the shift from Newtonian to non-
Newtonian behaviour.100,108
Other studies have also observed similar affects, relating
attractive PPIs to shear thinning behaviour.107,109
Rheometry is the study of flow. There are two forms of flow measured on rheometers: the
shear flow and extensional flow; the shear flow is the most commonly and easily measured.
For shear flow, the fluid is described as layers of fluid sliding over one another with each
layer moving faster than the one underneath it, such that the bottom layer is stationary. An
external force in the form of a ‘shear stress’ acts on the fluid over a unit area. This causes the
layers to move with the top layer moving the furthest at a distance x. A displacement gradient
is created across the layers and is termed as the ‘shear strain’. For fluids, the shear strain will
increase with the period of applied stress. The velocity gradient created is termed as the
‘shear rate’ – the change of strain over time. The ‘shear viscosity’, also known as the
‘dynamic viscosity’, is calculated as the coefficient between the shear stress and shear rate.
This is a quantitate measure of the internal fluid friction.110,111
Thus, the shear viscosity (),
measured by conventional rheometers, is defined as the shearing stress per unit rate of shear
strain via Newton’s formula.112
This is also known as macro-rheology. There are numerous
methods to measure solution viscosity and each come with their own set of benefits and
limitations. At a macroscopic level, the viscosity is the rate of transfer of momentum in a
liquid.113
A well-known conventional bulk rheometer utilised in many studies is the cone and
plate rheometer.105,114-116
Sample is loaded into a measurement plate and a solvent trap is used
to prevent solvent evaporation. One issue identified is the surface adsorption of the solution

36
components which can influence the measurement of bulk shear rheology of surfactant-free
protein solutions. Many proteins are known to adsorb at solution/material and solution/air
interfaces.117
Other commonly used techniques measuring bulk rheometry include glass
capillary and falling ball viscometers. The capillary viscometer measures the time required
for level of liquid to fall from one mark to another.118
There are techniques where there is no
solution/air interface i.e. microfluidic platforms. Microfluidic platforms are increasingly
being developed and used as they allow measurements at high flow rates (high shear stress)
thus allowing to explore viscosities in mAb solutions at similar high flow rates achieved
during injection.117
A common limitation for bulk rheometry is the large volume requirements which are in the
millilitre range. Due to limited material at early stages, viscosity is normally postponed until
later studies when more material is produced. Another limitation is the failure to detect local
variation of properties. Micro-rheology was developed to overcome these limitations of bulk
rheology. At a microscopic level, the solution viscosity is the resistance to solute mobility.113
Micro-rheology is the rheology in the micron size domain, thus having the advantage of
requiring small sample volume thereby making it suitable for early formulation development.
The second advantage is having the ability to examine local heterogeneity of the material and
thus changes between formulations. The third advantage is the non-invasiveness to samples,
as no external force is required.119
Agreements between different rheology technique are rare,
nevertheless, it has been shown by Del Giudice et al. where seven different rheological
techniques were compared, consisting of macro-rheology, micro-rheology and microfluidic
platforms and showed agreements across the techniques in hydroxyethyl cellulose aqueous
solutions.120
Micro-rheology techniques are based on the measurement of the motion of tracer particles in
the fluid and can determine the zero-shear viscosity (ZSV).120
The ZSV, as the name
suggests, is the viscosity measured at a shear rate approaching zero. It is difficult to measure
very low shear rates using standard rheometers – thus is it often extrapolated through
accessing obtainable shear rates. The ZSV is an important property as it is a sensitive
indicator of changes in a products formulation, thus useful in formulation development. The
effect of protein clusters on solution viscosity is a developing area, as already stressed. It has
been shown that only the low-shear viscosity is sensitive to the presence of such clusters,
particularly in unstable protein solutions;121
thus conventional rheometers cannot detect this
37
change in viscosity driven by particle clusters at low shear rates. However, the artefacts with
the current micro-rheology methods need to be assessed.122
Commonly used micro-rheology techniques include particle tracking, diffusing wave
spectroscopy (DWS), and DLS-based micro-rheology techniques.119
They all exploit the
Brownian motion of particles to obtain local rheological properties. The main problems
associated with the techniques are finding the correct tracer particle to probe the rheological
response (e.g. size of the probe), potential interaction between the probes and the protein, and
the resolution of the apparatus used.119
DWS requires large concentrations of tracer particles
such that they are high enough to dominate the scattering which leads to an increased
potential of the tracer particles interacting with proteins.123
He et al. reported the use of DLS
for measuring viscosity of mAb solutions. Polystyrene beads of known size were utilised
such that the size of the beads is large enough to allow easy separation of the DLS signals
between the beads and the protein; a size of 150nm radius was used. Initial data was
promising with glycerol solutions, showing good agreement with literature and the cone-plate
method. However, further studies124
measuring highly concentrated mAb solutions showed
potential issues suggesting bead-protein interaction which affected the viscosity value. This
was more apparent in complex buffers i.e. in the presence of salts. Thus, due to the pitfall
with the use of beads, this system is not applicable for mAb solutions in complex buffers
which would be industrially relevant.125
Fluorescence correlation spectroscopy (FCS) measures the diffusion of a molecule through
fluctuations in the fluorescent intensity caused by particles moving in and out of the solution.
The principles of FCS can be seen in section 1.4.3.1 and in the literature.126,127
With the
development of confocal microscopy and photo-detection techniques, FCS has become quite
advanced and accurate for analysis of dynamic information; thus has been used extensively in
the characterisation of proteins.128-131
The application of FCS to measure viscosity from the
diffusion of a dye is not recent. The microscopic dynamical properties, such as viscosity,
were derived from microscopic fluctuations i.e. diffusion of the probe, many decades ago.129
The first application of FCS using probes to measure micro-viscosity was in cells: Yoshida et
al, presented the application of FCS to investigate the microenvironment of the internal space
of organelles.132
Several groups have applied the system to characterise viscosity in aqueous
solutions: Holyst et al. utilised FCS to measure the diffusion of nanoprobes in crowded
environments; mimicking the crowded environment in cells and thus assessing different
rheological behaviours.133
A Korean group utilised FCS in assessing the micro-viscosity of

38
sucrose solutions. The accuracy and reliability of the system was demonstrated and it was
proposed as a promising tool for study of micro-viscosity of liquids.134
Similar FCS
applications have been used with glycerol135
and surfactant solutions.133
It is yet to be utilised
in mAb solutions.
To summarise this section, three areas of research require development in order to support the
development of highly concentrated mAb solutions suitable for subcutaneous delivery: (i)
understand the behaviour of the mAb at high concentrations, (ii) high throughput analytical
tools to estimate and predict rheology behaviour at high mAb concentrations, and (iii)
understand the role of the formulation in controlling solution viscosity.
1.3 Analytical Approaches Utilised in the Detection and Characterisation of Protein
Aggregation
Detection of protein aggregates in therapeutic drugs is proscribed by the national legislation
as laid out by US, European and Japanese Pharmacopoeia standards; recent revision of
USP23 <788>.136
The size ranges of protein aggregates are diverse (see Figure 1.2) and the
United stated Pharmacopeia and the European Pharmacopoeia currently define concentration
limits in parental solutions as > 10µm. Nevertheless, regulatory authorities expect
quantitative characterisation of micron particles 1-10 µm and qualitative characterisation of
submicron particles 0.1-1 µm in the early stages of development.23
In industry and academia, there are numerous techniques that have been developed over the
years to detect and characterise protein aggregates and each come with their own set of
benefits and limitations. Many techniques do cover the size range required by regulatory
authorities – but such techniques possess limitations in terms of accuracy and data
interpretation. Additionally, most analytical techniques have limitations in relation to their
ability to measure high protein concentrations (Table 1.1); such techniques require sample
pre-treatment (i.e. dilution) prior to measurement.

39
Table 1.1: Comparison of techniques reported for protein characterisation (aggregation)
Comparison of techniques reported for protein characterisation (aggregation).23,137,138
Technique Advantages Limitations
SEC
(SEC-MALLS)
• Good separation of large
molecules from small molecules
• Accurate determination of
molecular weight for large
regular-shaped proteins
• Low sample volume requirement
• Preserves biological activity
• Only a limited number of bands
developed
• > 10% difference in molar mass
required to have good resolution
• Poor molecular weight
determination for irregular shaped
proteins
• Aggregates can be lost by non-
specific binding to column
• Time consuming
DLS • Good for determining size
distribution of particles
• Good repeatability
• Low sample volume requirement
• No sample loss
• Non-invasive
• Less accurate for distinguishing
small oligomers
• Inaccurate for poly-disperse
samples
• Found to over-estimate mean size
of clusters
• Concentration limit of 25 mg/ml
• Sensitive to contaminants i.e. dust
NTA • Sizes and counts particles
individually
• Accurate data
• Quick data acquisition
• Concentration limits thus sample
dilution required
• Small aggregates missed due to
poor resolution of small aggregates
• Adsorption and sheer reported to
result in aggregates
MFI • Quick sample set-up
• Can distinguish matter (e.g.
silicone oil) from protein
• Direct visualisation of particles
• Size, count and shape of each
particle provided
• Large sample volume requirement
• Use of glass increases risk of
aggregation
• Can over-estimate size
• Poor particle differentiation for
particles < 4m
RMM
Archimedes
• Good for molar mass
• Can distinguish matter (e.g.
silicone oil) from protein
• Accurate data for particles < 2
m
• Sample loss due to clogging
• No differentiation between
different density particles (no
refractive index detector)
• Possible misclassification of
particle size
• Concentration limit thus sample
dilution often required
1.3.1 Light Scattering Methods
Light scattering methods are used extensively in protein aggregation analysis. Light
scattering can be described by Tyndall scattering or Rayleigh scattering, and light scattering
techniques are generally based on one or the other. Rayleigh scattering requires the particles
to be much smaller the wavelength of the light, whereas Tyndall scattering occurs when the
size of the particles in question are about the same size or larger than the wavelength being
40
described. The intensity of the scattered light depends on the wavelength of the incident light,
the angle of observation, and the size and shape of the particles (generally, spherical
particles). All light scattering instruments consist of a light source (i.e. a laser), a
spectrometer (for the optical set-up for defining the scatter angle volume), a detector, a signal
analyser and a computer software for the analysis.139
Common light scattering techniques include static light scattering (SLS), dynamic light
scattering (DLS), and size-exclusion chromatography (SEC) with multi angle laser light
scattering (MALLS), each providing different information on the protein sample based on the
instrument’s capabilities.
1.3.1.1 Static Light Scattering (SLS)
SLS, also known as ‘total intensity light scattering’ and ‘differential light scattering’, is the
classical light scattering method, measuring the intensity of the scattered light to obtain the
molecular weight. The measures quantify the ‘excess Rayleigh ratio’, which is directly
proportional to the intensity of the scattered light in excess of the light scattered by the pure
solvent. Subsequently, knowledge of the ratio verses the scattering angle and concentration is
utilised to determine the molar mass, size, and self-interactions of the sample.140
SLS determines the weight-averaged molar mass of the macromolecules in the solution, thus
the data is more representable if the solution is mono-disperse. There are many limitations
with SLS which limit its use in relation to protein aggregation. SLS analysis is limited to
macromolecules in the range of 50 x 103 to 50 x 10
6 g/mol (or 1 m) (see Figure 1.5), as the
SLS theory (Rayleigh-Gans-Debye approximation) becomes inapplicable for very large
macromolecules.
1.3.1.2 Dynamic Light Scattering (DLS)
DLS, also known as photon correlation spectroscopy or quasi-elastic light scattering, has
been a well-established method for over 40 years. SLS and DLS differ in that SLS measures
time average intensities while DLS measures real-time intensities and thus dynamic
properties. DLS is based on the Brownian motion of particles where particles or molecules in
solution cause (laser) light to be scattered at different intensities - thereby imprinting
information on their motion – and time-dependent fluctuations in the scattered light are
recorded by a fast photon counter. The fluctuations are directly related to the rate of diffusion
of the molecule through the solvent (i.e. the diffusion coefficient, a common parameter used
in analysing protein aggregates), which is calculated via fitting a correlation curve to an

41
exponential function. The diffusion coefficient is the main quantity measured by DLS and is
subsequently used to calculate the hydrodynamic radius (the radius of a hard sphere with the
same diffusion coefficient) using Stokes-Einstein relationship (see Equation 1.1).137
𝑅ℎ =𝑘𝑇
6𝜋𝜂𝐷⁄ Equation 1.1
Where 𝑅ℎ represents the hydrodynamic radius, k is the Boltzmann constant, T is the
temperature, 𝜂 represents the viscosity and D is the diffusion coefficient.
DLS is used mainly for aggregates in the nanometre range, and benefits include that it is not
destructive to the sample and requires little preparation time (as much as SLS in fact). A
practical advantage over SLS is the level of immunity to stray light, which permits
measurements in small volumes with free surfaces. On the other hand, DLS is not as sensitive
as SLS hence would require higher concentrations.140
A noticeable issue for highly polydisperse samples is that the scattering of a few large
particles can over-power the small particles, such as monomers. As DLS is an ensemble
technique, it tries to recover a particle size distribution from the combined signal of all
particles present in the sample, thereby resulting in the overestimation of mean size clusters.
Hence, with the intensity-based size measurements, the data does not necessarily reflect the
different sizes present in the samples. In such cases it maybe more reliable to use volume or
weight based distributions; but these are also bias to larger particles to some extent.141,142
Consequently, an inaccurate distribution will result in unreliable data on the derived sizes and
other parameters analysed. To summarize, DLS appears to be less suitable for particles in the
micrometre range, limited to a particular protein concentration range (i.e. < 25mg/ml) and
based on many assumptions that may not represent real samples.137
1.3.1.3 SEC-MALLS
Size-exclusion chromatography (SEC) is a commonly used chromatographic method where
molecules in solution are separated by their size. The SEC column consists of porous
polymer beads of different sizes so that when the solution passes through the column the
particles with the larger hydrodynamic volumes have a shorter path and smaller particles
travel further. The size-based separation allows a calibration curve to be derived from a set of
known analytes to be used to estimate the molecular weight of the unknown analyte.143
The
technique is typically applied to large molecules or macromolecular complexes such as
proteins. However, as proteins vary in their overall shape, their hydrodynamic radius does not

42
correlate accurately with their molecular weight.144,145
Hence, the accuracy of the determined
molecular weight can be questioned. Furthermore, the SEC column itself has many
drawbacks and potential issues that are still under investigation. For example, the presence of
high salt systems has shown to increase the potential of particulates forming in the mobile
phases, thereby affecting the system and column performance. In addition, protein aggregates
have been known to interact and bind to the column (clogging), resulting in the loss of some
aggregates.146,147
SEC is applied very frequently in aggregation detection despite not meeting
the ideal requirements of an aggregation detection technique.148
For example, most analytical
methods (including SEC) change the local environment of the protein, either by dilution or by
contact with other substances such as eluents. An ideal method would have minimal changes
in local environment.
SEC is generally coupled with other techniques to permit characterisation of the separated
fragments, such as MALLS. MALLS is a process of light passing through the solvent causing
the light to scatter off the axis where intensity is measured at different angles to the beam. If
the solute is of a different refractive index, then there is excess light scattering dependant on
the concentration of the solute or on the molar mass on the scattering angle. Angular
dependence maybe used for size of particles > 200 kDa; thus with SEC-MALLS, monomer
concentration as well as size can be determined.149
A common problem with light scattering techniques is the impact of small amounts of dust or
other small particulates in the sample solution. All solutions have to be thoroughly clear of
dust and supra-molecular particles (especially for smaller molecules); otherwise, this may
lead to non-representable data. The total light scattered is based on the sum of the intensities
scattered by each species – if the mass of a dust particle is a million times that of the protein,
then only one-millionth of the concentration of dust particles is required to produce the same
scattering intensity as the protein.140,150
Furthermore, light scattering techniques often require
sample dilution which introduces uncertainty in the analysis as the particle population is no
longer representative of the concentrated solution. Also, dilution can stress the protein
samples. As a result, samples that are more likely to change their properties after dilution are
fundamentally excluded from investigation. In addition, they require a separate measurement
of the refractive index for determining other characteristics such as concentration.

43
Figure 1.5: Analytical capabilities of protein aggregation detection methods.
Analytical capabilities, i.e. detectable size ranges, of protein aggregation detection methods used in
industry and academia. The grey area specifies the size ranges required to be detected / characterised
by regulations. Adapted from Zolls et al.137
1.3.2 Resonance Mass Measurement (Archimedes)
The recently developed Archimedes is a non-optical technique which harnesses the technique
of resonance mass measurement (RMM), whereby the frequency of a mechanical resonator
changes when a mass is added. Archimedes detects particle sizes ranging from 0.05 µm to 5
µm in diameter and a very attractive feature is the ability to distinguish between protein and
foreign matter: The sample solution is flushed through a micro-channel inside a resonating
cantilever. Particles pass through the sensor one-by-one and their mass is measured. The net
change in frequency is proportional to the buoyant mass of the particles passing the
channel;151
where light-weight positively buoyant particles (i.e. silicone oil droplets) and
dense negatively buoyant particles (i.e. protein particles) can be clearly discriminated as they
increase and decrease the frequency of the cantilever respectively. The ParticleLab software
separates the data for the two populations without the need for additional analysis.
Archimedes also provides information on concentration, fluid density and fluid viscosity.

44
The RMM Archimedes utilises two sensors, namely the nano-sensor and micro-sensor, and
their selection is based on the expected particle size range. Malvern provided some
information (see Table 1.2) which lists the polystyrene latex beads sizes, the theoretical value
of the buoyant mass and an estimate of protein aggregates’ sizes based on a density of 1.32
g/mL.
Table 1.2: Guidelines for nano- and micro- sensor use (information provided by Malvern).
Polystyrene latex (density 1.05) Proteins (density 1.32)
Nano-sensor Micro-sensor Buoyant mass
0.216 m 1.78E-16 0.118 nm
0.296 m 7.16E-16 0.162 nm
0.400 m 0.400 m 1.77E-15 0.219 nm
0.498 m 0.498 m 3.41E-15 0.272 nm
0.707 m 0.707 m 9.75E-15 0.387 nm
0.994 m 0.994 m 2.71E-14 0.543 nm
1.019 m 2.92E-14 0.557 nm
1.587 m 1.10E-13 0.868 nm
1.999 m 2.20E-13 1.093 nm
3.002 m 7.47E-13 1.641 nm
4.998 m 3.45E-12 2.733 nm
In Table 1.2, the light grey stands for conditions for which the users need to set the limit of
detection (LOD) manually; the automatic measurement capability of the instrument
corresponds to the dark grey cells, while where caution should be exercised with the particles
concentration (upper size range of sensors) corresponds to the red cells.
Weinbuch et al. compared data obtained between Archimedes and micro-flow imaging (MFI)
(MFI overview given in section 1.3.3.2), where Archimedes detected a higher fraction of
silicone oil for sizes above 1 µm while MFI detected more protein particles. Overall, from the
samples covered in the overlapping size ranges between both techniques, Archimedes data
was considered to be more accurate. However, a major limitation of the Archimedes is the
potential clogging of larger particles (> 0.5µm) in the column, thus making its actual upper
limit lower than the proposed upper limit in Table 1.2. In addition, there is ambiguous
differentiation between particles of a similar mass because of the physical detection principle.
For example, there is no differentiation possible if there is more than one particle type with
higher density than the buffer (e.g. protein and rubber).23
Here, there would be two particle
types both illustrating negative buoyancy. Furthermore, Archimedes faces a challenge in the
presence of complexes consisting both protein and silicone oil: protein-silicone oil complexes

45
have been observed in protein solutions (e.g. lysozyme and mAbs) spiked with silicone oil
emulsions.152,153
The Archimedes RMM system could miscalculate the size due to the
simultaneous influence of both material densities on the density of the complex. These
complexes could also be completely missed due to the higher density compensating for the
lower density.23
1.3.3 Microscopic Methods
1.3.3.1 Atomic Force Microscopy (AFM) and Transmission Electron Microscopy
(TEM)
AFM and TEM both have wide analytical capabilities (see Figure 1.5). TEM is the main
electron microscopy method, and involves the isolated samples to be illuminated by an
electron beam thereby offering images of the particles in high resolution. However, sample
preparation can be potentially damaged by the electron beam.137,154
AFM involves the sample
to be scanned mechanically using a cantilever; again, offering high resolution images and
seems suitable for the study of protein aggregates.155
However, a disadvantage of all
microscopic techniques is that they only analyse a small fraction of the sample – thus the data
may not be representable of the whole sample. In addition, both AFM and TEM are
expensive and acquisition of the data is time consuming.137
1.3.3.2 Micro-Flow Imaging (MFI)
Micro-flow imagine (MFI) is an emerging flow imaging technique covering the sub-visible
protein size range of 1-400 µm. MFI provides a database containing the count, size, and
morphology of particles and has become very quickly established in the biopharmaceutical
industry. MFI has been applied in many protein formulations, characterising large protein
particles156,157
due to its size range matching regulations and its ability to differentiate
between proteins and foreign matter, such as silicone oil.23,158
In a study on IgG1 aggregation
following freeze-thaw cycles, protein particles (aggregates) were seen to be highly
heterogeneous in shape ranging from small dense fibres to large ribbon-like aggregates.159
The main advantage of image techniques is the direct visualisation provided to obtain
qualitative information. Direct imaging means the system does not rely on a correlation
between particle size and the scattering/optical signal; no calibration is required. The
technique involves particles to be illuminated by light and bright-field images are captured in
successive frames by a CCD camera. The system software (i.e. MFI View Analysis Suite -
MVAS) extracts particle images by using a sensitive threshold to identify pixel groups which
define each particle. A continuous sample stream passes through a glass flow cell of 80-400

46
m in diameter as an imaging field. The flow cell is centered in the field-of-view of a custom
magnification system having a well characterised depth-of field. The combination of system
magnification and flow-cell depth determined the accuracy of the measured sample
concentration. The successive frames are analysed in real time. Typical volumes range from
< 0.25 to tens of millilitres, which is a large volume in comparison to other techniques;
however this allows the detection of large particles which are present in low
concentrations.160,161
Particle differentiation is done though applying custom-designed morphology filters, with
parameters such as intensity, circularity and aspect ratio. Subpopulations can then be isolated
and independently analysed. Parameters are set based on available information or using
information obtained from using control samples. For example, MFI has been used to select
silicone oil particles in protein solutions using a simple aspect ratio as a filter, for particles ≥
5 m – an accuracy of 96% has been achieved. However, due to diffraction and pixilation
effects, the minimum limit for particle size is around 4 m, where useful morphological
information can be obtained and thus used for particle differentiation.156,159
It should be noted that the development of a customised filter does require extra work, in
order to obtain information to set the range of several morphology parameters such that a
certain sub-population can be selected. This would need to be carried out on case-by-case
basis depending on the materials.158
Furthermore, the presence of glass adds the risk of proteins binding to the glass surfaces
which can increase the risk of surface-induced aggregation (see mechanism (5) – section
1.2.2). Another disadvantage is the requirement sample dilution and since it is a light-based
technique, data on particle number/size can be overestimated with high concentrated
samples.137,156
As mentioned, Archimedes (RMM) and MFI have been used together in studies. Archimedes
has been suggested for particles < 2 m and MFI for particles > 2 m (Figure 1.5), hence the
two methods could be used together to cover a broader size range – in relation to assessing
the effects of silicone oil on protein aggregation.23
As they are such new techniques
(especially the Archimedes), further validation is required to determine their accuracy and
reliability. Studies have already shown problems with Archimedes approaching its upper
limit and MFI in its lower limit i.e. < 4m in particle differentiation.

47
1.3.3.3 Nanoparticle Tracking Analysis
Nanoparticle tracking analysis (NTA) is a microscopic method developed by NanoSight Ltd
in 2006, for characterising analytes in the nanometre size range. It combines laser scattering
microscopy with a charge-couples device (CCD) camera which enables visualization and the
tracking of particles individually. The technique is defined as a counting upgrade of
DLS.155,162,163
Through the comparison of DLS and NTA, NTA was shown to accurately
analyse polydisperse samples which is a benefit over DLS. On the other hand, NTA has a
lower limit of detection (LOD) of around 30nm in diameter, and for very low refractive index
materials such as protein aggregates, detection of particles < 80nm becomes increasingly
difficult. This particular issue is heightened in high background sample types containing
higher concentration of monomeric non-aggregated protein. DLS is capable of detecting
particles < 5nm, (see Figure 1.5) but as mentioned earlier, the results from DLS can be
subjected to sample bias. Further limitations of NTA include the need for prior sample
dilution; the lengthy time taken for parameter adjustments, unlike DLS which is very user-
friendly; and low reproducibility (see Table 1.1 for a comparison of the aforementioned
techniques). Thereby there is a current effort at combining the two techniques together where
they can compensate for each other’s limitations.163-165
1.4 Fluorescence-based Approaches
Fluorescence based approaches are not used commercially for mAb aggregation
characterisation; however their use is increasing as their applications and advantages become
apparent. This section aims to cover the applicability of fluoresce in protein aggregation
characterisation and the application and recent advances of confocal laser scanning
microscopy.
1.4.1 Concept of Fluorescence
Fluorescence is the result of a series of electron-stage processes, involving the emission of
light following excitation, and fluorophores can be simply described as molecules that
possess fluorescence characteristic. Excitation states can be created by physical (i.e.
adsorption of light), mechanical (i.e. friction) or a chemical mechanism – by a source of
higher energy.166
It is comprised of a three-stage process: (i) excitation: a photon supplied by
an external source is adsorbed by the molecule in the ground state generating an excited
electronic state which has a higher energy level; (ii) excited state-lifetime: the higher energy
level is rapidly converted to the relaxed excited state (also known as vibrational relaxation);
(iii) emission: the molecule emits a photon from the relaxed state and returns to the ground

48
state. A Jablonski diagram is typically used to schematically illustrate fluorescence
activity.167
In Figure 1.6 the ground state (S0) and the higher energy levels of the first (S1) and
second (S2) excited singlet states are illustrated by stack of horizontal lines; with the thicker
line representing the electronic energy levels and the thinner lines representing the various
vibrational energy states. In the figure, the first absorption transition occurs from the lowest
ground state energy level to a higher vibrational energy level of S2. The second transition
occurs from the second vibrational level of the ground state to the highest vibrational energy
of S1. Relaxation from this long lived state is accompanied by emission (fluorescence). There
are other relaxation pathways which can compete with the fluorescence emission process. For
example, the excited state energy can be dispersed non-radiatively as heat (as illustrated in
Figure 1.6 by the dashed purple arrow) or the excited molecule can collide with another
molecule and transfer energy as quenching (dashed red arrow in Figure 1.6) thus resulting in
decreased fluorescence intensity.
Figure 1.6: Jablonski diagram illustrating the energy states of a molecule.
Jablonski diagram illustrating the energy states of a fluorescent molecule. S0 representing the ground
state where the fluorophore is non-excited and S1 and S2 are electronic excited states following
absorption. Adapted from Olympus Corporation.168
It has been stated that a single fluorophore has the ability to generate thousands of detectable
photons. Thus, fluorescence is based on the property of molecules to adsorb light at a

49
particular wavelength and to subsequently emit the light at a longer wavelength. The shift in
wavelength is termed as the Stokes shift.167,169
Many fluorescence based techniques have been developed such as fluorescence microscopes,
fluorescence scanners, micro-plate readers, flow cytometers and spectrofluorometers. Over
the last 10 years, fluorescence has been associated with two Nobel prizes in chemistry: In
2008170
for the discovery and development of the green fluorescent protein, GFP; and in
2014171
for the development of super-resolution fluorescence microscopy.
1.4.2 Fluorescent Probes
1.4.2.1 Fluorescent probes – important properties
The important characteristics which need to be considered with fluorophore selection are
discussed in this section. The first is fluorescence intensity (FI) which is dependent on several
factors: the quantum yield, intensity of the excitation source, the fluorophore concentration,
path length, the molecular extinction coefficient of the fluorophore, the adsorption
coefficient, and the photo-stability of the dye.172
For fluorescence microscopy, high quantum
yield is required. The quantum yield, also known as the quantum efficiency, represents the
efficiency of a fluorophore in absorption and emission of photons; defined as the ratio of
number of photons emitted over number of photons adsorbed. Fluctuations in stability
resulting in reduced efficiency can occur with dyes due to environmental factors such as pH,
proximity to quenchers or laser light.173
Another encountered issue is photobleaching.
Photobleaching is a destruction of a fluorophore due to high intensity illumination and/or
prolonged illumination, in its excited state resulting in the loss of fluorescence.129,172
Also,
background fluorescence can occur as a result of autofluorescence and compromises
fluorescence measurements thus must be subtracted from the analysis. Autofluorescence is a
naturally-occurring phenomenon that is observed with biological structures (intrinsic
fluorescence).129
1.4.2.2 Fluorophores Utilised in Protein Characterisation
Fluorophores can be divided into two classes, namely intrinsic and extrinsic. Intrinsic
protein fluorescence (or auto fluorescence) is derived from naturally fluorescent amino acid
residues: phenylalanine, tryptophan and tyrosine. Only the latter two are used experimentally
as their quantum yields are high enough to give a fluorescence signal. In the protein’s native
state they are located within the core of the protein, whereas, in the unfolded/partially folded
state they become exposed, hence they are used to follow protein folding.174
Gaudet et al.

50
demonstrated the potential use of a capillary-based intrinsic fluorescence technique to obtain
dissociation constants determined from a change in protein stability. Through this, they
determined the parameters of the thermodynamics of protein stability, focusing on the
interaction between rapamycan and the 12kDa FK506 binding protein, a target used in
prostate cancer treatment. As this technique did not require labelling, it is in principle
applicable to any protein with intrinsic fluorescence, particularly tryptophan residues.175
In
another approach, a high throughput formulation based on a fluorescence micro-plate reader
was used to select protein stabilizing excipients for the formulation of salmon calcitonin;
used in osteoporosis treatment, approved by the FDA in 1975. In this study, intrinsic
tryptophan fluorescence was compared with extrinsic fluorescence, and in the case of salmon
calcitonin, the fluorescence intensity of tryptophan only showed a change in the strongly
aggregated formulations; whereas the fluorescence intensity from extrinsic fluorescence was
more sensitive in detecting aggregation.176
Intrinsic fluorescence has been used for a number of papers attaining valuable input into
characterising protein unfolding.177-179
The range of commercially available fluorophores is
very diverse and can be split into many categories based on their origin and/or properties.
Natural dyes are derived from natural resources such as plants, animals, fruits and minerals.
Synthetic dyes have two main advantages over natural dyes: cost and consistency. Over the
years, the development of new synthetic dyes came with greater variation and versatility
(with a wide colour range) and increase in photo-stability.180-182
For fluorescence microscopy
synthesised (extrinsic) compounds are typically used that have some degree of conjugated
double bonds. Such compounds have ring structures (aromatic molecules) with π bonds that
easily distribute outer orbital electrons over a wide area. The more conjugated bonds the
molecule has, the lower the excited energy requirement and the longer the wavelength the
exciting light can be. The emitted light is shifted in the same direction. Moreover, the
efficiency increases with the number of π bonds, as measured by fluorescent quantum
yield.167
Extrinsic dyes can be covalently attached to proteins (via the ɛ-amino group of lysine, the α-
amino group of the N-terminus, or the thiol group of cysteine) or non-covalently attached (via
hydrophobic or electrostatic interactions). Here, for biopharmaceutical formulations, the
interest is in non-covalent extrinsic dyes, specifically dyes which bind specifically to protein
hydrophobic surfaces. Such dyes, in a hydrophobic environment, exhibit strong fluorescence
(high quantum yield) whereas in an aqueous environment they are insoluble and fluorescence

51
is strongly quenched.183,184
Hawe et al. carried out in-depth research into the currently most
common dyes used in protein characterisation: 1-anilinonaphthalene-8-sulfonate (ANS),
4,4’-bis-1-anilinonaphthalene-8-sulfonate (Bis-ANS), 9-diethylalamino-5-benzophenozazine-
5-one (Nile Red), dicyanovinyl-julolidine (DCVJ), Congo Red and Thioflavin T (ThT) -
focusing on their capabilities and limitations in protein characterisation. Different dyes are
suited to the many different aspects to protein characterisation such as assessment of protein
denaturation, folding and molten globular intermediates, detection of amyloid fibrils,
assessment of surface hydrophobicity and protein aggregation; thus the choice of dye should
be suited to the application. The various fluorescent dyes have shown to exhibit different
specificity and selectivity for different aggregate structures and sizes. Table 1.3 summarises
the dyes used and the relevant properties, whilst Figure 1.7 illustrates their chemical
structures. ANS and Bis-ANS have demonstrated to be very suitable for early stage protein
aggregation i.e. small reversible aggregates. It is known that at these early stages, protein
aggregation species are present in low concentrations and may exhibit a short life span.183
Fink et al. characterised IL-1, an important mediator of the inflammatory response,185
at
early stages of folding comparing ANS and tryptophan fluorescence. With tryptophan
fluorescence, the results indicated that aggregation events during folding can be potentially
mistaken as folding events, hence are missed. Additionally, previous light scattering
techniques, such as ‘stopped-flow light scattering’, were not able to detect the early small
aggregates, illustrating the high risk of missing aggregates with such techniques. It was
shown that the detected early aggregates with ANS fluorescence were indeed reversible as
there was no soluble protein loss at this stage.20,186,187
Bis-ANS has been used to assess
aggregation in thermally-stressed recombinant human factor VIII; using differential scanning
calorimetry. When comparing the data against intrinsic fluorescence data, again, data
indicated that some small aggregates were missed at the lower temperature analysed (37C)
with intrinsic fluorescence.188
In a study by Lindgren et al. of the aggregation states of the
protein transthyretin (TTR), ANS fluorescence intensity increased with increasing
aggregation size and Bis-ANS was shown to interact strongest with the monomeric A-state
and unfolded monomers.189
A major pitfall with the use of extrinsic dyes in measuring
aggregation is any interference of the extrinsic dye with the protein molecules. ANS-based
probes have shown to bind to some proteins (BSA190
and cytochrome c191
) through
electrostatic interactions, and in some cases ANS has shown to interfere with the protein
structures – shown to inhibit heat-induced aggregation of carbonic anhydrase.192
Bis-ANS has

52
also shown similar activity with insulin B-chain and alcohol dehydrogenase, with a proposed
use of protein stabilizer.193
The main limitation with ANS and Bis-ANS in protein
characterisation is in relation to their wavelengths i.e. requiring ultraviolet (UV) light. The
confocal system would need to be modified before their use (see Table 1.3).
Another pitfall of using extrinsic dyes is changing the solution environment in terms of PPIs.
Quinn et al. demonstrated how the addition of small fluorescent molecules can increase the
net attraction between proteins (human gamma-D crystalline, HGD) in solution with an
increase in the liquid-liquid phase separation temperature; although this increase did not
affect protein aggregation. These results indicate the need to compare between labelled and
unlabelled conditions to ensure correct data interpretation; with the increasing use of
fluorescence in protein solution characterisation, this aspect is very important.194

53
Table 1.3: Comparison of fluorescence dyes in their applicability to study protein aggregation
with confocal microscopy.
Comparison of fluorescence dyes in their applicability to study protein aggregation with confocal
microscopy (raster image correlation spectroscopy).183
195
184,196
Dye / Probe Molecular
formula
Excitation
Maxima
(nm)
Emission
Maxima
(nm)
Application Limitations
ANS
C16H13NO3S 350-380 505 Surface
hydrophobicity,
unfolding,
aggregation
Found to interfere
with protein
structures
Requires UV
Bis-ANS
C32H22K2N2O6S2
385-400 515 Surface
hydrophobicity,
unfolding,
aggregation
Found to interfere
with protein
structures
Requires UV
Nile Red
C20H18N2O2 540-580 660 Surface
hydrophobicity,
unfolding,
aggregation
Stable between pH
4.5 to 8.5
Recommended to
potentially
investigate
DCVJ
C16H15N3 450 480-505 Micro-viscosity of
protein
environment
Has low
sensitivity at low
concentrations
Sensitive to
solution viscosity
CCVJ
C16H16N2O2 435-440 490 Micro-viscosity of
protein
environment
Sensitive to
solution viscosity
SYPRO
Orange
Proprietary
information
(not available)
300-472 570 Surface
hydrophobicity,
unfolding,
aggregation
Labels surfactants
and silicone oil
SYPRO Red Proprietary
information
(not available)
300-550 630 Surface
hydrophobicity,
unfolding,
aggregation
Recommended to
potentially
investigate
ThT C17H19ClN2S 450 480-490 Fibrillation High
concentration
required.184
Congo Red C32H22N6Na2O6S2 497 614 Fibrillation Sensitive to pH
Poor binding
specificity to
aggregates
observed

54
Figure 1.7: Chemical structures of commonly used fluorescent dyes.
Chemical structure of commonly used fluorescent dyes: (A) ANS, (B) Bis-ANS, (C) DCVJ, (D) Nile
Red, (E) CCVJ, (F) ThT and (G) Congo Red. Adapted from Hawe et al.183

55
As well as detecting small aggregates, fluorescent dyes have shown the ability to detect large-
sized aggregates present at low concentrations. Demeule et al. proposed the technique of Nile
Red staining with fluorescence microscopy, to detect protein aggregates. Nile Red
fluorescence was able to detect micron-sized aggregates present at low concentrations. They
suggested that the ability to detect aggregates with Nile Red at early time points could reduce
the number of samples in long-term stability studies. It was also proposed that the high
sensitivity of extrinsic dyes could help gain size information about aggregates when
employing extrinsic dyes in fluorescent microscopy.184
However, dyes are known to be
sensitive to the solution, and Nile Red has shown to possess high sensitivity to pH and salts,
along with Congo Red;197
and thus limits their use in biopharmaceutical formulations.
SYPRO Orange is a fluorescence probe relatively new in the area of protein aggregation, in
comparison to the other aforementioned dyes. SYPRO Orange and SYPRO Red were
developed in 1996 by Molecular Probes Inc. for protein gel staining.198
SYPRO Red has not
been applied in labelling protein aggregates in solution, whereas SYPRO Orange been used
extensively to monitor protein folding under thermal stress195,199
and has demonstrated to be a
sensitive dye in detecting protein aggregates at low and high concentrations.183,195
It is one of
the main dyes used in differential scanning fluorometry (DSF), a screening method ultimately
used for defining the protein Tm in the development of IgG formulations. In a study by
Ablinger et al. a major limitation of SYPRO Orange has been conveyed, where only
formulations without surfactants can be analysed due to the dye’s interaction with the highly
hydrophobic parts of the surfactants. When the surfactant is above the critical micelle
concentration (cmc), SYPRO Orange is transferred into the hydrophobic core of the micelles
resulting in bright fluorescence of the dye and consequently high background. The
comparatively small increase of the fluorescence intensity, due to the unfolding of proteins, is
consequently masked.200
DCVJ is a dye which belongs to a group of fluorescent molecular
rotors that are mainly sensitive to the viscosity of the environment. DCVJ has been shown to
be suitable for detecting early oligomers ranging in size from 300 to 500 kDa, whereas
Thioflavin T was most appropriate for the detection of mature fibrils, but it did bind to early
oligomers of TTR as well.189
DCVJ has been proposed as an alternative to SYPRO Orange in
the determination of the Tm in the presence of surfactants. However, it showed to possess
limited sensitivity at low protein concentrations. Hence, the use of DCVJ with DSF would
only be recommended with high solution concentrations and SYPRO Orange would be
recommended for all solution concentrations but only in the absence of surfactants.200,201
However, no recommendations for IgG solutions at low concentrations in the presence of

56
surfactants have been suggested. Ablinger et al. proposed the use of another molecular rotor,
9-(2-carboxy-2-cyanovinyl)julolidine (CCVJ), which demonstrated to be suitable to detect
protein aggregation in the presence of surfactants with DSF for the first time. However this
study only looked at granulocyte-colony stimulating factor (G-CSF) characterisation;200
application is required with mAbs.
The applicability of each dye also varies between different techniques requiring fluorescence.
Fluorescence-based analyses will be discussed in sections 1.4.3 onwards.
1.4.3 Fluorescence Correlation Spectroscopy (FCS)
1.4.3.1 Principles of FCS
Fluorescence correlation spectroscopy (FCS) was originally developed by Magde et al. in the
early 1970s to assess the chemical dynamics of DNA-drug intercalation,202
but its interest and
use did not arise until the 1990s when Rigler et al. pushed the sensitivity of the technique to
single-molecule level with the advances of lasers; prior to this, the technique suffered from
poor signal to noise ratios mainly due to low detection efficiency and insufficient background
suppression.203,204
It is now an established technique in the field in biochemistry and
biophysics due to its extremely high sensitivity.205
FCS is a single molecule technique, analysing fluctuations in the fluorescence intensity (FI)
in the small measurement volume as fluorophores diffuse in and out of the volume. FCS is
based on the assumption that a Gaussian distribution of diffusing events will occur. The
fluorescence intensity fluctuations are detected in photon counts through a laser beam
focused by a microscope objective, as a time series. It is important to note that FCS studies
are amendable to artefacts associated with the use of fluorophores. The requirement imposed
on a fluorophore, utilised in FCS, include high quantum efficiency, large absorption cross
section and strong photo-stability (see section 1.4.2.1). Fluctuations in FI occur from
chemical (reactions, quenching etc.), biological (anomalous diffusion can occur, association
of molecules and other aggregation phenomena) and physical (molecular motion, photo-
physical interactions and changes in conformation) effects of the fluorophore of interest, as
well as from random affects (noise).206
In the FCS process, the excitation laser light is directed by a dichroic mirror into a water
immersion objective that focuses the light in a calibrated volume inside the sample –
calibration is carried out with a well-known dye with established properties e.g. rhodamine
green.129
Changes in the diffusion behaviour of fluorescent molecules entering and leaving

57
the detection / confocal volume (typically on the order of femtolitres) are monitored.
Subsequently, each fluorescence signal is collected and focused onto a pinhole, so that the
laser beam waist inside the sample is imaged onto the pinhole space. The conjugation of the
objective and the pinhole creates a spatial filter, which cuts the sampling volume to a
diffraction limited size. The fluorescence signal is then collected directly by an avalanche
photodiode and processed into an autocorrelation function (See Equation 1.2).126,127
𝐺(𝜏) =⟨𝐹(𝜏)𝐹(𝑡 + 𝜏)⟩
⟨𝐹(𝑡)⟩2⁄ Equation 1.2
where 𝐺(𝜏)is the correlation function, 𝑭(𝒕) describes the fluctuations of a signal, 𝐹(𝜏) is
the difference in fluorescence intensity between time (t) and the mean value, and 𝑡 + 𝜏
represents a later time.
The autocorrelation function for translational diffusion can be calculated from Equation 1.3:
𝐺(𝜏) = 1 +1
𝑁(
1
1+𝜏 𝜏𝐷⁄) (
1
1+(1 𝑠⁄ )2(𝜏 𝜏𝐷⁄)1/2
Equation 1.3
where 𝜏𝐷is the translational diffusion time, N is the number of particles and s is the structure
parameter existing at the same time in the focal volume.207
A typical fluorescence signal and correlation curve is shown in Figure 1.8. Through statistical
analysis information can be determined on protein dynamics, such as the number of particles
(inversely proportional to the amplitude of the ACF), the decay shape (demonstrates the
nature of the transport process) and the diffusion time.

58
Figure 1.8: FCS typical fluorescence signal and autocorrelation curve.
(left) A typical FCS count rate example showing fluorescence fluctuations and (right) autocorrelation
curve which lead to the generation of parameters following analysis. The measured correlation
function reflects the kinetics of molecules diffusing in and out of the detection volume (number of
particles and diffusion time).
1.4.3.2 Experimental use of FCS
The advances in optics and instrument design have allowed FCS to be applied to increasingly
complex problems, where other methods have encountered difficulty. The key desirable
properties of FCS include that it is non-invasive to the sample and requires small quantities of
fluorophores as it is a single molecule technique. Additionally, FCS is classed as high
throughput due to small measurement times.128,205
This section will cover some examples to
reveal the wide application of FCS.
FCS has been validated to provide reliable and reproducible measurements through its high
sensitivity for protein characterisation.128,129
For example, FCS was used to assess the
mechanisms of arginine in protein stabilisation. The amino acid has shown to improve the
refolding yield of proteins during formulation and suppress aggregation, but its mechanisms
are not understood. FCS provided an insight into the mechanisms, through demonstrating
that arginine inhibits the formation of partially folded intermediates, in the unfolding
transition of BSA.130
An Indian group have used FCS extensively for assessing the effect of a
variety of conditions on protein stabilization. In one particular study, Alexa Fluor 488 was
utilised to determine changes in hydrodynamic radius of lysozyme in the presence of
additives i.e. morpholinium salts and arginine.131
In another study, the hydrodynamic radius
of the protein, IFABP, labelled with fluorescein, was determined in different folding states.

59
The data was demonstrated to be consistent with independent light scattering
measurements.208
FCS has been extensively used in biological systems and is classed as a highly sensitive tool
studying molecular interactions on live cells.209
The technique has been used to improve
selection strategies for molecular libraries; with precise selection at the single molecule level.
The detection of specific interactions between phage with displayed antibody fragments and
fluorescently labelled antigen is one example of FCS demonstrating high throughput.205
FCS has also become an important tool in polymer science in dilute210
and concentrated
solutions.211
Cherdhirankorn et al. utilised FCS to measure the diffusion of tracers of different
sizes in polystyrene solutions over a broad range of concentrations and demonstrated its use
of investigating simultaneously local and global dynamics.211
Fluorescence spectroscopy
methods have proven to be very useful in assessing the diffusion in crowded environments.
Typically a trace protein and molecular crowders are chosen and the diffusion of the tracer
protein is measured by FCS.212
This system has been applied to many studies. Banks et al.
investigated the diffusion in crowded globular protein and random-coil polymer solutions as a
model system for diffusion in the intracellular environment. This was the first report of strong
observations of anomalous diffusion of proteins in crowded solutions.213
Random-coil
polymers were typically used as macromolecular crowding agents because of their
availability and ease of experimental manipulation. Globular proteins (e.g. ribonuclease,
human serum albumin, immunoglobulins) are now preferred to be utilised to create a more
realistic portrayal of the physiological environment.214-216
It is envisioned that this
aforementioned approach with the application of computational tools can be developed to
unravel the biophysical contributions to motion of protein and interaction in cellular
environments. This is through assessing properties such as molecular weight, size and shape
of the protein and solution environment to assess electrostatic interactions.214,216
FCS has been applied to elucidate molecular dynamics in the various regimes. The diffusion
of single molecules and nanoparticle can provide information about the viscoelastic
properties i.e. nano-rheology.215
FCS utilises a small amount fluorescent molecules to
measure the flow properties. This application of FCS has overcome many barriers of previous
measures such as bead-surface interaction (e.g. in DLS based systems) and insufficient
resolution.134,206,217

60
There are many intrinsic limitations which need to be considered for FCS measurements,
particularity with polymer solutions. Slight changes in the refractive index, coverslip
thickness, laser beam, pinhole adjustments or optical saturation can cause major distortions in
the confocal volume – this then affects the measured parameters such as the diffusion
time.215,218
The critical properties of the choice of fluorophore have already been stated.
Decays in the autocorrelation curves due to photophysical and photochemical processes have
been observed by many groups. The choice of fluorophore is a critical process to retrieve
meaningful results. Refractive index mismatch has been described for many systems. In
relation to polymer systems, depending on the polymer and the solvent, severe problems can
occur when the refractive index is very different to the value of water. In this situation, the
calibration with typical reference dyes (i.e. rhodamine-6G) in water carries errors. Solutions
to this problem have been proposed and demonstrated by means of alternative calibration
methods; where the reference probe is of known molecular weight or mass and the diffusion
of the probe in dilute solutions is also known.215,219,220
Zettl et al. used the known molecular
weight of rhodamine-B labelled polymer chains of varied lengths in dilute solutions to
determine the size of the confocal volume; such that polymers can be used for FCS
calibration in the organic solvent toluene. The molecular weight of the polymers ranged from
10 to 1000 kDa and a clear dependence of molecular weight on diffusion time is observed.
These times were correlated to the waist radius of the observation volume and the diffusion
coefficient. It was found that the determined waist beam size was very different to the values
determined with rhoadmine-6G in water. Since the molecular weight dependence of the
diffusion of polymer solutions is well established for most organic solvents, the same
procedure can be applied to calibrate the set-up for other solvents. Thus a calibration
procedure is established for FCS measurements in organic solvents.221
In the recent years, FCS has been applied in the detection of surfactant micelles, more so, in
determining the cmc in buffer solutions. The method involves the use of a hydrophobic dye
which incorporates into the surfactant micelle complex and the change in the measured
parameter as a function of surfactant concentration is determined as the cmc.222-224
1.4.4 Confocal Laser Scanning Microscopy and Imaging
1.4.4.1 Confocal microscope set-up
The first confocal fluorescence microscopes were developed in the 1990s and their use in the
field of protein characterisation is becoming an increasing interest. The refinement of
mainstream confocal laser scanning microscopes (CLSM) techniques using fluorescent

61
probes has provided significant advances in optical microscopy. Confocal microscopes image
mainly by (i) reflecting light off a specimen or (ii) by stimulating fluorescence from dyes
applied to the sample of interest.
The basic set-up of a fluorescence confocal microscope is illustrated in Figure 1.9. The dye is
illuminated with the laser at a specific wavelength and an image is formed. The mirrors used
are termed as ‘dichroic mirrors’ which reflects the shorter wavelength light and transmits the
longer wavelength light. The shorter (main) light is reflected and passed to the sample
through the objective and the longer-wavelength light from the fluorescent sample passes
through the objective and the dichroic mirror.225
The emitted light is subsequently passed
through a pinhole which excludes any out of plane light resulting in optical sectioning of the
sample – producing a background free image.226
Emitted photons are most commonly
detected by a photomultiplier tube (PMT); modern equipment have hybrid detectors or
avalanche photodiode detectors. A point-by-point image construction is made by focusing a
point of light sequentially across the sample i.e. measuring one pixel at a time (the pixel
being defined as the shift of the confocal volume).227
The images are subsequently stored
using computer media and analysed using computer software(s) to extract meaningful
information.
Figure 1.9: Basic set-up of a confocal microscope.
Basic set-up of a confocal microscope with a laser excitation source which illuminates the fluorescent
dye molecule. Light from the laser is scanned across the sample with rotating mirrors and focused
through a pinhole onto a detector. The excitation light is blue and the emitted light is green. Adapted
from Semwogerere et al.225
1.4.4.2 Image Analysis
Confocal microscope generates pictograms which contains lots of useful information. With
the collaboration between microscope users and bioimage informatics, a diverse range of
image analysis tools have been developed and applied to extract the information obtained in

62
the images. These vary from routine fluorescence intensity measurements to particle tracking
to image time series. One software tool which has become a modern image processing
platform is ImageJ, which is used for diverse applications including material sciences,
astronomy and medical imaging.228
Fiji is a distribution of ImageJ and facilitates the
transformation of new algorithms into ImageJ plugins. The tools are collaboration platforms
between computer science and biological research.229
An example of a particle tracking
technique is single particle tracking (SPT). SPT is used to follow isolated molecules as they
move in the cell. New methods on confocal microscopy have evolved to reveal spatial and
temporal information; allowing the execution of the location and time of when molecules
interact. Applying image correlation spectroscopy, assessing time series, allowed the
quantification of maps of complex molecular interactions for the first time.230-232
1.4.4.3 Image Correlation Spectroscopies
Image correlation spectroscopy (ICS) was first developed by Peterson et al. in the late 1980s
as an image analogue of FCS to observe protein cell movements.233
The spatial
autocorrelation function is determined from images or image series through scanning
adjacent pixels and lines. The ICS approach can be applied to images acquired by any
microscope and all image types. Unlike single-pointed FCS, ICS does not require the fast
diffusion of fluorophores, allowing the system to study slow dynamics or even chemically
fixed cells. ICS has been continuously developed to measure additional parameters, where
each method is an extension on the previous one.227
Kolin and Wiseman reviewed ICS developments. With the original spatial image correlation
spectroscopy (SICS), a spatial autocorrelation function is calculated from the intensities
recoded in the pixels of individual images.227
SICS can measure the number density and
aggregation state of fluorescently labelled macromolecules, however, the technique cannot
extract dynamics because it only analyses the spatial fluctuations in one image. Brock et al.
demonstrated the use of SICS to characterise spatial distributions of IgE-coated
membranes.234
Temporal ICS (TICS), also known as ‘image cross-correlation spectroscopy’
or ‘dynamic image correlation spectroscopy’, was introduced as an alternative to FCS for
slow moving fluorescent proteins. Temporal correlations between images are collected in a
time series which allows the determination of the diffusion coefficient and the flow speed.
However, the limitation of TICS is although it is able to measure the magnitude, it cannot
determine the direction (velocity); as only the time between frames is considered. This
limitation was overcome through combining TICS with SICS to calculate a full

63
spatiotemporal function (STICS) thereby determining the velocity of the protein
molecules.227
Another variant, k-space ICS (kICS) has the ability of photo-bleaching
correction, an important point as photo-beaching of fluorophores has shown to significantly
affect the diffusion coefficient and the flow speed obtained from TICS and STICS. At the
time of the review by Kolin et al. kICS could not be applied to small regions (< 32 x 32
pixels) of cells thereby limiting the analysis.227,235
The Wiseman group, in 2010, found that
the bias was absent when images series were simulated with a periodic boundary condition,
whereby particles that exit one side of the image appear on the opposite side of the image. A
number of additional findings are also presented which would benefit a kICS user.236
The aforementioned image spectroscopy analyses allow the measurement of the magnitude
and velocity of proteins. However, the analyses are for slow-moving (large) particles. With
temporal ICS the fastest diffusion coefficient measurable is around 10-9
cm2/s, however, small
molecules (proteins in solution) diffuse faster than the limits of TICS because the
fluorophores enter and leave the small focal volume long before a subsequent image is
acquired. Hence, intensity fluctuations in adjacent images in the image series are completely
uncorrelated.227
FCS could be used in such cases (i.e. for fast-moving particles) but as stated
earlier, FCS is not compatible with all CLSMs and image analysis provides additional
information.227
1.4.4.4 Raster Image Correlation Spectroscopy (RICS)
RICS was developed by Digman et al. to exploit the spatial correlation of diffusion so that
diffusion could be measured in every region of a cell. In the initial study raster scans were
used to measure the diffusion of fluorescent beads, enhanced green fluorescent protein
(EGFP), in solution and inside the cytoplasm of living cells. RICS was presented a powerful
analysis tool for measuring dynamic processes (fast and slow) using a standard confocal
microscope.127,237
From a mathematical perspective, RICS is an extension of ICS which produces raster
(graphical) images and can measure fast dynamics. RICS combines the high temporal
resolution of single-pointed FCS (microseconds) and the low temporal resolution of ICS
(seconds) with the added capability of spatial correlation; where points are measured as
different positions and at different times simultaneously. Time structures are introduced into
the image since different parts of the image are acquired at different times. The microscope
generates an image by using galvanometer mirrors to raster a laser beam across a sample,

64
recording one pixel at a time. Hence, RICS uses spatial correlation to measure the diffusion
coefficient of a sample imaged on a CLSM (Figure 1.10). Through comparison studies,
similar information has been retrieved between RICS and FCS.227,237
Figure 1.10: Systematic diagram of Raster Image Correlation Spectroscopy (RICS).
Systematic diagram of RICS: RICS is based on the use of acquired confocal microscope images where
particles have been fluorescently labelled. The laser beam scans across each pixel and each pixel
represents a variation in fluctuation. Through the auto-correlation of these images, the size and
kinetics of the labelled-species (i.e. protein) over time can be determined.
1.4.4.4.1 The mathematics of RICS
As mentioned earlier, images contain hidden temporal and spatial information that need to be
extracted to determine dynamics. The diffusion of a particle in uniform medium can be
described by the relationship in Equation 1.4. The equation has two distinct parts – a
temporal part and a spatial exponential Gaussian term.
𝐶(𝑟, 𝑡) = 1
(4𝜋𝐷𝑡)3/2exp (−
𝑟2
4𝐷𝑡 ), Equation 1.4
where D is the diffusion coefficient and 𝐶(𝑟, 𝑡)is proportional to the probability of finding the
particle at position r, at time t, when the particle was at the origin, r = 0 at time t = 0. A
particle at the origin (at t = 0) has a distance r from the origin with a Gaussian distribution
where the variance is dependent on the time and diffusion coefficient of the particle. When
the concentration is sampled at different spatial locations, the spatial autocorrelation function
decays with a characteristic length that is dependent on the diffusion coefficient and the size

65
of the illumination volume. Expressions for the spatial autocorrelation function assume that
the intensity fluctuation is due to the diffusion of a particle that is small compared to the point
spread function (PSF). In the temporal domain, a random motion is performed by the particle
where the (end-to-end) distance is dependent on the on the square root of time. In the spatial
domain, the particle has a probability to be at a distance from the original position as
described by the Gaussian relation in Equation 1.4. The scanning part of the correlation
function 𝑆(𝑥. 𝑦) where 𝑥 is the abscissa and 𝑦 is the ordinate is expressed in Equation 1.5 in
terms of the pixel size, 𝛿𝑟 (in the range of 0.1-0.2 m), the pixel residence time 𝜏 (in the
range of 5-100 s) the pixel sequence number 𝑛. For RICS, the theory developed for spatial
raster-scan is expanded in regards to the spatial part of the correlation (Equation 1.4) in terms
of pixel size (expanded range of 0.05-0.2 m), pixel resident time (expanded range of 2-100
s) and the line repetition time (typically in the 3-100 s range); thus, making RICS
accessible to most researchers using standard confocal microscopes.
The overall correlation function is given by 𝐺𝑠 (𝑥, 𝑦) = 𝑆(𝑥. 𝑦) 𝖷 𝐺(𝑥, 𝑦), where 𝐺(𝑥, 𝑦) is
the autocorrelation function without scanning.
S(x, y) = exp(−
1
2[(2xδr
w0)2+(2yδr
w0)2]
(1+4D(x+ny)τ
w02 )
)
Equation 1.5
𝐺(𝑥, 𝑦) = 𝛾
𝑁(1 +
4𝐷(𝑥+𝑛𝑦)𝜏
𝑤02 )
−1
(4𝐷(𝑥+𝑛𝑦)𝜏
𝑤𝑧2 )
−1/2
Equation 1.6
Spatial correlations depend on the spatial overlap and the time interval between adjacent
pixels. Longer time intervals between data points decrease correlation at shorter spatial scales
but increase correlation at distant pixels. The correlation of an image series for raster scan
pattern appears on three different timescales: Adjacent pixels on the horizontal axis are
separated by microseconds, the pixels along the vertical axis are milliseconds apart and pixels
from successive image frames are seconds apart. Thus, the difference in sampling time is
exploited to measure a range of diffusion coefficients – from very fast to slow diffusion.127,237
The resolution of a microscope is limited by diffraction of the excitation source. Acquired
images are a convolution of the PSF with the point source emission spreading over a number
of adjacent pixels arising from diffraction.227
With TICS, the spatial resolution is equal to that
of the image and a temporal resolution relating with the frame rate of the acquired image.235

66
Thus, TICS is limited with the imaging rate with maximum diffusion coefficient of 10-9
cm2/sec for a typical confocal setup. Small fluorophores with rapid diffusion rates would be
undetected.227
Using RICS on a confocal laser scanning microscope it is possible to measure
dynamics of rapidly diffusing species. Spatial resolution at pixel level for raster images and
dynamic processes can be obtained only for millisecond dynamics.127,237
With RICS it is
possible to apply a mean contribution filter from either mobile or immobile species present in
the sample.227
Following the development of RICS, as described in the aforementioned sections (in 2005),
the Gratton group (in 2008)238
provided guidelines for performing RICS analysis on a CLSM
in terms of instrument settings and image acquisition settings. It is recommended that for a
high spatial resolution, 50 to 100 images are required in order to reach a good signal-to-noise
ratio; low concentration samples require more frames. The correlation function,
simplistically, is characterised by two parameters: the amplitude of the function and the
characteristic decay (correlation time). It is clearly shown in the images the shape of the
spatial ACF is a reflection of the particle motion. The paper pointed out the importance of the
scan speed such that if the molecules are moving slower than the beam is scanning, the
spatial ACF will be insensitive to the dynamics. Also, when optimising the image acquisition
settings and the ACF fitting parameters, it is important to ensure there are enough data points
and a good fit to the ACF.238
1.4.4.4.2 The scope of RICS in measuring protein dynamics in
formulations
The work outlined with RICS has been mainly in cells, demonstrating RICS is a powerful
tool for measuring dynamics of proteins and lipids using commercial confocal
microscopes.127,232,238,239
Then, in 2012, Hamrang et al. reported a novel application for RICS
in the characterisation of protein diffusion of fluorescently labelled bovine serum albumin
(BSA) samples. The suitability of RICS as a tool for the quantitative assessment of protein
diffusion in solution was evaluated through comparing the data with DLS and FCS. The
diffusion of BSA solutions as a function of formulation (pH and ionic strength) and
denaturing conditions (thermal stress) was assessed. The diffusion coefficients obtained were
consistent across the three techniques. A decrease in the hydrodynamic radii was observed
with increasing ionic strength and an increase in hydrodynamic radii as a function of protein
concentration. The study proposed RICS as an orthogonal technique in the deduction of
protein aggregation. RICS was validated as a respectable application for assessing protein

67
behaviour and as a meaningful tool in the spatiotemporal interpretation of macromolecular
dynamics.138
In 2015, RICS was applied to characterise mAb aggregate solutions (Appendix
1).240
Aggregates were extrinsically labelled with SYPRO Red and visualised with confocal
microscopy prior to RICS analysis. Low concentrated mAb solutions (1 and 10mg/ml) were
subjected to thermal and freeze-thaw stress. Complementarity was demonstrated between
aggregate size ranges measured with RICS, MFI and DLS. SYPRO Red was successfully
utilised as an extrinsic labelling probe, without interfering with the protein itself. Thus, this
study provided scope for the assessment of RICS (with SYPRO Red) on assessment of
aggregation development in complex formulations i.e. in the presence of solution components
e.g. surfactants, silicone oil.
68
1.5 References
1. Vázquez-Rey M, Lang DA 2011. Aggregates in monoclonal antibody manufacturing
processes. Biotechnology and Bioengineering 108(7):1494-1508.
2. Scolnik PA 2009. mAbs: A business perspective. mAbs 1(2):179-184.
3. FDA Approved Antibody-based Therapeutics [Internet]. The Immunology Link.
Available from: http://www.immunologylink.com/FDA-APP-Abs.html
4. ClinicalTrials.gov [Internet]. U.S National Library of Medicine. Available from:
https://www.clinicaltrials.gov/
5. Stern M, Herrmann R 2005. Overview of monoclonal antibodies in cancer therapy:
present and promise. Critical Reviews in Oncology/Hematology 54(1):11-29.
6. Weiner GJ 2015. Building better monoclonal antibody-based therapeutics. Nature
Reviews Cancer 15(1):361.
7. Janeway CA, Travers P, Walport M 2001. The structure of a typical antibody
molecule in Immunobiology: The Immune System in Health and Disease. New York:
Garland Science.
8. Shukla AA, Hubbard B, Tressel T, Guhan S, Low D 2007. Downstream processing of
monoclonal antibodies: Application of platform approaches. Journal of Chromatography B
848(1):28-39.
9. Grainger DW 2004. Controlled-release and local delivery of therapeutic antibodies.
Expert Opinion on Biological Therapy 4(7):1029-1044.
10. Brekke OH, Sandlie I 2003. Therapeutic antibodies for human diseases at the dawn of
the twenty-first century. Nature Reviews Drug Discovery 2(1):52-62.
11. Scott AM, Wolchok JD, Old LJ 2012. Antibody therapy of cancer. Nature Reviews
Cancer 12(4):278-287.
12. Goldsmith SJ 2010. Radioimmunotherapy of Lymphoma: Bexxar and Zevalin.
Seminars in Nuclear Medicine 40(2):122-135.
13. Koffeman EC, Genovese M, Amox D, Keogh E, Santana E, Matteson EL, Kavanaugh
A, Molitor JA, Schiff MH, Posever JO, Bathon JM, Kivitz AJ, Samodal R, Belardi F,
Dennehey C, van den Broek T, van Wijk F, Zhang X, Zieseniss P, Le T, Prakken BA, Cutter
GC, Albani S 2009. Epitope-specific immunotherapy of rheumatoid arthritis: Clinical
responsiveness occurs with immune deviation and relies on the expression of a cluster of
molecules associated with T cell tolerance in a double-blind, placebo-controlled, pilot phase
II trial. Arthritis & Rheumatism 60(11):3207-3216.
14. Bossaller L, Rothe A 2013. Monoclonal antibody treatments for rheumatoid arthritis.
Expert Opinion on Biological Therapy 13(9):1257-1272.
15. Choy EHS, Panayi GS 2001. Cytokine Pathways and Joint Inflammation in
Rheumatoid Arthritis. New England Journal of Medicine 344(12):907-916.
16. Herenius MM, Oliveira AS, Wijbrandts CA, Gerlag DM, Tak PP, Lebre MC 2013.
Anti-TNF therapy reduces serum levels of chemerin in rheumatoid arthritis: a new
mechanism by which anti-TNF might reduce inflammation. PloS one 8(2):e57802.
17. Wang SSS, Wu JW, Yamamoto S, Liu H-S 2008. Diseases of protein aggregation and
the hunt for potential pharmacological agents. Biotechnology Journal 3(2):165-192.
18. Chiti F, Dobson CM 2009. Amyloid formation by globular proteins under native
conditions. Nature Chemical Biology 5(1):15-22.
19. Rosenberg A 2006. Effects of protein aggregates: An immunologic perspective. The
American Association of Pharmaceutical Scientists Journal 8(3):501-507.
20. Fink AL 1998. Protein aggregation: folding aggregates, inclusion bodies and amyloid.
Folding and Design 3(1):9-23.
21. Philo JS, Arakawa, T 2009. Mechanisms of protein aggregation. Current
Pharmaceutical Biotechnology 10(4):348-351.

69
22. Philo JS 2006. Is any measurement method optimal for all aggregate sizes and types?
The AAPS Journal 8(3):564-571.
23. Weinbuch D, Zölls S, Wiggenhorn M, Friess W, Winter G, Jiskoot W, Hawe A 2013.
Micro–flow imaging and resonant mass measurement (archimedes) – complementary
methods to quantitatively differentiate protein particles and silicone oil droplets. Journal of
Pharmaceutical Sciences 102(7):2152-2165.
24. Shukla AA, Thömmes J 2010. Recent advances in large-scale production of
monoclonal antibodies and related proteins. Trends in Biotechnology 28(5):253-261.
25. Firer MA 2001. Efficient elution of functional proteins in affinity chromatography.
Journal of Biochemical and Biophysical Methods 49(1–3):433-442.
26. Stability Testing of New Drug Substances and Products (revision 2) [Internet].
International Council for Harmonisation. Available from:
http://www.ich.org/products/guidelines/quality/quality-single/article/stability-testing-of-new-
drug-substances-and-products.html
27. Liu L, Ammar DA, Ross LA, Mandava N, Kahook MY, Carpenter JF 2011. Silicone
Oil Microdroplets and Protein Aggregates in Repackaged Bevacizumab and Ranibizumab:
Effects of Long-term Storage and Product Mishandling. Investigative Ophthalmology &
Visual Science 52(2):1023-1034.
28. May M 2012. Testing Drug Stability for Long-Term Storage. Drug Discovery and
Development. 10 May. Available from: https://www.dddmag.com/article/2012/10/testing-
drug-stability-long-term-storage
29. Waterman KC 2011. The Application of the Accelerated Stability Assessment
Program (ASAP) to Quality by Design (QbD) for Drug Product Stability. American
Association of Pharmaceutical Scientists 12(3):932.
30. Blessy M, Patel RD, Prajapati PN, Agrawal YK 2014. Development of forced
degradation and stability indicating studies of drugs—A review. Journal of Pharmaceutical
Analysis 4(3):159-165.
31. Kommanaboyina B, Rhodes CT 1999. Trends in Stability Testing, with Emphasis on
Stability During Distribution and Storage. Drug Development and Industrial Pharmacy
25(7):857-868.
32. Banks DD, Hambly DM, Scavezze JL, Siska CC, Stackhouse NL, Gadgil HS 2009.
The effect of sucrose hydrolysis on the stability of protein therapeutics during accelerated
formulation studies. Journal of Pharmaceutical Sciences 98(12):4501-4510.
33. Voynov V, Chennamsetty N, Kayser V, Helk B, Trout BL 2009. Predictive tools for
stabilization of therapeutic proteins. Mabs 1(6):580-582.
34. Barnett GV, Razinkov VI, Kerwin BA, Laue TM, Woodka AH, Butler PD,
Perevozchikova T, Roberts CJ 2015. Specific-Ion Effects on the Aggregation Mechanisms
and Protein–Protein Interactions for Anti-streptavidin Immunoglobulin Gamma-1. The
Journal of Physical Chemistry B 119(18):5793-5804.
35. Lund M, Jönsson B 2003. A Mesoscopic Model for Protein-Protein Interactions in
Solution. Biophysical Journal 85(5):2940-2947.
36. Brummitt RK, Nesta DP, Chang L, Chase SF, Laue TM, Roberts CJ 2011. Nonnative
Aggregation of an IgG1 Antibody in Acidic Conditions: Part 1. Unfolding, Colloidal
Interactions, and Formation of High-Molecular-Weight Aggregates. Journal of
Pharmaceutical Sciences 100(6):2087-2103.
37. Hari SB, Lau H, Razinkov VI, Chen S, Latypov RF 2010. Acid-Induced Aggregation
of Human Monoclonal IgG1 and IgG2: Molecular Mechanism and the Effect of Solution
Composition. Biochemistry 49(43):9328-9338.

70
38. Latypov RF, Hogan S, Lau H, Gadgil H, Liu D 2012. Elucidation of Acid-induced
Unfolding and Aggregation of Human Immunoglobulin IgG1 and IgG2 Fc. Journal of
Biological Chemistry 287(2):1381-1396.
39. Saluja A, Fesinmeyer RM, Hogan S, Brems DN, Gokarn YR 2010. Diffusion and
Sedimentation Interaction Parameters for Measuring the Second Virial Coefficient and Their
Utility as Predictors of Protein Aggregation. Biophysical Journal 99(8):2657-2665.
40. Curtis RA, Lue L 2006. A molecular approach to bioseparations: Protein–protein and
protein–salt interactions. Chemical Engineering Science 61(3):907-923.
41. George A, Wilson WW 1994. Predicting protein crystallization from a dilute solution
property. Acta Crystallographica Section D 50(4):361-365.
42. Curtis RA, Ulrich J, Montaser A, Prausnitz JM, Blanch HW 2002. Protein–protein
interactions in concentrated electrolyte solutions. Biotechnology and Bioengineering
79(4):367-380.
43. Connolly BD, Petry C, Yadav S, Demeule B, Ciaccio N, Moore JMR, Shire SJ,
Gokarn YR 2012. Weak Interactions Govern the Viscosity of Concentrated Antibody
Solutions: High-Throughput Analysis Using the Diffusion Interaction Parameter. Biophysical
Journal 103(1):69-78.
44. Lehermayr C, Mahler HC, Mäder K, Fischer S 2011. Assessment of net charge and
protein–protein interactions of different monoclonal antibodies. Journal of Pharmaceutical
Sciences 100(7):2551-2562.
45. Chakroun N, Hilton D, Ahmad SS, Platt GW, Dalby PA 2016. Mapping the
Aggregation Kinetics of a Therapeutic Antibody Fragment. Molecular Pharmaceutics
13(2):307-319.
46. Wang W, Roberts CJ 2013. Non-Arrhenius Protein Aggregation. The American
Association of Pharmaceutical Scientists Journal 15(3):840-851.
47. Dong A, Prestrelski SJ, Allison SD, Carpenter JF 1995. Infrared spectroscopic studies
of lyophilization- and temperature-induced protein aggregation. Journal of Pharmaceutical
Sciences 84(4):415-424.
48. Yan YB, Wang Q, He HW, Zhou HM 2004. Protein Thermal Aggregation Involves
Distinct Regions: Sequential Events in the Heat-Induced Unfolding and Aggregation of
Hemoglobin. Biophysical journal 86(3):1682-1690.
49. Lazar KL, Patapoff TW, Sharma VK 2010. Cold denaturation of monoclonal
antibodies. mAbs 2(1):42-52.
50. Pikal-Cleland KA, Rodrıguez-Hornedo N, Amidon GL, Carpenter JF 2000. Protein
Denaturation during Freezing and Thawing in Phosphate Buffer Systems: Monomeric and
Tetrameric β-Galactosidase. Archives of Biochemistry and Biophysics 384(2):398-406.
51. Austerberry JI, Dajani R, Panova S, Roberts D, Golovanov AP, Pluen A, van der
Walle CF, Uddin S, Warwicker J, Derrick JP, Curtis R 2017. The effect of charge mutations
on the stability and aggregation of a human single chain Fv fragment. European Journal of
Pharmaceutics and Biopharmaceutics 115(1):18-30.
52. Sahin E, Grillo AO, Perkins MD, Roberts CJ 2010. Comparative effects of pH and
ionic strength on protein–protein interactions, unfolding, and aggregation for IgG1
antibodies. Journal of Pharmaceutical Sciences 99(12):4830-4848.
53. Ejima D, Tsumoto K, Fukada H, Yumioka R, Nagase K, Arakawa T, Philo JS 2007.
Effects of acid exposure on the conformation, stability, and aggregation of monoclonal
antibodies. Proteins: Structure, Function, and Bioinformatics 66(4):954-962.
54. Ugwu SO, Apte SP 2004. The Effect of Buffers on Protein Conformational Stability.
Pharmaceutical Technology 28(3):86-113.
55. Mao YJ, Sheng XR, Pan XM 2007. The effects of NaCl concentration and pH on the
stability of hyperthermophilic protein Ssh10b. BMC Biochemistry 8(1):28-28.

71
56. Ritchie C 2012. Protein purification. Mater Methods. 17 July. Available from:
https://www.labome.com/method/Protein-Purification.html
57. Majhi PR, Ganta RR, Vanam RP, Seyrek E, Giger K, Dubin PL 2006.
Electrostatically Driven Protein Aggregation: β-Lactoglobulin at Low Ionic Strength.
Langmuir 22(22):9150-9159.
58. Lund M, Jungwirth P 2008. Patchy proteins, anions and the Hofmeister series. Jounal
of Physics 20(49): 494218
59. Song J 2009. Insight into “insoluble proteins” with pure water. FEBS Letters
583(6):953-959.
60. Ó’Fágáin C 2004. Lyophilization of Proteins. Protein Purification Protocols. New
York: Humana Press.
61. Kamerzell TJ, Esfandiary R, Joshi SB, Middaugh CR, Volkin DB 2011. Protein–
excipient interactions: Mechanisms and biophysical characterization applied to protein
formulation development. Advanced Drug Delivery Reviews 63(13):1118-1159.
62. Martos A, Koch W, Jiskoot W, Wuchner K, Winter G, Friess W, Hawe A 2017.
Trends on Analytical Characterization of Polysorbates and Their Degradation Products in
Biopharmaceutical Formulations. Journal of Pharmaceutical Sciences 106(7):1722-1735.
63. Ha E, Wang W, John Wang Y 2002. Peroxide formation in polysorbate 80 and protein
stability. Journal of Pharmaceutical Sciences 91(10):2252-2264.
64. Khan TA, Mahler H-C, Kishore RSK 2015. Key interactions of surfactants in
therapeutic protein formulations: A review. European Journal of Pharmaceutics and
Biopharmaceutics 97(1):60-67.
65. Schramm LL, Marangoni DG 2000. Surfactants and Their Solutions: Basic Principles.
In Surfactants: Fundamentals and Applications in the Petroleum Industry. Cambridge:
Cambridge University Press..
66. Agarkhed M, O’Dell C, Hsieh MC, Zhang J, Goldstein J, Srivastava A 2013. Effect of
Polysorbate 80 Concentration on Thermal and Photostability of a Monoclonal Antibody.
American Association of Pharmaceutical Scientists 14(1):1-9.
67. Hermeling S, Schellekens H, Crommelin DJA, Jiskoot W 2003. Micelle-Associated
Protein in Epoetin Formulations: A Risk Factor for Immunogenicity? Pharmaceutical
Research 20(12):1903-1907.
68. Singh SK 2011. Impact of Product-Related Factors on Immunogenicity of
Biotherapeutics. Journal of Pharmaceutical Sciences 100(2):354-387.
69. Kerwin BA 2008. Polysorbates 20 and 80 Used in the Formulation of Protein
Biotherapeutics: Structure and Degradation Pathways. Journal of Pharmaceutical Sciences
97(8):2924-2935.
70. Mohajeri E, Noudeh GD 2012. Effect of Temperature on the Critical Micelle
Concentration and Micellization Thermodynamic of Nonionic Surfactants: Polyoxyethylene
Sorbitan Fatty Acid Esters. E-Journal of Chemistry 9(4):2268-2274.
71. Brito RMM, Vaz WLC 1986. Determination of the critical micelle concentration of
surfactants using the fluorescent probe N-phenyl-1-naphthylamine. Analytical Biochemistry
152(2):250-255.
72. Tummino PJ, Gafni A 1993. Determination of the aggregation number of detergent
micelles using steady-state fluorescence quenching. Biophysical Journal 64(5):1580-1587.
73. Al-Soufi W, Piñeiro L, Novo M 2012. A model for monomer and micellar
concentrations in surfactant solutions: Application to conductivity, NMR, diffusion, and
surface tension data. Journal of Colloid and Interface Science 370(1):102-110.
74. Patist A, Bhagwat SS, Penfield KW, Aikens P, Shah DO 2000. On the measurement
of critical micelle concentrations of pure and technical-grade nonionic surfactants. Journal of
Surfactants and Detergents 3(1):53-58.

72
75. Treuheit M, Kosky A, Brems D 2002. Inverse Relationship of Protein Concentration
and Aggregation. Pharmaceutical Research 19(4):511-516.
76. Mahler HC, Müller R, Frieβ W, Delille A, Matheus S 2005. Induction and analysis of
aggregates in a liquid IgG1-antibody formulation. European Journal of Pharmaceutics and
Biopharmaceutics 59(3):407-417.
77. Luo Q, Joubert MK, Stevenson R, Ketchem RR, Narhi LO, Wypych J 2011. Chemical
Modifications in Therapeutic Protein Aggregates Generated under Different Stress
Conditions. The Journal of Biological Chemistry 286(28):25134-25144.
78. Teska BM, Brake JM, Tronto GS, Carpenter JF 2016. Aggregation and Particle
Formation of Therapeutic Proteins in Contact With a Novel Fluoropolymer Surface Versus
Siliconized Surfaces: Effects of Agitation in Vials and in Prefilled Syringes. Journal of
Pharmaceutical Sciences 105(7):2053-2065.
79. Vlasak J, Ionescu R 2008. Heterogeneity of monoclonal antibodies revealed by
charge-sensitive methods. Current Pharmaceutical Biotechnology 9(6):468-481.
80. Perevozchikova THN, Nesta DP, Roberts CJ 2015. Protein Adsorption, Desorption,
and Aggregation Mediated by Solid-Liquid Interfaces. Pharmaceutical Biotechnology
104(6):1946-1959.
81. Krayukhina E, Tsumoto K, Uchiyama S, Fukui K 2015. Effects of Syringe Material
and Silicone Oil Lubrication on the Stability of Pharmaceutical Proteins. Journal of
Pharmaceutical Sciences 104(2):527-535.
82. Majumdar S, Ford BM, Mar KD, Sullivan VJ, Ulrich RG, D'Souza AJM 2011.
Evaluation of the effect of syringe surfaces on protein formulations. Journal of
Pharmaceutical Sciences 100(7):2563-2573.
83. Kiese S, Papppenberger A, Friess W, Mahler HC 2008. Shaken, Not Stirred:
Mechanical Stress Testing of an IgG1 Antibody. Journal of Pharmaceutical Sciences
97(10):4347-4366.
84. Waxman L, Vilivalam V 2011. Evaluation of end-over-end rotation/agitation of
protein solutions in prefilled syringes made from glass or plastic as a preliminary indicator of
protein aggregation. Protein Stability Conference. Colorado, US: University of Colorado
Center for Pharmaceutical Biotechnology.
85. Thirumangalathu R, Krishnan S, Ricci MS, Brems DN, Randolph TW, Carpenter JF
2009. Silicone oil- and agitation-induced aggregation of a monoclonal antibody in aqueous
solution. Journal of Pharmaceutical Sciences 98(9):3167-3181.
86. Smith EJ 1988. Siliconization of parenteral packaging components. Journal of
Parenteral Science and Technology 42(1):1-13.
87. Bruno R, Peterson C 2012. Syringe Siliconization. TechnoPharm 2(40):238–244.
88. Colas A, Corning D 2007. Silicone in Pharmaceutical Applications. BioProcess
Online. 17 February. Available from: https://www.bioprocessonline.com/doc/silicones-in-
pharmaceutical-applications-0001
89. Chantelau EA., Berger M 1985. Pollution of insulin with silicone oil, a hazard of
disposable plastic syringes. Lancet 325(8443):1459-1459.
90. Gerhardt A, Bonam K, Bee JS, Carpenter JF, Randolph TW 2013. Ionic strength
affects tertiary structure and aggregation propensity of a monoclonal antibody adsorbed to
silicone oil–water interfaces. Journal of Pharmaceutical Sciences 102(2):429-440.
91. Lankers M, Munhall J, Valet O 2008. Differentiation between foreign particulate
matter and silicone oil induced protein aggregation in drug solutions by automated raman
spectroscopy. Microscopy and Microanalysis 14(2):1612-1613.
92. Ludwig DB, Trotter JT, Gabrielson JP, Carpenter JF, Randolph TW 2011. Flow
cytometry: A promising technique for the study of silicone oil-induced particulate formation
in protein formulations. Analytical Biochemistry 410(2):191-199.

73
93. Basu P, Krishnan S, Thirumangalathu R, Randolph TW, Carpenter JF 2013. IgG1
aggregation and particle formation induced by silicone-water interfaces on siliconized
borosilicate glass beads: A model for siliconized primary containers. Journal of
Pharmaceutical Sciences 102(3):852-865.
94. Hofmann M, Winzer M, Weber C, Gieseler H 2016. Prediction of Protein
Aggregation in High Concentration Protein Solutions Utilizing Protein-Protein Interactions
Determined by Low Volume Static Light Scattering. Journal of Pharmaceutical Sciences
105(6):1819-1828.
95. Shire SJ, Shahrokh Z, Liu J 2004. Challenges in the development of high protein
concentration formulations. Journal of Pharmaceutical Sciences 93(6):1390-1402.
96. Guidance for Industry Container Closure System for Packaging Human Drugs and
Biologics [Internet]. U.S. Department of Health and Human Services Food and Drug
Administration. Available from: http://www.fda.gov/cder/guidance/index.htm
97. Groves MJ 1988. Parenteral Technology Manual. Journal of Pharmaceutical Sciences
75(1):103-103.
98. Cilurzo F, Selmin F, Minghetti P, Adami M, Bertoni E, Lauria S, Montanari L 2011.
Injectability Evaluation: An Open Issue. American Association of Pharmacetical Scientists
Journal 12(2):604-609.
99. Shire SJ, Shahrokh Z, Liu J 2004. Challenges in the development of high protein
concentration formulations. Journal of Pharmaceutical Sciences 93(6):1390-1402.
100. Burckbuchler V, Mekhloufi G, Giteau AP, Grossiord JL, Huille S, Agnely F 2010.
Rheological and syringeability properties of highly concentrated human polyclonal
immunoglobulin solutions. European Journal of Pharmaceutics and Biopharmaceutics
76(3):351-356.
101. Overcashier DE, Chan EK, Hsu CC 2006. Technical considerations in the
development of prefilled syringes for protein products. American Pharmaceutical Review
9(6):77-83.
102. Mezger TG 2006. The Rheology Handbook. Hannvover, Germany: Vincentz Network
GmbH and Co.
103. Yu YX, Tian AW, Gao GH 2005. Prediction of collective diffusion coefficient of
bovine serum albumin in aqueous electrolyte solution with hard-core two-Yukawa potential.
Physical Chemistry Chemical Physics 7(12):2423-2428.
104. Neergaard MS, Kalonia DS, Parshad H, Nielsen AD, Møller EH, van de Weert M
2013. Viscosity of high concentration protein formulations of monoclonal antibodies of the
IgG1 and IgG4 subclass – Prediction of viscosity through protein–protein interaction
measurements. European Journal of Pharmaceutical Sciences 49(3):400-410.
105. Liu J, Nguyen MDH, Andya JD, Shire SJ 2005. Reversible Self-Association Increases
the Viscosity of a Concentrated Monoclonal Antibody in Aqueous Solution. Journal of
Pharmaceutical Sciences 94(9):1928-1940.
106. Nicoud L, Lattuada M, Yates A, Morbidelli M 2015. Impact of aggregate formation
on the viscosity of protein solutions. Soft Matter 11(27):5513-5522.
107. Dear BJ, Hung JJ, Truskett TM, Johnston KP 2017. Contrasting the Influence of
Cationic Amino Acids on the Viscosity and Stability of a Highly Concentrated Monoclonal
Antibody. Pharmaceutical Research 34(1):193-207.
108. Castellanos MM, Pathak JA, Colby RH 2014. Both protein adsorption and
aggregation contribute to shear yielding and viscosity increase in protein solutions. Soft
Matter 10(1):122-131.
109. Castellanos MM, Pathak JA, Leach W, Bishop SM, Colby RH 2014. Explaining the
Non-Newtonian Character of Aggregating Monoclonal Antibody Solutions Using Small-
Angle Neutron Scattering. Biophysical Journal 107(2):469-476.
74
110. Barnes HA 2000. Handbook of Elementary Rheology. University of Wales: Institute
of Non-Newtonian Fluid Mechanics.
111. A Basic Introduction to Rheology (White paper) [Internet]. Malvern Panalytical.
Available from: https://www.technologynetworks.com/analysis/white-papers/a-basic-
introduction-to-rheology-228340
112. Harding SE 1997. The intrinsic viscosity of biological macromolecules. Progress in
measurement, interpretation and application to structure in dilute solution. Progress in
Biophysics and Molecular Biology 68(2):207-262.
113. Tomar DS, Kumar S, Singh SK, Goswami S, Li L 2016. Molecular basis of high
viscosity in concentrated antibody solutions: Strategies for high concentration drug product
development. mAbs 8(2):216-228.
114. Kanai S, Liu J, Patapoff TW, Shire SJ 2008. Reversible Self-Association of a
Concentrated Monoclonal Antibody Solution Mediated by Fab–Fab Interaction That Impacts
Solution Viscosity. Journal of Pharmaceutical Sciences 97(10):4219-4227.
115. Saluja A, Kalonia DS 2008. Nature and consequences of protein–protein interactions
in high protein concentration solutions. International Journal of Pharmaceutics 358(1):1-15.
116. Saluja A, Badkar AV, Zeng DL, Nema S, Kalonia DS 2006. Application of high‐frequency rheology measurements for analyzing protein–protein interactions in high protein
concentration solutions using a model monoclonal antibody (IgG2). Journal of
Pharmaceutical Sciences 95(9):1967-1983.
117. Sharma V, Jaishankar A, Wang Y-C, McKinley GH 2011. Rheology of globular
proteins: apparent yield stress, high shear rate viscosity and interfacial viscoelasticity of
bovine serum albumin solutions. Soft Matter 7(11):5150-5160.
118. Eguchi Y, Karino T 2008. Measurement of Rheologic Property of Blood by a Falling-
Ball Blood Viscometer. Annals of Biomedical Engineering 36(4):545-553.
119. Kang H, Ahn, K, H., Lee, S, J 2010. Rheological properties of dilute polymer
solutions determined by particle tracking microrheology and bulk rheometry. Korea-Australia
Rheology Journal 22(1):11-10.
120. Del GF, Tassieri M, Oelschlaeger C, Shen AQ 2017. When Microrheology, Bulk
Rheology, and Microfluidics Meet: Broadband Rheology of Hydroxyethyl Cellulose Water
Solutions. Macromolecules 50(7):2951-2963.
121. Pathak JA, Sologuren RR, Narwal R 2013. Do Clustering Monoclonal Antibody
Solutions Really Have a Concentration Dependence of Viscosity? Biophysical Journal
104(4):913-923.
122. Amin S, Barnett GV, Pathak JA, Roberts CJ, Sarangapani PS 2014. Protein
aggregation, particle formation, characterization & rheology. Current Opinion in Colloid
& Interface Science 19(5):438-449.
123. Amin S, Rega CA, Jankevics H 2012. Detection of viscoelasticity in aggregating
dilute protein solutions through dynamic light scattering-based optical microrheology.
Rheologica Acta 51(4):329-342.
124. Wagner M, Reiche K, Blume A, Garidel P 2013. Viscosity measurements of antibody
solutions by photon correlation spectroscopy: an indirect approach – limitations and
applicability for high-concentration liquid protein solutions. Pharmaceutical Development
and Technology 18(4):963-970.
125. He F, Becker GW, Litowski JR, Narhi LO, Brems DN, Razinkov VI 2010. High-
throughput dynamic light scattering method for measuring viscosity of concentrated protein
solutions. Analytical Biochemistry 399(1):141-143.
126. Starchev K, Zhang J, Buffle J 1998. Applications of Fluorescence Correlation
Spectroscopy— Particle Size Effect. Journal of Colloid and Interface Science 203(1):189-
196.

75
127. Digman MA, Brown CM, Sengupta P, Wiseman PW, Horwitz AR, Gratton E 2005.
Measuring Fast Dynamics in Solutions and Cells with a Laser Scanning Microscope.
Biophysical journal 89(2):1317-1327.
128. Sherman E, Itkin A, Kuttner YY, Rhoades E, Amir D, Haas E, Haran G 2008. Using
Fluorescence Correlation Spectroscopy to Study Conformational Changes in Denatured
Proteins. Biophysical Journal 94(12):4819-4827.
129. Krichevsky O, Bonnet G 2002. Fluorescence correlation spectroscopy: the technique
and its applications. Reports on Progress in Physics 65(1):251-297.
130. Ghosh R, Sharma S, Chattopadhyay K 2009. Effect of Arginine on Protein
Aggregation Studied by Fluorescence Correlation Spectroscopy and Other Biophysical
Methods†. Biochemistry 48(5):1135-1143.
131. Pabbathi A, Ghosh S, Samanta A 2013. FCS Study of the Structural Stability of
Lysozyme in the Presence of Morpholinium Salts. The Journal of Physical Chemistry B
117(51):16587-16593.
132. Yoshida N, Tamura M, Kinjo M 2000. Fluorescence Correlation Spectroscopy: A
New Tool for Probing the Microenvironment of the Internal Space of Organelles. Single
Molecules 1(4):279-283.
133. Szymański J, Patkowski A, Wilk A, Garstecki P, Holyst R 2006. Diffusion and
Viscosity in a Crowded Environment: from Nano- to Macroscale. The Journal of Physical
Chemistry B 110(51):25593-25597.
134. Cha SHS, Kim D 2010. Viscosity of Sucrose Aqueous Solutions Measured by Using
Fluorescence Correlation Spectroscopy. Journal of the Korean Physical Society 56(4):1315-
1318.
135. Zondervan R, Kulzer F, Berkhout GCG, Orrit M 2007. Local viscosity of supercooled
glycerol near T(g) probed by rotational diffusion of ensembles and single dye molecules.
Proceedings of the National Academy of Sciences of the United States of America
104(31):12628-12633.
136. Pharmacopeia [Internet]. The United States Pharmacopeial. Available from:
http://app.uspnf.com/uspnf/
137. Zolls S, Tantipolphan R, Wiggenhorn M, Winter G, Jiskoot W, Friess W, Hawe A
2012. Particles in therapeutic protein formulations, Part 1: Overview of analytical methods.
Journal of Pharmaceutical Sciences 101(3):914-935.
138. Hamrang Z, Pluen A, Zindy E, Clarke D 2012. Raster image correlation spectroscopy
as a novel tool for the quantitative assessment of protein diffusional behaviour in solution.
Journal of Pharmaceutical Sciences 101(6):2082-2093.
139. Hiemenz PC, Rajagopalan R 1997. Static and dynamic light scattering and other
radiation scattering. New York: Marcel Dekker.
140. Some D, Kenrick S 2012. Characterization of Protein-Protein Interactions via Static
and Dynamic Light Scattering. UK: InTech.
141. Salinas BA, Sathish HA, Bishop SM, Harn N, Carpenter JF, Randolph TW 2010.
Understanding and modulating opalescence and viscosity in a monoclonal antibody
formulation. Journal of Pharmaceutical Sciences 99(1):82-93.
142. Ahrer K, Buchacher A, Iberer G, Josic D, Jungbauer A 2003. Analysis of aggregates
of human immunoglobulin G using size-exclusion chromatography, static and dynamic light
scattering. Journal of Chromatography A 1009(1–2):89-96.
143. Kunji ERS, Harding M, Butler PJG, Akamine P 2008. Determination of the molecular
mass and dimensions of membrane proteins by size exclusion chromatography. Methods
46(2):62-72.

76
144. Sahin E, Roberts C 2012. Size-Exclusion Chromatography with Multi-angle Light
Scattering for Elucidating Protein Aggregation Mechanisms. Therapeutic Proteins. New
York: Humana Press.
145. Štulı́k K, Pacáková V, Tichá M 2003. Some potentialities and drawbacks of
contemporary size-exclusion chromatography. Journal of Biochemical and Biophysical
Methods 56(1–3):1-13.
146. Hong P, Koza S, Bouvier ES 2012. Size-Exclusion Chromatography for the Analysis
of Protein Biotherapeutics and their Aggregates. Journal of liquid chromatography & related
technologies 35(20):2923-2950.
147. Murphy RM, Roberts CJ 2013. Protein misfolding and aggregation research: Some
thoughts on improving quality and utility. Biotechnology Progress 29(5):1109-1115.
148. Clodfelter DK, Nussbaum MA, Reilly J 1999. Comparison of free solution capillary
electrophoresis and size exclusion chromatography for quantitating non-covalent aggregation
of an acylated peptide. Journal of Pharmaceutical and Biomedical Analysis 19(5):763-775.
149. Mächtle W 2006. Centrifugation in Particle Size Analysis. Encyclopedia of
Analytical Chemistry. New Jersey: John Wiley & Sons, Ltd.
150. Harding ES 1994. Classicd Light Scattering for the Deterrnination ofAbsolute
Molecular Weights and Gross Conforrnation of Biological Macromolecules. Methods in
Molecular Biology 22(1):85-95.
151. Dextras P, Burg TP, Manalis SR 2009. Integrated Measurement of the Mass and
Surface Charge of Discrete Microparticles Using a Suspended Microchannel Resonator.
Analytical Chemistry 81(11):4517-4523.
152. Ludwig DB, Carpenter JF, Hamel JB, Randolph TW 2010. Protein adsorption and
excipient effects on kinetic stability of silicone oil emulsions. Journal of Pharmaceutical
Sciences 99(4):1721-1733.
153. Britt KA, Schwartz DK, Wurth C, Mahler HC, Carpenter JF, Randolph TW 2012.
Excipient Effects on Humanized Monoclonal Antibody Interactions with Silicone oil
Emulsions. Journal of Pharmaceutical Sciences 101(12):4419-4432.
154. Kuntsche J, Horst JC, Bunjes H 2011. Cryogenic transmission electron microscopy
(cryo-TEM) for studying the morphology of colloidal drug delivery systems. International
Journal of Pharmaceutics 417(1–2):120-137.
155. Lee H, Kirchmeier M, Mach H 2011. Monoclonal antibody aggregation intermediates
visualized by atomic force microscopy. Journal of Pharmaceutical Sciences 100(2):416-423.
156. Sharma DK, Oma P, Pollo MJ, Sukumar M 2010. Quantification and characterization
of subvisible proteinaceous particles in opalescent mAb Formulations Using Micro-Flow
Imaging. Journal of Pharmaceutical Sciences 99(6):2628-2642.
157. Huang CT, Sharma D, Oma P, Krishnamurthy R 2009. Quantitation of protein
particles in parenteral solutions using micro-flow imaging. Journal of Pharmaceutical
Sciences 98(9):3058-3071.
158. Strehl R, Rombach-Riegraf V, Diez M, Egodage K, Bluemel M, Jeschke M, Koulov
A 2012. Discrimination Between Silicone Oil Droplets and Protein Aggregates in
Biopharmaceuticals: A Novel Multiparametric Image Filter for Sub-visible Particles in
Microflow Imaging Analysis. Pharmaceutical Research 29(2):594-602.
159. Sharma D, Oma P, Krishnan S 2009. Silicone Microdroplets in Protein
Formulations—Detection and Enumeration. Pharmaceutical Technology 33(4). 2 April.
Available from: http://www.pharmtech.com/silicone-microdroplets-protein-formulations-
detection-and-enumeration-0?id=&sk=&date=&%0A%09%09%09&pageID=3
160. Sharma D, King D, Oma P, Merchant C 2010. Micro-Flow Imaging: Flow
Microscopy Applied to Sub-visible Particulate Analysis in Protein Formulations. The
American Association of Pharmaceutical Scientists Journal 12(3):455-464.
77
161. Zölls S, Weinbuch D, Wiggenhorn M, Winter G, Friess W, Jiskoot W, Hawe A 2013.
Flow Imaging Microscopy for Protein Particle Analysis—A Comparative Evaluation of Four
Different Analytical Instruments. The American Association of Pharmaceutical Scientists
Journal 15(4):1200-1211.
162. Wohlleben W 2012. Validity range of centrifuges for the regulation of nanomaterials:
from classification to as-tested coronas. Journal of nanoparticle research : an interdisciplinary
forum for nanoscale science and technology 14(12):1300-1300.
163. Filipe V, Hawe A, Jiskoot W 2010. Critical Evaluation of Nanoparticle Tracking
Analysis (NTA) by NanoSight for the Measurement of Nanoparticles and Protein Aggregates.
Pharmaceutical Research 27(5):796-810.
164. Li Y, Lubchenko V, Vekilov PG 2011. The use of dynamic light scattering and
Brownian microscopy to characterize protein aggregation. Review of Scientific Instruments
82(5):053106.
165. Mickisch S, Tantipolphan R, Wiggenhorn M, Frieb W, Winter G, Hawe A 2010.
Subvisible particles in a mAb formulation analyzed by nanoparticle tracking analysis and
microflow imaging. American Association of Pharmaceutical Scientists. Available from:
https://lobsteroverseas.net/library/mfi-poster-hall/subvisible-particles-in-a-monoclonal-
antibody-formulation/index.html
166. Lichtman JW, Conchello JA 2005. Fluorescence microscopy. Nature Methods
2(12):910-919.
167. Lichtman JW, Conchello JA 2005. Fluorescence microscopy. Nature Methods
2(12):910-919.
168. Jablonski Energy Diagram [Internet]. Olympus Corporation. Available from:
https://www.olympus-lifescience.com/en/microscope-resource/primer/java/jablonski/jabintro/
169. Jameson DM, Croney JC, Moens PDJ 2003. Fluorescence: Basic concepts, practical
aspects, and some anecdotes. Methods in Enzymology 360(1):1-43.
170. The Nobel Prize in Chemistry 2008 [Internet]. Nobelprize.org. Available from:
https://www.nobelprize.org/nobel_prizes/chemistry/laureates/2008/
171. The Nobel Prize in Chemistry 2014 [Internet]. Nobelprize.org. Available from:
https://www.nobelprize.org/nobel_prizes/chemistry/laureates/2014/
172. White NS, Errington RJ 2005. Fluorescence techniques for drug delivery research:
theory and practice. Advanced Drug Delivery Reviews 57(1):17-42.
173. Sugden JK 2004. Photochemistry of dyes and fluorochromes used in biology and
medicine: some physicochemical background and current applications. Biotechnic &
Histochemistry 79(2):71-90.
174. Chudakov MD, Matz VM., Lukyanov S, Lukyanov KA 2010. Fluorescent proteins
and their applications in imaging living cells and tissues. Physiological Reviews 90(3):1103-
1163.
175. Matthieu G, Nina R, Sophie EJ, Ewan RGM, Daniel GB, Gabriel A, Paul AD 2010.
Protein denaturation and protein:drugs interactions from intrinsic protein fluorescence
measurements at the nanolitre scale. Protein Science 19(8):1544-1554.
176. Capelle MH, Gurny R, Arvinte T 2009. A High Throughput Protein Formulation
Platform: Case Study of Salmon Calcitonin. Pharmaceutical Research 26(1):118-128.
177. Eftink MR 1994. The use of fluorescence methods to monitor unfolding transitions in
proteins. Biophysical Journal 66(2):482-501.
178. Duy C, Fitter J 2006. How Aggregation and Conformational Scrambling of Unfolded
States Govern Fluorescence Emission Spectra. Biophysical Journal 90(10):3704-3711.
179. Ghisaidoobe ABT, Chung SJ 2014. Intrinsic Tryptophan Fluorescence in the
Detection and Analysis of Proteins: A Focus on Förster Resonance Energy Transfer
Techniques. International Journal of Molecular Sciences 15(12):22518-22538.

78
180. Nenadic S, Tuckett S 2010. The rise of synthetic dyes. National Museums Scotland.
Available from: https://www.nms.ac.uk/collections-research/our-research/highlights-of-
previous-projects/colouring-the-nation/research/dyeing-and-printing-techniques/the-rise-of-
synthetic-dyes/
181. Lu L, Zhao M, Liang SC, Zhao LY, Li DB, Zhang BB 2009. Production and synthetic
dyes decolourization capacity of a recombinant laccase from Pichia pastoris. Journal of
Applied Microbiology 107(4):1149-1156.
182. Atkinson ER 1956. The chemistry of synthetic dyes and pigments. Journal of
Chemical Education 33(1):50-50.
183. Hawe A, Sutter M, Jiskoot W 2008. Extrinsic Fluorescent Dyes as Tools for Protein
Characterisation. Pharmaceutical Research 25(7):1487-1499.
184. Demeule B, Gurny R, Arvinte T 2007. Detection and characterization of protein
aggregates by fluorescence microscopy. International Journal of Pharmaceutics 329(1):37-
45.
185. Dinarello CA 2009. Immunological and Inflammatory Functions of the Interleukin-1
Family. Annual Review of Immunology 27(1-2):519-550.
186. Finke JM, Jennings PA 2001. Early Aggregated States in the Folding of Interleukin-
1β. Journal of Biological Physics 27(2-3):119-131.
187. Finke JM, Roy M, Zimm BH, Jennings PA 1999. Aggregation Events Occur Prior to
Stable Intermediate Formation during Refolding of Interleukin 1â. Biochemistry 39(3):575-
583.
188. Grillo AO, Edwards K-LT, Kashi RS, Shipley KM, Hu L, Besman MJ, Middaugh CR
2000. Conformational Origin of the Aggregation of Recombinant Human Factor VIII†.
Biochemistry 40(2):586-595.
189. Lindgren M, Sörgjerd K, Hammarström P 2005. Detection and Characterization of
Aggregates, Prefibrillar Amyloidogenic Oligomers, and Protofibrils Using Fluorescence
Spectroscopy. Biophysical Journal 88(6):4200-4212.
190. Laurence DJR 1952. A study of the adsorption of dyes on bovine serum albumin by
the method of polarization of fluorescence. Biochemical Journal 51(2):168-180.
191. Ali V, Prakash K, Kulkarni S, Ahmad A, Madhusudan KP, Bhakuni V 1999. 8-
Anilino-1-naphthalene Sulfonic Acid (ANS) Induces Folding of Acid Unfolded Cytochrome
c to Molten Globule State as a Result of Electrostatic Interactions. Biochemistry
38(41):13635-13642.
192. Kundu B, Guptasarma P 1999. Hydrophobic dye inhibits aggregation of molten
carbonic anhydrase during thermal unfolding and refolding. Proteins: Structure, Function,
and Bioinformatics 37(3):321-324.
193. Fu X, Zhang X, Chang Z 2005. 4,4′-Dianilino-1,1′-binaphthyl-5,5′-sulfonate, a novel
molecule having chaperone-like activity. Biochemical and Biophysical Research
Communications 329(3):1087-1093.
194. Quinn MK, Gnan N, James S, Ninarello A, Sciortino F, Zaccarelli E, McManus JJ
2015. How fluorescent labelling alters the solution behaviour of proteins. Physical Chemistry
Chemical Physics 17(46):31177-31187.
195. He F, Phan DH, Hogan S, Bailey R, Becker GW, Narhi LO, Razinkov VI 2010.
Detection of IgG aggregation by a high throughput method based on extrinsic fluorescence.
Journal of Pharmaceutical Sciences 99(6):2598-2608.
196. Simpson RJ 2010. SYPRO Orange fluorescent staining of protein gels. Cold Spring
Harbor Protocols 4. Available from:
http://cshprotocols.cshlp.org/content/2010/4/pdb.prot5414.abstract

79
197. Hawe A, Filipe V, Jiskoot W 2010. Fluorescent molecular rotors as dyes to
characterize polysorbate-containing IgG formulations. Pharmaceutical Research 27(2):314-
326.
198. Steinberg TH, Jones LJ, Haugland RP, Singer VL 1996. SYPRO Orange and SYPRO
Red Protein Gel Stains: One-Step Fluorescent Staining of Denaturing Gels for Detection of
Nanogram Levels of Protein. Analytical Biochemistry 239(2):223-237.
199. Niesen FH, Berglund H, Vedadi M 2007. The use of differential scanning fluorimetry
to detect ligand interactions that promote protein stability. Nature Protocols 2(9):2212-2221.
200. Ablinger E, Leitgeb S, Zimmer A 2013. Differential scanning fluorescence approach
using a fluorescent molecular rotor to detect thermostability of proteins in surfactant-
containing formulations. International Journal of Pharmaceutics 441(1–2):255-260.
201. Menzen T, Friess W 2013. High-throughput melting-temperature analysis of a
monoclonal antibody by differential scanning fluorimetry in the presence of surfactants.
Journal of Pharmaceutical Sciences 102(2):415-428.
202. Magde D, Elson E, Webb WW 1972. Thermodynamic Fluctuations in a Reacting
System—Measurement by Fluorescence Correlation Spectroscopy. Physical Review Letters
29(11):705-708.
203. Rigler R, Mets Ü, Widengren J, Kask P 1993. Fluorescence correlation spectroscopy
with high count rate and low background: analysis of translational diffusion. European
Biophysics Journal 22(3):169-175.
204. Rigler R 1995. Fluorescence correlations, single molecule detection and large number
screening Applications in biotechnology. Journal of Biotechnology 41(2):177-186.
205. Lagerkvist AC, Földes-Papp Z, Persson MAA, Rigler R 2001. Fluorescence
correlation spectroscopy as a method for assessment of interactions between phage displaying
antibodies and soluble antigen. Protein Science: A Publication of the Protein Society
10(8):1522-1528.
206. Tian Y, Martinez MM, Pappas D 2011. Fluorescence Correlation Spectroscopy: A
Review of Biochemical and Microfluidic Applications. Applied spectroscopy 65(4):115-124.
207. Jung C, Lee J, Kang M, Kim SW 2014. Viscosity-Dependent Diffusion of Fluorescent
Particles Using Fluorescence Correlation Spectroscopy. Journal of Fluorescence 24(6):1785-
1790.
208. Chattopadhyay K, Saffarian S, Elson EL, Frieden C 2005. Measuring Unfolding of
Proteins in the Presence of Denaturant Using Fluorescence Correlation Spectroscopy.
Biophysical Journal 88(2):1413-1422.
209. Chen Y, Munteanu AC, Huang YF, Phillips J, Zhu Z, Mavros M, Tan W 2009.
Mapping Receptor Density on Live Cells by Using Fluorescence Correlation Spectroscopy.
Chemistry – A European Journal 15(21):5327-5336.
210. Schaeffel D, Yordanov S, Staff RH, Kreyes A, Zhao Y, Schmidt M, Landfester K,
Hofkens J, Butt H-J, Crespy D, Koynov K 2015. Fluorescence Correlation Spectroscopy in
Dilute Polymer Solutions: Effects of Molar Mass Dispersity and the Type of Fluorescent
Labeling. ACS Macro Letters 4(2):171-176.
211. Cherdhirankorn T, Best A, Koynov K, Peneva K, Muellen K, Fytas G 2009. Diffusion
in Polymer Solutions Studied by Fluorescence Correlation Spectroscopy. The Journal of
Physical Chemistry B 113(11):3355-3359.
212. Medalia O, Weber I, Frangakis AS, Nicastro D, Gerisch G, Baumeister W 2002.
Macromolecular Architecture in Eukaryotic Cells Visualized by Cryoelectron Tomography.
Science 298(5596):1209-1213.
213. Banks DS, Fradin C 2005. Anomalous Diffusion of Proteins Due to Molecular
Crowding. Biophysical Journal 89(5):2960-2971.

80
214. Balbo J, Mereghetti P, Herten D-P, Wade Rebecca C 2013. The Shape of Protein
Crowders is a Major Determinant of Protein Diffusion. Biophysical Journal 104(7):1576-
1584.
215. Woll D 2014. Fluorescence correlation spectroscopy in polymer science. RSC
Advances 4(5):2447-2465.
216. Zorrilla S, Hink MA, Visser AJWG, Lillo MP 2007. Translational and rotational
motions of proteins in a protein crowded environment. Biophysical Chemistry 125(2):298-
305.
217. Moschakis T, Murray BS, Dickinson E 2006. Particle Tracking Using Confocal
Microscopy to Probe the Microrheology in a Phase-Separating Emulsion Containing
Nonadsorbing Polysaccharide. Langmuir 22(10):4710-4719.
218. Dertinger T, Loman A, Ewers B, Müller CB, Krämer B, Enderlein J 2008. The optics
and performance of dual-focus fluorescence correlation spectroscopy. Optics Express
16(19):14353-14368.
219. Widengren J, Mets U, Rigler R 1995. Fluorescence correlation spectroscopy of triplet
states in solution: a theoretical and experimental study. The Journal of Physical Chemistry
99(36):13368-13379.
220. Enderlein J, Gregor I, Patra D, Fitter J 2004. Art and Artefacts of Fluorescence
Correlation Spectroscopy. Current Pharmaceutical Biotechnology 5(2):155-161.
221. Zettl H, Häfner W, Böker A, Schmalz H, Lanzendörfer M, Müller AHE, Krausch G
2004. Fluorescence Correlation Spectroscopy of Single Dye-Labeled Polymers in Organic
Solvents. Macromolecules 37(5):1917-1920.
222. Pineiro L, Freire S, Bordello J, Novo M, Al-Soufi W 2013. Dye exchange in micellar
solutions. Quantitative analysis of bulk and single molecule fluorescence titrations. Soft
Matter 9(45):10779-10790.
223. Luschtinetz F, Dosche C 2009. Determination of micelle diffusion coefficients with
fluorescence correlation spectroscopy (FCS). Journal of Colloid and Interface Science
338(1):312-315.
224. Zettl H, Portnoy Y, Gottlieb M, Krausch G 2005. Investigation of Micelle Formation
by Fluorescence Correlation Spectroscopy. The Journal of Physical Chemistry B
109(27):13397-13401.
225. Semwogerere D, Weeks ER 2005. Confocol Microscopy. London: Taylor & Francis.
226. Paddock S 2000. Principles and practices of laser scanning confocal microscopy.
Molecular Biotechnology 16(2):127-149.
227. Kolin D, Wiseman P 2007. Advances in Image Correlation Spectroscopy: Measuring
Number Densities, Aggregation States, and Dynamics of Fluorescently labeled
Macromolecules in Cells. Cell Biochemistry and Biophysics 49(3):141-164.
228. Schneider CA, Rasband WS, Eliceiri KW 2012. NIH Image to ImageJ: 25 years of
image analysis. Nature Methods 9(7):671-675.
229. Schindelin J, Arganda-Carreras I, Frise E, Kaynig V, Longair M, Pietzsch T,
Preibisch S, Rueden C, Saalfeld S, Schmid B, Tinevez J-Y, White DJ, Hartenstein V, Eliceiri
K, Tomancak P, Cardona A 2012. Fiji: an open-source platform for biological-image
analysis. Nature Methods 9(1):676-682.
230. Digman MA, Gratton E 2012. Scanning Image Correlation Spectroscopy. BioEssays:
news and reviews in molecular, cellular and developmental biology 34(5):377-385.
231. Digman MA, Wiseman PW, Choi C, Horwitz AR, Gratton E 2009. Stoichiometry of
molecular complexes at adhesions in living cells. Proceedings of the National Academy of
Sciences of the United States of America 106(7):2170-2175.

81
232. Digman MA, Wiseman PW, Horwitz AR, Gratton E 2009. Detecting Protein
Complexes in Living Cells from Laser Scanning Confocal Image Sequences by the Cross
Correlation Raster Image Spectroscopy Method. Biophysical Journal 96(2):707-716.
233. Peterson NO, Hoddelius PL, Wiseman PW, Segar O, Magnusson KE 1993.
Quantitation of membrane receptor distributions by image correlation spectroscopy: concept
and application. Biophysical Journal 65(3):1135-1146.
234. Broek W, Huang Z, Thompson N 1999. High-Order Autocorrelation with Imaging
Fluorescence Correlation Spectroscopy: Application to IgE on Supported Planar Membranes.
Journal of Fluorescence 9(4):313-324.
235. Kolin DL, Costantino S, Wiseman PW 2006. Sampling Effects, Noise, and
Photobleaching in Temporal Image Correlation Spectroscopy. Biophysical journal
90(2):628-639.
236. Schwartzentruber JA 2010. k-Space Image Correlation Spectroscopy (kICS):
Accuracy and Precision, Capabilities and Limitations. PhD Thesis. McGill University.
Quebec, Canada.
237. Digman MA, Sengupta P, Wiseman PW, Brown CM, Horwitz AR, Gratton E 2005.
Fluctuation Correlation Spectroscopy with a Laser-Scanning Microscope: Exploiting the
Hidden Time Structure. Biophysical Journal 88(5):33-36.
238. Brown CM, Dalal RB, Hebert B, Digman MA, Horwitz AR, Gratton E 2008. Raster
image correlation spectroscopy (RICS) for measuring fast protein dynamics and
concentrations with a commercial laser scanning confocal microscope. Journal of Microscopy
229(1):78-91.
239. Rossow MJ, Sasaki JM, Digman MA, Gratton E 2010. Raster image correlation
spectroscopy in live cells. Nature Protocols 5(11):1761-1774.
240. Hamrang Z, Hussain M, Tingey K, Tracka M, Casas-Finet JR, Uddin S, van der Walle
CF, Pluen A 2015. Characterisation of Stress-Induced Aggregate Size Distributions and
Morphological Changes of a Bi-Specific Antibody Using Orthogonal Techniques. Journal of
Pharmaceutical Sciences 104(8):2473-2481.

82
2 : AIMS AND OBJECTIVES

83
2.1 Aims and Objectives
As highlighted in the Introduction Chapter, the ability to determine aggregation propensity
with minimum modification of the solutions or as early as possible in the process is essential
to improve bioprocess design and formulation of monoclonal antibodies (mAbs). A related
aspect/consequence of protein intermolecular interactions, particularly at high concentrations,
is the (increased) solution viscosity. It is hypothesized in this thesis that the use of
quantitative fluorescence techniques, namely raster image correlation spectroscopy (RICS)
and fluorescence correlation spectroscopy (FCS) (sequentially) can provide information on
proteins aggregation propensity and protein-protein interactions in highly concentrated
solutions and in real formulations - with high specificity, without interfering with sample
components and using small sample volumes.
Thus the aims of this thesis are:
To attempt to detect the whole range of sub-visible particles (specifically protein
aggregates) in real formulations,
To screen and select existing fluorescent dyes/probes to allow for viscosity
measurements such that changes in local rheological properties can be measured,
To demonstrate the potential use of fluorescence techniques in studying monoclonal
antibody solutions,
To relate rheology to aggregation to improve aggregation models.
To meet the aforementioned aims, the objectives of this thesis are to:
Validate and apply RICS (following extrinsic labelling by SYPRO Red) in mAb
aggregate solutions in the presence of other solution components - This involves assessing
the concentration of aggregate particles in industrially relevant formulations. The other
techniques used need to (together) cover a broad size range, measure particle counts, and
have the ability of particle differentiation or the specific selection of protein aggregates.
In Chapter 3 the effect of silicone oil and surfactants (polysorbate-20) are assessed on mAb
aggregation following agitation in pre-filled syringes. RICS measured size-distributions (and
concentrations) are compared against MFI and Archimedes (as orthogonal techniques).
Additionally, all three techniques are assessed on their analytical capabilities in terms of size
ranges and particle differentiation. To allowing comparison of RICS data with MFI and
Archimedes (which have concentration limits), a low mAb concentration of 10mg/ml is used.

84
Later in the thesis (Chapter 6), RICS is applied in the characterisation of high concentrated
i.e. 100mg/ml mAb solutions, subjected to various forms of agitation stress.
Assess the use of fluorescence probes (with FCS) in retrieving viscosity information of
mAb solutions – Fluorescent probes have been utilised in determining rheological information
through measuring their self-diffusion. To assess this application in mAb solutions, the
diffusion of different sized probes are measured by FCS using different proteins, (model
protein BSA and two mAbs with different aggregation propensities), a range of mAb
formulations (as a function of pH, salt and ionic strength) and over low to high mAb
concentrations. The data is compared with bulk rheology measurements and applied to
existing models.
To contribute towards aggregation models using fluorescence based techniques - An
additional method for assessing surfactant micelle behaviour is evaluated. Surfactants such
as polysorbate-20 are commonly used in protein formulations to protect against surface-
induced aggregation. However, their mechanisms are poorly understood – especially in mAb
solutions. The applicability of FCS with SYPRO Orange is assessed on labelling surfactant
micelles, in Chapter 5. The method is used to determine the critical micelle concentration of
nonionic surfactants (including polysorbate-20) and subsequently in detecting micelles in
high concentration mAb solutions.
To assess the relation between aggregation development and solution viscosity – To
do this a range of samples need to be generated with various aggregate size and
concentrations. For this purpose, in Chapter 6, various agitation conditions are manipulated
(based on agitation type, speed and duration) to generate a range of aggregate size
distributions and aggregate counts. Subsequently, FCS is applied in measuring changes in
solution viscosity and RICS in characterising aggregation development (sequentially).

85
3 : EVALUATION OF AGGREGATE
AND SILICONE OIL COUNTS IN
PRE-FILLED SILICONIZED
SYRINGES: AN ORTHOGONAL
STUDY CHARACTERISING THE
ENTIRE SUBVISIBLE SIZE RANGE

86
Int. J. Pharm., 519 (2017) pp 58-66.
Research Article
Evaluation of Aggregate and Silicone oil Counts in Pre-filled Siliconized Syringes: An
orthogonal study characterising the entire subvisible size range.
Maryam Shaha, #
, Zahra Rattraya, b, #
, Katie Dayc, Shahid Uddin
c, Robin Curtis
d, Christopher
F. van der Wallec and Alain Pluen
a*
a, School of Health Sciences, University of Manchester, Manchester, UK
b, Present address: Department of Therapeutic Oncology, Yale School of Medicine, New
Haven, USA
c, MedImmune Ltd, Formulation Sciences, Granta Park, Cambridge, UK
d, School of Chemical Engineering and Analytical Sciences, University of Manchester,
Manchester, UK
#, authors contributed equally
*, corresponding author: [email protected]

87
3.1 Abstract
Characterisation of particulates in therapeutic monoclonal antibody (mAb) formulations is
routinely extended to the sub-visible size-range (0.1-10 m). Additionally, with the increased
use of pre-filled syringes (PFS), particle differentiation is required between proteinaceous and
non-proteinaceous particles such as silicone oil droplets. Here, three orthogonal techniques:
Raster Image Correlation Spectroscopy (RICS), Resonance Mass Measurements (RMM) and
Micro-Flow Imaging (MFI), were evaluated with respect to their sub-visible particle
measurement and characterisation capabilities. Particle formation in mAb PFS solutions was
evaluated with increasing polysorbate-20 (PS-20) concentrations. All three techniques
provided complementary but distinct information on protein aggregate and silicone oil
droplet presence. PS-20 limited the generation of mAb aggregates during agitation, while
increasing the number of silicone oil droplets (PS-20 concentration dependant). MFI and
RMM revealed PS-20 lead to the formation of larger micron-sized droplets, with RICS
revealing an increase in smaller sub-micron droplets. Subtle differences in data sets
complicate the apparent correlation between silicone oil sloughing and mAb aggregates’
generation. RICS (though the use of a specific dye) demonstrates an improved selectivity for
mAb aggregates, a broader measurement size-range and smaller sample volume requirement.
Thus, RICS is proposed to add value to the currently available particle measurement
techniques and enable informed decisions during mAb formulation development.
Key words: particle, monoclonal antibody, protein aggregation, silicone oil, primary
packaging, raster image correlation spectroscopy,

88
3.2 Introduction
There is an estimated production of 3.5 billion pre-filled syringe (PFS) units per year for
therapeutic biopharmaceutical drug (e.g. monoclonal antibody (mAb)) administration, with a
potential to grow to 6.7 billion units by 2020.1,2
The increase in PFS use is driven by factors
such as the ease of use, advantages in safety, reductions in drug overfill and patient self-
administration; all of which reduce the incidence of hospitalisation and associated costs.3
One of the challenges for the formulation scientist is to ensure the stability of the formulated
mAb throughout the products lifetime, in the preferred presentation. Protein aggregation has
been found to arise during and after fill-finish steps; which may develop from mechanical
and/or agitation stress or from interaction with primary packaging components.4 Silicone oil
is a widely-utilised lubricant in PFS, facilitating ease of plunger movement in syringes and
injection with hypodermic needles;5 however, exposure to sloughed silicone oil droplets has
been suggested to adversely impact formulation stability.6,7
Initial indication of adverse
effects from silicone oil was found in the 1980s following correlation of insulin particle
formation with elevated blood glucose levels, in diabetics administered with the product.4
Later studies on agitation stress have shown the loss of soluble protein in PFS to be a
particular problem during transportation.7 Furthermore, agitation at higher speeds was
correlated with an increase in monomer loss in reported shaking studies.5 Subsequently, a
number of silicone oil related mechanisms underlying particulate formation have been
proposed, exemplified by dispersed droplets acting as nucleation sites for protein
aggregation;8 adsorption-destabilization of protein onto the silicone oil/water interface;
5 and
silicone oil droplet surface charge neutralisation by adsorbed proteins resulting in
agglomeration.9,10
The size range of protein and silicone oil particulates is generally wide (Table 3.1 presents
the various size ranges and common terminologies used).11-14
The United States
Pharmacopeia (USP) chapter ‘Particulate Matter in Injections’ <788> defines concentration
limits for particles in parental solutions that are ≥ 10 and 25 m.15
USP chapter ‘Subvisible
Particulate Matter in Therapeutic Protein Injections’ <787> makes the recommendation to
monitor particles < 10 µm, with a supporting chapter <1787> giving guidance on the
expanded techniques that can be used and size ranges.16
Based on the USP
recommendations, the commercially available Micro-Flow Imaging (MFI) system, detecting
particles from approximately 1 m to 400 m,17,18
is commonly used in the industry to assess
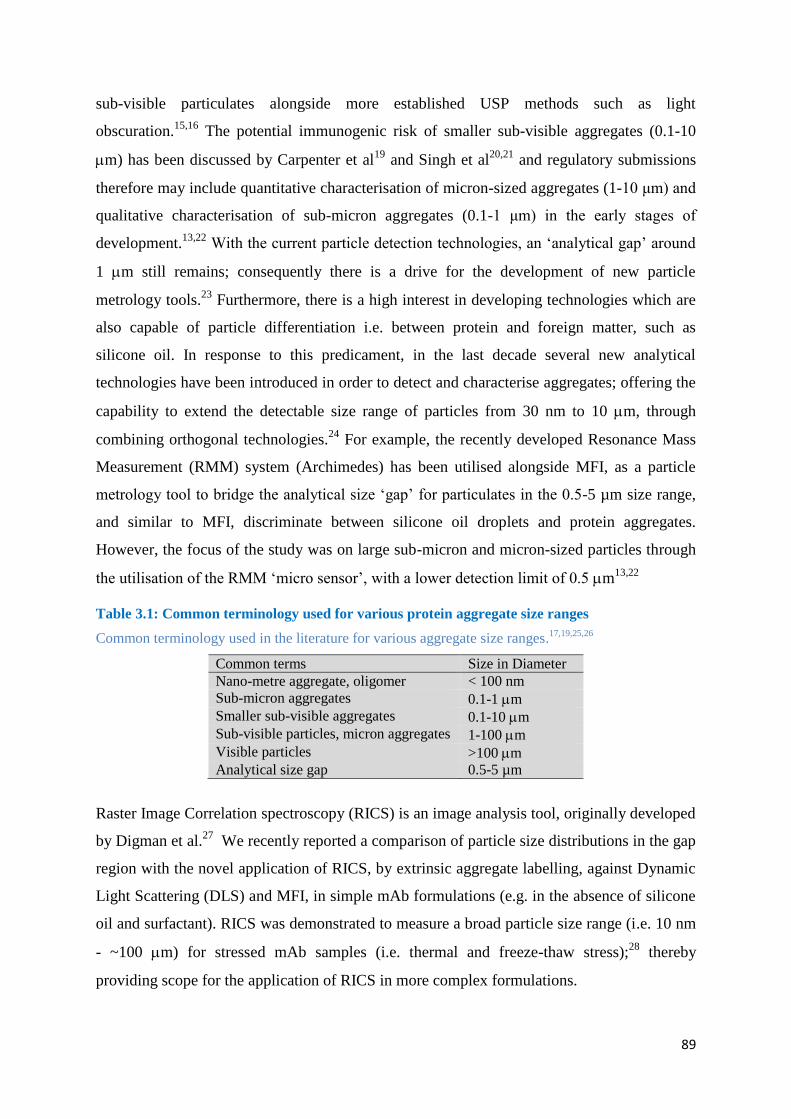
89
sub-visible particulates alongside more established USP methods such as light
obscuration.15,16
The potential immunogenic risk of smaller sub-visible aggregates (0.1-10
m) has been discussed by Carpenter et al19
and Singh et al20,21
and regulatory submissions
therefore may include quantitative characterisation of micron-sized aggregates (1-10 μm) and
qualitative characterisation of sub-micron aggregates (0.1-1 μm) in the early stages of
development.13,22
With the current particle detection technologies, an ‘analytical gap’ around
1 m still remains; consequently there is a drive for the development of new particle
metrology tools.23
Furthermore, there is a high interest in developing technologies which are
also capable of particle differentiation i.e. between protein and foreign matter, such as
silicone oil. In response to this predicament, in the last decade several new analytical
technologies have been introduced in order to detect and characterise aggregates; offering the
capability to extend the detectable size range of particles from 30 nm to 10 m, through
combining orthogonal technologies.24
For example, the recently developed Resonance Mass
Measurement (RMM) system (Archimedes) has been utilised alongside MFI, as a particle
metrology tool to bridge the analytical size ‘gap’ for particulates in the 0.5-5 µm size range,
and similar to MFI, discriminate between silicone oil droplets and protein aggregates.
However, the focus of the study was on large sub-micron and micron-sized particles through
the utilisation of the RMM ‘micro sensor’, with a lower detection limit of 0.5 m13,22
Table 3.1: Common terminology used for various protein aggregate size ranges
Common terminology used in the literature for various aggregate size ranges.17,19,25,26
Common terms Size in Diameter
Nano-metre aggregate, oligomer < 100 nm
Sub-micron aggregates 0.1-1 m
Smaller sub-visible aggregates 0.1-10 m
Sub-visible particles, micron aggregates 1-100 m
Visible particles >100 m
Analytical size gap 0.5-5 µm
Raster Image Correlation spectroscopy (RICS) is an image analysis tool, originally developed
by Digman et al.27
We recently reported a comparison of particle size distributions in the gap
region with the novel application of RICS, by extrinsic aggregate labelling, against Dynamic
Light Scattering (DLS) and MFI, in simple mAb formulations (e.g. in the absence of silicone
oil and surfactant). RICS was demonstrated to measure a broad particle size range (i.e. 10 nm
- ~100 m) for stressed mAb samples (i.e. thermal and freeze-thaw stress);28
thereby
providing scope for the application of RICS in more complex formulations.

90
This manuscript reports the quantitative evaluation of protein and silicone oil particulates
formed in PFS solutions, both within and outside the analytical size gap range. We compare
the complementary of RICS, detecting particles from 30 nm-10 m, against RMM and MFI
which are capable of particle sizing over the sub-micron (~ 0.1- ~ 5 µm, through the use of
the nano and micro sensor) and micron (> 1 µm) sizes ranges, respectively. The PFS
solutions, in the presence and absence of polysorbate-20 (PS-20), were subjected to agitation
stress via end-over-end rotation, used to model stress during transportation.7,29
There are
numerous studies assessing the mechanisms of mAb aggregation.30,31
and the effects of
silicone oil7,10,13,32
or polysorbate surfactants33,34
in influencing the aggregation process; such
studies include novel methods to reduce in situ mAb aggregation in PFS.35
However, the
focus has been the larger sub-visible size range of particulates i.e. > 0.5 m;36-38
due to the
current lack of available technologies that are sensitive to the detection of smaller particles,
whilst capable of differentiating between proteinaceous and foreign particulates (e.g. silicone
oil). Herein, the ability of RICS to characterise aggregates in solutions containing silicone oil
droplets via extrinsic fluorescent dyes is also evaluated: the selectivity of RICS (through the
use of a specific dye) is compared with the efficiency of RMM and MFI (based on particle
buoyancy and optical parameters for RMM and MFI, respectively) in particle differentiation.
The assessment of size and concentration of particulates generated in siliconized PFS
containing formulated mAb is reported utilising all three techniques.
3.3 Materials and Methods
3.3.1 Materials
A bi-specific monoclonal antibody (IgG1, MW 204kDa, pI 8.9-9.2), herein termed ‘COE-08’,
was kindly provided by Medimmune (Cambridge, UK). 1 mL, long, sterile, ready to fill BD
HypakTM
glass siliconized syringes were purchased from Becton Dickinson and Company
(New Jersey, US).
All buffer components including sucrose, L-histidine and PS-20 were of analytical grade or
higher, purchased from Sigma Aldrich (Dorset, UK) and used without further purification. To
minimise potential degradation of the polysorbate, 10% w/v PS-20 stocks are made in batches
at Medimmune (to ensure minimal use of the original product bottle) and used within a fixed
expiry date. All stock solutions are subsequently tightly sealed and stored at 4C.
SYPRO® Red and SYPRO® Orange dyes were obtained from Thermo Scientific
(Leicestershire, UK) at a concentration of 5000× (in DMSO). All buffers and solutions were

91
prepared with Millipore de-ionised water (18 MΩ.cm) and pre-filtered prior to stress
experiments.
3.3.2 Methods
3.3.2.1 Sample Preparation
All solutions were prepared in a pH 6 buffer composed of 25 mM histidine and 235 mM
sucrose. COE-08 solutions were prepared at a final concentration of 10 mg/mL in the
presence of 0, 0.02 and 0.05% w/v PS-20 and placed in syringes. Control syringes were filled
with buffer containing the same PS-20 concentrations i.e. in the absence of mAb. Solutions
were placed in the syringes ensuring a consistently sized air bubble, of a height of
approximately 1mm. Multiple syringes were used per condition to ensure sufficient sample
volume for all three instruments. Syringes were placed on an end-over-end rotator at ambient
temperature (21C) in a thermostatically-controlled environment for a 24 hour agitation
period at 20 rpm. In parallel, non-agitated samples (of the same described solutions) were
stored in an open rack on the benchtop.
3.3.2.2 Analysis of Particulates with Confocal Microscopy (RICS)
SYPRO® Red and SYPRO® Orange (Thermo Scientific, Leicestershire, UK), used to label
protein aggregates and silicone oil droplets, respectively, were added to samples (post-
experiment) 15 minutes prior to visualisation with confocal microscopy at a final working
concentration of 2.5×.
A Zeiss 510 Confocor 2 (Zeiss, Jena, Germany) confocal microscope equipped with a c-
Apochromat 40×/1.2NA water-immersion objective was utilised for image acquisition. For
SYPRO® Red solutions, imaging was carried out by exciting the dye with a Helium-Neon
laser at 543 nm and the emitted fluorescence collected above 585 nm (LP585 filter set).
Excitation of SYPRO Orange® was carried out at 488 nm (Argon laser) and the emitted
fluorescence collected with a 560-615 nm bandpass filter. Confocal image time series of
1,024 × 1,024 pixel resolution were captured over 100 frames with a corresponding pixel
dwell time of 6.4 microseconds. In-house RICS software (ManICS) was applied to analysis
of images acquired using confocal microscopy. A full description of the RICS algorithm has
been described elsewhere.27,39
The aforementioned image time series were sub-divided into
32x32 pixels region of interest (ROI) and the diffusion coefficients (D) within each ROI was
generated (Figure 3.1a). All fits possessing a R2 below 0.7 were discarded from the fit data
prior to generation of particle size distributions (explanation can be seen in Appendix 2,
A2.1).

92
RICS-derived diffusion coefficients were subsequently converted to particle diameter using
the Stoke-Einstein equation (following determination of solvent viscosity):
𝐷 = 𝑘𝑇 3𝜋𝜂𝑎⁄ Equation 3.1
Where D refers to the diffusion coefficient, k refers to the Boltzmann constant, T the
temperature at which the measurements were performed, η solvent viscosity and a the
hydrodynamic diameter.
3.3.2.3 Resonant Mass Measurement (RMM)
Particle size analysis using RMM is based on frequency shifts that are proportional to particle
buoyant mass, and depend on the sensitivity of a resonator 40
. An Archimedes system
(Malvern, UK) was utilised for RMM of positively- (silicone oil droplets) and negatively-
buoyant (protein aggregates) particles. Both the nano and micro sensor were utilised for all
solutions. The limit of detection (LOD) was set at 0.01 Hz (corresponding to 0.07 µm for
protein particles and 0.17 m for silicone oil particles) and 0.03 Hz (corresponding to 0.33
µm for protein particles and 0.68 m for silicone oil particles) for the nano and micro
sensors, respectively. System set-up and cleaning procedures are described by the
manufacturer and elsewhere.13,35
3.3.2.4 Micro-flow Imaging (MFI) Analysis
MFI analysis was performed using a Protein Simple MFI 5000 series (Protein Simple,
California, USA). Millipore filtered pure water and particle-free buffer (5 mL) was purged
through the system to remove residual particles prior to measurements and reduce the
baseline prior to data acquisition for each sample. Subsequently, the sample was introduced
at a flow rate of 0.5 mL/min, the illumination optimized and 0.5 mL of sample analysed at a
corresponding flow rate of 0.1 mL/min. Bright-field images, morphometric (i.e. equivalent
circle diameter (ECD) and aspect ratio) and particle data obtained from the analysis of
agitated and non-agitated samples were subjected to analysis of particle counts, morphology
and size distribution.
A customised filter was adapted from previous studies40,41
and applied to differentiate
between silicone oil and proteinaceous particles using Origin 2016 (OriginLab Corporation,
Northampton, MA, USA). MFI data obtained from solutions containing silicone oil only or
COE-08 aggregates only were utilised to create a customised discriminant analysis filter
based on four MFI parameters: aspect ratio, intensity mean, intensity minimum and intensity
standard deviation (cf. Sharma et al.42
). Discriminant analysis uses known sample to build a
model that can aid data stratification through establishing particle identity (i.e. COE-08 or

93
silicone oil). The analysis was applied to each MFI-generated dataset. To set the mAb
standard during development of the customised filter, an aliquot of COE-08 in buffer was
subjected to agitation via end-over-end rotation (for 24 hours) in de-siliconized syringes.
3.3.2.5 Statistical Analysis
Unless otherwise stated, a non-parametric one-way ANOVA was performed to assess the
influence of stress type on resultant size distribution/particle counts. A calculated probability
(i.e. p-value) equal or less than 0.05 was considered to be statistically significant.
3.4 Results
The formation of protein aggregates and silicone oil droplets in PFS, in the presence and
absence of agitation stress, was evaluated as a function of PS-20 concentration (0, 0.02 and
0.05% w/v). MFI, RMM and RICS were utilized, as described in the methods, to selectively
evaluate protein aggregate formation and silicone oil sloughing, over the broadest size range.
For each technique, the particle counts were separated, where applicable, into size ranges of
(i) < 0.07 m (RICS only), (ii) 0.07-0.5 m (RICS and RMM), (iii) 0.5-5 m (RICS, RMM
and MFI; with MFI only detecting particles > 1 m), and (iv) > 5 m (RICS, RMM and
MFI). The size ranges were chosen with respect to the RMM nano sensor analytical range of
0.07-0.5 m.
3.4.1 Fluorescent dye selection for proteinaceous aggregates and silicone oil
droplets for RICS analysis
Since confocal microscopy and RICS analysis rely on fluorophores, RICS may distinguish
between particles originating from different materials (in this case, protein vs silicone oil)
provided a dye with relevant physicochemical properties is selected. SYPRO® Red was
previously used to label protein aggregates in simple formulations.28
In this study, SYPRO®
Red was used to label protein aggregates in more complex formulations (i.e. in the presence
of silicone oil and / or surfactant micelles).
Micrographs (Figure 3.1b) suggested no apparent labelling of silicone oil and / or PS-20
micelles by SYPRO® Red that would interfere with the data obtained from labelled protein
aggregates. Moreover, following RICS analysis, the images acquired of buffer-only PFS
solutions (i.e. in absence of mAb), did not generate any conclusive data as an insufficient
correlation (with R2 < 0.7) was obtained. This result indicated the significantly higher affinity
of SYPRO® Red for proteinaceous aggregates compared to silicone oil droplets and/or PS-20
micelles.
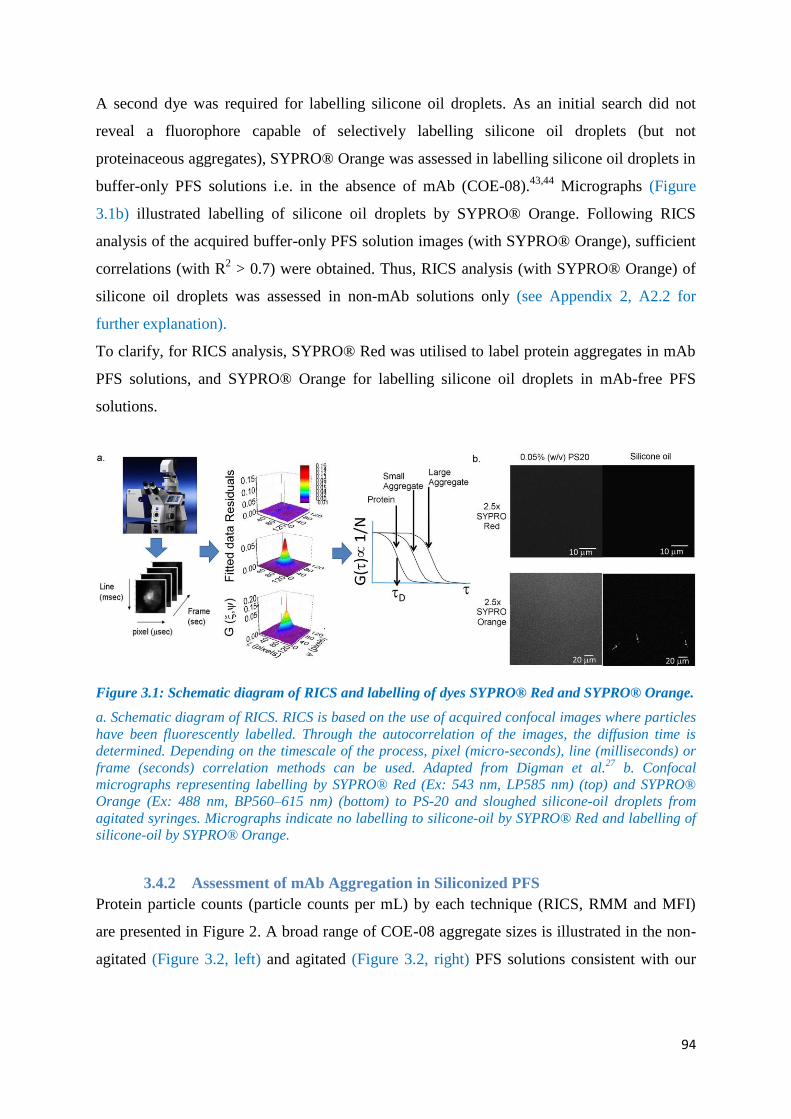
94
A second dye was required for labelling silicone oil droplets. As an initial search did not
reveal a fluorophore capable of selectively labelling silicone oil droplets (but not
proteinaceous aggregates), SYPRO® Orange was assessed in labelling silicone oil droplets in
buffer-only PFS solutions i.e. in the absence of mAb (COE-08).43,44
Micrographs (Figure
3.1b) illustrated labelling of silicone oil droplets by SYPRO® Orange. Following RICS
analysis of the acquired buffer-only PFS solution images (with SYPRO® Orange), sufficient
correlations (with R2 > 0.7) were obtained. Thus, RICS analysis (with SYPRO® Orange) of
silicone oil droplets was assessed in non-mAb solutions only (see Appendix 2, A2.2 for
further explanation).
To clarify, for RICS analysis, SYPRO® Red was utilised to label protein aggregates in mAb
PFS solutions, and SYPRO® Orange for labelling silicone oil droplets in mAb-free PFS
solutions.
Figure 3.1: Schematic diagram of RICS and labelling of dyes SYPRO® Red and SYPRO® Orange.
a. Schematic diagram of RICS. RICS is based on the use of acquired confocal images where particles
have been fluorescently labelled. Through the autocorrelation of the images, the diffusion time is
determined. Depending on the timescale of the process, pixel (micro-seconds), line (milliseconds) or
frame (seconds) correlation methods can be used. Adapted from Digman et al.27
b. Confocal
micrographs representing labelling by SYPRO® Red (Ex: 543 nm, LP585 nm) (top) and SYPRO®
Orange (Ex: 488 nm, BP560–615 nm) (bottom) to PS-20 and sloughed silicone-oil droplets from
agitated syringes. Micrographs indicate no labelling to silicone-oil by SYPRO® Red and labelling of
silicone-oil by SYPRO® Orange.
3.4.2 Assessment of mAb Aggregation in Siliconized PFS
Protein particle counts (particle counts per mL) by each technique (RICS, RMM and MFI)
are presented in Figure 2. A broad range of COE-08 aggregate sizes is illustrated in the non-
agitated (Figure 3.2, left) and agitated (Figure 3.2, right) PFS solutions consistent with our

95
previous work.28
The size distributions of the protein particles, clearly showing the outliers,
can be seen in the SI (Appendix 2, A2.3).
When assessing the particle profiles of the three techniques (Figure 3.2), complementary is
observed in relation to (i) higher aggregate counts in the absence of PS-20 following agitation
and (ii) the greater presence of smaller particles: significantly higher (p < 0.05) absolute
aggregate counts were measured in agitated PFS solutions in the absence of PS-20, by all
three techniques. An overall assessment of the separated particle size ranges indicates that the
larger the particle size, the smaller the observed particle count will be (a typical trend already
found in aggregate solutions).20,45
In relation to this assessment, the two main observations
were, (i) significantly lower absolute particle concentrations (particles per mL) detected by
MFI in comparison to RMM, for all PFS solutions (approximately three orders of magnitude)
and (ii) the higher absolute aggregate counts in the 0% w/v PS-20 agitated samples were due
to the significantly higher particle counts (p < 0.05) in the 0.5–5 m size range by MFI and
significantly higher particle counts (p < 0.01) in the 0.07–0.5 m size range by RMM and
RICS.
Additionally, when assessing the particle size ranges across the three techniques, a pattern is
observed when considering each technique’s analytical capability, the sampled volume, and
the trend of low incidence of larger particles. MFI utilises the largest sampled volume and
detected particles > 5 m in all PFS solutions. By RICS and RMM, only the 0% w/v PS-20
agitated PFS solutions contained particles larger than 5 m in diameter. The same sample
when analysed by MFI contained the highest particle concentration in the > 5 m size range.
Similarly, by RICS only the agitated solutions contained particles in the 0.5-5 m size range;
and the same samples contained higher particle counts by RMM and MFI, in comparison to
the non-agitated solutions (Figure 3.2).

96
Fig
ure 3
.2: P
rotein
pa
rticle cou
nts in
mA
b P
FS
solu
tion
s mea
sure
d b
y RIC
S, R
MM
an
d M
FI.
Pro
tein p
article co
un
ts in m
Ab
PFS so
lutio
ns in
the p
resence a
nd
ab
sence o
f agita
tion
, as a
fun
ction
of P
S-20
con
centra
tion
(0%
, 0.02
% a
nd
0.0
5%
w/v). H
orizon
tal a
nd
vertical a
xis represen
ts pa
rticle cou
nts (p
article co
un
ts per m
L) determ
ined
by R
ICS, R
MM
an
d M
FI for size ra
ng
es (i) <0.07
m
, (ii)
0.0
7–
0.5
m
, (iii) 0.5–5
m
an
d (iv) >5
m
. Axis sca
le varies p
er techn
iqu
e to ea
se visua
lisatio
n of d
ata
. Va
lues represen
t avera
ge co
un
ts an
d error
ba
rs represen
t the std
. dev. fo
r n = 3
.

97
3.4.3 Characterisation of Dispersed Silicone oil in PFS
3.4.3.1 Silicone oil Droplets in PFS Containing Buffer Only (no mAb)
Dispersed silicone oil droplets in buffer-filled non-agitated and agitated PFS solutions, in the
presence of 0, 0.02 and 0.05% w/v PS-20, were characterized by RMM, RICS and MFI as
described in the methods. Silicone oil droplet counts are presented in Figure 3.3 and the size
distributions can be seen in the SI (Appendix 2, A2.3).
It is observed that the presence of PS-20 resulted in significantly higher total droplet counts
(p < 0.05), for non-agitated and agitated PFS solutions (Figure 3.3). This is an interesting
outcome as the PS-20 solutions had the lowest protein aggregate counts, as seen in Figure
3.2. The results illustrate that PS-20 had a more dominant effect than agitation in the
sloughing of silicone oil in PFS.
Similarly to the mAb profiles, higher concentrations of smaller sized oil droplets are detected
by all three techniques (Figure 3.3), for all solutions. The smaller size ranges for RMM (i.e.
0.07-0.5 m) and RICS (< 0.07 and 0.07-0.5 m) detected significantly higher oil droplet
counts (p < 0.05) in the presence of PS-20 (non-agitated and agitated solutions). Larger
silicone oil droplets i.e. > 5 m, detected by MFI, were also greater in presence in PS-20
agitated samples.
As with the mAb data in Figure 3.2, the differences in sampled volumes across the techniques
and the low incidence of larger particles may explain the results in the overlapping size
ranges. For example, RMM only measured particles larger than 5m in the 0.05% w/v PS-20
PFS solutions (non-agitated and agitated). RICS detected silicone oil particles in the 0.5–5
m size range in the presence of PS-20 (0.02 and 0.05% w/v) or following agitation, and only
detected silicone oil particles larger than 5 m in the 0.05% w/v PS-20 agitated solutions
(Figure 3.3).

98
Fig
ure 3
.3: S
ilicon
e oil d
rop
let cou
nts in
bu
ffer-filled P
FS
solu
tion
s mea
sure
d b
y RIC
S, R
MM
an
d M
FI.
Silicon
e oil d
rop
let cou
nts in
bu
ffer-filled P
FS solu
tion
s, in th
e presen
ce an
d a
bsen
ce of a
gita
tion
, as a
fun
ction
of P
S-20
con
centra
tion
(0%
, 0.0
2% a
nd
0
.05
% w
/v). Ho
rizon
tal a
nd
vertical a
xis represen
ts pa
rticle cou
nts (p
article co
un
ts per m
L) determ
ined
by R
ICS, R
MM
an
d M
FI for size ra
ng
es (i) <0.07
m
, (ii) 0.07
–0.5
m
, (iii) 0.5–
5
m a
nd
(iv) >5
m. A
xis scale varies p
er techn
ique to
ease visu
alisa
tion
of d
ata
. Va
lues rep
resent a
verag
e cou
nts a
nd
erro
r ba
rs represen
t the std
. dev. fo
r n = 3
.

99
3.4.3.2 RMM and MFI Characterisation of Silicone oil Droplets in mAb PFS
Samples
Silicone oil droplet counts in the mAb PFS solutions were determined by RMM and MFI
(distinguishing between proteinaceous particles and silicone oil droplets as described in the
methods) and are presented in Figure 3.4. The silicone oil size distributions can be seen in
the SI (Appendix 2, A2.3).
Both RMM and MFI showed a greater concentration of larger silicone oil droplets in the
presence of PS-20 following agitation (PS-20 concentration dependant): similar to the buffer-
filled PFS data (Figure 3.3), the only solutions containing particles larger than 5 m by RMM
were in the presence of PS-20. Following agitation, MFI detected a higher concentration of
particles larger than 5 m in the PS-20 samples. Conversely, unlike RMM, MFI data showed
differences in silicone oil droplet counts between the mAb PFS (Figure 3.4) and buffer-only
PFS solutions (Figure 3.3): significantly higher total droplet counts were observed in the 0%
w/v PS-20 agitated mAb PFS solutions (Figure 3.4). Particle size separation showed this was
due to the significantly higher particle counts in the 0.5-5 m size range (p < 0.01).
It is important to note that differentiation of protein and silicone oil particles with MFI
proved problematic; even with the use of the discriminant analysis described in the methods.
This is a problem observed in previous papers due to optical similarities between protein and
silicone oil particles with a diameter less than 4m.17,46
Table 3.2 presents the (apparent)
protein concentrations in buffer-only (i.e. mAb-free) PFS solutions determined by MFI,
following discriminant analysis. The apparent protein concentrations determined for the non-
agitated and agitated PFS solutions were above the background count limit of the MFI system
i.e. the threshold for a clean run of water (determined as 200 particles per mL). Thus, particle
differentiation issues between protein and silicone oil following discriminant-analysis are
indicated. This result is exacerbated for particle numbers in the lower size range, i.e. 0.5- 5
m; as the concentration for particles > 5 m is less than the background limit, unlike the
0.5-5 m size range. Thus it is possible that the (apparent) higher silicone oil particles per mL
in the 0% (w/v) PS-20 (mAb PFS) agitated solutions (Figure 3.4) could be a result of particle
differentiation issues between protein and silicone oil in the lower MFI size-range in this
study (i.e. 0.5-5 m).

100
Table 3.2: Measured protein concentrations in buffer-filled PFS solutions determined by MFI.
Measured protein concentrations in buffer-filled PFS solutions determined by MFI (following
discriminant analysis). Values represent averages with std. dev. for n=3.
Solution Total (1-10 m) 1-5 m > 5 m
Buffer in PFS Non-Agitated 1796 ± 393 1711 ± 380 85 ± 27
Buffer in PFS Agitated 4133 ± 313 4004 ± 370 129 ± 57

101
Fig
ure 3
.4: S
ilicon
e oil d
rop
let cou
nts in
mA
b P
FS
solu
tion
mea
sure
d b
y RM
M a
nd M
FI.
Silicon
e oil d
rop
let cou
nts in
mA
b P
FS solu
tion
s, in th
e presen
ce an
d a
bsen
ce of a
gita
tion
, as a
fun
ction
of P
S-20
con
centra
tion
(0%, 0
.02%
an
d 0
.05%
w/v). H
orizo
nta
l an
d vertica
l axis rep
resents p
article co
un
ts (pa
rticle cou
nts p
er mL) d
etermin
ed b
y RM
M an
d M
FI for size ra
ng
es (i) < 0.0
7
m, (ii)
0.0
7–
0.5
m
, (iii) 0.5–
5
m a
nd
(iv) >5
m. A
xis scale va
ries per tech
niq
ue to
ease visu
alisa
tion
of d
ata
. Va
lues rep
resent a
verag
e coun
ts an
d erro
r b
ars rep
resent th
e std. d
ev. for n
= 3.

102
3.5 Discussion
3.5.1 Considerations Regarding the Different Techniques
The information gained from the various commercially-available particle metrology
technologies has recently been subjected to considerable discussion, as highlighted by Ripple
and Dimitrova47
and Quiroz et al.26
Common to all techniques extrapolating data obtained
from small sample volumes or in dilute samples, is the uncertainty in particle-size data
approaching the technique detection limit. The substantial differences in sampled volumes
across the three techniques in the present study: RICS (~2 x 10⁻⁹
mL) < RMM (~4 x 10⁻⁶
mL
and ~1 x 10⁻⁴
mL by the nano and micro sensors, respectively) < MFI (3 x 10⁻¹
mL), may
explain the differences observed in the data in the overlapping size ranges between the
techniques. Low sampled volumes reduce the likelihood of detecting larger particles present
in low concentrations.24
On the other hand, a significant sample volume is required to
generate statistically significant particle counts per dose unit. Consequently, the argument for
poor precision of new techniques in favour of light obscuration is debatable since all
techniques are known to suffer from caveats. For example, in the case of light obscuration
method HIAC (high accuracy liquid particle counter) and MFI, both of which are optical-
based particle counting techniques, the techniques are influenced by the refractive index
difference between protein particles and the formulation. As highlighted by Ripple and Hu48
and Zölls et al,46
the change in refractive index at higher concentrations has led to the
underestimation of particle concentrations. Hence, although novel and emerging techniques
may not be appropriate for quality control in their current state, they are capable of
monitoring the early stages of aggregation, require minimal sample volume and are therefore
directly relevant to early stages of formulation development. Thus the main focus of the
present work was to assess the presence of particulates that may not be easily detected by
light obscuration or MFI i.e. in the submicron size range and smaller. This manuscript
compares the particle trends / concentrations across MFI, RMM (micro and nano sensor) and
RICS.
MFI has received much attention in the analysis of large protein particles (i.e. >1 m)42,49,50
as the volume and the size-range matches regulations; in regards to their morphology, and
recently in differentiating between protein and silicone oil particles using customised
filters.13,41
The discriminant analysis used in this study is based on certain particle parameters
relating to apparent optical properties and circularity (aspect ratio, intensity mean, intensity
minimum and intensity standard deviation), devised by Weinbuch et al.13
However, due to

103
some optical similarities between mAb and silicone oil, the reliability of this analysis has
previously been questioned for particles < 4m.13,17,46
Supporting previous literature, this
study observed a significant apparent presence of COE-08 particles above the background
count limit in mAb-free PFS solutions (Table 3.2). The misclassification error with MFI may
offer some explanations for the possible effects observed in the 0.5-5 m size range in this
study i.e. accounting for the higher oil droplet concentration in the 0% w/v PS-20 agitated
solutions in Figure 3.4, which is inconsistent with other data-sets. Thereby, for mixed
solutions (i.e. protein and silicone oil), it is recommended to utilise MFI alongside another
method possessing an overlapping size range (covering 1-5 m) and also capable of particle
differentiation i.e. RMM.13,17
Overall, results from the current study are consistent with previous reports showing
complementarity between RMM and MFI13
(Figure 3.2 for protein aggregates, and Figures
3.3-3.4 for silicone oil droplets). This is true when accounting for the strong dependence
between number of particles and their sizes,26,45
wherin a significantly greater aggregate count
in the lower sub-visible size range was measured following and prior to agitation in PFS.
Through the use of the RMM nano sensor and RICS, the smaller-sized aggregate population
was analysed, detecting particles < 0.5 m in diameter. There are limited published reports on
the use of RMM,13,46,51
and to our knowledge, this is the first study reporting the use of both
RMM sensors on the same solutions. A careful observation of size ranges detected by RMM
micro and nano sensors (shown in Appendix 2, A2.3) revealed uncertainties regarding the use
of both detectors. While the size ranges of the nano and micro sensors are intended to
overlap, an overlap of particle sizes is not always observed, raising questions about the
likelihood of detecting poorly-populated larger particles in the small sampled volume. The
same observation was found in the silicone oil data acquired by RMM (Appendix 2, A2.3).
It is noteworthy that RMM exploits the differences in density to distinguish between particles
but requires the use of both the nano and micro sensors to cover a broad size range, which
increases measurement time and sample consumption. Furthermore, RMM has particle
concentration limits, accruing errors for samples with low particle counts,13
but also for
samples with particle counts > 2×10⁶ particles/mL where there is a risk of high coincidence
and dilution is required.51,52
Concentration limits appear to be a downfall for many
technologies characterising in the lower size range. For example, Nano-Particle Tracking
Analysis (NTA), which also has the ability of particle differentiation through using
fluorescence, has similar concentration limits to RMM. The combined effect of adsorption

104
(from contact with glass and stainless steel during measurement) and sheer (during injection)
has also been reported to create aggregates.53,54
With regard to RICS, the main challenge was the selection of an appropriate dye. In this
study, the selectivity of SYPRO® Red for protein aggregates was demonstrated, with
SYPRO® Orange labelling both protein aggregates43,55,56
and silicone oil droplets (Figure
3.1). When using RICS, fluorescent dye selection should be considered on a case-by-case
basis. However, following the selection of the fluorophore, no change of detector was
required and the trends for particle size and concentration observed with RMM were
consistent with those observed by RICS.
It should be mentioned that comparison of particle concentrations from MFI, RMM or RICS
data needs consideration due to fundamental differences in measurement between these
techniques. MFI and RMM both use flow that can potentially bias the movement of
particulates such that particles are counted within a certain sampled volume. With the present
settings, RICS detects a number of particles in the focal volume of the objective, but particles
moving by Brownian motion may cross this focal volume more than once. Indeed, Figures
3.2 and 3.3 suggest higher particle counts than those determined by RMM and MFI. Thus, in
the current setting, direct comparison of particle counts between RMM, MFI vs RICS cannot
be made. It is foreseen that microfluidics may be of use with RICS; Rossow et al. have
demonstrated the use of RICS in the presence of flow.57
It is important to consider the uncertainties carried by different technologies, especially when
comparing the acquired data-sets across multiple techniques. Nevertheless, considering all of
the above points, the trends across the three techniques i.e. the effect of agitation and the
presence of PS-20 on aggregation formation vs the dispersion of silicone oil droplets in the
PFS solutions, are the same.
3.5.2 Agitation in Siliconized PFS Increases Aggregation Formation
All samples containing 0% w/v PS-20 contained a significantly larger aggregate count
following agitation, which is consistent with the widely known effect that agitation has on
protein solutions sheared at the air-water interface.34,58
Due to the increased use of PFS in fill-
finish manufacturing, it is important to understand the impact of siliconized syringes on the
stability of formulated mAb during storage and transport in the presence or absence of
agitation. Previous literature indicate that the presence of silicone oil can result in aggregation
increase following agitation; the effect being silicone oil concentration dependant.32
Other

105
studies have indicated that silicone oil itself i.e. in the absence of an additional stress such as
agitation, does not impact aggregation formation.5,7
In this study, silicone oil droplets and aggregated protein were detected in all mAb-filled
(COE-08) PFS solutions (Figure 3.2 for aggregates and Figure 3.4 for silicone oil). As the
PS-20 solutions contained the lowest aggregate counts (Figure 3.2) whilst containing the
highest silicone oil droplet counts (Figures 3.3-3.4), no correlation between protein
aggregation and silicone oil droplet presence was observed. Based on this, and previous
literature, it may be that the effect of silicone oil on mAb stability is a case by case basis.
Considering the surface-active properties of PS-20, the observed increase of silicone oil
droplets generated in PS-20 samples (Figure 3.3) was consistent with previous reports.36
This
observation needs to be tempered against the imaging method used for RICS which relies on
inverted microscopy of a small sample volume within a narrowly-defined plane of focus
across which droplets move by Brownian motion and by virtue of their density relative to the
bulk. Here, we have assumed that PS-20 stabilised silicone oil droplets in solution,9 and
silicone oil droplets in the absence of PS-20 have the same density and are therefore
positively buoyant in aqueous solution. Nevertheless, silicone oil extracted from the surface
by PS-20 appears to increase the number of droplets in the micrometre region (‘outliers’
observed in Appendix 2, A2.3).
There is another explanation which requires consideration in regards to the higher
concentration of droplets measured in PS-20 samples. As discussed, solutions with PS-20 had
a greater presence of small-sized silicone-oil droplets. PS-20 has been shown in the literature
to affect droplet stability; slowing droplet association. Based on this, in absence of PS-20 a
higher concentration of larger droplets would be expected. As a consequence, in the absence
of PS-20, the sloughed droplets may be too large to be detected by the techniques (i.e.
droplets in the micro range)5 – specifically RMM and RICS. However, MFI has the capability
of detecting very large droplets (> 100 m59
) and a higher concentration of large droplets (i.e.
< 5m) is not observed in the absence of PS-20 (Figure 3.3).
3.5.3 PS-20 limits the Formation of Aggregates in Siliconized PFS following
Agitation
Agitated PFS solutions in the absence of PS-20 generated the highest protein aggregate
counts following agitation (Figure 3.2). More so, the presence of PS-20 reduced the protein
particle counts to their respective baselines, i.e. the counts in non-agitated solutions for the
same PS-20 concentration. RICS and RMM showed that PS-20 significantly reduced small

106
sub-visible aggregates, while MFI showed that PS-20 limited the development of larger
aggregates (Figure 3.2). A number of studies have attempted to explain the protective
mechanisms of polysorbates in preventing aggregation (see Khan et al34
). The predominant
mechanism is assumed to be adsorption competition between the surfactant and the protein at
the air/liquid (or glass/liquid) interface. As a result, adsorption-denaturation of the protein at
these interfaces is attenuated.5,34,60
A further suggestion is that surfactant molecules may form
micelles (at concentrations above the critical micelle concentration) that shield exposed
protein hydrophobic surfaces, assuming partial or complete denaturation, and attenuate
protein-protein interactions.61,62
Protein destabilising effects in increasing polysorbate concentrations have been observed in
other studies.33,63
In this study, no significant differences in aggregate formation were
observed between the two PS-20 concentrations (Figure 3.2), although a higher concentration
of silicone oil droplets is observed in the 0.05% w/v concentration (Figures 3.3-3.4).
Nevertheless, determining the optimal polysorbate concentration for a specific mAb
formulation must be accounted for during formulation development.
It should be noted that, alongside the use and assessment of the technologies, the novelty of
this study is the assessment of agitation-induced protein aggregation development with the
effect of (i) silicone oil sloughing and (ii) PS-20. Previous literature either assesses one factor
only (i.e. PS-20 inhibition of agitation-induced aggregation) or applies the method of spiking
studies; and not siliconized PFS. Thus the approach of this study is more representative of a
pharmaceutical formulation subjected to transport stress, and also allowed direct assessment
of silicone oil sloughed droplets and agitation-induced aggregation – which in this case,
showed no relation between the two.
3.6 Conclusions
All three techniques demonstrated that the presence of PS-20 in mAb solutions contributes to
a significant reduction in proteinaceous aggregates following agitation, consistent with the
surfactant activity of PS-20. Comparison of the data sets imply that there is no interplay
between the sloughing of silicone oil droplets in PFS and the exacerbation of protein
aggregate formation in the sub-visible size range. While advanced particle characterisation
technologies are available to the formulation scientist, it is still the case that this is a
challenging area and emerging methods, while welcomed, may not have yet achieved the
expected capability of bridging the current sizing ‘gap’ for sub-visible particles.

107
Nevertheless, our data show that they provide complementary information and support
methods such as MFI. This study demonstrates that RICS analysis may expand the scope for
sub-visible particle sizing/characterisation and is an orthogonal technique to RMM. Since
confocal microscopy is well established, RICS offers the potential for widespread application
in laboratories where specialist equipment may not be available.
3.7 Acknowledgements
MS was supported by a Biotechnology and Biological Sciences Research Council (BBSRC)
‘BRIC’ studentship with MedImmune Ltd.

108
3.8 References
1. Prefilled Syringes Market (Glass and Plastic) - Global Industry Analysis, Size,
Volume, Share, Growth, Trends and Forecast [Internet]. Transparency Market Research.
Available from: https://www.prnewswire.com/news-releases/prefilled-syringes-market-glass-
and-plastic---global-industry-analysis-size-volume-share-growth-trends-and-forecast-2013---
2019-238933921.html
2. The Future of Alliances and Partnerships in the Pre-filled Syringes Market to 2020
[Internet]. Smithers Rapra. Avilable from https://www.smithersrapra.com/market-
reports/medical-industry-market-reports/the-future-of-alliances-and-partnerships-in-the-pr
3. Condino AAF, Hoffenberg S, Edward J 2005. A Home Infliximab Infusion Program.
Journal of Pediatric Gastroenterology and Nutrition 40(1):67-69.
4. Baldwin RN 1988. Contamination of Insulin by Silicone Oil: a Potential Hazard of
Plastic Insulin Syringes. Diabetic Medicine 5(8):789-790.
5. Thirumangalathu R, Krishnan S, Ricci MS, Brems DN, Randolph TW, Carpenter JF
2009. Silicone oil- and agitation-induced aggregation of a monoclonal antibody in aqueous
solution. Journal of Pharmaceutical Sciences 98(9):3167-3181.
6. Shi L, Ladizhansky V 2012. Magic angle spinning solid-state NMR experiments for
structural characterization of proteins. Methods in Molecular Biology 895(1):153-165.
7. Gerhardt A, McGraw NR, Schwartz DK, Bee JS, Carpenter JF, Randolph TW 2014.
Protein Aggregation and Particle Formation in Prefilled Glass Syringes. Journal of
Pharmaceutical Sciences 103(6):1601-1612.
8. Majumdar S, Ford BM, Mar KD, Sullivan VJ, Ulrich RG, D'Souza AJM 2011.
Evaluation of the effect of syringe surfaces on protein formulations. Journal of
Pharmaceutical Sciences 100(7):2563-2573.
9. Ludwig DB, Carpenter JF, Hamel JB, Randolph TW 2010. Protein adsorption and
excipient effects on kinetic stability of silicone oil emulsions. Journal of Pharmaceutical
Sciences 99(4):1721-1733.
10. Basu P, Krishnan S, Thirumangalathu R, Randolph TW, Carpenter JF 2013. IgG1
aggregation and particle formation induced by silicone-water interfaces on siliconized
borosilicate glass beads: A model for siliconized primary containers. Journal of
Pharmaceutical Sciences 102(3):852-865.
11. Philo JS 2006. Is any measurement method optimal for all aggregate sizes and types?
The American Association of Pharmaceutical Scientists Journal 8(3):564-571.
12. Philo JS, Arakawa T 2009. Mechanisms of protein aggregation. Current
Pharmaceutical Biotechnology 10(4):348-351.
13. Weinbuch D, Zölls S, Wiggenhorn M, Friess W, Winter G, Jiskoot W, Hawe A 2013.
Micro–flow imaging and resonant mass measurement (archimedes) – complementary
methods to quantitatively differentiate protein particles and silicone oil droplets. Journal of
Pharmaceutical Sciences 102(7):2152-2165.
14. Ludwig DB, Trotter JT, Gabrielson JP, Carpenter JF, Randolph TW 2011. Flow
cytometry: A promising technique for the study of silicone oil-induced particulate formation
in protein formulations. Analytical Biochemistry 410(2):191-199.
15. <788> Particulate Matter in Injections [Internet]. U.S. Pharmacopeia. Available from
http://www.pharmacopeia.cn/v29240/usp29nf24s0_c788.html
16. <787> Subvisible particulate matter in therapeutic protein injections. U.S
Pharmacopeia. Available from: http://pssnicomp.com/applications/parenterals/usp-subvisible-
particulate-matter-in-therapeutic-protein-injections/
17. Zolls S, Tantipolphan R, Wiggenhorn M, Winter G, Jiskoot W, Friess W, Hawe A
2012. Particles in therapeutic protein formulations, Part 1: Overview of analytical methods.
Journal of Pharmaceutical Sciences 101(3):914-935.
109
18. Sharma DK, King D, Oma P, Merchant C 2010. Micro-Flow Imaging: Flow
Microscopy Applied to Sub-visible Particulate Analysis in Protein Formulations. The
American Association of Pharmaceutical Scientists Journal 12(3):455-464.
19. Carpenter JF, Randolph TW, Jiskoot W, Crommelin DJA, Russell Middaugh C,
Winter G, Fan Y-X, Kirshner S, Verthelyi D, Kozlowski S, Clouse KA, Swann PG,
Rosenberg A, Cherney B 2009. Overlooking Subvisible Particles in Therapeutic Protein
Products: Gaps That May Compromise Product Quality. Journal of Pharmaceutical Sciences
98(4):1201-1205.
20. Singh SK, Afonina N, Awwad M, Bechtold-Peters K, Blue JT, Chou D, Cromwell M,
Krause H-J, Mahler H-C, Meyer BK, Narhi L, Nesta DP, Spitznagel T 2010. An Industry
Perspective on the Monitoring of Subvisible Particles as a Quality Attribute for Protein
Therapeutics. Journal of Pharmaceutical Sciences 99(8):3302-3321.
21. Singh SK 2013. Particulate Matter in Sterile Parenteral Products. Sterile Product
Development: Formulation, Process, Quality and Regulatory Considerations. New York:
Springer New York.
22. Pharmacopeia [Internet]. The United States Pharmacopeial. Available from:
http://app.uspnf.com/uspnf/
23. Gross J, Sayle S, Karow AR, Bakowsky U, Garidel P 2016. Nanoparticle tracking
analysis of particle size and concentration detection in suspensions of polymer and protein
samples: Influence of experimental and data evaluation parameters. European Journal of
Pharmaceutics and Biopharmaceutics 104(1):30-41.
24. Quiroz ARJL, Da Cunha T, Boillon A, Adler M, Finkler C, Huwyler J, Schmidt R,
Mahler HC, Koulov AV 2015. Factors Governing the Precision of Subvisible Particle
Measurement Methods – A Case Study with a Low-Concentration Therapeutic Protein
Product in a Prefilled Syringe. Pharmaceutical Research 33(2):450-461.
25. Narhi LO, Schmit J, Bechtold-Peters K, Sharma D 2012. Classification of Protein
Aggregates1. Journal of Pharmaceutical Sciences 101(2):493-498.
26. Ríos Quiroz A, Lamerz J, Cunha T, Boillon A, Adler M, Finkler C, Huwyler J,
Schmidt R, Mahler H-C, Koulov AV 2015. Factors Governing the Precision of Subvisible
Particle Measurement Methods – A Case Study with a Low-Concentration Therapeutic
Protein Product in a Prefilled Syringe. Pharmaceutical Research 33(2):450-461.
27. Digman MA, Brown CM, Sengupta P, Wiseman PW, Horwitz AR, Gratton E 2005.
Measuring Fast Dynamics in Solutions and Cells with a Laser Scanning Microscope.
Biophysical Journal 89(2):1317-1327.
28. Hamrang Z, Hussain M, Tingey K, Tracka M, Casas-Finet JR, Uddin S, van der Walle
CF, Pluen A 2015. Characterisation of Stress-Induced Aggregate Size Distributions and
Morphological Changes of a Bi-Specific Antibody Using Orthogonal Techniques. Journal of
Pharmaceutical Sciences 104(8):2473-2481.
29. Waxman L, Vilivalam V 2011. Evaluation of end-over-end rotation/agitation of
protein solutions in prefilled syringes made from glass or plastic as a preliminary indicator of
protein aggregation. Protein Stability Conference. Colorado, US: University of Colorado
Center for Pharmaceutical Biotechnology.
30. Morris AM, Watzky MA, Finke RG 2009. Protein aggregation kinetics, mechanism,
and curve-fitting: A review of the literature. Biochimica et Biophysica Acta (BBA) - Proteins
and Proteomics 1794(3):375-397.
31. Li Y, Mach H, Blue JT 2011. High throughput formulation screening for global
aggregation behaviors of three monoclonal antibodies. Journal of Pharmaceutical Sciences
100(6):2120-2135.
32. Jones LS, Kaufmann A, Middaugh CR 2005. Silicone Oil Induced Aggregation of
Proteins. Journal of Pharmaceutical Sciences 94(4):918-927.
110
33. Agarkhed M, O’Dell C, Hsieh M-C, Zhang J, Goldstein J, Srivastava A 2013. Effect
of Polysorbate 80 Concentration on Thermal and Photostability of a Monoclonal Antibody.
American Association of Pharmaceutical Scientists 14(1):1-9.
34. Khan TA, Mahler H-C, Kishore RSK 2015. Key interactions of surfactants in
therapeutic protein formulations: A review. European Journal of Pharmaceutics and
Biopharmaceutics 97(1):60-67.
35. Depaz RA, Chevolleau T, Jouffray S, Narwal R, Dimitrova MN 2014. Cross-Linked
Silicone Coating: A Novel Prefilled Syringe Technology That Reduces Subvisible Particles
and Maintains Compatibility with Biologics. Journal of Pharmaceutical Sciences
103(5):1384-1393.
36. Felsovalyi F, Janvier S, Jouffray S, Soukiassian H, Mangiagalli P 2012. Silicone-Oil-
Based Subvisible Particles: Their Detection, Interactions, and Regulation in Prefilled
Container Closure Systems for Biopharmaceuticals. Journal of Pharmaceutical Sciences
101(12):4569-4583.
37. Teska BM, Brake JM, Tronto GS, Carpenter JF 2016. Aggregation and Particle
Formation of Therapeutic Proteins in Contact With a Novel Fluoropolymer Surface Versus
Siliconized Surfaces: Effects of Agitation in Vials and in Prefilled Syringes. Journal of
Pharmaceutical Sciences 105(7):2053-2065.
38. Krayukhina E, Tsumoto K, Uchiyama S, Fukui K 2015. Effects of Syringe Material
and Silicone Oil Lubrication on the Stability of Pharmaceutical Proteins. Journal of
Pharmaceutical Sciences 104(2):527-535.
39. Hamrang Z, Pluen A, Zindy E, Clarke D 2012. Raster image correlation spectroscopy
as a novel tool for the quantitative assessment of protein diffusional behaviour in solution.
Journal of Pharmaceutical Sciences 101(6):2082-2093.
40. Weinbuch D, Zoells S, Wiggenhorn M, Friess W, Winter G, Jiskoot W, Hawe A
2013. Micro-flow imaging and resonant mass measurement (archimedes) - complementary
methods to quantitatively differentiate protein particles and silicone oil droplets. Journal of
Pharmaceutical Sciences 102(7):2152-2165.
41. Strehl R, Rombach-Riegraf V, Diez M, Egodage K, Bluemel M, Jeschke M, Koulov
A 2012. Discrimination Between Silicone Oil Droplets and Protein Aggregates in
Biopharmaceuticals: A Novel Multiparametric Image Filter for Sub-visible Particles in
Microflow Imaging Analysis. Pharmaceutical Research 29(2):594-602.
42. Sharma DK, Oma P, Pollo MJ, Sukumar M 2010. Quantification and characterization
of subvisible proteinaceous particles in opalescent mAb Formulations Using Micro-Flow
Imaging. Journal of Pharmaceutical Sciences 99(6):2628-2642.
43. Nashine VC, Kroetsch AM, Sahin E, Zhou R, Adams ML 2013. Orthogonal High-
Throughput Thermal Scanning Method for Rank Ordering Protein Formulations. American
Association of Pharmaceutical Scientists 14(4):1360-1366.
44. Vedadi M, Arrowsmith CH, Allali-Hassani A, Senisterra G, Wasney GA 2010.
Biophysical characterization of recombinant proteins: A key to higher structural genomics
success. Journal of Structural Biology 172(1-2):107-119.
45. Ripple DC, Narhi LO 2015. Protein Particles (0.1 µm to 100 µm). State-of-the-Art
and Emerging Technologies for Therapeutic Monoclonal Antibody Characterization.
Washington, U.S: American Chemical Society.
46. Zölls S, Gregoritza M, Tantipolphan R, Wiggenhorn M, Winter G, Friess W, Hawe A
2013. How subvisible particles become invisible—relevance of the refractive index for
protein particle analysis. Journal of Pharmaceutical Sciences 102(5):1434-1446.
47. Ripple DC, Dimitrova MN 2012. Protein particles: What we know and what we do
not know. Journal of Pharmaceutical Sciences 101(10):3568-3579.

111
48. Ripple DC, Hu Z 2015. Correcting the Relative Bias of Light Obscuration and Flow
Imaging Particle Counters. Pharmaceutical Research 33(3):653-672.
49. Wuchner K, Büchler J, Spycher R, Dalmonte P, Volkin DB 2010. Development of a
microflow digital imaging assay to characterize protein particulates during storage of a high
concentration IgG1 monoclonal antibody formulation. Journal of Pharmaceutical Sciences
99(8):3343-3361.
50. Sharma D, King D, Oma P, Merchant C 2010. Micro-Flow Imaging: Flow
Microscopy Applied to Sub-visible Particulate Analysis in Protein Formulations. The
American Association of Pharmaceutical Scientists Journal 12(3):455-464.
51. Panchal J, Kotarek J, Marszal E, Topp EM 2014. Analyzing Subvisible Particles in
Protein Drug Products: a Comparison of Dynamic Light Scattering (DLS) and Resonant Mass
Measurement (RMM). The American Association of Pharmaceutical Scientists Journal
16(3):440-451.
52. Amin S, Barnett GV, Pathak JA, Roberts CJ, Sarangapani PS 2014. Protein
aggregation, particle formation, characterization & rheology. Current Opinion in Colloid
& Interface Science 19(5):438-449.
53. Funke S, Matilainen J, Nalenz H, Bechtold-Peters K, Mahler H-C, Friess W 2016.
Silicone Migration From Baked-on Silicone Layers. Particle Characterization in Placebo and
Protein Solutions. Journal of Pharmaceutical Sciences 105(12):3520-3531.
54. Filipe V, Hawe A, Jiskoot W 2010. Critical Evaluation of Nanoparticle Tracking
Analysis (NTA) by NanoSight for the Measurement of Nanoparticles and Protein Aggregates.
Pharmaceutical Research 27(5):796-810.
55. Goldberg DS, Bishop SM, Shah AU, Sathish HA 2011. Formulation development of
therapeutic monoclonal antibodies using high-throughput fluorescence and static light
scattering techniques: Role of conformational and colloidal stability. Journal of
Pharmaceutical Sciences 100(4):1306-1315.
56. He F, Phan DH, Hogan S, Bailey R, Becker GW, Narhi LO, Razinkov VI 2010.
Detection of IgG aggregation by a high throughput method based on extrinsic fluorescence.
Journal of Pharmaceutical Sciences 99(6):2598-2608.
57. Rossow M, Mantulin WW, Gratton E 2009. Spatiotemporal image correlation
spectroscopy measurements of flow demonstrated in microfluidic channels. Journal of
Biomedical Optics 14(2):24014-24017.
58. Treuheit M, Kosky A, Brems D 2002. Inverse Relationship of Protein Concentration
and Aggregation. Pharmaceutical Research 19(4):511-516.
59. Huang C-T, Sharma D, Oma P, Krishnamurthy R 2009. Quantitation of protein
particles in parenteral solutions using micro-flow imaging. Journal of Pharmaceutical
Sciences 98(9):3058-3071.
60. Lee HJ, McAuley A, Schilke KF, McGuire J 2011. Molecular origins of surfactant-
mediated stabilization of protein drugs. Advanced Drug Delivery Reviews 63(13):1160-
1171.
61. Mahler H-C, Müller R, Frieβ W, Delille A, Matheus S 2005. Induction and analysis of
aggregates in a liquid IgG1-antibody formulation. European Journal of Pharmaceutics and
Biopharmaceutics 59(3):407-417.
62. Bam NB, Cleland JL, Yang J, Manning MC, Carpenter JF, Kelley RF, Randolph TW
1998. Tween protects recombinant human growth hormone against agitation-induced damage
via hydrophobic interactions. Journal of Pharmaceutical Sciences 87(12):1554-1559.
63. Bhaskar AKM, Kumar M 2014. Effect of Polysorbate-80 Concentration on G-CSF
Formulation Using Liquid Chromatography. International Journal of Pharmacy and
Pharmaceutical Sciences 6(9):299-302.

112
4 : SELF-DIFFUSION IN HIGHLY
CONCENTRATED PROTEIN
SOLUTIONS MEASURED BY
FLUORESCENCE CORRELATION
SPECTROSCOPY

113
Research article
Self-diffusion in Highly Concentrated Protein Solutions measured by Fluorescence
Correlation Spectroscopy
Maryam Shaha, Daniel Corbett
b, Aisling Roche
b, Peter Davis
b#, Katie Day
c, Shahid Uddin
c,
Christopher F. van der Wallec Robin Curtis
b, and Alain Pluen
a*
a, School of Health Sciences, University of Manchester, Manchester, UK
b, School of Chemical Engineering and Analytical Sciences, University of Manchester,
Manchester, UK
c, MedImmune Ltd, Formulation Sciences, Granta Park, Cambridge, UK
#, Present address: Department of Molecular Biology and Biotechnology, University of
Sheffield, Sheffield S10 2TN

114
4.1 Abstract
Biopharmaceuticals (e.g. monoclonal antibodies (mAbs)) are formulated at high
concentrations to meet patient dose requirements. However at these high concentrations i.e. >
100mg/ml, intermolecular interactions are heightened leading to stability and viscosity issues.
Fluorescence correlation spectroscopy (FCS) has shown strong scope for measuring micro-
rheology of aqueous solutions using fluorescence probes. In this study, the method’s use in
mAb solutions, through measuring the diffusion of tracers of different size, is demonstrated.
Additionally, solutions of model protein bovine serum albumin are measured and the data
compared with bulk rheometry (i.e. macroviscosity), and the applicability of existing models.
It is observed that the applicability of the generalised Stokes Equation relation is dependent
on the tracer size (in comparison to crowder size) and any crowder-tracer interactions. Using
a tracer of similar size to the crowder (which does not interact with solution components) can
extract valuable information on the effect of solution properties (i.e. pH, salts, ionic strength)
on changes in local rheological behaviour.

115
4.2 Introduction
4.2.1 Effects of molecular crowding
Molecular crowding in cells and biopharmaceutical solutions has recently attracted attention
of both experimentalists and theorists.1,2
One of the direct repercussions of molecular
crowding is the change in viscosity observed in biopharmaceutical injections. Indeed, the
current move to limit the number of injections and improve the patient’s life by increasing the
mAbs concentration (well above 100 mg/ml) results in higher viscosity that may exceed the
limit of ‘syringeability’ (about 50 mPaS for most cases) to subcutaneous routes; as well as
bringing manufacturing difficulties to industries.3-7
Viscosity is governed by weak protein-
protein interactions (attractive and repulsive forces) and possibly by conformational changes
likely to happen at high protein concentrations.8,9
In previous studies10-12
mAbs demonstrated
diverse viscosity-concentration profiles unveiling a sharp exponential increase in solution
viscosity with increasing mAb concentration. However, even if these may be mitigated by
parameter such as pH, ionic strength, ions,13-15
a better monitoring of viscosity change
especially at highly concentrated protein solutions is necessary to provide guidance for
protein formulation developments.16
Typically, for a solution component to be termed as a ‘crowder’, it comprises more than 80%
of the volume. For the purpose of this study, the term ‘crowder’ refers to the fundamental
solution component i.e. in a protein formulation it would be the protein (regardless of the
protein concentration).
4.2.2 Measuring solution viscosity - diffusion of tracer particles
A number of approaches have been used and often rely on the generalised Stokes Einstein
relation. Methods include pulsed-field-gradient (PFG) NMR,17
forced Rayleigh scattering,
Taylor dispersion, fluorescence recovery after photobleaching (FRAP),18
dynamic light
scattering (DLS),19
and X-ray photon correlation (XPCS). Each of these techniques is
typically tailored for a certain range of concentrations or diffusion coefficient values.
Muramatsu and Minton studied the diffusion of tracer proteins in solutions crowded with
proteins via measurements of boundary spreading.20,21
In this study21
, the fractional reduction
of the diffusion of the tracer increased with increasing size of tracer species, and with
decreasing size of background species. Importantly, tracer diffusion in non-dilute solution has
been extensively utilised for polymer solutions studies.22-24
Indeed recent studies showed
molecules diffusion in polymer solutions can sense the microscopic friction which for

116
sufficiently large molecular probes is proportional to the friction coefficient extracted from
viscosity measurements. A concentration dependence of the self-diffusion had been observed
which may be represented by a semi empirical exponential law depending on the diffusant
size.22,25
Fluorescence correlation spectroscopy (FCS) is an ideal tool to study diffusion of tracers in
mAbs solutions as it measures the fluorescence fluctuations in the focal volume (less than one
fL). FCS is validated as a highly sensitive method to measure diffusion of fluorescently
labelled molecules in solution as well as their interactions,26-28
and has been utilized to
determine the long-time self-diffusion and large scale motion in a number of protein solutions
studies.1,2,24,28
Importantly, in these experiments, the friction experienced by tracer particles
can be expected to scale with the macroscopic solution viscosity (c), such that the long-time
diffusion coefficient DL may be considered to behave as predicted by the generalized Stokes–
Einstein (GSE) relation.29
𝐷𝐿 =𝑘𝐵𝑇
6𝜋𝜂(𝑐)𝑅𝐻
Equation 4.1
Where 𝑘𝐵𝑇 denotes the thermal energy and RH is the hydrodynamic radius of the
fluorescently labelled tracer. Provided that only the viscosity depends on the concentration c
of the dispersed particles but not the particle’s (apparent) hydrodynamic size, long-time
translational diffusion coefficients may thus be expected to follow the same concentration
dependence as the inverse viscosity of the same solution. Interestingly using proteins as
molecular crowders has resulted in different and sometimes conflictual results; indeed
depending whether the molecular crowders were proteins or polymers resulted in either
confirming or invalidating the GSE relation. An important point to remember is translational
diffusion measurements solely report on the tracer species, whereas viscosity measurements
are strongly dominated by the specific interactions among the crowder molecules due to their
much higher volume fraction. For example, Balbo et al.1 measured the self-diffusion tracer
proteins, fluorescently labelled BSA and IgG, in non-labelled BSA and IgG solutions
(respectively). After plotting the normalized translational diffusion coefficients 𝐷𝐿/𝐷𝐿,0, as a
function of protein volume fraction and computer modelling, the authors claimed the
dependence on crowder type appeared to be more important than the dependence on the
tracer type.1 This notion is supported by the findings of Zorrilla et al. They measured the
translational diffusion of apomyoglobin (apoMb) in concentrated ribonuclease-A (RNase -A)
and human serum albumin (HSA) solutions, using FCS. The translational diffusion of

117
labelled apoMb-m (tracer at nM concentration) in HSA and RNase-A solutions was
significantly slowed down by increasing concentrations of the crowder molecules compared
to its diffusion in dilute buffer.24
Overall, their results agreed with Muramatsu and Minton
results, and they proposed empirical relationships for estimation of local translational
viscosity from the determined bulk viscosity.24,30
In three recent papers, Roos et al. observed self-diffusion of proteins in concentrated protein
solutions using NMR and FCS. In the first one, Roos et al by PGNMR31
found that upon
increasing the protein concentration, the translational diffusion ofcrystallin nicely
followed the trend measured for the inverse solution viscosity. In a following studies, Roos et
al.2 found that long-time translational diffusion scales with macroscopic viscosity and small
solvent molecules diffuse faster than predicted from the SE relation, at least with regards to
the (macroscopic) solution viscosity.29
Contemplations on whether the diffusion of protein in crowding agents was anomalous have
received some attention. Interestingly when diffusion was found to be anomalous, the
crowding agent was a polymer: for example Banks and Fradin (2005) demonstrated this using
streptavidin in dextran solutions with anomality clearly appearing at high concentrations;
anomalous diffusion exponent.32
The effect of tracer size in crowded solutions has received considerable attention when these
crowders are polymers. Michelmann-Ribeiro et al. noticed that the diffusion of these particles
was affected differently in poly(vinyl alcohol) (PVA) solutions.33
Holyst et al. explored this
further with poly(ethylene glycol) (PEG) solutions. For probes smaller than the size of PEG,
the nanoviscosity is measured which is several orders of magnitude smaller than the
macroviscosity. For probes equal to or larger than PEG, the macroscopic value of viscosity
was measured. The study established a clear relation between the nano and macroviscosity as
based on the crossover length scale; determined from the crowder radius (of gyration), the
correlation length (distance between entanglement points of polymer chains; which is
affected by the polymer concentration) and the probe size.34
Here, two monoclonal antibodies with different behaviours and bovine serum albumin (BSA)
(as a model protein) are used as crowding agents; particular attention was taken to the charge
of the tracer molecule in order to determine the effect of tracer sizes on the self-diffusion.
The translation diffusion is compared with bulk rheometry (macroviscosity) and the
application of the GSE relation is assessed.

118
4.3 Materials and Methods
4.3.1 Materials
The monoclonal antibodies, termed as COE-03 (IgG1, MW 145kDa, pI 8.44) and COE-19
(IgG1, MW 145kDa, pI 7.4-7.9) were kindly provided by MedImmune Ltd (Cambridge, UK).
Azure-B, ATTO-465, ATTO-Rho6G, polysorbate-20, polysorbate-80, IgG-AF and IgM-AF
probes (mouse IgG1 isotype control, Alexa Fluor 488 conjugates) and buffer components
(histidine and sucrose) were acquired from Sigma Aldrich (Dorset, UK).
Rhodamine Green™ was acquired from Invitrogen (Paisley, UK). Lab-Tek Nunc® eight-well
chamber slides, scintillation vials, toluene and sucrose were obtained from Fisher Scientific
Ltd (Leicestershire, UK).
All buffers and solutions were prepared with Millipore de-ionised water (18 MV.cm) and pre-
filtered prior to stress experiments.
To reach high mAb concentrations (above 50mg/ml) mAbs were concentrated with 50 kDa
MWCO amicon ultra-centrifugal filter units (Sigma Aldrich, Dorset, UK).
4.3.2 Methods
4.3.2.1 Log P using spectrophotometry
4.3.2.1.1 Sample Preparation
To determine the Log P values (to confirm the hydrophilicity) of Azure-B, ATTO-465 and
ATTO-Rho6G, the partition coefficient (P) was determined using spectrophotometry.
Two concentrations for each dye were chosen (2M and 4M in buffer) and a 1:1 ratio of the
dye in buffer and toluene were prepared in scintillation vials. The scintillation vials were
placed on an A600 Rocker (Denley Instruments Ltd, West Sussex, UK) for each
concentration and a sample of from the buffer phase was removed after 1 hour and after 48
hours. Each experiment was repeated in triplicate.
4.3.2.1.2 Fluorescence Spectrophotometry and Data Analysis
A Cary Eclipse Fluorospectrophotometer (Varian Ltd., Australia) was utilised. The
concentration of the dye in buffer and subsequently toluene (concentration of dye in toluene =
original concentration – concentration of dye in buffer) was determined.
To determine the partition coefficient𝑃𝑡/𝑏, the following equation was used:

119
𝑃𝑡/𝑏 =𝐶𝑡𝑜𝑙𝑢𝑒𝑛𝑒
𝐶𝑏𝑢𝑓𝑓𝑒𝑟⁄
Equation 4.2
Where, 𝐶𝑡𝑜𝑙𝑢𝑒𝑛𝑒 is the concentration of dye in toluene and 𝐶𝑏𝑢𝑓𝑓𝑒𝑟 is the concentration of dye
in the buffer.
The partition coefficient (P) is thereby the quotient of the two concentrations; hence the log P
is simply the logarithm to base 10 of the quotient.
To test for significance, statistical tests, one-way ANOVA followed by post-hoc comparison
were applied.
4.3.2.2 Fluorescence Correlation Spectroscopy (FCS)
The experimental approach has been described elsewhere.35
Briefly, the Argon laser and the
Helium-Neon laser of a Zeiss Confocor2 LSM 510 META (Zeiss, Jena, Germany) and a
40×/1.2NA water-immersion objective were utilised. For the different probes, different
Argon laser lines were utilised: 488nm for IgG-AF and IgM-AF, 458nm for ATTO-465 and
514nm for ATTO-Rho6G. The Helium-Neon laser line of 633 nm was utilised for Azure-B.
The laser beam waist for the Argon lasers was determined by measuring Rhodamine Green™
(published diffusion coefficient of 2.8 × 10⁻⁶
cm2/s
36) and the laser beam for Helium-Neon
laser was determined by Alexa Fluor 647 (published diffusion coefficient of 3.0 × 10⁻⁶
cm2/s
37,38), using Equation 4.3:
𝜏𝐷 =𝜔02
4𝐷𝐿⁄
Equation 4.3
Where 𝜏𝐷 corresponds to the diffusion time and 𝟂0 is the laser waist beam.
Samples were loaded in duplicate into the corner of Lab-Tek Nunc eight-well chamber slides
(Fisher Scientific, Leicestershire, UK) and duplicate measurements collected. A constant
volume of the dyes was added to each solution in order to have approximately the same
number of particles per focal volume. The 40x 1.2W NA collar was adjusted in order to
maintain the number of particles per focal volume. Diffusion measurements were performed
at least 40 times and the acquisition time was varied between 5 s and 60 s per run depending
on the concentration. For the single-exponential model the following equation was applied to
fit the autocorrelation curve (G(τ)):
2/1
2
1
111
1)(
D
D SNG
Equation 4.4

120
Where N is the number of particles and S is the structure parameter.
4.3.2.3 Vilastic-3 for viscosity measurement
The Vilastic-3 Viscoelasticity Analyser (Vilastic Scientific, Inc., Austin, TX) was operated.
The oscillatory flow is generated at a selected frequency (i.e. 1 Hz) in a precision
measurement tube. The resolution of the magnitude and the phase of the pressure and volume
flow allows the calculation of the viscous and elastic components of the shear strain, shear
rate and shear stress at the tube wall. The stress (directly proportional to the pressure) is
proportional to the shear force which produces the shear strain and the shear rate
(proportional to the volume flow) within the fluid. The viscosity, 𝞰, is the ratio of the shear
stress to shear rate.
The dynamic viscosity of the mAb solutions was measured at a frequency of 1 Hz over a
range of shear rates (1-100 s-1
) at 25C. The Vilastic-3 standard sample cups were used
requiring approximately a volume of 2ml per sample.
Measurements were performed 100 times and the output was averaged and repeated in
triplicate for each sample.
4.3.2.4 RheoChip in measuring shear viscosity
Shear viscosity measurements were performed using the in-house RheoChip platform1 .The
RheoChip is a microfluidic rheometry device made of polymethyl methacrylate (PMMA)
using soft lithographic methods to create three internal rectangular channels of widths 800
m, 200 m and 100 m respectively and nominal height 50 m. Channels are oxygen
plasma treated to make hydrophilic and protein adhesion resistant. All experiments are
performed using the 200 m channel unless otherwise specified. The channel contains a
pressure tap, at a distance from the inlet sufficient for one-dimensional, Poiseuille-like,
laminar flow to be achieved. A second pressure tap is located 30mm further along the
channel. These pressure taps are each fitted with pressure detection unit consisting of two
identical linear strain gauge pressure transducers, enabling the differential pressure drop
across the length of channel between the taps to be measured. The RheoChip is calibrated
using deionised water with known viscosity corresponding to the measured temperature
during calibration. A calibration constant is established for each chip, 𝑓, where
𝑓 =1
(Δ𝑃
𝑄)𝐴𝑣𝑔.
Equation 4.5

121
where Δ𝑃 is the differential pressure, 𝑄 is the imposed flowrate and the Avg subscript reflects
average over multiple shear rates. The RheoChip is filled with the solvent of the sample and
allowed to reach steady state prior to measurement. A 1 mL glass syringe filled with protein
sample is secured in a Nexus 6000 syringe pump (Chemyx, TX, USA) and connected to the
RheoChip apparatus, ensuring there are no air bubbles in the system. The sample is pumped
into the chip in a cycle of flowrates from 10 mL/hr to 2 mL/hr in increments of 2 mL/hr, each
time allowing sufficient time for steady state flow to be achieved. The pressure drop across
the channel at each flow rate is detected and relayed to a data acquisition platform consisting
of National Instruments CompacDAQ 9172 chassis, a National Instruments 9237 data
acquisition modulus and LabView software (National Instruments). Shear viscosity is
calculated relative to the aforementioned calibration by the following formula,
𝜂𝑠𝑎𝑚𝑝𝑙𝑒 = 𝑓. 𝜂𝐻20 (Δ𝑃
𝑄)𝑠𝑎𝑚𝑝𝑙𝑒
Equation 4.6
where 𝑓 is the chip calibration constant, 𝜂𝐻20 is the viscosity of deionised water at calibration
temperature.
4.4 Results
4.4.1 Candidate dye for solution viscosity
While there are a huge variety of dyes (commercially) available for fluorescence microscopy,
not all dyes will perform well with FCS. Dyes for FCS need to be bright i.e. high extinction
coefficient and high quantum yield, low singlet-to-triple state quantum yield, and low photo-
bleaching.27
Additionally, for the measurement of viscosity (of mAb solutions), through the
translational diffusion time, the dye needs to be hydrophilic and not bind to solution
components (including protein).
A literature search was carried out to select candidate dyes to measure the viscosity of mAb
solutions using FCS. Criteria for dye selection were (i) hydrophilic, (ii) carry the same charge
to the mAbs used (buffers would be at a pH below the PI and so mAbs would be positively
charged in the experimental solutions) and have (iii) fluorescence stability over the pH range
studied (around pH 5 – pH 9).
Three candidate dyes, namely Azure-B, ATTO-465 and ATTO-Rho6G, were selected based
on available information in the literature and from manufacturers – summarised in Table 4.1.
Experiments were carried out to test the aforementioned properties / criteria. Firstly, the log P
(hydrophilicity) was determined for all three dyes.

122
Table 4.1: Available information of the three candidate dyes.
Available information of the three candidate dyes (Azure-B, ATTO-465 and ATTO-Rho6G) chosen
to investigate.40-43
Dye Excitation
maxima
Emission
maxima
Hydrophilic Log P Charge Available
Comments
Azure-B 648 662 Yes Mixed
values
Cationic pH stable
ATTO-
465
420-465 508 Yes Not
known
Cationic High thermal and
photo-stability; pH
stable; strong
absorption and good
fluorescence, large
Stokes-shift, good
water solubility
ATTO-
Rho6G
535 560 Yes Not
known
Cationic A new Rhodamine
dye; shows strong
absorption; high
fluorescence
quantum yield, high
thermal and photo-
stability; pH stable;
highly suitable for
single-molecule
detection applications
and high-resolution
microscopy
4.4.1.1 Hydrophilicity of candidate dyes
Table 4.2 summarizes the calculated log P values (at pH 6.0), which are all negative, thereby
signifying that all three dyes are indeed hydrophilic. Calibration curved can be seen in the SI
(Appendix 3, A3.1). Two different shaking times were used: Generally, times of around 24-
48 hours are recommended for such experiments (to ensure saturation has been reached). A
shorter time of 1 hour was also chosen (as the dye concentrations chosen were well below the
stated solubility limit). Statistical tests revealed Azure-B was significantly less hydrophilic (p
< 0.05) than the ATTO dyes. No significant differences were observed between
concentrations or between shaking times (at p = 0.05) for the same dye.

123
Table 4.2: Log P values of Azure-B, ATTO-465 and ATTO-Rho6G.
Log P values of Azure-B, ATTO-465 and ATTO-Rho6G using two shaking times of 1 hour and 48
hours. Values represent averages with std. dev. for n=3.
Dye Concentration (μM) Log P (1 hour) Log P (48 hours)
Azure B 2 -0.11 ± 0.07 -0.07 ± 0.03
4 -0.24 ± 0.14 -0.07 ± 0.05
ATTO-465
2 -1.38 ± 0.17 -1.49 ± 0.18
4 -1.45 ± 0.39 -1.33 ± 0.31
ATTO-Rho6G
2 -0.72 ± 0.21 -1.56 ± 0.27
4 -1.21 ± 0.64 -1.10 ± 0.49
4.4.1.2 Fluorescence Stability
One of the most crucial properties of the candidate dye is the fluorescence stability (necessary
for FCS) which is reflected through the count rate over the measurement time. The ATTO
dyes displayed constant average fluorescence intensities over time during the measurements,
thereby representing stable fluorescence i.e. indicating the fluorophores were not photo-
bleached during the measurement. However, Azure-B displayed some significant larger peaks
in the count rate (in comparison to the constant average pattern) which may be due to the
presence of some insoluble components of the dye (example count rates can be seen in the SI
Appendix 3, A3.2). This is supported by the log P values of Azure-B (Table 4.2).
The FCS diffusion times of Azure-B, ATTO-465 and ATTO-Rho6G in his/suc buffer (pH6.0)
were determined at dye concentrations of 1nM, 10nM and 100nM (Table 4.3). The diffusion
times showed large variability within the same dye concentration (i.e. the repeats) and
between the different concentrations, measured with Azure-B and ATTO-465. ATTO-
Rho6G, on the other hand, gave similar diffusion times across the three concentrations. Based
on these results, no further experiments were carried out with Azure-B and ATTO-465.
Table 4.3: Diffusion times of Azure-B, ATTO-465 and ATTO-Rho6G.
Diffusion times of Azure-B, ATTO-465 and ATTO-Rho6G at 1nM, 10nM and 100nM (in buffer).
Values represent mean with std. dev for n=5.
Dye Concentration (nM) Diffusion time (s)
AZURE-B 1 60 ± 3
10 32 ± 5
100 35 ± 8
ATTO-465 1 44 ± 20
10 35 ± 10
100 59 ± 9
ATTO-RHO6G 1 35 ± 1
10 36 ± 1
100 36 ± 1
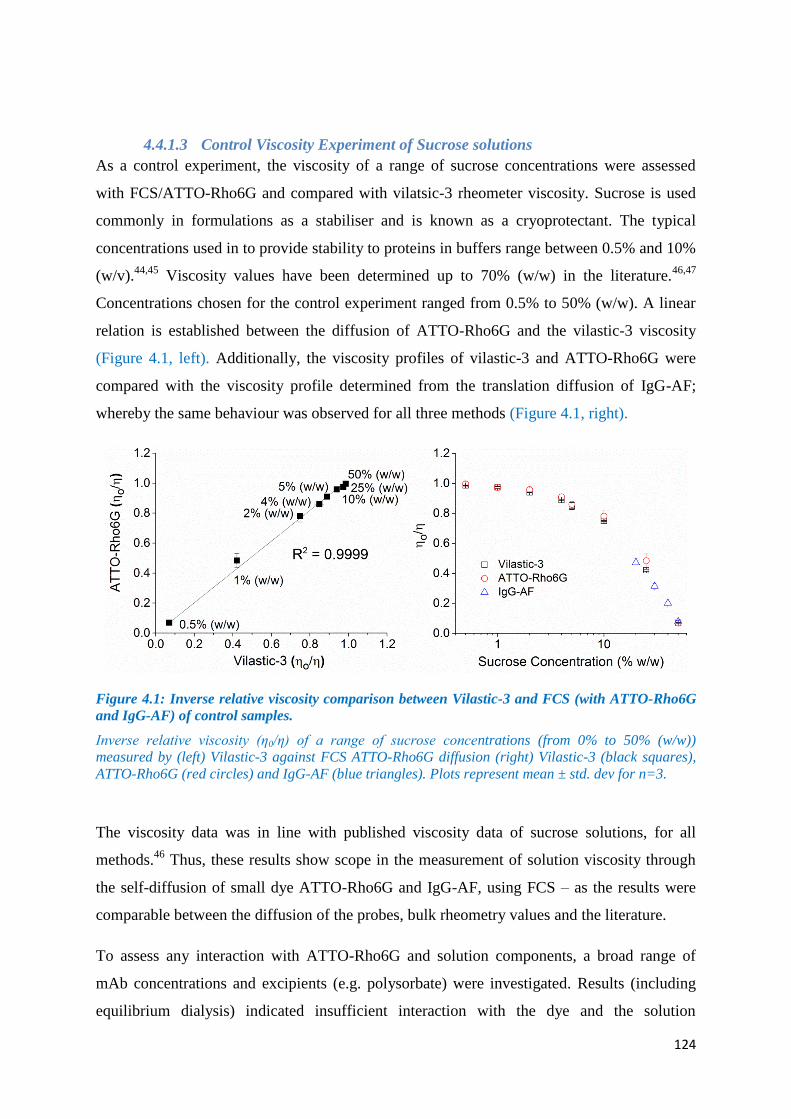
124
4.4.1.3 Control Viscosity Experiment of Sucrose solutions
As a control experiment, the viscosity of a range of sucrose concentrations were assessed
with FCS/ATTO-Rho6G and compared with vilatsic-3 rheometer viscosity. Sucrose is used
commonly in formulations as a stabiliser and is known as a cryoprotectant. The typical
concentrations used in to provide stability to proteins in buffers range between 0.5% and 10%
(w/v).44,45
Viscosity values have been determined up to 70% (w/w) in the literature.46,47
Concentrations chosen for the control experiment ranged from 0.5% to 50% (w/w). A linear
relation is established between the diffusion of ATTO-Rho6G and the vilastic-3 viscosity
(Figure 4.1, left). Additionally, the viscosity profiles of vilastic-3 and ATTO-Rho6G were
compared with the viscosity profile determined from the translation diffusion of IgG-AF;
whereby the same behaviour was observed for all three methods (Figure 4.1, right).
Figure 4.1: Inverse relative viscosity comparison between Vilastic-3 and FCS (with ATTO-Rho6G
and IgG-AF) of control samples.
Inverse relative viscosity (η0/η) of a range of sucrose concentrations (from 0% to 50% (w/w))
measured by (left) Vilastic-3 against FCS ATTO-Rho6G diffusion (right) Vilastic-3 (black squares),
ATTO-Rho6G (red circles) and IgG-AF (blue triangles). Plots represent mean ± std. dev for n=3.
The viscosity data was in line with published viscosity data of sucrose solutions, for all
methods.46
Thus, these results show scope in the measurement of solution viscosity through
the self-diffusion of small dye ATTO-Rho6G and IgG-AF, using FCS – as the results were
comparable between the diffusion of the probes, bulk rheometry values and the literature.
To assess any interaction with ATTO-Rho6G and solution components, a broad range of
mAb concentrations and excipients (e.g. polysorbate) were investigated. Results (including
equilibrium dialysis) indicated insufficient interaction with the dye and the solution

125
components tested. Additionally a linear relation between ATTO-Rho6G diffusion time and
mAb solution viscosity was modulated. Results can be seen in the SI (Appendix 3, A3.3).
4.4.2 Self-diffusion in highly concentrated protein solutions
In this section the self-diffusion of probes are assessed over a range of protein concentrations
as a function of pH, salt and ionic strength. Through comparing data between the probes (of
different size), and the macroviscosity using the RhoeChip, the effect of probe type and size
in determining rheological behaviour of protein solutions is analysed.
Figure 4.2 presents a typical example of the variation of the normalised autocorrelation curve
of IgG-AF with increasing concentration of mAbs used in this study (here COE-03). The
ACF appears to reflect the diffusion of one species only and shifts to the right with increasing
concentrations. The insert in Figure 4.2 presents the mean square displacement (MSD), based
on the model by Rathgeber et al.48
⟨∆𝑟2(𝑡)⟩ = 3
2𝑤𝑥𝑦2 (
1
�̅�𝐺(𝑡)−1) Equation 4.7
The dash lines (Figure 4.2 insert) indicate a linear dependence between the MSD and time; as
the MSD corresponding to the different concentrations do all show dependence close to 1
with time, the diffusion of IgG-AF appears to follow GSE relation, consequently is not
anomalous.
Figure 4.2: Normalised FCS autocorrelation function for IgG-AF solutions.
Normalised FCS autocorrelation function (ACF) for IgG-AF in a range of COE-3 concentrations,
ranging from 0 to 220mg/ml. The average time the fluorescent probe spends in the focal volume is
given by the characteristic decay time of the ACF. Insert: the mean square displacement of the IgG-
AF COE-03 solutions, showing dependence to 1 over time.

126
4.4.2.1 Effect of buffer and ionic strength on ratio of diffusion times
Figure 4.3 presents the effect of the change of the ratio of diffusion times as a function of
protein concentration, for different solution conditions and for ATTO-Rho6G and IgG-AF.
For all conditions, the change of the ratio of diffusion times is significantly less in presence
of ATTO-Rho6G than of IgG-AF. Experimental conditions do not affect the ratios for
ATTO-Rho6G but the mAb concentration; therefore indicating that the fluorescent dye is not
sensitive to differences related to the buffer conditions and is only affected by the mAb
concentration. On the other hand, IgG-AF appears to be sensitive to the influence of the
buffer and ionic strength on the microenvironment.
Figure 4.3: Variations of the ratio of diffusion times as a function of mAb concentration, measured
by FCS, of tracers IgG-AF and ATTO-Rho6G over different buffer conditions.
Vitiations of the ratio of diffusion times as a function of mAb concentration, measured by FCS, of
tracers IgG-AF (top row) and ATTO-Rho6G (bottom row) in COE-3 (left) and COE-19 (right)
solutions in different buffer conditions, at T =20C. Plots represent mean ± std. dev for n=3
4.4.2.2 Influence of tracer size
Many studies (particularly for polymers as crowding agents) suggest an influence of the
tracers’ size on the relation between ratios of diffusion times to nano- or micro-rheology;
however, this has not been specifically determined in protein solutions. To this extent, the
behaviour in mAb solutions and in solutions of a model protein, BSA, different sizes of
tracers were used and the ratio of the diffusion coefficients compare against the relative

127
viscosity determined using the RheoChip. For mAb solutions, ATTO-Rho6G, IgG-AF and
IgM-AF were chosen, whilst for BSA solutions, BSA-AF and TMR-peptide were used.
Figure 4.4 presents the influence of tracers’ size on the change of the ratio of diffusion times.
Figure 4.4: Variation of ratio of diffusitives of different-sized fluorescent tracers compared with the
relative macro-viscosity as a function of protein concentration.
Variation of the ratio of diffusivities of different-sized fluorescent tracers measured by FCS - Atto-
Rho6G, IgG-AF and IgM-AF in mAb (COE-19) solutions (left) and BSA-AFA and TMR-peptide in
BSA solutions (right) - are compared with the relative macro- viscosity (measured by RheoChip), as a
function of the protein concentration. Plots represent mean ± std. dev for n=3
Figure 4.4 clearly demonstrates that an effect of tracer size is observed in mAb and BSA
solutions. The fluorescent dye, ATTO-Rho6G, is barely sensitive to the presence of proteins
even at high concentrations (ratio increased 2-3𝗑 at 160 g/L) whilst IgG-AF and IgM-AF
show greatly increased retardation (Figure 4.4, left). The variation of the IgM-AF ratio of
diffusion times matches the evolution of the relative (RheoChip) macroviscosity but not IgG-
AF; thus, in this example, an equivalent hydrodynamic radius to the one of the crowder
molecule is not enough. On the other hand in the case of the model protein solutions, a tracer
size effect is observed as the retardation observed for TMR-peptide is less than the one
observed in presence of BSA-AF; however, a noticeable difference with the aforementioned
solutions, the variation of the ratio of the diffusion times matches the variation of the relative
viscosity indicating that in this case the hydrodynamic radius of the tracer molecule is
sufficient to determine the macroviscosity (Figure 4.4, right).
The observed slowdown of tracers has been addressed using the hard-sphere (HS) model
(termed model 1 herein) as suggested by Roos et al.2:

128
𝐷𝐿(∅𝐻𝑆)
𝐷𝐿,0≅
(1−∅𝐻𝑆)3
1+(3 2⁄ )∅𝐻𝑆+2∅𝐻𝑆2+3∅𝐻𝑆
3 Equation 4.8
Where ∅𝐻𝑆 = 𝑘∅, with 𝑘>1, ∅ is the effective volume fraction and 𝐷𝐿 denotes the long-time
translational diffusion coefficient.
However a simpler model (model 2) can also be used to describe the retardation and the
change of viscosity as shown by Conolly et al:16
𝜂 = 𝜂0𝑒𝑘𝑐 Equation 4.9
Where 𝜂 is the solution viscosity at any given mAb concentration (𝑐), 𝜂0 is the solution
viscosity at infinite dilution and 𝑘 is exponential coefficient.
Table 4.4 and 4.5 summarizes the different values of 𝑘 obtained for both models for BSA and
mAb solutions, respectively. For the purpose of this study, 𝑘 for model 1 is termed as 𝑘1 and
𝑘 for model 2 is termed as 𝑘2. Simplistically, 𝑘1=1 proves translational diffusion follows HS
behaviour such that higher 𝑘1 values (i.e. away from 1) represent higher levels of interaction.
Similarly for the exponential model the higher the 𝑘2 value, the higher the level of
interaction. Both models can be utilised to compare levels of interaction between different
solution conditions.
The data following application of model 1 show BSA-AF in BSA solutions (Table 4.4)
behaviour is close to the HS model; where values are in close agreement with Roos et al.2 As
expected for mAb solutions (Table 4.5), the values of 𝑘1 diverge clearly from 1 towards 2
and over: according to Roos et al., such behaviour would suggest that the behaviour of IgG in
mAbs solutions does not only involve weak inter-protein interactions. The effect is more
prominent for COE-19.
From applying model 2, an effect of the size of the tracer is observed in BSA and mAbs
solutions (i.e. kTMRpeptide < kBSA-AF ≈kRheochip and kAtto < kIgG ≤ kRheoChip ≤ kIgM, respectively);
more precisely in mAbs solutions, kIgM is at least equal to kRheochip (the only time it is similar
is for COE-19 pH6.5 and COE-03 pH6.5).
A correlation between the interaction parameter, 𝑘𝐷, and 𝑘2 has been demonstrated in the
literature.16
Herein, 𝑘𝐷 values of COE-03 solutions were determined and compared with
determined 𝑘 values with IgG-AF; for both model 1 and model 2. Initial observation showed
no correlation. However, separating the data as a function of pH and salts, an effect of pH is
observed (Figure 4.5). Comparing between the two models, the more complex model (model

129
1) had a better correlation of k with the 𝑘𝐷 (R2
of 0.99 and 0.86 for 𝑘1 and 𝑘2 values,
respectively). However, no relation was observed between 𝑘𝐷 and 𝑘 for ionic strength.
For both models, the presence of excipients does not affect the change of the relative
viscosity or the change of the diffusion times for BSA solutions.
Table 4.4: Calculated 𝐤𝟏 and 𝐤𝟐 for BSA samples measured by FCS and the RheoChip.
Calculated 𝑘1 and 𝑘2 for BSA samples from the diffusion of tracers measured by FCS (BSA-AF and
TMR-peptide) and the RheoChip (𝑘2 only). Values represent means with std. dev for n=3.
Tracer Condition 𝒌𝟏 𝒌𝟐
RheoChip
no excipients N/A 0.0082 ± 0.0001
ArgHCl N/A 0.0086 ± 0.0001
ArgGlu N/A 0.0085 ± 0.0001
Sucrose N/A 0.0088 ± 0.0001
BSA-AF
BSA no excipients 1.38 ± 0.04 0.0088 ± 0.0006
BSA ArgHCl 1.28 ± 0.06 0.0078 ± 0.0006
BSA ArgGlu 1.33 ± 0.04 0.0083 ± 0.0005
BSA Sucrose 1.19 ± 0.04 0.0072 ± 0.0004
TMR peptide
BSA no excipients 0.98 ± 0.02 0.0059 ± 0.0000
BSA ArgHCl 0.97 ± 0.04 0.0057 ± 0.0003
BSA ArgGlu 0.99 ± 0.04 0.0058 ± 0.0003
BSA Sucrose 1.07 ± 0.04 0.0065 ± 0.0003

130
Table 4.5: Calculated 𝐤𝟏 and 𝐤𝟐 measured by FCS and the RheoChip.
Calculated 𝑘1 and 𝑘2 for mAb samples from the diffusion of tracers measured by FCS (ATTO-
Rho6G, IgG-AF, IgM-AF) the RheoChip (𝑘2 only). Values represent means with std. dev for n=3.
Tracer mAb
Condition 𝒌 from
model 1
𝒌 from
model 2
RheoChip
COE-03
pH 9 Tris N/A 0.0228 ± 0.0011
pH 6.5 (His Suc) N/A 0.0127 ± 0.0002
pH 5.5 acetate N/A 0.0124 ± 0.0007
pH5 no salt N/A 0.0115 ± 0.0002
pH5 250mM NaCl N/A 0.0103 ± 0.0007
COE-19
pH5 no salt N/A 0.0251 ± 0.0003
pH5 250mM NaCl N/A 0.0185 ± 0.0008
pH6.5 250mM NaCl N/A 0.0182 ± 0.0001
pH8 250mM NaCl N/A 0.0167 ± 0.0003
ATTO-Rho6G
COE-03
pH 9 Tris 1.16 ± 0.07 0.0074 ± 0.0003
pH 6.5 (His Suc) 1.13 ± 0.07 0.0069 ± 0.0004
pH 5.5 acetate 1.34 ± 0.07 0.0077 ± 0.0006
pH5 no salt 1.21 ± 0.04 0.0070 ± 0.0001
COE-19
pH5 no salt 1.05 ± 0.03 0.0059 ± 0.0001
pH5 250mM NaCl 1.03 ± 0.04 0.0061 ± 0.0002
pH6.5 250mM NaCl 1.05 ± 0.04 0.0060 ± 0.0001
pH8 250mM NaCl 1.05 ± 0.03 0.0058 ± 0.0002
IgG-AF
COE-03
pH 9 Tris 2.50 ± 0.09 0.0188 ± 0.0005
pH 6.5 (His Suc) 2.17 ± 0.02 0.0140 ± 0.0002
pH 5.5 acetate 2.35 ± 0.02 0.0161 ± 0.0003
pH5 no salt 1.86 ± 0.11 0.0118 ± 0.0002
pH5 250mM NaCl 1.69 ± 0.06 0.0108 ± 0.0005
pH 5 250mM NaSCN 2.10 ± 0.05 0.0137 ± 0.0005
COE-19
pH5 no salt 3.18 ± 0.17 0.0208 ± 0.0003
pH5 250mM NaCl 2.27 ± 0.09 0.0147 ± 0.0005
pH6.5 250mM NaCl 2.14 ± 0.05 0.0138 ± 0.0002
pH8 250mM NaCl 2.51 ± 0.12 0.0150 ± 0.0002
IgM-AF COE-19
pH8 250mM NaCl 2.74 ± 0.05 0.0196 ± 0.0001
pH6.5 250mM NaCl 2.50 ± 0.08 0.0186 ± 0.0006
pH 5 no salt 5.62 ± 0.28 0.0408 ± 0.0002
COE-03 pH 6.5 (His Suc) 2.76 ± 0.10 0.0155 ± 0.0007

131
Figure 4.5: Relation between interaction parameter (kD) and the exponential coefficient (k).
Relation between kD and the k determined from model 1 (left) and model 2 (right) as a function of pH
and (inserts) as function of salt for COE-03 solutions. 𝒌 calculated from the FCS diffusion of IgG-AF.
Plots represent average with std. errors.
As mentioned above, the retardation of IgG-AF is usually less than the change of relative
viscosity at high concentrations (at concentrations ≥ 100mg/mL). This can be seen on Figure
4.4 by a direct comparison which clearly shows that as soon as the ratio of diffusivities
increases to 5 and above, a difference is observed. However, the influence of the
experimental conditions i.e. pH, ionic strength, ions, on the IgG-AF retardation parallels the
one observed for the change of the relative viscosity. Consequently IgG-AF can be used to
inform of the solution’s environment. On the other hand, the observed retardation for IgM-AF
varies considerably depending on the experimental conditions used for these experiments: it
may follow the change of the relative viscosity (e.g. COE-03 pH6.5 and COE-19 pH6.5
250mM) or deviate and have a stronger effect (COE-19 pH 5 and pH 8 250mM). Data from
Table 4.5, illustrate how much these deviate. Figure 4.3 can be similarly explained. At high
concentrations, shear thinning causes divergence in the ratio of diffusion times plots
indicating possible protein-protein interaction leading to aggregation. The deviation of 𝑘1 and
𝑘2 values coincide with these diffusion plots (Table 4.5). For example, the pH5 (no salt)
condition showed the most divergence for COE-03 at high concentrations (with IgG-AF) and
also had the highest 𝑘 values (𝑘1=3.18±0.17, 𝑘2=0.020.8±0.0003) for that group of
conditions.
Interestingly COE-19 has interesting physical behaviours i.e. highly prone to aggregation
(personal communication) whilst COE-03 behaviour is more what would be expected. This
suggests that although a size effect is observed for IgM-AF, it may be an unreliable tool to
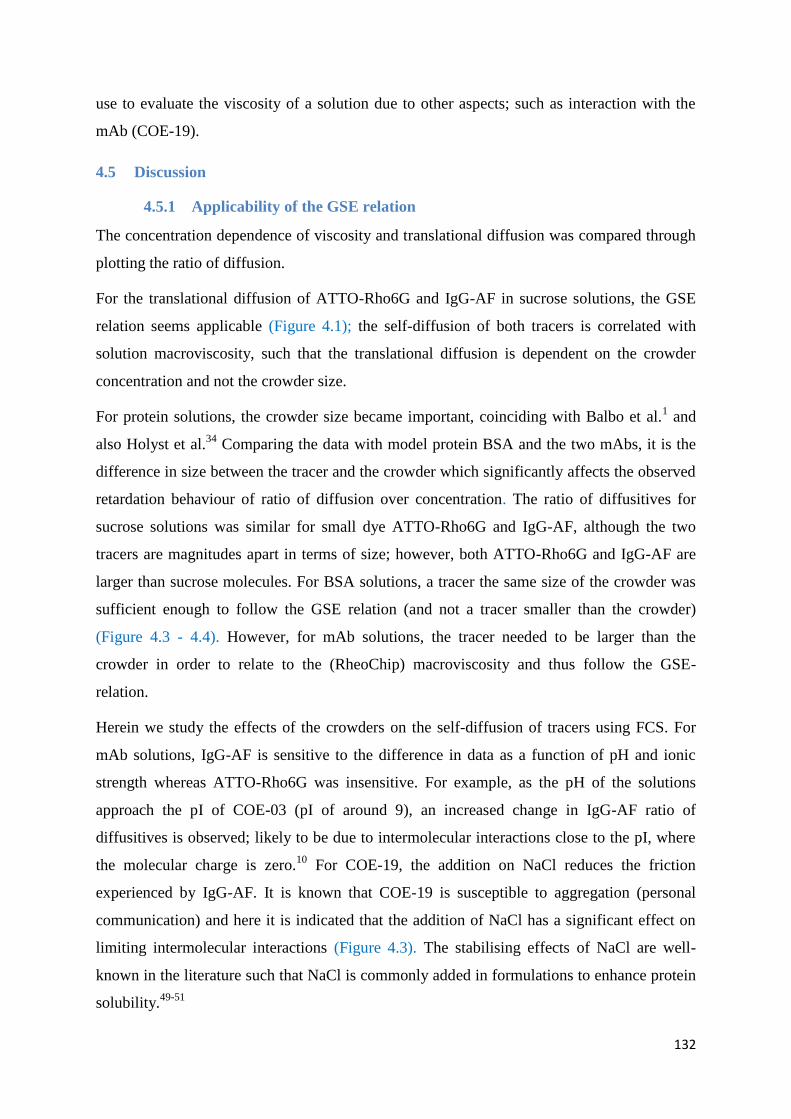
132
use to evaluate the viscosity of a solution due to other aspects; such as interaction with the
mAb (COE-19).
4.5 Discussion
4.5.1 Applicability of the GSE relation
The concentration dependence of viscosity and translational diffusion was compared through
plotting the ratio of diffusion.
For the translational diffusion of ATTO-Rho6G and IgG-AF in sucrose solutions, the GSE
relation seems applicable (Figure 4.1); the self-diffusion of both tracers is correlated with
solution macroviscosity, such that the translational diffusion is dependent on the crowder
concentration and not the crowder size.
For protein solutions, the crowder size became important, coinciding with Balbo et al.1 and
also Holyst et al.34
Comparing the data with model protein BSA and the two mAbs, it is the
difference in size between the tracer and the crowder which significantly affects the observed
retardation behaviour of ratio of diffusion over concentration. The ratio of diffusitives for
sucrose solutions was similar for small dye ATTO-Rho6G and IgG-AF, although the two
tracers are magnitudes apart in terms of size; however, both ATTO-Rho6G and IgG-AF are
larger than sucrose molecules. For BSA solutions, a tracer the same size of the crowder was
sufficient enough to follow the GSE relation (and not a tracer smaller than the crowder)
(Figure 4.3 - 4.4). However, for mAb solutions, the tracer needed to be larger than the
crowder in order to relate to the (RheoChip) macroviscosity and thus follow the GSE-
relation.
Herein we study the effects of the crowders on the self-diffusion of tracers using FCS. For
mAb solutions, IgG-AF is sensitive to the difference in data as a function of pH and ionic
strength whereas ATTO-Rho6G was insensitive. For example, as the pH of the solutions
approach the pI of COE-03 (pI of around 9), an increased change in IgG-AF ratio of
diffusitives is observed; likely to be due to intermolecular interactions close to the pI, where
the molecular charge is zero.10
For COE-19, the addition on NaCl reduces the friction
experienced by IgG-AF. It is known that COE-19 is susceptible to aggregation (personal
communication) and here it is indicated that the addition of NaCl has a significant effect on
limiting intermolecular interactions (Figure 4.3). The stabilising effects of NaCl are well-
known in the literature such that NaCl is commonly added in formulations to enhance protein
solubility.49-51
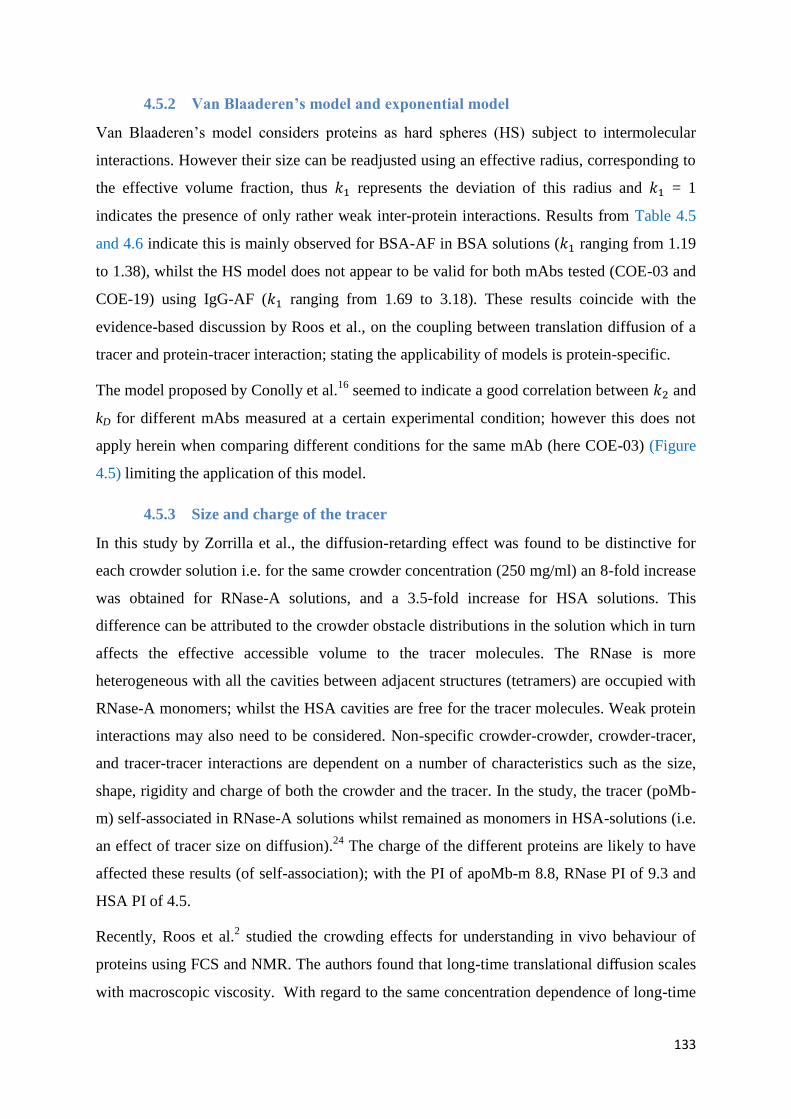
133
4.5.2 Van Blaaderen’s model and exponential model
Van Blaaderen’s model considers proteins as hard spheres (HS) subject to intermolecular
interactions. However their size can be readjusted using an effective radius, corresponding to
the effective volume fraction, thus 𝑘1 represents the deviation of this radius and 𝑘1 = 1
indicates the presence of only rather weak inter-protein interactions. Results from Table 4.5
and 4.6 indicate this is mainly observed for BSA-AF in BSA solutions (𝑘1 ranging from 1.19
to 1.38), whilst the HS model does not appear to be valid for both mAbs tested (COE-03 and
COE-19) using IgG-AF (𝑘1 ranging from 1.69 to 3.18). These results coincide with the
evidence-based discussion by Roos et al., on the coupling between translation diffusion of a
tracer and protein-tracer interaction; stating the applicability of models is protein-specific.
The model proposed by Conolly et al.16
seemed to indicate a good correlation between 𝑘2 and
kD for different mAbs measured at a certain experimental condition; however this does not
apply herein when comparing different conditions for the same mAb (here COE-03) (Figure
4.5) limiting the application of this model.
4.5.3 Size and charge of the tracer
In this study by Zorrilla et al., the diffusion-retarding effect was found to be distinctive for
each crowder solution i.e. for the same crowder concentration (250 mg/ml) an 8-fold increase
was obtained for RNase-A solutions, and a 3.5-fold increase for HSA solutions. This
difference can be attributed to the crowder obstacle distributions in the solution which in turn
affects the effective accessible volume to the tracer molecules. The RNase is more
heterogeneous with all the cavities between adjacent structures (tetramers) are occupied with
RNase-A monomers; whilst the HSA cavities are free for the tracer molecules. Weak protein
interactions may also need to be considered. Non-specific crowder-crowder, crowder-tracer,
and tracer-tracer interactions are dependent on a number of characteristics such as the size,
shape, rigidity and charge of both the crowder and the tracer. In the study, the tracer (poMb-
m) self-associated in RNase-A solutions whilst remained as monomers in HSA-solutions (i.e.
an effect of tracer size on diffusion).24
The charge of the different proteins are likely to have
affected these results (of self-association); with the PI of apoMb-m 8.8, RNase PI of 9.3 and
HSA PI of 4.5.
Recently, Roos et al.2 studied the crowding effects for understanding in vivo behaviour of
proteins using FCS and NMR. The authors found that long-time translational diffusion scales
with macroscopic viscosity. With regard to the same concentration dependence of long-time

134
translational diffusion, effective-sphere behaviour cannot even qualitatively describe the hen
egg white lysozyme experimental data. Similarly Roos et al. by PG-NMR found that upon
increasing the protein concentration, the translational diffusion of aB-crystallin nicely
followed the trend measured for the inverse solution viscosity. Despite its large size and
oligomeric structure, -crystallin in dilute solution behaves like a normal rigid globular
protein, showing no specificity in Brownian dynamics compared to other, even much smaller,
proteins.31
Rothe et al. observed the small solvent molecules diffuse faster than predicted
from the SE relation, at least with regards to the (macroscopic) solution viscosity. Under
crowding conditions these small probe molecules diffuse in an environment of much larger
surrounding particles, which renders the validity of the effective-medium approach
questionable with regards to estimating the macroscopic dispersion viscosity.29
Assessing the current literature, despite the high interest in crowding effects for
understanding in vivo behaviour of proteins, the effect on Brownian dynamics remains little
studied and controversial. Sherman et al. investigated intramolecular diffusion of denatured
molecules, studying the dependence of the intrachain dynamics on the concentration of the
denaturant, guanidinium chloride (GdmCl). The increase of the GdmCl concentration
expands the protein chain and significantly altered the viscosity. The intrachain diffusion
coefficient (𝐷) should depend on the internal friction generated by the probed loop itself and
its interaction with other parts of the chain, and on solution viscosity. However, 𝐷 values did
not change over the range of GdmCl concentrations in which solvent viscosity increases. One
explanation suggested was the changes in intrachain diffusion which may cancel the viscosity
effect. Another suggested explanation was that the intramolecular diffusion maybe dominated
by a profoundly constant internal friction. In order to investigate further, microscopic
investigations of the internal friction is required.52
Dauty et al. studied the influence of molecule crowding on the translational diffusion of a
range of macromolecules of different size and properties (including proteins, double stranded
DNAs and dextrans). The diffusion (𝐷) of all particles were reduced exponentially with
increasing Ficoll-70 concentration. The difference in change of diffusion was not influenced
by the tracer size as a function of Ficoll-70 concentration thus the study demonstrated a
previously unrecognised insensitivity of crowding. Our results with sucrose solutions
(discussed earlier) complement these findings. The HS model of diffusion in crowded
solutions (Equation 4.8) does not apply to these data.

135
4.6 Conclusion
Measurements of translation diffusion as a function of concentration can provide useful
information on the effects of molecular crowding on solution viscosity. FCS is chosen to
measure the translational diffusion (of tracers) due to the many orders of magnitude of time it
can accurately measure, using very dilute tracer concentrations. The data presented in this
study show a correlation with translation diffusion of the tracers and concentration of
crowder. However, whether the GSE relation is applicable and if the tracer is sensitive to
changes in solution properties (i.e. pH, salts, ionic strength), this is dependent on the tracer
size and tracer properties (which is dependent on the crowder properties); such as tracer-
crowder interaction (as indicated by data with IgM-AF). Utilising a tracer of size equal (or
larger) to the crowder size can detect changes in micro-rheology (providing it is the true self-
diffusion of the tracer which is measured). This study, along with related literature, shows the
scope of the FCS application to provide insight into intermolecular interactions governing
high viscosity of highly concentrated mAb solutions. With the development of computational
models, this application could reduce the number of studies in early formulation
development.

136
4.7 References
1. Balbo J, Mereghetti P, Herten D-P, Wade Rebecca C 2013. The Shape of Protein
Crowders is a Major Determinant of Protein Diffusion. Biophysical Journal 104(7):1576-
1584.
2. Roos M, Ott M, Hofmann M, Link S, Rössler E, Balbach J, Krushelnitsky A,
Saalwächter K 2016. Coupling and Decoupling of Rotational and Translational Diffusion of
Proteins under Crowding Conditions. Journal of the American Chemical Society
138(32):10365-10372.
3. Berteau C, Filipe-Santos O, Wang T, Rojas HE, Granger C, Schwarzenbach F 2015.
Evaluation of the impact of viscosity, injection volume, and injection flow rate on
subcutaneous injection tolerance. Medical Devices 8(1):473-484.
4. Dias C, Abosaleem B, Crispino C, Gao B, Shaywitz A 2015. Tolerability of High-
Volume Subcutaneous Injections of a Viscous Placebo Buffer: A Randomized, Crossover
Study in Healthy Subjects. American Association of Pharmaceutical Scientists 16(5):1101-
1107.
5. Jackisch C, Müller V, Maintz C, Hell S, Ataseven B 2014. Subcutaneous
Administration of Monoclonal Antibodies in Oncology. Geburtshilfe und Frauenheilkunde
74(4):343-349.
6. Fry A 2014. Injecting Highly Viscous Drugs. Pharmaceutical Technology 38(11). 2
November. Available from: http://www.pharmtech.com/injecting-highly-viscous-drugs
7. Burckbuchler V, Mekhloufi G, Giteau AP, Grossiord JL, Huille S, Agnely F 2010.
Rheological and syringeability properties of highly concentrated human polyclonal
immunoglobulin solutions. European Journal of Pharmaceutics and Biopharmaceutics
76(3):351-356.
8. Saluja A, Kalonia DS 2008. Nature and consequences of protein–protein interactions
in high protein concentration solutions. International Journal of Pharmaceutics 358(1):1-15.
9. Zhou H-X, Rivas G, Minton AP 2008. Macromolecular Crowding and Confinement:
Biochemical, Biophysical, and Potential Physiological Consequences. Annual Review of
Biophysics 37(1):375-397.
10. Yadav S, Shire SJ, Kalonia DS 2012. Viscosity behavior of high-concentration
monoclonal antibody solutions: Correlation with interaction parameter and electroviscous
effects. Journal of Pharmaceutical Sciences 101(3):998-1011.
11. Yadav S, Sreedhara A, Kanai S, Liu J, Lien S, Lowman H, Kalonia DS, Shire SJ
2011. Establishing a Link Between Amino Acid Sequences and Self-Associating and
Viscoelastic Behavior of Two Closely Related Monoclonal Antibodies. Pharmaceutical
Research 28(7):1750-1764.
12. Shire SJ 2009. Formulation and manufacturability of biologics. Current Opinion in
Biotechnology 20(6):708-714.
13. Liu J, Nguyen MDH, Andya JD, Shire SJ 2005. Reversible Self-Association Increases
the Viscosity of a Concentrated Monoclonal Antibody in Aqueous Solution. Journal of
Pharmaceutical Sciences 94(9):1928-1940.
14. Russo D 2008. The impact of kosmotropes and chaotropes on bulk and hydration shell
water dynamics in a model peptide solution. Chemical Physics 345(2–3):200-211.
15. Kanai S, Liu J, Patapoff TW, Shire SJ 2008. Reversible Self-Association of a
Concentrated Monoclonal Antibody Solution Mediated by Fab–Fab Interaction That Impacts
Solution Viscosity. Journal of Pharmaceutical Sciences 97(10):4219-4227.
16. Connolly BD, Petry C, Yadav S, Demeule B, Ciaccio N, Moore JMR, Shire SJ,
Gokarn YR 2012. Weak Interactions Govern the Viscosity of Concentrated Antibody
Solutions: High-Throughput Analysis Using the Diffusion Interaction Parameter. Biophysical
Journal 103(1):69-78.

137
17. Callaghan PT, Pinder DN 1983. A pulsed field gradient NMR study of self-diffusion
in a polydisperse polymer system: dextran in water. Macromolecules 16(6):968-973.
18. Swaminathan R, Bicknese S, Periasamy N, Verkman AS 1996. Cytoplasmic viscosity
near the cell plasma membrane: translational diffusion of a small fluorescent solute measured
by total internal reflection-fluorescence photobleaching recovery. Biophysical Journal
71(2):1140-1151.
19. Amin S, Rega CA, Jankevics H 2012. Detection of viscoelasticity in aggregating
dilute protein solutions through dynamic light scattering-based optical microrheology.
Rheologica Acta 51(4):329-342.
20. Muramatsu N, Minton AP 1988. An automated method for rapid determination of
diffusion coefficients via measurements of boundary spreading. Analytical Biochemistry
168(2):345-351.
21. Muramatsu N, Minton AP 1988. Tracer diffusion of globular proteins in concentrated
protein solutions. Proceedings of the National Academy of Sciences of the United States of
America 85(9):2984-2988.
22. Cherdhirankorn T, Best A, Koynov K, Peneva K, Muellen K, Fytas G 2009. Diffusion
in Polymer Solutions Studied by Fluorescence Correlation Spectroscopy. The Journal of
Physical Chemistry B 113(11):3355-3359.
23. Woll D 2014. Fluorescence correlation spectroscopy in polymer science. RSC
Advances 4(5):2447-2465.
24. Zorrilla S, Hink MA, Visser AJWG, Lillo MP 2007. Translational and rotational
motions of proteins in a protein crowded environment. Biophysical Chemistry 125(2):298-
305.
25. Phillies GDJ 1987. Dynamics of polymers in concentrated solutions: the universal
scaling equation derived. Macromolecules 20(3):558-564.
26. Digman MA, Brown CM, Sengupta P, Wiseman PW, Horwitz AR, Gratton E 2005.
Measuring Fast Dynamics in Solutions and Cells with a Laser Scanning Microscope.
Biophysical Journal 89(2):1317-1327.
27. Krichevsky O, Bonnet, G 2002. Fluorescence correlation spectroscopy: the technique
and its applications. Reports on Progress in Physics 65(1):251-297.
28. Ghosh R, Sharma S, Chattopadhyay K 2009. Effect of Arginine on Protein
Aggregation Studied by Fluorescence Correlation Spectroscopy and Other Biophysical
Methods†. Biochemistry 48(5):1135-1143.
29. Rothe M, Gruber T, Groger S, Balbach J, Saalwachter K, Roos M 2016. Transient
binding accounts for apparent violation of the generalized Stokes-Einstein relation in
crowded protein solutions. Physical Chemistry Chemical Physics 18(27):18006-18014.
30. Mooney M 1951. The viscosity of a concentrated suspension of spherical particles.
Journal of Colloid Science 6(2):162-170.
31. Roos M, Link S, Balbach J, Krushelnitsky A, Saalwächter K 2015. NMR-Detected
Brownian Dynamics of αB-Crystallin over a Wide Range of Concentrations. Biophysical
Journal 108(1):98-106.
32. Banks DS, Fradin C 2005. Anomalous Diffusion of Proteins Due to Molecular
Crowding. Biophysical Journal 89(5):2960-2971.
33. Michelman-Ribeiro A, Horkay F, Nossal R, Boukari H 2007. Probe Diffusion in
Aqueous Poly(vinyl alcohol) Solutions Studied by Fluorescence Correlation Spectroscopy.
Biomacromolecules 8(5):1595-1600.
34. Holyst R, Bielejewska A, Szymanski J, Wilk A, Patkowski A, Gapinski J, Zywocinski
A, Kalwarczyk T, Kalwarczyk E, Tabaka M, Ziebacz N, Wieczorek SA 2009. Scaling form
of viscosity at all length-scales in poly(ethylene glycol) solutions studied by fluorescence

138
correlation spectroscopy and capillary electrophoresis. Physical Chemistry Chemical Physics
11(40):9025-9032.
35. Hamrang Z, Pluen A, Zindy E, Clarke D 2012. Raster image correlation spectroscopy
as a novel tool for the quantitative assessment of protein diffusional behaviour in solution.
Journal of Pharmaceutical Sciences 101(6):2082-2093.
36. Bacia K, Schwille P 2003. A dynamic view of cellular processes by in vivo
fluorescence auto- and cross-correlation spectroscopy. Methods 29(1):74-85.
37. Ghenuche P, Rigneault H, Wenger J 2012. Hollow-core photonic crystal fiber probe
for remote fluorescence sensing with single molecule sensitivity. Optics Express
20(27):28379-28387.
38. Culbertson CT, Jacobson SC, Ramsey MJ 2002. Diffusion coefficient measurements
in microfluidic devices. Talanta 56(2):365-373.
39. Saluja A, Fesinmeyer RM, Hogan S, Brems DN, Gokarn YR 2010. Diffusion and
Sedimentation Interaction Parameters for Measuring the Second Virial Coefficient and Their
Utility as Predictors of Protein Aggregation. Biophysical Journal 99(8):2657-2665.
40. Marshall PN, Bentley SA, Lewis SM 1976. Purified azure B as a reticulocyte stain.
Journal of Clinical Pathology 29(12):1060-1063.
41. Wittekind D, Schulte E 1987. Standardized Azure B as a reticulocyte stain. Clinical
and Laboratory Haematology 9(4):395-398.
42. Penney DP, Powers JM, Frank M, Willis C, Churukian C 2002. Analysis and testing
of biological stains - the Biological Stain Commission Procedures. Biotechnic &
Histochemistry 77(5-6):237-275.
43. Arden-Jacob J, Drexhage K-H, Druzhinin SI, Ekimova M, Flender O, Lenzer T, Oum
K, Scholz M 2013. Ultrafast photoinduced dynamics of the 3,6-diaminoacridinium derivative
ATTO 465 in solution. Physical Chemistry Chemical Physics 15(6):1844-1853.
44. Mensink MA, Frijlink HW, van der Voort Maarschalk K, Hinrichs WLJ 2017. How
sugars protect proteins in the solid state and during drying (review): Mechanisms of
stabilization in relation to stress conditions. European Journal of Pharmaceutics and
Biopharmaceutics 114(1):288-295.
45. Bhatnagar BS, Bogner RH, Pikal MJ 2007. Protein Stability During Freezing:
Separation of Stresses and Mechanisms of Protein Stabilization. Pharmaceutical
Development and Technology 12(5):505-523.
46. Barber EJ 1996. Calculation of density and viscosity of sucrose solutions as a function
of concentration and temperature. National Cancer Institute Monographs 21(1):219-239.
47. Table - sucrose solutions, composition, viscosity, density [Internet]. Isotables.
Available from: http://lclane.net/text/sucrose.html
48. Rathgeber S, Beauvisage H-J, Chevreau H, Willenbacher N, Oelschlaeger C 2009.
Microrheology with Fluorescence Correlation Spectroscopy. Langmuir 25(11):6368-6376.
49. Gerhardt A, Bonam K, Bee JS, Carpenter JF, Randolph TW 2013. Ionic strength
affects tertiary structure and aggregation propensity of a monoclonal antibody adsorbed to
silicone oil–water interfaces. Journal of Pharmaceutical Sciences 102(2):429-440.
50. Mao Y-J, Sheng X-R, Pan X-M 2007. The effects of NaCl concentration and pH on
the stability of hyperthermophilic protein Ssh10b. BMC Biochemistry 8(1):28-28.
51. Ritchie C 2012. Protein purification. Mater Methods. 17 July. Available from:
https://www.labome.com/method/Protein-Purification.html
52. Sherman E, Haran G 2011. Fluorescence Correlation Spectroscopy of Fast Chain
Dynamics within Denatured Protein L. Chemphyschem. European Journal of Chemical
Physics and Physical Chemistry 12(3):696-703.

139
5 : INVESTIGATING
POLYSORBATE MICELLE
FORMATION BY FLUORESCENCE
CORRELATION SPECTROSCOPY

140
Research Article
Investigating Polysorbate Micelle Formation by Fluorescence Correlation Spectroscopy
in monoclonal antibody solutions
Maryam Shaha, #
, Katie Dayb, Shahid Uddin
b, Tom Jowitt
a, Robin Curtis
c, Christopher F. van
der Walleb and Alain Pluen
a*
a, School of Health Sciences, University of Manchester, Manchester, UK
b, MedImmune Ltd, Formulation Sciences, Granta Park, Cambridge, UK
c, School of Chemical Engineering and Analytical Sciences, University of Manchester,
Manchester, UK
#, first author
*, corresponding author: [email protected]

141
5.1 Abstract
Polysorbates are commonly used in biopharmaceutical (e.g. monoclonal antibody (mAb))
formulations to prevent surface-induced protein aggregation. The critical micelle
concentration (cmc) is an important parameter for surfactant functionality, thus it is taken into
account when deciding on the surfactant concentration. However, the mechanisms of
polysorbate micelle behaviour in high concentrated mAb solutions are still unclear, partly due
to the limitations of analytical techniques. This study demonstrates the use of fluorescence
correlation spectroscopy (FCS), with hydrophobic dye SYPRO® Orange, in labelling
surfactant micelles. As the dye only fluoresces though hydrophobic interaction, i.e.
incorporating into the micelle core, the cmc of three nonionic surfactants (Triton X-100,
polysorbate-20 and polysorbate-80) was accurately determined along with the micelle radius
(in water and in buffer). Additionally, micelles are detected in the presence of mAb, thus
demonstrating the scope of the method in assessing polysorbate behaviour in highly
concentrated mAb formulations.

142
5.2 Introduction
5.2.1 Polysorbates prevent surface-induced protein aggregation
Monoclonal antibodies (mAbs) are prone to interaction with surfaces which can lead to
partial unfolding and (subsequently) protein aggregation. In order to prevent surface-induced
aggregation, which is accelerated by agitation stress, stabilising agents are added in
formulations. Non-ionic surfactants have shown to be very efficient at preventing, or at least
considerably reducing, aggregation at interfaces.1,2
The surfactant is usually added after
ultrafiltration-diafiltration and prior to the bulk freezing step during manufacturing.3
Polysorbate-20 (PS-20) and polysorbate-80 (PS-80) are the most commonly used non-ionic
surfactants, with around 80% of commercially available mAbs containing either PS-20 or PS-
80 in the formulation.4 The two main mechanisms proposed for protein stabilisation are (i)
through competing with proteins at adsorption sites on interfaces and (ii) through interaction
with proteins by binding to hydrophobic regions of protein surfaces. Both mechanisms
prevent protein aggregation by reducing protein-protein interactions. From these, the first
mechanism is classed as the most dominant mechanism for mAb solutions. Studies have
shown surfactants are thermodynamically favoured over proteins for adsorption at the
interface.3,5,6
Several studies have observed interaction with polysorbates for proteins with
hydrophobic regions on surfaces such as human growth hormone and bovine serum
albumin.3,7-10
Whereas, studies on mAb-polysorbate interaction have reported interaction
between mAb and polysorbates to be very weak / negligible and likely play no significant
role for stabilisation.3,11
5.2.2 Importance of surfactant concentration and the cmc
The functionality of surfactants is dependent on the surfactant concentration; as the protective
effects of surfactants is related to the coverage of the surface by surfactant monomers. Thus,
the functionality of surfactants is affected by the critical micelle concentration (cmc), defined
as the concentration above which micelles start to form spontaneously. The cmc is the most
commonly preferred functionality-related parameter as it reflects complete surface coverage
to prevent protein-interface interaction. Below the cmc polysorbates are monomeric, whilst
above the cmc micelles form as the surfaces are saturated with polysorbate and additional
surfactant form micelles due to their amphipathic nature. Micelles are self-assembled
surfactant complexes formed to limit the interaction of the nonpolar groups (tails) to the
aqueous solution.4,12
The typical concentration range used for nonionic surfactants is 0.001-
0.1% (w/v). The concentration chosen is usually based on the lowest effective concentration

143
which stabilised the protein upon interfacial stress; this is usually just above the cmc. A
concentration of surfactant too high may result in the formation of protein-micelle complexes
which may cause immune responses.13-15
The cmc for almost all surfactants are listed in the literature for pure water. However, the cmc
is affected by parameters such as temperature; whereby a reduction in the cmc has been
correlated with increasing temperature for nonionic surfactants.16-18
The cmc of ionic
surfactants is also affected by changes in pH and ionic strength, but this has not been
observed for nonionic surfactants.19,20
The cmc measured in a specific formulation (rather
than the pure PS in water) is termed as the ‘apparent cmc’.
5.2.3 Experimental detection of micelles
Typically, to determine the cmc a measured parameter is correlated against surfactant
concentration and the onset of micelle formation is experimentally observed by a significant
change in the measured parameter.21
There are a large number of techniques that exist to
measure the cmc of surfactants. Common methods include surface tension,3 conductivity,
spectrophotometry22,23
and light scattering (e.g. dynamic light scattering, DLS).24,25
Advantages of such techniques include ease of use and that the equipment is largely
available. Disadvantages include costly equipment, time-consuming and interference from
solution components. Measuring the cmc in presence of proteins is not straightforward. This
may partly be the reason for the limited literature on the effect of mAb concentration on cmc
and micelle behaviour, especially in high concentrated mAb solutions. For example, DLS is
affected by solution components (e.g. protein monomers, protein aggregates, surfactants,
silicone oil, dust etc.), thus can only be applied to determine the cmc in pure surfactant
solutions. Protein molecules tend to be a similar size to micelles and the system cannot
differentiate between the two populations.13
Surface tension is used to determine cmc in
protein solutions, however it only deducts presence of micelles indirectly from the data of
surface saturation and so cannot provide direct information on presence of micelles.13
Patist
et al. have shown while assessing nine nonionic surfactants, that dye micellization methods
were more accurate at determining the cmc in comparison to surface tension measurements
which were sensitive to the presence of surface active impurities.26
In the last few years,
Horiuchi et al. proposed the use of ultrasonic resonance technology (URT) to determine cmc
in protein solutions. URT catches signal from changes in protein structure and hydration
condition around the protein. The presence of protein amplifies the signal of ultrasound
velocity so far that micellisation was detectable. However, URT is sensitive to foreign matter

144
(particularity large particles) and also unable to determine the cmc in protein-free
formulations.13
Fluorescence correlation spectroscopy (FCS) is a single molecule technique, measuring
fluctuations in the fluorescence intensity in the confocal volume. It yields the translational
diffusion coefficient of a fluorescent molecule in a solution. The method has been applied to
determine the cmc of various surfactants, including PS-20, in buffered solutions (in absence
of mAb) using commercially available dyes.27-30
Herein, this work demonstrates the scope of
FCS, using a moderately hydrophobic dye SYPRO® Orange, to detect micelles in high
concentration mAb solutions.
5.3 Materials and Methods
5.3.1 Materials
SYPRO® Orange and Rhodamine-123 (R123) dyes were obtained from Thermo Scientific
(Leicestershire, UK).
Surfactants (PS-20, PS-80, and Triton X-100 (TX100)) and buffer components (L-histidine)
were of analytical grade or higher, purchased from Sigma Aldrich (Dorset, UK) and used
without further purification. All buffers and solutions were prepared with Millipore de-
ionised water (18 MΩ.cm).
The monoclonal antibody, COE-03 (IgG1, MW 145kDa, pI 8.44), was supplied by
MedImmune at stock concentration of 40.2 mg/ml.
5.3.2 Methods
5.3.2.1 Sample Preparation
The buffer formulation used for all solutions (pure polysorbate, pure mAb or a mixture of
both) was 25 mM histidine, 240 mM sucrose at pH 6.0.
All solutions with SYPRO® Orange were prepared to a final concentration of 0.2× and 1× for
FCS and spectrophotometry measurements, respectively. All solutions with R123 were
prepared to a final concentration of 10 nM for FCS measurements.
The range of concentrations measured for each surfactant varied in order to obtain enough
points before and after the change of slope in the concentration plots. Dilutions were prepared
from stock concentration of 5% w/v surfactant.

145
The mAb (COE-03) solution was concentrated via ultracentrifugation using an amicon ultra-4
centrifugal filter unit with a membrane of 50kDa (Sigma, Dorset), to a concentration of
approximately 180 mg/ml.
5.3.2.2 Spectrofluorometry
Fluorescence intensity (INT) was measured with a Tecan Safire plate reader (Tecan Trading,
Switzerland) which utilises the Magellan V7.1 software for system set-up. SYPRO® Orange
samples were excited at 460 nm and emitted at 560-615 nm. For each measurement, 200 l of
sample was measured.
5.3.2.3 Fluorescence correlation spectroscopy (FCS)
A Zeiss LSM 510 ConfoCor 2 setup (Zeiss, Jena, Germany) equipped with a 40x/1.2NA
water immersion objective was used. For each measurement, 100 l of sample was measured.
The Argon laser was operated at 488nm for SYPRO Orange and R123 and fluorescence
collected at 560-615nm and 505-550nm, respectively. System calibration was performed with
Rhodamine GreenTM
(diffusion coefficient of 2.8 × 10⁻⁶
cm2/sec; Life technologies). System
calibration determines the laser beam waist size and optimises the optical setup for further
experiments. The laser beam waist size is estimated using Equation 5.1:
𝜏𝐷 =𝜔𝑜2
4𝐷⁄
Equation 5.1
where, 𝜏𝐷 corresponds to the diffusion time, ωo is the laser waist beam and D is the diffusion
coefficient.
After calibration, the determined laser waist beam size can be applied to the subsequent
experimental data to determine the diffusion coefficient through applying Equation 1. The
radius is then determined using the Stokes Einstein equation (Equation 5.2):
𝐷 = 𝑘𝑇 6𝜋𝜂𝑅⁄ Equation 5.2
where, 𝐷 is the diffusion coefficient, 𝑅 is the hydrodynamic radius, 𝑘 is Boltzmann’s constant
and 𝜂 represents the solution viscosity.
5.3.2.4 Rheometer measured viscosity of mAb solutions
Viscosity (mPa.s) was measured using an Anton Paar MCR-301 rheometer (Anton Paar, UK)
with CP40-0.3 cone/plate attachment. 150µl of sample was measured with a shear rate of
1000 s-1
.

146
5.3.2.5 Isothermal titration calorimetry (ITC) of mAb binding to PS-20
ITC was used to identify any mAb (COE-03) binding interaction with PS-20. A Malvern
PEAQ ITC (Malvern, UK) was used to quantitate molecular interactions by measuring the
heat transfer during a binding event. Binding affinity, stoichiometry and entropy of a reaction
is detected by titrating in a ligand (i.e. PS-20), from an injector into a well containing the
protein. A series of small aliquots are injected until the binding detected reaches equilibrium.
Twenty injections of 0.1% w/v PS-20 at 25C (10 l per injection) were titrated into the well
containing 10mg/ml mAb, with a three minute spacing. A blank experiment in which PS-20
was titrated into buffer was also used to subtract the heat of dilution of PS-20. The molar
binding enthalpy (∆𝐻) were analysed using the manufacturer software and the kD determined
from the fit of ∆𝐻 to molar ratio.
5.4 Results and Discussion
5.4.1 Validation of SYPRO® Orange to determine the cmc
In order to validate FCS-SYPRO® Orange as an appropriate method, the cmc of PS-20 in
water (Figure 5.1) and in buffer (Figure 5.2) was determined initially using
spectrofluorometry in presence of SYPRO® Orange (as described in the methods). The cmc
in water was determined as 0.0072 (±0.0046) % w/v PS-20 which is consistent with
literature.31
The cmc of PS-20 in buffer was determined at a lower concentration of 0.0031
(±0.0015) % w/v. However, these results were not statistically different (at p = 0.05).
Figure 5.1: INT determined by spectrofluorometry of PS-20 solutions in water, in the presence of
SYPRO® Orange, in order to determine the cmc.
INT determined by spectrofluorometry of PS-20 solutions in water, in the presence of 1𝗑 SYPRO®
Orange. Plots represent averages with std. dev for n=3. Cmc determined from point of intersection at
0.0072% w/v (linear fits applied using Origin Software; error of 0.0046 % determined).

147
Figure 5.2: INT determined by spectrofluorometry of PS-20 solutions in histidine/sucrose buffer, in
the presence of SYPRO® Orange, in order to determine the cmc.
INT determined by spectrofluorometry of PS-20 solutions in histidine/sucrose buffer (pH6), in the
presence of 1𝗑 SYPRO® Orange. Plots represent averages with std. dev for n=3. Cmc determined
from point of intersection at 0.0031% w/v (linear fits applied using Origin Software; error of 0.0015
% determined).
5.4.2 Determining the cmc by FCS with SYPRO® Orange
The cmc of nonionic surfactant Triton X-100 (TX100) has been previously determined using
FCS by Pineiro et al. using R123 dye.30
In this section, we repeat their method and
subsequently present the use of SYPRO® Orange to determine the cmc using FCS.
With R123 solutions, the diffusion coefficient is used to determine the cmc and we
extrapolate a value of 0.017(±0.012) % w/v (Figure 5.3) which coincides with literature.30
Below the cmc, the diffusion time will be that of the dye alone in solution, whereas above the
cmc the dye will incorporate into the micelle. However, not all of the dye will be bound –
there will also be some free dye in solution and the proportion of free and bound dye will
vary depending on the surfactant concentration. The dye molecule is constantly exchanging
between the aqueous and micelle environment, and due to the fast exchange equilibrium two
species are not observed. As the surfactant concentration (and so the micelle concentration)
increases, less of the dye will be free and thus the ‘mean diffusion time’ (combined diffusion
time of free and bound dye) will increase. Thus, the cmc can be determined through plotting
the (mean) diffusion time against the surfactant concentration.30
With SYPRO® Orange solutions, the cmc is determined using the FCS determined number
of particles. SYPRO® Orange will only fluoresce when incorporated into the micelle and so
below the cmc, the number of fluorescent particles is fundamentally nil and the diffusion time
is not representable due to poor correlation (illustrated by chi2 values). Above the cmc, the

148
FCS number of particles is correlated with the surfactant concentration and the diffusion time
represents the (apparent) micelle diffusion time, such that the micelle radius can be directly
determined without the need of complex data analysis. Using this approach, the cmc was also
determined as 0.017 (±0.011) % w/v (Figure 5.4). Above the cmc, a radius of around 5nm is
determined from the diffusion time of SYPRO® Orange solutions (as described in the
methods), which is also consistent with previous literature of a TX100 micelle (values 4.84
and 5.3nm have been determined by DLS).32
Thus, it can be established that SYPRO®
Orange is incorporated into micelles. Below the cmc, the chi2
(correlation fit) is very poor and
thus the diffusion time carries no worth for these measurements.
One point which requires discussion is the non-existent plateau in the figure of TX100 and
R123 (Figure 5.3). The diffusion coefficient for micelles should (eventually) plateau out
above the cmc - as seen in the INT measurements (Figures 5.1 and 5.2) and TX100 with
SYPRO® Orange (Figure 5.4). The difference between the two probes (R123 and SYPRO®
Orange) may explain this difference of data. Freire et al.33
assessed the behaviour of cationic
fluorophore R123, with various nonionic and ionic surfactants. R123 presented affinity to
surfactant micelles with the behaviour explained by the partition equilibrium model with the
existence of free dye and bound dye. At the surfactant concentrations used, a certain
proportion of the free dye was always present – thus we may need to reach much higher
surfactant concentrations in order to observe the plateau with R123. Pineiro et al. also stated
that it is incorrect to assume the fraction of free dye and bound dye are two static species;
empirical models are required for quantifications. The figures in the Pineiro paper show the
start of a plateau to be around 0.6 – 1.2 % w/v TX100.30
This concentration range is much
higher than the concentration range assessed herein (highest concentration of 0.3% w/v
TX100) (Figure 5.3). The lack of plateau for any following graphs (i.e. Figures 5-5-5.7) may
also be explained by the need to assess higher surfactant concentrations.

149
Figure 5.3: FCS-determined parameters of TX100 solutions in the presence of R123, in order to
determine the cmc.
FCS-determined diffusion coefficient (D) (filled black triangles), counts per molecule (filled blue
squares), and chi2 (open grey diamonds) of TX100 solutions in the presence of 10nM R123. Symbols
represent averages plus std. dev for n=5. Cmc determined from point of intersection of 0.017% w/v
(linear fits – bold black lines - applied using Origin Software; error of 0.012 % determined).
Figure 5.4: FCS-determined parameters of TX100 solutions in the presence of SYPRO® Orange in
order to determine the cmc.
FCS-determined number of particles (filled black squares) diffusion time (filled red circles), and chi2
(open grey diamonds) of TX100 solutions (in water) in the presence of 0.2𝗑 SYPRO® Orange.
Symbols represent averages plus std. dev (n=5).Cmc determined from point of intersection as 0.017%
w/v (linear fits – bold black lines - applied using Origin Software; error of 0.011 % determined).

150
This initial data with TX100 validate the FCS/SYPRO® Orange method to determine the
cmc on the nonionic surfactant. The method was then applied to polysorbates, PS-80 and PS-
20. Figures 5.5 and 5.6 present the FCS data (using SYPRO® Orange) for PS-80 and PS-20
samples in water with determined cmc values of 0.0016 (±0.0012) % and 0.007 (±0.003) %
w/v, respectively, which match the literature. PS-20 solutions in histidine/sucrose buffer were
also measured and a slightly lower cmc of 0.0036 (±0.002) % w/v was determined (Figure
5.7) – similar to the cmc value determined by spectrofluorometry. Again, statistical
differences (at p = 0.05) were not observed between the cmc of PS-20 in water and in buffer.
The radius was determined from the diffusion time of SYPRO® Orange solutions at PS
concentrations above the cmc: For water and buffer solutions, a radius of around 3nm was
determined which coincides with the literature (values between 2.7 – 3.5 nm have been
determined for PS-20 and PS-80 micelles).34-36
For all solutions, deterioration in the chi2 is
observed as a function of surfactant concentration, particularly below the apparent cmc.
Figure 5.5: FCS-determined parameters of PS-80 solutions in the presence of SYPRO® Orange in
water, in order to determine the cmc.
FCS-determined number of particles (filled black squares) diffusion time (filled red circles), and chi2
(open pink diamonds) of PS-80 solutions in the presence of 0.2x SYPRO® Orange in water. Symbols
represent averages plus std. dev (n=5). Cmc determined as 0.0016% w/v (linear fits – bold black lines
- applied using Origin Software; error of 0.0012 % determined).
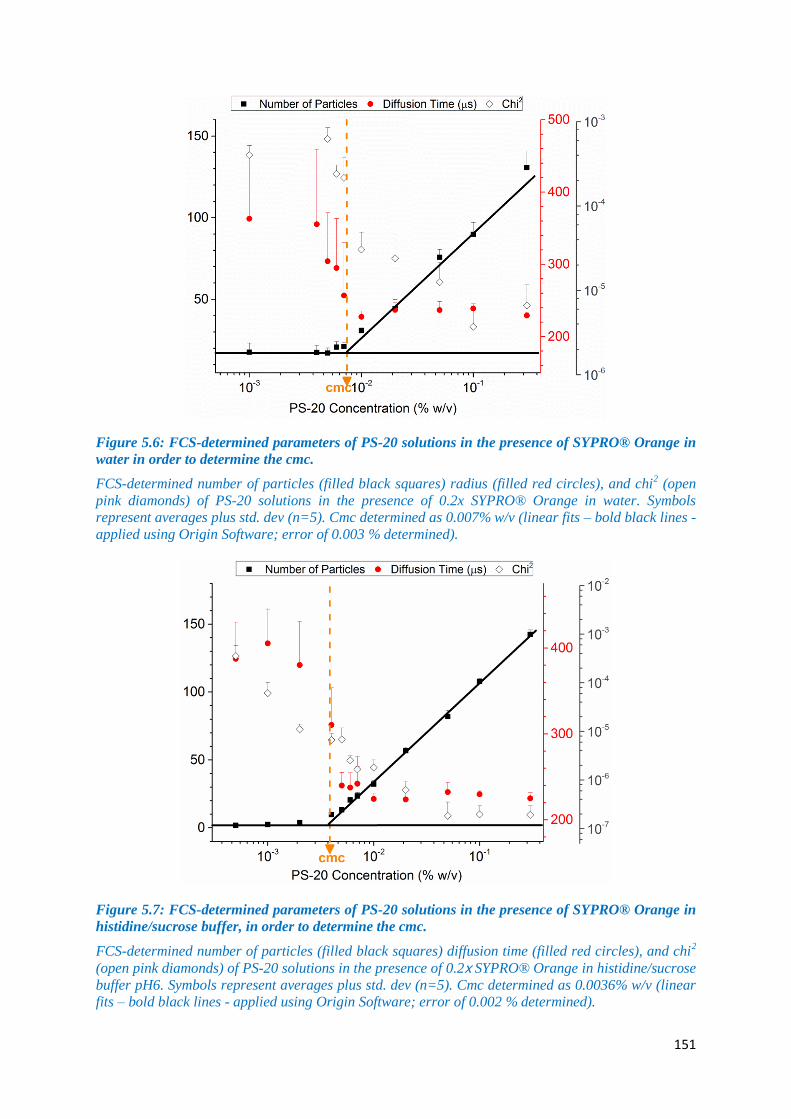
151
Figure 5.6: FCS-determined parameters of PS-20 solutions in the presence of SYPRO® Orange in
water in order to determine the cmc.
FCS-determined number of particles (filled black squares) radius (filled red circles), and chi2 (open
pink diamonds) of PS-20 solutions in the presence of 0.2x SYPRO® Orange in water. Symbols
represent averages plus std. dev (n=5). Cmc determined as 0.007% w/v (linear fits – bold black lines -
applied using Origin Software; error of 0.003 % determined).
Figure 5.7: FCS-determined parameters of PS-20 solutions in the presence of SYPRO® Orange in
histidine/sucrose buffer, in order to determine the cmc.
FCS-determined number of particles (filled black squares) diffusion time (filled red circles), and chi2
(open pink diamonds) of PS-20 solutions in the presence of 0.2𝗑 SYPRO® Orange in histidine/sucrose
buffer pH6. Symbols represent averages plus std. dev (n=5). Cmc determined as 0.0036% w/v (linear
fits – bold black lines - applied using Origin Software; error of 0.002 % determined).
152
Based on all of the above results, it can be established that FCS with the utilisation of
SYPRO® Orange, is a sensitive measure of detecting micelles and can accurately determine
the cmc of solutions along with the micelle size. The cmc values of the three surfactants
(TX100, PS-20 and PS-80) are largely different e.g. by a magnitude of around 4.4𝗑 between
PS-20 and PS-80 (in water). As aforementioned, substantial differences in the cmc of
nonionic surfactants, due to solution properties, are typically not observed. Both techniques
in this study, i.e. spectrofluorometry and FCS, detected apparent differences in cmc for
different solvents (i.e. between water and buffer) however these were not statistically
different (there was a smaller differences in magnitude between the (apparent) cmc values i.e.
around 2.2𝗑 between PS-20 in water and PS-20 in buffer). Thus current methods are not
sensitive to measuring changes in cmc of a nonionic surfactant in different buffers (in
absence of mAb).
5.4.3 FCS / SYPRO® Orange micelle detection in mAb solutions
Concentrated mAb solutions of 75, 100 and 150 mg/ml were assessed with a number of PS-
20 concentrations above the apparent PS-20 cmc in buffer (determined previously). SYPRO®
Orange with mAb alone (i.e. in absence of surfactant) generated an insufficient correlation to
generate any data, as did the dye alone in buffer, indicating insufficient interaction between
the hydrophobic dye and native protein (data not shown).
For each PS-20 concentration assessed (0.007%, 0.01%, 0.02% and 0.05% w/v) the diffusion
time, number of particles and chi2
were compared between the mAb solutions and the
respective buffer solution. The PS: protein ratio was determined for all mAb solutions
(through calculating the mol/L for COE-08 and PS-20 for each solution and determining the
ratio of PS-20 over protein) and compared with the data. The only mAb solution which did
not show significant differences (p < 0.05) across the parameters (i.e. diffusion time and
number of particles) was the 75mg/ml mAb 0.05% w/v PS-20; which had the highest PS:
protein ratio (Table 5.1).

153
Table 5.1: FCS parameters and PS: protein ratio of mAb solutions in presence of SYPRO®
Orange.
FCS parameters (diffusion time, number of particles and chi2) of mAb solutions in presence of
SYPRO® Orange, along with the PS: protein ratio. Values represent averages with their std. dev for
n=5.
PS-20
Concentration
(% w/v)
mAb
Concentration
Number of
Particles
Diffusion
Chi2 PS: protein
ratio
0.007 Buffer only 26 ± 3 242 ± 20 2E-6 ± 1E-6
75mgml* 42 ± 6* 391 ± 111* 2E-5 ± 1E-5* 0.11
100mgml* 63 ± 15* 474 ± 118* 3E-5 ± 2E-5* 0.08
0.01 Buffer only 40 ± 3 224 ± 7 2E-6 ± 9E-7
75mgml* 49 ± 9* 302 ± 58* 8E-6 ± 6E-6* 0.16
100mgml* 63 ± 20* 421 ± 148* 4E-5 ± 2E-5* 0.12
0.02 Buffer only 57 ± 3 223 ± 12 6E-7 ± 3E-7
75mgml 69 ± 6* 248 ± 26 3E-6 ± 2E-6* 0.31
100mgml* 97 ± 31* 411 ± 123* 8E-6 ± 7E-6* 0.24
150mgml* 115 ± 10* 708 ± 162* 4E-5 ± 3E-5* 0.16
0.05 Buffer only 82 ± 6 232 ± 11 2E-7 ± 2E-7
75mgml 77 ± 7 258 ± 35 2E-6 ± 2E-6 0.79
100mgml* 183 ± 53* 588 ± 114* 3E-6 ± 6E-7* 0.59
* indicates significant difference with the respective buffer only solution (i.e. at same PS-20
concentration).
Diffusion Time
Using the Stokes Einstein relation (Equation 5.2) and Equation 5.1, a relation between the
diffusion time and solution’s viscosity is obtained. Studies have demonstrated the correlation
between solution viscosity with protein concentration and the solution viscosity has been
reported to affect both the FCS diffusion time and number of particles.37-39
To assess if the
relation applies to this data, the viscosity of the mAb solutions was measured, as described in
the methods, and comparisons were made with both FCS parameters. A poor correlation was
determined (R2 of 0.32) between the solution viscosity and the FCS number of particles (data
not shown). The relation between the FCS diffusion time and the viscosity of the mAb
solutions is shown in Figure 5.8 and a correlation is observed; although not very strong (R2
value of 0.64). As the data shows that the diffusion time of SYPRO® Orange surfactant
solutions in the presence of mAb does not statistically change to suggest the presence of large
structures, the diffusion time change is likely a result of change in viscosity combined with
the change in number of particles.

154
Figure 5.8: Viscosity (cone plate method) plotted against the FCS diffusion times of concentrated
mAb solutions.
Macro-viscosity (cone plate method) plotted against the FCS diffusion times (with 0.2𝗑 SYPRO®
Orange) of concentrated mAb solutions (75, 100, 150 mg/ml COE-03).
mAb-PS Interaction
Due to the possible mAb-polysorbate interaction (resulting in mAb-PS complexes) at high
mAb concentrations, the binding of PS-20 to mAb (COE-03) was investigated using
Isothermal titration calorimetry (ITC).
To test the levels at which PS-20 is usable as a ligand, several different concentrations were
titrated ranging from 1% w/v to 0.05% w/v PS-20. At concentrations greater than 0.1% w/v
large interaction heats observed were most likely due to dissolution of the micelles. Based on
this, higher concentrations than 0.1% w/v were not used due to extremely large heats of
dilution (Figure 5.9). PS-20 solution (0.1% w/v) was titrated into 10mg/ml COE-03.
Subtraction of PS-20 alone gave the results shown in Figure 5.10.

155
Figure 5.9: Isothermal titration calorimetry thermogram recorded for injection of 0.1% w/v PS-20
into PBS.
Isothermal titration calorimetry thermogram recorded for injection of 0.1% w/v PS-20 solution into
PBS showing quite large heats.
Figure 5.10: Isothermal calorimetry results for injection of 0.1% w/v PS-20 into 10mg/ml COE-03.
(top) Isothermal titration calorimetry thermogram recorded for injection of 0.1% PS-20 into 10mg/ml
COE-03 and (bottom) the theoretical curve fitted to the integrated data of heat released to the molar
ratio.

156
Based on this analysis, there seems to be a very slight interaction with a total negative
enthalpy change of 1.29 kcal/mol. The fit seems to suggest that the interaction has a kD of
approximately 24 M, with approximately 4 binding sites (n-value of 0.28). This is indicative
of a very slight endothermic process. This heat change may be attributed by surfactant
binding to protein and/or micelle dissociation.40-42
Nevertheless, this interaction is very weak
and barely detectable, thus the experiment failed to detect any mAb-PS interaction for the
conditions assessed.
Number of particles
In the water or buffer only PS-20 solutions (i.e. in absence of mAb) the FCS number of
particles increased with PS-20 concentration, for concentrations above the cmc (Figure 5.5
and Figure 5.7). As the dye is incorporated into the micelle, this suggests the FCS number of
particles correlates with the micelle population. The question is, can this relation be applied
to solutions containing high concentration mAb: FCS is prone to artefacts with high
concentration solutions, thus the parameters and other solution factors need to be considered
with mAb solutions. An increase in the diffusion time with the number of particles could be a
possible effect of refractive index issues which have led to a larger detection volume and thus
longer diffusion time; rather than a result of a change in the fluorescent population i.e.
micelle numbers.38,43
In this study, both the diffusion time and the number of particles
increase with increasing mAb concentration, although a linear correlation is not established
due to the aforementioned influence of solution viscosity. As ITC failed to support an
increase in number of particles, the apparent increase of particles is likely to be related to the
increase in measured volume and not on the creation of mixed micelles.
PS: Protein ratio
The only mAb solution which did not show a change in diffusion time or number of particles
was the solution with the highest PS: protein ratio of 0.79 (Table 5.1). This is an interesting
finding suggesting the micelle behaviour is affected when the polysorbate ratio is below a
certain level (or when the protein ratio is above a certain level). However, the explanation for
the change in data here, and what is represents, is beyond the scope of this study. Moreover,
this result needs confirmation. It would be constructive to add more ratios to the data set in
order to assess if PS: protein ratio is influencing the measured data - solutions with PS:
protein ratios larger than 0.79 and in between 0.79 and 0.59 (the next highest PS: protein ratio
which did show a change in the measured data). The surfactant: protein ratio has been classed

157
as an important parameter on the protective effects of surfactants i.e. at preventing agitation-
induced aggregation.8,10,44
Another factor which should be considered is the properties of the
protein itself; as the surface activity varies between proteins thus the competition between the
protein and the surfactant molecules (at interfaces) will be affected.9
5.5 Conclusion
The behaviour of proteins and polysorbates are complex, and in protein formulations the
properties of the protein (hydrophobicity, surface activity) and concentration (or ratios) need
to be considered. To enable further understanding of their behaviours, developments of new
analytical systems are required. In this study, it is shown that fluorescence correlation
spectroscopy (FCS), utilising SYPRO® Orange dye, can be used to determine the cmc, as
well as the micelle size of nonionic surfactants. The potential application of detecting
micelles in the presence of mAb, using the FCS-SYPRO® Orange application, may provide
valuable input in gaining information on micelle behaviour in mAb formulations and thus
contribute towards formulation development.

158
5.6 References
1. Jones LS, Bam NB, Randolph TW 1997. Surfactant-Stabilized Protein Formulations:
A Review of Protein-Surfactant Interactions and Novel Analytical Methodologies.
Therapeutic Protein and Peptide Formulation and Delivery. Washington, U.S: American
Chemical Society.
2. Shah M, Rattray Z, Day K, Uddin S, Curtis R, van der Walle CF, Pluen A 2017.
Evaluation of aggregate and silicone-oil counts in pre-filled siliconized syringes: An
orthogonal study characterising the entire subvisible size range. International Journal of
Pharmaceutics 519(1):58-66.
3. Khan TA, Mahler H-C, Kishore RSK 2015. Key interactions of surfactants in
therapeutic protein formulations: A review. European Journal of Pharmaceutics and
Biopharmaceutics 97(1):60-67.
4. Martos A, Koch W, Jiskoot W, Wuchner K, Winter G, Friess W, Hawe A 2017.
Trends on Analytical Characterization of Polysorbates and Their Degradation Products in
Biopharmaceutical Formulations. Journal of Pharmaceutical Sciences 106(7):1722-1735.
5. Mahler H-C, Senner F, Maeder K, Mueller R 2009. Surface activity of a monoclonal
antibody. Journal of Pharmaceutical Sciences 98(12):4525-4533.
6. Hillgren A, Lindgren J, Aldén M 2002. Protection mechanism of Tween 80 during
freeze–thawing of a model protein, LDH. International Journal of Pharmaceutics 237(1):57-
69.
7. Ruiz-Peña M, Oropesa-Nuñez R, Pons T, Louro SRW, Pérez-Gramatges A 2010.
Physico-chemical studies of molecular interactions between non-ionic surfactants and bovine
serum albumin. Colloids and Surfaces B: Biointerfaces 75(1):282-289.
8. Bam NB, Cleland JL, Yang J, Manning MC, Carpenter JF, Kelley RF, Randolph║
TW 1998. Tween protects recombinant human growth hormone against agitation-induced
damage via hydrophobic interactions. Journal of Pharmaceutical Sciences 87(12):1554-1559.
9. Deechongkit S, Wen J, Narhi LO, Jiang Y, Park SS, Kim J, Kerwin BA 2009.
Physical and biophysical effects of polysorbate 20 and 80 on darbepoetin alfa. Journal of
Pharmaceutical Sciences 98(9):3200-3217.
10. Chou DK, Krishnamurthy R, Randolph TW, Carpenter JF, Manning MC 2005.
Effects of Tween 20® and Tween 80® on the Stability of Albutropin During Agitation.
Journal of Pharmaceutical Sciences 94(6):1368-1381.
11. Garidel P, Hoffmann C, Blume A 2009. A thermodynamic analysis of the binding
interaction between polysorbate 20 and 80 with human serum albumins and
immunoglobulins: A contribution to understand colloidal protein stabilisation. Biophysical
Chemistry 143(1):70-78.
12. Cui X, Mao S, Liu M, Yuan H, Du Y 2008. Mechanism of Surfactant Micelle
Formation. Langmuir 24(19):10771-10775.
13. Horiuchi S, Winter G 2015. CMC determination of nonionic surfactants in protein
formulations using ultrasonic resonance technology. European Journal of Pharmaceutics and
Biopharmaceutics 92(1):8-14.
14. Hermeling S, Schellekens H, Crommelin DJA, Jiskoot W 2003. Micelle-Associated
Protein in Epoetin Formulations: A Risk Factor for Immunogenicity? Pharmaceutical
Research 20(12):1903-1907.
15. Singh SK 2011. Impact of Product-Related Factors on Immunogenicity of
Biotherapeutics. Journal of Pharmaceutical Sciences 100(2):354-387.
16. Mohajeri E, Noudeh GD 2012. Effect of Temperature on the Critical Micelle
Concentration and Micellization Thermodynamic of Nonionic Surfactants: Polyoxyethylene
Sorbitan Fatty Acid Esters. E-Journal of Chemistry 9(4):2268-2274.

159
17. Chen L-J, Lin S-Y, Huang C-C, Chen E-M 1998. Temperature dependence of critical
micelle concentration of polyoxyethylenated non-ionic surfactants. Colloids and Surfaces A:
Physicochemical and Engineering Aspects 135(1):175-181.
18. Hait SK, Moulik SP 2001. Determination of critical micelle concentration (CMC) of
nonionic surfactants by donor-acceptor interaction with lodine and correlation of CMC with
hydrophile-lipophile balance and other parameters of the surfactants. Journal of Surfactants
and Detergents 4(3):303-309.
19. Fuguet E, Ràfols C, Rosés M, Bosch E 2005. Critical micelle concentration of
surfactants in aqueous buffered and unbuffered systems. Analytica Chimica Acta 548(1–
2):95-100.
20. Thongngam M, McClements DJ 2005. Influence of pH, Ionic Strength, and
Temperature on Self-Association and Interactions of Sodium Dodecyl Sulfate in the Absence
and Presence of Chitosan. Langmuir 21(1):79-86.
21. Tadros T 2013. Critical Micelle Concentration. Encyclopedia of Colloid and Interface
Science. Berlin, Heidelberg: Springer.
22. Kapoor RC, Chand P, Aggarwala VP 1972. Spectrophotometric determination of
critical micelle concentration of nonionic surfactants. Analytical Chemistry 44(12):2107-
2109.
23. Dominguez A, Fernandez A, Gonzalez N, Iglesias E, Montenegro L 1997.
Determination of Critical Micelle Concentration of Some Surfactants by Three Techniques.
Journal of Chemical Education 74(10):1227.
24. Movchan TG, Soboleva IV, Plotnikova EV, Shchekin AK, Rusanov AI 2012.
Dynamic light scattering study of cetyltrimethylammonium bromide aqueous solutions.
Colloid Journal 74(2):239-247.
25. Sutherland E, Mercer SM, Everist M, Leaist DG 2009.
Diffusion in Solutions of Micelles. What Does Dynamic Light Scattering Measure? Journal of
Chemical & Engineering Data 54(2):272-278.
26. Patist A, Bhagwat SS, Penfield KW, Aikens P, Shah DO 2000. On the measurement
of critical micelle concentrations of pure and technical-grade nonionic surfactants. Journal of
Surfactants and Detergents 3(1):53-58.
27. Zettl H, Portnoy Y, Gottlieb M, Krausch G 2005. Investigation of Micelle Formation
by Fluorescence Correlation Spectroscopy. The Journal of Physical Chemistry B
109(27):13397-13401.
28. Luschtinetz F, Dosche C 2009. Determination of micelle diffusion coefficients with
fluorescence correlation spectroscopy (FCS). Journal of Colloid and Interface Science
338(1):312-315.
29. Yu L, Tan M, Ho B, Ding JL, Wohland T 2006. Determination of critical micelle
concentrations and aggregation numbers by fluorescence correlation spectroscopy:
Aggregation of a lipopolysaccharide. Analytica Chimica Acta 556(1):216-225.
30. Pineiro L, Freire S, Bordello J, Novo M, Al-Soufi W 2013. Dye exchange in micellar
solutions. Quantitative analysis of bulk and single molecule fluorescence titrations. Soft
Matter 9(45):10779-10790.
31. Wan LSC, Lee PFS 1974. CMC of Polysorbates. Journal of Pharmaceutical Sciences
63(1):136-137.
32. Aivaliotis M, Samolis P, Neofotistou E, Remigy H, Rizos AK, Tsiotis G 2003.
Molecular size determination of a membrane protein in surfactants by light scattering.
Biochimica et Biophysica Acta (BBA) - Biomembranes 1615(1):69-76.
33. Freire S, Bordello J, Granadero D, Al-Soufi W, Novo M 2010. Role of electrostatic
and hydrophobic forces in the interaction of ionic dyes with charged micelles. Photochemical
& Photobiological Sciences 9(5):687-696.

160
34. Tang X, Huston KJ, Larson RG 2014. Molecular Dynamics Simulations of Structure–
Property Relationships of Tween 80 Surfactants in Water and at Interfaces. The Journal of
Physical Chemistry B 118(45):12907-12918.
35. Karjiban RA, Basri M, Rahman MBA, Salleh AB 2012. Structural Properties of
Nonionic Tween80 Micelle in Water Elucidated by Molecular Dynamics Simulation.
APCBEE Procedia 3(1):287-297.
36. Kumari H, Kline SR, Atwood JL 2014. Aqueous solubilization of hydrophobic
supramolecular metal-organic nanocapsules. Chemical Science 5(6):2554-2559.
37. Jung C, Lee J, Kang M, Kim SW 2014. Viscosity-Dependent Diffusion of Fluorescent
Particles Using Fluorescence Correlation Spectroscopy. Journal of Fluorescence 24(6):1785-
1790.
38. Sherman E, Itkin A, Kuttner YY, Rhoades E, Amir D, Haas E, Haran G 2008. Using
Fluorescence Correlation Spectroscopy to Study Conformational Changes in Denatured
Proteins. Biophysical Journal 94(12):4819-4827.
39. Tian Y, Martinez MM, Pappas D 2011. Fluorescence Correlation Spectroscopy: A
Review of Biochemical and Microfluidic Applications. Applied spectroscopy 65(4):115-124.
40. McClements DJ 2000. Isothermal Titration Calorimetry Study of Pectin−Ionic
Surfactant Interactions. Journal of Agricultural and Food Chemistry 48(11):5604-5611.
41. Bordbar A-K, Taheri-Kafrani A, Mousavi SH-A, Haertlé T 2008. Energetics of the
interactions of human serum albumin with cationic surfactant. Archives of Biochemistry and
Biophysics 470(2):103-110.
42. Kresheck GC, Hargraves WA 1981. Enthalpy titration studies of the binding of
surfactants to polyvinylpyrrolidonel. Journal of Colloid and Interface Science 83(1):1-10.
43. Jorg E, Ingo G, Digambara P, Jorg F 2004. Art and Artefacts of Fluorescence
Correlation Spectroscopy. Current Pharmaceutical Biotechnology 5(2):155-161.
44. Serno T, Carpenter JF, Randolph TW, Winter G 2010. Inhibition of agitation-induced
aggregation of an IgG-antibody by hydroxypropyl-β-cyclodextrin. Journal of Pharmaceutical
Sciences 99(3):1193-1206.

161
6 : VISCOSITY CHANGE
FOLLOWING AGGREGATION
DEVELOPMENT: CONFOCAL
MICROSCOPY SYSTEM FOR
ASSESSING AGGREGATION
DEVELOPMENT AND VISCOSITY
SEQUENTIALLY

162
Research Article
Viscosity Change Following Aggregation Development: Confocal microscopy system for
assessing aggregation development and viscosity sequentially
Maryam Shaha, #
, Katie Dayb, Shahid Uddin
b, Robin Curtis
c, Christopher F. van der Walle
b
and Alain Pluena*
a, School of Health Sciences, University of Manchester, Manchester, UK
b, MedImmune Ltd, Formulation Sciences, Granta Park, Cambridge, UK
c, School of Chemical Engineering and Analytical Sciences, University of Manchester, Manchester,
UK
#, first author
*, corresponding author: [email protected]

163
6.1 Abstract
Two aspects are assessed in this study: (i) the effect of aggregate development (size and
counts) on change in solution viscosity and (ii) the effect of monoclonal antibody (mAb)
concentration on agitation-induced aggregation. Two different forms of agitation (rotation
and shaking), various agitation times (from 2hrs to 24hrs) and different shaking speeds
(500rpm and 2000rpm) were chosen to generate different particle sizes. Raster image
correlation spectroscopy (RICS) is employed to characterise aggregation solutions. This is the
first reported application of RICS characterising high concentrated mAb solutions. The
micro-rheology of the mAb solutions is determined by the diffusion of fluorescence probes;
measured by fluorescence correlation spectroscopy (FCS). It is observed that the change in
viscosity is correlated with aggregate development in terms of size and counts, for both the
low (1mg/ml) and high (100mg/ml) mAb concentrations assessed. The complexity of
aggregation mechanisms are highlighted through the measured inversely proportional
relationship between agitation-induced aggregation and protein concentration. The practical
advantages of utilisation of RICS and FCS on the same system are also portrayed
demonstrating their scope as a potential tool/package in biopharmaceutical formulation
development.

164
6.2 Introduction
6.2.1 Protein aggregation and viscosity issues of biopharmaceutical products
Regulatory authorities expect the manufacture to ensure product quality of
biopharmaceuticals (e.g. monoclonal antibody (mAb) products) during storage, transport and
until it patient administration, stating ‘The storage conditions and the length of studies chosen
should be sufficient to cover storage, shipment and subsequent use’ (ICH Q1A 2.1.7).1,2
These guidelines set out the principal requirements for the safe storage and distribution of
time- and temperature-sensitive pharmaceutical products.3
Non-native protein aggregation affects product quality, potency and safety4-6
and is a major
degradation route during manufacture, formulation, and storage of biopharmaceuticals. This
issue is often heightened at high concentrations i.e. > 80 mg/ml,7,8
which are needed to meet
dose requirements (e.g. for subcutaneous injection).9-11
At these high protein concentrations
the tendency of attractive protein-protein interactions (PPIs) increases due to the close
proximity of protein molecules.12
An additional related problem with high mAb
concentrations is solution viscosity. High viscosity accounts for issues with syringeability and
injectability at high protein concentrations; leading to increased risk of unsuccessful
administration and adverse effects in patients.10,13,14
Studies have shown mAbs exhibit a wide
range of viscosity profiles showing exponential increases in viscosity with protein
concentration. As intermolecular interactions (e.g. PPI) have shown to influence the viscosity
profiles, studies have attempted to relate the nature and magnitude of PPIs at dilute
concentrations to predict the behaviour of proteins at high protein concentrations. However,
due the complexity of aggregation mechanisms, which vary with protein concentration and
solution properties, a different approach is needed.15-20
Solution properties influencing protein
behaviour include pH and ionic strength as well as the molecular weight and morphology of
protein aggregates.21-24
6.2.2 Relation between aggregation development and change in solution
viscosity
A number of studies have observed a correlation between aggregate size and solution
viscosity. For example, Barnett et al. assessed the relation between changes in aggregate
structures and solution viscosity in conditions where PPIs were highly repulsive. -
chymotrypsinogen (aCgn) solutions were evaluated at concentrations 0.5-1 mg/ml and a
direct link between aggregation growth (aggregate molecular weight) and increase in solution
viscosity (zero-shear viscosity) is illustrated, shown to be consistent with polymer solution

165
theory (which states solution viscosity is influenced by concentration, molecular weight and
morphology of protein aggregates).25
Nicoud et al. studied the heat-induced aggregation of a
mAb at a higher concentration range of 20-60 mg/ml. Thermal stress caused an increase in
average hydrodynamic radius which increased the solution viscosity (zero-shear viscosity)
and correlated with protein concentration.26
Similarly, Lilyestrom et al. observed a linear
dependence of viscosity on reversible self-association (RSA) in terms of cluster size for two
mAbs, at a high concentration of 175mg/ml.27
Other studies have also obtained similar results
demonstrating a correlation between aggregate size in the sub-visible size range and low-
shear viscosity.28-30
6.2.3 Analytical Techniques to assess viscosity change following aggregation
6.2.3.1 Aggregation characterisation – limitations and future direction
The limitations of aggregate characterisation techniques are partly to blame for the difficulty
to predict how size and concentration of aggregates will affect solution viscosity. The two
main limitations are related to (i) characterising size ranges and (ii) concentration limits of
the technique. These are discussed briefly: (i) Protein particles formed as a result of
aggregation can span many orders of magnitude form nanometres to micrometres. The actual
distribution of particle sizes and concentrations is difficult to obtain due to the limitations of
many techniques that are commonly utilised e.g. light scattering techniques. Most techniques
provide ‘weighted averages’ for aggregates but these are biased towards larger particles in the
solution.25,31
An assessment of the influence of the aggregate size distribution on the viscosity
may be more useful. Furthermore, multiple techniques are required to cover a broad size
range, using commercially available techniques; as not one technique covers the whole size
range of mAb aggregates. This increases sample volume and analysis time.31
(ii) The
concentration limits of many aggregation characterisation techniques (e.g. analytical ultra-
centrifugation and light scattering techniques) make it difficult to assess aggregation at high
concentrations.11,31
Diluting the sample is not a simple answer as diluted samples will no
longer represent the solution; as reversible aggregates may be lost following dilution. This is
one of the reasons reversible self-association (RSA) is poorly studied, thus this is a major
limitation when characterising high concentration solutions.32
Aggregation resulting from the
formation of RSA or PPI are major precursors of high viscosity, particularly at high
concentrations.33
Another common issue with technologies is the requirement of large sample
volumes31
thus, as mentioned earlier, making it difficult to assess aggregation and viscosity
during early formulation development when material is limited.

166
The novel application of raster image correlation spectroscopy (RICS) in the characterisation
of biopharmaceutical stability was demonstrated in 2012 with BSA samples.34
In 2015, the
applicability of RICS in characterising aggregate size distributions, with the use of extrinsic
labelling, was shown for low concentrated mAb solutions35
and subsequently the specificity
of the method was demonstrated in the presence of solution components (e.g. polysorbate and
silicone oil) – where trends for particle size and concentration was consistent with other
methods.36
These aforementioned studies have demonstrated the scope of RICS for sub-
visible particle sizing for early formulation development – with its high specificity, broad size
range, and small sample volume requirements. In this paper, the applicability of RICS in
characterising high concentrated mAb solutions (i.e. 100mg/ml) is demonstrated.
6.2.3.2 Micro-rheology to assess viscosity change
All of the aforementioned studies measuring the viscosity of protein solutions (section 6.2.2)
were using low-shear or zero-shear viscosity techniques. Such microrheology techniques (e.g.
dynamic light scattering, diffusive wave spectroscopy) exploit the Brownian motion of
particles to obtain local rheological properties; and have demonstrated their sensitivity as
indicators of particle formation and growth. The techniques have been used to assess changes
in rheological properties of a wide range of solutions including dilute polymer solutions,37-39
polymer gel40
and live cells.41,42
Additional advantages include that they are the non-invasive
to samples and require small sample volumes.39,43,44
Several groups have utilised fluorescence correlation spectroscopy (FCS) to measure the
microviscosity of aqueous solutions from the diffusion of fluorescent probes (e.g. dyes).45,46
The first application was by Yoshida et al. in cells.47
We previously demonstrated the use of
two probes, ATTO-Rho6G dye and IgG-AF conjugate, with FCS in retrieving viscosity
information of (unstressed) mAb solutions.48
Herein, we utilise the aforementioned probes
(ATTO-Rho6G and IgG-AF) to determine mAb solution viscosity in the presence of protein
aggregates.
In this study the sequential use of RICS and FCS on the same confocal system
permits/allows to retrieve ample information on mAb solutions; in terms of aggregate growth
and solution viscosity, respectively. Expanding the scope of the techniques, we demonstrate
the use of RICS (with extrinsic labelling) on characterising high protein concentration
solutions and FCS (using fluorescent probes) in solutions containing aggregates. The effect
167
of aggregate size and concentration on solution micro-rheology is assessed through imposing
agitation conditions on mAb solutions to generate various aggregate size ranges.
6.3 Materials and Methods
6.3.1 Materials
The mAb, COE-08 (IgG1, MW 204kDa, pI 8.9-9.2), was kindly provided by Medimmune
(Cambridge, UK).
SYPRO® Red dye was obtained from Thermo Scientific (Leicestershire, UK) at a
concentration of 5000 𝗑 (in DMSO). ATTO-Rho6G dye, IgG-AF probe (mouse IgG1 isotype
control, Alexa Fluor 488 conjugate) and buffer components, sucrose and L-histidine, were
purchased from Sigma Aldrich (Dorset, UK). All buffers and solutions were prepared with
Millipore de-ionised water (18 MV.cm) and pre-filtered prior to stress experiments.
6.3.2 Methods
6.3.2.1 Sample preparation
All solutions were prepared in a pH 6 buffer composed of 25mM histidine and 235mM
sucrose. COE-08 solutions were prepared at a final concentration of 1mg/ml or 100mg/ml.
The supplied stock of COE-08 is around 50mg/ml. To reach the concentration of 100mg/ml,
the mAb was concentrated with a 50 kDa MWCO amicon ultra-centrifugal filter unit (Sigma
Aldrich, Dorset, UK).
For agitation, mAb samples were placed in vials at 21C in a thermostatically-controlled
environment. Vials were agitated via rotation (at 20rpm) or shaking at various speeds: (i)
end-over-end rotation for 16 and 24 hours; (ii) shaking at 500rpm for 4, 8, and 16 hours; and
(iii) shaking at 2000rpm for 2 hours and 8 hours.
6.3.2.2 Analysis of particulates and viscosity with confocal microscopy
A Zeiss 510 Confocor 2 (Zeiss, Jena, Germany) confocal microscope equipped with a c-
Apochromat 40×/1.2NA water-immersion objective was utilised for RICS and FCS optical
paths.
6.3.2.2.1 RICS for characterising aggregate particles
SYPRO® Red (Thermo Scientific, Leicestershire, UK) used to label protein aggregates was
added to samples (post-experiment) 15 min prior to visualisation with confocal microscopy at
a final working concentration of 2.5 𝗑.

168
Imaging was carried out by exciting the dye with a Helium-Neon laser at 543 nm and the
emitted fluorescence collected above 585 nm (LP585 filter set). Confocal image time series
of 1,024 × 1,024 pixel resolution were captured over 100 frames with a corresponding pixel
dwell time of 6.4 microseconds. In-house RICS software (ManICS) was applied to analysis
of images acquired using confocal microscopy. A full description of the RICS algorithm has
been described in the literature.34,49
The aforementioned image time series were sub-divided
into 32x32 pixels region of interest (ROI) and the diffusion coefficients (D) within each ROI
was generated (as shown in36
).
RICS-derived diffusion coefficients were subsequently converted to particle diameter using
the Stoke-Einstein equation (following determination of solvent viscosity):
𝑅ℎ =𝑘𝑇
6𝜋𝜂𝐷⁄ Equation 6.1
Where 𝑅ℎ represents the hydrodynamic radius, k is the Boltzmann constant, T is the
temperature, 𝜂 represents the viscosity and D is the diffusion coefficient.
For each solution, similar to the analysis method in the previous RICS study,36
particle counts
were separated into size ranges of (i) <0.05 m, (ii) 0.05–0.5 m, (iii) 0.5–5 m, and (iv) >5
m.
6.3.2.2.2 FCS as a tool for viscosity
The working concentration of ATTO-Rho6G was 100nM and the working concentration of
IgG-AF was 0.001mg/ml, for all solutions. Again, the fluorescent probes were added to
samples post-experimental stress.
The Argon laser was operated at 514nm for ATTO-Rho6G (ex/em, 535nm/560nm) and at
488nm for IgG-AF (ex/em, 488nm/525nm). System calibration was performed with
Rhodamine GreenTM
(ex/em, 503nm/528nm, diffusion coefficient of 2.8 × 10⁻⁶
cm2/sec; Life
technologies50
). System calibration determines the laser beam waist size and optimises the
optical setup for further experiments. The laser beam waist size is estimated using the
following equation:
𝜏𝐷 =𝜔02
4𝐷⁄
Equation 6.2
where 𝜏𝐷 corresponds to the diffusion time, 𝟂0 is the laser waist beam and D is the diffusion
coefficient.

169
100l of sample was added into each well of the glass bottomed eight-well chamber slide,
and measurements were performed at 10-20 runs, each over a range of measurement times
from 10 seconds to 60 seconds depending on the sample i.e. protein concentration
(measurement time chosen is the minimum time required for a correlation curve to yield
reliable values for the diffusion time). The output was averaged for each sample and repeated
in pentuplicate.
Single component and two-component fits were applied to the acquired FCS data. The two
component model allows the detection (and characterisation) of the presence of two different
populations of fluorescent molecules i.e. the unbound dye and the bound dye (for example, to
the mAb).
For the single component fits, the following equation was applied:
𝐺(𝜏) = 1 + 1 𝑁⁄ (1 + 𝜏 𝜏𝐷⁄ )−1(1 + 𝑆2 𝜏 𝜏𝐷⁄ )
−0.5 Equation 6.3
where 𝐺(𝜏) is the correlation function, N is the number of particles, 𝜏𝐷is the diffusion time,
and S is the structural parameter.
For the two-component fits, the correlation function is determined using the following
equation:
𝐺(𝜏) = 1 + 1 𝑁𝑝⁄
(
(
𝑓1
(1+𝑡 𝜏𝐷𝑖,1⁄ )(1+𝑡
𝑆2𝜏𝐷𝑖,1⁄ )
12⁄)+(
𝑓2
(1+𝑡 𝜏𝐷𝑖,2⁄ )(1+𝑡
𝑆2𝜏𝐷𝑖,2⁄ )
12⁄)
)
Equation 6.4
where 𝜏𝐷,1corresponds to the diffusion time of species one, Np is the number of particles, 𝑓1 is
the proportion of species one contribution, S is the structural parameter, 𝑓2 is the proportion
of species two contribution and 𝜏𝐷,2 corresponds to the diffusion time of species two.
For all FCS measurements, the F-test is applied between the one-component and two-
component models to assess whether the addition of parameters statically improved the fit (at
p = 0.05). If results indicated that the two-component model did not statistically improve the
fit in comparison to the one-component model, only results from the one-component model
are exploited and it is assumed that only one population of fluorescent particles are measured
e.g. the unbound dye in solution.

170
6.3.2.3 Statistical tests
Unless otherwise stated, a non-parametric one-way ANOVA was performed to assess the
influence of stress type on resultant size distribution/particle counts and solution viscosity. A
calculated probability (i.e. p-value) equal or less than 0.05 was considered to be statistically
significant.

171
6.4 Results
6.4.1 Viscosity change with aggregation development following agitation of low
mAb concentrated solutions (1mg/ml) – effect of probe size on assessing
changes in viscosity
An evaluation of the aggregate propensity following agitation was initially tested with
1mg/ml COE-08 solutions using RICS as shown in Figure 6.1. The shaking 500rpm 4hr
condition showed an insufficient correlation to generate any exploitable data, indicating a low
count of aggregates in the solution. Aggregate particles were detected in all other solutions.
Figure 6.1: RICS (with SYPRO Red) determined protein particle counts for agitated 1mg/ml COE-
08 solutions.
RICS (with SYPRO Red) determined protein particle counts (particles / fL) for agitated 1mg/ml COE-
08 solutions in vials. Data separated into size ranges of (i) < 0.05, (ii) 0.05-0.5, (iii) 0.5-5 and (iv) >
5 m. Values represent means with std. dev for n=3. Significant differences (p < 0.05) obtained
between rotation 24hrs and shaken 2000rpm with all other solutions in the 0.05-0.5 m size range;
indicated by*.

172
Figure 6.1 shows that particle size distributions changed with the agitation method: The
500rpm 8hr shaken solution did not seem to have any particles larger than 0.5 m, measured
by RICS. Significant differences in the 0.05-0.5 m size range were obtained where the 24hr
rotation solutions (p < 0.05) and the 2000rpm shaken solutions (p < 0.05) obtained
significantly higher concentrations than the other solutions; but not significant to each other
at p = 0.05.
Concomitantly the diffusion time of tracers in these solutions were measured by FCS. Figure
6.2 illustrates the FCS data (ratio of diffusitives) with ATTO-Rho6G of the agitated
solutions. Interestingly, the 24hr rotation solutions (p < 0.01) and 2000rpm shaken solutions
(p < 0.05) obtained significantly higher relative viscosities in comparison to all other
solutions; but not significant with each other at p = 0.05.
Figure 6.2: FCS relative diffusion time of ATTO-Rho6G 1mg/ml COE-08 agitated solutions.
FCS determined relative diffusion time of ATTO-Rho6G 1mg/ml COE-08 agitated solutions. Values
represent means with std. dev for n=3. Significant differences (p < 0.05) obtained between rotation
24hrs and 2000rpm 2hrs with all other solutions (p = 0.05); indicated by*.
From this initial data, the type of stress (speed and duration) had an effect on aggregation
development, in terms of size range and concentration (Figure 6.1). Overall the 2000rpm 2hr
condition generated similar data (aggregate and viscosity) as the 24hr rotation condition,
although the difference in duration time was large, suggesting the 2000rpm may be a harsher
stress than rotation. The 16hr rotation and 16hr 500pm shaking had similar outcomes,
indicating similar effect of 500rpm shaking and end-over-end rotation on aggregation.
173
Comparing the RICS (Figure 6.1) and FCS data (Figure 6.2), an increase in viscosity is
observed in solutions with the greatest aggregate counts. No difference in ATTO-Rho6G
ratio of diffusitives is observed between the presence of no aggregates (shaken 500rpm 4hrs
solution), small aggregates (<0.5 m, shaken 500rpm 8hrs) and the development of large
aggregates (>5 m, shaken 500rpm 16hr and rotation 16hrs).
ATTO-Rho6G is a small molecule tracer dye. The sensitivity of larger particles to solution
viscosity has been shown in the literature.46,51
In our earlier study (Chapter 4)48
, the diffusion
IgG-AF has been shown to give relatable information on the micro-viscosity of mAb
solutions. The solutions assessed were unstressed solutions (i.e. containing no protein
aggregates) and so any labelling/interaction between IgG-AF and mAb aggregates needed to
be assessed before the use of IgG-AF in solutions containing aggregates (in this study).
Interaction between IgG-AF and mAb aggregates
Two experiments were carried out to assess any labelling/interaction between IgG-AF and
mAb (COE-08) aggregates. In these experiments 10mg/ml COE-08 (in histidine-sucrose
buffer at pH 6), samples were agitated to generate aggregate particles. RICS (with SYPRO®
Red) was carried out to assess aggregation development (size and concentration), followed by
FCS for a range of incubation times with IgG-AF. For RICS, SYPRO® Red was added 15
minutes prior to measurement, in the absence of IgG-AF. For FCS, IgG-AF solutions were in
the absence of SYPRO® Red. The first experimental condition was 10mg/ml COE-08
shaken at 500rpm for 4hrs. This condition did not generate any particles above 5m (Figure
6.3). It was assessed if IgG-AF labelled aggregates were visible with RICS. The amount of
detected aggregates was substantially lower by IgG-AF, in comparison to SYPRO Red (in
relation to aggregate size and counts) (SI, Appendix 4).

174
Figure 6.3: RICS (with SYPRO Red) determined protein particle counts for 4 hour shaken (at
500rpm) 10mg/ml COE-08 solutions.
RICS (with SYPRO Red) determined protein particle counts (particles / fL) for 4 hour shaken (at
500rpm) 10mg/ml COE-08 solutions in vials. Data separated into size ranges of (i) < 0.05, (ii) 0.05-
0.5, (iii) 0.5-5 and (iv) > 5 m. Values represent means with std. dev for n=3.
FCS was carried out at different time points following incubation with IgG-AF, from 30
minutes to 24hrs. Table 6.1 presents the determined FCS diffusion times of the COE-08
shaken samples. The data idicates insufficient interaction between the IgG-AF and mAb
aggregates, as the diffusion time is consistent with that of an IgG particle52,53
for all time
points. Labelling of aggregates would results in larger diffusion times. A very low level of
peaks in the FCS count rates was observed (≤ 4%) such that the average diffusion time
determined for each measurement (i.e. over 20 runs) was not affected by runs which
contained peaks (removal of runs with peaks did not change the data). Thus indicating the
lack of large fluorescent particles e.g. IgG-AF-mAb complexes. Also, the measured number
of particles (𝑛) did not change over the incubation times. Additionally, the F-test between the
one and two component FCS models showed no significant differences; thus implying the
presence of only one population of fluorescence particles i.e. free IgG-AF.

175
Table 6.1: FCS determined diffusion times and number of particles of 10mg/ml COE-08
solutions shaken at 500rpm for 4hrs, in presence of IgG-AF.
FCS determined diffusion times and number of particles of 10mg/ml COE-08 solutions shaken at
500rpm for 4hrs, in presence of IgG-AF for different incubation times. Samples were acquired for 10-
20 seconds acquisition time and 20 runs, for each measurement. Values represent means with std. dev
for n=5. Incubation time with IgG-AF Diffusion time (s) Number of particles
30 mins 269 ± 8 4 ± 1
1hr 265 ± 3 4 ± 1
2hr 249 ± 6 4 ± 1
4hr 249 ± 8 6 ± 2
8hr 247 ± 7 5 ± 2
16hr 247 ± 5 5 ± 1
24hr 253 ± 5 4 ± 1
As the first experiment did not generate large aggregates (i.e. > 5m) (Figure 6.3) the second
condition chosen was 10mg/ml COE-08 agitation via rotation for 24hrs to generate larger
aggregates and subsequently assess interaction with IgG-AF. Figure 6.4 illustrates the RICS
determined aggregate data.
Figure 6.4: RICS (with SYPRO Red) determined protein particle counts for 24 hour rotation
10mg/ml COE-08 solutions.
RICS (with SYPRO Red) determined protein particle counts (particles / fL) for 24 hour rotation
10mg/ml COE-08 solutions in vials. Data separated into size ranges of (i) < 0.05, (ii) 0.05-0.5, (iii)
0.5-5 and (iv) > 5 m. Values represent means with std. dev for n=3.
The FCS diffusion time of IgG-AF solutions up to and including 8hr incubation time were
consistent with that of free IgG-AF (i.e. not bound to mAb aggregates), whereas an increase
in the diffusion time was observed for the 16hr and 24hr incubation times. The number of

176
particles did not significantly change over the incubation times; thus, the increase in diffusion
time was not attributed to an increase in 𝑛 (which would suggest possible FCS artefacts).
After 8hrs, an increase in the peak level in the count rates is observed, representing the
detection of large particles i.e. aggregates, with a high peak level for 16hr and 24hr in the
count rates (based on the percentage of runs containing peaks for each measurement) (Table
6.2). Thus, the FCS data indicates some level of interaction between IgG-AF and mAb
aggregates after 8hrs of incubation (Table 6.2), in the presence of large aggregates (Figure
6.4); as interaction was not observed in the first experiment which did not have particles >
5m (Figure 6.3).
Table 6.2: FCS determined diffusion times and number of particles of 10mg/ml COE-08
solutions agitated via rotation for 24hrs, in presence of IgG-AF.
FCS determined diffusion times and number of particles of 10mg/ml COE-08 solutions agitated via
rotation for 24hrs, in presence of IgG-AF for different incubation times. Values represent means with
std. dev for n=5. Incubation time Diffusion time (s) Number of particles Peak level in count rate
30 minutes 288 ± 20 3 ± 1 < 10%
1hr 290 ± 10 3 ± 1 < 10%
2hr 288 ± 36 3 ± 1 < 10%
4hr 285 ± 38 2 ± 1 < 10%
8hr 298 ± 48 2 ± 1 20-30%
16hr 1464 ± 398 2 ± 1 40-70%
24hr 2131 ± 313 2 ± 1 > 70%
Therefore, it is recommend running FCS measurements with IgG-AF, for mAb aggregate
solutions, within a 4hr incubation time of IgG-AF as the experiments indicate negligible level
of interaction between IgG-AF and aggregates within this time frame.
We have already assessed labelling with ATTO-Rho6G and solution components, showing
insufficient interaction.48
Thus the FCS diffusion times of both probes can be determined in
protein formulations containing mAb aggregates.
Probe size on measuring solution viscosity
RICS analyses were repeated to ensure equivalent aggregation development (size and counts)
as with the previous experiments (and reproducibility of the experiment), with the additional
condition of 2000rpm shaken 8hrs (Figure 6.5). The same pattern was observed with
aggregation development for the agitation conditions and no significant differences obtained
at p = 0.05). Thus comparison can be made between the two FCS data sets: ATTO-Rho6G

177
(Figure 6.2) and IgG-AF (Figure 6.6). The additional condition of 2000rpm shaken 8hrs
produced similar data to the 2000rpm 2hrs condition.
Figure 6.5: RICS (with SYPRO Red) determined protein particle counts for agitated 1mg/ml COE-
08 solutions.
RICS (with SYPRO Red) determined protein particle counts (particles / fL) for agitated 1mg/ml COE-
08 solutions in vials. Data separated into size ranges of (i) < 0.05, (ii) 0.05-0.5, (iii) 0.5-5 and (iv) >
5 m. Values represent means with std. dev for n=3. Significant differences (p < 0.05) obtained
between rotation 24hrs and shaken 2000rpm with all other solutions in the 0.05-0.5 m size range;
indicated by*.
Similar to the ATTO-Rho6G data (Figure 6.2), significantly higher relative viscosities (p <
0.05) are obtained from the IgG-AF diffusion times (Figure 6.6) of solutions containing high
concentration of aggregates (i.e. rotation 24hr, 2000rpm 2hr and 2000rpm 8hr conditions)
(Figure 6.5). No difference of the ratio of diffusitives was observed between solutions
containing no aggregates (shaken 500rpm 4hrs) and solutions containing small aggregates
(shaken 500rpm 8hrs). Different to the ATTO-Rho6G data, significant differences (p < 0.05)
were observed between the IgG-AF determined ratio of diffusitives of the solution containing

178
no aggregates (shaken 500rpm 4hrs) and the solution containing a wide size range of
aggregates (rotation 16hrs and shaken 500rpm 16hrs) (Figure 6.6).
Figure 6.6: FCS relative diffusion of IgG-AF 1mg/ml COE-08 agitated solutions.
FCS relative diffusion time of IgG-AF 1mg/ml COE-08 agitated solutions. Values represent means
with std. dev for n=3. Significant differences between rotation 24hrs, 2000rpm 2hs and 2000rpm 8hrs
with all other solutions; indicate by *. Significant difference between 500rpm 4hrs with 16hr
conditions (500rpm and rotation); indicated by *b.
6.4.2 Viscosity change with aggregation development following agitation - high
mAb concentrated solutions (100mg/ml)
Building on these encouraging results, the same concept was applied to concentrated mAbs
solutions. The agitation conditions were split into three groups based on aggregation
development with 1mg/ml solutions, so that a smaller number of conditions can be selected to
cover a wide aggregation spectrum for 100mg/ml solutions: (i) high agitation stress
conditions generating high concentration of aggregates in the sub-visible size range i.e.
rotation 24hrs and shaking 2000rpm (2hr and 8hrs); (ii) middle agitation stress conditions
generating wide size range of aggregates i.e. shaken 500rpm 16hrs and rotation 16hrs; (iii)
low level stress conditions of shaken 500rpm 8hrs (low level of aggregation / small
aggregates) and shaken 500rpm 4hrs (no aggregation). Four conditions were chosen for the
100mg/ml experiments: (i) shaken 2000rpm 2hrs (high agitation stress), (ii) shaken 500rpm
16hrs (middle agitation stress) and (iii) shaken 500rpm 8hr and 4hr (low agitation stress).
The generated RICS data of 100mg/ml mAb solutions following agitation stress is shown in
Figure 6.7.

179
Figure 6.7: RICS (with SYPRO Red) determined protein particle counts for agitated 100mg/ml
COE-08 solutions.
RICS (with SYPRO Red) determined protein particle counts (particles / fL) for agitated 100mg/ml
COE-08 solutions in vials. Data separated into size ranges of (i) < 0.05, (ii) 0.05-0.5, (iii) 0.5-5 and
(iv) > 5 m. Values represent means with std. dev for n=3. Significant differences (p< 0.05) obtained
between shaken 2000rpm solution with all other solutions in the 0.05-0.5 and 0.5-5m size range;
indicated by*.
To simplify the study, when comparing the RICS 100mg/ml data to the 1mg/ml data (and in
future discussions), only Figure 6.5 will be utilised for 1mg/ml solutions.
As observed with 1mg/ml solutions (Figure 6.5), the 100mg/ml mAb shaking 500rpm 4hr
condition did not apparently lead to aggregates formation according to RICS analysis.
Additionally, after comparing across size ranges, significant differences (p < 0.05) were
observed between 2000rpm 2hr condition and all other solutions in the 0.05-0.5 and 0.5-5 m
size ranges (Figure 6.7). Comparing the 1mg/ml and 100mg/ml conditions, the total
aggregate concentration was significantly higher (p < 0.05) in the 1mg/ml conditions.
Again, in parallel, diffusion was measured using FCS. IgG-AF FCS data for 100mg/ml
agitated solutions is presented in Figure 6.8. The shaken 2000rpm 2hr solution (containing
high level of aggregation) had a significantly higher viscosity (p < 0.05) and the shaken
500rpm 4hr solution (containing no aggregates) had a significantly lower viscosity (p < 0.05)
than all other solutions. Comparing the IgG-AF FCS data between 1mg/ml and 100mg/ml

180
solutions, the 100mg/ml solutions generated much higher relative viscosities, approximately a
four-fold increase, for all conditions; thus indicating the mAb concentration is the major
parameter for solution viscosity.
Figure 6.8: FCS relative diffusion of IgG-AF 100mg/ml COE-08 agitated solutions.
FCS relative diffusion time of IgG-AF 100mg/ml COE-08 agitated solutions. Values represent means
with std. dev for n=3. Significant differences between 2000rpm 2hrs with all other solutions;
indicated by *. Significant differences between 500rpm 4hrs with all other solutions; indicated by *b.
6.5 Discussion
6.5.1 Measuring microrheology using probes
One of the major drawbacks of microrheology techniques (e.g. DLS based microrheology
techniques) is the potential interaction between the tracer and protein structures which in turn
can influence the data.39,54
Thus, it was vital to assess the potential interaction of IgG-AF and
mAb aggregates in this study (interaction of ATTO-Rho6G had previously been evaluated48
).
It was found that after prolonged incubation with IgG-AF, some interaction is observed with
mAb aggregates (as indicated by Tables 6.1-6.2 and SI, Appendix 4). With a short incubation
time (i.e. < 4hrs) the level of interaction is negligible and does not influence the resulting data
of IgG-AF self-diffusion. Thus, it is validated that the self-diffusion of IgG-AF can be
determined (by FCS) in the presence of mAb aggregates.
The sensitivity of larger particles to solvent viscosity has been demonstrated in the literature,
such that a crossover between the micro and macro scale viscosity has been demonstrated
based on the size of the probe.51,55
Our previous study using ATTO-Rho6G and IgG-AF
showed that IgG-AF measured the influence of the buffer and ionic strength on the
microenvironment; whereas ATTO-Rho6G did not i.e. was insensitive to the changes.48
Here,
181
Figures 6.2 and 6.6 again illustrate the role of the probe size to observe potential changes in
relative viscosity. The relative diffusion of IgG-AF established a difference between no
aggregate solutions and solutions with a wide range of aggregates, whereas ATTO-Rho6G
was insensitive to these changes in the local rheological behaviour of the solutions.
6.5.2 How much agitation is needed to impact protein stability?
Agitation experiments are used to mimic manufacture and transport stress to determine each
protein’s susceptibility to agitation-induced aggregation. To mimic these processes vortexing,
stirring, rotating or shaking experiments are often conducted.56,57
Rotation has been found to
represent transport stress very well,58,59
and so the 16hr rotation condition in this study should
represent 16hrs of real-time transport stress. Higher shaking speeds and high temperatures are
used for accelerating aggregation (accelerated stability studies). The transport time of
products varies - transporting a batch from one manufacturing site to a distribution site
abroad can take a couple of days. Stability studies assessing the effect of temperature /
agitation during transport are typically performed for durations of 8hrs (representing one
shift), 24hr (daily work) or 72hrs (temperature of standard local transport time).2 Thus,
herein, a wide range of agitation times are assessed.
In this study, rotation and 500rpm shaking showed similar impacts on aggregation and
viscosity change. As a significant change (p < 0.05) in viscosity was only observed following
the development of large aggregate particles, after 16hrs of agitation (500rpm shaking), it is
implied that a short transport time (≤ 8hrs) was not sufficient enough to effect protein
behaviour. However, this observation is only true for the mAb assessed in this study (COE-
08) at ambient temperature.
Agitation time is one parameter which has been assessed extensively in the literature, utilised
to assess aggregation kinetics.60-62
In this study, the 500rpm conditions for 1mg/ml mAb
samples illustrated aggregation development as a function of shaking duration: 4hr (no
apparent aggregates), 8hr (small aggregates) and 16hr (wide aggregate size-range) (Figure
6.5). As the time points are quite far apart, 500rpm shaking could be a very useful agitation
condition to assess aggregation kinetics.
6.5.3 Protein aggregation at the air-water interface
The effect of agitation stress on aggregation development is very well documented. The main
stress parameter proposed for agitation-induced aggregation is the air-water interface. As air
is more hydrophobic than water, proteins adsorb at the interface to minimise the exposure of

182
the hydrophobic residue to the aqueous solution. During agitation, there is an increase in the
amount of air-water interface interactions which may facilitate, or enhance, surface-mediated
unfolding / aggregation.36,58,59,63-65
Due to the various conditions assessed i.e. agitation type,
agitation speed and protein concentration, a number of factors are assessed in this study:
6.5.3.1 Agitation speed
Assessment of aggregation development between 500rpm and 2000rpm shaking conditions
shows aggregation development as a function of agitation speed. As shown in Figure 6.5,
shaking at 2000rpm for 2hrs generated higher aggregate concentrations than shaking at
500rpm for 16hrs. The difference is more prominent through comparing aggregation
development between the two conditions for the same agitation time (i.e. 8hrs), showing the
aggregation rate at 2000rpm to be much higher than 500rpm (an 8-fold increase). These
results complement the literature with aggregation development correlating with agitated
speed, although the literature is scarce, particularly for mAbs. Grigolato et al. assessed effect
of mechanical agitation on amyloid formation. The shaking speed increased both the
fragmentation rate and the primary nucleation rate of amyloid fibrils.62
Fleischman et al.
assessed shipping-induced aggregation on mAb solutions and similarly observed significant
increase in particle counts with increase in shaking speed.57
The reason for the limited
literature is because shaking experiments have not been found to yield a good fit in
comparison to real-time shipment; as mentioned earlier, rotation is a much better
representation.57
The speeds generally used in shaking conditions in the literature have been
less than 400rpm.57,62,64
6.5.3.2 Protein concentration
It is expected that at higher mAb concentrations, aggregation development increases; due to
the increased risk of protein self-association from molecular overcrowding.66,67
This
behaviour has been observed in the literature where increased aggregation is observed at high
protein concentrations following thermal stress.26,68
In relation to agitation stress, the rate of
aggregation is expected to be proportional to the combination of protein concentration and
the surface area of the air/water interface. However, in this study an inverse relation between
aggregation and protein concentration is seen; between 1mg/ml (Figure 6.5) and 100mg/ml
solutions (Figure 6.7). This is not the first instance such a phenomenon is observed, although
this may be the first reported study assessing a high mAb concentration i.e. 100mg/ml (rather
than a dilute concentration range). In a study by Teuheit et al.69
aggregation decreased with
higher protein concentrations when induced by agitation. Pegylated megakaryocyte growth

183
factor and pegylated granulocyte colony stimulating factor were subjected to shaking,
vortexing or stimulated shipping (using specially designed vibrational table) and the
aggregation percentage was analysed (using SEC-HPLC). A dilute concentration range of
proteins were assessed of 1, 10, and 20 mg/ml. The unexpected result was explained by the
rate-limiting effect on aggregation at the air/water interface and the air/water interface to
protein ratio that is greatest with decreased protein concentration. Accelerated aggregation is
due to the high ratio of air/water interface to proteins such that if the aggregation rate is kept
constant, there will be higher aggregation development with increased ratio of air/water
interface. Whereas at increasing temperature, the rate limiting step is the collision rate
between protein molecules in the solution; rather than contact with air/water interface. A
similar finding was also observed in an earlier study by Krielgaard et al. on recombinant
human factor XIII solutions. The percentage of soluble aggregates increased with decreasing
protein concentration following agitation and freeze-thaw. Again, a dilute concentration
range was assessed; of 1, 5 and 10 mg/ml.70
Other studies have also found higher
concentrated protein solutions to be more resistant against freeze-thaw induced protein
denaturation.71-73
With a similar explanation to agitation, the effect could be attributed to the
smaller percentage of denaturation at the boundaries of the interfaces. The surface-area of the
interfaces e.g. ice-liquid interface, is finite thereby limiting the amount of protein which can
accumulate (and subsequently denature) at the interface.74
6.6 Conclusion
The impact of aggregation development on solution viscosity was enabled through assessing
subtle changes in aggregation development (size and counts) following various agitation
conditions. Both protein concentrations assessed (1mg/ml and 100mg/ml) show an influence
of the presence of large aggregate particles on solution viscosity; although early stages of
aggregation did not affect local rheology. Additionally, comparison of data sets implies
agitation-induced aggregation is inversely affected by mAb concentration. The potential of
characterising aggregation and the solution viscosity from the same sample is of great interest
to the biopharmaceutical industry due to the low sample consumption and short operating
time. This study demonstrates the ample information which can be retrieved on aggregate
development and solution viscosity using RICS and FCS sequentially on the same confocal
set-up; where high concentrated protein solutions can be assessed and thus contribute towards
ensuring the stability of biopharmaceuticals.

184
6.7 References
1. Stability Testing of New Drug Substances and Products (revision 2) [Internet].
International Council for Harmonisation. Available from:
http://www.ich.org/products/guidelines/quality/quality-single/article/stability-testing-of-new-
drug-substances-and-products.html.
2. Ammann C 2011. Stability Studies Needed to Define the Handling and Transport
Conditions of Sensitive Pharmaceutical or Biotechnological Products. American Association
of Pharmaceutical Scientists 12(4):1264-1275.
3. Annex 9 Model guidance for the storage and transport of time- and temperature–
sensitive pharmaceutical products [Internet]. World Health Organisation Technical Report
Series. Available from
http://www.who.int/medicines/areas/quality_safety/quality_assurance/ModelGuidanceForSto
rageTransportTRS961Annex9.pdf
4. Rosenberg AS 2006. Effects of protein aggregates: An immunologic perspective.
American Association of Pharmaceutical Scientists 8(3):501-507.
5. Maas C, Hermeling S, Bouma B, Jiskoot W, Gebbink MFBG 2007. A Role for
Protein Misfolding in Immunogenicity of Biopharmaceuticals. Journal of Biological
Chemistry 282(4):2229-2236.
6. Elvin JG, Couston RG, van der Walle CF 2013. Therapeutic antibodies: Market
considerations, disease targets and bioprocessing. International Journal of Pharmaceutics
440(1):83-98.
7. Ghosh R, Calero-Rubio C, Saluja A, Roberts CJ 2016. Relating Protein–Protein
Interactions and Aggregation Rates From Low to High Concentrations. Journal of
Pharmaceutical Sciences 105(3):1086-1096.
8. Roberts CJ 2014. Protein aggregation and its impact on product quality. Current
Opinion in Biotechnology 30(1):211-217.
9. Jackisch C, Müller V, Maintz C, Hell S, Ataseven B 2014. Subcutaneous
Administration of Monoclonal Antibodies in Oncology. Geburtshilfe und Frauenheilkunde
74(4):343-349.
10. Dias C, Abosaleem B, Crispino C, Gao B, Shaywitz A 2015. Tolerability of High-
Volume Subcutaneous Injections of a Viscous Placebo Buffer: A Randomized, Crossover
Study in Healthy Subjects. American Association of Pharmaceutical Scientists 16(5):1101-
1107.
11. Shire SJ, Shahrokh Z, Liu J 2004. Challenges in the development of high protein
concentration formulations. Journal of Pharmaceutical Sciences 93(6):1390-1402.
12. Voynov V, Chennamsetty N, Kayser V, Helk B, Trout BL 2009. Predictive tools for
stabilization of therapeutic proteins. Mabs 1(6):580-582.
13. Berteau C, Filipe-Santos O, Wang T, Rojas HE, Granger C, Schwarzenbach F 2015.
Evaluation of the impact of viscosity, injection volume, and injection flow rate on
subcutaneous injection tolerance. Medical Devices (Auckland, NZ) 8(1):473-484.
14. Cilurzo F, Selmin F, Minghetti P, Adami M, Bertoni E, Lauria S, Montanari L 2011.
Injectability Evaluation: An Open Issue. American Association of Pharmaceutical Scientists
12(2):604-609.
15. Connolly BD, Petry C, Yadav S, Demeule B, Ciaccio N, Moore JMR, Shire SJ,
Gokarn YR 2012. Weak Interactions Govern the Viscosity of Concentrated Antibody
Solutions: High-Throughput Analysis Using the Diffusion Interaction Parameter. Biophysical
Journal 103(1):69-78.
16. Yadav S, Liu J, Shire SJ, Kalonia DS 2010. Specific interactions in high
concentration antibody solutions resulting in high viscosity. Journal of Pharmaceutical
Sciences 99(3):1152-1168.

185
17. Yadav S, Shire SJ, Kalonia DS 2010. Factors Affecting the Viscosity in High
Concentration Solutions of Different Monoclonal Antibodies. Journal of Pharmaceutical
Sciences 99(12):4812-4829.
18. Weiss WF, Hodgdon TK, Kaler EW, Lenhoff AM, Roberts CJ 2007. Nonnative
Protein Polymers: Structure, Morphology, and Relation to Nucleation and Growth.
Biophysical Journal 93(12):4392-4403.
19. Saluja A, Fesinmeyer RM, Hogan S, Brems DN, Gokarn YR 2010. Diffusion and
Sedimentation Interaction Parameters for Measuring the Second Virial Coefficient and Their
Utility as Predictors of Protein Aggregation. Biophysical Journal 99(8):2657-2665.
20. Philo JS, Arakawa T 2009. Mechanisms of protein aggregation. Current
Pharmaceutical Biotechnology 10(4):348-351.
21. Sharma V, Jaishankar A, Wang Y-C, McKinley GH 2011. Rheology of globular
proteins: apparent yield stress, high shear rate viscosity and interfacial viscoelasticity of
bovine serum albumin solutions. Soft Matter 7(11):5150-5160.
22. Heo Y, Larson RG 2005. The scaling of zero-shear viscosities of semidilute polymer
solutions with concentration. Journal of Rheology 49(5):1117-1128.
23. Liu J, Nguyen MDH, Andya JD, Shire SJ 2005. Reversible Self-Association Increases
the Viscosity of a Concentrated Monoclonal Antibody in Aqueous Solution. Journal of
Pharmaceutical Sciences 94(9):1928-1940.
24. Russo D 2008. The impact of kosmotropes and chaotropes on bulk and hydration shell
water dynamics in a model peptide solution. Chemical Physics 345(2–3):200-211.
25. Barnett GV, Qi W, Amin S, Neil LE, Roberts CJ 2015. Aggregate structure,
morphology and the effect of aggregation mechanisms on viscosity at elevated protein
concentrations. Biophysical Chemistry 207(1):21-29.
26. Nicoud L, Lattuada M, Yates A, Morbidelli M 2015. Impact of aggregate formation
on the viscosity of protein solutions. Soft Matter 11(27):5513-5522.
27. Lilyestrom WG, Yadav S, Shire SJ, Scherer TM 2013. Monoclonal Antibody Self-
Association, Cluster Formation, and Rheology at High Concentrations. The Journal of
Physical Chemistry B 117(21):6373-6384.
28. Castellanos MM, Pathak JA, Colby RH 2014. Both protein adsorption and
aggregation contribute to shear yielding and viscosity increase in protein solutions. Soft
Matter 10(1):122-131.
29. Castellanos MM, Pathak JA, Leach W, Bishop SM, Colby RH 2014. Explaining the
Non-Newtonian Character of Aggregating Monoclonal Antibody Solutions Using Small-
Angle Neutron Scattering. Biophysical Journal 107(2):469-476.
30. Fukuda M, Moriyama C, Yamazaki T, Imaeda Y, Koga A 2015. Quantitative
Correlation between Viscosity of Concentrated MAb Solutions and Particle Size Parameters
Obtained from Small-Angle X-ray Scattering. Pharmaceutical Research 32(12):3803-3812.
31. Zolls S, Tantipolphan R, Wiggenhorn M, Winter G, Jiskoot W, Friess W, Hawe A
2012. Particles in therapeutic protein formulations, Part 1: Overview of analytical methods.
Journal of Pharmaceutical Sciences 101(3):914-935.
32. Kanai S, Liu J, Patapoff TW, Shire SJ 2008. Reversible Self-Association of a
Concentrated Monoclonal Antibody Solution Mediated by Fab–Fab Interaction That Impacts
Solution Viscosity. Journal of Pharmaceutical Sciences 97(10):4219-4227.
33. Saluja A, Badkar AV, Zeng DL, Kalonia DS 2007. Ultrasonic rheology of a
monoclonal antibody (IgG2) solution: Implications for physical stability of proteins in high
concentration formulations. Journal of Pharmaceutical Sciences 96(12):3181-3195.
34. Hamrang Z, Pluen A, Zindy E, Clarke D 2012. Raster image correlation spectroscopy
as a novel tool for the quantitative assessment of protein diffusional behaviour in solution.
Journal of Pharmaceutical Sciences 101(6):2082-2093.
186
35. Hamrang Z, Hussain M, Tingey K, Tracka M, Casas-Finet JR, Uddin S, van der Walle
CF, Pluen A 2015. Characterisation of Stress-Induced Aggregate Size Distributions and
Morphological Changes of a Bi-Specific Antibody Using Orthogonal Techniques. Journal of
Pharmaceutical Sciences 104(8):2473-2481.
36. Shah M, Rattray Z, Day K, Uddin S, Curtis R, van der Walle CF, Pluen A 2017.
Evaluation of aggregate and silicone-oil counts in pre-filled siliconized syringes: An
orthogonal study characterising the entire subvisible size range. International Journal of
Pharmaceutics 519(1):58-66.
37. Xu J, Tseng Y, Carriere CJ, Wirtz D 2002. Microheterogeneity and Microrheology of
Wheat Gliadin Suspensions Studied by Multiple-Particle Tracking. Biomacromolecules
3(1):92-99.
38. Dasgupta BR, Tee S-Y, Crocker JC, Frisken BJ, Weitz DA 2002. Microrheology of
polyethylene oxide using diffusing wave spectroscopy and single scattering. Physical Review
E 65(5):0515051-05150510
39. Kang H, Ahn KH, Lee SJ 2010. Rheological properties of dilute polymer solutions
determined by particle tracking microrheology and bulk rheometry. Korea-Australia
Rheology Journal 22(1):11-10.
40. Larsen TH, Furst EM 2008. Microrheology of the Liquid-Solid Transition during
Gelation. Physical Review Letters 100(14):146001-146001.
41. Tseng Y, Kole TP, Lee S-HJ, Wirtz D 2002. Local dynamics and viscoelastic
properties of cell biological systems. Current Opinion in Colloid & Interface Science
7(3):210-217.
42. Palmer A, Xu J, Wirtz D 1998. High-frequency viscoelasticity of crosslinked actin
filament networks measured by diffusing wave spectroscopy. Rheologica Acta 37(2):97-106.
43. Pathak JA, Sologuren RR, Narwal R 2013. Do Clustering Monoclonal Antibody
Solutions Really Have a Concentration Dependence of Viscosity? Biophysical Journal
104(4):913-923.
44. Del Giudice F, Tassieri M, Oelschlaeger C, Shen AQ 2017. When Microrheology,
Bulk Rheology, and Microfluidics Meet: Broadband Rheology of Hydroxyethyl Cellulose
Water Solutions. Macromolecules 50(7):2951-2963.
45. Cha SHS, Kim D 2010. Viscosity of Sucrose Aqueous Solutions Measured by Using
Fluorescence Correlation Spectroscopy. Journal of the Korean Physical Society 56(4):1315-
1318.
46. Zondervan R, Kulzer F, Berkhout GCG, Orrit M 2007. Local viscosity of supercooled
glycerol near T(g) probed by rotational diffusion of ensembles and single dye molecules.
Proceedings of the National Academy of Sciences of the United States of America
104(31):12628-12633.
47. Yoshida N, Tamura M, Kinjo M 2000. Fluorescence Correlation Spectroscopy: A
New Tool for Probing the Microenvironment of the Internal Space of Organelles. Single
Molecules 1(4):279-283.
48. Shah M, Corbett D, Roche A, Davis P, Day K, Uddin S, Van der Walle C, Curtis R,
Pluen A 2018. Self-diffusion in Highly Concentrated Protein Solutions measured by
Fluorescence Correlation Spectroscopy. Unpublished. University of Manchester: Manchester,
UK.
49. Digman MA, Brown CM, Sengupta P, Wiseman PW, Horwitz AR, Gratton E 2005.
Measuring fast dynamics in solutions and cells with a laser scanning microscope. Biophysical
Journal 89(2):1317-1327.
50. Rigler R, Mets Ü, Widengren J, Kask P 1993. Fluorescence correlation spectroscopy
with high count rate and low background: analysis of translational diffusion. European
Biophysics Journal 22(3):169-175.

187
51. Szymański J, Patkowski A, Wilk A, Garstecki P, Holyst R 2006. Diffusion and
Viscosity in a Crowded Environment: from Nano- to Macroscale. The Journal of Physical
Chemistry B 110(51):25593-25597.
52. Krouglova T, Vercammen J, Engelborghs Y 2004. Correct Diffusion Coefficients of
Proteins in Fluorescence Correlation Spectroscopy. Application to Tubulin Oligomers
Induced by Mg(2+) and Paclitaxel. Biophysical Journal 87(4):2635-2646.
53. Pokrić B, Pučar Z 1979. The two-cross immunodiffusion technique: Diffusion
coefficients and precipitating titers of IgG in human serum and rabbit serum antibodies.
Analytical Biochemistry 93(1):103-114.
54. He F, Becker GW, Litowski JR, Narhi LO, Brems DN, Razinkov VI 2010. High-
throughput dynamic light scattering method for measuring viscosity of concentrated protein
solutions. Analytical Biochemistry 399(1):141-143.
55. Jung C, Lee J, Kang M, Kim SW 2014. Viscosity-Dependent Diffusion of Fluorescent
Particles Using Fluorescence Correlation Spectroscopy. Journal of Fluorescence 24(6):1785-
1790.
56. Yang M 2015. Stress and Protein Instability During Formulation and Fill/Finish
Processes. BioPharm International 28(6). 1 June. Available from:
http://www.biopharminternational.com/stress-and-protein-instability-during-formulation-and-
fillfinish-processes
57. Fleischman ML, Chung J, Paul EP, Lewus RA 2017. Shipping-Induced Aggregation
in Therapeutic Antibodies: Utilization of a Scale-Down Model to Assess Degradation in
Monoclonal Antibodies. Journal of Pharmaceutical Sciences 106(4):994-1000.
58. Waxman L, Vilivalam V 2011. Evaluation of end-over-end rotation/agitation of
protein solutions in prefilled syringes made from glass or plastic as a preliminary indicator of
protein aggregation. Protein Stability Conference. Colorado, US: University of Colorado
Center for Pharmaceutical Biotechnology.
59. Gerhardt A, McGraw NR, Schwartz DK, Bee JS, Carpenter JF, Randolph TW 2014.
Protein Aggregation and Particle Formation in Prefilled Glass Syringes. Journal of
Pharmaceutical Sciences 103(6):1601-1612.
60. Teska BM, Brake JM, Tronto GS, Carpenter JF 2016. Aggregation and Particle
Formation of Therapeutic Proteins in Contact With a Novel Fluoropolymer Surface Versus
Siliconized Surfaces: Effects of Agitation in Vials and in Prefilled Syringes. Journal of
Pharmaceutical Sciences 105(7):2053-2065.
61. Telikepalli SN, Kumru OS, Kalonia C, Esfandiary R, Joshi SB, Middaugh CR, Volkin
DB 2014. Structural Characterization of IgG1 mAb Aggregates and Particles Generated
under Various Stress Conditions. Journal of Pharmaceutical Sciences 103(3):796-809.
62. Grigolato F, Colombo C, Ferrari R, Rezabkova L, Arosio P 2017. Mechanistic Origin
of the Combined Effect of Surfaces and Mechanical Agitation on Amyloid Formation.
American Chemical Society Nano 11(11):11358-11367.
63. Thirumangalathu R, Krishnan S, Ricci MS, Brems DN, Randolph TW, Carpenter JF
2009. Silicone oil- and agitation-induced aggregation of a monoclonal antibody in aqueous
solution. Journal of Pharmaceutical Sciences 98(9):3167-3181.
64. Kiese S, Papppenberger A, Friess W, Mahler H-C 2008. Shaken, Not Stirred:
Mechanical Stress Testing of an IgG1 Antibody. Journal of Pharmaceutical Sciences
97(10):4347-4366.
65. Chou DK, Krishnamurthy R, Randolph TW, Carpenter JF, Manning MC 2005.
Effects of Tween 20® and Tween 80® on the Stability of Albutropin During Agitation.
Journal of Pharmaceutical Sciences 94(6):1368-1381.
66. Saluja A, Kalonia DS 2008. Nature and consequences of protein–protein interactions
in high protein concentration solutions. International Journal of Pharmaceutics 358(1):1-15.

188
67. Zhou H-X, Rivas G, Minton AP 2008. Macromolecular Crowding and Confinement:
Biochemical, Biophysical, and Potential Physiological Consequences. Annual Review of
Biophysics 37(1):375-397.
68. Rosa M, Roberts CJ, Rodrigues MA 2017. Connecting high-temperature and low-
temperature protein stability and aggregation. PLoS One 12(5):0176748-0176748.
69. Treuheit M, Kosky A, Brems D 2002. Inverse Relationship of Protein Concentration
and Aggregation. Pharmaceutical Research 19(4):511-516.
70. Krielgaard L, Jones LS, Randolph TW, Frokjaer S, Flink JM, Manning MC,
Carpenter JF 1998. Effect of tween 20 on freeze-thawing- and agitation-induced aggregation
of recombinant human factor XIII. Journal of Pharmaceutical Sciences 87(12):1597-1603.
71. Allison SD, Dong A, Carpenter JF 1996. Counteracting effects of thiocyanate and
sucrose on chymotrypsinogen secondary structure and aggregation during freezing, drying,
and rehydration. Biophysical Journal 71(4):2022-2032.
72. Sarciaux J, Mansour S, Hageman M, Nail S 1998. Effects of buffer composition and
processing conditions on aggregation of bovine IgG during freeze-drying. Journal of
Pharmaceutical Sciences 88(12):1354-1361.
73. Desu HR, Narishetty ST 2013. Challenges in Freeze–Thaw Processing of Bulk
Protein Solutions. In Sterile Product Development: Formulation, Process, Quality and
Regulatory Considerations. New York: Springer New York.
74. Mezhebovsky TER, Sass P, Shahrokh Z 2016. Enabling Freeze-Thaw Stability of
PBS-Based Formulations of a Monoclonal Antibody. BioPharm International 29(8). 1
August. Available from: http://www.biopharminternational.com/enabling-freeze-thaw-
stability-pbs-based-formulations-monoclonal-antibody

189
7 : FINAL CONCLUSIONS

190
7.1 Final Conclusions
Protein aggregation is a major degradation route during biopharmaceutical (e.g. monoclonal
antibodies) development. The mechanisms of aggregation still require further investigation;
particularly at high concentrations which are required to meet patient dose requirements. In
relation to this, the development of novel techniques is a major research area with a focus on
the detection of early aggregation i.e. small reversible aggregates, using small sample
material.
To characterise the broad size range of aggregates, and to overcome the limitations of a single
method, several approaches are used to determine sample aggregation. The two main
limitations with current methods are: (i) change of the local environment and (ii) high
concentration.1 The present study has shown RICS has a broad size range and specificity to
aggregates. Its principle using the spatiotemporal fluorescence intensity variations from
confocal images can be transferred to real proteins formulations to quantify the presence of
protein aggregates (sizes and concentrations). In Chapter 3, following a comparison between
RICS, RMM and MFI, RICS appeared to be an orthogonal technique to RMM with its own
set of advantages and disadvantages; for example sensors do not need to be changed (to cover
a broad size range) or the need for sample dilution but its sampling volume is too small and
relies on Brownian motion. Nevertheless, RICS bridged the gap (around 1m) between
RMM and MFI which have issues with particle differentiation towards their limits of
detection.2
Micro-rheology methods such as FCS are able to measure local variation of properties thus
may contribute towards models of predicting protein solution behaviour at high
concentrations. Here, in Chapter 4, FCS is applied in measuring the microviscosity of protein
solutions through measuring the self-diffusion of various sized tracers (e.g. ATTO-Rho6G
dye and IgG-AF for mAb solutions and TMR-peptide and BSA-AF for BSA solutions). It is
shown that using a tracer which is equal to or larger than the size of the crowder (i.e. mAb)
the ratio of diffusion is relatable to values of macroviscosity. For a tracer of the size equal to
the size of the crowder, (at least) changes in the solution environment can be informed –
although they may not be transferable to bulk rheometry values. Other micro-rheology
methods (such as DLS-based methods) measure self-diffusion of polystyrene-based tracers
that have a high risk of interaction with the protein particles and thus interfere with the data,
particularly at high concentrations.3,4
The probes used in FCS for mAb solutions e.g. ATTO-
Rho6G and IgG-AF were assessed for stability and potential interaction with solution

191
components (e.g. protein, surfactants etc.) before their application. As the quantity of
fluorophore required for FCS is small, the risk of interaction between probe and solution
components is minimal. Nevertheless, for each solution, interaction between the tracer and
the crowder need to be considered on a case by case basis. As seen in this study, although
IgM-AF seemed to give relatable information to bulk rheometry (of mAb solutions),
interaction between IgM-AF and mAb was indicated and thus IgM-AF cannot be utilised in
this application.
Another application of fluorescence proposed in this work is the use of SYPRO Orange
labelling and FCS to detect the presence of surfactant micelles and determine the cmc
accurately along with the micelle size (Chapter 5). Further investigations are required to
assess contribution of FCS artefacts (refractive index issues) on the measured diffusion time
and number of particles. Nevertheless, as the protein molecules are excluded from the data,
the approach has potential to assess polysorbate micelle behaviour in the presence of protein.
Hence, this application could provide insight into polysorbate mechanisms in high
concentrated protein formulations.
There are no established methods validated by regulatory authorities for the prediction of
long-term stability of mAb products. This is due to the complex nature of mAb solutions;
especially at high concentrations (see commentary – Appendix 5). To tackle this problem,
analytical tool boxes have been suggested.5 The use of RICS and FCS on the same system
can be classed as one of these analytical tool boxes, which may provide information on
solution properties in terms of aggregation and solution viscosity (respectively). Indeed
during early formulation development, limited material is available thus many techniques
requiring large sample volumes cannot be used to assess aggregation and viscosity. RICS and
FCS both require a couple of hundred of microlitres a useful point for high concentration
solutions. System set-up time is also low as both platforms can be setup on the same confocal
system. In the finale of the thesis, the sequential use of RICS and FCS is demonstrated (in
Chapter 6). The viscosity change following aggregation development is characterised as a
function of agitation type, agitation speed, and protein concentration. A correlation is
established between aggregation development (size and counts) and changes in solution
viscosity. Illustrating the complexity of mAb behaviour, an inverse relation is observed with
agitation-induced aggregation and mAb concentration.

192
As a final conclusion, in this thesis fluorescence based correlation spectroscopy analyses
have been utilised to assess mAb aggregation propensity in the context of downstream
bioprocessing and formulation. The use of RICS and FCS on the same confocal system offers
a high throughput method for accelerated stability assessments. The ability to determine
aggregation propensity with minimum modification of solutions or as early as possible in
formulation development is a major contributor to improve bioprocess design and
formulation of mAbs. It is envisaged that through the expansion of the hardware capability
e.g. heated stages for multi-well plates and automated measurements and analysis, the
RICS/FCS confocal system could be utilised to select appropriate buffer systems for mAb
products and thus act as a potential tool for formulation scientists in biopharmaceutical
product development.

193
7.2 References
1. Demeule B, Gurny R, Arvinte T 2007. Detection and characterization of protein
aggregates by fluorescence microscopy. International Journal of Pharmaceutics 329(1–2):37-
45.
2. Shah M, Rattray Z, Day K, Uddin S, Curtis R, van der Walle CF, Pluen A 2017.
Evaluation of aggregate and silicone-oil counts in pre-filled siliconized syringes: An
orthogonal study characterising the entire subvisible size range. International Journal of
Pharmaceutics 519(1):58-66.
3. Kang H, Ahn KH, Lee SJ 2010. Rheological properties of dilute polymer solutions
determined by particle tracking microrheology and bulk rheometry. Korea-Australia
Rheology Journal 22(1):11-10.
4. He F, Becker GW, Litowski JR, Narhi LO, Brems DN, Razinkov VI 2010. High-
throughput dynamic light scattering method for measuring viscosity of concentrated protein
solutions. Analytical Biochemistry 399(1):141-143.
5. Schermeyer M-T, Wöll AK, Kokke B, Eppink M, Hubbuch J 2017. Characterization
of highly concentrated antibody solution - A toolbox for the description of protein long-term
solution stability. mAbs 9(7):1169-1185.

194
APPENDIX 1

195
SUPPLEMENTARY INFORMATION FOR CHAPTER 1
A1.1 : Characterisation of Stress-Induced Aggregate Size Distributions and
Morphological Changes of a Bi-Specific Antibody Using Orthogonal Techniques
196
APPENDIX 2

197
APPENDIX 2: SUPPLEMENTARY INFORMATION FOR CHAPTER 3
A2.1 Discarding fits with R2 < 0.7
The reason to keep data with a R2 larger than 0.7 lies in the difficulty to relate R
2 to the fit of
the surface by a single diffusion fitting model (compared to fit a FCS/DLS curve with a
similar model). To assert our confidence in the diffusion coefficient determined by RICS, a
solution of 100nm diameter fluorescent beads (FluoSpheres, ThermoFisher) was used (stock
solution was dilute 1000x without further treatment), imaged using the Zeiss LSM510 and
then analysed with our software ManICS. Using ROIs, more than 1000 pairs (density, N and
diffusion coefficient, D) were obtained. These data were plotted as N (number of particles) vs
D (diffusion coefficient) and clusters in the data were sought: there should be only one cluster
with outliers (Figure A2.1).
A Gaussian Mixture Model with 2 or more components can be used (Please note that the
analysis was carried out using sklearning from http://scikit-
learn.org/stable/modules/mixture.html#variational-bayesian-gaussian-mixture in which the
BayesianGaussianMixture object implements a variant of the Gaussian mixture model with
variational inference algorithms). The number of components must be large enough to
exclude the outliers from the main distribution, but low enough to ensure that the main
distribution is not split in the process.
The Mixture with the highest weight is the distribution of interest (the centroid of which is
the mean N,D for our beads population). The 95% confidence ellipse for this population can
then be calculated (X2 = 5.991). The assumption (for a single species population) is that R2 is
higher towards the centroid of the cluster and lower for (N, D) pairs further away.
Knowing the 95% confidence ellipse, the mean R2
outside and inside the 95% confidence
ellipse can be calculated. The mean R2 value outside the confidence ellipse is 0.7, which we
use as a criterion (R2
> 0.7) for rejecting outliers (Figure A2.1).

198
Figure A2.1: Diffusion coefficient determined by RICS of a solution of 100nm diameter fluorescent
beads (FluoSpheres, ThermoFisher). Graph plots represent N (number of particles) vs D (diffusion
coefficient). The mean R2 value outside the confidence ellipse is determined as 0.7.

199
A2.2 Labelling of Particles by SYPRO® Red and SYPRO® Orange
(i) Efficiency of SYPRO® Red and SYPRO® Orange in labelling mAb
aggregates and silicone-oil
Two experiments were carried out in order to assess the labelling abilities of the two dyes
(SYPRO® Red and SYPRO® Orange), using 10mg/ml COE-08 in 0% (w/v) PS-20 histidine-
sucrose buffer (as described in the main manuscript) (Figures S2-S3). First, the mAb solution
was agitated in siliconized PFS for a 24 hour agitation period (as described in the main
manuscript). Solutions were subsequently analysed by RICS following incubation with
SYPRO® Red or SYPRO® Orange. The purpose of the experiment was to assess the size
ranges and the concentrations measured in the presence of the two dyes; in order to determine
if silicone-oil data can be selectively obtained in the presence of mAb, through data
subtraction i.e. SYPRO® Orange labelling minus SYPRO® Red labelling. Initial observation
of the particle size distributions (Figure S2) showed a larger particle size distribution
measured in the presence of SYPRO® Red, in comparison to SYPRO® Orange. When
comparing with the particle size distributions from the manuscript, the particle size
distribution in the presence of SYPRO® Red (Figure S2, left) was similar to the COE-08 data
(described later, Figure S4) and the SYPRO® Orange distribution (described later, Figure S2,
right) was similar to the silicone-oil data (Figure S5). This observation alongside the lack of
labelling by SYPRO® Orange for particles above 1 m indicated potential issues with mAb
(COE-08) aggregate labelling by SYPRO® Orange.
Figure A2.2: Particle size distribution from agitated mAb-filled PFS solutions, detected by RICS,
following incubation with SYPRO® Red and SYPRO® Orange. Sample means are represented by ■,
medians by a horizontal line, and minima/maxima by ×.
A second experiment with 10mg/ml COE-08 agitated (for 24 hours) in de-siliconized PFS
was undertaken for comparison. Figure A2.3 presents the particle concentrations determined

200
by the two dyes, separated into the same size ranges used in the manuscript i.e. (i) < 0.07, (ii)
0.07-0.5, (iii) 0.5-5 and (iv) > 5 m.
Figure A2.3: Particle counts in agitated mAb-filled siliconized (top) and de-siliconized (bottom) PFS
solutions. Horizontal and vertical axis represents particle counts determined by RICS (particles/mL)
following incubation with SYPRO® Red (left) and SYPRO® Orange (right) for size ranges (i) <
0.07m, (ii) 0.07-0.5m, (iii) 0.5-5m and (iv) >5m. Values represent average counts and error
bars represent the std. dev. for n=3.
Statistical tests (one-way ANOVA) showed significantly higher particle concentrations were
measured in the presence of SYPRO® Red in comparison to SYPRO® Orange (p < 0.05) for
the agitated PFS solutions, for all size ranges. For the de-siliconized PFS solutions,
significantly higher particle concentrations were observed (p < 0.05) in the 0.07-0.5 m and
0.5-5 m size ranges. As the maxima for particles measured in the presence of SYPRO®
Orange in the siliconized and de-siliconized PFS samples was 1.09 m and 1.17 m,
respectively, the particle concentration in the > 5 m size range was nil.
If SYPRO® Orange sufficiently labelled both aggregates and silicone-oil, a higher particle
concentration would be expected in comparison to the concentration measured in the
presence SYPRO® Red (labelling only aggregates), for the same sample. As this is not what
is observed, it can be concluded that SYPRO® Orange cannot be utilised to label both mAb
aggregates and silicone-oil droplets.

201
Thus, with the use of the current dyes SYPRO® Red and SYPRO® Orange, the
characterisation of silicone-oil droplets in the presence of mAb cannot be performed. Instead,
it is proposed to use SYPRO® Red to measure mAb aggregates (in the presence of other
solution components such as silicone-oil) and SYPRO® Orange to measure silicone-oil in
mAb-free solutions only; as we have done in the paper.
(ii) SYPRO Orange in labelling PS-20 micelles
Following incubation with SYPRO® Orange, although insufficient labelling of PS-20
micelles is observed, a brighter background is present (Figure 1). The brighter background
may suggest interaction of the fluorophore with PS-20 micelles (as the PS-20 concentrations
used here are above the known CMC1,2
). Fluorescence correlation spectroscopy (FCS) was
utilised to detect PS-20 micelles in the presence of SYPRO® Orange. Table A2.1 presents
the determined PS-20 micelle radius (for both PS-20 concentrations used), with values that
are supported by previous literature.3-5
To ensure micelles were not selected in the RICS
analysis (for mAb or silicone-oil data), a cut-off was set at 30 nm for RICS analysis (for all
solutions).
Table A2.1: Radius of PS-20 micelles determined through FCS analysis following incubation with x
2.5 SYPRO® Orange (Ex: 488nm, BP 560-615nm). Zeiss LSM 510 ConforCor 2 setup (Zeiss, Jena,
Germany) equipped with a c-Apochromat 40×/1.2NA water-immersion objective was utilised. Values
represent averages with std. dev. for n=5.
PS-20 Concentration (w/v) Radius (nm)
0.02% 3.25 ± 0.39
0.05% 3.09 ± 0.16
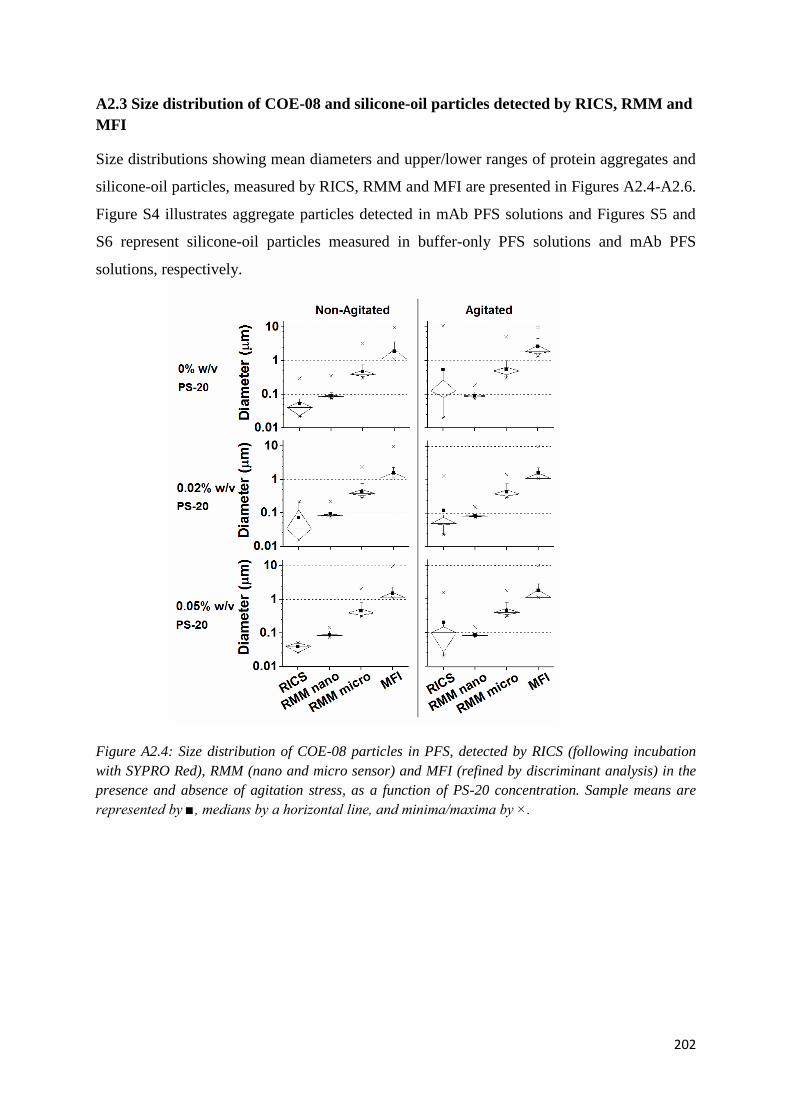
202
A2.3 Size distribution of COE-08 and silicone-oil particles detected by RICS, RMM and
MFI
Size distributions showing mean diameters and upper/lower ranges of protein aggregates and
silicone-oil particles, measured by RICS, RMM and MFI are presented in Figures A2.4-A2.6.
Figure S4 illustrates aggregate particles detected in mAb PFS solutions and Figures S5 and
S6 represent silicone-oil particles measured in buffer-only PFS solutions and mAb PFS
solutions, respectively.
Figure A2.4: Size distribution of COE-08 particles in PFS, detected by RICS (following incubation
with SYPRO Red), RMM (nano and micro sensor) and MFI (refined by discriminant analysis) in the
presence and absence of agitation stress, as a function of PS-20 concentration. Sample means are
represented by ■, medians by a horizontal line, and minima/maxima by ×.

203
Figure A2.5: Size distribution of silicone-oil particles in buffer-filled PFS, detected by RICS (following
incubation with SYPRO Orange), RMM (nano and micro sensor) and MFI (refined by discriminant analysis), in
the presence and absence of agitation stress, as a function of PS-20 concentration. Sample means are
represented by ■, medians by a horizontal line, and minima/maxima by ×.

204
Figure A2.6: Size distribution of silicone-oil particles in mAb PFS solutions, detected by RMM (nano and micro
sensor) and MFI (refined by discriminant analysis), in the presence and absence of agitation stress, as a
function of PS-20 concentration. Sample means are represented by ■, medians by a horizontal line, and
minima/maxima by ×.
205
A2.4 References
1. Fuguet E, Ràfols C, Rosés M, Bosch E 2005. Critical micelle concentration of
surfactants in aqueous buffered and unbuffered systems. Analytica Chimica Acta 548(1–
2):95-100.
2. Mittal KL 1972. Determination of CMC of polysorbate 20 in aqueous solution by
surface tension method. Journal of Pharmaceutical Sciences 61(8):1334-1335.
3. Luschtinetz F, Dosche C 2009. Determination of micelle diffusion coefficients with
fluorescence correlation spectroscopy (FCS). Journal of Colloid and Interface Science
338(1):312-315.
4. Carnero RC, Molina-Bolívar J, Aguiar J, MacIsaac G, Moroze S, Palepu R 2003.
Effect of ethylene glycol on the thermodynamic and micellar properties of Tween 20. Colloid
and Polymer Science 281(6):531-541.
5. Khlebtsov BN, Chumakov EM, Semyonov SV, Chumakov MI, Khlebtsov NG 2004. Study of complex micellar systems by static and dynamic light scattering. Saratov Fall
Meeting 2003: Coherent Optics of Ordered and Random Media IV. Saratov, Russia: Russian
Federation.

206
APPENDIX 3

207
APPENDIX 3: SUPPLEMENTARY INFORMATION FOR CHAPTER 4
A3.1 Spectrophotometry calibration curves of candidate dyes
To determine the concentration of dye following rocking (for the Log P), calibration curves
were produced for the candidate dyes i.e. Azure-B, ATTO-465 and ATTO-Rho6G (Figure
A3.1).
Figure A3.1: Calibration curve of (A) Azure-B (B) ATTO-465 and (C) ATTO-Rho6G determined
using spectrophotometry. Symbols and error bars show mean ± standard deviations respectively for
n=3. R2 value of calibration curves are 0.941, 0.997 and 0.993 respectively.

208
A3.2 Count rates of candidate dyes
Example (FCS) count rates of the candidate dyes (Azure-B, ATTO-465 and ATTO-Rho6G)
are illustrated in Figure A3.2.
Figure A3.2: Typical FCS count rates of (TOP) Azure-B 100nM - large peak outliers are indicated
with arrows, (MIDDLE) ATTO-465 100nM and (BOTTOM) ATTO-Rho6G 100nM.

209
A3.3 ATTO-Rho6G labelling of mAb and other solution components
To investigate any labelling of mAb (COE-08) by ATTO-Rho6G, a broad range of mAb
(COE-08) concentrations (1mg/ml - 75mg/ml) were assessed with two concentrations of
ATTO-Rho6G (1nM and 100nM). The FCS diffusion times are presented in Figure A3.3.
Figure A3.3: Diffusion times of (LEFT) 1nM and (RIGHT) 100nM ATTO-Rho6G in the presence of
COE-08 (concentrations from 1mg/ml to 75mg/ml). Symbol illustrates the mean (± st. dev) (n=5).
An increase in the diffusion times with increasing COE-08 concentrations with ATTO-
Rho6G was established and statistical analysis (one-way ANOVA with post hoc
comparisons) showed that the difference in diffusion times between the varied mAb
concentrations were significant, for all comparisons (p < 0.05). No significant differences (at
p = 0.05) were observed between the one-component and two-component models for all
measurements which indicates the presence of only one population of fluorescent parties i.e.
the unbound dye.
The viscosity of the mAb solutions was determined (independently) using a Vilastic-3
rheometer (as described in the main methods). Results illustrated a strong correlation with the
rheometer determined viscosity and the diffusion time for 1nM and 100nM ATTO-Rho6G
determined by FCS (Figure A3.4). Thus, a linear relation between ATTO-Rho6G and
solution viscosity is established.

210
Figure A3.4: Viscosity (from vilatic-3) of COE-08 concentrations from 1mg/ml to 75mg/ml against
FCS-determined diffusion times with (LEFT) 1nM ATTO-Rho6G and (RIGHT) 100nM ATTO-Rho6G.
Graph illustrates the mean (± st. dev). A linear relationship is established (linear regression fit
applied using Origin Software), indicating that η τD. R2 values of the slopes are 0.971 and 0.997,
respectively.
Equilibrium dialysis (using a 96-well Equilibrium Dialysis Block and dialysis membrane
with a 12-14 kDa MWCO) was carried out to rule out weak binding to the mAb (COE-08),
which with rapid on/off rates would produce an 'effective" diffusion time that increases with
COE-08 concentration and would not necessarily produce a two-component fit (which would
be seen if on/off rates are slow). Equilibrium dialysis offers the ability to study low affinity
interactions that are undetectable using other methods. Figure A3.5 illustrates the calibration
curve of ATTO-Rho6G determined by spectrophotometry. The determined ‘fraction bound’
values are presented in Figure A3.6, which had no significant differences (at p = 0.05) when
comparing the mAb samples with their respective control samples (i.e. no mAb), for each dye
concentration. Thus, indicating insufficient interaction between ATTO-Rho6G and COE-08
over a wide range of concentrations.

211
Figure A3.5: Calibration curve of ATTO-Rho6G determined using spectrophotometry. Symbols and
error bars show mean ± standard deviations respectively for n=3. R2 value of 0.999 determined.
Figure A3.6: Fraction bound values following equilibrium dialysis. Data measured by
spectrophotometry. Symbols represent means ± st. dev at n = 3. Dashed blue lines represent the
control sample data (st.dev around the mean) per dye concentration, showing no significant
differences between the control and mAb samples.
The diffusion times of the solutions following equilibrium dialysis using lower dye
concentrations i.e. < 200nM were determined by FCS. With FCS, both sides of the well were
analysed (i.e. the mAb side too). Figure A3.7 presents the diffusion times determined in each
well chamber following equilibrium dialysis.

212
Figure A3.7: FCS determined diffusion times of dye and COE-08 solutions following equilibrium
dialysis. Data represents means ± st. dev at n = 3.
Solutions from ‘dye only’ chambers gave a diffusion time of around 35s (consistent with
previous data). Solutions from ‘mAb chambers’ show an increase in diffusion time as mAb
concentrations increases, for each dye concentration (again, consistent with previous data).
Stats (F-test between chi2
values) between the one and two component models showed no
significant differences (at p = 0.05) between the fits of the models. Thus, insufficient
labelling is indicated of COE-08 with the hydrophilic dye, ATTO-Rho6G.
Next step was to assess binding of ATTO-Rho6G with protein aggregates and other solution
components. Table A3.1 presents the FCS diffusion times of stressed COE-08 solutions
(conditions chosen are known to generate aggregates1) and polysorbate solutions. No
significant differences (at p = 0.05) of the FCS fits were observed between the one and two
component models, for all measurements, indicating the presence of only one population of
fluorescent particles i.e. dye in solution. The labelling of mAb or PS (micelles would be
present at the concentrations assessed) should generate a diffusion time that is larger than
250s; this would equate to a radius of around 3nm. Thus the observed slight increase in
diffusion time represents an increase in the solution viscosity. Significant differences were
observed (p < 0.05) with the protein solutions (more so with the aggregate solutions), and the
higher PS concentrated solutions in comparison to buffer only solution.

213
Table A3.4: FCS diffusion times of 100nM ATTO-Rho6G solutions containing mAb, mAb
aggregates and a range of polysorbate solutions. Values represent mean ± st. dev for n=5.
Solution Diffusion Time (s)
Buffer only 36 ± 2
10mg/ml COE-03 unstressed 41 ± 1
10mg/ml COE-03 58C overnight 45 ± 3
10mg/ml COE-03 80C overnight 62 ± 11
PS-20 solutions:
0.005%
0.02%
0.05%
1%
0.02% + 10mg/ml COE-03
36 ± 2
36 ± 2
36 ± 2
45 ± 4
50 ± 6
PS-80 solutions:
0.001%
0.02%
0.04%
1%
0.02% + 10mg/ml COE-03
36 ± 2
35 ± 1
37 ± 3
42 ± 4
49 ± 4

214
A3.4 References
1. Hamrang Z, Hussain M, Tingey K, Tracka M, Casas-Finet JR, Uddin S, van der Walle
CF, Pluen A 2015. Characterisation of Stress-Induced Aggregate Size Distributions and
Morphological Changes of a Bi-Specific Antibody Using Orthogonal Techniques. Journal of
Pharmaceutical Sciences 104(8):2473-2481.

215
APPENDIX 4

216
APPENDIX 4: SUPPLEMENTARY INFORMATION FOR CHAPTER 6
A4.1 Aggregate labelling comparison between IgG-AF and SYPRO Red
To assess if labelling of aggregates by IgG-AF was visible with RICS, 4hr 500rpm shaken
10mgml COE-08 solutions were compared with labelling by SYPRO Red. SYPRO Red has
been validated for successful labelling of aggregates through comparing measured size ranges
and concentrations with orthogonal techniques.1,2
Figure A4.1 shows the low level of
labelling by IgG-AF in comparison to extrinsic labelling by SYPRO Red: Following
overnight incubation with IgG-AF, only small aggregates were detected by IgG-AF (i.e. < 0.5
m) and the concentration of aggregates was substantially lower (p < 0.05) for each size
range, in comparison to data with SYPRO Red.
Figure A4.1: RICS (left) with SYPRO Red and (right) IgG-AF determined aggregate concentrations
(particles / fL) for 4 hour shaken (at 500rpm) 10mg/ml COE-08 solutions in vials. Data separated into
size ranges of (i) < 0.05, (ii) 0.05-0.5, (iii) 0.5-5 and (iv) > 5 m.

217
A4.2 References
1. Hamrang Z, Hussain M, Tingey K, Tracka M, Casas-Finet JR, Uddin S, van der Walle
CF, Pluen A 2015. Characterisation of Stress-Induced Aggregate Size Distributions and
Morphological Changes of a Bi-Specific Antibody Using Orthogonal Techniques. Journal of
Pharmaceutical Sciences 104(8):2473-2481.
2. Shah M, Rattray Z, Day K, Uddin S, Curtis R, van der Walle CF, Pluen A 2017.
Evaluation of aggregate and silicone-oil counts in pre-filled siliconized syringes: An
orthogonal study characterising the entire subvisible size range. International Journal of
Pharmaceutics 519(1):58-66.
218
APPENDIX 5

219
APPENDIX 5: COMMENTARY
A5.1 Commentary: New Perspectives on Protein Aggregation during
Biopharmaceutical Development
Commentary
New Perspectives on Protein Aggregation during Biopharmaceutical Development
Maryam Shah
Division of Pharmacy and Optometry, School of Health Sciences, Faculty of Biology, Medicine and Health,
University of Manchester, Manchester, UK
Abstract
Protein aggregation during biopharmaceutical (e.g. monoclonal antibodies) development
impacts yields, production costs and must be controlled during formulation in order to ensure
the clinical efficacy of the drug product: understanding aggregation mechanisms and
developing mitigating strategies are imperative. This commentary reflects on recent progress
made in the field of protein aggregation with considerations on novel detection techniques,
novel excipients, interfacial phenomena and prediction of aggregation rates. Furthermore,
future directions of research are speculated based on opinions of several academics and
industrialists: an academic perspective with industrial focus.
Introduction to protein biopharmaceutical development
Biopharmaceutical proteins constitute a growing family of medicines for many therapeutic
areas including oncology, inflammation and autoimmunity, infectious disease, and
cardiovascular and metabolic disease. In the last decade more than 170 biologics have been
approved for clinical use and around a third of these are monoclonal antibodies (mAbs).1
There are, however, a number of associated challenges in their manufacturing and
formulation including controlling and predicting the reversible and irreversible formation of
protein aggregates. Aggregation can lead to loss of product recovery following production
and purification, and places constraints on how the protein is formulated for storage; as the
formulation constitutes (i.e. salts, excipients2,3
) and storage conditions (i.e. temperature4,5
)
impact protein stability. Moreover, research suggests aggregation can cause unwanted side
effects in patients.6,7
Thus, there are strict regulations on the level of aggregation in protein
biopharmaceuticals.8-10

220
Biopharmaceutical companies have in-house (proprietary) approaches to minimise
aggregation, based on experience. For companies with both Research and Development arms,
a wealth of bioprocess expertise has been accumulated, including the relationship between
mAb stability and domain architecture to the amino acid sequence.11
However, ushering in a
non-empirical, rational approach a priori would be of great benefit when translating results
for the aggregation behaviour of one protein family (e.g. mAbs) to another (e.g. bispecific
mAbs or peptide fusions). Such an approach would require commensurate improvement of
measuring and detecting aggregates, their kinetics, and accompanying predictive models. The
ability to predict aggregation requires an improved understanding of the underlying inter- and
intra-molecular mechanisms. To date, the strategy has been to bring together robust in silico
models with quantitative analytical measurement to provide insight to the aggregation
process; from nucleation to visible particulate, particularly across the so-called ‘gap region’
around 1 m.12,13
This strategy has been particularly profitable under collaborative ventures
between academic and industrial partners.
This commentary reflects on recent progress made in the field of (non-covalent) protein
aggregation (i.e. physical, non-covalent changes). Additionally, from an academic
perspective with industrial focus, speculations on the future direction of research are reported,
asking: what are scientists aiming to achieve when using a specific measurement technique or
predictive model; and how important is our knowledge of the knowns and unknowns as
related to protein aggregation?
Measuring protein aggregation: scope, limitations and future technologies
Much effort has been put into developing technologies able to detect and characterise protein
aggregates. With the increased interest in the characterisation of smaller sub-micron sized
aggregates (0.1 – 1 m),14-16
the need for technologies able to detect small aggregates in
highly concentrated mAb formulations is a future requirement that will be paramount to
predicting shelf life of liquid drug products.
A major advance was in the quantitative characterisation of aggregate size distributions,
particularly aggregates generated by the dynamic process of ‘reversible self-assembly’ (RSA)
which, for mAbs, would typically be in the order of tens of nanometres in diameter.
Analytical ultracentrifugation (AUC) is a useful technique for characterising such aggregates
(e.g. monomer, dimer, trimer) and in quantifying protein association as a function of protein
concentration; and thus calculating the respective equilibria that may exist.17
Current AUC

221
technology using optical detection systems (UV/vis absorption and Rayleigh interference) is
limited to protein concentrations less than 50 g/L. Above this limit samples require dilution
prior to measurement. Sample dilution introduces uncertainly in the predictive value of the
analytical method since the resultant aggregate population is no longer representative of that
present in the concentrated solution, a consequence of perturbation of the equilibria present in
a mAb sample which undergoes RSA. One possible solution arises from protein detection
technologies based on Schlieren optics, which do not require dilution and are compatible with
AUC instruments. Ironically, such optical systems were formally available in earlier AUC
instrumentation and therefore could be reintroduced in a relatively simple manner.
The requirement for sample dilution is not restricted to AUC: other technologies including
conventional methods such as dynamic light scattering (DLS) and emerging techniques
covering the sub-visible size-range such as resonant mass measurement (RMM)
(Archimedes®, Malvern Ltd., UK) and nanoparticle tracking analysis (NTA), are also poorly
suited to cope with characterising aggregates in highly concentrated mAb solutions (> 100
g/L) due to inherent ambiguity in the interpretation of data acquired.18-21
Measurement of
aggregates in highly concentrated mAb solutions is relevant because high doses may be
needed to meet a therapeutic response, and in the case of chronic administration via
subcutaneous injection, a volume limit of around 1 ml is common (at least for a pre-filled
syringe).22
Another requirement in the advancement of technologies is the ability to differentiate
between protein and foreign matter. For example, mAb solutions in pre-filled syringes often
contain sloughed silicone-oil particles following agitation / transport and commercially
available techniques detecting small aggregates do not have the ability to differentiate. The
recently developed (RMM) Archimedes® system has the ability to differentiate between
protein and foreign matter (based on particle buoyancy) although the approach has
concentration limits. Archimedes has been used alongside micro-flow imaging (MFI), to
cover a broad size range.16,23
MFI has received much attention due to the volume and size-
range matching regulations and providing useful information on the morphology of large
protein particles i.e. > 1 m. However, due to optical similarities between particles (e.g.
protein and silicone-oil), significant misclassification errors have been observed for particles
< 4 m. Thus, the ‘analytical gap’ around 1 m still remains.16
The adaption of existing
image correlation spectroscopy (ICS) analyses for the measurement of protein aggregates has
very recently been demonstrated: Raster Image Correlation Spectroscopy (RICS) has been

222
utilised to selectively characterise aggregates in the presence of other solution components,
though the use of fluorescence labelling, covering a broad size-range. Due to the specificity
of the technique and small sample volume requirement, there is strong scope for the
application of RICS in complex mAb solutions, especially in relation to early formulation
development.23
The application of RICS in high concentrated mAb solutions (i.e. > 100
mg/ml) is a worthwhile next step.
Can we predict protein aggregation rates?
As previously mentioned, to address this question we require an understanding of the
molecular pathways towards an aggregated state and their concomitant determinants. A key
stumbling block is the detection of aggregate prone state(s) or structural conformers, which
occur transiently at low concentrations relative to natively folded proteins. It is hypothesised
that structural intermediates may nucleate aggregation through transient exposure, for
example, of a relatively hydrophobic peptide loop on the domain body. Testing this
hypothesis in silico would immediately present the currently intractable problem of searching
across a vast number of structural intermediates for their propensity to self-assemble.
Experimental approaches inducing transient structural states may currently be more
productive, so long as there exists analytical techniques able to probe the dynamic nature of
protein unfolding at high concentrations. A simple but well established measure of protein
conformational stability used during antibody engineering and formulation development is
the melting temperatures (Tm), determined by differential scanning calorimetry (DSC) or
differential scanning fluorimetry (DSF). A thermogram from either technique can at least
establish that the first unfolding event begins at a temperature above that of the highest
storage temperature used to induce stress under accelerated stability studies (ICH
guidelines24
).
Industrial approaches to predicting aggregation rates on storage usually rely on
extrapolating kinetics measured under accelerated conditions such as higher temperatures.
Recent report describes the limited accuracy of accelerated stability methods in predicting
aggregation rates25
and their adoption in the biopharmaceutical industry for this purpose is
unclear. In many cases extrapolating shelf-life from accelerated conditions is inaccurate due
to competing aggregation pathways whose relative rates change with temperature, which is a
cause of non-Arrhenius behaviour in protein aggregate rates.25,26
As such, predictions require
a broad range of temperatures, involving the measurement of monomer loss over very long
timescales.

223
The second virial coefficient, B22, is often used as a surrogate parameter for correlating
storage stability, which relies on the assumption that native-state protein-protein interactions
are similar to those between partially folded intermediates in aggregation pathways. More
insight can be gained by developing coarse-grained models that reflect the structural
determinants of protein-protein interactions. These models could be used for predicting the
concentrated solution behaviour, which was characterized in terms of the protein-protein
Kirkwood-Buff integral, G22. The importance for understanding the effects of solution non-
ideality on aggregation at high protein concentration is highlighted.27,28
These approaches are
applicable for capturing the impact of electrostatic interactions on aggregation pathways, but
are not universally reliable as buried hot-spots, not exposed in the native state, have a strong
influence on aggregation.29,30
A major goal for the protein formulation community is the establishment of a
database relating protein structure and environment (solution, interface and excipient
conditions), to aggregation behaviour. This is largely due to the inevitable absence of
harmonisation in environment conditions across the numerous research papers describing
protein aggregation, coupled to very limited structural information on the protein itself (often
merely the relative mass and isoelectric point). However, aggregation studies on non-mAb
proteins which have such a goal in mind have demonstrated its feasibility. A recent study into
a human-like single chain antibody fragment (scFv) characterised the effects of multiple
mutational strategies (patch overcharging, charge substitution, salt bridge addition,
hydrophobic surface residue removal), on the conformational and colloidal stability of the
protein.31
Elsewhere, systematic mutant analyses show that single and double amino acid
mutations to γD-crystallin can have dramatic effects on protein phase separation (assessing
aggregation, liquid-liquid phase separation and crystallisation) and its dependence on
temperature; these measurements provide insight into the energetics of anisotropic protein-
protein interactions.32-34
Protein phase diagrams for chemically modified γD-crystallin also
demonstrated that relatively minor changes to the protein surface change the thermodynamics
of protein-protein interactions and therefore RSA: this may be important in the development
of antibody drug conjugates (ADCs). However, HT bulk solution phase measurements as a
function of temperature (i.e. through differential static light scattering; Stargazer-384™,
Harbinger) are not necessarily sensitive to the subtle changes in bulk solution properties35
and
identifying the key protein surface drivers is currently a research focus.

224
At the interface
Understanding how the fill finish process and associated primary packing impact upon mAb
aggregation is an important focus in development. Determining the nature of the adsorbed
mAb layer at the air/liquid and solid/liquid interface is not routinely performed in industry
but is an active area of investigation in academia, often through collaboration. Such studies
are directly relevant to understanding the origin of particulate formation upon vial shaking,
for instance. Similarly, aggregation is as much an issue during post-production (transport,
storage, etc.) as it is during production, and shaking studies are a routine assessment of
formulation robustness in regard of titrating an appropriate concentration of (typically)
polysorbate-20/-80. Work from the Friess group has shown that compression and
decompression of the protein film, which mAbs form at the liquid-air interface, results in
aggregate formation, depending on the extent of protein-protein interaction.36
The stabilizing
role of polysorbate surfactants was demonstrated to attenuate interface induced aggregation
of mAbs on account of their faster adsorption kinetics to the interface in comparison to
proteins. Nevertheless, polysorbate surfactants must be obtained at the highest possible purity
since they are well characterised to undergo hydrolysis leading to the generation of fatty
acids; this not only removes surfactant activity (and therefore increases mAb instability at the
interface) but may also promote mAb degradation in the bulk solution.36
While alternative,
synthetic surfactants, such as triblock copolymers of polypropylene oxide and polyethylene
oxide have application in therapeutic mAb formulations, the predominance of the
polysorbates remains. Similarly, novel surfactants based on trehalose fatty acid esters have
been synthesised, characterised and tested in relevant formulation scenarios such as shake-
induced stress, but have not been adopted further in mAb formulation.37
It is increasingly thought that the nature of the mAb layer adsorbed at the solid/liquid
interface has impact on the bulk stability, through adsorption-desorption events concomitant
with structural deformation, leading to non-native conformers nucleating aggregation in bulk
solution. This research effort is ongoing and high resolution analytical techniques probing
surface adsorption have been brought to bear on this challenge, specifically ellipsometry and
neutron reflection. It has been shown that such data can be interpreted through molecular
simulation of the adsorbed layer. At low concentrations there is minimal evidence for
unfolding at the silicon oxide (glass) interface and the most noticeable parameter affecting on
mAb adsorption is buffer pH, most likely on account of the electrostatic forces between the
mAb surface charge and surface. In the context of industrial formulation and fill-finish,

225
changing buffer pH may offer a route to modulating surface adsorption, assuming such a
requirement was identified as necessary during development.38
What use are novel excipients?
Excipients commonly used during the formulation of mAbs include amino acids, polyols,
salts, sugars, and surfactants. It seems unlikely that this status quo will remain given recent
reports and patents39
identifying new excipients that equally mitigate the physical and
chemical instability of biological drugs. A key driver for this field being the reduction of
viscosity of highly concentrated mAb solutions, but other more general drivers may be to
improve a medicinal product (e.g. through a change in its pharmacokinetics) and therefore
patient benefit, gain a product differentiation, or increase drug product quality and simplify a
manufacturing step or bioprocess. Leveraging research from the related field of protein
expression and refolding, arginine salts have become a strong focus in recent years and salt
forms other than the hydrochloride salt have provoked industrial applications, particularly
arginine glutamate,40,41
although pharmaceutical grades of the dry powder remain
outstanding. Non-arginine excipients are in earlier phases of investigation but include
hydrophobic anions42
and 2,6-pyridenicarboxylic acid.42
The latter suffers from low
solubility, limiting its application unless new, more aqueously soluble salt forms can be
identified. Nevertheless, these hydrophobic anions do not appear to perturb protein tertiary
structure and do reduce the viscosity of concentrated mAb solutions. Further work would be
required to better understand their performance during long-term stability studies, for
example, comparison of aggregation and fragmentation rates against arginine salts.
There is also a wider research effort to characterise the low-affinity binding domains/amino
acids to arginine and anions described above. It is possible that such binding sites represent
aggregation ‘hot spots’ on the protein surface. Their identification would in principal
facilitate the rational design of ‘custom excipients’. To this goal, molecular dynamics
simulations of local protein surface patches (or indeed, the whole mAb) are likely to become
an important research tool: excipients that bind to these hotspots could be identified through
molecular docking routines. A related experimental approach has been to determine the
binding energies of common excipients to surface regions of a Fab fragment, ranking the
binding energies for a hotspot against the Tm and aggregation rate.25
Bringing a novel excipient into clinical testing poses a challenge that would demand a clear
rationale for their inclusion into a mAb formulation. In regard of clinical trials, the European
Medicines Agency (EMA)43
states: “For novel excipients, details are to be given on their

226
manufacturing process, characterisation and control in relevance to product safety”.
Similarly, EMA guidelines for Marketing Authorisation Application require documentation
as would be expected for a new drug substance: “Full details of manufacture, characterisation
and controls with cross references to supporting safety data should be provided for novel
excipients, according to the drug substance format.” In the US, the Food and Drug
Administration does not outline specific guidance for novel excipients unless included in a
Biologics License Application (or New Drug Application). The industry would therefore
need to assess the risk of investment necessary for safety and efficacy documentation, and the
potential risk to delay approval of the drug product containing the novel excipient, against the
critical advantages gained, such as a unique capability or purpose.
Concluding remarks
From an industrial aspect, aggregation is statistically understood but not mechanically
unravelled: individual companies have standardised stress testing using an approach which is
mostly effective at getting rid of the very bad contenders. However, stress studies depend on
the mechanism of aggregation (pathway) thus the question for academics remains on what is
the rate limiting factor. It is questioned whether understanding pathways is necessary or
finding conditions limiting aggregation would be sufficient. In the literature, studies focusing
on predicting aggregation is quite low in comparison to measuring aggregation (e.g.
technologies, modelling) and controlling aggregation (e.g. use of excipients).
Characterising, modelling and predicting aggregation of biopharmaceuticals is a complex
task far from being answered. On the whole, this review highlights the need for further
research collaboration between industry and academia, as, as difficult as this problem may be
for mAbs, these molecules may be considered as ‘well behaved’ compared to novel entities
e.g. peptides, affimers, fragments but also mixtures of proteins.
Acknowledgements
This commentary includes discussions which took place during the meeting ‘Recent
Breakthroughs and New Perspectives in Protein Aggregation’, February 2017, sponsored by
BioProNET (grant code BB/L013770/1) and University of Manchester (Division of
Pharmacy and Optometry). The author would like to gratefully acknowledge the following
for their contribution to the commentary: Professor Christopher Roberts (University of
Delaware), Dr Jennifer McManus (Maynooth University), Professor Paul Dalby (University
College London), Professor Stephen Harding (University of Nottingham), Professor

227
Wolfgang Friess (LMU Munich) and Dr James Austerberry (University of Manchester).
Special thanks go to Dr Alain Pluen (University of Manchester), Dr Robin Curtis (University
of Manchester) and Dr Chris Van der Walle (Medimmune) for their contribution and
invaluable support.

228
References
1. Biopharmaceutical Products in the U.S. and European Markets [Internet]. U.S.
Biopharmacopeia. Available from: http://www.biopharma.com/approvals.html
2. Ugwu SO, Apte SP 2004. The Effect of Buffers on Protein Conformational Stability.
Pharmaceutical Technology 28(3):86-113.
3. Kamerzell TJ, Esfandiary R, Joshi SB, Middaugh CR, Volkin DB 2011. Protein–
excipient interactions: Mechanisms and biophysical characterization applied to protein
formulation development. Advanced Drug Delivery Reviews 63(13):1118-1159.
4. Lazar KL, Patapoff TW, Sharma VK 2010. Cold denaturation of monoclonal
antibodies. mAbs 2(1):42-52.
5. Grant Y, Matejtschuk P, Bird C, Wadhwa M, Dalby P 2012. Freeze drying
formulation using microscale and design of experiment approaches: a case study using
granulocyte colony-stimulating factor. Biotechnology Letters 34(4):641-648.
6. Rosenberg AS 2006. Effects of protein aggregates: An immunologic perspective.
American Association of Pharmaceutical Scientists Journal 8(3):501-507.
7. Wang SSS, Wu JW, Yamamoto S, Liu H-S 2008. Diseases of protein aggregation and
the hunt for potential pharmacological agents. Biotechnology Journal 3(2):165-192.
8. <788> Particulate Matter in Injections [Internet]. U.S. Pharmacopeia. Available from
http://www.pharmacopeia.cn/v29240/usp29nf24s0_c788.html
9. <787> Subvisible particulate matter in therapeutic protein injections. U.S
Pharmacopeia. Available from: http://pssnicomp.com/applications/parenterals/usp-subvisible-
particulate-matter-in-therapeutic-protein-injections/
10. Guidance for Industry Container Closure System for Packaging Human Drugs and
Biologics [Internet]. U.S. Department of Health and Human Services Food and Drug
Administration. Available from: http://www.fda.gov/cder/guidance/index.htm
11. Dobson CL, Devine PWA, Phillips JJ, Higazi DR, Lloyd C, Popovic B, Arnold J,
Buchanan A, Lewis A, Goodman J, van der Walle CF, Thornton P, Vinall L, Lowne D,
Aagaard A, Olsson L-L, Ridderstad Wollberg A, Welsh F, Karamanos TK, Pashley CL,
Iadanza MG, Ranson NA, Ashcroft AE, Kippen AD, Vaughan TJ, Radford SE, Lowe DC
2016. Engineering the surface properties of a human monoclonal antibody prevents self-
association and rapid clearance in vivo. Scientific Reports 6(1):38644-38644.
12. Carpenter JF, Randolph TW, Jiskoot W, Crommelin DJA, Russell Middaugh C,
Winter G, Fan Y-X, Kirshner S, Verthelyi D, Kozlowski S, Clouse KA, Swann PG,
Rosenberg A, Cherney B 2009. Overlooking Subvisible Particles in Therapeutic Protein
Products: Gaps That May Compromise Product Quality. Journal of Pharmaceutical Sciences
98(4):1201-1205.
13. Gross J, Sayle S, Karow AR, Bakowsky U, Garidel P 2016. Nanoparticle tracking
analysis of particle size and concentration detection in suspensions of polymer and protein
samples: Influence of experimental and data evaluation parameters. European Journal of
Pharmaceutics and Biopharmaceutics 104(1):30-41.
14. Singh SK 2013. Particulate Matter in Sterile Parenteral Products. In Sterile Product
Development: Formulation, Process, Quality and Regulatory Considerations. New York:
Springer New York.
15. Pharmacopeia [Internet]. The United States Pharmacopeial. Available from:
http://app.uspnf.com/uspnf/
16. Weinbuch D, Zölls S, Wiggenhorn M, Friess W, Winter G, Jiskoot W, Hawe A 2013.
Micro–flow imaging and resonant mass measurement (archimedes) – complementary
methods to quantitatively differentiate protein particles and silicone oil droplets. Journal of
Pharmaceutical Sciences 102(7):2152-2165.

229
17. Sarangapani PS, Weaver J, Parupudi A, Besong TMD, Adams GG, Harding SE,
Manikwar P, Castellanos MM, Bishop SM, Pathak JA 2016. Both Reversible Self-
Association and Structural Changes Underpin Molecular Viscoelasticity of mAb Solutions.
Journal of Pharmaceutical Sciences 105(12):3496-3506.
18. Zolls S, Tantipolphan R, Wiggenhorn M, Winter G, Jiskoot W, Friess W, Hawe A
2012. Particles in therapeutic protein formulations, Part 1: Overview of analytical methods.
Journal of Pharmaceutical Sciences 101(3):914-935.
19. Amin S, Barnett GV, Pathak JA, Roberts CJ, Sarangapani PS 2014. Protein
aggregation, particle formation, characterization & rheology. Current Opinion in Colloid
& Interface Science 19(5):438-449.
20. Patel AR, Lau D, Liu J 2012. Quantification and Characterization of Micrometer and
Submicrometer Subvisible Particles in Protein Therapeutics by Use of a Suspended
Microchannel Resonator. Analytical Chemistry 84(15):6833-6840.
21. Funke S, Matilainen J, Nalenz H, Bechtold-Peters K, Mahler H-C, Friess W 2016.
Silicone Migration From Baked-on Silicone Layers. Particle Characterization in Placebo and
Protein Solutions. Journal of Pharmaceutical Sciences 105(12):3520-3531.
22. Shire SJ, Shahrokh Z, Liu J 2004. Challenges in the development of high protein
concentration formulations. Journal of Pharmaceutical Sciences 93(6):1390-1402.
23. Shah M, Rattray Z, Day K, Uddin S, Curtis R, van der Walle CF, Pluen A 2017.
Evaluation of aggregate and silicone-oil counts in pre-filled siliconized syringes: An
orthogonal study characterising the entire subvisible size range. International Journal of
Pharmaceutics 519(1):58-66.
24. Stability Testing of New Drug Substances and Products (revision 2) [Internet].
International Council for Harmonisation. Available from:
http://www.ich.org/products/guidelines/quality/quality-single/article/stability-testing-of-new-
drug-substances-and-products.html
25. Chakroun N, Hilton D, Ahmad SS, Platt GW, Dalby PA 2016. Mapping the
Aggregation Kinetics of a Therapeutic Antibody Fragment. Molecular Pharmaceutics
13(2):307-319.
26. Wang W, Roberts CJ 2013. Non-Arrhenius Protein Aggregation. The American
Association of Pharmaceutical Scientists Journal 15(3):840-851.
27. Barnett GV, Drenski M, Razinkov V, Reed WF, Roberts CJ 2016. Identifying protein
aggregation mechanisms and quantifying aggregation rates from combined monomer
depletion and continuous scattering. Analytical Biochemistry 511(1):80-91.
28. Ghosh R, Calero-Rubio C, Saluja A, Roberts CJ 2016. Relating Protein–Protein
Interactions and Aggregation Rates From Low to High Concentrations. Journal of
Pharmaceutical Sciences 105(3):1086-1096.
29. Kim N, Remmele RL, Liu D, Razinkov VI, Fernandez EJ, Roberts CJ 2013.
Aggregation of anti-streptavidin immunoglobulin gamma‐1 involves Fab unfolding and
competing growth pathways mediated by pH and salt concentration. Biophysical Chemistry
172(1):26-36.
30. Arosio P, Rima S, Lattuada M, Morbidelli M 2012. Population Balance Modeling of
Antibodies Aggregation Kinetics. The Journal of Physical Chemistry B 116(24):7066-7075.
31. Austerberry JI, Dajani R, Panova S, Roberts D, Golovanov AP, Pluen A, van der
Walle CF, Uddin S, Warwicker J, Derrick JP, Curtis R 2017. The effect of charge mutations
on the stability and aggregation of a human single chain Fv fragment. European Journal of
Pharmaceutics and Biopharmaceutics 115(1):18-30.
32. Quinn MK, Gnan N, James S, Ninarello A, Sciortino F, Zaccarelli E, McManus JJ
2015. How fluorescent labelling alters the solution behaviour of proteins. Physical Chemistry
Chemical Physics 17(46):31177-31187.

230
33. McManus JJ, Charbonneau P, Zaccarelli E, Asherie N 2016. The physics of protein
self-assembly. Current Opinion in Colloid & Interface Science 22(1):73-79.
34. James S, Quinn MK, McManus JJ 2015. The self assembly of proteins; probing
patchy protein interactions. Physical Chemistry Chemical Physics 17(7):5413-5420.
35. Goldberg DS, Lewus RA, Esfandiary R, Farkas DC, Mody N, Day KJ, Mallik P,
Tracka MB, Sealey SK, Samra HS 2017. Utility of High Throughput Screening Techniques
to Predict Stability of Monoclonal Antibody Formulations During Early Stage Development.
Journal of Pharmaceutical Sciences 106(8):1971-1977.
36. Köpf E, Frieß W 2016. Proteinformulierung: Vom Molekül zum Medikament Protein
pharmaceuticals: challenges and approaches. Pharmakon 4(2):125-133.
37. Schiefelbein L, Keller M, Weissmann F, Luber M, Bracher F, Frieß W 2010.
Synthesis, characterization and assessment of suitability of trehalose fatty acid esters as
alternatives for polysorbates in protein formulation. European Journal of Pharmaceutics and
Biopharmaceutics 76(3):342-350.
38. Li Z, Li R, Smith C, Pan F, Campana M, Webster JRP, van der Walle CF, Uddin S,
Bishop SM, Narwal R, Warwicker J, Lu JR 2017. Neutron Reflection Study of Surface
Adsorption of Fc, Fab, and the Whole mAb. ACS Applied Materials & Interfaces
9(27):23202-23211.
39. Soula STB 2015. Stable pharmaceutical composition, comprising an aqueous solution
of an antibody-derived therapeutically active protein (US 20150216977 A1). Adocia.
40. Kheddo P, Cliff MJ, Uddin S, van der Walle CF, Golovanov AP 2016. Characterizing
monoclonal antibody formulations in arginine glutamate solutions using (1)H NMR
spectroscopy. mAbs 8(7):1245-1258.
41. Kheddo P, Golovanov AP, Mellody KT, Uddin S, van der Walle CF, Dearman RJ
2016. The effects of arginine glutamate, a promising excipient for protein formulation, on cell
viability: Comparisons with NaCl. Toxicology in Vitro 33(1):88-98.
42. Du W, Klibanov AM 2011. Hydrophobic salts markedly diminish viscosity of
concentrated protein solutions. Biotechnology and Bioengineering 108(3):632-636.
43. Guidline on the requirements to the chemical and pharmaceutical quality
documentation concerning investigational medicinal products in clinical trials [Internet].
European Medicines Agency Inspections. Available from:
https://ec.europa.eu/health/sites/health/files/files/eudralex/vol-10/18540104en_en.pdf