quantitative analysis of consistency in nosql key...
TRANSCRIPT

Quantitative Analysis of Consistency in NoSQL Key-value Stores
Si Liu, Son Nguyen, Jatin Ganhotra, Muntasir Raihan RahmanIndranil Gupta, and José Meseguer
February 2016

NoSQL Systems
• Growing quickly
– $3.4B industry by 2018
• Apache Cassandra
• Among top 10 most popular database engines in
February 2016
• Top 1 among all Key-value/NoSQL stores (by DB-
Engines Ranking)
• Large scale Internet service companies rely heavily on
Cassandra
- e.g., IBM, eBay, Netflix, Facebook, Instagram, GitHub 2

Predicting Cassandra
Performance...• …Is Hard. Today’s options:
– Deploy on Real Cluster• Many man-hours
• Non-repeatable experiments
– Prove theorems on paper• Very hard to do for performance properties
– Simulations• Large and unwieldy
• Take time to run
• Hard to change (original Cassandra is 345K lines of code)
3
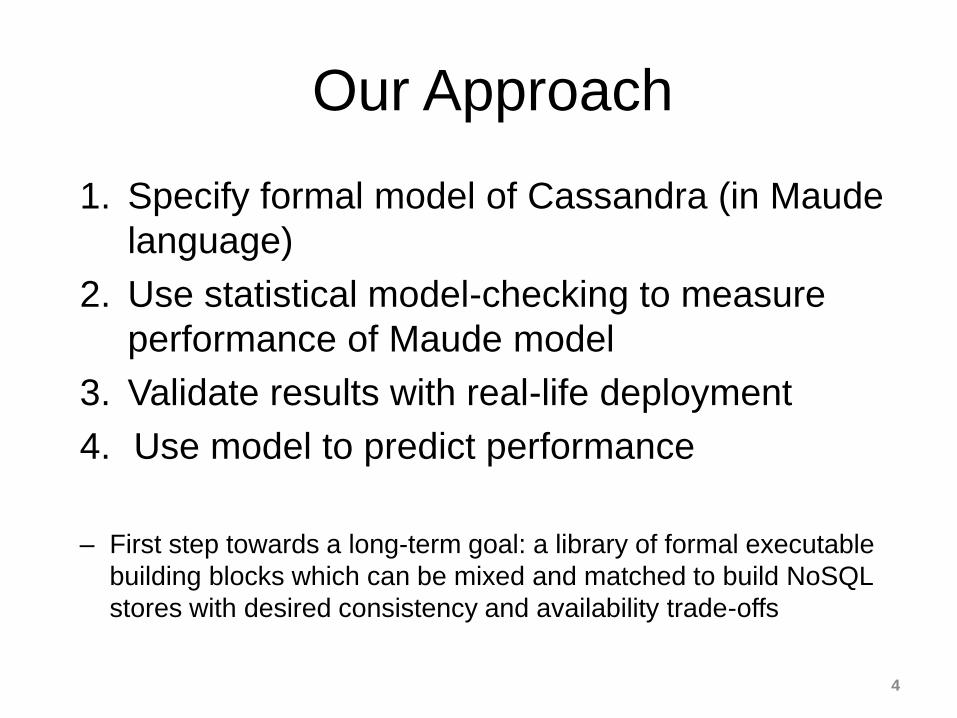
Our Approach
1. Specify formal model of Cassandra (in Maude
language)
2. Use statistical model-checking to measure
performance of Maude model
3. Validate results with real-life deployment
4. Use model to predict performance
– First step towards a long-term goal: a library of formal executable
building blocks which can be mixed and matched to build NoSQL
stores with desired consistency and availability trade-offs
4

How we go about it
We use:
1. Maude
- Modeling framework for distributed systems
- Supports rewriting logic specification and programming
- Efficiently executable
2. PVeStA
- Statistical model checking tool
- Runs Monte-Carlo simulations of model
- Verifies a property up to a user-specified level of confidence

• Cassandra is deployed in data centers
• Each key-value pair replicated at multiple servers
• Clients can read/write key-value pairs
• Read/write goes from client to Coordinator, which
forwards to replica(s)
• Client can specify how many replicas
need to answer
• Consistency Level
• E.g., One, Quorum, All
Apache Cassandra Overview
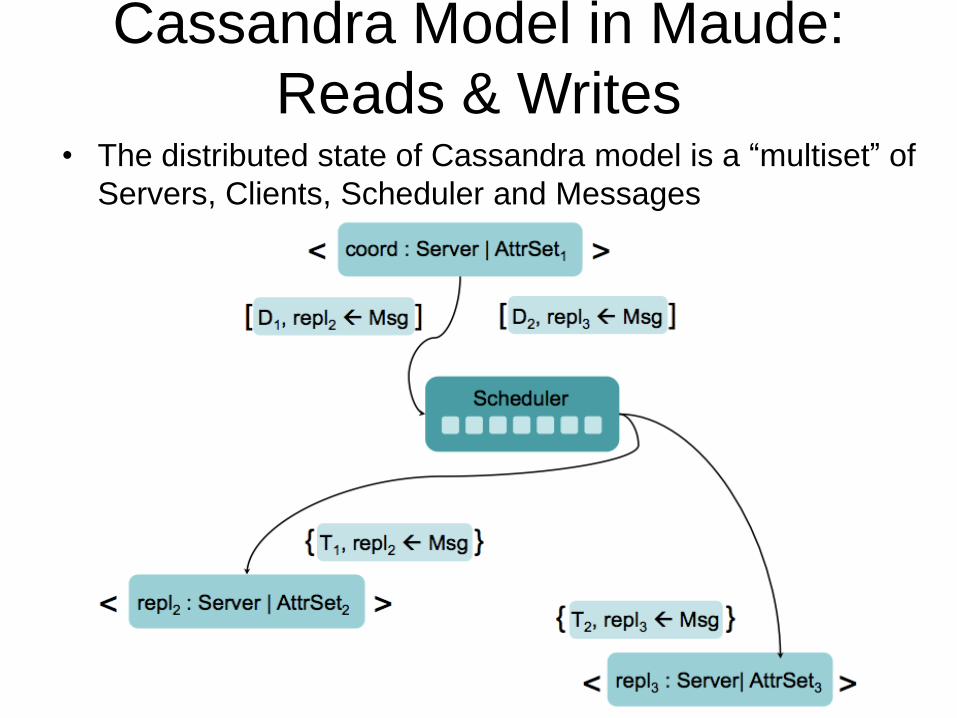
• The distributed state of Cassandra model is a “multiset” of
Servers, Clients, Scheduler and Messages
Cassandra Model in Maude:
Reads & Writes
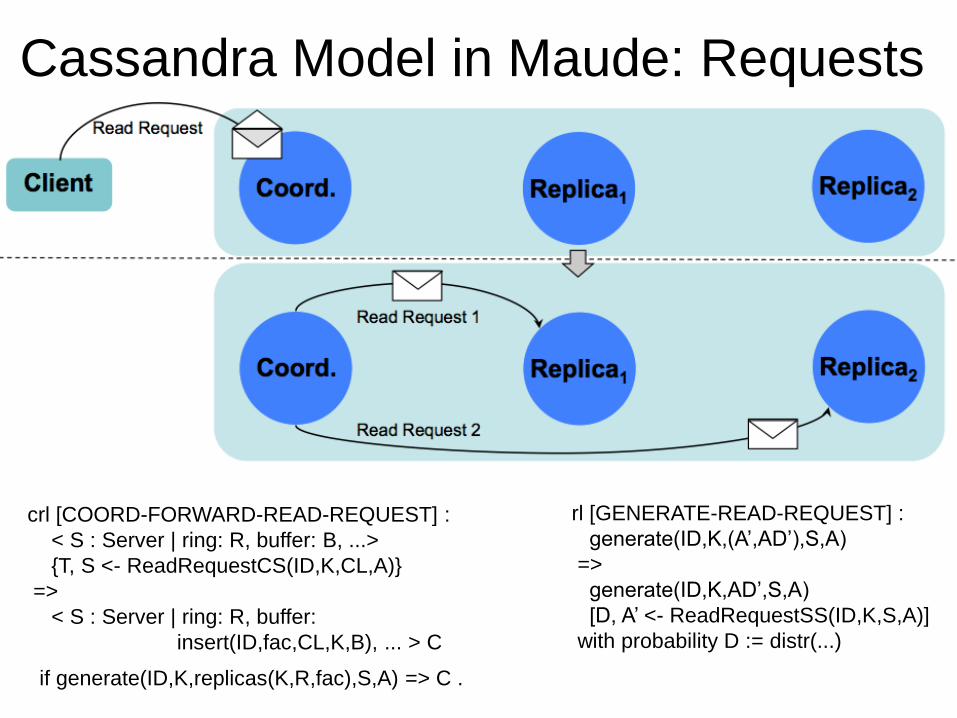
Cassandra Model in Maude: Requests
crl [COORD-FORWARD-READ-REQUEST] :
< S : Server | ring: R, buffer: B, ...>
{T, S <- ReadRequestCS(ID,K,CL,A)}
=>
< S : Server | ring: R, buffer:
insert(ID,fac,CL,K,B), ... > C
if generate(ID,K,replicas(K,R,fac),S,A) => C .
rl [GENERATE-READ-REQUEST] :
generate(ID,K,(A’,AD’),S,A)
=>
generate(ID,K,AD’,S,A)
[D, A’ <- ReadRequestSS(ID,K,S,A)]
with probability D := distr(...)

Validating Performance
• We measure Cassandra and an alternative
Cassandra-like design’s satisfaction of various
consistency models
• strong consistency (SC), read your writes (RYW),
monotonic reads (MR), consistent prefix (CP), causal
consistency (CC)
• We answer two questions:
1. How well does our Cassandra/alternative design’s model
satisfy those consistency models?
2. How well do these results match reality (i.e.,
experimental evaluations from a real Cassandra
deployment on a real cluster)?
9
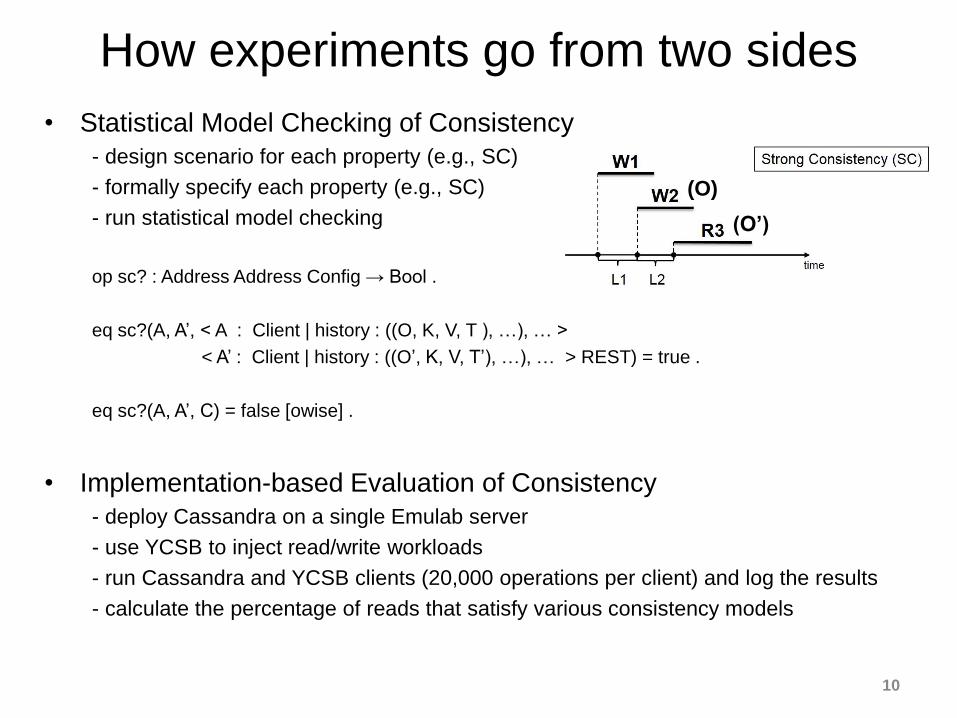
How experiments go from two sides
• Statistical Model Checking of Consistency
- design scenario for each property (e.g., SC)
- formally specify each property (e.g., SC)
- run statistical model checking
op sc? : Address Address Config → Bool .
eq sc?(A, A’, < A : Client | history : ((O, K, V, T ), …), … >
< A’ : Client | history : ((O’, K, V, T’), …), … > REST) = true .
eq sc?(A, A’, C) = false [owise] .
• Implementation-based Evaluation of Consistency
- deploy Cassandra on a single Emulab server
- use YCSB to inject read/write workloads
- run Cassandra and YCSB clients (20,000 operations per client) and log the results
- calculate the percentage of reads that satisfy various consistency models
10
(O)
(O’)
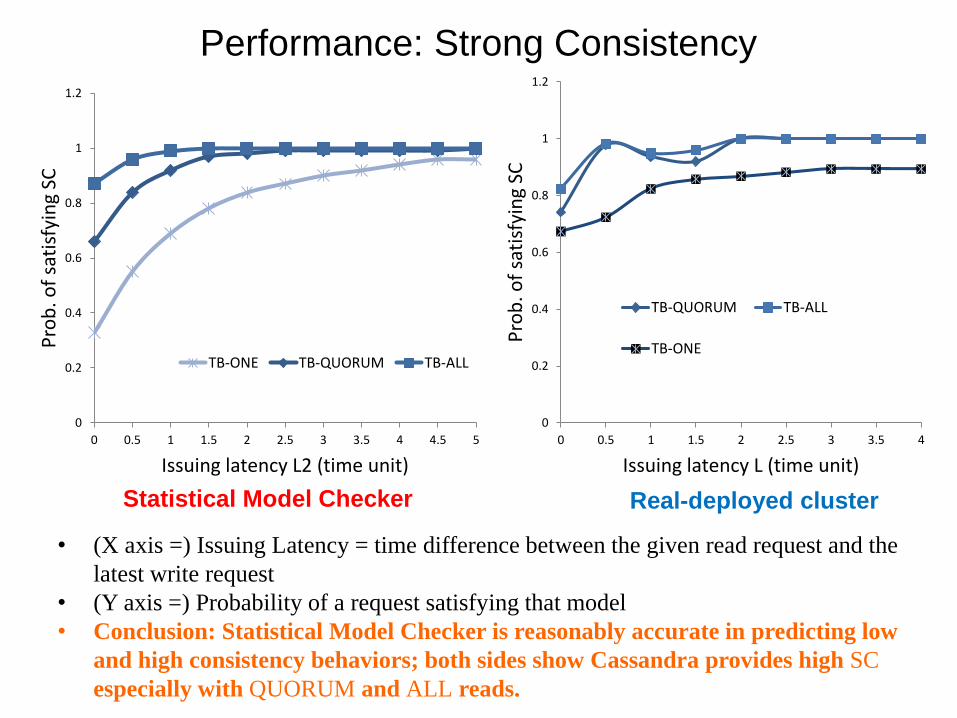
Performance: Strong Consistency
• (X axis =) Issuing Latency = time difference between the given read request and the
latest write request
• (Y axis =) Probability of a request satisfying that model
• Conclusion: Statistical Model Checker is reasonably accurate in predicting low
and high consistency behaviors; both sides show Cassandra provides high SC
especially with QUORUM and ALL reads.
0
0.2
0.4
0.6
0.8
1
1.2
0 0.5 1 1.5 2 2.5 3 3.5 4
Pro
b. o
f sa
tisf
yin
g SC
Issuing latency L (time unit)
TB-QUORUM TB-ALL
TB-ONE
Real-deployed cluster
0
0.2
0.4
0.6
0.8
1
1.2
0 0.5 1 1.5 2 2.5 3 3.5 4 4.5 5
Pro
b. o
f sa
tisf
yin
g SC
Issuing latency L2 (time unit)
TB-ONE TB-QUORUM TB-ALL
Statistical Model Checker
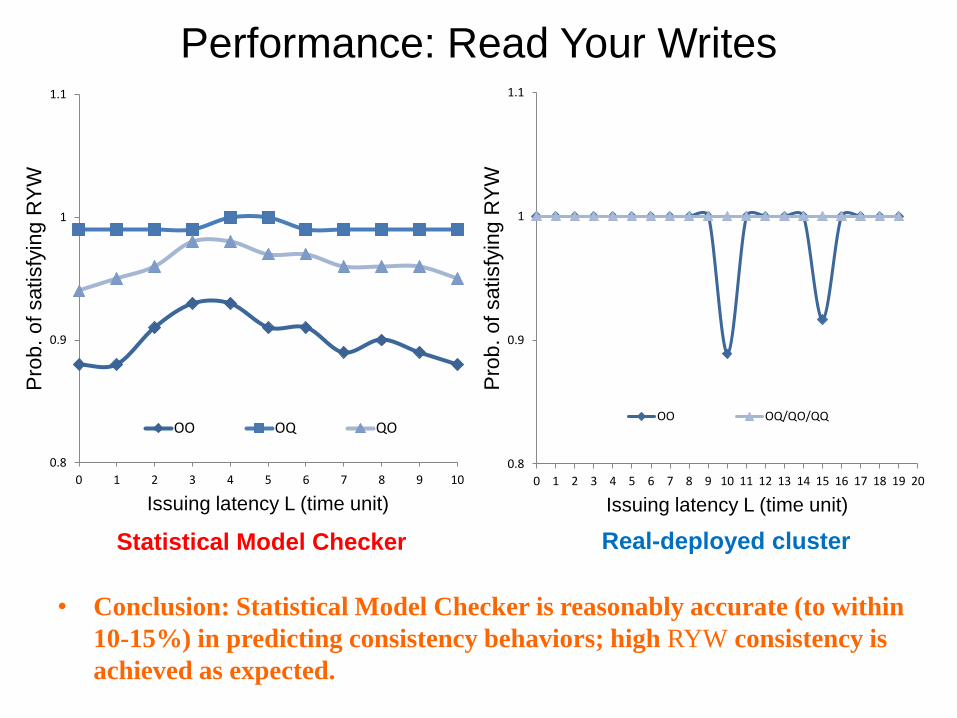
Performance: Read Your Writes
0.8
0.9
1
1.1
0 1 2 3 4 5 6 7 8 9 10 11 12 13 14 15 16 17 18 19 20P
rob.
of satisfy
ing R
YW
Issuing latency L (time unit)
OO OQ/QO/QQ
Real-deployed cluster
• Conclusion: Statistical Model Checker is reasonably accurate (to within
10-15%) in predicting consistency behaviors; high RYW consistency is
achieved as expected.
0.8
0.9
1
1.1
0 1 2 3 4 5 6 7 8 9 10
Pro
b.
of satisfy
ing R
YW
Issuing latency L (time unit)
OO OQ QO
Statistical Model Checker
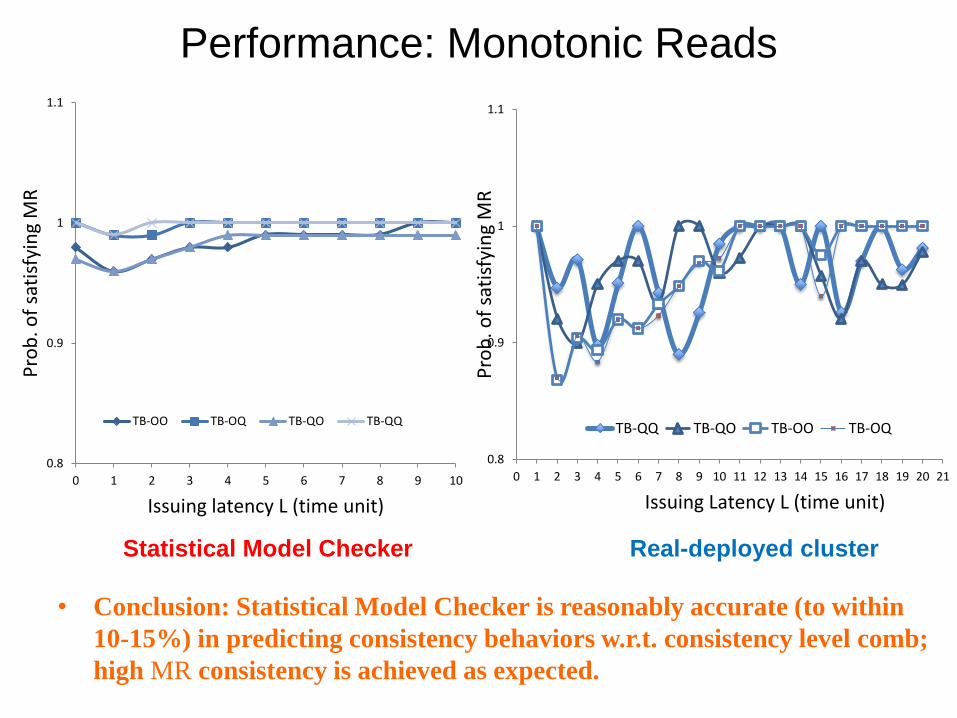
Performance: Monotonic Reads
• Conclusion: Statistical Model Checker is reasonably accurate (to within
10-15%) in predicting consistency behaviors w.r.t. consistency level comb;
high MR consistency is achieved as expected.
0.8
0.9
1
1.1
0 1 2 3 4 5 6 7 8 9 10
Pro
b. o
f sa
tisf
yin
g M
R
Issuing latency L (time unit)
TB-OO TB-OQ TB-QO TB-QQ
0.8
0.9
1
1.1
0 1 2 3 4 5 6 7 8 9 10 11 12 13 14 15 16 17 18 19 20 21P
rob
. of
sati
sfyi
ng
MR
Issuing Latency L (time unit)
TB-QQ TB-QO TB-OO TB-OQ
Statistical Model Checker Real-deployed cluster

Performance: Causality
• Conclusion: Statistical Model Checker is reasonably accurate (to within
10-15%) in predicting consistency behaviors w.r.t. consistency level comb;
high CC is achieved as expected.
Statistical Model Checker Real-deployed cluster
0.8
0.9
1
1.1
0 2 4 6 8 10 12 14
Pro
b. o
f sa
tisf
yin
g C
C
Issuing latency L (time unit)
TB-OO TB-OQ TB-OA TB-QO
0.8
0.9
1
1.1
1 2 3 4 5 6
Pro
b. o
f sa
tisf
yin
g C
CIssuing Latency L (time unit)
TB-OO TB-OQ TB-OA TB-QO
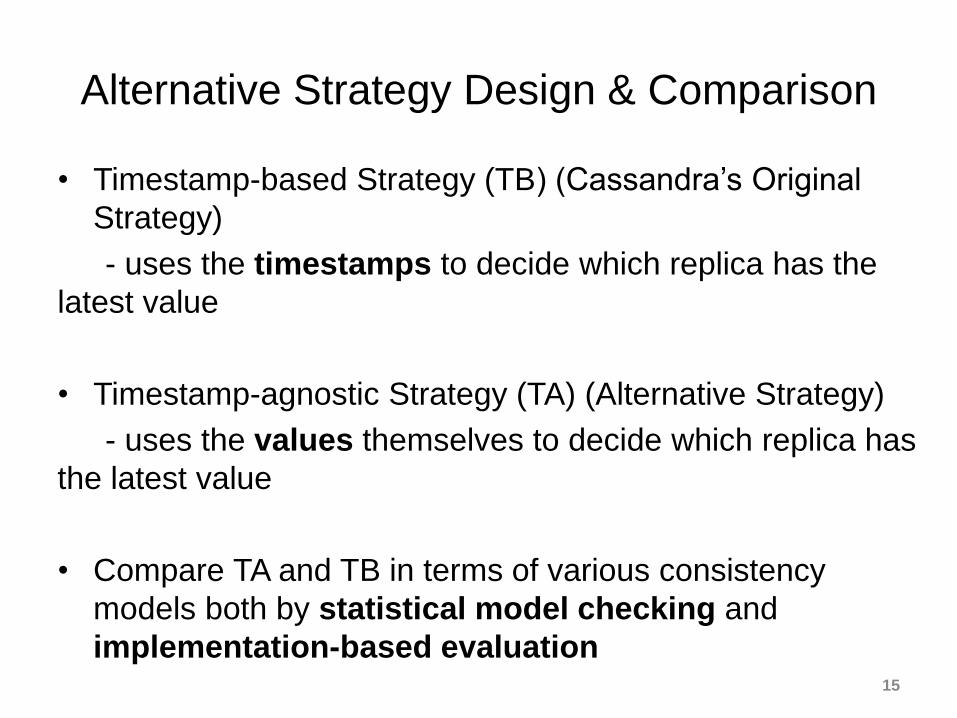
Alternative Strategy Design & Comparison
• Timestamp-based Strategy (TB) (Cassandra’s Original
Strategy)
- uses the timestamps to decide which replica has the
latest value
• Timestamp-agnostic Strategy (TA) (Alternative Strategy)
- uses the values themselves to decide which replica has
the latest value
• Compare TA and TB in terms of various consistency
models both by statistical model checking and
implementation-based evaluation15

0
0.2
0.4
0.6
0.8
1
1.2
0 0.5 1 1.5 2 2.5 3 3.5 4
Pro
b. o
f sa
tisf
yin
g SC
Issuing latency L (time unit)
TB-QUORUM TB-ALL
TA-QUORUM TA-ALL
TB-ONE TA-ONE
0
0.2
0.4
0.6
0.8
1
1.2
0 0.5 1 1.5 2 2.5 3 3.5 4 4.5 5
Pro
b. o
f sa
tisf
yin
g SC
Issuing latency L2 (time unit)
TB-ONE TB-QUORUM
TB-ALL TA-ONE
TA-QUORUM TA-ALL
Comparison: Strong Consistency
Statistical Model Checker Real-deployed cluster
• Conclusion: Both TA and TB provide high SC, especially with QUORUM
and ALL reads.

0.8
0.9
1
1.1
0 1 2 3 4 5 6 7 8 9 10
Pro
b. o
f sa
tisf
yin
g R
YW
Issuing latency L (time unit)
TB-OO TB-OQ TB-OATA-OO TA-OQ TA-OA
Comparison: Read Your Writes
Statistical Model Checker Real-deployed cluster
0.8
0.9
1
1.1
0 1 2 3 4 5 6 7 8 9 10 11 12 13 14 15 16 17 18 19 20
Pro
b. o
f sa
tisf
yin
g R
YW
Issuing latency L (time unit)
TB-OO TA-OO TA/TB-OQ/QO/QQ
• Conclusion: Both TA and TB offer high RYW consistency as expected; TA
provides slightly lower consistency for some points, even though TA’s
overall performance is close to TB’s.

0.5
0.6
0.7
0.8
0.9
1
1.1
0 5 10 15 20 25
Pro
b. o
f sa
tisf
yin
g C
P
Issuing latency L (time unit)
ONE Writes
TB-OO TB-OQ
TB-OA TA-OO
TA-OQ TA-OA
Comparison: Consistent Prefix
Statistical Model Checker Real-deployed cluster
0.5
0.6
0.7
0.8
0.9
1
1.1
1 2 3 4 5 6
Pro
b. o
f sa
tisf
yin
g C
PIssuing Latency L (time unit)
ONE Writes
TA-OA TA-OQ
TB-OA TB-OQ
• Conclusion: TB gains more CP consistency only before some issuing
latency for ALL reads.

0.8
0.9
1
1.1
0 2 4 6 8 10 12 14
Pro
b. o
f sa
tisf
yin
g C
C
Issuing latency L (time unit)
TB-OO TB-OQ TB-QO
TA-OO TA-OQ TA-QO
Comparison: Causality
• Conclusion: Both TA and TB achieve high CC consistency as expected;
regarding OQ, TA’s performance resembles TB’s and both surpass each
other slightly for some points.
Statistical Model Checker Real-deployed cluster
0.8
0.9
1
1.1
1 2 3 4 5 6
Pro
b. o
f sa
tisf
yin
g C
CIssuing Latency L (time unit)
TB-OO TB-OQ TB-QO
TA-OO TA-OQ TA-QO

Comparison & Conclusion
• The resulting trends from both sides are similar, leading
to the same conclusions with respect to consistency
measurements and strategy comparisons
• Our Cassandra model achieves much higher
consistency (up to SC) than the promised EC, with
QUORUM reads sufficient to provide up to 100%
consistency in almost all scenarios
• TA is not a competitive design alternative to TB in terms
of those consistency models except CP, even though TA
behaves close to TB in most cases
- TA surpasses TB with ALL reads during a certain interval of
issuing latency
20
Summary
• First formal and executable model of Cassandra
• Captures all major design decisions
• Predicting Consistency behavior by using Statistical
Model-Checking
• Statistical Model-checking matches reality
(deployment numbers)
• Our work best to predict Cassandra Performance
• Faster than simulations
• Less work than full deployment
• Repeatable
21
Ongoing and Future Work
• Other performance metrics- throughput, latency
• Model other NoSQL or transactional systems- RAMP already modeled & analyzed (SAC 16’)
• Build a library of building blocks- Mix and match to generate any NoSQL or transactional
system with desired consistency and availability trade-offs
22