quantifying the relationship between entrepreneurship and...
TRANSCRIPT

Quantifying the relationship between entrepreneurshipand competitiveness development stagesin Latin America
José Ernesto Amorós & Cristóbal Fernández &
Juan Tapia
# The Author(s) 2011. This article is published with open access at Springerlink.com
Abstract This research aims to quantify the importance of a country’s entrepreneurshiplevel in terms of its competitiveness rates. Our hypothesis is that those countriesentrepreneurship growth rates increase their competitiveness indicators and that thisentrepreneurial improvement could be a key factor in reaching the next stage ofdevelopment. We establish this relationship using a longitudinal database of LatinAmerican countries that participated in the Global Entrepreneurship Monitor (GEM)and the Global Competitiveness Reports of the World Economic Forum (WEF) from2001 to 2006. GEM and WEF construct aggregated indexes using several variables torate each country’s entrepreneurship activity and competitiveness development. We usea discriminant analysis to identify various countries’ competitiveness subgroups andshow how each country’s entrepreneurship rates have weight in different stages ofcompetitiveness, placing a special emphasis on Latin America. Our results suggest thatLatin American countries need to gain entrepreneurial dynamics and economic (andcompetitiveness) development by transforming their typical self-employment or lowvalue-added new ventures for local markets into strong, innovative networked firmscompeting globally. Some management and policy implications are also discussed.
Keywords Competitiveness . Economic growth . Global EntrepreneurshipMonitor .
Latin America . Discriminant analysis
Int Entrep Manag JDOI 10.1007/s11365-010-0165-9
J. E. Amorós (*)School of Business and Economics, Universidad del Desarrollo, Av. La Plaza 700. Las Condes,7610658 Santiago, Chilee-mail: [email protected]
J. E. AmorósESADE Business School, Barcelona, Spain
C. Fernández : J. TapiaIndustrial Department, Universidad Técnica Federico Santa María, Av. España 1680, Valparaíso, Chile
J. TapiaDepartment of Economics, University of California Davis, One shields Avenue, Davis, CA 95616, USA

Introduction
Entrepreneurship is a very important activity for a country’s competitiveness and growthand a significant source of social mobility. New ventures have become an importantaspect of countries’ economic development, especially in terms of their contributions tonew job creation (Birch 1979, 1987). However, going beyond the relevant function ofentrepreneurship in job generation, there is an important debate about the real impactthat entrepreneurship has on countries’ economic and competitiveness development(Acs and Storey 2004; van Stel et al. 2005; Acs and Amorós 2008). Ever sinceSchumpeter’s (1934) seminal work on the role of entrepreneurs in identifyingopportunities to create value by introducing innovation in the market, a considerablepart of the literature suggests that entrepreneurship contributes to economicperformance by introducing innovation, bringing about market changes, enhancingrivalry, and creating competition (Wong et al. 2005, p. 337).
Based on this discussion, it is evident that different countries or regions havevarying relationships between their degree of entrepreneurial dynamics and theircompetitiveness stages. The influence of entrepreneurial dynamics1 on countries’competitive development (and consequently on their economic growth) presents acomplex relationship (Spencer and Gómez 2006). For many emerging economies,such as that in Latin America, spurring economic growth through new businesscreation can be problematic at times (Fritsch and Mueller 2004). Over the last20 years, many Latin American countries have experienced high economic growthrates. Natural resource exporting and certain low value-added products led toeconomic expansion in these countries until the mid-1990s; however, over the lastfew years, economic growth rates have slowed down considerably (Echecopar 2004;IADB 2006; IADB 2008). Porter (1990), who developed a position that differs fromthe principle of maximization for the use of natural resources, affirms that “Thetheory of the comparative advantage in factors is also frustrating for the companiesbecause its assumptions bear scarcely any resemblance to real competition. A theorywhich overlooks the role of the companies’ strategy, such as improving technologyor differentiating products, leaves very little ways out for companies, except fromtrying to influence the policy of the government” (p. 35). On the other hand, whenanalyzing the factors related to technological innovation that determine the successof firms in underdeveloped or developing countries, Vignolo and Wechsler (1992)say that “In any serious consideration of the factors of competitiveness and thepower of the countries in the international arena, it is necessary to bear in mind thatnowadays having or not having natural resources appears as a completely irrelevantfactor. To this must be added the fact that having natural resources with comparativeadvantages has become, for many underdeveloped countries, a real curse, againstwhat common sense leads us to expect” (p. 2) This translates into an emerginginterest on how Latin American countries could develop more new ventures toproduce value-added products or services. With this rationale, entrepreneurship and
1 It is possible to distinguish between the static and dynamic perspectives of entrepreneurship. The staticperspective refers to the number of business owners as a dimension of the industrial structure of theeconomy. The dynamic perspective refers to the gross changes in the entrepreneurship rate (Wennekers etal. 2005, p. 295).
Int Entrep Manag J
innovation processes are key factors to increase economic dynamism (Minniti et al.2006). Nevertheless, empirical studies regarding the impact of entrepreneurialactivity on countries’ competitive development are limited (van Stel et al. 2005),especially in developing countries (West et al. 2008).
As such, the objective of this research is to quantify the relationship betweenentrepreneurship and competitiveness development stages in a sample of LatinAmerican countries. We define each country’s entrepreneurship rates using a constructcalled the entrepreneurship factor. Our main hypothesis is that countries that evidencegrowth in entrepreneurship rates increase their competitiveness indicators, which islikely to be a key factor in reaching the next stage of development. In other words,countries that have a positive entrepreneurship factor have positive degree ofcompetitiveness. We establish this relationship applying a discriminant analysis modelto data from a longitudinal database of Latin American countries that participated inthe Global Entrepreneurship Monitor (GEM) and the Global Competitiveness Reportsof the World Economic Forum (WEF) from 2001 to 2006.
The rest of the paper is structured as follows: In Section 2, we discuss theliterature related to Latin American competitiveness and entrepreneurship, and westate our hypothesis. In Section 3, we set forth the methodology and describe thevariables under study. Section 4 presents the results followed by a discussion andconclusions in Section 5.
A general framework of entrepreneurship and competitiveness: the LatinAmerican perspective
Entrepreneurship and competiveness at the country level
Competiveness at the country level is a wide topic that has been growing since theinception of Porter’s (1990) arguments about the relevance of nations’ competitiveadvantage. Some of the most well known examples of research on internationalcomparisons of national competitiveness have been conducted for the WorldEconomic Forum’s Global Competitiveness Report and for IMD’s World Compe-titiveness Yearbook. Following the World Economic Forum’s framework, Porter etal. (2002) defined competitiveness according to a country’s economic development,which was separated into three specific stages: the factor-driven stage, the efficiency-driven stage, and the innovation-driven stage. In addition, Porter et al. (2002)developed two transitions between these stages. The third stage of economicdevelopment defined by Porter has some similarities to the arguments presented byAudretsch and Thurik (2001, 2004) which suggest that “entrepreneurial economies”are linked closely to countries in the innovation-oriented stages, while countries with“managed economies” that are more closely linked to the efficiency-oriented stage.
Some studies arguing that during the last two decades, the development of newtechnologies and consequently the emergence of new business models have shiftedfrom large corporations to small and new ventures (Audretsch and Thurik 2001;Thurow 2003; Wennekers et al. 2005). Domestic rivalry in the markets in which thefirms compete generates pressure on the companies to improve and innovate. Rivalcompanies show their animosity to each other by reducing costs and improving
Int Entrep Manag J

quality and services so as to create new and better products and processes. In thiscontext, entrepreneurial dynamics are relevant because rivalry will also depend onsetting up new firms to create new competitors. This “entrepreneurship process”could be vital for competitive advantage because it nurtures the innovation processin an industrial sector. The new entrepreneurial businesses may serve new segmentsor try new methods that their rivals who have been on the scene longer failed toidentify or respond to for lack of flexibility. These entrepreneurial firms help nations’innovation systems, allowing them to adapt to the changing conditions of globalcompetitiveness and provides them with the capacity to establish differences in orderto increase the value acknowledged by their markets. Innovative and entrepreneurialvalue-added products and services have direct and indirect effects on competitiveadvantages instead comparative advantages based on raw materials or labour force.
For example, in Latin America some countries that export more complex productsenjoy more prosperity than those that only export commodities or those that arebased on comparative advantages alone. For these reasons, countries’ competitive-ness (not only in Latin America but elsewhere as well) has an important relationshipwith several indicators at the microeconomics and business firm level. As Porter(2002) elaborates, they are “microeconomic foundations of the economy, rooted inthe company operating practices and strategies as well as in the quality of the inputs,infrastructure, institutions, and array of regulatory and other policies that constitutethe business environment in which a nations’ firms compete” (p. 1). These micro-level indicators include entrepreneurship activities. The level of a country’sdevelopment (competitiveness and economic) encourages and strengthens entrepre-neurial activity (Acs et al. 2005), but at the same time, entrepreneurship contributesto these developments. Recently, the Global Entrepreneurship Monitor (GEM)project based on the Global Competitiveness Report pointed out that certainframework conditions relate more fully to innovation-driven economies that arespecific to innovation and new venture creation (Bosma and Levie 2010). In thissense, entrepreneurship is the mechanism that turns innovation into economic output(Acs and Armington 2006; Bosma and Levie 2010).
Despite the fact that entrepreneurial efforts could improve competitiveness andeconomic growth—namely, they could help countries transition from “managedeconomies” to “entrepreneurial economies”—there is evidence that shows thatentrepreneurship dynamics differ not only among countries with different develop-ment stages (Carree et al. 2002; van Stel et al. 2005; Carree et al. 2007) but alsoamong regions in a single country (Audretsch and Keilbach 2004; Lee et al. 2004;Belso-Martínez 2005). Empirical studies based on information gathered fromdifferent countries in different time periods2 reveal various types of relationships
2 Some works, like Tang and Koveos (2004), van Stel et al. (2005), Wennekers et al. (2005), Acs andAmorós (2008), and Amorós and Cristi (2008), have shown a different relationship betweenentrepreneurship rates and different economic and competitive performance variables. Furthermore,Carree et al. (2002) showed a U-shaped relationship between the level of per capita income and the rate ofself-employment (or business ownership) in 23 OECD countries and revisited their research founding anL-shape for the entrepreneurship equilibrium rate (Carree et al. 2007). Wennekers et al. (2005) alsoshowed three U-shaped links between entrepreneurship rates and the level of economic development,measured in terms of income per capita, innovation capacity, and diverse associated socio-demographicvariables.
Int Entrep Manag J

between the variables that measure the level of entrepreneurship, economic growth,and competitiveness (Wennekers et al. 2010). These differences depend on specificconditions at the national or regional level, which, in turn, are related to manyaspects that include socio-cultural, institutional, and economics factors (Valliere andPeterson 2009). Regarding the three stages of economic development, the GEMProject remarks:
It is important to recognize that the three principal types of economic activity:factor-driven, efficiency-driven, and innovation-driven, are present in allnational economies. But their relative prevalence—and their contribution toeconomic development—varies. The Global Competitiveness Report proposi-tion is that each phase of economic development has different optimalcombination of these activities. The three phases are labelled according to theactivity that is most significant for that phase. Thus the relative importance ofentrepreneurial framework conditions to a country’s advancement in economicdevelopment may vary by phase of economic development. (Bosma and Levie2010, p. 11)
To summarise these ideas, entrepreneurship varies across countries and dependsnot only on economic growth but also on other factors, such as institutionalcharacteristics, socio-demographic factors, etc., that are correlated in very complexsystems. However, most researchers agree that entrepreneurship activities matter foreconomic development (Bosma and Levie 2010), even though these activities havedifferent scopes or respond to different conditions depending the degree or level ofthe country’s competitiveness.
The “entrepreneurial reality” and “entrepreneurial paradox” in Latin America
There is a consensus that Latin America is a region with great economic potential.With a population about 569 million people and an aggregate gross domestic productof about $6.6 billion3 U.S. Dollars (2009, PPP), the region also is home of two of thelargest economies in the world: Brazil and Mexico. Many Latin American countrieshave been reformed in the last 20 years, including privatizations, increases in the roleof private enterprises in fostering economic growth, and high-powered incentives forefficient enterprises (Aulakh et al. 2000). Additionally, the region has made realefforts in the area of democracy, property rights, and macroeconomic stability.Without prejudice to the above facts, in comparative terms, some emergenteconomies, such as Israel, Korea, Singapore, and Ireland, have experienced aremarkable transformation in the last 20 years both in terms of economic growth andinstitutional development. At the same time, Latin America has shown much lowerlevels of development. Some causes of this relatively poor performance are that theregion still lags in the “softer” areas of education, knowledge creation, and economicreform. Therefore, the region has been less successful in improving economicperformance compared to other emerging markets (Blejer 2006; López-Claros et al.2006) and has had more difficulties developing other “softer” activities, likeentrepreneurship and new business creation (Acs and Amorós 2008).
3 Millions of millions
Int Entrep Manag J

The entrepreneurship phenomenon in Latin America has become a rapidlyexpanding field (Kantis et al. 2002; Kantis 2004; Amorós and Cristi 2008). Tiffin(2004) demonstrates the increasing interest and numerous implications of entrepre-neurship topics in almost all of the countries in the region. In addition, LatinAmerican policymakers are increasingly emphasizing entrepreneurial activities,including new business creation and self-employment, because these activities havethe potential to significantly enhance social and economic development.4 Peres andStumpo (2002) show that new and small firms are not only secondary actors in theindustrial structure of the countries because new ventures can create jobs (or employindividuals in the case of self-employment), but they can also help “rejuvenate”regional economies (Capelleras et al. 2010).
Latin American countries have great potential to generate competitivenessand wellbeing through the creation of new firms; however, they have generallybeen unable to consolidate entrepreneurial dynamics (Kantis 2005). The GEMmethodology5 places Latin American participant countries as having highentrepreneurship rates. Compared with the average rates of efficiency-driveneconomies and also with those of innovation-driven nations, the average rates ofearly-stage entrepreneurship activity6 in Latin America are significantly high, asexhibited in Fig. 1. For example, some early-stage entrepreneurship activity ratesin Peru or Bolivia were around 25% 2005 to 2008. These quantitative indicatorsreflect the fact that many adults are directly involved in entrepreneurship activities.Nevertheless, the dynamism of new Latin American ventures is lower bycomparison to other emergent regions, such as Southeast Asia, because accordingGEM data (and other related studies), the region has high necessity-basedentrepreneurship rates (Kantis et al. 2004; Autio 2005, 2007; Minniti et al. 2006;Bosma and Levie 2010). In relative terms, necessity-motivated entrepreneurs takepart in a large share of the total entrepreneurial activity in Latin America. However,many of these “entrepreneurial activities” include self-employment, which cannotprovide value-added business opportunities or subsequent growth. Necessity-driven entrepreneurial businesses are not bad outcomes, as they could be a“reaction” (push motives) to certain national conditions. Necessity-drivenentrepreneurial businesses could be beneficial for many economies because inmany cases, despite the extremely small scale of the business, they can still be aproductive source of employment. As discussed previously, many factors, such asinstitutional environment, influence the entrepreneurships dynamics in LatinAmerica. These weak institutional environments have created informal, lifestyle,and survivalist entrepreneurs (de Soto 1989), but they could also be a barrier forthe subsequent growth of these new firms (Capelleras and Rabetino 2008).
4 In the 1990s, when the region achieved a moderate of growth, the labour market “left” the micro andsmall enterprises to moved to big established firms (about 90% of the total new jobs), but micro andsmalls firms also playing a safety-valve role when no other employment sources were available (Berry2002).5 For the methodological design and implementation of the GEM project, see Reynolds et al. (2005).6 In the methodology section, we detail how early-stage entrepreneurial activity is calculated in terms of apercentage of the adult population who are setting up a business or are owner-managers of a new businessthat has paid any form of salary or wages for fewer than 42 months.
Int Entrep Manag J
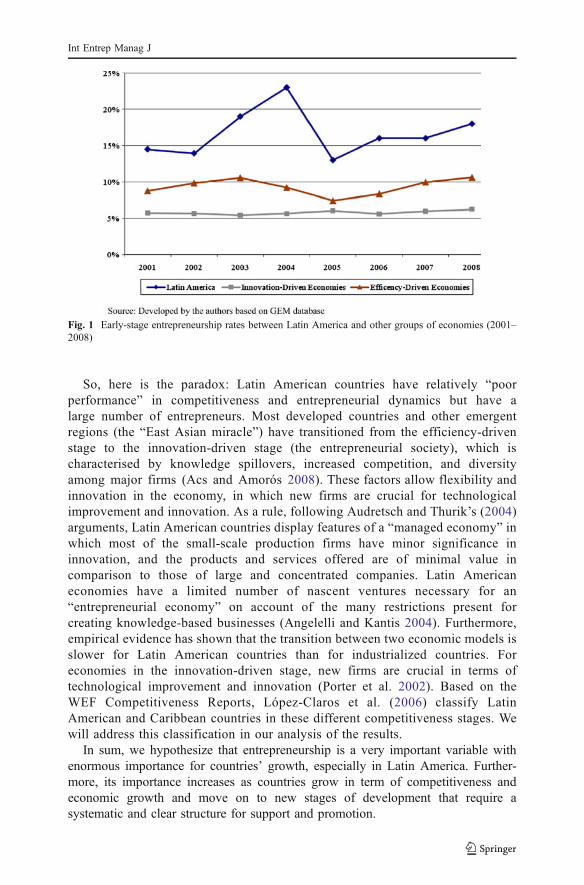
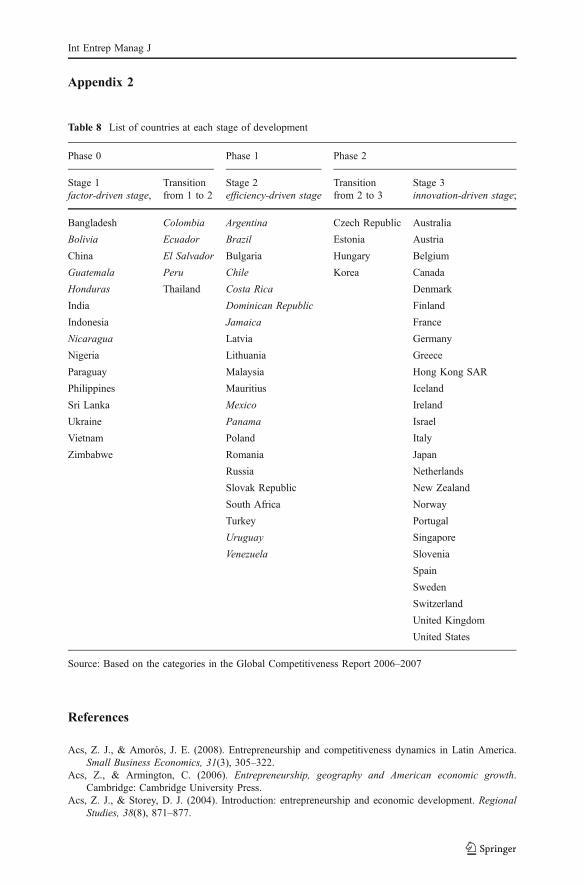
So, here is the paradox: Latin American countries have relatively “poorperformance” in competitiveness and entrepreneurial dynamics but have alarge number of entrepreneurs. Most developed countries and other emergentregions (the “East Asian miracle”) have transitioned from the efficiency-drivenstage to the innovation-driven stage (the entrepreneurial society), which ischaracterised by knowledge spillovers, increased competition, and diversityamong major firms (Acs and Amorós 2008). These factors allow flexibility andinnovation in the economy, in which new firms are crucial for technologicalimprovement and innovation. As a rule, following Audretsch and Thurik’s (2004)arguments, Latin American countries display features of a “managed economy” inwhich most of the small-scale production firms have minor significance ininnovation, and the products and services offered are of minimal value incomparison to those of large and concentrated companies. Latin Americaneconomies have a limited number of nascent ventures necessary for an“entrepreneurial economy” on account of the many restrictions present forcreating knowledge-based businesses (Angelelli and Kantis 2004). Furthermore,empirical evidence has shown that the transition between two economic models isslower for Latin American countries than for industrialized countries. Foreconomies in the innovation-driven stage, new firms are crucial in terms oftechnological improvement and innovation (Porter et al. 2002). Based on theWEF Competitiveness Reports, López-Claros et al. (2006) classify LatinAmerican and Caribbean countries in these different competitiveness stages. Wewill address this classification in our analysis of the results.
In sum, we hypothesize that entrepreneurship is a very important variable withenormous importance for countries’ growth, especially in Latin America. Further-more, its importance increases as countries grow in term of competitiveness andeconomic growth and move on to new stages of development that require asystematic and clear structure for support and promotion.
Fig. 1 Early-stage entrepreneurship rates between Latin America and other groups of economies (2001–2008)
Int Entrep Manag J
Methodology
Background information
Both “The World Competitiveness Yearbook” and “The Global CompetitivenessReport” (GCR) make indexes showing how different countries rank in terms ofcompetitiveness over time and classify these countries hierarchically in terms of aseries of variables representing both the micro- and macroeconomic influences eachcountry has in the world. Both reports present each country’s competitive situation interms of individual variables and combination of variables. For instance, GCRcalculates its index by a country’s weighted average across three major indicators:basic requirements (institutions, infrastructure, macroeconomics, health, and primaryeducation), efficiency enhancers (higher education and training, market efficiency,and technological readiness), and innovation and sophistication factors (businesssophistication and innovation).7 The weightings used are shown in Table 1, and theirclassifications as different states are shown in Table 2.
Data
Using the GCR data, we wanted to determine the differences that influence specificcountries’ indicators and explore which factors have relative priority over others inenabling countries to attain their competitiveness goals. Therefore, we analyzed theweight of the relative importance attributable to each variable and/or factor for eachcountry and explained any set of variables with a high level of correlation. On theother hand, we believe that entrepreneurship is a key factor for countries to achievetheir competitiveness-level goals; therefore, it became imperative to consider whatvariables are directly related to the entrepreneurship phenomena in our analysis ofthe ordinal classification of the variables.
Our analysis includes 71 sub-indexes from the GCR (Appendix 1) for 71countries (Appendix 2) between 2001 and 2006. These variables are based on theExecutive Opinion Survey developed by the WEF. This survey is based on theopinions of business executives who not only have broad familiarity with the currentconditions in their countries but also knowledge and experience in the globalenvironment. The survey asks the participants from approximately 125 counties toevaluate each variable on a scale of 1 to 7 with 1 representing the worst possiblecondition and 7 the best possible condition. With this objective, the WEF contactedabout 130 partner institutions from around the world. For each year the survey wasimplemented, the WEF received approximately 11,000 and 12,000 responses.8 Inaddition, to classify the countries, we used information about GDP per capita thatwas also reported by the GCR. This information allowed us to classify the countriesinto the following groups: 1) countries with a per capita income GDP lower than US
7 This classification corresponds to that offered by The Global Competitiveness Index for 2006–2007because year after year, they have changed the way in which they calculate the index, creatinginconsistencies in the index.8 The World Economics Forum subjects raw data to a rigorous quality control process.
Int Entrep Manag J
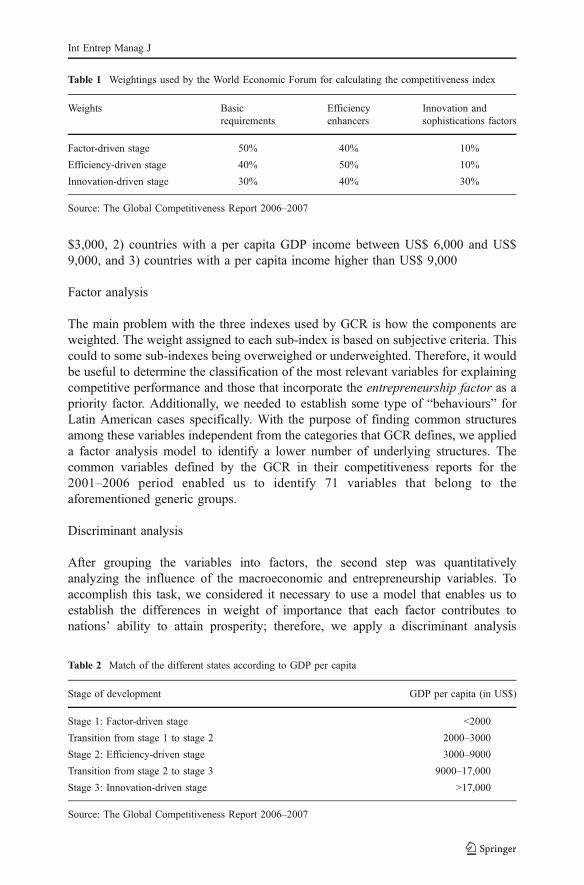
$3,000, 2) countries with a per capita GDP income between US$ 6,000 and US$9,000, and 3) countries with a per capita income higher than US$ 9,000
Factor analysis
The main problem with the three indexes used by GCR is how the components areweighted. The weight assigned to each sub-index is based on subjective criteria. Thiscould to some sub-indexes being overweighed or underweighted. Therefore, it wouldbe useful to determine the classification of the most relevant variables for explainingcompetitive performance and those that incorporate the entrepreneurship factor as apriority factor. Additionally, we needed to establish some type of “behaviours” forLatin American cases specifically. With the purpose of finding common structuresamong these variables independent from the categories that GCR defines, we applieda factor analysis model to identify a lower number of underlying structures. Thecommon variables defined by the GCR in their competitiveness reports for the2001–2006 period enabled us to identify 71 variables that belong to theaforementioned generic groups.
Discriminant analysis
After grouping the variables into factors, the second step was quantitativelyanalyzing the influence of the macroeconomic and entrepreneurship variables. Toaccomplish this task, we considered it necessary to use a model that enables us toestablish the differences in weight of importance that each factor contributes tonations’ ability to attain prosperity; therefore, we apply a discriminant analysis
Table 2 Match of the different states according to GDP per capita
Stage of development GDP per capita (in US$)
Stage 1: Factor-driven stage <2000
Transition from stage 1 to stage 2 2000–3000
Stage 2: Efficiency-driven stage 3000–9000
Transition from stage 2 to stage 3 9000–17,000
Stage 3: Innovation-driven stage >17,000
Source: The Global Competitiveness Report 2006–2007
Table 1 Weightings used by the World Economic Forum for calculating the competitiveness index
Weights Basicrequirements
Efficiencyenhancers
Innovation andsophistications factors
Factor-driven stage 50% 40% 10%
Efficiency-driven stage 40% 50% 10%
Innovation-driven stage 30% 40% 30%
Source: The Global Competitiveness Report 2006–2007
Int Entrep Manag J

model. Discriminant analysis is useful because it allows for characterization andclassification; in this case, it enabled us to identify and classify a group of countries9
(Moreno and Casillas 2007).
Categorical dependent variable
The levels of GDP per capita were used to determine the different levels at which thefactors will be differentiated. As proposed by Porter (2005) and in line with GCR’smethodology, we used the gross domestic product per capita to differentiate amongthe different countries depending on their level of growth because it “will reflect acountry’s structural fundamentals over the middle and long term” (p. 51).10 For thediscriminant analysis, we ranked the countries as follows: countries with a per capitaincome GDP lower than a US$3,000, countries with a per capita GDP incomebetween US$ 6,000 and US$ 9,000, and countries with a per capita income higherthan US$9,000. These rates are adjusted by the purchasing power parity, GDP percapita (PPP). The data was taken from the International Monetary Fund’s WorldEconomic Outlook Database.11
Independent variables
First, we used the factors obtained by the factor analysis procedure. Next, theanalysis was repeated using the specific indicators for entrepreneurship (instead ofthe factors) from the GEM database for 2001–2006. At the end of 2006, 55 differentcountries had participated in GEM, 10 of which are from the Latin American andCaribbean region. The GEM provides harmonized, internationally comparable dataon entrepreneurial activity12 and contains various entrepreneurial measures that areconstructed on a survey basis7, known as the Adult Population Survey. The GEMestimates the percentage of the adult population (people between 18–64 years old)that is actively involved in starting a new venture and separates them into twocategories: 1) nascent entrepreneurs who have taken action to create a new businessin the past year but have not paid any salaries or wages for more than 3 months and2) owner/managers of a business who have paid wages and salaries for over threemonths but for fewer than 42 months. The sum of these measurements is known asTotal Entrepreneurship Activity (TEA) Index. In addition, the individuals involvedin TEA are classified13 into Opportunity Entrepreneurs (people that want to exploit aperceived business opportunity) and Necessity Entrepreneurs (people that did not
9 Other techniques could be also used, such as logistic regression techniques for instance. Nevertheless,discriminant analysis and logistic regression techniques generally reveal the same pattern and producesimilar solutions, especially when we used with a dichotomous dependent variable, as in this case. Oneinteresting future extension would be to compare those solutions. Due to the expected similarity of bothtechniques’ results in this case, the difference among them would not have affected our conclusions.10 Appendix 1 shows the countries grouped into five categories using the GCR criteria. We highlighted thecountries from Latin America and the Caribbean.11 Available online at http://www.imf.org/external/data.htm.12 More details about the GEM project, data, and reports may be obtained at http://www.gemconsortium.org.13 For the complete GEM project measurements, see Reynolds et al. (2005), and for recent changes to theGEM measurements, see Minniti et al. (2006) and Bosma et al. (2008).
Int Entrep Manag J

have a better option for work as an employee). We use Opportunity and Necessityrates in our analysis.
Results
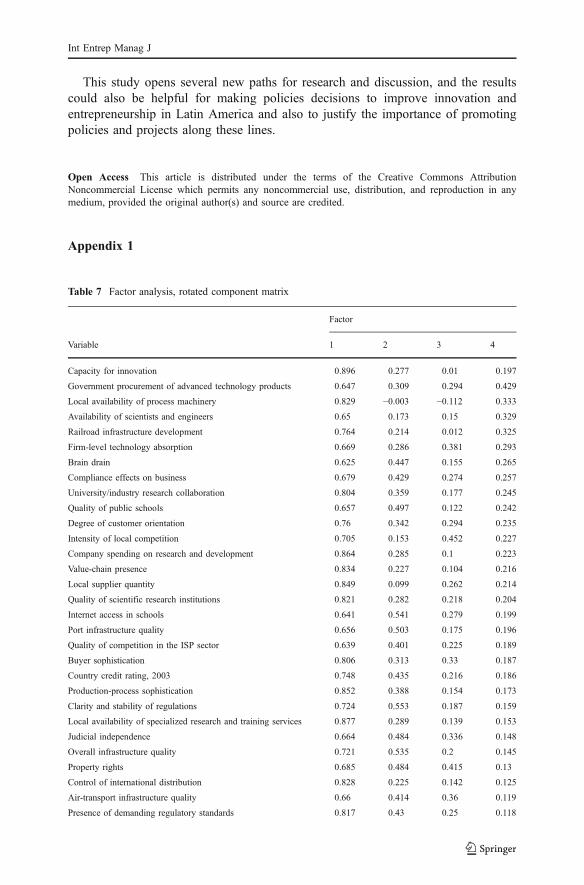
The factor analysis by means of the orthogonal rotation method yielded four factorsthat account for 75.4% of the variance14 as a whole. The decision to work with fourfactors was made based on the criteria of stopping the analysis before the eigenvaluebecomes greater than 1. We also did several analyses with a different number offactors, but this did not provide any more information. In addition, the variablesincluded in these other cases did not allow us to complete a conceptual analysis withthe same form as the other four cases.
Factor 1 is the main factor, accounting for more than 65% of the variance:
Factor 1 is considered the enterprising, efficiency, and innovation factor. Somevariables considered in this factor include the capacity for innovation, localavailability of specialized research and training services, companies spending onresearch and development, production-process sophistication, value-chainpresence, the nature of competitive advantage, the quality of managementschools, and the availability of venture capital, among others.Factor 2 groups the variables that are related to stability and best practices within thepublic and private sector and government, such as cooperation in labour-employerrelations, government effectiveness in reducing poverty, public trust of politicians,favouritism in government officials’ decisions, government surplus/deficit, irregularpayments in public contracts, and irregular payments in export and imports.Factor 3 is comprised of variables including both the financial sector as well asgovernment promotion of investments in science and technology, such asgovernment success in ICT promotion, government prioritization of ICT, accessto credit and FDI, and technology transfer.Factor 4 includes mainly variables that are associated mainly to macroeconomicstability, such as national savings ratios, inflation, and interest ratios.
If we compare our factors with the original factors utilized by the World EconomicForum, Basic Requirements (Institutions, Infrastructure, Macroeconomics, Health, andPrimary Education) would be separated in our case between factors 2 and 4; EfficiencyEnhancers (Higher Education and Training, Market Efficiency, and TechnologicalReadiness) and Innovation and Sophistication Factors (Business Sophistication andInnovation) are both part of factors 1 and 3. As we explained before, the necessity ofgrouping factors in this form was originally due to the fact that the weight of each factorvariable was based on subjective criteria; however, this new arrangement allows us togroup these variables based on the correlation between each one, thereby enabling us toavoid underestimating or overestimating the weight of each variable. Additionally, thiscategorization allows us to keep the conceptual value of each factor, as the factoranalysis enabled us to group each variable with a clear conceptual relationship.
14 Both the Bartlett tests as well as the Kaiser-Meyer-Olkin (KMO) show that the results are statisticallysignificant. KMO=0.970; Barlett Test p=0.000, (n=432).
Int Entrep Manag J

Appendix 2 lists the resulting factors and the variables constituting them.To analyze our hypothesis about the importance of innovation and the
entrepreneurship in countries’ growth, it is important to determine the weight offactors 1 and 3 on the competitiveness of a country and to analyze the importance ofthe enterprising factors within the frame of each country’s entrepreneurship andcompetitiveness. First, we show maps that face the position of each Latin Americancountry considered in our sample has with respect to those factors (see Figs. 2 and3). Second, we quantified the weight of each factor using the discriminant method.
& Figures 2 and 3 are useful to obtain a reference for each factor in relative terms tothe total sample; the rest of the points shown on these figures represent the othercountries considered in the WEF’s data (most of the Latin American countriesare positioned in the negative quadrant of the map for these factors). Somecountries, such as Argentina, Brazil, Costa Rica, Mexico, Chile, and Panama, allof which have a GDP per capita ranging between US$3,000 and US$9000, havea better relative position for these factors; however, other countries, such asBolivia, Paraguay, Nicaragua, and Honduras that have a GDP per capita lowerthan US$2,000. This shows—at least based on the first qualitative impression—apositive relationship between the innovation and entrepreneurship variables andLatin American countries’ success in term of growth. This could be importantinformation in terms of the relevant factors for the development process of thesecountries.
Having obtained the four factors, we resorted to a linear discriminant analysis, atool yielding a discriminant function that statistically discriminates between threegroups of cases (successful countries, countries having intermediate success, and
Fig. 2 Map positioning of Factor 1 (enterprising and innovation factor) vs. Factor 2 (stability and goodpractices within the public and private sector)
Int Entrep Manag J

countries with a moderate degree of performance15). This technique fits well with acountry’s capacity to generate its GDP per capita .16 The analysis was performed fortwo purposes: on the one hand, it seeks to obtain a classification of the factors’ datawithin the predetermined discriminatory groups, and secondly, it enables us toquantify the factors that better describe an association with one of the groups(namely, which factors have a greater discriminant weight), allowing us to quantifythe importance of the factors related to entrepreneurship. In this analysis, we usedthe Wilkins’s method, which elects variables for the model and defines the order ofinclusion.17
After applying the variables obtained in the factor analysis to this procedure, theprocedure yielded two significant factors when it came to discriminating between thedifferent stages: factors 1 and 3 (Table 3). The results of the structural matrix areshown in Table 4. These results show that the two factors are associated withentrepreneurship and innovation variables. The degree of significance is good for
15 To classify these three cases, we used the three groups of countries classified by GDP indicated insection 3.1: countries with a per capita income GDP lower than a US$3,000, countries with a per capitaGDP income between US$6,000 and US$9,000, and countries with a per capita income higher than US$9,000. These rates are adjusted by the purchasing power parity per US dollars, GDP per capita (PPP).16 See the methodology developed by Zirger and Maidique (1990, p.867–883).17 This method resorts to the lambda (λ), which represents the sum of the ratio between the sum of theintra-group squares with a reference to the average or centroid of the values under analysis. When thevalues of this coefficient are close to 1, the mean average groupings of a same factor or variable are equaland tend to be 0 when total the variability is attributable to differences between groups. In addition to theWilks indicator, we also used other indicators, such as the F associated to a level of significance, whichrepresents the ratio average between the variance between groups and the average intra-group (an averageintra-group is expressed as the variance between the degrees of freedom and the average intra-groupvariance and the degrees of freedom or variance that such a variable or factor has). Referential methodsindicate whether the level of significance is lower than 0.005, the hypothesis that states that the meanaverages are equal, is rejected. In turn, for a statistical test, an F associated is used to determine whetherthe contribution made by the new factor is significant or not.
Fig. 3 Map positioning of Factor 3 (financial sector and the government’s promotion of investments inscience and technology) vs. Factor 4 (macroeconomic stability)
Int Entrep Manag J
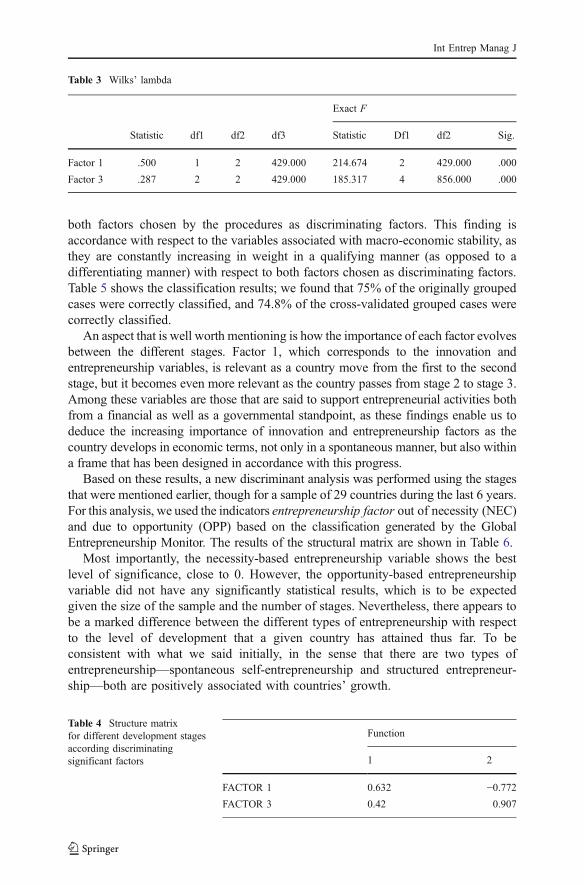
both factors chosen by the procedures as discriminating factors. This finding isaccordance with respect to the variables associated with macro-economic stability, asthey are constantly increasing in weight in a qualifying manner (as opposed to adifferentiating manner) with respect to both factors chosen as discriminating factors.Table 5 shows the classification results; we found that 75% of the originally groupedcases were correctly classified, and 74.8% of the cross-validated grouped cases werecorrectly classified.
An aspect that is well worth mentioning is how the importance of each factor evolvesbetween the different stages. Factor 1, which corresponds to the innovation andentrepreneurship variables, is relevant as a country move from the first to the secondstage, but it becomes even more relevant as the country passes from stage 2 to stage 3.Among these variables are those that are said to support entrepreneurial activities bothfrom a financial as well as a governmental standpoint, as these findings enable us todeduce the increasing importance of innovation and entrepreneurship factors as thecountry develops in economic terms, not only in a spontaneous manner, but also withina frame that has been designed in accordance with this progress.
Based on these results, a new discriminant analysis was performed using the stagesthat were mentioned earlier, though for a sample of 29 countries during the last 6 years.For this analysis, we used the indicators entrepreneurship factor out of necessity (NEC)and due to opportunity (OPP) based on the classification generated by the GlobalEntrepreneurship Monitor. The results of the structural matrix are shown in Table 6.
Most importantly, the necessity-based entrepreneurship variable shows the bestlevel of significance, close to 0. However, the opportunity-based entrepreneurshipvariable did not have any significantly statistical results, which is to be expectedgiven the size of the sample and the number of stages. Nevertheless, there appears tobe a marked difference between the different types of entrepreneurship with respectto the level of development that a given country has attained thus far. To beconsistent with what we said initially, in the sense that there are two types ofentrepreneurship—spontaneous self-entrepreneurship and structured entrepreneur-ship—both are positively associated with countries’ growth.
Table 3 Wilks’ lambda
Exact F
Statistic df1 df2 df3 Statistic Df1 df2 Sig.
Factor 1 .500 1 2 429.000 214.674 2 429.000 .000
Factor 3 .287 2 2 429.000 185.317 4 856.000 .000
Function
1 2
FACTOR 1 0.632 −0.772FACTOR 3 0.42 0.907
Table 4 Structure matrixfor different development stagesaccording discriminatingsignificant factors
Int Entrep Manag J

Discussion and conclusions
Today, in Latin American countries, there are several challenges one of which isdiscovering what steps need to be taken to arrive at a greater level of development.When we face this question, it is important to discover what factors are more importantin a country’s development. Every government faces different alternatives to theirdevelopment—different possible policies and resources; therefore, they have to choosewhich factors have the greatest potential of helping their development based on themoment at hand. As such, this study is an important contribution, as it gives quantitativeweight to different types of variables, groups these variables with clear criteria, anddemonstrates the increased importance of the variables associated with entrepreneurshipand innovation as countries grow
Our results provide evidence as to the importance of competitiveness and theentrepreneurship factor in Latin American countries. The most developed countries,especially those countries with a GDP per capita between US$3,000 and US$9,000,are in a special position to achieve more progress in their competitiveness stages.Furthermore, for those countries with a per capita GDP below US$3,000, their
Table 5 Classification resultsb,c
For discriminant Predicted Group Membership Total
0 1 2
Original Count 0 87 33 5 125
1 41 79 7 127
2 0 22 158 180
% 0 69.6 26.4 4.0 100
1 32.3 62.2 5.5 100
2 0.0 12.2 87.8 100
Cross-validateda Count 0 87 33 5 125
1 41 79 7 127
2 0 23 157 180
% 0 69.6 26.4 4.0 100
1 32.3 62.2 5.5 100
2 0.0 12.8 87.2 100
a Cross validation is only done for those cases in the analysis. In cross validation, each case is classified bythe functions derived from all cases other than that caseb 75.0% of original grouped cases correctly classifiedc 74.8% of cross-validated grouped cases correctly classified
Function
1 2
NEC .982 .189
OPP .153 .988
Table 6 Structure matrix fordifferent development stagesaccording to the types ofentrepreneurship
Int Entrep Manag J

infrastructures for education, health, and telecommunications and their governmentstability are the “major issues” needing to be addressed, and they also need to improvetheir entrepreneurial environment as an additional factor that could contribute to theireventual competitiveness and economic growth. The GEM reports establish thatcountries with low incomes have a high rate of entrepreneurial activity derived fromthe fact that a large part of the population has not been alternative sources ofemployment. This phenomenon is a major factor in Latin American entrepreneurshiprates (Llisterri et al. 2006). In this case, when middle-sized and large companies thatoperate in conventional industries are strengthened and when they have managed tobecome a source of employment, they can attract necessity-based entrepreneurs.
In this sense, Latin American governments not only need to emphasizemacroeconomic variables, which continue to be important with a qualifying rolerather than a differentiating role, but they also need to begin prioritizing theirdevelopment by taking into account microeconomic variables (i.e., those morerelated to entrepreneurial economics) as well as by encouraging entrepreneurshipactivity in their countries. Figures 1 and 2 illustrate how several Latin Americancountries are adopting measures along these lines, as they have found these variablesto be are important for greater growth. It is also a matter of concern to determinewhy certain countries have limited growth in per capita GDP, as this would aid ineventually diminishing the gaps in growth. Latin America has much room for growthin the areas of entrepreneurship and microeconomic stability, which makes itindispensable for researchers to explore how a country’s competitiveness depends onthe competitiveness of the companies that are integral parts of each country. In turn,researchers also need to examine the development of “entrepreneurial cultures”(Malecki 1997; West et al. 2008) that enhance this potential of growth.
Our results using the discriminant analysis help to understand better the relationshipbetween competitiveness and entrepreneurship. Our analysis illustrate that factorsassociated with entrepreneurial variables that are statistically significant with respect totheir importance in different countries’ development stages and also enabled us to detectthe greater presence of necessity-based entrepreneurship in the first stages.
These results forced us to question whether entrepreneurship is truly relevant forLatin American economies or not. We believe that this question is not only relevantbut also highly necessary. The implications to develop entrepreneurial activity inLatin America go beyond achieving an efficiency-driven economy stage. The regionneeds to develop more dynamic new ventures that reflect better competitiveness andeconomic-development performance (Autio 2005; Amorós and Cristi 2008).
As a restricting element to our research, we have, on the one hand, limited data for agreat number of countries over a period limited period of time related to indicatorsdirectly associated with entrepreneurship. On the other hand, there is also disaggrega-tion of the different types of entrepreneurship in the countries various areas ofdevelopment. Also, we analyzed all of the countries together, as we believe the factorswould have the same weight in each case. Along this line, it would be interesting toundertake an analysis on a country–by-country basis within the Latin American contextto see how entrepreneurship has evolved and which policies may be adopted by eachgovernment according to their stage of development. Another interesting futureextension would be to undergo a cluster analysis that allows categorizing the countriesbased on their characteristics to discover the best possibilities to use in each case.
Int Entrep Manag J
This study opens several new paths for research and discussion, and the resultscould also be helpful for making policies decisions to improve innovation andentrepreneurship in Latin America and also to justify the importance of promotingpolicies and projects along these lines.
Open Access This article is distributed under the terms of the Creative Commons AttributionNoncommercial License which permits any noncommercial use, distribution, and reproduction in anymedium, provided the original author(s) and source are credited.
Appendix 1
Table 7 Factor analysis, rotated component matrix
Factor
Variable 1 2 3 4
Capacity for innovation 0.896 0.277 0.01 0.197
Government procurement of advanced technology products 0.647 0.309 0.294 0.429
Local availability of process machinery 0.829 −0.003 −0.112 0.333
Availability of scientists and engineers 0.65 0.173 0.15 0.329
Railroad infrastructure development 0.764 0.214 0.012 0.325
Firm-level technology absorption 0.669 0.286 0.381 0.293
Brain drain 0.625 0.447 0.155 0.265
Compliance effects on business 0.679 0.429 0.274 0.257
University/industry research collaboration 0.804 0.359 0.177 0.245
Quality of public schools 0.657 0.497 0.122 0.242
Degree of customer orientation 0.76 0.342 0.294 0.235
Intensity of local competition 0.705 0.153 0.452 0.227
Company spending on research and development 0.864 0.285 0.1 0.223
Value-chain presence 0.834 0.227 0.104 0.216
Local supplier quantity 0.849 0.099 0.262 0.214
Quality of scientific research institutions 0.821 0.282 0.218 0.204
Internet access in schools 0.641 0.541 0.279 0.199
Port infrastructure quality 0.656 0.503 0.175 0.196
Quality of competition in the ISP sector 0.639 0.401 0.225 0.189
Buyer sophistication 0.806 0.313 0.33 0.187
Country credit rating, 2003 0.748 0.435 0.216 0.186
Production-process sophistication 0.852 0.388 0.154 0.173
Clarity and stability of regulations 0.724 0.553 0.187 0.159
Local availability of specialized research and training services 0.877 0.289 0.139 0.153
Judicial independence 0.664 0.484 0.336 0.148
Overall infrastructure quality 0.721 0.535 0.2 0.145
Property rights 0.685 0.484 0.415 0.13
Control of international distribution 0.828 0.225 0.142 0.125
Air-transport infrastructure quality 0.66 0.414 0.36 0.119
Presence of demanding regulatory standards 0.817 0.43 0.25 0.118
Int Entrep Manag J

Table 7 (continued)
Factor
Variable 1 2 3 4
Local supplier quality 0.862 0.311 0.274 0.112
Laws relating to ICT 0.696 0.464 0.405 0.111
Nature of competitive advantage 0.835 0.356 0.023 0.101
Venture-capital availability 0.701 0.404 0.378 0.101
Extent of regional sales 0.661 0.335 0.249 0.096
Extent of staff training 0.83 0.382 0.269 0.079
Intellectual property protection 0.77 0.529 0.267 0.039
Stringency of environmental regulations 0.785 0.493 0.195 0.035
Willingness to delegate authority 0.771 0.457 0.246 0.033
Effectiveness of antitrust policy 0.811 0.345 0.349 −0.009
Extent of marketing 0.829 0.233 0.356 −0.026
Reliance on professional management 0.743 0.342 0.387 −0.028
Quality of management schools 0.734 0.272 0.373 −0.067
Extent of incentive compensation 0.744 0.255 0.322 −0.071
Financial-market sophistication 0.722 0.381 0.433 −0.103
Efficacy of corporate boards 0.598 0.406 0.409 −0.08
Local equity market access 0.607 0.146 0.547 0.058
Ease of access to loans 0.578 0.496 0.451 0.023
Extent of bureaucratic red tape −0.428 −0.281 −0.122 0.011
Cooperation in labour-employer relations 0.284 0.59 0.199 0.398
Government effectiveness in reducing poverty 0.539 0.555 0.253 0.302
Public trust of politicians 0.516 0.694 0.221 0.262
Favouritism in decisions of government officials 0.586 0.643 0.261 0.171
Government surplus/deficit, 2002 0.024 0.532 −0.043 0.155
Irregular payments in public contracts 0.582 0.718 0.172 0.06
Business costs of corruption 0.611 0.616 0.321 0.016
Irregular payments in tax collection 0.535 0.684 0.069 0.006
Irregular payments in export and imports 0.557 0.684 0.175 −0.029
Organized crime 0.21 0.357 0.094 0.058
Informal sector −0.52 −0.561 −0.212 −0.252
Government success in ICT promotion 0.457 0.296 0.486 0.453
Government prioritization of ICT 0.45 0.28 0.456 0.442
Access to credit 0.21 0.168 0.686 0.215
FDI and technology transfer 0.021 0.018 0.622 0.186
Soundness of banks 0.46 0.435 0.559 −0.098
Recession expectations 0.169 0.079 0.538 0.45
National savings rate, 2002 0.063 0.049 −0.024 0.73
Pay and productivity 0.253 0.355 0.352 0.563
Hiring and firing practices −0.147 0.302 0.123 0.527
Inflation, 2002 −0.078 0.004 −0.032 −0.494
Interest rate spread, 2002 −0.18 −0.03 −0.162 −0.514
Int Entrep Manag J
Appendix 2
References
Acs, Z. J., & Amorós, J. E. (2008). Entrepreneurship and competitiveness dynamics in Latin America.Small Business Economics, 31(3), 305–322.
Acs, Z., & Armington, C. (2006). Entrepreneurship, geography and American economic growth.Cambridge: Cambridge University Press.
Acs, Z. J., & Storey, D. J. (2004). Introduction: entrepreneurship and economic development. RegionalStudies, 38(8), 871–877.
Table 8 List of countries at each stage of development
Phase 0 Phase 1 Phase 2
Stage 1factor-driven stage,
Transitionfrom 1 to 2
Stage 2efficiency-driven stage
Transitionfrom 2 to 3
Stage 3innovation-driven stage;
Bangladesh Colombia Argentina Czech Republic Australia
Bolivia Ecuador Brazil Estonia Austria
China El Salvador Bulgaria Hungary Belgium
Guatemala Peru Chile Korea Canada
Honduras Thailand Costa Rica Denmark
India Dominican Republic Finland
Indonesia Jamaica France
Nicaragua Latvia Germany
Nigeria Lithuania Greece
Paraguay Malaysia Hong Kong SAR
Philippines Mauritius Iceland
Sri Lanka Mexico Ireland
Ukraine Panama Israel
Vietnam Poland Italy
Zimbabwe Romania Japan
Russia Netherlands
Slovak Republic New Zealand
South Africa Norway
Turkey Portugal
Uruguay Singapore
Venezuela Slovenia
Spain
Sweden
Switzerland
United Kingdom
United States
Source: Based on the categories in the Global Competitiveness Report 2006–2007
Int Entrep Manag J

Acs, Z. J., Arenius, P., Hay, M., & Minniti, M. (2005). Global entrepreneurship monitor: 2004 executivereport. Wellesley: Babson College and London Business School.
Amorós, J. E., & Cristi, O. (2008). Entrepreneurship and competitiveness development: a longitudinalanalysis of Latin American countries. International Entrepreneurship and Management Journal, 4(4),381–399.
Audretsch, D., & Keilbach, M. (2004). Entrepreneurship and regional growth: an evolutionaryinterpretation. Journal of Evolutionary Economics, 14(5), 605–616.
Audretsch, D., & Thurik, R. (2001). What is New about the New Economy? Sources of growth in themanaged and entrepreneurial economy. Industrial and Corporate Change, 10(1), 267–315.
Audretsch, D., & Thurik, R. (2004). Model of the entrepreneurial economy. The Papers onEntrepreneurship, Growth and Public Policy, Max Planck Institute, Jena 17.
Aulakh, P., Kotabe, M., & Teegen, H. (2000). Export strategies and performance of firms fromemerging economies: Evidence from Brazil, Chile and Mexico. Academy of Management Journal,43, 342–361.
Autio, E. (2005). GEM report on high–expectation entrepreneurship. Babson Park: Babson College andLondon Business School.
Autio, E. (2007). GEM 2007: Global report on high–growth entrepreneurship. Babson Park: BabsonCollege and London Business School.
Belso-Martínez, J. A. (2005). Equilibrium entrepreneurship rate, economic development and growth.Evidence from Spanish regions. Entrepreneurship & Regional Development, 17(2), 145–161.
Berry, A. (2002). The role of the small and medium enterprise sector in Latin America and similardeveloping economies. Seton Hall Journal of Diplomacy and International Relations, Winter/Spring,104–119.
Birch, D. (1979). The job generation process. Cambridge, MA: MIT Program on Neighborhood andRegional Change.
Birch, D. (1987). Job creation in America: How our smallest companies put the most people to work. NewYork: The Free Press.
Blejer, M. (2006). Latin America and the external environment: A missed opportunity? In A. López-Claros (Ed.), The Latin America competitiveness review 2006 (pp. 43–46). Geneva: World EconomicForum.
Bosma, N., & Levie, J. (2010). Global entrepreneurship monitor, 2009 global report. Wellesley: BabsonCollege.
Bosma, N., Jones, K., Autio, E., & Levie, J. (2008). Global entrepreneurship monitor, executive report2007. Wellesley: Babson College and London Business School.
Capelleras, J.-L., & Rabetino, R. (2008). Individual, organizational and environmental determinants ofnew firm employment growth: evidence from Latin America. International Entrepreneurship andManagement Journal, 4(4), 79–99.
Capelleras, J.-L., Greene, F., Kantis, H., & Rabetino, R. (2010). Venture creation speed andsubsequent growth: evidence from South America. Journal of Small Business Management, 48(3),302–324.
Carree, M., Van Stel, A., Thurik, R., & Wennekers, S. (2002). Economic development and businessownership: an analysis using data of 23 OECD countries in the period 1976–1996. Small BusinessEconomics, 19(3), 271–290.
Carree, M., Van Stel, A., Thurik, R., & Wennekers, S. (2007). The relationship between economicdevelopment and business ownership revisited. Entrepreneurship and Regional Development, 19(3),281–291.
De Soto, H. (1989). The other path: The invisible revolution in the Third World. New York: Harper &Row.
Echecopar, G. (2004). Incubating innovative starts–ups: Some lesson for Chile. In S. Tiffin (Ed.),Entrepreneurship in Latin America, 2004 (pp. 101–112). Westport: Praeger.
Fritsch, M., & Mueller, P. (2004). Effects of new business formation on regional development over time.Regional Studies, 38(8), 961–975.
IADB (2006). Annual inform 2005. In J. Ferriter (Ed.), Washington, D.C.: Inter–American DevelopmentBank.
IADB (2008). Annual inform 2007. In A. Russell (Ed.), Washington, D.C.: Inter–American DevelopmentBank.
Kantis, H. (2004). Main contrasts between Latin America and East Asia, Italy, and Spain. In H. Kantis, P.Angelelli, & V. Moori-Koenig (Eds.), Experience in Latin America and Worldwide 2004 (pp. 57–74).Washington, DC: Inter–American Development Bank–Fundes International.
Int Entrep Manag J

Kantis, H. (2005). The emergence of dynamic ventures in Latin America, Southern Europe and EastAsia: an international comparison. International Journal of Entrepreneurship and Small Business,2(1), 34–56.
Kantis, H., Ishida, M., & Komori, M. (2002). Entrepreneurship in emerging economies: the creation anddevelopment of new firms in Latin America and East Asia. Washington, DC: Inter–AmericanDevelopment Bank.
Kantis, H., Angelelli, P., & Moori-Koenig, V. (2004). Experience in Latin America and Worldwide.Washington, DC: Inter–American Development Bank–Fundes International.
Lee, S. Y., Florida, R., & Acs, Z. J. (2004). Creativity and entrepreneurship: a regional analysis of newfirm formation. Regional Studies, 38(8), 879–891.
Llisterri, J. J., Kantis, H., Angelelli, P., & Tejerina, L. (2006). Is youth entrepreneurship a necessity or anopportunity? A first exploration of household and new enterprise surveys in Latin America.Washington, DC: Sustainable Development Department Technical Papers Series, Inter–AmericanDevelopment Bank.
López-Claros, A., Altinger, L., Blanke, J., Drzeniek, M., & Mía, I. (2006). Assessing Latin Americancompetitiveness: Challenges and opportunities. In A. López-Claros (Ed.), The Latin Americacompetitiveness review 2006 (pp. 3–36). Geneva: World Economic Forum.
Malecki, E. J. (1997). Entrepreneurs, networks, and economic development: A review of recent research. In J.K. Katz (Ed.), Advances in entrepreneurship, emergence and growth (pp. 57–118). Greenwich: JAI.
Minniti, M., Bygrave, W. D., & Autio, E. (2006). Global entrepreneurship monitor executive report 2005.Babson Park: Babson College and London Business School.
Moreno, A. M., & Casillas, J. C. (2007). High–growth SMEs versus non–high–growth SMEs: adiscriminant analysis. Entrepreneurship & Regional Development, 19(1), 69–88.
Peres, W., & Stumpo, G. (2002). Las pequeñas y medianas empresas industriales en América Latina y elCaribe. CEPAL: Siglo Veintiuno Editores.
Porter, M. (1990). The competitive advantage of nations. New York: The Free Press.Porter, M. (2002). Enhancing the Microeconomic Foundations of Prosperity: The Current Competitiveness
Index in World Economic Forum, The Global Competitiveness Report 2001–2002 (pp. 2–26). Oxford:Oxford University Press.
Porter, M. (2005). Building the microeconomic foundations of prosperity: findings from the BusinessCompetitiveness Index. In A. Lopez-Claros, M. Porter & K. Schwab (Eds.), Global CompetitivenessReport 2005-2006. Policies underpinning rising prosperity (pp 43-77). New Hampshire: PalgraveMacmillan.
Porter, M., Sachs, J., & Arthur, J. (2002). Executive summary: Competitiveness and stages of economicdevelopment. In M. Porter, J. Sachs, P. K. Cornelius, J. W. McArthur, & K. Schwab (Eds.), The globalcompetitiveness report 2001–2002 (pp. 16–25). New York: Oxford University Press.
Reynolds, P., Bosma, N., Autio, E., Hunt, S., De Bono, N., Servais, I., et al. (2005). Globalentrepreneurship monitor: Data collection design and implementation 1998–2003. Small BusinessEconomics, 24(3), 205–231.
Schumpeter, J. A. (1934). The theory of economic development. Cambridge: Harvard University Press.Spencer, J. W., & Gómez, C. (2006). The relationship among national institutional structures, economic
factors, and domestic entrepreneurial activity: a multicountry study. Journal of Business Research, 57(10), 1098–1107.
Tang, L., & Koveos, P. E. (2004). Venture entrepreneurship, innovation entrepreneurship and economicgrowth. Journal of Developmental Entrepreneurship, 9(2), 161–171.
Thurow, L. (2003). Fortune favours the bold: What we must do to build a new and lasting globalprosperity. New York: Harper Collins.
Tiffin, S. (2004). Entrepreneurship in Latin America. Westport: Praeger.Valliere, D., & Peterson, R. (2009). Entrepreneurship and economic growth: evidence from emerging and
developed countries. Entrepreneurship & Regional Development, 21(5), 459–480.Van Stel, A., Carree, M., & Thurik, R. (2005). The effect of entrepreneurial activity on national economic
growth. Small Business Economics, 24(3), 311–321.Vignolo, C., & Wechsler, G. (1992). La Innovación Tecnológica en Chile: lecciones de un estudio de caso
de empresas manufactureras exitosas. Santiago: Universidad de Chile, Facultad de Ciencias Físicas yMatemáticas, Departamento de Ingeniería Industrial.
Wennekers, S., van Stel, A., Thurik, R., & Reynolds, P. (2005). Nascent entrepreneurship and the level oeconomic development. Small Business Economics, 24(3), 293–309.
Wennekers, S., van Stel, A., Carree, M., & Thurik, R. (2010). The relationship between entrepreneurship andeconomic development: is it U-shaped? Foundations and Trends in Entrepreneurship, 6(3), 167–237.
Int Entrep Manag J
West, G. P., III, Bamford, C. E., & Marsden, J. W. (2008). Contrasting entrepreneurial economicdevelopment in emerging Latin American economies: Applications and extensions of resource–basedtheory. Entrepreneurship Theory and Practice, 32(1), 15–36.
Wong, P. K., Ho, Y. P., & Autio, E. (2005). Entrepreneurship, innovation and economic growth: Evidencefrom GEM data. Small Business Economics, 24(3), 335–350.
Zirger, B., & Maidique, M. (1990). A model of new product development: an empirical test. ManagementScience, 36(7), 867–883.
Int Entrep Manag J