quantifying the potential impact of a marine conservation
TRANSCRIPT
Department of Energy and Climate Change
Quantifying the Potential Impact of a Marine Conservation Zone (MCZ) Network on the Deployment of Offshore Renewables Report R.1763 March 2011
All images copyright ABPmer apart from front cover (wave, anemone, bird) and policy & management (rockpool) Andy Pearson www.oceansedgephotography.co.uk
Department of Energy and Climate Change
Quantifying the Potential Impact of a Marine Conservation Zone (MCZ) Network on the Deployment of Offshore Renewables Date: March 2011 Project Ref: R/3981/1 Report No: R.1763 © ABP Marine Environmental Research Ltd
Version Details of Change Authorised By Date
1 Draft for Comment S C Hull 04.02.2011
2 Final S C Hull 04.03.2011
3 Second Final S C Hull 18.04.2011
Document Authorisation Signature Date
Project Manager: J E Saunders
18.04.2011
Quality Manager: C E Brown
18.04.2011
Project Director: S C Hull
18.04.2011
ABP Marine Environmental Research Ltd Suite B, Waterside House Town Quay Tel: +44(0)23 8071 1840 SOUTHAMPTON Fax: +44(0)23 8071 1841 Hampshire Web: www.abpmer.co.uk SO14 2AQ Email: [email protected]
ABPmer is certified by:
Quantifying the Potential Impact of a Marine Conservation Zone (MCZ) Network on the Deployment of Offshore Renewables
R/3981/1 (i) R.1763
Summary Aims and Objectives The Department of Energy and Climate Change (DECC) Offshore Renewables Team (ORT) commissioned ABPmer to undertake an assessment of the potential cost impacts of possible MCZ networks in English waters on offshore renewables interests (wind, wave, tidal stream and tidal range). The main objective of the study has been to quantify what impact a newly created Marine Protected Area (MPA) network could have on the potential for offshore renewables to contribute to meeting the UK’s 2020 renewable energy targets and 2050 emissions reductions targets. The study has evaluated: The proportion and value of proposed offshore wind deployment that could realistically be
affected by and be at risk as a result of new MCZ designations (2020 and beyond); The proportion of the wave and tidal energy resource (and the socio-economic value of that
resource) that could realistically be affected by and be at risk as a result of new MCZ designations (2020 and beyond); and
What additional project costs might realistically be incurred by developers of a) offshore wind and b) wave and tidal energy developments as a result of new designations and how that would be likely to affect project financing.
The study has been undertaken at a strategic level to report potential cost impacts at a regional and national scale. The report has sought to interpret potential cost impacts in terms of the implications for the projected overall investment in offshore wind and wave and tidal development, project financing, jobs, the supply chain and renewable energy targets. The outputs from the study will assist DECC in making an input to the MCZ project at a national level and inform the wider MCZ process and Government decision-making. Methodology The designation of MCZ has the potential to affect offshore renewables interests in a number of ways including: Increased costs to developers associated with planning/pre-development construction,
operation and decommissioning of offshore renewables infrastructure as a result of requirements for additional management measures to support achievement of MCZ conservation objectives;
Increased costs to developers associated with project delays (i.e. delays in revenue streams) due to the longer time scales to achieve consent;
Increased costs of project financing due to perceived increases in risks to project delivery; Delay or reduction to investment in offshore renewables affecting contributions to GVA and
jobs; and Delay or failure to progress in achieving climate change targets. The scale of these impacts is likely to be strongly influenced by the spatial extent of overlap between offshore renewables interests and MCZ features and the nature and cost of the management measures

Quantifying the Potential Impact of a Marine Conservation Zone (MCZ) Network on the Deployment of Offshore Renewables
R/3981/1 (ii) R.1763
issues that might be imposed. A key focus of the study has therefore been to seek to quantify the potential extent of spatial overlap between existing and future offshore renewables interests and to explore possible requirements for management measures and their associated costs through the project life cycle. This information has then been used to explore the potential consequences for overall deployment of offshore renewables in English waters. To reflect the inherent uncertainties in the location and scale of MCZs and the requirements for management measures at this stage of the MCZ designation process, the methodology has used different MCZ network options and scenarios to explore these uncertainties. The evaluation of the costs of potential management measures has been undertaken through completion of a number of tasks: Defining MCZ network options for assessment:
- Option 1: MCZ Regional Project 2nd iteration network options; - Option 2: an alternative network option based on a separate research study (ABPmer,
2010a); - Option 3: an option which assumes a lower level of spatial overlap between potential
MCZ and offshore renewables interests compared to Options 1 and 2; and - Option 4: an option which assumes a higher level of spatial overlap between potential
MCZ and offshore renewables interests compared to Options 1 and 2. Defining management measure scenarios (which identify the rules that determine the
circumstances in which different types of measures might be applied): - Low Scenario which assumed fewer requirements for additional management
measures and costs towards the lower end of cost ranges; - High Scenario which assumed greater requirements for management measures and
costs towards the upper end of cost ranges; Defining potential management measures and costs; Spatial analysis of interaction between MCZ network options and offshore renewables interests
to characterize the nature and spatial extent of any incompatibilities; and Assessment of cost impact of alternative scenarios for each network option. This included
capital costs (planning/pre-development and construction) and operating costs (operating costs and decommissioning costs).
Findings The analysis has indicated that there is a substantial spatial overlap between offshore renewables interests and potential MCZ. For example, based on option 1 (2nd iteration networks) up to 30% of existing and 13% of future OWF arrays could be affected and up to 30% of future export cables.
The cost impacts of MCZ are hard to quantify because of the underlying uncertainty concerning the detail of the management measures that might be required. This is reflected in the wide range in costs between the low and high scenarios. Across the options and scenarios, the range of potential total costs for management measures at a national level for all offshore renewables is estimated to range between £9m and £4.4bn. Virtually all of these costs are associated with offshore wind, reflecting the dominance of offshore wind - existing and planned developments could lead to an installed capacity of 44GW in UK waters. In contrast, the assessment has assumed that only 500MW of wave and 120MW of tidal stream are installed in English waters by 2030. This is a relatively small proportion of the total
Quantifying the Potential Impact of a Marine Conservation Zone (MCZ) Network on the Deployment of Offshore Renewables
R/3981/1 (iii) R.1763
expected contribution of 2.6GW in UK waters by 2030, particularly reflecting the greater extent of exploitable resource in Scottish waters. The cost estimates for wave and tide are consequently much lower than for offshore wind ranging from £0-40m and £0-10m respectively. Potential total additional costs associated with tidal range deployments were estimated at around £40m for four possible tidal range sites (Thames, Solway, Wyre and Mersey) with a combined installed capacity of around 1400MW.
Capital costs associated with relocating export cables around MCZ (and particularly Reference Condition MCZ) are estimated to account for the majority of total additional costs based on the assumptions used. If Reference Areas are located in the vicinity of cable landfall points, this could be particularly costly for offshore wind developers and could preclude some developments. All of the costs in the low scenarios are driven by habitat measures (based on the assumptions applied) but in the high scenarios, up to 25% of the total costs for future offshore wind and tidal stream could be driven by other features (birds, marine mammals and fish) and 20% for future wave developments. These costs relate to additional monitoring requirements and mitigation measures to address issues of underwater noise and collision risks (tidal stream devices).
The relative increases in capital and operating costs associated with MCZ management measures are relatively modest when averaged over offshore renewables development as a whole. However, costs will be focused on those sites and cable routes where incompatible overlaps occur with MCZ and therefore cost impacts to the affected sites will be substantially larger. The analysis suggests that the additional costs identified in the low scenarios are small; however, costs in the high scenarios are more significant, possibly up to 10% of capital or operating costs.
Offshore renewables developers may also experience cost impacts as a result of project delays (delayed profits) and increased financing costs associated with greater uncertainty for projects located in MCZ. It has not been possible to quantify these costs for this study but developers have indicated that requirements to meet nature conservation objectives are a material factor in financing discussions.
It is difficult to assess the implications of possible cost increases for existing installations or future deployments. The offshore renewables sector has experienced very significant cost increases in the last five years and the scale of likely increases associated with MCZ designation is relatively minor in comparison. It is estimated that unconsented UK OWF developments will need to contribute around 8GW installed capacity by 2020 to achieve the level of deployment (13GW) projected in DECC analysis from 2009 and a further 35 GW to meet the industry expectation of 48 GW in Crown Estate leases. . Based on the analysis set out in the UK Renewable Energy Action Plan (NREAP) the risk that MCZ designations pose to the achievement of the 2020 Renewable Energy target is considered low. However, the Government’s ambition for offshore renewable energy is far greater and, hence, MCZ impacts less certain. In terms of these wider ambitions and the 2050 targets, the scale of practical resources is large, particularly for offshore wind. While MCZ designation may constrain the location of future offshore renewables deployment to some extent, the scale of the resources, particularly for offshore wind and wave, suggests large areas will remain suitable for future development. Therefore, MCZ designations alone should not prevent offshore renewables from making a significant contribution to 2050 targets, although other environmental constraints and spatial conflicts may limit the extent of available resource in practice.

Quantifying the Potential Impact of a Marine Conservation Zone (MCZ) Network on the Deployment of Offshore Renewables
R/3981/1 (iv) R.1763
Acknowledgements The authors would like to thank the Project Steering Group comprising DECC, The Crown Estate and Defra for their help, advice and guidance through the course of this project. We are also grateful to members of the Renewable UK MCZ Group and Marine Group for providing information to support some of the assumptions used in the study.

Quantifying the Potential Impact of a Marine Conservation Zone (MCZ) Network on the Deployment of Offshore Renewables
R/3981/1 (v) R.1763
Abbreviations > More than < Less than % Percent(age) £ Pound Sterling ABPmer ABP Marine Environmental Research Ltd BAI Broad Areas of Interest bn Billion BS British Standard BSH Broad-Scale Habitats BWEA British Wind Energy Association Capex Capital Expenditure, Capital Expense cf Compared to C-POD Monitoring equipment uses digital waveform characterisation to select cetacean clicks
and logs the time, centre frequency, sound pressure level, duration and bandwidth of each click
DECC Department of Energy and Climate Change Defra Department for Environment, Food and Rural Affairs. dMCZ draft Marine Conservation Zone EIA Environmental Impact Assessment ENG Ecological Network Guidance ETI Energy Technologies Institute EU European Union EUNIS European Nature Information System FREDS Forum for Renewable Energy Development in Scotland GIS Geographic Information System FOCI Features of Conservation Importance FS Finding Sanctuary GVA Gross Value Added GW Giga watt HDD Horizontal Directional Drilling HM Her Majesty’s HRA Habitats Regulations Appraisal HVDC High Voltage Direct Current IA Impact Assessment IRR Internal Rate of Return IS Irish Sea JNCC Joint Nature Conservation Committee km kilometres m/s metres per second MarLIN The Marine Life Information Network Marxan Software designed to aid systematic reserve design on conservation planning MCAA Marine & Coastal Access Act MCZ Marine Conservation Zone

Quantifying the Potential Impact of a Marine Conservation Zone (MCZ) Network on the Deployment of Offshore Renewables
R/3981/1 (vi) R.1763
MEAP Marine Energy Action Plan MMO Marine Management Organisation MPA Marine Protected Area mpcs Mean peak current speed MW Mega watt NAREC National Renewable Energy Centre Limited NE Natural England nm nautical miles NREAP National Renewable Energy Action Plan O&M Operation and Maintenance Opex Operating Expense, Operating Expenditure, Revenue Expenditure ORT Offshore Renewables Team OWF Offshore Wind Farm pMCZ potential Marine Conservation Zone RA Relevant Authority ROC Renewables Obligation Certificate SAC Special Area of Conservation SAP Science Advisory Panel SDC Sustainable Development Commission SEA Strategic Environmental Assessment SNCBs Statutory Nature conservation Bodies SPA Special Protection Area TCE The Crown Estate TWh Terawatt Hours UK United Kingdom UKERC UK Energy Research Centre US United States vs Versus
Quantifying the Potential Impact of a Marine Conservation Zone (MCZ) Network on the Deployment of Offshore Renewables
R/3981/1 (vii) R.1763
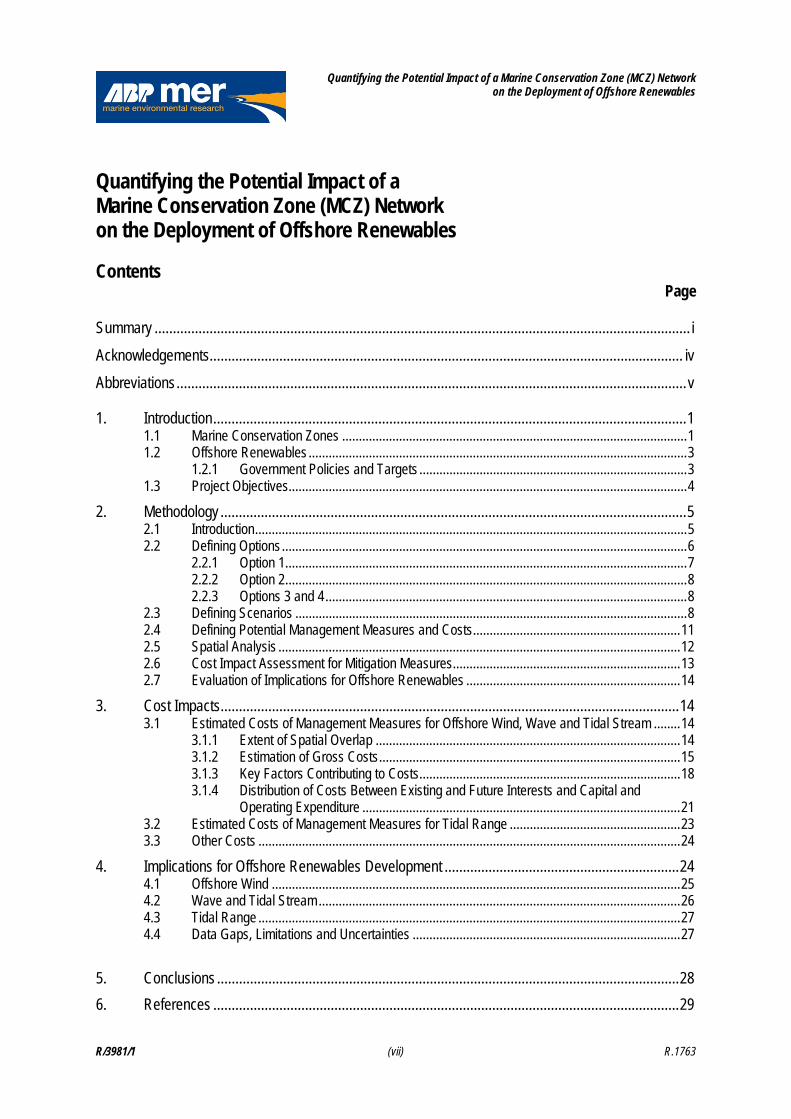
Quantifying the Potential Impact of a Marine Conservation Zone (MCZ) Network on the Deployment of Offshore Renewables Contents
Page
Summary .................................................................................................................................................. i
Acknowledgements................................................................................................................................. iv
Abbreviations...........................................................................................................................................v
1. Introduction.................................................................................................................................1 1.1 Marine Conservation Zones .......................................................................................................1 1.2 Offshore Renewables .................................................................................................................3
1.2.1 Government Policies and Targets ................................................................................3 1.3 Project Objectives.......................................................................................................................4
2. Methodology ...............................................................................................................................5 2.1 Introduction.................................................................................................................................5 2.2 Defining Options.........................................................................................................................6
2.2.1 Option 1........................................................................................................................7 2.2.2 Option 2........................................................................................................................8 2.2.3 Options 3 and 4............................................................................................................8
2.3 Defining Scenarios .....................................................................................................................8 2.4 Defining Potential Management Measures and Costs..............................................................11 2.5 Spatial Analysis ........................................................................................................................12 2.6 Cost Impact Assessment for Mitigation Measures....................................................................13 2.7 Evaluation of Implications for Offshore Renewables ................................................................14
3. Cost Impacts.............................................................................................................................14 3.1 Estimated Costs of Management Measures for Offshore Wind, Wave and Tidal Stream ........14
3.1.1 Extent of Spatial Overlap ...........................................................................................14 3.1.2 Estimation of Gross Costs..........................................................................................15 3.1.3 Key Factors Contributing to Costs..............................................................................18 3.1.4 Distribution of Costs Between Existing and Future Interests and Capital and
Operating Expenditure ...............................................................................................21 3.2 Estimated Costs of Management Measures for Tidal Range ...................................................23 3.3 Other Costs ..............................................................................................................................24
4. Implications for Offshore Renewables Development ................................................................24 4.1 Offshore Wind ..........................................................................................................................25 4.2 Wave and Tidal Stream............................................................................................................26 4.3 Tidal Range ..............................................................................................................................27 4.4 Data Gaps, Limitations and Uncertainties ................................................................................27
5. Conclusions ..............................................................................................................................28
6. References ...............................................................................................................................29

Quantifying the Potential Impact of a Marine Conservation Zone (MCZ) Network on the Deployment of Offshore Renewables
R/3981/1 (viii) R.1763
Appendices A. Figures B. Assumptions C. Summary Tables of Management Measures and Costs D. Data Sources E. Assumptions for Spatial Analysis F. Summary Outputs from Cost Model Tables 1. Indicative scale of exploitable wave and tidal stream resources.................................................3 2. Percentage spatial overlap between offshore renewables interests and potential MCZ ...........15 3. Summary of estimated gross costs of management measures ................................................16 4. Proportion of total costs accounted for by reference area measures........................................18 5. Indicative average capital and operating costs of MCZ management measures per MW
installed capacity ......................................................................................................................21 6. Indicative costs of management measures for tidal range sites ...............................................24 Figures 1. English MCZ Regional Project Boundaries.................................................................................2 2. Variation in Estimated Cost of Management Measures for Offshore Wind Across Options
and Scenarios...........................................................................................................................16 3. Variation in Estimated Cost of Management Measures for Wave Deployments Across
Options and Scenarios .............................................................................................................17 4. Variation in Estimated Cost of Management Measures for Tidal Stream Deployments
Across Options and Scenarios .................................................................................................17 5. Variation in Estimated Cost of Management Measures with MCZ Network Size for All
Offshore Renewables Interests ................................................................................................17 6. Elements of Offshore Renewables Development Incurring Management Measure Costs........20

Quantifying the Potential Impact of a Marine Conservation Zone (MCZ) Network on the Deployment of Offshore Renewables
R/3981/1 1 R.1763
1. Introduction The Department of Energy and Climate Change (DECC) Offshore Renewables Team (ORT) has commissioned ABPmer to undertake an assessment of the potential cost impacts of possible Marine Protected Area (MPA) networks in English waters on offshore renewables interests (wind, wave and tidal). The study has been carried out under DECC’s Offshore Renewables Research and Technical Advice Framework Agreement.
1.1 Marine Conservation Zones The Marine & Coastal Access Act (MCAA) 2009 provides for the identification and designation of Marine Conservation Zones (MCZ) within English territorial and offshore waters. Ecological Network Guidance (ENG) has been published for the development of the MCZ networks (JNCC and Natural England, 2010a). The guidance establishes selection criteria for three types of feature: Twenty three Broad-scale habitat features (EUNIS level 3 features based on
UKSeaMap (JNCC, 2009)); Twenty two habitat features of conservation importance (habitat FOCI) such as
seagrass beds and oyster reefs; and Twenty nine low or limited mobility species features of conservation importance
(species FOCI) such as pink sea fans (Eunicella verrucosa) and file shells (Limaria hians).
The guidance also provides for the protection of additional features of conservation importance where these occur within proposed MCZs, for example, harbour porpoise, marine birds or features of geological importance, although occurrence of these features will not be a primary reason for site selection. In England, the process of identifying these MCZs is being taken forward through four Regional Projects (Figure 1). Guidance and oversight to the regional project process is being provided by an MCZ Project Advisory Board chaired by Natural England. Each Regional Project was required to submit initial proposals for MCZ networks in June 2010. Revisions to these proposals were submitted in October 2010. A further revision is proposed for March 2011 with draft MCZ recommendations to be submitted in June 2011 and final proposals to be submitted at the end of August 2011. An independent Science Advisory Panel (SAP) has been established to provide advice to the MCZ Regional Projects on the extent to which their proposals meet the ENG criteria. As part of the process of identifying potential MCZ, the Regional Projects are also required to identify possible conservation objectives for each site and to consider the potential management measures that might need to be applied to human activities within and around the sites, to support achievement of those conservation objectives.

Quantifying the Potential Impact of a Marine Conservation Zone (MCZ) Network on the Deployment of Offshore Renewables
R/3981/1 2 R.1763
Figure 1. English MCZ Regional Project Boundaries The MCAA provides for social and economic factors to be taken into account during the site selection process:
‘In considering whether it is desirable to designate an area as an MCZ, the appropriate authority may have regard to any economic or social consequences of doing so’ (MCAA Act S 117). The Defra Ministerial Statement on the Creation of a Network of Marine Protected Areas (11 March 2010) indicated that ‘In ensuring we create an ecologically coherent network, the Government wants to minimise any adverse social and economic impacts and wherever possible to work with the grain of sustainable economic use of the seas.’
Project Delivery Guidance (NE and JNCC, 2010) includes advice on how to take account of socio-economic factors in site selection, including requirements for formal Impact Assessment (IA). The process of IA is being built into the MCZ identification process. A number of draft IAs are being prepared alongside network proposals. Final IAs for regional networks and a cumulative IA are required to be submitted by Regional Projects by 30 September 2011.

Quantifying the Potential Impact of a Marine Conservation Zone (MCZ) Network on the Deployment of Offshore Renewables
R/3981/1 3 R.1763
1.2 Offshore Renewables
The UK has some of the best offshore wind, wave, tidal stream and tidal range resources in the world. The Offshore Valuation Report (The Offshore Valuation Group, 2010) suggests that the potential for fixed offshore wind installations could be 116GW installed capacity with a further 190GW of potential for floating offshore wind installations within 100nm of the coast. Estimates indicate that the practical resource level for wave energy in the UK waters is in the order 50 TWh/year (The Carbon Trust, 2006), although the Offshore Valuation Report suggests a lower figure of around 37TWh/year. The total UK tidal stream potential is indicated to be in the order of 17TWh/year (SKM, 2008, Black & Veatch, 2005; Sustainable Development Commission, 2007), although the Offshore Valuation Report suggests the potential could be as high as 116TWh/year, assuming resources as low as 1.5m/s mean peak current speed (mpcs) can be profitably exploited. Indicative areas of exploitable resource (for English and Welsh waters) are presented in Table 1 (based on AEA Technology & Hartley Anderson, in prep). Table 1. Indicative scale of exploitable wave and tidal stream resources
Resource Potentially Exploitable Area (km²)1
0-12nm 20246 12-25nm 13340 25-50nm 29226
Wave (distance from shore)
>50nm 61832 >1m/s <=1.5m/s 9952
>1.5m/s <=2.5m/s 1959 Tidal Stream
(mean peak current speed) >2.5m/s 42
1 Areas of suitable resource excluding hard constraints and Military Practice and Exercise Areas
The UK also has significant tidal range resource with the world’s second highest tidal range site being located in the Severn Estuary. The Sustainable Development Commission (SDC, 2007) estimated that there is an opportunity to potentially provide up to 13% of the UK’s electricity generation from tidal range alone. The Offshore Valuation Report suggests that the potential exploitable resource could be up to 36TWh/yr.
1.2.1 Government Policies and Targets In 2010, DECC published its study to set out pathways for the decarbonisation of the power sector by 2050 and to meet the UK’s 15% Renewable Energy Directive requirements by 2020 (HM Government, 2010a). The UK also submitted its National Renewable Energy Action Plan (NREAP) (HM Government, 2010b) to the EU Commission. The Climate Change Act, which came into force in November 2008, creates a new legal framework for the UK to reduce, through domestic and international action, greenhouse gas emissions to at least 80% below 1990 levels by 2050. The NREAP notes that the precise breakdown of the 2020 renewable energy target between technologies will depend on how investors respond to the incentives Government puts in place.
Quantifying the Potential Impact of a Marine Conservation Zone (MCZ) Network on the Deployment of Offshore Renewables
R/3981/1 4 R.1763
Scenarios developed to inform the NREAP indicated that the UK could generate around 30% of its electricity from renewable sources by 2020, around half of which might come from offshore wind with a small contribution from wave and tidal energy developments. The NREAP set out an indicative scenario for achieving the 15% target which included the potential deployment of 13 GW offshore wind. However, it also indicated that this was only one possible scenario and this does not represent a fixed target for the sector. As above, this is dependent on investment in different renewables technologies, and decarbonisation targets will require more offshore wind. DECC’s Offshore Energy Strategic Environmental Assessment (SEA) (DECC, 2009b) stated that 33GW of offshore wind could be acceptable in environmental terms (in the UK Renewable Energy Zone and English and Welsh territorial waters – Scotland and Northern Ireland are conducting SEAs for their territorial waters). The Crown Estate (2010) currently has in place leases, agreements for lease and exclusivity agreements for roughly 48GW of capacity. There are also no specific targets for wave and tidal energy generation. The Marine Energy Action Plan (HM Government, 2010c) recognises that marine renewable energy could play an important role in the period to 2020 as the sector begins to roll out larger arrays of devices, followed by large scale deployment in the period beyond 2020 to help to meet the Government’s policy for an 80% cut in carbon emissions by 2050. The Action Plan recognises that 1-2GW of wave and tide installed capacity could be achieved by 2020 with a conservative estimate of 2.6GW in UK waters by 2030. Much of the exploitable resource is located in Scottish waters and a significant proportion of early development may take place there, with possibly lower levels of development in English waters. If a good proportion of tidal range projects that are planned (e.g. Mersey, Solway), come to fruition, a deployment level for tidal range developments of 1GW by 2020 could be achievable.
1.3 Project Objectives The main objective of the study has been to quantify what impact a newly created MPA network could have on the potential for offshore renewables to contribute to meeting the UK’s 2020 renewable energy targets and 2050 emissions reductions targets. In particular, the study has sought to provide an indication of the following: The proportion and value of proposed offshore wind deployment that could realistically
be affected by and be at risk as a result of new MCZ designations (2020 and beyond); The proportion of the wave and tidal energy resource (and the socio-economic value of
that resource) that could realistically be affected by and be at risk as a result of new MCZ designations (2020 and beyond); and
What additional project costs might realistically be incurred by developers of a) offshore wind and b) wave and tidal energy developments as a result of new designations and how that would be likely to affect project financing.
The study has been undertaken at a strategic level to report cost impacts at a regional and national scale and has been designed to help DECC input to the MCZ project at a national level. If appropriate, the outputs of the study may be fed into the regional MCZ projects but this is not the primary purpose of the undertaking this work, as each of the Regional Projects will have its own impact assessment.

Quantifying the Potential Impact of a Marine Conservation Zone (MCZ) Network on the Deployment of Offshore Renewables
R/3981/1 5 R.1763
The report has sought to interpret potential cost impacts in terms of the implications for the projected overall investment in offshore wind and wave and tidal development, project financing, jobs, the supply chain and renewable energy targets. The study has been conducted between December 2010 and February 2011 and has been overseen by a Steering Group comprising DECC ORT, The Crown Estate (TCE) and Defra.
2. Methodology
2.1 Introduction The designation of MCZ has the potential to affect offshore renewables interests in a number of ways including: Increased costs to developers associated with planning, pre-planning, construction,
operation and decommissioning of offshore renewables infrastructure as a result of requirements for additional management measures to support achievement of MCZ conservation objectives;
Increased costs to developers associated with project delays (i.e. delays in revenue streams) due to the longer time scales to achieve consent;
Increased costs of project financing due to perceived increases in risks to project delivery;
Delay or reduction to investment in offshore renewables affecting contributions to GVA and jobs; and
Delay or failure to progress in achieving climate change targets. The scale of these impacts will be strongly influenced by the spatial extent of overlap between offshore renewables interests and MCZ features and the nature and cost of the management measures that might be imposed through conditions in marine licences. A key focus of the study has therefore been to seek to quantify the potential extent of spatial overlap between existing and future offshore renewables interests and to explore possible requirements for management measures and their associated costs. This information has then been used to explore the potential wider consequences for overall deployment of offshore renewables in English waters. The development of Marine Protected Area (MPA) network proposals including identification of conservation objectives and possible management measures is a continuing process and firm recommendations will not be produced by the Regional Projects until August 2011. Similarly details of future offshore renewables development are necessarily uncertain, particularly in the longer-term. The study has therefore been progressed through the development of a range of network options and management scenarios to seek to take account of this uncertainty. In doing this, the study outputs are also future proof to some extent and will usefully inform later iterations of MCZ proposals. Nevertheless, the results from the study should necessarily be seen as indicative at this stage as more detailed estimation of cost impacts will only be possible
Quantifying the Potential Impact of a Marine Conservation Zone (MCZ) Network on the Deployment of Offshore Renewables
R/3981/1 6 R.1763
once offshore renewables plans are clarified and site boundaries, conservation objectives and management measures are known. The evaluation of the costs of potential management measures has been undertaken through completion of the following steps: Defining MCZ network options; Defining management measure scenarios (which identify the rules that will determine
the circumstances in which different types of measures will be applied); Defining potential management measures and costs; Spatial analysis of interaction between MCZ network options and offshore renewables
interests to characterize the nature and spatial extent of any incompatibilities; and Assessment of cost impact of alternative scenarios for each network option - this
brings the information from the previous two tasks together and estimates cost impacts using standard unit costs for measures.
The implications of the potential costs of mitigation measures have then been evaluated in terms of their potential impact on investment, jobs, renewable energy targets and carbon reduction targets.
2.2 Defining Options Four broad MCZ network options have been developed and assessed. The options differ in the extent of spatial overlap between potential MCZ and offshore renewables interests on the basis that the extent of spatial overlap is likely to be a key driver of the costs of management measures (ABPmer et al., 2007). The options have included the 2nd iteration networks developed by the Regional Projects (Option 1). The 2nd iteration networks have also been taken as a starting point for the development of two further options which assume proportionately lower and higher extents of spatial overlap between MCZ and offshore renewables interests compared to the 2nd iteration networks (Options 3 and 4) (see Appendix B). A further network option has been assessed that was developed independently of the regional MCZ process (Option 2) which provides a useful comparison with 2nd iteration outputs. The four options comprise: Option 1: 2nd iteration networks (including sub-options to take account of co-location/no
co-location in Finding Sanctuary and Irish Sea Regions). It has been assumed that all these networks broadly meet the ENG criteria (SAP responses largely confirm this);
Option 2: Illustrative network based on ABPmer (2010a). This study developed a number of hypothetical MCZ networks which aimed to meet the ecological network criteria while avoiding socio-economic interests;
Option 3: an illustrative network which assumes a lower spatial overlap between MCZ and offshore renewables interests compared to the 2nd iteration networks (approximately 50% of 2nd iteration overlap); and
Option 4: an illustrative network which assumes a higher spatial overlap between MCZ and offshore renewables interests compared to the 2nd iteration networks (approximately 200% of 2nd iteration overlap).
Quantifying the Potential Impact of a Marine Conservation Zone (MCZ) Network on the Deployment of Offshore Renewables
R/3981/1 7 R.1763
The options have been designed to cover a range of possible outcomes to the MCZ designation process to seek to ensure that project outputs can usefully inform subsequent iterations of network design. Thus, the publication of the 3rd iteration and subsequent iterations will not materially affect or date the results and conclusions of the study. The locations of potential MCZs used in Options 1 and 2 are presented in Figures A1 and A2 (Appendix A). Options 3 and 4 have been defined as proportional variations to the 2nd iteration networks and it is therefore not possible to represent these spatially. In order to develop cost estimates for the options, in addition to information on spatial overlap between potential MCZ and offshore renewables interests, it is also necessary to have information on the possible conservation objectives for each site (for example, whether the objective is to maintain or recover features to favourable condition or to reference condition). Furthermore, it is necessary to understand which features are to be protected within each site and whether there are additional features (e.g. birds, marine mammals, fish) to be protected within the site.
2.2.1 Option 1 The 2nd iteration network proposals are at various stages of completeness. The Net Gain outputs (Net Gain, 2010) provide information on the location of potential MCZ and Broad Areas of Interest (BAI) and the features that are to be protected, including additional features (birds, marine mammals, fish). They also provide an indication of which sites might include Reference Areas but not where such sites might be. The Finding Sanctuary outputs (Finding Sanctuary, 2010) identify the locations of building blocks (BAI) which may be put forward as draft MCZ, the features proposed for protection and the extent to which they meet ENG criteria. No information is provided on possible conservation objectives. The Irish Sea and Balanced Seas 2nd iteration outputs (Irish Sea Conservation Zones, 2010; Balanced Seas, 2010) only identify the location of BAIs/pMCZ and limited information on the extent to which these possible areas meet ENG criteria. They do not provide information on conservation objectives or additional features to be protected. For some regional networks, alternative options have been put forward, particularly in relation to issues of possible co-location with offshore wind farms (Finding Sanctuary and Irish Sea). The Net Gain outputs identify both a series of dMCZ (which very largely meet ENG criteria) and a series of further large BAIs which have also been identified as potentially contributing to the regional network. In defining Option 1 for each region, the following assumptions have been made: Spatial extent of 2nd iteration sites:
- For Finding Sanctuary and Irish Sea the ‘no co-location with offshore wind farms’ options have been used (the co-location options have been assessed as sub-options);
- For Net Gain, only the dMCZ sites have been used (on the basis that these very largely meet the ENG criteria);
- For Balanced Seas all the BAIs have been included;
Quantifying the Potential Impact of a Marine Conservation Zone (MCZ) Network on the Deployment of Offshore Renewables
R/3981/1 8 R.1763
Location and Extent of Reference Areas - these have not been defined in the 2nd iteration outputs. The relative proportion of total potential MCZ area that might be designated as Reference Area has been estimated based on the number of broad-scale habitats within each MCZ Region and a notional minimum size of each Reference Area (see Assumption 5, Appendix B); and
Inclusion of additional features within MCZs - only the Net Gain 2nd iteration includes an indication of which sites might include additional bird, marine mammal or fish features. The proportion of MCZ Regions containing bird only, marine mammal only, fish only or multiple features was calculated for Net Gain Region and these proportions were applied to the other MCZ Regions (see Assumption 11, Appendix B).
2.2.2 Option 2
Option 2 has been based on a previous research study which explored MCZ network options incorporating socio-economic factors in network design using an MPA planning tool - Marxan (ABPmer, 2010a). Through this study a number of different network designs were developed for the English MCZ regions which broadly met ENG criteria while incorporating socio-economic interests in a variety of different ways. In particular, some of the scenarios sought to steer site selection away from areas of socio-economic importance using functionality within the Marxan tool. The scenario selected for inclusion in this study (Scenario 6) sought to strongly steer site selection away from all major socio-economic interests while locking-in existing and impending Special Areas of Conservation (SAC) within overall network design, thus minimising the extent of areas that might need to be designated as MCZ. This option produced an MCZ network area that was slightly smaller than 2nd iteration networks. It provides a useful comparison to Option 1 as it has been developed independently from the work of the Regional Projects. Estimates of the proportion of the potential networks that might be Reference Area and the proportion of sites supporting additional features have been determined in a similar manner to Option 1.
2.2.3 Options 3 and 4 Options 3 and 4 seek to extend the range of spatial overlap between potential MCZ and offshore renewables interests. The high and low options were based on the judgements of the study team in consultation with the Project Steering Group (see Assumption 1, Appendix B). In broad terms Option 3 assumes a spatial overlap between offshore renewables interests and MCZ networks that is approximately 50% of Option 1, while Option 4 assumes an overlap that is approximately 200% of Option 1. Estimates of the proportion of the potential networks that might be Reference Area and the proportion of sites supporting additional features have been determined in a similar manner to Option 1.
2.3 Defining Scenarios There is currently considerable uncertainty concerning the potential requirements for management measures, reflecting uncertainties about the conservation objectives that will be set for individual sites, the significance of any incompatibility between offshore renewables

Quantifying the Potential Impact of a Marine Conservation Zone (MCZ) Network on the Deployment of Offshore Renewables
R/3981/1 9 R.1763
activities and MCZ features and the judgements that will be made by regulators and conservation advisors. NE & JNCC (2011) provides guidance on conservation objective setting. Two main types of conservation objective will be established: Favourable Condition this will take one of two forms:
- Objectives to maintain the condition of features, where they are considered to already be in favourable condition;
- Objectives to recover the condition of features, where they are considered not to be in favourable condition; and
Reference Condition in which all extraction, deposition or human-derived disturbance are likely to be prohibited. The ENG includes guidance on the requirements for Reference Areas. Additional draft guidance has also been prepared (JNCC and NE, 2010b).
The requirements for management measures will largely be determined by: The conservation objectives proposed for the site (Favourable Condition, Reference
Condition); Current/anticipated extent of incompatibility between human activities and achievement
of conservation objectives (linked to feature sensitivity to pressures associated with human activity); and
Judgements of MCZ Regional Projects, the Statutory Nature Conservation Bodies (SNCBs) and the Marine Management Organisation (MMO).
The MCZ Project has compiled various information on the sensitivity of MCZ features to human pressures (ABPmer & MarLIN, 2010) and made linkages between human activities and human pressures. This has been incorporated into a compatibility tool (PRISM) by Net Gain as a means of indicating where human pressure may require additional management measures to support achievement of conservation objectives. However, outputs from the tool still require a significant level of interpretative judgement. In its response to the 2nd iteration reports, the SAP commented that certain broad-scale habitats are likely to be considered to be compatible with offshore wind farm development where the conservation objective relates to protecting representative habitat (i.e. where the objective is to maintain favourable condition). These broad-scale habitats include: Subtidal Coarse Sediment (EUNIS level 3 habitat A5.1); Subtidal Sand (EUNIS level 3 habitat A5.2); Subtidal Mud (EUNIS level 3 habitat A5.3); and Subtidal Mixed Sediments (EUNIS level 3 habitat A5.4). The possible outcomes of deliberations on the requirements for management measures are: The activity is compatible with the achievement of site conservation objectives for the
feature(s) with which it interacts and thus no additional management measures are required (no restriction);
Quantifying the Potential Impact of a Marine Conservation Zone (MCZ) Network on the Deployment of Offshore Renewables
R/3981/1 10 R.1763
The activity can be made compatible with the achievement of site conservation objectives by applying additional management measures to reduce impacts (partial restriction); and
The activity is not compatible with the achievement of site conservation objectives. The activity can only proceed if it is relocated (e.g. relocation of proposed wind farm, cable route (detour round, under (Horizontal Directional Drilling (HDD))) (full restriction).
In addition, there is also some uncertainty concerning the contribution that existing (or impending) SAC management measures might make to the achievement of MCZ objectives where such sites are co-located and thus whether and the extent to which additional measures might be required in these areas. In the light of these uncertainties, the study has adopted a scenario approach in identifying where potential management measures might be required (and their associated costs). Two main scenarios have been applied to seek to identify the likely range of possible outcomes on the requirements for management measures: ‘Low estimate Scenario’ (Low Scenario) - the following assumptions have been made
about the requirements for management measures: - The selection of Reference Areas will avoid all existing and proposed OWF
arrays and existing export cables (See Assumption 11, Appendix B); - The location of Reference Areas will largely avoid future cable routes; where
this is not possible, cable routes will need to divert around Reference Areas (See Assumptions 9 and 11, Appendix B);
- No management measures will be required in areas where offshore renewables interests overlap with habitats that are deemed not to be sensitive to offshore renewables activities (the four broad-scale habitats identified above);
- Where MCZ overlap with SAC it has been assumed that existing management measures are already sufficient to support achievement of MCZ objectives; and
- Where incompatibilities exist, these can be addressed using low cost mitigation measures and/or costs will be towards the lower end of cost estimate ranges.
‘High Estimate Scenario’ (High Scenario) - the following assumptions have been made about the requirements for management measures: - Reference Areas will overlap with existing cables and future offshore
renewables interests in proportion to the total overlap with MCZ1; additional management measures will be required in areas of overlap (See Assumptions 9 and 11, Appendix B);
- Management measures for habitats will be required for all areas of spatial overlap between potential MCZ and offshore renewables interests outside of SACs irrespective of sensitivity;
1 The overlap with existing arrays has been excluded on the basis that Reference Areas are seeking to avoid co-
location with socio-economic activities. The assumption is likely to be conservative because MCZ Regional Projects will generally also be seeking to avoid co-locating Reference Areas with future OWF areas or cable routes.

Quantifying the Potential Impact of a Marine Conservation Zone (MCZ) Network on the Deployment of Offshore Renewables
R/3981/1 11 R.1763
- Where MCZ overlap with SACs it has been assumed that existing management measures are sufficient to support achievement of MCZ objectives for habitat features but that further measures will be required to protect additional MCZ features; and
- Where incompatibilities exist, these will need to be addressed using higher cost mitigation measures and/or costs will be towards the higher end of cost estimate ranges.
The scenarios do not distinguish between sites for which the conservation objective is to ‘maintain’ or to ‘recover’ features because the study team considers that in most cases this distinction will not have particularly significant implications for the management measures that the offshore renewables sector may be required to apply. However, it is possible that management measures could vary to some extent between these two objectives.
2.4 Defining Potential Management Measures and Costs There is a range of existing information on requirements for potential management measures in protected marine sites and in relation to offshore renewables activities, including: Inshore SAC Impact Assessments (Natural England, 2010); Round 3 Offshore Wind Habitats Regulations Appraisal (Entec, 2009); Pentland Firth Strategic Area Wave and Tidal Leasing Round Habitats Regulations
Appraisal (ABPmer, 2010b); and Habitats Regulations Appraisal for draft Offshore Wind Energy Plan in Scottish
Territorial Waters (ABPmer, 2011). This information has been used to identify possible management measures that might be applied to activities through the project life cycle (planning/pre-development, construction, operation and decommissioning) for offshore wind, wave and tidal development to avoid or reduce impacts to relevant features (habitats and benthic species, birds, marine mammals and fish). Initial lists of possible management measures were circulated to offshore wind, wave and tidal developers for comment. This process highlighted the difficulty of distinguishing between management measures that might be required anyway and measures that might be additionally required to address specific issues associated with a designated site. For example, some measures will be required based on the occurrence of nature conservation features, irrespective of whether the features are protected by specific designations. Furthermore there is limited directly relevant experience in the offshore renewables sector of identifying and implementing management measures for designated sites and where examples exist these are often exceptional cases from which it may be inappropriate to generalize. In particular, there is a dearth of information on management measures associated with operation and decommissioning, reflecting the limited experience to date. In presenting possible requirements for management measures, the study has necessarily relied heavily on the expertise and judgement of the study team, informed by contributions from offshore renewables developers. This represents a key limitation and uncertainty for the study which is likely to remain until such time as there is greater clarity on
Quantifying the Potential Impact of a Marine Conservation Zone (MCZ) Network on the Deployment of Offshore Renewables
R/3981/1 12 R.1763
the requirements for management measures and detailed discussions have been concluded between developers and conservation advisors at project level. Information on the potential costs of management measures has been collated alongside the lists of possible measures, drawing on the information sources identified above and in discussions with offshore wind operating companies and developers. The costing of management measures is also highly uncertain, in particular because: There is limited published experience in the offshore renewables sector of
implementing measures specifically for conservation purposes, particularly in relation to operation and decommissioning;
Some costs are very volatile, for example cable costs have increased rapidly in the past few years, largely reflecting the increasing price of copper; and
The nature and scale of future development is, in many cases, substantially different from existing development and thus historic cost information may not be relevant.
Furthermore some of the costs are very variable. For example, the costs of seasonal delays significantly depend on the length of the delay, the implications for demobilization and remobilization of vessels and the extent of sunk investment in a project (for which there is an extended period during which this investment is not providing any return). While we have sought to capture such costs within the assessment, actual costs incurred by developers will be highly site and situation specific. For this analysis planning/pre-development and construction have been treated as capital costs and operating and decommissioning costs have been treated as operating costs (with decommissioning costs averaged over the operating life of the development). Summary tables of assumed management measures, indicative costs and information sources that have been used within the assessment are presented in Appendix C. In addition to the costs of management measures, offshore renewables developers may also incur a range of other costs as a consequence of MCZ designation, including: Costs of project delays or cancellations (costs incurred as a result of deferred revenue
streams or contractual commitments); and Increased costs of project financing due to perceived increases in risks to project
delivery. Information on these issues has been sought from offshore renewables developers working through the Renewable UK MCZ Group and Marine Group and wider DECC contacts.
2.5 Spatial Analysis A spatial analysis has been undertaken to identify the nature and extent of spatial overlap between Options 1 and 2 and offshore renewables interests. The spatial overlap for Options 3 and 4 has been assumed based on the calculated overlap for Options 1 and 2. Spatial data on offshore renewables interests included:

Quantifying the Potential Impact of a Marine Conservation Zone (MCZ) Network on the Deployment of Offshore Renewables
R/3981/1 13 R.1763
Existing (built/consented) offshore wind farm, wave and tidal arrays2; Existing (built/consented) offshore wind farm, wave and tidal array export cables2; Future (unconsented) offshore wind farm, wave and tidal arrays; Future (unconsented) offshore wind farm, wave and tidal array export cables and cable
routes; Locations of wave, tidal stream and tidal range resources:
- Potentially exploitable wave resources within: 12nm; 12-25nm; and >25nm - Potentially exploitable tidal stream resources: >2.5m/s mpcs; >1.5<=2.5 m/s
mpcs; and >1<=1.5m/s mpcs; - Locations of potential tidal range interest.
Further details on the nature and sources of spatial data used in the analysis are presented in Appendix D. The locations of offshore wind, wave, tidal stream and tidal range interests are shown in Figures A3 to A7. The approaches adopted for the spatial analysis differed between the various renewable energy interests and are described in Appendix E. To support the costing of the scenarios, the total spatial overlap for wind wave and tidal stream was broken down into the following categories: Total spatial overlap between potential regional MCZ and offshore renewables interest
(km² and number for arrays; km for cables); Total spatial overlap with estimated Regional Reference Area (based on a percentage
of total spatial overlap with Option 1); Area/length/number of spatial overlap for which objective is Favourable Condition
(Total spatial overlap minus Reference Area); and The Favourable Condition area was then subdivided into areas/lengths/numbers inside
or outside of existing (or impending) SAC and further subdivided into areas/lengths/numbers supporting sensitive or non-sensitive habitats (based on the proportions identified from the spatial analysis).
For possible tidal range developments a detailed spatial analysis was not possible and a more qualitative assessment was undertaken for these interests.
2.6 Cost Impact Assessment for Mitigation Measures The cost impacts for the different options and scenarios have been calculated using a simple spreadsheet model which has applied the scenarios and cost estimates for measures to the outputs from the spatial analysis. The assessment has been based on total costs at current prices including both capital costs (planning/pre-development and construction) and operating costs (operational costs and annualised decommissioning costs). Operating costs have been estimated over a period of 40
2 Our analysis assumed that around 7GW of offshore wind farm capacity will have been consented by the time
MCZs are formally designated in 2012, compared to the current value of just over 5MW.
Quantifying the Potential Impact of a Marine Conservation Zone (MCZ) Network on the Deployment of Offshore Renewables
R/3981/1 14 R.1763
years. This time period includes for potential decommissioning. The phasing of costs will depend on the phasing of proposed offshore renewables development. This has not been assessed in detail in this study and therefore it has not been possible to estimate discounted costs. It has also been assumed that developments will be constructed and decommissioned within the 40 year time period, although it is possible that many developments might choose to repower after 20 or so years, prolonging the life of the offshore wind farms to 40 years or more. Repowering may result in additional costs being incurred for MCZ management measures but there is currently a high level of uncertainty concerning the extent of works that might be associated with repowering and it has therefore not been included in the scope of the analysis.
2.7 Evaluation of Implications for Offshore Renewables The potential cost impacts of management measures have been collated at MCZ regional level and aggregated to national level. The cost impacts have then been interpreted in terms of potential impacts on the delivery of projected investment in offshore renewables, project financing, jobs, the supply chain and renewable energy targets for 2020 and 2050.
3. Cost Impacts
3.1 Estimated Costs of Management Measures for Offshore Wind, Wave and Tidal Stream
3.1.1 Extent of Spatial Overlap Table 2 summarizes the calculated extent of spatial overlap between potential MCZ and different aspects of offshore renewables interests for Options 1 and 2. The percentages for Options 3 and 4 are not presented here as they have been derived from Option 1 as project assumptions These percentages are shown in Appendix B (see Assumption 1). The extent of spatial overlap varies considerably between the various interests. For example, under Option 1 the spatial overlap between potential MCZ and existing OWF arrays ranges from 7% (no co-location) to 11% (co-location) affecting around 30% of all arrays. For future arrays, overlap with Option 1 ranges from 4% (no co-location) to 12% (co-location) but a lower proportion of arrays are affected (around 10%). There is also a high level of overlap between potential MCZ and existing and future export cables. There is very limited existing deployment of wave and tidal stream devices and the information therefore does not give a particularly good guide to potential future issues. The indicative assessment for future wave and tidal stream deployment suggests that a significant proportion of wave (20-30%) and tide arrays (37-100%) and export cable routes (15-100%) are captured within the potential MCZ options. Around 20-30% of broader wave resources and 20-35% of broader tidal stream resources are included in potential MCZ networks. While the information

Quantifying the Potential Impact of a Marine Conservation Zone (MCZ) Network on the Deployment of Offshore Renewables
R/3981/1 15 R.1763
on spatial overlap provides a gross indication of potential cost impacts, the actual cost impacts will also be governed by decisions on the requirements for management measures. Table 2. Percentage spatial overlap between offshore renewables interests and
potential MCZ
Offshore Renewables Interest Size of Resource (km²/km/ no.)
Option 1 (No co-location)
%
Option 1 (Co-location)
%
Option 2 %
Existing Wind Array (area) 4374 7 11 18 Existing Wind Array (number) 28 29 32 46 Future Wind Array (area) 8221 4 12 6 Future Wind Array (number) 76 9 13 8 Existing Wind Export Cable (length) 1650 43 45 75 Future Wind Export Cable (length) 4694 28 28 20 Existing Wave Array (area) 8 0 0 0 Existing Wave Array (number) 1 0 0 0 Future Wave Array (area) (resource within 12nm)
20 20 21 33
Future Wave Array (number) 10 20 21 33 Wave resource 12-25nm (area) 13038 21 23 19 Wave resource >25nm (area) 90447 32 32 16 Existing Wave Export Cable (length) 26 14 14 0 Future Wave Export Cable (length) 60 16 14 18 Existing Tide Array (area) 1 0 0 100 Existing Tide Array (number) 1 0 0 100 Future Tide Array (area) (resource >2.5m/s mpcs)
19 6 6 25
Future Tide Array (number) 2 37 37 100 Tidal stream resource >1.5m/s<=2.5m/s (area)
1314 18 16 21
Tidal stream resource >1m/s<=1.5m/s (area)
6223 33 34 37
Existing Tide Export Cable 1 0 0 100 Future Tide Export Cable 6 25 25 100
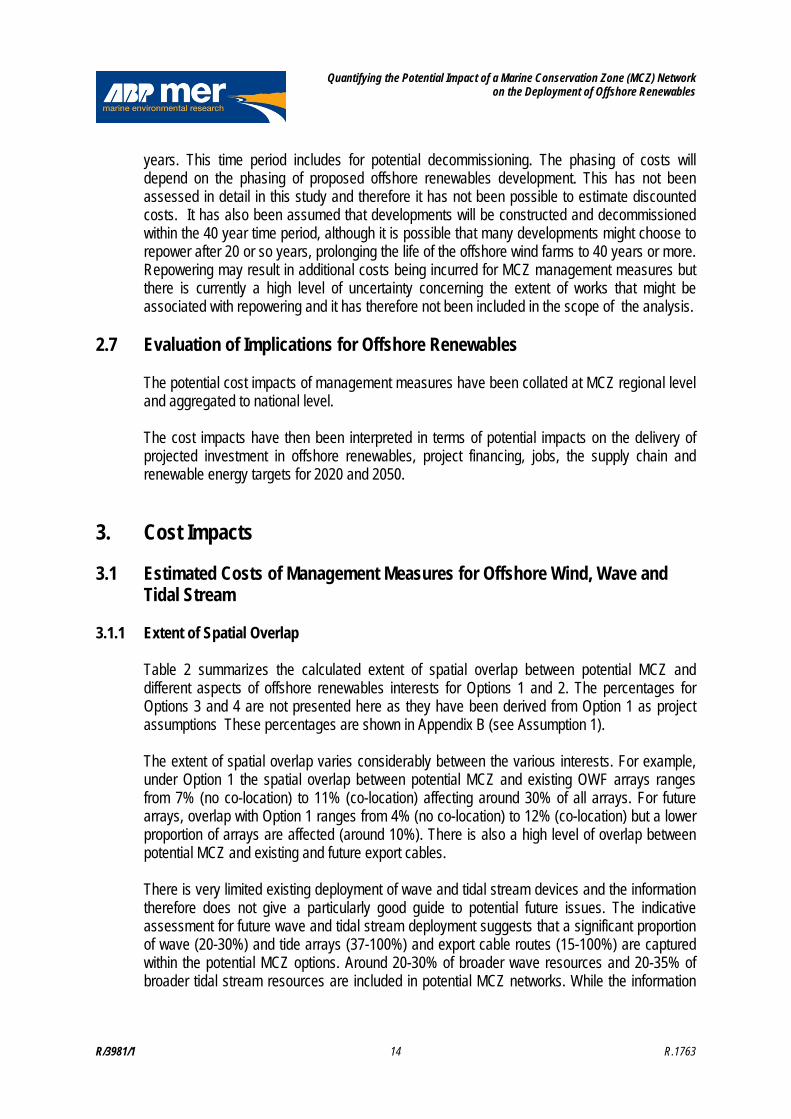
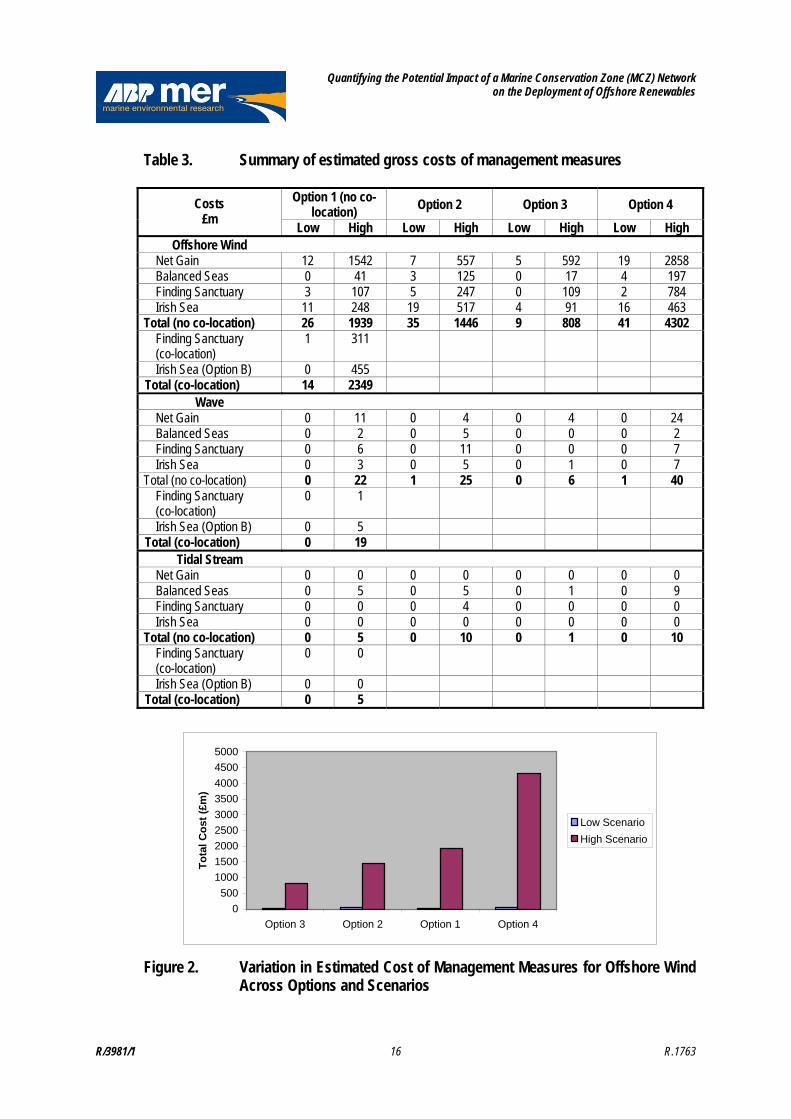
3.1.2 Estimation of Gross Costs Table 3 presents a summary of the potential total (undiscounted) costs3 of management measures for the four options under the low and high scenarios for wind, wave and tidal stream interests. Figures 2 to 4 provide a summary of the potential low and high scenario costs of management measures for each technology at national level. Figure 5 provides a summary of total costs relative to MCZ network size for the low and high scenarios. Detailed information for each Region, technology and option is provided in Appendix F.
3 Total costs include capital costs and operating costs (over 40 years) at current prices.
Quantifying the Potential Impact of a Marine Conservation Zone (MCZ) Network on the Deployment of Offshore Renewables
R/3981/1 16 R.1763
Table 3. Summary of estimated gross costs of management measures
Option 1 (no co-location)
Option 2 Option 3 Option 4 Costs £m
Low High Low High Low High Low High Offshore Wind
Net Gain 12 1542 7 557 5 592 19 2858 Balanced Seas 0 41 3 125 0 17 4 197 Finding Sanctuary 3 107 5 247 0 109 2 784 Irish Sea 11 248 19 517 4 91 16 463
Total (no co-location) 26 1939 35 1446 9 808 41 4302 Finding Sanctuary (co-location)
1 311
Irish Sea (Option B) 0 455 Total (co-location) 14 2349
Wave Net Gain 0 11 0 4 0 4 0 24 Balanced Seas 0 2 0 5 0 0 0 2 Finding Sanctuary 0 6 0 11 0 0 0 7 Irish Sea 0 3 0 5 0 1 0 7
Total (no co-location) 0 22 1 25 0 6 1 40 Finding Sanctuary (co-location)
0 1
Irish Sea (Option B) 0 5 Total (co-location) 0 19
Tidal Stream Net Gain 0 0 0 0 0 0 0 0 Balanced Seas 0 5 0 5 0 1 0 9 Finding Sanctuary 0 0 0 4 0 0 0 0 Irish Sea 0 0 0 0 0 0 0 0
Total (no co-location) 0 5 0 10 0 1 0 10 Finding Sanctuary (co-location)
0 0
Irish Sea (Option B) 0 0 Total (co-location) 0 5
0
500
1000
1500
2000
2500
3000
3500
4000
4500
5000
Option 3 Option 2 Option 1 Option 4
To
tal
Co
st (
£m)
Low Scenario
High Scenario
Figure 2. Variation in Estimated Cost of Management Measures for Offshore Wind Across Options and Scenarios
Quantifying the Potential Impact of a Marine Conservation Zone (MCZ) Network on the Deployment of Offshore Renewables
R/3981/1 17 R.1763
0
5
10
15
20
25
30
35
40
45
Option 3 Option 1 Option 2 Option 4
To
tal
Co
st (
£m)
Low Scenario
High Scenario
Figure 3. Variation in Estimated Cost of Management Measures for Wave Deployments Across Options and Scenarios
0
2
4
6
8
10
12
Option 3 Option 1 Option 2 Option 4
To
tal
Co
st (
£m)
Low Scenario
High Scenario
Figure 4. Variation in Estimated Cost of Management Measures for Tidal Stream Deployments Across Options and Scenarios
0500
100015002000250030003500400045005000
0 20000 40000 60000 80000 100000 120000 140000
Network Size (km2)
To
tal C
ost
(£m
)
Low Scenario
High Scenario
Figure 5. Variation in Estimated Cost of Management Measures with MCZ Network Size for All Offshore Renewables Interests
Quantifying the Potential Impact of a Marine Conservation Zone (MCZ) Network on the Deployment of Offshore Renewables
R/3981/1 18 R.1763
Total costs at national level range from £9m (Option 3, low scenario) up to £4.4bn (Option 4, high scenario). Virtually all of these costs are associated with existing and future OWF. Wave and tidal stream costs are predicted to be two orders of magnitude lower than offshore wind, reflecting the different scales of deployment assumed in the model (Table 3). A key feature of all the estimates is the large cost range between low and high scenarios. This reflects the current high level of uncertainty surrounding the requirements for and nature of management measures. For example, in Net Gain Region, the potential costs for offshore wind range from £12m up to £1.5bn under Option 1 (Table 3). The co-location of offshore wind development and MCZs in Irish Sea and Finding Sanctuary regions is estimated to potentially reduce cost impacts under the low scenario but to significantly increase cost impacts under the high scenario (increase from £1.9bn to £2.3bn Option 1 high scenario). Figure 5 indicates the relationship between MCZ network size and management measure costs to the offshore renewables sector based on assumptions about the notional size of MCZ networks in Options 3 and 4. With such limited data and a high level of uncertainty, the relationships should be seen as illustrative.
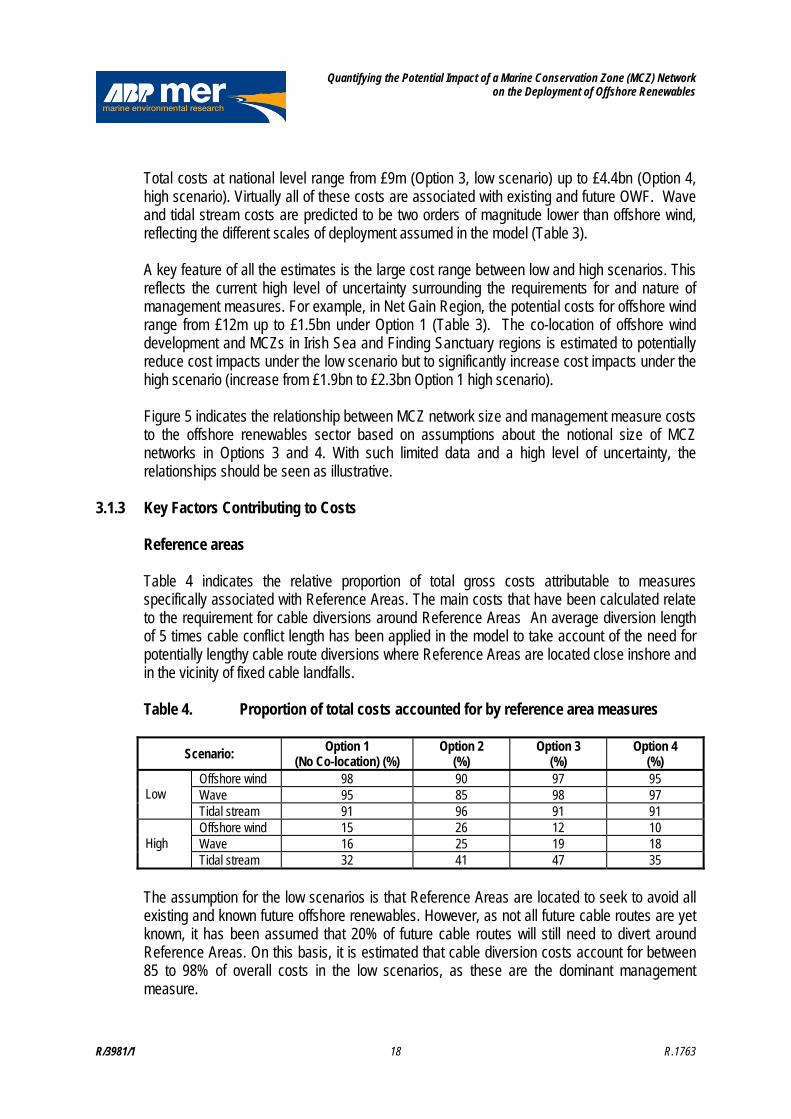
3.1.3 Key Factors Contributing to Costs
Reference areas Table 4 indicates the relative proportion of total gross costs attributable to measures specifically associated with Reference Areas. The main costs that have been calculated relate to the requirement for cable diversions around Reference Areas An average diversion length of 5 times cable conflict length has been applied in the model to take account of the need for potentially lengthy cable route diversions where Reference Areas are located close inshore and in the vicinity of fixed cable landfalls. Table 4. Proportion of total costs accounted for by reference area measures
Scenario: Option 1 (No Co-location) (%)
Option 2 (%)
Option 3 (%)
Option 4 (%)
Offshore wind 98 90 97 95 Wave 95 85 98 97 Low Tidal stream 91 96 91 91 Offshore wind 15 26 12 10 Wave 16 25 19 18 High Tidal stream 32 41 47 35
The assumption for the low scenarios is that Reference Areas are located to seek to avoid all existing and known future offshore renewables. However, as not all future cable routes are yet known, it has been assumed that 20% of future cable routes will still need to divert around Reference Areas. On this basis, it is estimated that cable diversion costs account for between 85 to 98% of overall costs in the low scenarios, as these are the dominant management measure.

Quantifying the Potential Impact of a Marine Conservation Zone (MCZ) Network on the Deployment of Offshore Renewables
R/3981/1 19 R.1763
In the high scenarios the principal driver of Reference Area costs is the potential requirement to divert future cables around Reference Areas, although it also includes a minor component for maintenance of existing cables. The costs are generally in the range 10 - 25% of total costs, with the exception of tidal stream, for which the proportion ranges from 32-47%. The indicative proportion of regional MCZ that might be designated as Reference Area varies considerably between the Regions (see Assumption 5, Appendix B): Balanced Seas (21.5%); Finding Sanctuary (9.6%); Irish Sea (27%) Net Gain (2.3%) The variation reflects the very different sizes of the Regions and the MCZ networks. It might be expected that in Regions with a higher indicative proportion of Reference Areas that this would impose significant additional constraints on cable routeing. While the model has used a notional factor of 5 times conflict length to estimate the potential cost impact, it should be recognised that where large Reference Areas are located inshore and in the vicinity of cable landfalls, this could require much longer cable diversions. This may be a particular issue in Net Gain and Irish Sea Regions where there is a significant overlap between proposed cable routes and potential MCZ. The cost model also assumes (in the high scenario) that Reference Areas may be located in areas of proposed offshore renewables arrays in proportion to the total overlap between offshore renewables interests and potential MCZ. However the model does not assign a cost where such issues arise and it has been assumed that proposed developments will relocate within areas of available resource. For Net Gain and Finding Sanctuary Regions the proportion of MCZ that might be designated as Reference Areas are relatively small. Assuming a proportional distribution of Reference Areas would suggest that any displacement of arrays would be likely to be minor. For Balanced Seas and Irish Sea Regions the proportion of MCZ that might be designated as Reference Areas is much larger; it could be assumed that a proportional distribution of Reference Areas might lead to more significant displacement of arrays. However, current proposals for MCZ in these Regions largely avoid co-location with arrays and this is therefore not a significant issue at present.
Offshore renewables interest elements Figure 6 illustrates the breakdown of potential costs by offshore renewables interest. The pie charts indicate that the principal costs are associated with future export cable route diversions (both to avoid Reference Areas and to divert around MCZ for which the objective is ‘Favourable Condition’). These account for between 47-56% of total costs in the high scenarios and 95-100% in the low scenarios. A significant proportion of costs are also associated with future arrays and future array cables.

Quantifying the Potential Impact of a Marine Conservation Zone (MCZ) Network on the Deployment of Offshore Renewables
R/3981/1 20 R.1763
Offshore Wind High Scenario Offshore Wave High Scenario Offshore Tide High Scenario
3%
22%
7%
54%
5%9%
7%
1%
56%4%
32%
2%
24%
0%
47%
0%
27%
Offshore Wind Low Scenario Offshore Wave Low Scenario Offshore Tide Low Scenario
1%
4%
95%
98%
2%
100%
Figure 6. Elements of Offshore Renewables Development Incurring Management Measure Costs
O f f s hor e W in d H igh S c e n a r io
3 %
2 2 %
7 %
5 4 %
5 %
9 %
Existing Array Future Array Existing Export Cable Future Export Cable Existing Array Cable Future Array Cable

Quantifying the Potential Impact of a Marine Conservation Zone (MCZ) Network on the Deployment of Offshore Renewables
R/3981/1 21 R.1763
MCZ feature type For the low scenarios, it has been assumed that no additional management measures will be required should additional features (birds, marine mammals and fish) be included within MCZ. Therefore all costs within the low scenarios are attributable to management measures for habitat features. For the high scenarios, export and array cable costs account for 75 to 90% of total costs. These costs are wholly driven by habitat management measures. For array costs, these are driven by a combination of habitat features and additional features. An examination of the cost model indicates that other features account for >95% of management measure costs in the high scenario for offshore wind and tidal stream. This suggests that roughly up to 25% of the total costs for offshore wind and tidal stream could be driven by other features (birds, fish and marine mammals). For wave, the equivalent factor is around 80% suggesting that around 20% of total costs could be driven by other features for wave developments.
3.1.4 Distribution of Costs Between Existing and Future Interests and Capital and Operating Expenditure To provide an indication of the relative cost impact of potential MCZ management measures, Table 5 below sets out the indicative average cost increases for existing and future offshore renewables interests expressed as capital and annual operating costs per MW of installed capacity. These values are also expressed as a percentage increase to existing capital and operating costs. Capital costs have been assumed to be £3.1m per MW installed for offshore wind (BWEA, 2009; Scottish Renewables, 2010) and £10m per MW installed for wave and tidal devices; operating costs (including decommissioning costs) have been assumed to be £80k per MW installed p.a. for all offshore renewables (Ernst & Young, 2009; Scottish Renewables, 2010)). However in reality, the costs will be focused on those projects where there is a potential incompatibility between offshore renewables interests and MCZ objectives. This is discussed in more detail below. Table 5. Indicative average capital and operating costs of MCZ management
measures per MW installed capacity
Operating Costs for Existing Interests
Capital Costs for Future Interests
Operating Costs For Future Interests Scenario £'000
per MW1 p.a. % Existing
Opex2 £'000
per MW3 % Capital
Cost4 £'000
per MW p.a. % Existing
Opex2
Offshore Wind Low Scenario 0.0 0.0% 0.0 0.0% 0.0 0.0% Option
1: High Scenario 0.1 0.1% 43.6 1.4% 0.4 0.5% Low Scenario 0.0 0.0% 0.1 0.0% 0.0 0.0% Option
2: High Scenario 2.5 3.2% 24.7 0.8% 0.2 0.3% Low Scenario 0.0 0.0% 0.0 0.0% 0.0 0.0% Option
3: High Scenario 0.7 0.9% 16.6 0.5% 0.1 0.1% Low Scenario 0.0 0.0% 0.0 0.0% 0.1 0.1% Option
4: High Scenario 4.0 5.0% 84.7 2.7% 0.8 0.9%

Quantifying the Potential Impact of a Marine Conservation Zone (MCZ) Network on the Deployment of Offshore Renewables
R/3981/1 22 R.1763
Operating Costs for Existing Interests
Capital Costs for Future Interests
Operating Costs For Future Interests Scenario £'000
per MW1 p.a. % Existing
Opex2 £'000
per MW3 % Capital
Cost4 £'000
per MW p.a. % Existing
Opex2
Wave Low Scenario 5 0.0 0.0% 0.0 0.0% Option
1: High Scenario 24.9 0.2% 0.1 0.1% Low Scenario 0.2 0.0% 0.0 0.0% Option
2: High Scenario 27.7 0.3% 0.1 0.1% Low Scenario 0.0 0.0% 0.0 0.0% Option
3: High Scenario 8.1 0.1% 0.0 0.0% Low Scenario 0.0 0.0% 0.0 0.0% Option
4: High Scenario 48.2 0.5% 0.1 0.1% Tidal Stream
Low Scenario 5 0.1 0.0% 0.1 0.1% Option 1: High Scenario 16.3 0.2% 1.3 1.7%
Low Scenario 0.1 0.0% 0.1 0.2% Option 2: High Scenario 42.4 0.4% 1.8 2.3%
Low Scenario 0.1 0.0% 0.0 0.0% Option 3: High Scenario 6.6 0.1% 0.3 0.3%
Low Scenario 0.3 0.0% 0.1 0.2% Option 4: High Scenario 35.1 0.4% 2.2 2.8%
1 Existing (consented) offshore wind capacity taken as 7217MW 2 Existing and future operating costs assumed to be £80k per MW installed p.a. (including decommissioning costs) 3 Future (unconsented) offshore wind capacity assumed to be 37.3GW; future wave capacity assumed to be 500MW and future tidal stream
capacity assumed to be 120MW 4 Capital costs per MW installed assumed as: offshore wind £3.1m; wave and tidal stream £10m 5 Figures not presented as there are very few existing wave or tidal stream deployments in English waters
Existing offshore wind The scale of average additional operating and decommissioning costs for existing offshore wind installations varies significantly between the low and high scenarios and between options. In the low scenario, no increased maintenance/decommissioning costs are identified; for the high scenarios additional costs range from 0.1- 5%. From Table 2, approximately one-third of existing arrays and around half of existing export cables overlap with potential MCZ. Thus, under the high scenario, actual operating/decommissioning cost increases experienced by those existing offshore wind installations operating in MCZ might be expected to be 2 to 3 times the values shown in Table 5 (0.3 to 15%).
Future offshore wind For future offshore wind interests, approximately 13% of future arrays and 30% of future export cable overlaps with potential MCZ for Option 1. Applying a factor of between 3 and 8 to the capital costs for the high scenario would indicate a capital cost increases of 5-11% for affected projects under this option. For future operating costs the potential cost increases would be smaller (up to 4%). The model suggests broadly similar levels of cost impact for the other options.

Quantifying the Potential Impact of a Marine Conservation Zone (MCZ) Network on the Deployment of Offshore Renewables
R/3981/1 23 R.1763
It is of note that the model indicates that the increases in operating costs for existing offshore wind installations will be relatively higher than those for future wind installations. This is because the model assumes that future offshore wind arrays and export cables will largely avoid spatial overlap with MCZ and thus additional operating and decommissioning costs will be reduced relative to existing installations.
Future wave No significant additional capital or operating/decommissioning costs are identified for future wave developments under the low scenarios. The average high scenario capital cost increases are less than 1%. From Table 2, approximately 20% of array and 14% of cable route overlaps with potential MCZ for Option 1. Applying these factoral adjustments to the capital cost would increase costs of affected projects by only around 1%. For operating/decommissioning costs the estimated average increase under Option 1 is 0.1% suggesting that affected projects would experience operational cost increases of less than 1%. The model suggests broadly similar levels of cost impact for the other options.
Future tide No significant additional capital costs are identified for future tidal stream developments under the low scenarios. Average additional operating/decommissioning costs are also considerably less than 1%. The average high scenario capital cost increases are generally very small. The additional capital costs on affected projects is likely to be a slightly greater proportion of total capital costs (up to 2%) compared to wave deployments, owing to the potential requirement for a greater level of pre-development monitoring. Operational costs for tidal stream arrays may be significantly greater than for wave arrays, again owing to additional monitoring requirements, particularly where there are additional MCZ features, such as marine mammals.
3.2 Estimated Costs of Management Measures for Tidal Range All tidal range sites considered are in the vicinity of SPAs and/or SACs (Figures A5 to A7). Of these sites, four are also in the vicinity of potential MCZ. The presence of European designated sites is likely to be the primary driver for management measures to address tidal range impacts. These measures would also be expected to be largely effective in mitigating and offsetting potential impacts to any additional MCZ features. Indicative costs for MCZ management measures for the four sites are presented in Table 6 in accordance with the assumptions in Appendix E.

Quantifying the Potential Impact of a Marine Conservation Zone (MCZ) Network on the Deployment of Offshore Renewables
R/3981/1 24 R.1763
Table 6. Indicative costs of management measures for tidal range sites
Location Indicative Installed Capacity (MW)1
Notional Cost of MCZ Management Measures (£m)
Balanced Seas: Thames 437 11.6 Solway 2002 5.3 Wyre 60 1.6 Irish Sea: Mersey 7003 18.6
1 Based on values indicated in AEA Technology & Hartley Anderson (in prep) unless stated otherwise. 2 Based on indicative scale tidal barrage suggested by Solway Energy Gateway
http://www.solwayenergygateway.co.uk/solway-energy-home.asp. 3 Based on an impounding barrage short listed as part of the Mersey Tidal Power Project (Peel Energy & North West Regional
Development Agency, 2010).
The total indicative costs for all potential barrages would be of the order of £40m.
3.3 Other Costs In addition to estimating the costs of management measures, the study has also sought to collate information on other sources of possible cost to offshore renewables development. For example a 1GW offshore wind farm array has the potential to generate power with an annual value of approximately £400m (at current electricity prices). A one year delay to such a project would forgo a profit stream associated with this income during that year. The scale of profit foregone would depend on the IRR for the project which typically might be of the order of 12% (Ernst & Young, 2009). In discussions, a number of offshore wind developers have indicated that the uncertainty surrounding development consents and associated environmental conditions has been a material factor in project financing discussions, although it has not been possible to obtain any specific data due to reasons of commercial confidentiality.
4. Implications for Offshore Renewables Development There are currently many pressures on the financial viability of offshore renewables developments and additional cost pressures arising from MCZ designation must be seen in this broader context. Construction costs for offshore wind have doubled over the past five years as a result of increases in raw material prices, currency fluctuations and a restricted supply chain (BWEA, 2009). Operating costs for offshore wind are also reported to have risen by c.65% over the last five years largely driven by greater experience of running such projects and also a change in O&M philosophy by offshore wind operators who now seek to adopt a more proactive maintenance approach with a view to extending the life of their assets (Ernst & Young, 2009). Economic viability is now seen as a major challenge to deployment for offshore wind projects. Indeed, several high profile investors have made strategic decisions to withdraw from offshore wind development in recent years including Shell and Fred Olsen Renewables. Ernst & Young
Quantifying the Potential Impact of a Marine Conservation Zone (MCZ) Network on the Deployment of Offshore Renewables
R/3981/1 25 R.1763
(2009) suggested that additional financial support may be required to ensure an adequate level of revenue to project developers, for example, an increase of the Renewables Obligation banding for offshore wind. Similar if not greater pressures apply to wave and tidal stream developments in seeking to move from prototypes through to commercial scale arrays.
4.1 Offshore Wind The designation of MCZ potentially introduce further significant costs for offshore wind development, although there is currently a high level of uncertainty concerning the scale of these costs. The analysis suggests that under the low scenario, the additional capital and operating costs are likely to be small, particularly in relation to other cost increases experienced over the past five years. Under the high scenario, cost increases could be larger (up to 5-11% of capital costs for affected projects under Option 1) and potentially significant. If these costs are taken as ‘the straw that breaks the camel’s back’ then a significant proportion of future investment could be put at risk. For example, 13% of future offshore wind arrays and around 30% of future export cable could potentially be affected under Option 1. However, this is an over-simplistic view, particularly in the light of other cost increases that have been absorbed in recent years and ignores the potential to increase the Renewables Obligation banding. In both the low and high scenarios, costs associated with cable route diversions are identified as the primary cost driver based on the assumptions used. In the high scenario, the costs of measures to address risks to other marine features contributed up to 25% of total costs. Potential conflicts with future cable routes pose a key risk. Onerous requirements to divert cables round or under MCZ could prejudice entire developments. This is particularly likely to be a concern if Reference Areas are designated in the vicinity of cable landfall points. The scale of the impacts associated with project delays and increased financing costs is very uncertain. Such issues are likely to form one of a number of considerations that investors take into account as part of decision-making. Owing to the uncertainties surrounding cost impacts it is difficult to predict the potential impacts on jobs or the achievement of renewable energy targets. Bain & Company (2008) suggest that there is the potential to create 36,000 full time equivalent jobs assuming a base case scenario of 27GW installed capacity of offshore wind by 2020 with a 35% retention rate4 for design and manufacturing. They indicate that job creation could be as high as 57,000 jobs assuming an installed capacity of 34GW and a 70% retention factor. The net numbers of jobs created is likely to be less than these totals as development of offshore wind will effectively displace jobs from other forms of energy generation. Furthermore, the numbers are very sensitive to assumptions about retention rates.
4 The retention rate represents the proportion of the supply chain provided nationally rather than from overseas.

Quantifying the Potential Impact of a Marine Conservation Zone (MCZ) Network on the Deployment of Offshore Renewables
R/3981/1 26 R.1763
The NREAP identified an indicative scenario of 13GW of offshore wind capacity by 2020. Currently around 5GW of offshore wind has been consented, suggesting that 8GW of additional offshore wind capacity would be required by 2020 to achieve this scenario, although it is recognised that the UK’s ambition is considerably greater than 13GW. DECC’s Offshore Energy Strategic Environmental Assessment (SEA) (DECC, 2009b) stated that 33GW of offshore wind could be acceptable in environmental terms (in the UK Renewable Energy Zone and English and Welsh territorial waters – Scotland and Northern Ireland are conducting SEAs for their territorial waters). The Crown Estate currently has in place leases, agreements for lease and exclusivity agreements for roughly 48GW of capacity. On this basis it is unlikely that MCZ designations would seriously compromise achievement of NREAP indicative scenario, unless a very large proportion of proposed development areas were delayed or cancelled. The scale of overlap between potential MCZ and unconsented offshore wind farms would not suggest that MCZ on their own would be a reason why the NREAP ‘indicative scenario’ was not achieved, although there may be an impact on higher government ambitions. The Offshore Valuation Report identified a large potential for longer-term offshore wind development both for fixed and floating installations with a potential combined installed capacity of over 300GW (The Offshore Valuation Group, 2010). While MCZ designations might constrain deployment opportunities at some of these locations, it is expected that significant potential for further offshore wind development would remain. This suggests that offshore wind would be able to make a substantial contribution towards the achievement of the 2050 target to reduce greenhouse gas emissions to at least 80% below 1990 levels.
4.2 Wave and Tidal Stream For wave and tidal stream developments, there is currently very limited understanding of the location and scale of future deployments. This assessment has focused on the most probable deployment areas for arrays (i.e. close inshore for wave, highest mean peak current speeds for tidal stream) and has made assumptions about the proportion of expected wave and tidal stream development to 2030 that may be located in English waters. The scale of the <12nm wave resource and the relatively low extent of spatial overlap with potential MCZ suggests that MCZ designation may not particularly constrain future wave deployment, although this necessarily remains uncertain. The areas of highest tidal stream resource (>2.5m/s, mpcs) in English waters are very limited. The scale of this resource significantly constrains opportunities for tidal stream deployments although more extensive resource >2.5m/s, mpcs occurs elsewhere in UK waters. Assuming that in the longer term, it becomes possible to exploit tidal stream resources between 1.5-2.5m/s mpcs, this resource is more widespread. The scale of overlap between this resource and potential MCZ is around 21%. This relatively low spatial overlap suggests that MCZ designation may not particularly constrain opportunities for future tidal stream deployment, although this remains uncertain. On this basis, MCZ designations in English waters would not necessarily impede progress towards a suggested combined installed capacity for wave and tidal stream of 2.6GW in UK waters by 2030.

Quantifying the Potential Impact of a Marine Conservation Zone (MCZ) Network on the Deployment of Offshore Renewables
R/3981/1 27 R.1763
4.3 Tidal Range All the potential tidal range locations have extensive existing designations under the Birds and/or Habitats Directives. Four of these locations, namely Thames, Solway, Wyre and Mersey also have potential MCZ designations within a distance of 10km. The additional total cost for potential MCZ measures has been estimated at around £40m for all four developments. Such additional costs are unlikely to significantly influence decisions on whether to proceed with these developments.
4.4 Data Gaps, Limitations and Uncertainties The study has made use of readily available sources of data. Not all existing offshore wind cable data could be acquired in the short time scales for the study. These gaps have been taken into account in the analysis and are not considered to materially affect study findings. There is limited information on the costs of maintenance and decommissioning of offshore renewables and on the additional costs that may be incurred operating within MCZ. Cost estimates for these elements have necessarily required the study team to make judgements based on discussions with project developers. Due to commercial confidentiality, no detailed information could be sourced from developers on the increased costs of project financing associated with projects affecting MPAs, although several developers stated that this was a material factor. There are significant uncertainties concerning the location of MCZ and the management measures that might be required. The study has sought to accommodate these uncertainties through the use of options and scenarios, although the latter result in very wide cost ranges, reflecting the current high levels of uncertainty. There are also significant uncertainties about the location and scale of future offshore renewables development and while the main areas for their future development over the next decade or so can be identified, the cable routes for many are poorly defined. Locations for offshore wind development beyond R3 are not yet established. For wave and tidal stream developments, while it is possible to identify areas of suitable resource, the locations for specific developments or associated cable routes cannot be defined. A number of assumptions have been made within the study to facilitate the cost impact assessment. The extent of uncertainty will reduce, particularly when the size and location of MCZs and the associated requirements for management measures become clearer. The cost model developed for the study has sought to encompass these uncertainties and can therefore be used to refine cost estimates through the further iterations of the MCZ process. Through discussions with developers, it became evident that there is a lack of clarity on the costs or effectiveness of management measures. Further research in this area would be helpful to provide consistent guidance on cost effective mitigation measures through offshore renewables project life cycles.

Quantifying the Potential Impact of a Marine Conservation Zone (MCZ) Network on the Deployment of Offshore Renewables
R/3981/1 28 R.1763
5. Conclusions The analysis has indicated that there is a substantial spatial overlap between offshore renewables interests and potential MCZ. For example, based on option 1 (2nd iteration networks) up to 30% of existing and 13% of future OWF arrays could be affected and up to 30% of future export cables. The cost impacts of MCZ are hard to quantify because of the underlying uncertainty concerning the detail of the management measures that might be required. This is reflected in the wide range in costs between the low and high scenarios. Across the options and scenarios, the range of potential total costs for management measures at a national level for all offshore renewables is estimated to range between £9m and £4.4bn. Virtually all of these costs are associated with offshore wind, reflecting the dominance of offshore wind - existing and planned developments could lead to an installed capacity of 44GW in UK waters. In contrast, the assessment has assumed that only 500MW of wave and 120MW of tidal stream are installed in English waters by 2030. The cost estimates for wave and tide are consequently much lower ranging from £0-40m and £0-10m respectively. Potential total additional costs associated with tidal range deployments were estimated at around £40m for four possible tidal range sites (Thames, Solway, Wyre and Mersey) with a combined installed capacity of around 1400MW. Capital costs associated with relocating export cables around MCZ (and particularly Reference Condition MCZ) are estimated to account for the majority of total additional costs based on the assumptions used. If Reference Areas are located in the vicinity of cable landfall points, this could be particularly costly for offshore wind developers and could preclude some developments. All of the costs in the low scenarios are driven by habitat measures (based on the assumptions applied) but in the high scenarios, up to 25% of the total costs for future offshore wind and tidal stream could be driven by other features (birds, marine mammals and fish) and 20% for future wave developments. These costs relate to additional monitoring requirements and mitigation measures to address issues of underwater noise and collision risks (tidal stream devices). The relative increases in capital and operating costs associated with MCZ management measures are relatively modest when averaged over offshore renewables development as a whole. However, costs will be focused on those sites and cable routes where incompatible overlaps occur with MCZ and therefore cost impacts to the affected sites will be substantially larger. The analysis suggests that the additional costs identified in the low scenarios are small; however, costs in the high scenarios are more significant, possibly up to 10% of capital or operating costs. Offshore renewables developers may also experience cost impacts as a result of project delays (delayed profits) and increased financing costs associated with greater uncertainty for projects located in MCZ. It has not been possible to quantify these costs for this study but developers have indicated that requirements to meet nature conservation objectives is a material factor in financing discussions.
Quantifying the Potential Impact of a Marine Conservation Zone (MCZ) Network on the Deployment of Offshore Renewables
R/3981/1 29 R.1763
It is difficult to assess the implications of possible cost increases for existing installations or future deployments. The offshore renewables sector has experienced very significant cost increases in the last five years and the scale of likely increases associated with MCZ designation is relatively minor in comparison. It is estimated that unconsented UK OWF developments will need to contribute around a further 8GW installed capacity by 2020 to support achievement of the Government’s 2020 renewable energy target, although it is recognised that the UK Government’s ambition for offshore wind significantly exceeds the NREAP ‘indicative scenario’. The risk that MCZ designations pose to the achievement of the 2020 target is considered low. In terms of wider ambitions and 2050 targets, the scale of practical resources is large, particularly for offshore wind. While MCZ designation may constrain the location of future offshore renewables deployment to some extent, the scale of the resources, particularly for offshore wind and wave, suggests large areas will remain suitable for future development. Therefore MCZ designations should not prevent offshore renewables from making a significant contribution to 2050 targets.
6. References ABPmer, RPA & Jan Brooke, 2007. Cost Impact of Marine biodiversity Policies on business - The Marine Bill. CR0378: Natural Environment Group Science Division. ABPmer 2011. Habitats Regulations Appraisal for draft Plan for Offshore Wind Energy in Scottish Territorial Waters. ABPmer, 2010a. Marine Conservation Zone Network Options. Report prepared for The Crown Estate, September 2010, ABP Marine Environmental Research Ltd, Report No. R. 1683. ABPmer, 2010b. Report to Inform an Appropriate Assessment for the Pentland Firth Strategic Area Leasing Round. Report for The Crown Estate, February, 2010. ABPmer & MarLIN, 2010. Development of a Sensitivity Matrix (pressures-MCZ/MPA features). Report No 22. Report to Defra, September 2010. AEA Technology plc & Hartley Anderson Ltd, in prep. Marine Energy Screening Study for England and Wales. Report to DECC, July 2010. Bain & Company, 2008. Employment opportunities and challenges in the context of rapid industry growth. Balanced Seas, 2010. Balanced Seas Marine Conservation Zone Project Second Progress Report, October 29th 2010. Black & Veatch, 2005. Phase II UK Tidal Stream Energy Resource Assessment, Carbon Trust British Wind Energy Association, 2009. UK Offshore Wind: Charting the Right Course. Scenarios for offshore capital costs for the next five years.

Quantifying the Potential Impact of a Marine Conservation Zone (MCZ) Network on the Deployment of Offshore Renewables
R/3981/1 30 R.1763
DECC, 2009a. The UK Low Carbon Transition Plan. DECC, 2009b. UK Offshore Energy Strategic Environmental Assessment Future Leasing for Offshore Wind Farms and Licensing for Offshore Oil & Gas and Gas Storage. Environmental Report. January 2009. Entec UK Ltd, 2009. Habitats Regulations Appraisal of the Round 3 Plan. Information to Inform an Appropriate Assessment. Report for The Crown Estate, December, 2009. Ernst & Young, 2009. Cost of and financial support for offshore wind. A report for the Department of Energy and Climate Change, April 2009. Finding Sanctuary, 2010. Second Progress Report Submitted to the Science Advisory Panel October 29th 2010. HM Government, 2010a. 2050 Pathways Analysis. July, 2010. HM Government, 2010b. National Renewable Energy Action Plan for the United Kingdom - Article 4 of the Renewable Energy Directive 2009/28/EC. HM Government, 2010c. Marine Energy Action Plan 2010 Executive Summary & Recommendations. Irish Sea Conservation Zones, 2010. Second progress report. November 10th, 2010. JNCC, 2009. UKSeaMap 2010. Project Description. September, 2009. JNCC and Natural England, 2010a. Ecological Network Guidance to Regional Stakeholder Groups on identifying Marine Conservation Zones 2010. JNCC and Natural England, 2010b. Marine Conservation Zone Reference Areas: Guidance document for regional MCZ projects Version 1.1 National Grid, 201. http://www.nationalgrid.com/NR/rdonlyres/CC4994A2-83C5-4990-9E0C-F8CE04DCA588/43378/Appendices2010_Final.pdf Natural England, 2010. Evidence Base for Designation of Inner Dowsing, Race Bank and North Ridge special Area of Conservation. Final Impact Assessment. July, 2010. Natural England and JNCC, 2010. Project Delivery Guidance on the process to select Marine Conservation Zones Version: Final July 2010. Natural England and JNCC, 2011. Conservation Objective Guidance. January 2011.

Quantifying the Potential Impact of a Marine Conservation Zone (MCZ) Network on the Deployment of Offshore Renewables
R/3981/1 31 R.1763
Net Gain, 2010. Progress Report for the 2nd Iteration. Submission to the Science Advisory Panel, October, 2010. Parsons Brinckerhoff, 2010. Strategic Environmental Assessment of Proposals for Tidal Power Development in the Severn Estuary. Options Definition Report Version 3, Volume 1. Report to DECC, April 2010. Peel Energy & North West Regional Development Agency, 2010. Mersey Tidal Power Feasibility Study. Stage 2 Options Report Summary. November 2010. Risk & Policy Analysts, ABPmer, Terence O’Rourke & Jan Brooke, 2006. Determining the Costs and Benefits of Current and Potential New Marine Management Arrangements. Report CSA 7207/ME1415 for Defra. November, 2006. Scottish Renewables, 2010. Scottish Offshore Wind: Creating an Industry Sustainable Development Commission, 2007. Tidal Power in the UK. SKM (2008) Quantification of Constraints on the Growth of UK Renewable Generating Capacity Sustainable Development Commission (2007) Turning the Tide, Tidal Power in the UK The Carbon Trust, 2006. Future Marine Energy. The Crown Estate. 2010. UK Offshore Wind Report 2010. The Offshore Valuation Group, 2010. The Offshore Valuation. A valuation of the UK’s offshore renewable energy resource. Published by the Public Interest Research Centre.

Appendices

Appendix A Figures

±
Option 1 Networks
DateFeb 11
ByNMW
SizeA4
Version1
3981 - Fig_2nd_Iterations.mxd
ScaleProjection Albers
© ABPmer, All rights reserved, 2011
NOT TO BE USED FOR NAVIGATION
0 100 20050km
Option 1 NetworksBalanced Seas
Finding Sanctuary
Irish Sea Conservation Zones
Net Gain
MCZ Regional ProjectsBalanced Seas
Finding Sanctuary
Irish Sea Conservation Zones
Net Gain
Produced by ABPmer Ltd
1:5,000,000
Figure A1
QA FMM
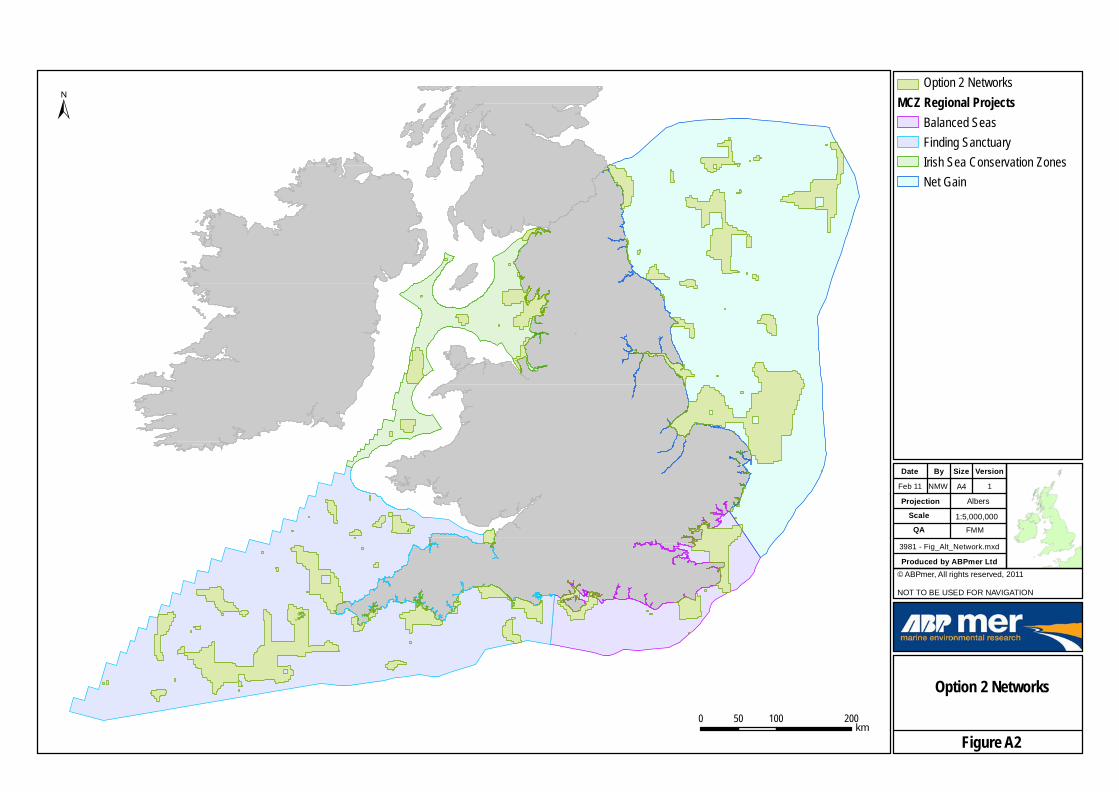
±
Option 2 Networks
DateFeb 11
ByNMW
SizeA4
Version1
3981 - Fig_Alt_Network.mxd
ScaleProjection Albers
© ABPmer, All rights reserved, 2011
NOT TO BE USED FOR NAVIGATION
0 100 20050km
Option 2 Networks
MCZ Regional ProjectsBalanced Seas
Finding Sanctuary
Irish Sea Conservation Zones
Net Gain
Produced by ABPmer Ltd
1:5,000,000
Figure A2
QA FMM

±
Wind Resources Within theMCZ Regional Project Areas
DateFeb 11
ByNMW
SizeA4
Version1
3981 - Fig_wind_resource.mxd
ScaleProjection Albers
© ABPmer, All rights reserved, 2011
NOT TO BE USED FOR NAVIGATION
0 100 20050km
Wind ResourcesExisting Wind Activity
Proposed Wind Activity
Existing Cables
Proposed Cables
MCZ Regional ProjectsBalanced Seas
Finding Sanctuary
Irish Sea Conservation Zones
Net Gain
Produced by ABPmer Ltd
1:5,000,000
Figure A3
QA FMM

±
Wave & Tidal Resourceswithin the MCZ RegionalProject Areas
DateFeb 11
ByNMW
SizeA4
Version1
3981 -Fig_wave_tide_resource
ScaleProjection Albers
© ABPmer, All rights reserved, 2011Data Sources: DECCNOT TO BE USED FOR NAVIGATION
0 100 20050km
Tidal ResourceExisting Tidal Resource
Future Tidal Resources >2.5m/s
Wave ResourceExisting Wave Resource
Future Wave Resource 0-12nm
MCZ Regional ProjectsBalanced Seas
Finding Sanctuary
Irish Sea Conservation Zones
Net Gain
Produced by ABPmer Ltd
1:5,000,000
Figure A4
QA FMM
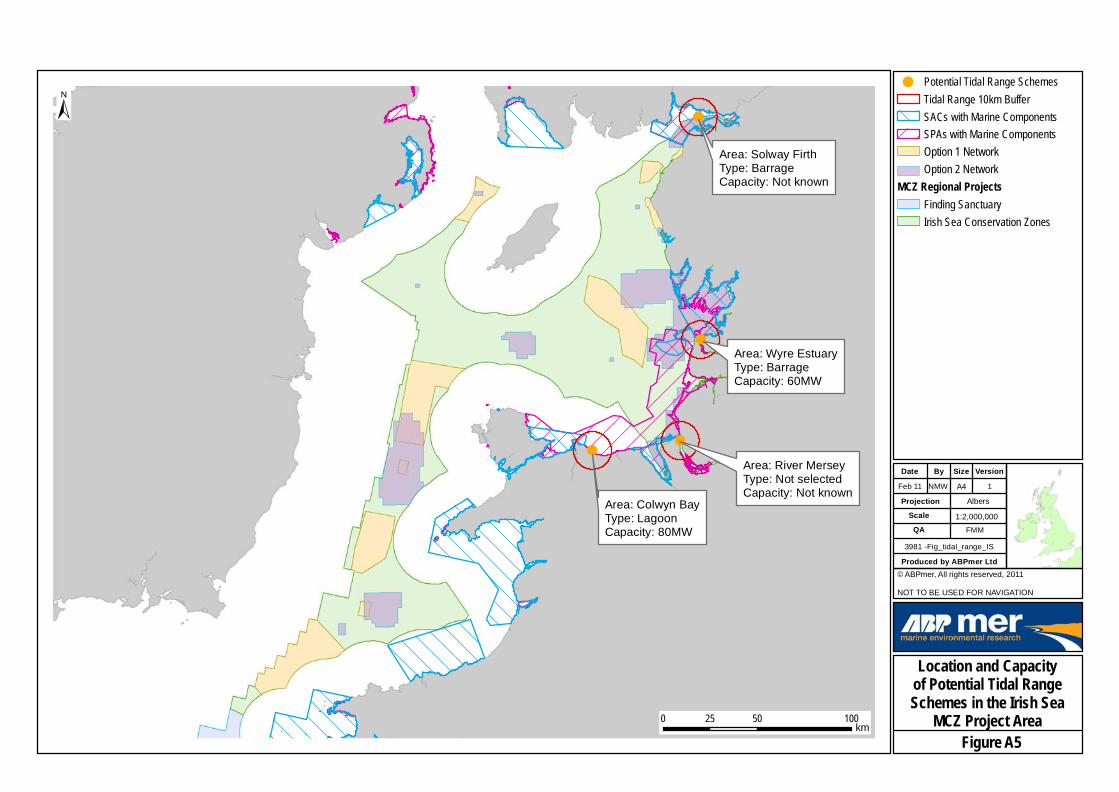
Area: Colwyn BayType: LagoonCapacity: 80MW
Area: River MerseyType: Not selectedCapacity: Not known
Area: Solway FirthType: BarrageCapacity: Not known
Area: Wyre EstuaryType: BarrageCapacity: 60MW
±
Location and Capacityof Potential Tidal RangeSchemes in the Irish SeaMCZ Project Area
DateFeb 11
ByNMW
SizeA4
Version1
3981 -Fig_tidal_range_IS
ScaleProjection Albers
© ABPmer, All rights reserved, 2011
NOT TO BE USED FOR NAVIGATION
0 50 10025km
Potential Tidal Range Schemes
Tidal Range 10km Buffer
SACs with Marine Components
SPAs with Marine Components
Option 1 Network
Option 2 Network
MCZ Regional ProjectsFinding Sanctuary
Irish Sea Conservation Zones
Produced by ABPmer Ltd
1:2,000,000
Figure A5
QA FMM
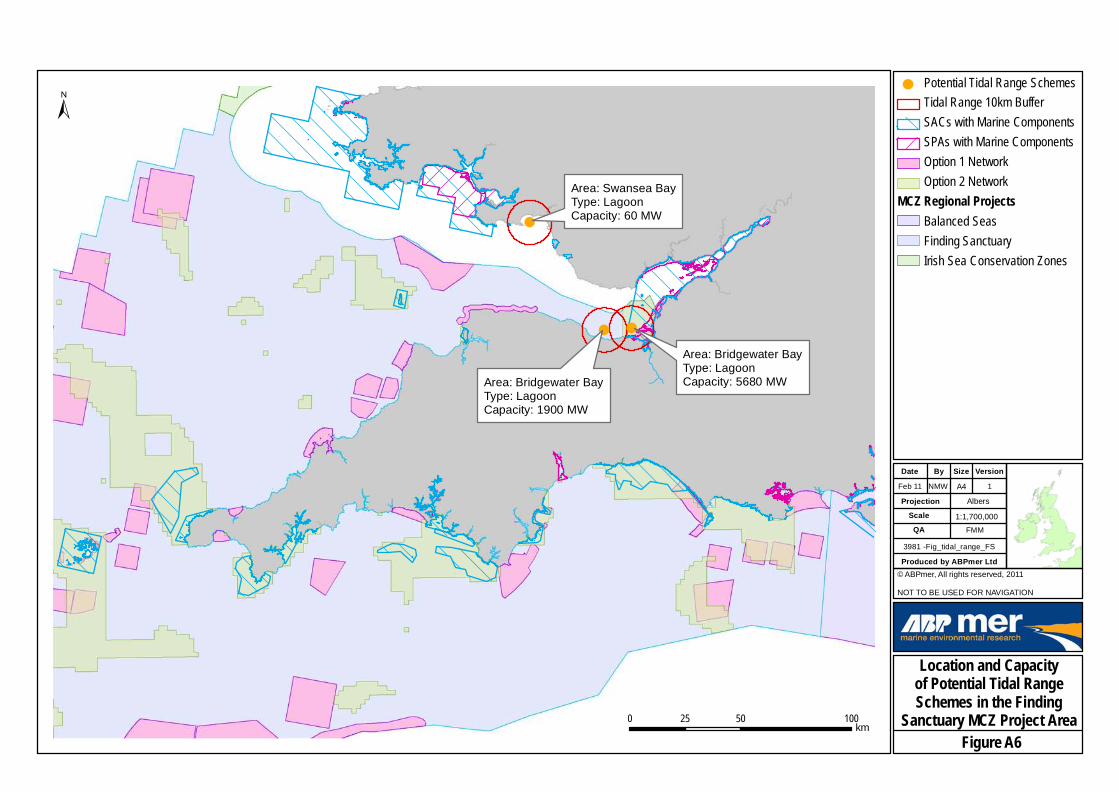
Area: Swansea BayType: LagoonCapacity: 60 MW
Area: Bridgewater BayType: LagoonCapacity: 1900 MW
Area: Bridgewater BayType: LagoonCapacity: 5680 MW
±
Location and Capacityof Potential Tidal RangeSchemes in the FindingSanctuary MCZ Project Area
DateFeb 11
ByNMW
SizeA4
Version1
3981 -Fig_tidal_range_FS
ScaleProjection Albers
© ABPmer, All rights reserved, 2011
NOT TO BE USED FOR NAVIGATION
0 50 10025km
Potential Tidal Range Schemes
Tidal Range 10km Buffer
SACs with Marine Components
SPAs with Marine Components
Option 1 Network
Option 2 Network
MCZ Regional ProjectsBalanced Seas
Finding Sanctuary
Irish Sea Conservation Zones
Produced by ABPmer Ltd
1:1,700,000
Figure A6
QA FMM
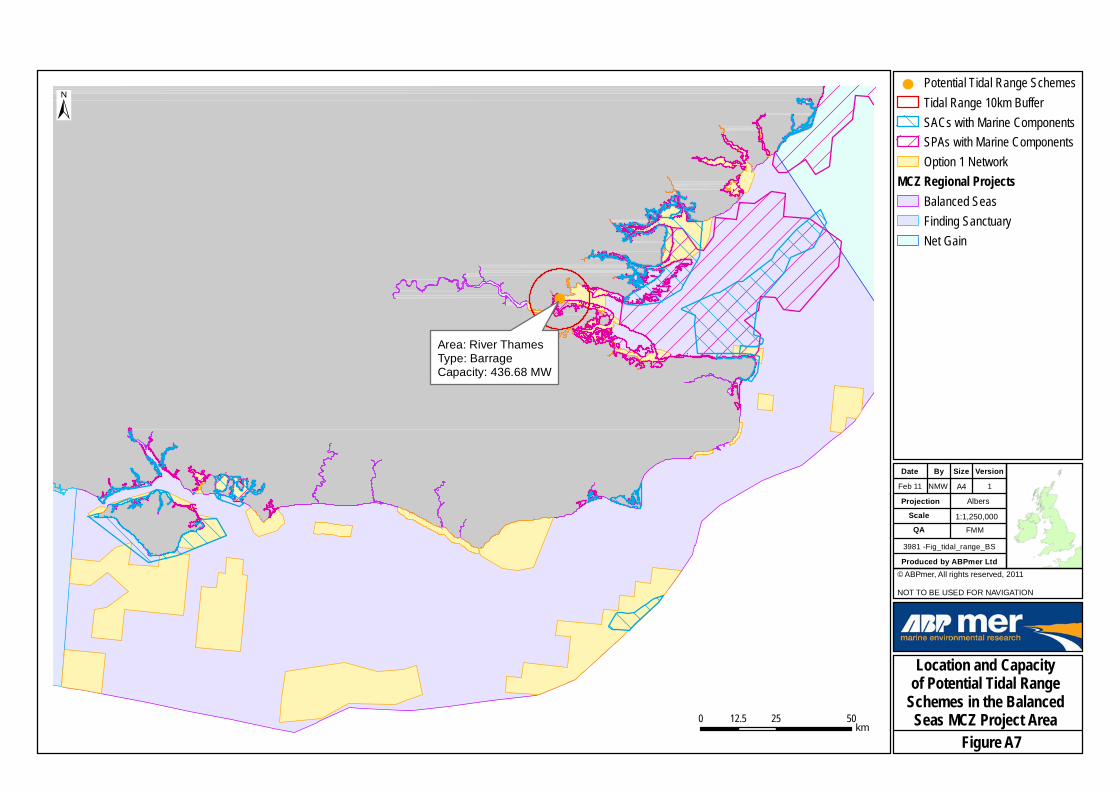
Area: River ThamesType: BarrageCapacity: 436.68 MW
±
Location and Capacityof Potential Tidal RangeSchemes in the BalancedSeas MCZ Project Area
DateFeb 11
ByNMW
SizeA4
Version1
3981 -Fig_tidal_range_BS
ScaleProjection Albers
© ABPmer, All rights reserved, 2011
NOT TO BE USED FOR NAVIGATION
0 25 5012.5km
Potential Tidal Range Schemes
Tidal Range 10km Buffer
SACs with Marine Components
SPAs with Marine Components
Option 1 Network
MCZ Regional ProjectsBalanced Seas
Finding Sanctuary
Net Gain
Produced by ABPmer Ltd
1:1,250,000
Figure A7
QA FMM

Appendix B Assumptions

Quantifying the Potential Impact of a Marine Conservation Zone (MCZ) Network on the Deployment of Offshore Renewables
R/3981/1 B.1 R.1763
Appendix B. Assumptions B1. Options Four options have been considered, two were based on possible MCZ networks (2nd iteration from the Regional Projects and alternative network), where the percentage spatial overlaps were determined for the main renewable energy interests. The other two options, namely low and high, have been selected to extend the range of spatial overlaps occurring in the other two possible MCZ networks. Factoral adjustments have been made to the 2nd iteration MCZ networks to provide values for the spatial extent, length or number of overlaps for the low and high options (Table B1). In general, low option values were approximately 50% of the spatial overlap for the 2nd iteration and the high option values approximately 200%, although this varied significantly across offshore renewable energy interest elements. Table B1. Percentage overlaps applied to options
Offshore Renewables Interest Element
Low Option Alternative Network
2nd Iteration (No co-location)
High Option
Existing Wind Array 10 18 7 60 Future Wind Array 1 6 4 10 Existing Wind Export Cable 20 75 43 95 Future Wind Export Cable 10 20 28 40 Existing Wave Array 0 0 0 100 Future Wave Array 10 33 20 50 Existing Wave Export Cable 0 0 14 30 Future Wave Export Cable 5 18 16 30 Existing Tide Array 0 100 0 100 Future Tide Array 5 25 6 40 Existing Tide Export Cable 5 100 0 100 Future Tide Export Cable 10 100 25 50
B2. Calculating Number of Arrays in R3 OWF Zones The spatial analysis calculates the proportion of spatial overlap between R3 zones and potential MCZs. However, the proportion of R3 zones that might be developed varies across the zones. It is therefore necessary to seek to identify the proportion each R3 zone that may be developed and then to adjust the calculated spatial overlap pro rata. This assessment has been undertaken using information contained in the Offshore Energy SEA (DECC, 2009b) and the scoping document for the R3 Habitats Regulations Appraisal (HRA) (Entec, 2009). The Offshore Energy SEA (DECC, 2009b) assumed that a 1GW installation may comprise 2 x arrays, occupying 260km² total area. The total number of arrays in each zone has been calculated below, based on indicative site capacities identified in the R3 HRA Scoping document (Entec, 2009). The proportion of zone area is also presented based on Entec (2009), and TCE (D. Tudor, pers comm 2/2/2011) see Table B2.

Quantifying the Potential Impact of a Marine Conservation Zone (MCZ) Network on the Deployment of Offshore Renewables
R/3981/1 B.2 R.1763
Table B2. Estimated total number of arrays in each zone
Regional Project Area (RP) R3 Zone
Indicative Zone Capacity GW1
Indicative No of Arrays2
Proportion of R3 Zone
Occupied by Arrays (%)3
Proportion of Regional Project
(%)4 Dogger Bank 13 26 39 Hornsea 4 8 22 Net Gain East Anglia 7 14 30
32
Balanced Seas Rampion 1.5 3 100 Balanced Seas/ Finding Sanctuary West of Isle of Wight 1.5 3 53
83
Finding Sanctuary Atlantic Array 2.5 5 68 61
Irish Seas Irish Sea 6 12 71 71 1 As referenced by Entec, 2009 2 Based on Entec, 2009 3 Based on Entec, 2009 4 Weighted proportion according to the size of the R3 Zone calculated by ABPmer
B3. Calculating the Number of Future OWF Arrays Intersected by Potential MCZ The spatial overlap of existing OWF arrays with potential MCZs was calculated, and this relationship was used to calculate the number of number of possible future arrays intersected by potential MCZs in each Region on a pro rata basis. B4. Calculating the Extent of Cable Overlap (Offshore Wind) The estimated length of overlap between cables and potential MCZ that is calculated within the GIS is based on a single linear route. However, this route often comprises multiple cables. It is therefore necessary to correct the calculated overlap to take account of the actual (or estimated) number of cables present within that route. Table B3 identifies the estimated number of cables based on assumptions about cable type together with the notional number of cables calculated in GIS. The lengths of overlap calculated in GIS have been adjusted to reflect the estimates of actual cable numbers before applying management measures to these overlaps in accordance with the scenario rules. For within array cable overlap, the same spatial overlap has been used as applied to the arrays, see Table B2. For length of within-array cable, an assumption of length = 1.25 x area of array was made based on information for Greater Gabbard OWF (RWE npower renewables pers. comm..).

Quantifying the Potential Impact of a Marine Conservation Zone (MCZ) Network on the Deployment of Offshore Renewables
R/3981/1 B.3 R.1763
Table B3. Notional cable overlap
Region/Zone Cable Type Assumed Number of Cables
Notional Number of Cables Assessed in
GIS Existing AC 38 16 Dogger Bank HVDC 13 3 Hornsea HVDC 4 4 East Anglia HVDC or AC 21a 7
Net Gain:
Other R2/R2.5 AC 5 2 Existing AC 10 8 Rampion AC 12 1 Balanced Seas: Other R2/2.5 AC 5 3 West of Isle of Wight AC 8 2 Finding Sanctuary Atlantic Array AC 13 3 Existing AC 9 9 Irish Sea HVDC or AC 17a 10 Irish Sea: Other R2/R2.5 AC 5 5
a Where choice of cable is uncertain the average of the indicative HVDC and AC numbers has been used.
B5. Calculating Size of Reference Areas within Each MCZ Region The ENG requires that one Reference Area (RA) for each BSH and Habitat FOCI is identified in each Regional Project Area. The BSH Reference Areas are to be a minimum of 5km diameter with an average size of 10 and 20km diameter. The Habitat FOCI Reference Areas vary in diameter according to ENG Table 7. Generally they are much smaller than BSH Reference Areas and will probably be nested within BSH Reference Areas. For the purposes of this assessment they have therefore been ignored. For each Region, a list of the BSHs present was drawn up and from this the number that provided a patch of at least 15km diameter was calculated. For those BSHs that were <15km diameter, the largest patch area was identified on the basis that this was the maximum size that the RA for that BSH could occupy. The total RA area was calculated as the sum of the individual areas for each BSH patch. The total RA is expressed as a proportion of total regional MCZ area in Table B4 below. Table B4 Reference area calculations
Region/Zone Indicative RA Area (km²)
Total 2nd Iteration Network Area (km²)
Percentage of 2nd Iteration Network Area (%)
Net Gain 757.8 32914.9 2.3 Balanced Seas 839.7 3905.2 21.5 Finding Sanctuary 1640.8 17116.5 9.6 Irish Sea 861.8 3193.7 27

Quantifying the Potential Impact of a Marine Conservation Zone (MCZ) Network on the Deployment of Offshore Renewables
R/3981/1 B.4 R.1763
B6. Calculating Indicative Size and Number of Wave and Tidal Arrays Information provided within the Wave and Tidal Screening Report (AEA Technology & Hartley Anderson, in prep) on the indicative size and number of arrays has been sourced as follows: Medium generation capacities for wave and tidal current were taken from the summary table on
page 29, Table 9 as 25MW km² for each. Section 5.2 suggests wave arrays will comprise of between 50 and 100 devices with 10 to 200
devices being deployed per km² i.e. an array will cover 0.5km² to 10km² . Section 5.2 also suggests that tidal arrays of up to 50 to 100 devices per array, with up to 100
devices per km² i.e. an array 0.5 between 5km² . It was therefore assumed that the average size of either a wave or tidal array = 2km². The Marine Energy Action Plan (MEAP) is aiming for a provision of 1-2GW from these forms of devices by 2020; Government agrees that this is achievable, with an increase to 2.6GW from wave and tidal in UK waters by 2030 (MEAP p19). In addition studies by UKERC ETI and FREDS suggest a provision of 2GW by 2020. The assessment has been based on a figure of 2.6GW in UK waters by 2030. It has been assumed that 120MW of tidal stream and 500MW of wave would be developed in English waters by 2030. This is based on an assumption that around 25% of tidal stream resource >2.5m/s mpcs might be exploited and that English waters would only make a modest contribution to the UK total. B7. Estimating Spatial Distribution of Future Wave and Tidal Devices It has been assumed that all wave devices deployed up to 2030 would use wave resource within 12nm, and that all tidal devices deployed up to 2030 would use tidal resource >2.5mpcs (based on AEA Technology and Hartley Anderson Ltd (in prep.)). From section 6 above, an output of 25MW per km² , had been assumed and the respective areas required for wave and tide arrays have been calculated. The areas of wave and tidal development were then assigned to the Regions pro rata to the regional resource. The number of arrays in each Region were calculated by assuming that an average size array covered an area of is 2km² . Table B5. Tide
Region/Zone Tidal Resource >2.5m/s (mpcs)
<12nm (km²)
Pro Rata Scale of Development
(MW Installed Capacity)
Indicative Number of Arrays
Net Gain 0 0 0 Balanced Seas 4.15 26 0.5 Finding Sanctuary 15.03 94 2 Irish Sea 0 0 0 Total 19.18 120 2.5

Quantifying the Potential Impact of a Marine Conservation Zone (MCZ) Network on the Deployment of Offshore Renewables
R/3981/1 B.5 R.1763
Table B6. Wave
Region/Zone Wave Resource
>10-20kw/m <12nm (km²)
Percentage of Resource
Pro Rata Scale of Development (MW Installed
Capacity)
Indicative Number of Arrays
Net Gain 4796.54 0.35 % 145 3 Balanced Seas 2901.02 1.45 % 85 2 Finding Sanctuary 6976.42 0.17 % 210 4 Irish Sea 1972.88 1.47 % 60 1 Total 16646.86 0.6 % 500 10
B8. Calculating Future Wave and Tidal Cable and Conflict Lengths All wave and tidal export cables have been assumed to be single AC cables. For wave export to shore cables an average distance of 6km/array has been used. For future wave export cables the same percentage of overlap as given for offshore wind has been applied. The length of the required tidal stream export cables has been based on the location of resource in each Region and average distance to shore. For within array cables, an assumed length of 10x the array area has been used (on the assumption that devices will be located much closer together than for offshore wind farms) . Percentage overlap with array cables was calculated on the same basis as for arrays. B9. Cable Route Diversion Where future cable routes intersect with potential MCZ, the following assumptions have been applied: Low scenario:
- Favourable condition sensitive habitat - cables divert around feature incurring an additional cable length of 1 x cable conflict length; and
- Reference condition – cables divert around Reference Area incurring an additional cable length of 5 x cable conflict length. This factor is applied to 20% of calculated cable conflict length on the basis that Reference Areas will largely seek to avoid obstructing known future cable routes;
High scenario:
- Favourable condition non-SAC habitat - cables divert around feature incurring an additional cable length of 1 x cable conflict length; and
- Reference condition – cables divert around Reference Area incurring an additional cable length of 5 x cable conflict length.
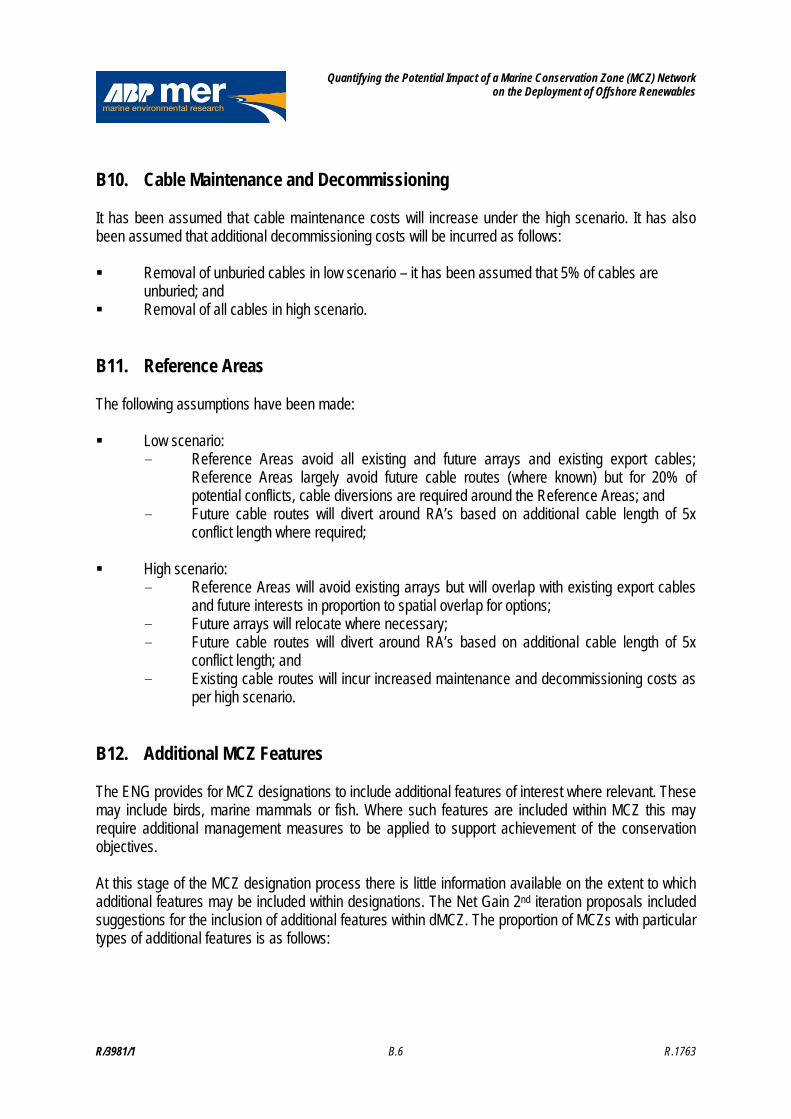
Quantifying the Potential Impact of a Marine Conservation Zone (MCZ) Network on the Deployment of Offshore Renewables
R/3981/1 B.6 R.1763
B10. Cable Maintenance and Decommissioning It has been assumed that cable maintenance costs will increase under the high scenario. It has also been assumed that additional decommissioning costs will be incurred as follows: Removal of unburied cables in low scenario – it has been assumed that 5% of cables are
unburied; and Removal of all cables in high scenario. B11. Reference Areas The following assumptions have been made: Low scenario:
- Reference Areas avoid all existing and future arrays and existing export cables; Reference Areas largely avoid future cable routes (where known) but for 20% of potential conflicts, cable diversions are required around the Reference Areas; and
- Future cable routes will divert around RA’s based on additional cable length of 5x conflict length where required;
High scenario:
- Reference Areas will avoid existing arrays but will overlap with existing export cables and future interests in proportion to spatial overlap for options;
- Future arrays will relocate where necessary; - Future cable routes will divert around RA’s based on additional cable length of 5x
conflict length; and - Existing cable routes will incur increased maintenance and decommissioning costs as
per high scenario. B12. Additional MCZ Features The ENG provides for MCZ designations to include additional features of interest where relevant. These may include birds, marine mammals or fish. Where such features are included within MCZ this may require additional management measures to be applied to support achievement of the conservation objectives. At this stage of the MCZ designation process there is little information available on the extent to which additional features may be included within designations. The Net Gain 2nd iteration proposals included suggestions for the inclusion of additional features within dMCZ. The proportion of MCZs with particular types of additional features is as follows:

Quantifying the Potential Impact of a Marine Conservation Zone (MCZ) Network on the Deployment of Offshore Renewables
R/3981/1 B.7 R.1763
Habitats/benthic species only: 14%; Habitats/benthic species plus fish: 5%; Habitats/benthic species plus marine mammals: 5%; Habitats/benthic species plus birds: 32%; and Habitats/benthic species plus multiple additional interests: 45%. These percentages have been assumed to apply in the other MCZ Regions and have been used to drive requirements for management measures.
Appendix C Summary Tables of Management Measures and Costs
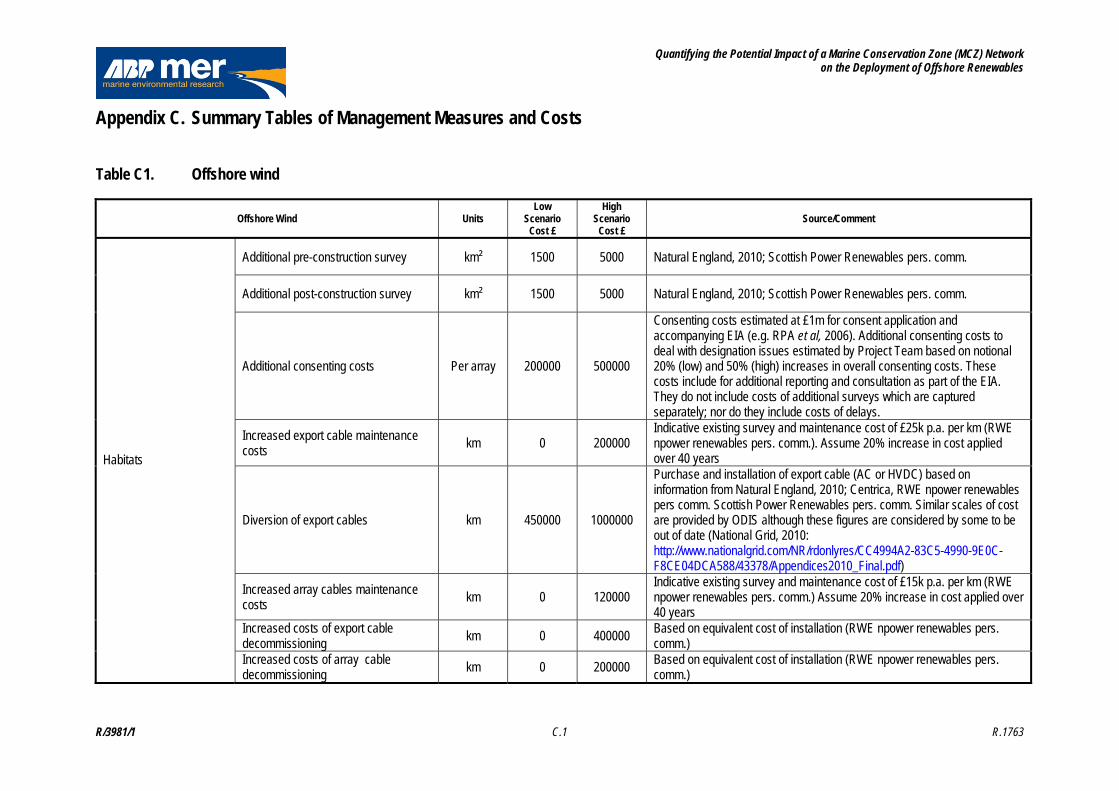
Quantifying the Potential Impact of a Marine Conservation Zone (MCZ) Network on the Deployment of Offshore Renewables
R/3981/1 C.1 R.1763
Appendix C. Summary Tables of Management Measures and Costs Table C1. Offshore wind
Offshore Wind Units Low
Scenario Cost £
High Scenario
Cost £ Source/Comment
Additional pre-construction survey km² 1500 5000 Natural England, 2010; Scottish Power Renewables pers. comm.
Additional post-construction survey km² 1500 5000 Natural England, 2010; Scottish Power Renewables pers. comm.
Additional consenting costs Per array 200000 500000
Consenting costs estimated at £1m for consent application and accompanying EIA (e.g. RPA et al, 2006). Additional consenting costs to deal with designation issues estimated by Project Team based on notional 20% (low) and 50% (high) increases in overall consenting costs. These costs include for additional reporting and consultation as part of the EIA. They do not include costs of additional surveys which are captured separately; nor do they include costs of delays.
Increased export cable maintenance costs
km 0 200000 Indicative existing survey and maintenance cost of £25k p.a. per km (RWE npower renewables pers. comm.). Assume 20% increase in cost applied over 40 years
Diversion of export cables km 450000 1000000
Purchase and installation of export cable (AC or HVDC) based on information from Natural England, 2010; Centrica, RWE npower renewables pers comm. Scottish Power Renewables pers. comm. Similar scales of cost are provided by ODIS although these figures are considered by some to be out of date (National Grid, 2010: http://www.nationalgrid.com/NR/rdonlyres/CC4994A2-83C5-4990-9E0C-F8CE04DCA588/43378/Appendices2010_Final.pdf)
Increased array cables maintenance costs
km 0 120000 Indicative existing survey and maintenance cost of £15k p.a. per km (RWE npower renewables pers. comm.) Assume 20% increase in cost applied over 40 years
Increased costs of export cable decommissioning
km 0 400000 Based on equivalent cost of installation (RWE npower renewables pers. comm.)
Habitats
Increased costs of array cable decommissioning
km 0 200000 Based on equivalent cost of installation (RWE npower renewables pers. comm.)

Quantifying the Potential Impact of a Marine Conservation Zone (MCZ) Network on the Deployment of Offshore Renewables
R/3981/1 C.2 R.1763
Offshore Wind Units Low
Scenario Cost £
High Scenario
Cost £ Source/Comment
Foundation option to minimize noise km² 0 357692
Increased cost of tripod foundation cf monopile = 1% capex; increased cost of gravity vs tripod in 30-40m = 4% capex. Increase monopile to gravity = 5%. Assume average of 3% across all foundation types. Cost based on £3.1m per MW installed, 3.9MW per km² (1GW occupies 260km²) = £357k per km² - based on information provided by RWE npower renewables
Fish
Seasonal delay construction Per array 0 50000000
This is made up of 2 factors: Notional increased cost of £40m if construction programme for R2 wind
farm increased from 2 to 3 years as a result of sunk investment that is not providing a return for an additional year (ABPmer et al, 2007);
Cost of seasonal delays associated with demobilization and re-mobilization of vessels and project team overhead estimated as £10m (for example, demob/remob of 4 vessels @£0.5m per vessel = £4m; Management overhead @ £850k per month x 7 month = £6m) (Anon, pers comm.)
Additional preconstruction monitoring Per array 0 500000 Estimated by Project Team, based on knowledge of existing survey costs. Provides for additional fill-in boat surveys
Mammals
Additional post construction monitoring Per array 0 2500000 Estimated by Project Team, based on knowledge of existing survey costs. Provides for extended monitoring during and post-construction (underwater noise, marine mammal distributions and movements)
Additional preconstruction monitoring Per array 0 250000
Estimated by Project Team, based on knowledge of existing survey costs. This assumes approx 6 fill-in surveys @£40k per survey (aerial survey). If additional years of pre-construction monitoring were required, the costs would be higher
Additional post construction monitoring Per array 0 2500000 Estimated by Project Team, based on knowledge of existing survey costs, for example major aerial and radar tracking surveys over an extended period
Other Features
Birds
Seasonal delay construction As fish

Quantifying the Potential Impact of a Marine Conservation Zone (MCZ) Network on the Deployment of Offshore Renewables
R/3981/1 C.3 R.1763
Table C2. Wave
Wave Units Low
Scenario Cost £
High Scenario
Cost £ Source/Comment
Additional pre-construction survey Per array 10000 20000 Estimated based on small benthic survey using inshore vessel. NB costs could be much higher if larger vessels required (£30k to £200k)
Additional post-construction survey Per array 10000 20000 Estimated based on small benthic survey using inshore vessel. NB costs could be much higher if larger vessels required (£30k to £200k)
Additional consenting costs Per array 50000 125000 Estimated by Project Team based on notional 20% (low) and 50% (high) increases in overall consenting costs
Increased export cable maintenance costs
km 0 200000 Indicative existing survey and maintenance cost of £25k p.a. per km (RWE npower renewables pers. comm.) Assume 20% increase in cost applied over 40 years
Diversion of export cables km 450000 1000000 Purchase and installation of export cable (AC or HVDC) based on information from Natural England, 2010; Centrica, RWE npower renewables pers. comm., Scottish Power Renewables pers. comm.
Increased array cables maintenance costs
km 0 120000 Indicative existing survey and maintenance cost of £15k p.a. per km (RWE npower renewables pers. comm.). Assume 20% increase in cost applied over 40 years
Increased costs of export cable decommissioning km 0 400000
Based on equivalent cost of installation (RWE npower renewables pers. comm.)
Habitats
Increased costs of array cable decommissioning km 0 200000
Based on equivalent cost of installation (RWE npower renewables pers. comm.)
Fish No additional measures
Additional preconstruction monitoring Per array 0 250000 Estimated by Project Team, based on knowledge of existing survey costs. Provides for limited additional boat based and C-POD monitoring
Mammals Additional post construction monitoring Per array 0 250000 Estimated by Project Team, based on knowledge of existing survey costs.
Provides for limited additional boat based and C-POD monitoring
Additional preconstruction monitoring Per array 0 250000 Estimated by Project Team, based on knowledge of existing survey costs. Provides for limited additional boat based monitoring
Other Features
Birds Additional post construction monitoring Per array 0 250000 Estimated by Project Team, based on knowledge of existing survey costs.
Provides for limited additional boat based monitoring.
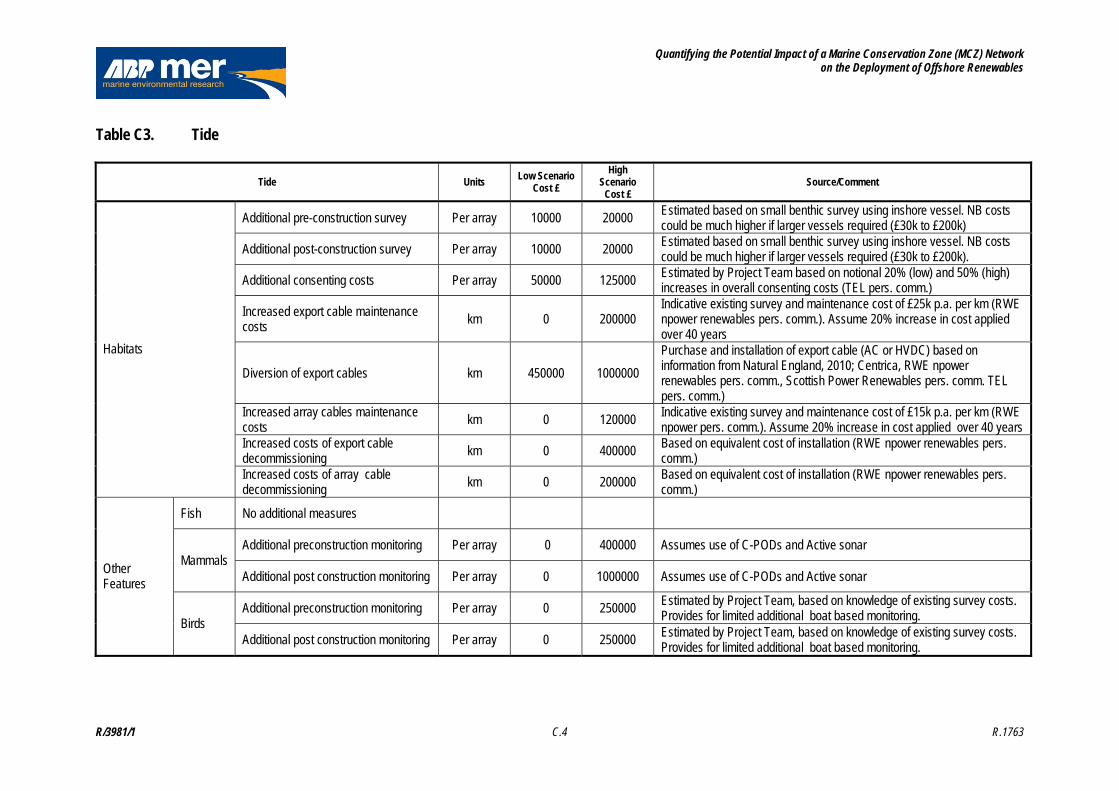
Quantifying the Potential Impact of a Marine Conservation Zone (MCZ) Network on the Deployment of Offshore Renewables
R/3981/1 C.4 R.1763
Table C3. Tide
Tide Units Low Scenario
Cost £
High Scenario
Cost £ Source/Comment
Additional pre-construction survey Per array 10000 20000 Estimated based on small benthic survey using inshore vessel. NB costs could be much higher if larger vessels required (£30k to £200k)
Additional post-construction survey Per array 10000 20000 Estimated based on small benthic survey using inshore vessel. NB costs could be much higher if larger vessels required (£30k to £200k).
Additional consenting costs Per array 50000 125000 Estimated by Project Team based on notional 20% (low) and 50% (high) increases in overall consenting costs (TEL pers. comm.)
Increased export cable maintenance costs
km 0 200000 Indicative existing survey and maintenance cost of £25k p.a. per km (RWE npower renewables pers. comm.). Assume 20% increase in cost applied over 40 years
Diversion of export cables km 450000 1000000
Purchase and installation of export cable (AC or HVDC) based on information from Natural England, 2010; Centrica, RWE npower renewables pers. comm., Scottish Power Renewables pers. comm. TEL pers. comm.)
Increased array cables maintenance costs
km 0 120000 Indicative existing survey and maintenance cost of £15k p.a. per km (RWE npower pers. comm.). Assume 20% increase in cost applied over 40 years
Increased costs of export cable decommissioning km 0 400000
Based on equivalent cost of installation (RWE npower renewables pers. comm.)
Habitats
Increased costs of array cable decommissioning km 0 200000
Based on equivalent cost of installation (RWE npower renewables pers. comm.)
Fish No additional measures
Additional preconstruction monitoring Per array 0 400000 Assumes use of C-PODs and Active sonar Mammals
Additional post construction monitoring Per array 0 1000000 Assumes use of C-PODs and Active sonar
Additional preconstruction monitoring Per array 0 250000 Estimated by Project Team, based on knowledge of existing survey costs. Provides for limited additional boat based monitoring.
Other Features
Birds Additional post construction monitoring Per array 0 250000 Estimated by Project Team, based on knowledge of existing survey costs.
Provides for limited additional boat based monitoring.

Appendix D Data Sources

Quantifying the Potential Impact of a Marine Conservation Zone (MCZ) Network on the Deployment of Offshore Renewables
R/3981/1 D.1 R.1763
Appendix D. Data Sources Table D1. Data sources
Sector Data Source UKSeaMap 2010 Broad-scale habitats JNCC Intertidal habitats Natural England Habitat FOCI Defra Species FOCI Defra
Conservation Features
SAC/SPA boundaries JNCC Existing and consented (not yet built) offshore wind farms (R1/R2) TCE
Existing and consented (not yet built) offshore wind cable routes (R1/R2)
TCE, Global Offshore Wind Farms Database
Existing application areas for offshore wind development (not yet consented) (R2/R2.5/R3) TCE
Proposed cable routes/corridors for existing application areas
TCE, Global Offshore Wind Farms Database, Developers
Offshore wind demonstration sites (e.g. NAREC) TCE, Developers
Offshore Wind
Offshore wind demonstration site cable routes (e.g. NAREC)
TCE, Global Offshore Wind Farms Database, Developers
Existing lease areas TCE Existing cable routes TCE Potential future interest areas TCE
Wave
Screening study for wave and tidal DECC Existing lease areas – e.g. Bristol Channel, Humber, TCE Existing cable routes TCE Potential future interest areas TCE
Tidal
Screening study for wave and tidal DECC

Appendix E Assumptions for Spatial Analysis

Quantifying the Potential Impact of a Marine Conservation Zone (MCZ) Network on the Deployment of Offshore Renewables
R/3981/1 E.1 R.1763
Appendix E. Assumptions for Spatial Analysis E1. Offshore Wind The spatial overlap (km² and number of arrays) between potential MCZ and existing arrays was quantified for each Region. A 1km buffer was applied to each array so that where arrays were close to potential MCZ the possible need for management measures could be taken into account. For future arrays, the spatial overlap (km²) between potential MCZ and existing arrays was also quantified for each Region. However, it is recognised that many of the R3 zones will not be fully developed. The extent of future spatial overlap was therefore adjusted to take account of the proportion of R3 zones that might be developed in each Region (see Assumption 2, Appendix B). There is currently some uncertainty about the number of future arrays. For the purposes of this study the spatial analysis was used to calculate the number of future array zones which overlapped with potential MCZ in each Region. This number was then adjusted to reflect a possible number of arrays (see Assumption 2, Appendix B). This number was then further adjusted to take account of the proportion of R3 zones that might be developed in each Region (see Assumption 2, Appendix B). For existing export cables, the length of cable intersecting with potential MCZ in each Region was calculated. This length was then adjusted to take account of any missing cables data (see Assumption 4, Appendix B). For future export cables, some of the cable routes are only available as cable corridors. Where only corridors were available, the cable was assumed to run along the centreline of the corridor. The length of cable route intersecting with potential MCZ in each Region was calculated. This length was then adjusted for any missing cables and further adjusted to reflect the presence of multiple cables within cable corridors (see Assumption 4, Appendix B). The length of existing and future within array cable overlapping with potential MCZ was calculated as 1.25 x area of array overlapping with potential MCZ (see Assumption 4, Appendix B). E2. Wave The spatial overlap for existing wave devices and cable routes was quantified using GIS. The possible scale of future wave development to 2030 was estimated based on the following assumptions: Wave development contributes 500MW by 2030; 1km² of wave array generates 25MW (AEA Technology & Hartley Anderson, in prep); Average array size of 2km²; Number of arrays to deliver 500MW = 10; and Area of arrays to deliver 500MW = 20km².

Quantifying the Potential Impact of a Marine Conservation Zone (MCZ) Network on the Deployment of Offshore Renewables
R/3981/1 E.2 R.1763
Arrays were assigned to MCZ Regions pro rata to the wave resource (Assumption 7, Appendix B). The spatial overlap between potential MCZ and exploitable wave resources within 12nm was calculated. The spatial overlap between potential MCZ and future wave arrays was calculated pro rata. For each possible future array, it was assumed that the average export cable length was 6km. A total estimated length of export cable was calculated based on the possible number of arrays in each Region. The length of cable overlapping with potential MCZ was calculated assuming a similar proportional overlap to offshore wind export cables (Assumption 8, Appendix B). For existing and future within array cables, an estimated length of spatial overlap with potential MCZ was calculated as 10 x area of array overlapping with potential MCZ. E3. Tidal Stream The spatial overlap for existing tidal stream devices and cable routes was quantified using GIS. The possible scale of future tidal development to 2030 was estimated based on the following assumptions: Tidal development contributes 120MW by 2030 (based on development of 25% of tidal
resource >2.5m/s mpcs); 1km² of tidal array generates 25MW (AEA Technology & Hartley Anderson, in prep); Average array size of 2km²; Number of arrays to deliver 120MW = 2.5; and Area of arrays to deliver 120 MW = 5km². Arrays were assigned to MCZ Regions pro rata to the tidal stream resource (Assumption 7, Appendix B). The spatial overlap between potential MCZ and exploitable tidal stream resources >2.5mpcs was calculated. The spatial overlap between potential MCZ and future tidal arrays was calculated pro rata. For each possible future array, the likely export cable length was calculated as the distance to the nearest point of shore. A total estimated length of export cable was calculated based on the possible number of arrays in each Region (Assumption 8, Appendix B). The length of possible future export cable overlapping with potential MCZ was calculated directly in the GIS. For existing and future within array cables, an estimated length of spatial overlap with potential MCZ was calculated as 10 x area of array overlapping with potential MCZ. E4. Tidal Range Potential tidal range locations were identified based on AEA Technology & Hartley Anderson (in prep). All potential MCZ upstream of these locations or potential intertidal MCZ 10km downstream of these locations were identified.
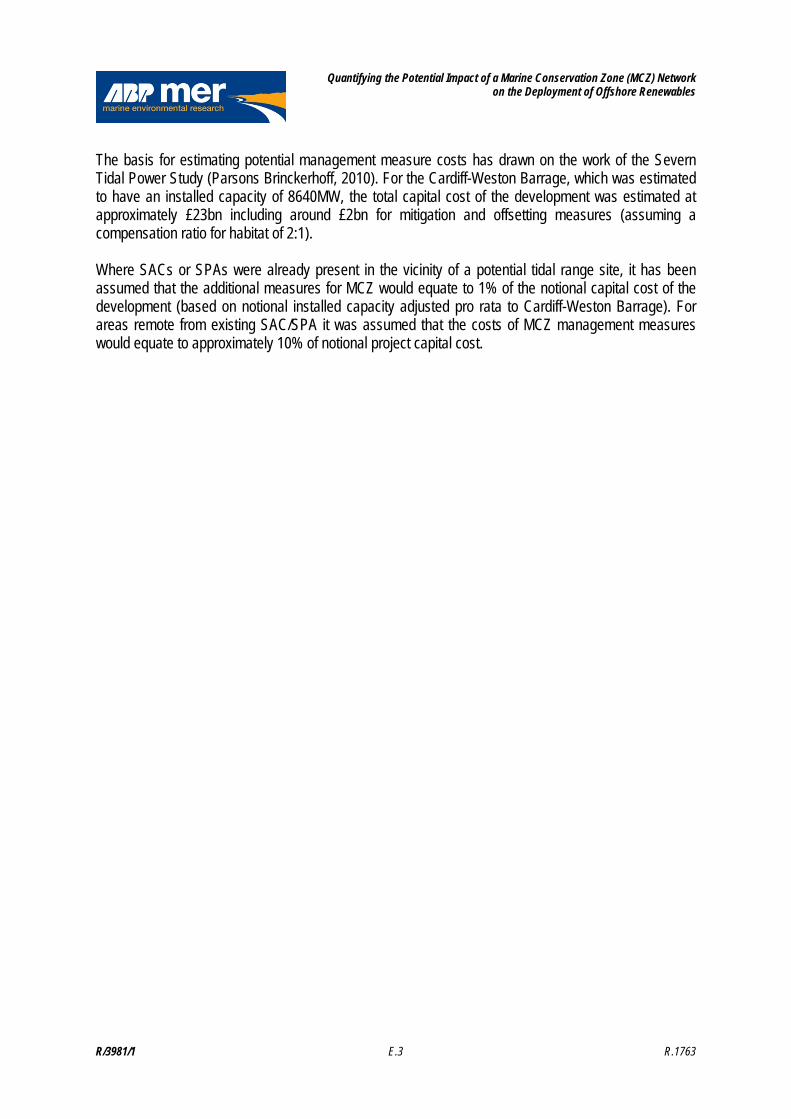
Quantifying the Potential Impact of a Marine Conservation Zone (MCZ) Network on the Deployment of Offshore Renewables
R/3981/1 E.3 R.1763
The basis for estimating potential management measure costs has drawn on the work of the Severn Tidal Power Study (Parsons Brinckerhoff, 2010). For the Cardiff-Weston Barrage, which was estimated to have an installed capacity of 8640MW, the total capital cost of the development was estimated at approximately £23bn including around £2bn for mitigation and offsetting measures (assuming a compensation ratio for habitat of 2:1). Where SACs or SPAs were already present in the vicinity of a potential tidal range site, it has been assumed that the additional measures for MCZ would equate to 1% of the notional capital cost of the development (based on notional installed capacity adjusted pro rata to Cardiff-Weston Barrage). For areas remote from existing SAC/SPA it was assumed that the costs of MCZ management measures would equate to approximately 10% of notional project capital cost.

Appendix F Summary Outputs from Cost Model

Quantifying the Potential Impact of a Marine Conservation Zone (MCZ) Network on the Deployment of Offshore Renewables
R/3981/1 R.1763
Appendix F. Summary Outputs from Cost Model
Table F1. Net Gain Option 1 - Wind
Spatial OverlapResource Total Not Sensitive Sensitive Not Sensitive Sensitive Reference Area
Existing Array Overlap km2 289.2 170.7 0.2 118.2 0.0
Future Array Overlap km2 237.3 212.3 0.0 25.0 0.0
Existing Array Overlap No 7 6 0 1 0Proposed Array Overlap No 3 2 0 1 0
Existing Export Cable Overlap km 714.69 182.13 0.94 444.95 70.20 16.44Proposed Export Cable Overlap km 1152.69 1033.08 0.40 92.69 0.00 26.51
Existing Array Cable Overlap km 361.5 213.4 0.3 147.7 0.0Proposed Array Cable Overlap km 296.6 265.3 0.0 31.3 0.0
Low ScenarioNot Sensitive Sensitive Not Sensitive Sensitive Reference Area Total (£1000s)
Existing Array Overlap (£1000s) 0 1 0 0 1Future Array Overlap (£1000s) 0 0 0 0 0
Existing Array Overlap (£1000s) 0 0 0 0 0Proposed Array Overlap (£1000s) 0 0 0 0 0
Existing Export Cable Overlap (£1000s) 0 19 0 0 329 348Proposed Export Cable Overlap (£1000s) 0 182 0 0 11930 12112
Existing Array Cable Overlap (£1000s) 0 3 0 0 3Proposed Array Cable Overlap (£1000s) 0 0 0 0 0Total 0 205 0 0 12259 12464
High ScenarioNot Sensitive Sensitive Not Sensitive Sensitive Reference Area Total (£1000s)
Existing Array Overlap (£1000s) 1707 2 0 0 1710Future Array Overlap (£1000s) 68759 0 7727 0 76486
Existing Array Overlap (£1000s) 19145 0 3191 0 22336Proposed Array Overlap (£1000s) 34632 0 16816 0 51448
Existing Export Cable Overlap (£1000s) 91067 472 0 0 8219 99757Proposed Export Cable Overlap (£1000s) 1033080 405 0 0 132559 1166044
Existing Array Cable Overlap (£1000s) 55489 77 0 0 55565Proposed Array Cable Overlap (£1000s) 68989 0 0 0 68989Total 1372867 955 27734 0 140778 1542334
Outside SAC Inside SAC
Outside SAC Inside SAC
Inside SACOutside SAC
F.1

Quantifying the Potential Impact of a Marine Conservation Zone (MCZ) Network on the Deployment of Offshore Renewables
R/3981/1 R.1763
Table F2. Net Gain Option 1 - Wave
Spatial OverlapResource Total Not Sensitive Sensitive Not Sensitive Sensitive Reference Area
Existing Array Overlap km2 0.0 0.0 0.0 0.0 0.0
Future Array Overlap km2 2.2 1.7 0.0 0.4 0.1
Existing Array Overlap No 0.0 0.0 0.0 0.0 0.0Proposed Array Overlap No 1.1 0.9 0.0 0.2 0.0
Existing Export Cable Overlap km 0.0 0.0 0.0 0.0 0.0 0.0Proposed Export Cable Overlap km 5.9 5.3 0.0 0.5 0.0 0.1
Existing Array Cable Overlap km 0.0 0.0 0.0 0.0 0.0Proposed Array Cable Overlap km 22.0 17.1 0.1 3.9 0.9
Low ScenarioNot Sensitive Sensitive Not Sensitive Sensitive Reference Area Total (£1000s)
Existing Array Overlap (£1000s) 0 0 0 0 0Future Array Overlap (£1000s) 0 0 0 0 0
Existing Array Overlap (£1000s) 0 0 0 0 0Proposed Array Overlap (£1000s) 0 0 0 0 0
Existing Export Cable Overlap (£1000s) 0 0 0 0 0 0Proposed Export Cable Overlap (£1000s) 0 1 0 0 61 62
Existing Array Cable Overlap (£1000s) 0 0 0 0 0Proposed Array Cable Overlap (£1000s) 0 1 0 0 1Total 0 2 0 0 61 63
High ScenarioNot Sensitive Sensitive Not Sensitive Sensitive Reference Area Total (£1000s)
Existing Array Overlap (£1000s) 0 0 0 0 0Future Array Overlap (£1000s) 0 0 0 0 0
Existing Array Overlap (£1000s) 0 0 0 0 0Proposed Array Overlap (£1000s) 686 2 124 28 840
Existing Export Cable Overlap (£1000s) 0 0 0 0 0 0Proposed Export Cable Overlap (£1000s) 5291 2 0 0 679 5972
Existing Array Cable Overlap (£1000s) 0 0 0 0 0Proposed Array Cable Overlap (£1000s) 4451 16 0 0 4467Total 10428 20 124 28 679 11280
Outside SAC Inside SAC
Outside SAC Inside SAC
Outside SAC Inside SAC
F.2

Quantifying the Potential Impact of a Marine Conservation Zone (MCZ) Network on the Deployment of Offshore Renewables
R/3981/1 R.1763
Table F3. Net Gain Option 1 - Tide
Spatial OverlapResource Total Not Sensitive Sensitive Not Sensitive Sensitive Reference Area
Existing Array Overlap km2 0 0 0 0 0
Future Array Overlap km2 0 0 0 0 0
Existing Array Overlap No 0 0 0 0 0Proposed Array Overlap No 0 0 0 0 0
Existing Export Cable Overlap km 0 0 0 0 0 0Proposed Export Cable Overlap km 0 0 0 0 0 0
Existing Array Cable Overlap km 0 0 0 0 0Proposed Array Cable Overlap km 0 0 0 0 0
Low ScenarioNot Sensitive Sensitive Not Sensitive Sensitive Reference Area Total (£1000s)
Existing Array Overlap (£1000s) 0 0 0 0 0Future Array Overlap (£1000s) 0 0 0 0 0
Existing Array Overlap (£1000s) 0 0 0 0 0Proposed Array Overlap (£1000s) 0 0 0 0 0
Existing Export Cable Overlap (£1000s) 0 0 0 0 0 0Proposed Export Cable Overlap (£1000s) 0 0 0 0 0 0
Existing Array Cable Overlap (£1000s) 0 0 0 0 0Proposed Array Cable Overlap (£1000s) 0 0 0 0 0Total 0 0 0 0 0 0
High ScenarioNot Sensitive Sensitive Not Sensitive Sensitive Reference Area Total (£1000s)
Existing Array Overlap (£1000s) 0 0 0 0 0Future Array Overlap (£1000s) 0 0 0 0 0
Existing Array Overlap (£1000s) 0 0 0 0 0Proposed Array Overlap (£1000s) 0 0 0 0 0
Existing Export Cable Overlap (£1000s) 0 0 0 0 0 0Proposed Export Cable Overlap (£1000s) 0 0 0 0 0 0
Existing Array Cable Overlap (£1000s) 0 0 0 0 0Proposed Array Cable Overlap (£1000s) 0 0 0 0 0Total 0 0 0 0 0 0
Outside SAC Inside SAC
Outside SAC Inside SAC
Outside SAC Inside SAC
F.3
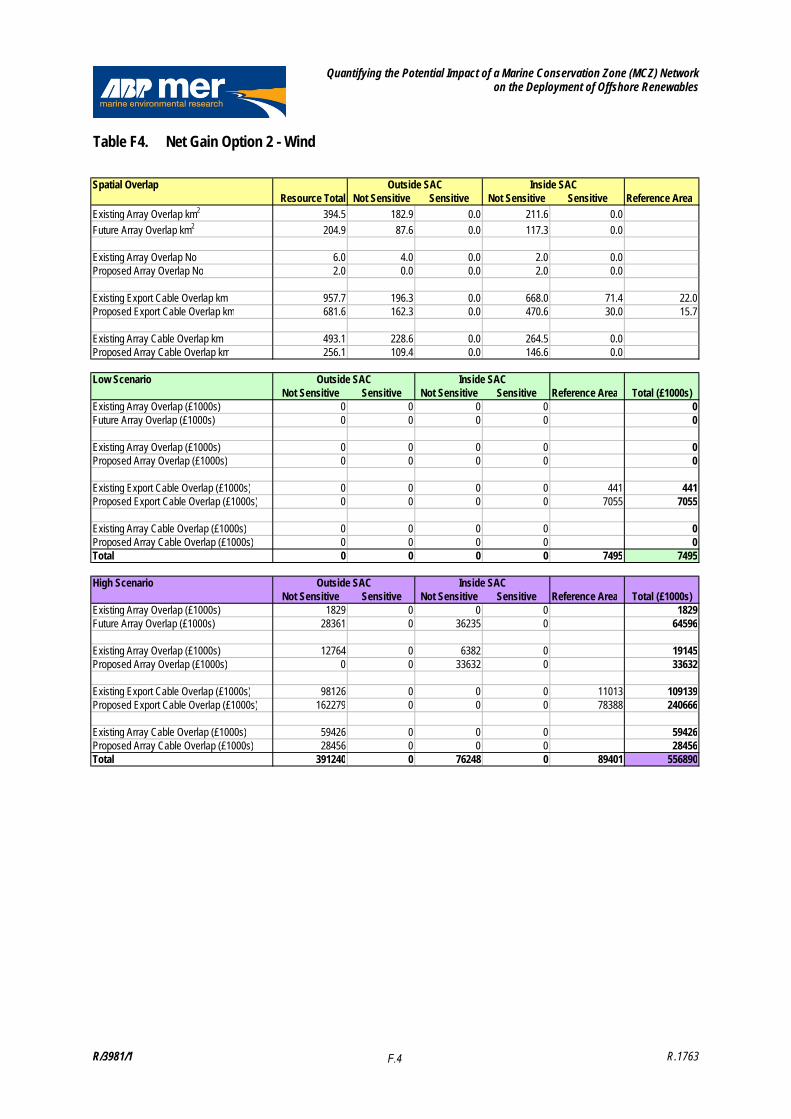
Quantifying the Potential Impact of a Marine Conservation Zone (MCZ) Network on the Deployment of Offshore Renewables
R/3981/1 R.1763
Table F4. Net Gain Option 2 - Wind
Spatial OverlapResource Total Not Sensitive Sensitive Not Sensitive Sensitive Reference Area
Existing Array Overlap km2 394.5 182.9 0.0 211.6 0.0
Future Array Overlap km2 204.9 87.6 0.0 117.3 0.0
Existing Array Overlap No 6.0 4.0 0.0 2.0 0.0Proposed Array Overlap No 2.0 0.0 0.0 2.0 0.0
Existing Export Cable Overlap km 957.7 196.3 0.0 668.0 71.4 22.0Proposed Export Cable Overlap km 681.6 162.3 0.0 470.6 30.0 15.7
Existing Array Cable Overlap km 493.1 228.6 0.0 264.5 0.0Proposed Array Cable Overlap km 256.1 109.4 0.0 146.6 0.0
Low ScenarioNot Sensitive Sensitive Not Sensitive Sensitive Reference Area Total (£1000s)
Existing Array Overlap (£1000s) 0 0 0 0 0Future Array Overlap (£1000s) 0 0 0 0 0
Existing Array Overlap (£1000s) 0 0 0 0 0Proposed Array Overlap (£1000s) 0 0 0 0 0
Existing Export Cable Overlap (£1000s) 0 0 0 0 441 441Proposed Export Cable Overlap (£1000s) 0 0 0 0 7055 7055
Existing Array Cable Overlap (£1000s) 0 0 0 0 0Proposed Array Cable Overlap (£1000s) 0 0 0 0 0Total 0 0 0 0 7495 7495
High ScenarioNot Sensitive Sensitive Not Sensitive Sensitive Reference Area Total (£1000s)
Existing Array Overlap (£1000s) 1829 0 0 0 1829Future Array Overlap (£1000s) 28361 0 36235 0 64596
Existing Array Overlap (£1000s) 12764 0 6382 0 19145Proposed Array Overlap (£1000s) 0 0 33632 0 33632
Existing Export Cable Overlap (£1000s) 98126 0 0 0 11013 109139Proposed Export Cable Overlap (£1000s) 162279 0 0 0 78388 240666
Existing Array Cable Overlap (£1000s) 59426 0 0 0 59426Proposed Array Cable Overlap (£1000s) 28456 0 0 0 28456Total 391240 0 76248 0 89401 556890
Outside SAC Inside SAC
Outside SAC Inside SAC
Inside SACOutside SAC
F.4

Quantifying the Potential Impact of a Marine Conservation Zone (MCZ) Network on the Deployment of Offshore Renewables
R/3981/1 R.1763
Table F5. Net Gain Option 2 - Wave
Spatial OverlapResource Total Not Sensitive Sensitive Not Sensitive Sensitive Reference Area
Existing Array Overlap km2 0 0 0 0 0
Future Array Overlap km2 2.13 0.84 0.00 1.19 0.10
Existing Array Overlap No 0 0 0 0 0Proposed Array Overlap No 1.07 0.42 0.00 0.59 0.05
Existing Export Cable Overlap km 0 0.0 0.0 0.0 0.0 0.0Proposed Export Cable Overlap km 3.49 0.83 0.00 2.41 0.15 0.08
Existing Array Cable Overlap km 0 0 0 0 0Proposed Array Cable Overlap km 21.31 8.40 0.03 11.85 1.00
Low ScenarioNot Sensitive Sensitive Not Sensitive Sensitive Reference Area Total (£1000s)
Existing Array Overlap (£1000s) 0 0 0 0 0Future Array Overlap (£1000s) 0 0 0 0 0
Existing Array Overlap (£1000s) 0 0 0 0 0Proposed Array Overlap (£1000s) 0 0 0 0 0
Existing Export Cable Overlap (£1000s) 0 0 0 0 0 0Proposed Export Cable Overlap (£1000s) 0 36 0 0 36 72
Existing Array Cable Overlap (£1000s) 0 0 0 0 0Proposed Array Cable Overlap (£1000s) 0 0 0 0 0Total 0 36 0 0 36 73
High ScenarioNot Sensitive Sensitive Not Sensitive Sensitive Reference Area Total (£1000s)
Existing Array Overlap (£1000s) 0 0 0 0 0Future Array Overlap (£1000s) 0 0 0 0 0
Existing Array Overlap (£1000s) 0 0 0 0 0Proposed Array Overlap (£1000s) 337 1 377 32 747
Existing Export Cable Overlap (£1000s) 0 0 0 0 0 0Proposed Export Cable Overlap (£1000s) 831 0 0 0 401 1233
Existing Array Cable Overlap (£1000s) 0 0 0 0 0Proposed Array Cable Overlap (£1000s) 2185 9 0 0 2193Total 3352 10 377 32 401 4173
Outside SAC Inside SAC
Outside SAC Inside SAC
Outside SAC Inside SAC
F.5

Quantifying the Potential Impact of a Marine Conservation Zone (MCZ) Network on the Deployment of Offshore Renewables
R/3981/1 R.1763
Table F6. Net Gain Option 2 - Tide
Spatial OverlapResource Total Not Sensitive Sensitive Not Sensitive Sensitive Reference Area
Existing Array Overlap km2 0.79 0.00 0.00 0.79 0.00
Future Array Overlap km2 0.00 0.00 0.00 0.00 0.00
Existing Array Overlap No 0.39 0.00 0.00 0.39 0.00Proposed Array Overlap No 0.00 0.00 0.00 0.00 0.00
Existing Export Cable Overlap km 0.66 0.00 0.00 0.28 0.19 0.02Proposed Export Cable Overlap km 0.00 0.00 0.00 0.00 0.00 0.00
Existing Array Cable Overlap km 7.85 0.00 0.00 7.85 0.00Proposed Array Cable Overlap km 0.00 0.00 0.00 0.00 0.00
Low ScenarioNot Sensitive Sensitive Not Sensitive Sensitive Reference Area Total (£1000s)
Existing Array Overlap (£1000s) 0 0 0 0 0Future Array Overlap (£1000s) 0 0 0 0 0
Existing Array Overlap (£1000s) 0 0 0 0 0Proposed Array Overlap (£1000s) 0 0 0 0 0
Existing Export Cable Overlap (£1000s) 0 0 0 0 0 0Proposed Export Cable Overlap (£1000s) 0 0 0 0 0 0
Existing Array Cable Overlap (£1000s) 0 0 0 0 0Proposed Array Cable Overlap (£1000s) 0 0 0 0 0Total 0 0 0 0 0 0
High ScenarioNot Sensitive Sensitive Not Sensitive Sensitive Reference Area Total (£1000s)
Existing Array Overlap (£1000s) 0 0 0 0 0Future Array Overlap (£1000s) 0 0 0 0 0
Existing Array Overlap (£1000s) 0 0 272 0 272Proposed Array Overlap (£1000s) 0 0 0 0 0
Existing Export Cable Overlap (£1000s) 0 0 0 0 8 8Proposed Export Cable Overlap (£1000s) 0 0 0 0 0 0
Existing Array Cable Overlap (£1000s) 0 0 0 0 0Proposed Array Cable Overlap (£1000s) 0 0 0 0 0Total 0 0 272 0 8 280
Outside SAC Inside SAC
Outside SAC Inside SAC
Outside SAC Inside SAC
F.6
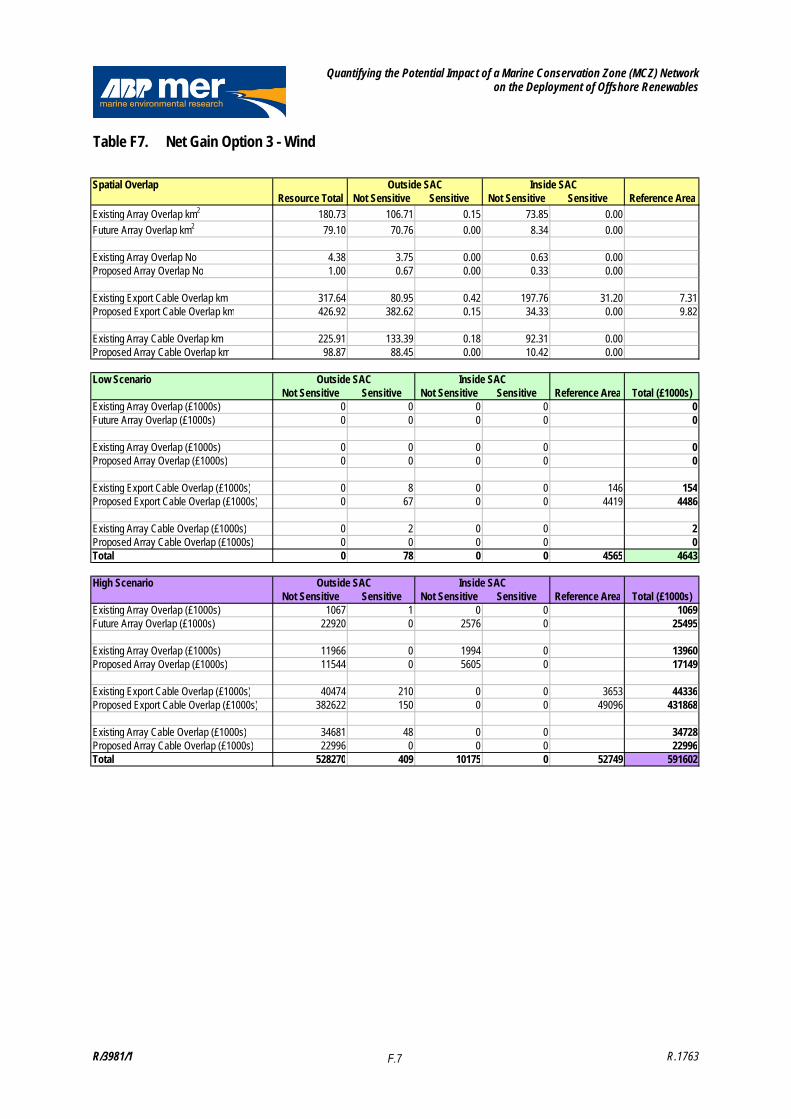
Quantifying the Potential Impact of a Marine Conservation Zone (MCZ) Network on the Deployment of Offshore Renewables
R/3981/1 R.1763
Table F7. Net Gain Option 3 - Wind
Spatial OverlapResource Total Not Sensitive Sensitive Not Sensitive Sensitive Reference Area
Existing Array Overlap km2 180.73 106.71 0.15 73.85 0.00
Future Array Overlap km2 79.10 70.76 0.00 8.34 0.00
Existing Array Overlap No 4.38 3.75 0.00 0.63 0.00Proposed Array Overlap No 1.00 0.67 0.00 0.33 0.00
Existing Export Cable Overlap km 317.64 80.95 0.42 197.76 31.20 7.31Proposed Export Cable Overlap km 426.92 382.62 0.15 34.33 0.00 9.82
Existing Array Cable Overlap km 225.91 133.39 0.18 92.31 0.00Proposed Array Cable Overlap km 98.87 88.45 0.00 10.42 0.00
Low ScenarioNot Sensitive Sensitive Not Sensitive Sensitive Reference Area Total (£1000s)
Existing Array Overlap (£1000s) 0 0 0 0 0Future Array Overlap (£1000s) 0 0 0 0 0
Existing Array Overlap (£1000s) 0 0 0 0 0Proposed Array Overlap (£1000s) 0 0 0 0 0
Existing Export Cable Overlap (£1000s) 0 8 0 0 146 154Proposed Export Cable Overlap (£1000s) 0 67 0 0 4419 4486
Existing Array Cable Overlap (£1000s) 0 2 0 0 2Proposed Array Cable Overlap (£1000s) 0 0 0 0 0Total 0 78 0 0 4565 4643
High ScenarioNot Sensitive Sensitive Not Sensitive Sensitive Reference Area Total (£1000s)
Existing Array Overlap (£1000s) 1067 1 0 0 1069Future Array Overlap (£1000s) 22920 0 2576 0 25495
Existing Array Overlap (£1000s) 11966 0 1994 0 13960Proposed Array Overlap (£1000s) 11544 0 5605 0 17149
Existing Export Cable Overlap (£1000s) 40474 210 0 0 3653 44336Proposed Export Cable Overlap (£1000s) 382622 150 0 0 49096 431868
Existing Array Cable Overlap (£1000s) 34681 48 0 0 34728Proposed Array Cable Overlap (£1000s) 22996 0 0 0 22996Total 528270 409 10175 0 52749 591602
Outside SAC Inside SAC
Outside SAC Inside SAC
Inside SACOutside SAC
F.7

Quantifying the Potential Impact of a Marine Conservation Zone (MCZ) Network on the Deployment of Offshore Renewables
R/3981/1 R.1763
Table F8. Net Gain Option 3 - Wave
Spatial OverlapResource Total Not Sensitive Sensitive Not Sensitive Sensitive Reference Area
Existing Array Overlap km2 0.0 0.0 0.0 0.0 0.0
Future Array Overlap km2 0.8 0.6 0.0 0.1 0.0
Existing Array Overlap No 0.0 0.0 0.0 0.0 0.0Proposed Array Overlap No 0.4 0.3 0.0 0.1 0.0
Existing Export Cable Overlap km 0.0 0.0 0.0 0.0 0.0 0.0Proposed Export Cable Overlap km 2.3 2.0 0.0 0.2 0.0 0.1
Existing Array Cable Overlap km 0.0 0.0 0.0 0.0 0.0Proposed Array Cable Overlap km 8.1 6.3 0.0 1.4 0.3
Low ScenarioNot Sensitive Sensitive Not Sensitive Sensitive Reference Area Total (£1000s)
Existing Array Overlap (£1000s) 0 0 0 0 0Future Array Overlap (£1000s) 0 0 0 0 0
Existing Array Overlap (£1000s) 0 0 0 0 0Proposed Array Overlap (£1000s) 0 0 0 0 0
Existing Export Cable Overlap (£1000s) 0 0 0 0 0 0Proposed Export Cable Overlap (£1000s) 0 0 0 0 24 24
Existing Array Cable Overlap (£1000s) 0 0 0 0 0Proposed Array Cable Overlap (£1000s) 0 0 0 0 0Total 0 1 0 0 24 24
High ScenarioNot Sensitive Sensitive Not Sensitive Sensitive Reference Area Total (£1000s)
Existing Array Overlap (£1000s) 0 0 0 0 0Future Array Overlap (£1000s) 0 0 0 0 0
Existing Array Overlap (£1000s) 0 0 0 0 0Proposed Array Overlap (£1000s) 254 1 46 11 311
Existing Export Cable Overlap (£1000s) 0 0 0 0 0 0Proposed Export Cable Overlap (£1000s) 2035 1 0 0 261 2297
Existing Array Cable Overlap (£1000s) 0 0 0 0 0Proposed Array Cable Overlap (£1000s) 1649 6 0 0 1654Total 3938 8 46 11 261 4263
Outside SAC Inside SAC
Outside SAC Inside SAC
Outside SAC Inside SAC
F.8

Quantifying the Potential Impact of a Marine Conservation Zone (MCZ) Network on the Deployment of Offshore Renewables
R/3981/1 R.1763
Table F9. Net Gain Option 3 - Tide
Spatial OverlapResource Total Not Sensitive Sensitive Not Sensitive Sensitive Reference Area
Existing Array Overlap km2 0 0 0 0 0
Future Array Overlap km2 0 0 0 0 0
Existing Array Overlap No 0 0 0 0 0Proposed Array Overlap No 0 0 0 0 0
Existing Export Cable Overlap km 0 0 0 0 0 0Proposed Export Cable Overlap km 0 0 0 0 0 0
Existing Array Cable Overlap km 0 0 0 0 0Proposed Array Cable Overlap km 0 0 0 0 0
Low ScenarioNot Sensitive Sensitive Not Sensitive Sensitive Reference Area Total (£1000s)
Existing Array Overlap (£1000s) 0 0 0 0 0Future Array Overlap (£1000s) 0 0 0 0 0
Existing Array Overlap (£1000s) 0 0 0 0 0Proposed Array Overlap (£1000s) 0 0 0 0 0
Existing Export Cable Overlap (£1000s) 0 0 0 0 0 0Proposed Export Cable Overlap (£1000s) 0 0 0 0 0 0
Existing Array Cable Overlap (£1000s) 0 0 0 0 0Proposed Array Cable Overlap (£1000s) 0 0 0 0 0Total 0 0 0 0 0 0
High ScenarioNot Sensitive Sensitive Not Sensitive Sensitive Reference Area Total (£1000s)
Existing Array Overlap (£1000s) 0 0 0 0 0Future Array Overlap (£1000s) 0 0 0 0 0
Existing Array Overlap (£1000s) 0 0 0 0 0Proposed Array Overlap (£1000s) 0 0 0 0 0
Existing Export Cable Overlap (£1000s) 0 0 0 0 0 0Proposed Export Cable Overlap (£1000s) 0 0 0 0 0 0
Existing Array Cable Overlap (£1000s) 0 0 0 0 0Proposed Array Cable Overlap (£1000s) 0 0 0 0 0Total 0 0 0 0 0 0
Outside SAC Inside SAC
Outside SAC Inside SAC
Outside SAC Inside SAC
F.9
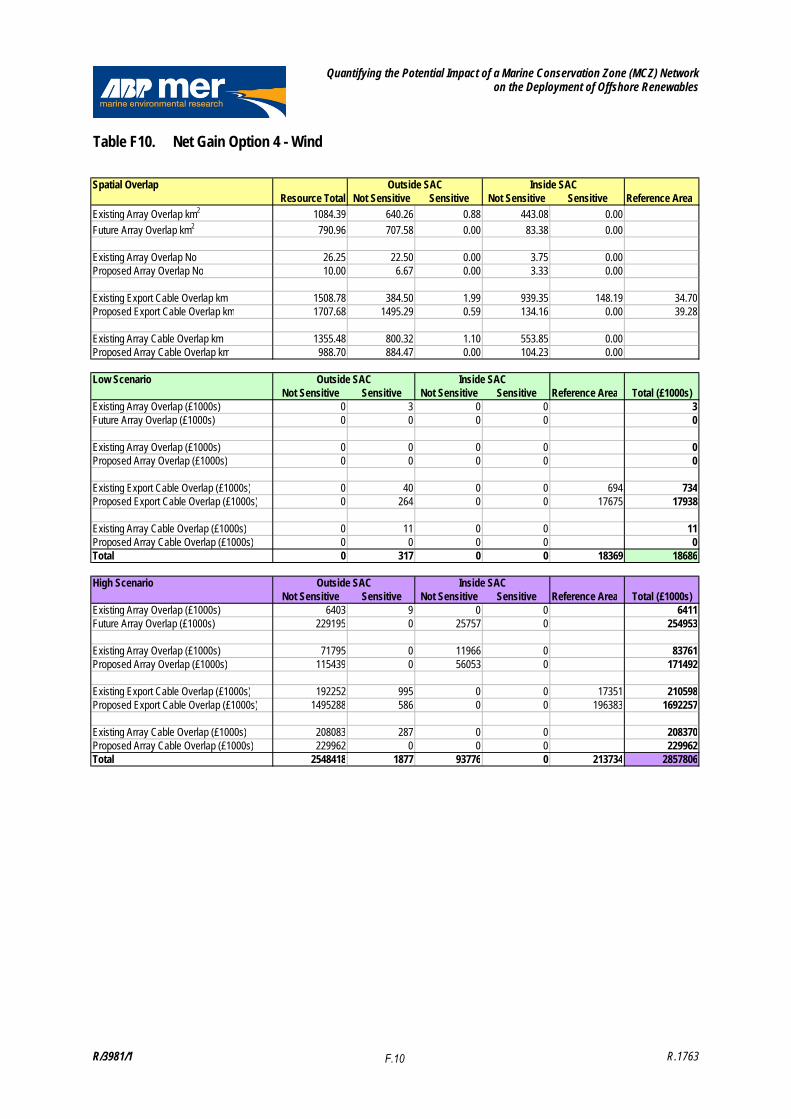
Quantifying the Potential Impact of a Marine Conservation Zone (MCZ) Network on the Deployment of Offshore Renewables
R/3981/1 R.1763
Table F10. Net Gain Option 4 - Wind
Spatial OverlapResource Total Not Sensitive Sensitive Not Sensitive Sensitive Reference Area
Existing Array Overlap km2 1084.39 640.26 0.88 443.08 0.00
Future Array Overlap km2 790.96 707.58 0.00 83.38 0.00
Existing Array Overlap No 26.25 22.50 0.00 3.75 0.00Proposed Array Overlap No 10.00 6.67 0.00 3.33 0.00
Existing Export Cable Overlap km 1508.78 384.50 1.99 939.35 148.19 34.70Proposed Export Cable Overlap km 1707.68 1495.29 0.59 134.16 0.00 39.28
Existing Array Cable Overlap km 1355.48 800.32 1.10 553.85 0.00Proposed Array Cable Overlap km 988.70 884.47 0.00 104.23 0.00
Low ScenarioNot Sensitive Sensitive Not Sensitive Sensitive Reference Area Total (£1000s)
Existing Array Overlap (£1000s) 0 3 0 0 3Future Array Overlap (£1000s) 0 0 0 0 0
Existing Array Overlap (£1000s) 0 0 0 0 0Proposed Array Overlap (£1000s) 0 0 0 0 0
Existing Export Cable Overlap (£1000s) 0 40 0 0 694 734Proposed Export Cable Overlap (£1000s) 0 264 0 0 17675 17938
Existing Array Cable Overlap (£1000s) 0 11 0 0 11Proposed Array Cable Overlap (£1000s) 0 0 0 0 0Total 0 317 0 0 18369 18686
High ScenarioNot Sensitive Sensitive Not Sensitive Sensitive Reference Area Total (£1000s)
Existing Array Overlap (£1000s) 6403 9 0 0 6411Future Array Overlap (£1000s) 229195 0 25757 0 254953
Existing Array Overlap (£1000s) 71795 0 11966 0 83761Proposed Array Overlap (£1000s) 115439 0 56053 0 171492
Existing Export Cable Overlap (£1000s) 192252 995 0 0 17351 210598Proposed Export Cable Overlap (£1000s) 1495288 586 0 0 196383 1692257
Existing Array Cable Overlap (£1000s) 208083 287 0 0 208370Proposed Array Cable Overlap (£1000s) 229962 0 0 0 229962Total 2548418 1877 93776 0 213734 2857806
Outside SAC Inside SAC
Outside SAC Inside SAC
Inside SACOutside SAC
F.10

Quantifying the Potential Impact of a Marine Conservation Zone (MCZ) Network on the Deployment of Offshore Renewables
R/3981/1 R.1763
Table F11. Net Gain Option 4 - Wave
Spatial OverlapResource Total Not Sensitive Sensitive Not Sensitive Sensitive Reference Area
Existing Array Overlap km2 0.0 0.0 0.0 0.0 0.0
Future Array Overlap km2 4.1 3.2 0.0 0.7 0.2
Existing Array Overlap No 0.0 0.0 0.0 0.0 0.0Proposed Array Overlap No 2.0 1.6 0.0 0.4 0.1
Existing Export Cable Overlap km 0.0 0.0 0.0 0.0 0.0 0.0Proposed Export Cable Overlap km 13.6 12.2 0.0 1.1 0.0 0.3
Existing Array Cable Overlap km 0.0 0.0 0.0 0.0 0.0Proposed Array Cable Overlap km 40.7 31.7 0.1 7.2 1.7
Low ScenarioNot Sensitive Sensitive Not Sensitive Sensitive Reference Area Total (£1000s)
Existing Array Overlap (£1000s) 0 0 0 0 0Future Array Overlap (£1000s) 0 0 0 0 0
Existing Array Overlap (£1000s) 0 0 0 0 0Proposed Array Overlap (£1000s) 0 0 0 0 0
Existing Export Cable Overlap (£1000s) 0 0 0 0 0 0Proposed Export Cable Overlap (£1000s) 0 2 0 0 141 143
Existing Array Cable Overlap (£1000s) 0 0 0 0 0Proposed Array Cable Overlap (£1000s) 0 1 0 0 1Total 0 3 0 0 141 144
High ScenarioNot Sensitive Sensitive Not Sensitive Sensitive Reference Area Total (£1000s)
Existing Array Overlap (£1000s) 0 0 0 0 0Future Array Overlap (£1000s) 0 0 0 0 0
Existing Array Overlap (£1000s) 0 0 0 0 0Proposed Array Overlap (£1000s) 1270 5 229 53 1556
Existing Export Cable Overlap (£1000s) 0 0 0 0 0 0Proposed Export Cable Overlap (£1000s) 12211 5 0 0 1567 13782
Existing Array Cable Overlap (£1000s) 0 0 0 0 0Proposed Array Cable Overlap (£1000s) 8243 30 0 0 8272Total 21724 39 229 53 1567 23611
Outside SAC Inside SAC
Outside SAC Inside SAC
Outside SAC Inside SAC
F.11

Quantifying the Potential Impact of a Marine Conservation Zone (MCZ) Network on the Deployment of Offshore Renewables
R/3981/1 R.1763
Table F12. Net Gain Option 4 - Tide
Spatial OverlapResource Total Not Sensitive Sensitive Not Sensitive Sensitive Reference Area
Existing Array Overlap km2 0.8 0.0 0.0 0.8 0.0
Future Array Overlap km2 0.0 0.0 0.0 0.0 0.0
Existing Array Overlap No 0.4 0.0 0.0 0.4 0.0Proposed Array Overlap No 0.0 0.0 0.0 0.0 0.0
Existing Export Cable Overlap km 0.7 0.0 0.0 0.6 0.0 0.0Proposed Export Cable Overlap km 0.0 0.0 0.0 0.0 0.0 0.0
Existing Array Cable Overlap km 7.9 0.0 0.0 7.9 0.0Proposed Array Cable Overlap km 0.0 0.0 0.0 0.0 0.0
Low ScenarioNot Sensitive Sensitive Not Sensitive Sensitive Reference Area Total (£1000s)
Existing Array Overlap (£1000s) 0 0 0 0 0Future Array Overlap (£1000s) 0 0 0 0 0
Existing Array Overlap (£1000s) 0 0 0 0 0Proposed Array Overlap (£1000s) 0 0 0 0 0
Existing Export Cable Overlap (£1000s) 0 0 0 0 0 0Proposed Export Cable Overlap (£1000s) 0 0 0 0 0 0
Existing Array Cable Overlap (£1000s) 0 0 0 0 0Proposed Array Cable Overlap (£1000s) 0 0 0 0 0Total 0 0 0 0 0 0
High ScenarioNot Sensitive Sensitive Not Sensitive Sensitive Reference Area Total (£1000s)
Existing Array Overlap (£1000s) 0 0 0 0 0Future Array Overlap (£1000s) 0 0 0 0 0
Existing Array Overlap (£1000s) 0 0 272 0 272Proposed Array Overlap (£1000s) 0 0 0 0 0
Existing Export Cable Overlap (£1000s) 0 0 0 0 8 8Proposed Export Cable Overlap (£1000s) 0 0 0 0 0 0
Existing Array Cable Overlap (£1000s) 0 0 0 0 0Proposed Array Cable Overlap (£1000s) 0 0 0 0 0Total 0 0 272 0 8 280
Outside SAC Inside SAC
Outside SAC Inside SAC
Outside SAC Inside SAC
F.12
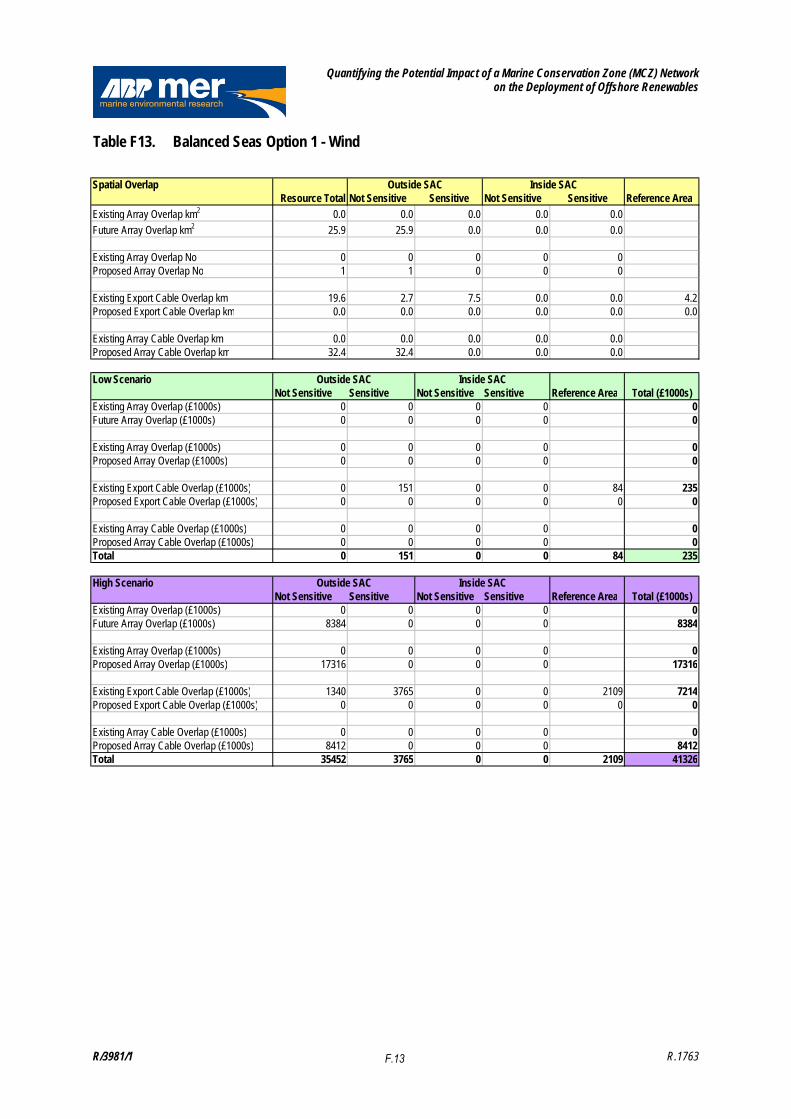
Quantifying the Potential Impact of a Marine Conservation Zone (MCZ) Network on the Deployment of Offshore Renewables
R/3981/1 R.1763
Table F13. Balanced Seas Option 1 - Wind
Spatial OverlapResource Total Not Sensitive Sensitive Not Sensitive Sensitive Reference Area
Existing Array Overlap km2 0.0 0.0 0.0 0.0 0.0
Future Array Overlap km2 25.9 25.9 0.0 0.0 0.0
Existing Array Overlap No 0 0 0 0 0Proposed Array Overlap No 1 1 0 0 0
Existing Export Cable Overlap km 19.6 2.7 7.5 0.0 0.0 4.2Proposed Export Cable Overlap km 0.0 0.0 0.0 0.0 0.0 0.0
Existing Array Cable Overlap km 0.0 0.0 0.0 0.0 0.0Proposed Array Cable Overlap km 32.4 32.4 0.0 0.0 0.0
Low ScenarioNot Sensitive Sensitive Not Sensitive Sensitive Reference Area Total (£1000s)
Existing Array Overlap (£1000s) 0 0 0 0 0Future Array Overlap (£1000s) 0 0 0 0 0
Existing Array Overlap (£1000s) 0 0 0 0 0Proposed Array Overlap (£1000s) 0 0 0 0 0
Existing Export Cable Overlap (£1000s) 0 151 0 0 84 235Proposed Export Cable Overlap (£1000s) 0 0 0 0 0 0
Existing Array Cable Overlap (£1000s) 0 0 0 0 0Proposed Array Cable Overlap (£1000s) 0 0 0 0 0Total 0 151 0 0 84 235
High ScenarioNot Sensitive Sensitive Not Sensitive Sensitive Reference Area Total (£1000s)
Existing Array Overlap (£1000s) 0 0 0 0 0Future Array Overlap (£1000s) 8384 0 0 0 8384
Existing Array Overlap (£1000s) 0 0 0 0 0Proposed Array Overlap (£1000s) 17316 0 0 0 17316
Existing Export Cable Overlap (£1000s) 1340 3765 0 0 2109 7214Proposed Export Cable Overlap (£1000s) 0 0 0 0 0 0
Existing Array Cable Overlap (£1000s) 0 0 0 0 0Proposed Array Cable Overlap (£1000s) 8412 0 0 0 8412Total 35452 3765 0 0 2109 41326
Outside SAC Inside SAC
Outside SAC Inside SAC
Outside SAC Inside SAC
F.13

Quantifying the Potential Impact of a Marine Conservation Zone (MCZ) Network on the Deployment of Offshore Renewables
R/3981/1 R.1763
Table F14. Balanced Seas Option 1 - Wave
Spatial OverlapResource Total Not Sensitive Sensitive Not Sensitive Sensitive Reference Area
Existing Array Overlap km2 0.0 0.0 0.0 0.0 0.0
Future Array Overlap km2 0.78 0.6 0.0 0.1 0.0
Existing Array Overlap No 0 0.0 0.0 0.0 0.0Proposed Array Overlap No 0.4 0.3 0.0 0.1 0.0
Existing Export Cable Overlap km 0.0 0.0 0.0 0.0 0.0 0.0Proposed Export Cable Overlap km 0.0 0.0 0.0 0.0 0.0 0.0
Existing Array Cable Overlap km 0.0 0.0 0.0 0.0 0.0Proposed Array Cable Overlap km 7.8 6.0 0.3 1.5 0.1
Low ScenarioNot Sensitive Sensitive Not Sensitive Sensitive Reference Area Total (£1000s)
Existing Array Overlap (£1000s) 0 0 0 0 0Future Array Overlap (£1000s) 0 0 0 0 0
Existing Array Overlap (£1000s) 0 0 0 0 0Proposed Array Overlap (£1000s) 0 0 0 0 0
Existing Export Cable Overlap (£1000s) 0 0 0 0 0 0Proposed Export Cable Overlap (£1000s) 0 0 0 0 0 0
Existing Array Cable Overlap (£1000s) 0 0 0 0 0Proposed Array Cable Overlap (£1000s) 0 3 0 0 3Total 0 3 0 0 0 3
High ScenarioNot Sensitive Sensitive Not Sensitive Sensitive Reference Area Total (£1000s)
Existing Array Overlap (£1000s) 0 0 0 0 0Future Array Overlap (£1000s) 0 0 0 0 0
Existing Array Overlap (£1000s) 0 0 0 0 0Proposed Array Overlap (£1000s) 240 10 48 2 299
Existing Export Cable Overlap (£1000s) 0 0 0 0 0 0Proposed Export Cable Overlap (£1000s) 0 0 0 0 0 0
Existing Array Cable Overlap (£1000s) 0 0 0 0 0Proposed Array Cable Overlap (£1000s) 1556 66 0 0 1623Total 1796 77 48 2 0 1922
Outside SAC Inside SAC
Outside SAC Inside SAC
Outside SAC Inside SAC
F.14
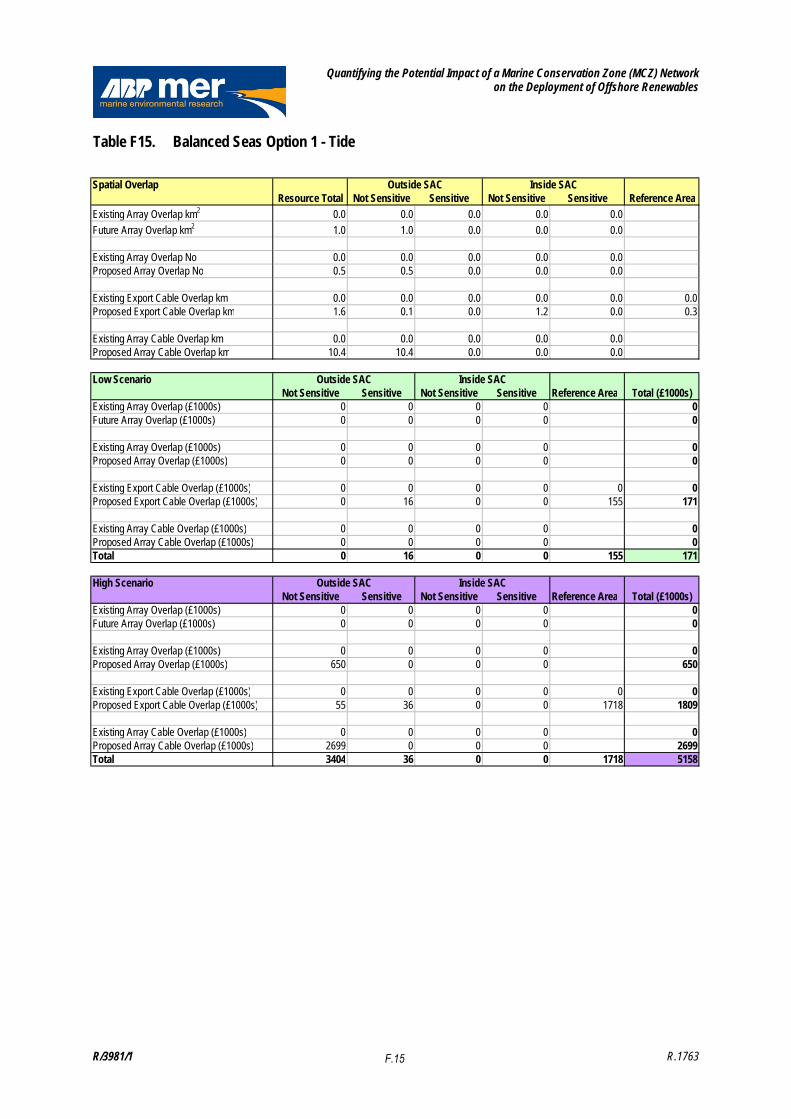
Quantifying the Potential Impact of a Marine Conservation Zone (MCZ) Network on the Deployment of Offshore Renewables
R/3981/1 R.1763
Table F15. Balanced Seas Option 1 - Tide
Spatial OverlapResource Total Not Sensitive Sensitive Not Sensitive Sensitive Reference Area
Existing Array Overlap km2 0.0 0.0 0.0 0.0 0.0
Future Array Overlap km2 1.0 1.0 0.0 0.0 0.0
Existing Array Overlap No 0.0 0.0 0.0 0.0 0.0Proposed Array Overlap No 0.5 0.5 0.0 0.0 0.0
Existing Export Cable Overlap km 0.0 0.0 0.0 0.0 0.0 0.0Proposed Export Cable Overlap km 1.6 0.1 0.0 1.2 0.0 0.3
Existing Array Cable Overlap km 0.0 0.0 0.0 0.0 0.0Proposed Array Cable Overlap km 10.4 10.4 0.0 0.0 0.0
Low ScenarioNot Sensitive Sensitive Not Sensitive Sensitive Reference Area Total (£1000s)
Existing Array Overlap (£1000s) 0 0 0 0 0Future Array Overlap (£1000s) 0 0 0 0 0
Existing Array Overlap (£1000s) 0 0 0 0 0Proposed Array Overlap (£1000s) 0 0 0 0 0
Existing Export Cable Overlap (£1000s) 0 0 0 0 0 0Proposed Export Cable Overlap (£1000s) 0 16 0 0 155 171
Existing Array Cable Overlap (£1000s) 0 0 0 0 0Proposed Array Cable Overlap (£1000s) 0 0 0 0 0Total 0 16 0 0 155 171
High ScenarioNot Sensitive Sensitive Not Sensitive Sensitive Reference Area Total (£1000s)
Existing Array Overlap (£1000s) 0 0 0 0 0Future Array Overlap (£1000s) 0 0 0 0 0
Existing Array Overlap (£1000s) 0 0 0 0 0Proposed Array Overlap (£1000s) 650 0 0 0 650
Existing Export Cable Overlap (£1000s) 0 0 0 0 0 0Proposed Export Cable Overlap (£1000s) 55 36 0 0 1718 1809
Existing Array Cable Overlap (£1000s) 0 0 0 0 0Proposed Array Cable Overlap (£1000s) 2699 0 0 0 2699Total 3404 36 0 0 1718 5158
Outside SAC Inside SAC
Outside SAC Inside SAC
Outside SAC Inside SAC
F.15

Quantifying the Potential Impact of a Marine Conservation Zone (MCZ) Network on the Deployment of Offshore Renewables
R/3981/1 R.1763
Table F16. Balanced Seas Option 2 - Wind
Spatial OverlapResource Total Not Sensitive Sensitive Not Sensitive Sensitive Reference Area
Existing Array Overlap km2 261.1 93.1 0.0 168.0 0.0
Future Array Overlap km2 4.0 2.0 0.0 2.0 0.0
Existing Array Overlap No 3.0 3.0 0.0 0.0 0.0Proposed Array Overlap No 1.0 1.0 0.0 0.0 0.0
Existing Export Cable Overlap km 131.8 26.4 0.4 75.9 0.7 28.3Proposed Export Cable Overlap km 21.8 13.6 0.4 2.5 0.7 4.7
Existing Array Cable Overlap km 326.3 116.3 0.0 210.0 0.0Proposed Array Cable Overlap km 5.0 2.5 0.0 2.5 0.0
Low ScenarioNot Sensitive Sensitive Not Sensitive Sensitive Reference Area Total (£1000s)
Existing Array Overlap (£1000s) 0 0 0 0 0Future Array Overlap (£1000s) 0 0 0 0 0
Existing Array Overlap (£1000s) 0 0 0 0 0Proposed Array Overlap (£1000s) 0 0 0 0 0
Existing Export Cable Overlap (£1000s) 0 9 0 0 567 575Proposed Export Cable Overlap (£1000s) 0 195 0 0 2111 2306
Existing Array Cable Overlap (£1000s) 0 0 0 0 0Proposed Array Cable Overlap (£1000s) 0 0 0 0 0Total 0 204 0 0 2678 2881
High ScenarioNot Sensitive Sensitive Not Sensitive Sensitive Reference Area Total (£1000s)
Existing Array Overlap (£1000s) 931 0 0 0 931Future Array Overlap (£1000s) 640 0 626 0 1266
Existing Array Overlap (£1000s) 9573 0 0 0 9573Proposed Array Overlap (£1000s) 17316 0 0 0 17316
Existing Export Cable Overlap (£1000s) 13211 217 0 0 14170 27598Proposed Export Cable Overlap (£1000s) 13566 434 0 0 23454 37453
Existing Array Cable Overlap (£1000s) 30249 0 0 0 30249Proposed Array Cable Overlap (£1000s) 643 0 0 0 643Total 86129 650 626 0 37624 125028
Outside SAC Inside SAC
Outside SAC Inside SAC
Outside SAC Inside SAC
F.16

Quantifying the Potential Impact of a Marine Conservation Zone (MCZ) Network on the Deployment of Offshore Renewables
R/3981/1 R.1763
Table F17. Balanced Seas Option 2 - Wave
Spatial OverlapResource Total Not Sensitive Sensitive Not Sensitive Sensitive Reference Area
Existing Array Overlap km2 0.0 0.0 0.0 0.0 0.0
Future Array Overlap km2 1.3 0.9 0.0 0.3 0.0
Existing Array Overlap No 0.0 0.0 0.0 0.0 0.0Proposed Array Overlap No 0.6 0.4 0.0 0.2 0.0
Existing Export Cable Overlap km 0.0 0.0 0.0 0.0 0.0 0.0Proposed Export Cable Overlap km 1.0 0.6 0.0 0.1 0.0 0.2
Existing Array Cable Overlap km 0.0 0.0 0.0 0.0 0.0Proposed Array Cable Overlap km 13.0 9.0 0.4 3.4 0.2
Low ScenarioNot Sensitive Sensitive Not Sensitive Sensitive Reference Area Total (£1000s)
Existing Array Overlap (£1000s) 0 0 0 0 0Future Array Overlap (£1000s) 0 0 0 0 0
Existing Array Overlap (£1000s) 0 0 0 0 0Proposed Array Overlap (£1000s) 0 0 0 0 0
Existing Export Cable Overlap (£1000s) 0 0 0 0 0 0Proposed Export Cable Overlap (£1000s) 0 9 0 0 100 109
Existing Array Cable Overlap (£1000s) 0 0 0 0 0Proposed Array Cable Overlap (£1000s) 0 4 0 0 4Total 0 14 0 0 100 113
High ScenarioNot Sensitive Sensitive Not Sensitive Sensitive Reference Area Total (£1000s)
Existing Array Overlap (£1000s) 0 0 0 0 0Future Array Overlap (£1000s) 0 0 0 0 0
Existing Array Overlap (£1000s) 0 0 0 0 0Proposed Array Overlap (£1000s) 360 18 108 5 490
Existing Export Cable Overlap (£1000s) 0 0 0 0 0 0Proposed Export Cable Overlap (£1000s) 640 20 0 0 1106 1766
Existing Array Cable Overlap (£1000s) 0 0 0 0 0Proposed Array Cable Overlap (£1000s) 2333 114 0 0 2447Total 3332 152 108 5 1106 4703
Outside SAC Inside SAC
Outside SAC Inside SAC
Outside SAC Inside SAC
F.17

Quantifying the Potential Impact of a Marine Conservation Zone (MCZ) Network on the Deployment of Offshore Renewables
R/3981/1 R.1763
Table F18. Balanced Seas Option 2 - Tide
Spatial OverlapResource Total Not Sensitive Sensitive Not Sensitive Sensitive Reference Area
Existing Array Overlap km2 0.0 0.0 0.0 0.0 0.0
Future Array Overlap km2 1.0 1.0 0.0 0.0 0.0
Existing Array Overlap No 0.0 0.0 0.0 0.0 0.0Proposed Array Overlap No 0.5 0.5 0.0 0.0 0.0
Existing Export Cable Overlap km 0.0 0.0 0.0 0.0 0.0 0.0Proposed Export Cable Overlap km 1.6 0.1 0.0 1.2 0.0 0.3
Existing Array Cable Overlap km 0.0 0.0 0.0 0.0 0.0Proposed Array Cable Overlap km 10.4 10.4 0.0 0.0 0.0
Low ScenarioNot Sensitive Sensitive Not Sensitive Sensitive Reference Area Total (£1000s)
Existing Array Overlap (£1000s) 0 0 0 0 0Future Array Overlap (£1000s) 0 0 0 0 0
Existing Array Overlap (£1000s) 0 0 0 0 0Proposed Array Overlap (£1000s) 0 0 0 0 0
Existing Export Cable Overlap (£1000s) 0 0 0 0 0 0Proposed Export Cable Overlap (£1000s) 0 16 0 0 155 171
Existing Array Cable Overlap (£1000s) 0 0 0 0 0Proposed Array Cable Overlap (£1000s) 0 0 0 0 0Total 0 16 0 0 155 171
High ScenarioNot Sensitive Sensitive Not Sensitive Sensitive Reference Area Total (£1000s)
Existing Array Overlap (£1000s) 0 0 0 0 0Future Array Overlap (£1000s) 0 0 0 0 0
Existing Array Overlap (£1000s) 0 0 0 0 0Proposed Array Overlap (£1000s) 652 0 0 0 652
Existing Export Cable Overlap (£1000s) 0 0 0 0 0 0Proposed Export Cable Overlap (£1000s) 55 36 0 0 1718 1809
Existing Array Cable Overlap (£1000s) 0 0 0 0 0Proposed Array Cable Overlap (£1000s) 2709 0 0 0 2709Total 3415 36 0 0 1718 5170
Outside SAC Inside SAC
Outside SAC Inside SAC
Outside SAC Inside SAC
F.18

Quantifying the Potential Impact of a Marine Conservation Zone (MCZ) Network on the Deployment of Offshore Renewables
R/3981/1 R.1763
Table F19. Balanced Seas Option 3 - Wind
Spatial OverlapResource Total Not Sensitive Sensitive Not Sensitive Sensitive Reference Area
Existing Array Overlap km2 0.0 0.0 0.0 0.0 0.0
Future Array Overlap km2 8.6 8.6 0.0 0.0 0.0
Existing Array Overlap No 0 0 0 0 0Proposed Array Overlap No 0 0 0 0 0
Existing Export Cable Overlap km 8.7 1.2 3.3 0.0 0.0 1.9Proposed Export Cable Overlap km 0.0 0.0 0.0 0.0 0.0 0.0
Existing Array Cable Overlap km 12.3 2.1 6.0 0.0 0.0Proposed Array Cable Overlap km 10.8 10.8 0.0 0.0 0.0
Low ScenarioNot Sensitive Sensitive Not Sensitive Sensitive Total (£1000s)
Existing Array Overlap (£1000s) 0 0 0 0 0Future Array Overlap (£1000s) 0 0 0 0 0
Existing Array Overlap (£1000s) 0 0 0 0 0Proposed Array Overlap (£1000s) 0 0 0 0 0
Existing Export Cable Overlap (£1000s) 0 67 0 0 37 104Proposed Export Cable Overlap (£1000s) 0 0 0 0 0 0
Existing Array Cable Overlap (£1000s) 0 60 0 0 60Proposed Array Cable Overlap (£1000s) 0 0 0 0 0Total 0 127 0 0 37 164
High ScenarioNot Sensitive Sensitive Not Sensitive Sensitive Total (£1000s)
Existing Array Overlap (£1000s) 0 0 0 0 0Future Array Overlap (£1000s) 2795 0 0 0 2795
Existing Array Overlap (£1000s) 0 0 0 0 0Proposed Array Overlap (£1000s) 5772 0 0 0 5772
Existing Export Cable Overlap (£1000s) 596 1673 0 0 937 3206Proposed Export Cable Overlap (£1000s) 0 0 0 0 0 0
Existing Array Cable Overlap (£1000s) 555 1559 0 0 2114Proposed Array Cable Overlap (£1000s) 2804 0 0 0 2804Total 12521 3232 0 0 937 16690
Outside SAC Inside SAC
Outside SAC Inside SAC
Outside SAC Inside SACReference Area
Reference Area
F.19

Quantifying the Potential Impact of a Marine Conservation Zone (MCZ) Network on the Deployment of Offshore Renewables
R/3981/1 R.1763
Table F20. Balanced Seas Option 3 - Wave
Spatial OverlapResource Total Not Sensitive Sensitive Not Sensitive Sensitive Reference Area
Existing Array Overlap km2 0.0 0.0 0.0 0.0 0.0
Future Array Overlap km2 0.08 0.1 0.0 0.0 0.0
Existing Array Overlap No 0 0.0 0.0 0.0 0.0Proposed Array Overlap No 0.04 0.0 0.0 0.0 0.0
Existing Export Cable Overlap km 0 0.0 0.0 0.0 0.0 0.0Proposed Export Cable Overlap km 0.12 0.0 0.0 0.1 0.0 0.0
Existing Array Cable Overlap km 0 0.0 0.0 0.0 0.0Proposed Array Cable Overlap km 0.77 0.8 0.0 0.0 0.0
Low ScenarioNot Sensitive Sensitive Not Sensitive Sensitive Reference Area Total (£1000s)
Existing Array Overlap (£1000s) 0 0 0 0 0Future Array Overlap (£1000s) 0 0 0 0 0
Existing Array Overlap (£1000s) 0 0 0 0 0Proposed Array Overlap (£1000s) 0 0 0 0 0
Existing Export Cable Overlap (£1000s) 0 0 0 0 0 0Proposed Export Cable Overlap (£1000s) 0 1 0 0 12 13
Existing Array Cable Overlap (£1000s) 0 0 0 0 0Proposed Array Cable Overlap (£1000s) 0 0 0 0 0Total 0 1 0 0 12 13
High ScenarioNot Sensitive Sensitive Not Sensitive Sensitive Reference Area Total (£1000s)
Existing Array Overlap (£1000s) 0 0 0 0 0Future Array Overlap (£1000s) 0 0 0 0 0
Existing Array Overlap (£1000s) 0 0 0 0 0Proposed Array Overlap (£1000s) 31 0 0 0 31
Existing Export Cable Overlap (£1000s) 0 0 0 0 0 0Proposed Export Cable Overlap (£1000s) 4 3 0 0 132 139
Existing Array Cable Overlap (£1000s) 0 0 0 0 0Proposed Array Cable Overlap (£1000s) 200 0 0 0 200Total 235 3 0 0 132 370
Outside SAC Inside SAC
Outside SAC Inside SAC
Outside SAC Inside SAC
F.20

Quantifying the Potential Impact of a Marine Conservation Zone (MCZ) Network on the Deployment of Offshore Renewables
R/3981/1 R.1763
Table F21. Balanced Seas Option 3 - Tide
Spatial OverlapResource Total Not Sensitive Sensitive Not Sensitive Sensitive Reference Area
Existing Array Overlap km2 0.0 0.0 0.0 0.0 0.0
Future Array Overlap km2 0.2 0.2 0.0 0.0 0.0
Existing Array Overlap No 0.0 0.0 0.0 0.0 0.0Proposed Array Overlap No 0.1 0.1 0.0 0.0 0.0
Existing Export Cable Overlap km 0.0 0.0 0.0 0.0 0.0 0.0Proposed Export Cable Overlap km 0.6 0.0 0.0 0.5 0.0 0.1
Existing Array Cable Overlap km 0.0 0.0 0.0 0.0 0.0Proposed Array Cable Overlap km 2.2 2.2 0.0 0.0 0.0
Low ScenarioNot Sensitive Sensitive Not Sensitive Sensitive Reference Area Total (£1000s)
Existing Array Overlap (£1000s) 0 0 0 0 0Future Array Overlap (£1000s) 0 0 0 0 0
Existing Array Overlap (£1000s) 0 0 0 0 0Proposed Array Overlap (£1000s) 0 0 0 0 0
Existing Export Cable Overlap (£1000s) 0 0 0 0 0 0Proposed Export Cable Overlap (£1000s) 0 6 0 0 62 68
Existing Array Cable Overlap (£1000s) 0 0 0 0 0Proposed Array Cable Overlap (£1000s) 0 0 0 0 0Total 0 6 0 0 62 68
High ScenarioNot Sensitive Sensitive Not Sensitive Sensitive Reference Area Total (£1000s)
Existing Array Overlap (£1000s) 0 0 0 0 0Future Array Overlap (£1000s) 0 0 0 0 0
Existing Array Overlap (£1000s) 0 0 0 0 0Proposed Array Overlap (£1000s) 135 0 0 0 135
Existing Export Cable Overlap (£1000s) 0 0 0 0 0 0Proposed Export Cable Overlap (£1000s) 22 14 0 0 687 724
Existing Array Cable Overlap (£1000s) 0 0 0 0 0Proposed Array Cable Overlap (£1000s) 562 0 0 0 562Total 720 14 0 0 687 1421
Outside SAC Inside SAC
Outside SAC Inside SAC
Outside SAC Inside SAC
F.21
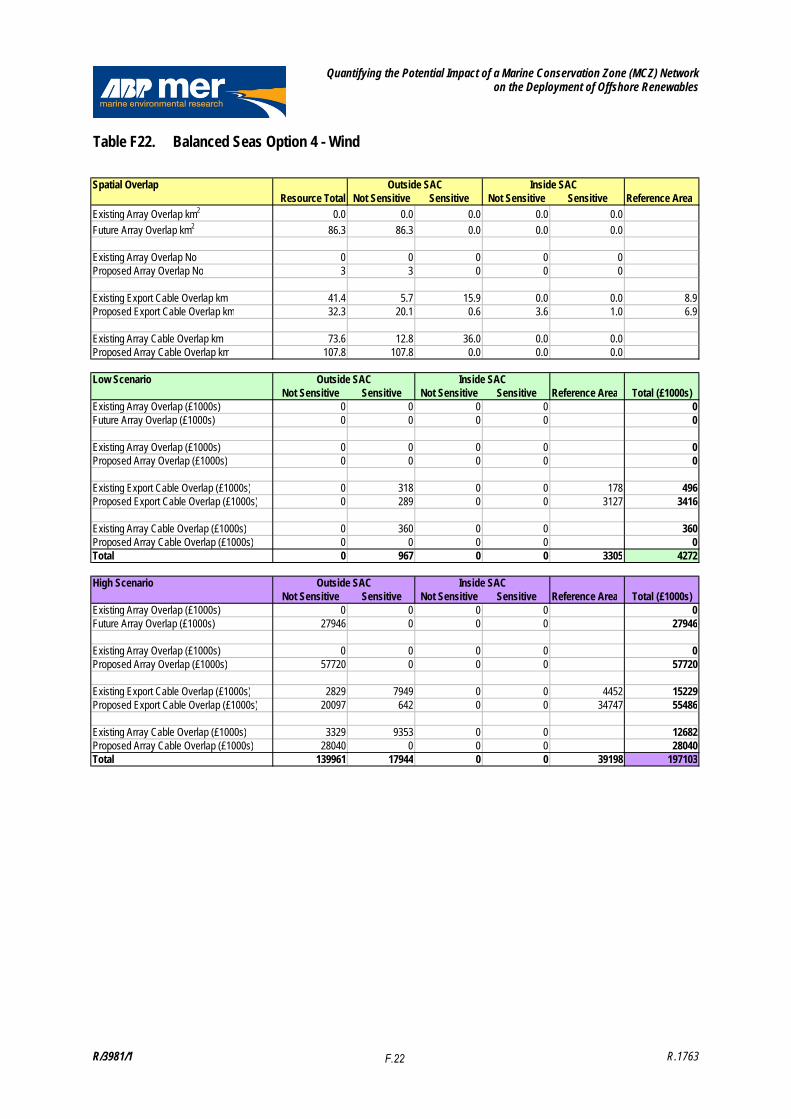
Quantifying the Potential Impact of a Marine Conservation Zone (MCZ) Network on the Deployment of Offshore Renewables
R/3981/1 R.1763
Table F22. Balanced Seas Option 4 - Wind
Spatial OverlapResource Total Not Sensitive Sensitive Not Sensitive Sensitive Reference Area
Existing Array Overlap km2 0.0 0.0 0.0 0.0 0.0
Future Array Overlap km2 86.3 86.3 0.0 0.0 0.0
Existing Array Overlap No 0 0 0 0 0Proposed Array Overlap No 3 3 0 0 0
Existing Export Cable Overlap km 41.4 5.7 15.9 0.0 0.0 8.9Proposed Export Cable Overlap km 32.3 20.1 0.6 3.6 1.0 6.9
Existing Array Cable Overlap km 73.6 12.8 36.0 0.0 0.0Proposed Array Cable Overlap km 107.8 107.8 0.0 0.0 0.0
Low ScenarioNot Sensitive Sensitive Not Sensitive Sensitive Reference Area Total (£1000s)
Existing Array Overlap (£1000s) 0 0 0 0 0Future Array Overlap (£1000s) 0 0 0 0 0
Existing Array Overlap (£1000s) 0 0 0 0 0Proposed Array Overlap (£1000s) 0 0 0 0 0
Existing Export Cable Overlap (£1000s) 0 318 0 0 178 496Proposed Export Cable Overlap (£1000s) 0 289 0 0 3127 3416
Existing Array Cable Overlap (£1000s) 0 360 0 0 360Proposed Array Cable Overlap (£1000s) 0 0 0 0 0Total 0 967 0 0 3305 4272
High ScenarioNot Sensitive Sensitive Not Sensitive Sensitive Reference Area Total (£1000s)
Existing Array Overlap (£1000s) 0 0 0 0 0Future Array Overlap (£1000s) 27946 0 0 0 27946
Existing Array Overlap (£1000s) 0 0 0 0 0Proposed Array Overlap (£1000s) 57720 0 0 0 57720
Existing Export Cable Overlap (£1000s) 2829 7949 0 0 4452 15229Proposed Export Cable Overlap (£1000s) 20097 642 0 0 34747 55486
Existing Array Cable Overlap (£1000s) 3329 9353 0 0 12682Proposed Array Cable Overlap (£1000s) 28040 0 0 0 28040Total 139961 17944 0 0 39198 197103
Outside SAC Inside SAC
Outside SAC Inside SAC
Outside SAC Inside SAC
F.22

Quantifying the Potential Impact of a Marine Conservation Zone (MCZ) Network on the Deployment of Offshore Renewables
R/3981/1 R.1763
Table F23. Balanced Seas Option 4 - Wave
Spatial OverlapResource Total Not Sensitive Sensitive Not Sensitive Sensitive Reference Area
Existing Array Overlap km2 0.0 0.0 0.0 0.0 0.0
Future Array Overlap km2 0.38 0.4 0.0 0.0 0.0
Existing Array Overlap No 0 0.0 0.0 0.0 0.0Proposed Array Overlap No 0.19 0.2 0.0 0.0 0.0
Existing Export Cable Overlap km 0.00 0.00 0.00 0.00 0.00 0.0Proposed Export Cable Overlap km 0.74 0.03 0.02 0.53 0.01 0.2
Existing Array Cable Overlap km 0 0.0 0.0 0.0 0.0Proposed Array Cable Overlap km 3.85 3.8 0.0 0.0 0.0
Low ScenarioNot Sensitive Sensitive Not Sensitive Sensitive Reference Area Total (£1000s)
Existing Array Overlap (£1000s) 0 0 0 0 0Future Array Overlap (£1000s) 0 0 0 0 0
Existing Array Overlap (£1000s) 0 0 0 0 0Proposed Array Overlap (£1000s) 0 0 0 0 0
Existing Export Cable Overlap (£1000s) 0 0 0 0 0 0Proposed Export Cable Overlap (£1000s) 0 11 0 0 71 83
Existing Array Cable Overlap (£1000s) 0 0 0 0 0Proposed Array Cable Overlap (£1000s) 0 0 0 0 0Total 0 11 0 0 71 83
High ScenarioNot Sensitive Sensitive Not Sensitive Sensitive Reference Area Total (£1000s)
Existing Array Overlap (£1000s) 0 0 0 0 0Future Array Overlap (£1000s) 0 0 0 0 0
Existing Array Overlap (£1000s) 0 0 0 0 0Proposed Array Overlap (£1000s) 154 0 0 0 154
Existing Export Cable Overlap (£1000s) 0 0 0 0 0 0Proposed Export Cable Overlap (£1000s) 25 17 0 0 793 835
Existing Array Cable Overlap (£1000s) 0 0 0 0 0Proposed Array Cable Overlap (£1000s) 1000 0 0 0 1000Total 1179 17 0 0 793 1989
Outside SAC Inside SAC
Outside SAC Inside SAC
Outside SAC Inside SAC
F.23

Quantifying the Potential Impact of a Marine Conservation Zone (MCZ) Network on the Deployment of Offshore Renewables
R/3981/1 R.1763
Table F24. Balanced Seas Option 4 - Tide
Spatial OverlapResource Total Not Sensitive Sensitive Not Sensitive Sensitive Reference Area
Existing Array Overlap km2 0 0.0 0.0 0.0 0.0
Future Array Overlap km2 1.73 1.7 0.0 0.0 0.0
Existing Array Overlap No 0.00 0.0 0.0 0.0 0.0Proposed Array Overlap No 0.87 0.9 0.0 0.0 0.0
Existing Export Cable Overlap km 0.00 0.0 0.0 0.0 0.0 0.0Proposed Export Cable Overlap km 3.20 0.1 0.1 2.3 0.0 0.7
Existing Array Cable Overlap km 0.00 0.0 0.0 0.0 0.0Proposed Array Cable Overlap km 17.30 17.3 0.0 0.0 0.0
Low ScenarioNot Sensitive Sensitive Not Sensitive Sensitive Reference Area Total (£1000s)
Existing Array Overlap (£1000s) 0 0 0 0 0Future Array Overlap (£1000s) 0 0 0 0 0
Existing Array Overlap (£1000s) 0 0 0 0 0Proposed Array Overlap (£1000s) 0 0 0 0 0
Existing Export Cable Overlap (£1000s) 0 0 0 0 0 0Proposed Export Cable Overlap (£1000s) 0 32 0 0 309 342
Existing Array Cable Overlap (£1000s) 0 0 0 0 0Proposed Array Cable Overlap (£1000s) 0 0 0 0 0Total 0 32 0 0 309 342
High ScenarioNot Sensitive Sensitive Not Sensitive Sensitive Reference Area Total (£1000s)
Existing Array Overlap (£1000s) 0 0 0 0 0Future Array Overlap (£1000s) 0 0 0 0 0
Existing Array Overlap (£1000s) 0 0 0 0 0Proposed Array Overlap (£1000s) 1083 0 0 0 1083
Existing Export Cable Overlap (£1000s) 0 0 0 0 0 0Proposed Export Cable Overlap (£1000s) 110 72 0 0 3437 3618
Existing Array Cable Overlap (£1000s) 0 0 0 0 0Proposed Array Cable Overlap (£1000s) 4499 0 0 0 4499Total 5691 72 0 0 3437 9200
Outside SAC Inside SAC
Outside SAC Inside SAC
Outside SAC Inside SAC
F.24

Quantifying the Potential Impact of a Marine Conservation Zone (MCZ) Network on the Deployment of Offshore Renewables
R/3981/1 R.1763
Table F25. Finding Sanctuary Option 1 (Co-location) - Wind
Spatial OverlapResource Total Not Sensitive Sensitive Not Sensitive Sensitive Reference Area
Existing Array Overlap km2 0 0 0 0 0
Future Array Overlap km2 353.6 351.0 2.6 0 0
Existing Array Overlap No 0 0 0 0 0Proposed Array Overlap No 3 2 1 0 0
Existing Export Cable Overlap km 0 0 0 0 0 0Proposed Export Cable Overlap km 15.1 13.6 0 0 0 1.4
Existing Array Cable Overlap km 0 0 0 0 0Proposed Array Cable Overlap km 442.0 438.7 3.3 0 0
Low ScenarioNot Sensitive Sensitive Not Sensitive Sensitive Reference Area Total (£1000s)
Existing Array Overlap (£1000s) 0 0 0 0 0Future Array Overlap (£1000s) 0 12 0 0 12
Existing Array Overlap (£1000s) 0 0 0 0 0Proposed Array Overlap (£1000s) 0 200 0 0 200
Existing Export Cable Overlap (£1000s) 0 0 0 0 0 0Proposed Export Cable Overlap (£1000s) 0 0 0 0 651 651
Existing Array Cable Overlap (£1000s) 0 0 0 0 0Proposed Array Cable Overlap (£1000s) 0 33 0 0 33Total 0 245 0 0 651 896
High ScenarioNot Sensitive Sensitive Not Sensitive Sensitive Reference Area Total (£1000s)
Existing Array Overlap (£1000s) 0 0 0 0 0Future Array Overlap (£1000s) 113692 856 0 0 114548
Existing Array Overlap (£1000s) 0 8432 0 0 8432Proposed Array Overlap (£1000s) 34632 17316 0 0 51948
Existing Export Cable Overlap (£1000s) 0 0 0 0 0 0Proposed Export Cable Overlap (£1000s) 13621 0 0 0 7232 20853
Existing Array Cable Overlap (£1000s) 0 0 0 0 0Proposed Array Cable Overlap (£1000s) 114072 859 0 0 114931Total 276017 27463 0 0 7232 310712
Outside SAC Inside SAC
Outside SAC Inside SAC
Outside SAC Inside SAC
F.25

Quantifying the Potential Impact of a Marine Conservation Zone (MCZ) Network on the Deployment of Offshore Renewables
R/3981/1 R.1763
Table F26. Finding Sanctuary Option 1 (Co-location) - Wave
Spatial OverlapResource Total Not Sensitive Sensitive Not Sensitive Sensitive Reference Area
Existing Array Overlap km2 0.0 0.0 0.0 0.0 0.0
Future Array Overlap km2 0.9 0 0 0.5 0.4
Existing Array Overlap No 0 0 0 0 0Proposed Array Overlap No 0.5 0 0 0.2 0.2
Existing Export Cable Overlap km 0.7 0.6 0.0 0 0 0.1Proposed Export Cable Overlap km 0.6 0.5 0 0 0 0.1
Existing Array Cable Overlap km 0 0 0 0 0Proposed Array Cable Overlap km 9.1 0 0 4.8 3.6
Low ScenarioNot Sensitive Sensitive Not Sensitive Sensitive Reference Area Total (£1000s)
Existing Array Overlap (£1000s) 0 0 0 0 0Future Array Overlap (£1000s) 0 0 0 0 0
Existing Array Overlap (£1000s) 0 0 0 0 0Proposed Array Overlap (£1000s) 0 0 0 0 0
Existing Export Cable Overlap (£1000s) 0 0 0 0 1 2Proposed Export Cable Overlap (£1000s) 0 0 0 0 25 25
Existing Array Cable Overlap (£1000s) 0 0 0 0 0Proposed Array Cable Overlap (£1000s) 0 0 0 0 0Total 0 0 0 0 26 27
High ScenarioNot Sensitive Sensitive Not Sensitive Sensitive Reference Area Total (£1000s)
Existing Array Overlap (£1000s) 0 0 0 0 0Future Array Overlap (£1000s) 0 0 0 0 0
Existing Array Overlap (£1000s) 0 0 0 0 0Proposed Array Overlap (£1000s) 0 0 153 114 267
Existing Export Cable Overlap (£1000s) 323 11 0 0 36 370Proposed Export Cable Overlap (£1000s) 518 0 0 0 275 794
Existing Array Cable Overlap (£1000s) 0 0 0 0 0Proposed Array Cable Overlap (£1000s) 0 0 0 0 0Total 842 11 153 114 311 1431
Outside SAC Inside SAC
Outside SAC Inside SAC
Outside SAC Inside SAC
F.26
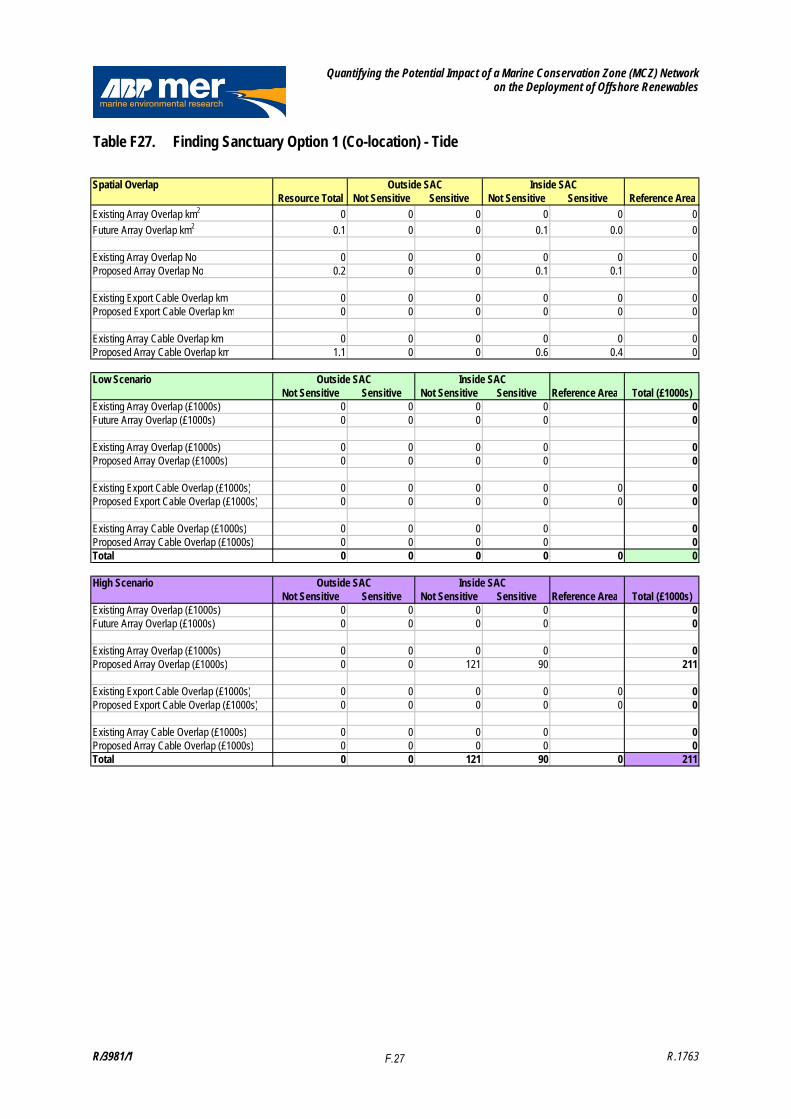
Quantifying the Potential Impact of a Marine Conservation Zone (MCZ) Network on the Deployment of Offshore Renewables
R/3981/1 R.1763
Table F27. Finding Sanctuary Option 1 (Co-location) - Tide
Spatial OverlapResource Total Not Sensitive Sensitive Not Sensitive Sensitive Reference Area
Existing Array Overlap km2 0 0 0 0 0 0
Future Array Overlap km2 0.1 0 0 0.1 0.0 0
Existing Array Overlap No 0 0 0 0 0 0Proposed Array Overlap No 0.2 0 0 0.1 0.1 0
Existing Export Cable Overlap km 0 0 0 0 0 0Proposed Export Cable Overlap km 0 0 0 0 0 0
Existing Array Cable Overlap km 0 0 0 0 0 0Proposed Array Cable Overlap km 1.1 0 0 0.6 0.4 0
Low ScenarioNot Sensitive Sensitive Not Sensitive Sensitive Reference Area Total (£1000s)
Existing Array Overlap (£1000s) 0 0 0 0 0Future Array Overlap (£1000s) 0 0 0 0 0
Existing Array Overlap (£1000s) 0 0 0 0 0Proposed Array Overlap (£1000s) 0 0 0 0 0
Existing Export Cable Overlap (£1000s) 0 0 0 0 0 0Proposed Export Cable Overlap (£1000s) 0 0 0 0 0 0
Existing Array Cable Overlap (£1000s) 0 0 0 0 0Proposed Array Cable Overlap (£1000s) 0 0 0 0 0Total 0 0 0 0 0 0
High ScenarioNot Sensitive Sensitive Not Sensitive Sensitive Reference Area Total (£1000s)
Existing Array Overlap (£1000s) 0 0 0 0 0Future Array Overlap (£1000s) 0 0 0 0 0
Existing Array Overlap (£1000s) 0 0 0 0 0Proposed Array Overlap (£1000s) 0 0 121 90 211
Existing Export Cable Overlap (£1000s) 0 0 0 0 0 0Proposed Export Cable Overlap (£1000s) 0 0 0 0 0 0
Existing Array Cable Overlap (£1000s) 0 0 0 0 0Proposed Array Cable Overlap (£1000s) 0 0 0 0 0Total 0 0 121 90 0 211
Outside SAC Inside SAC
Outside SAC Inside SAC
Outside SAC Inside SAC
F.27
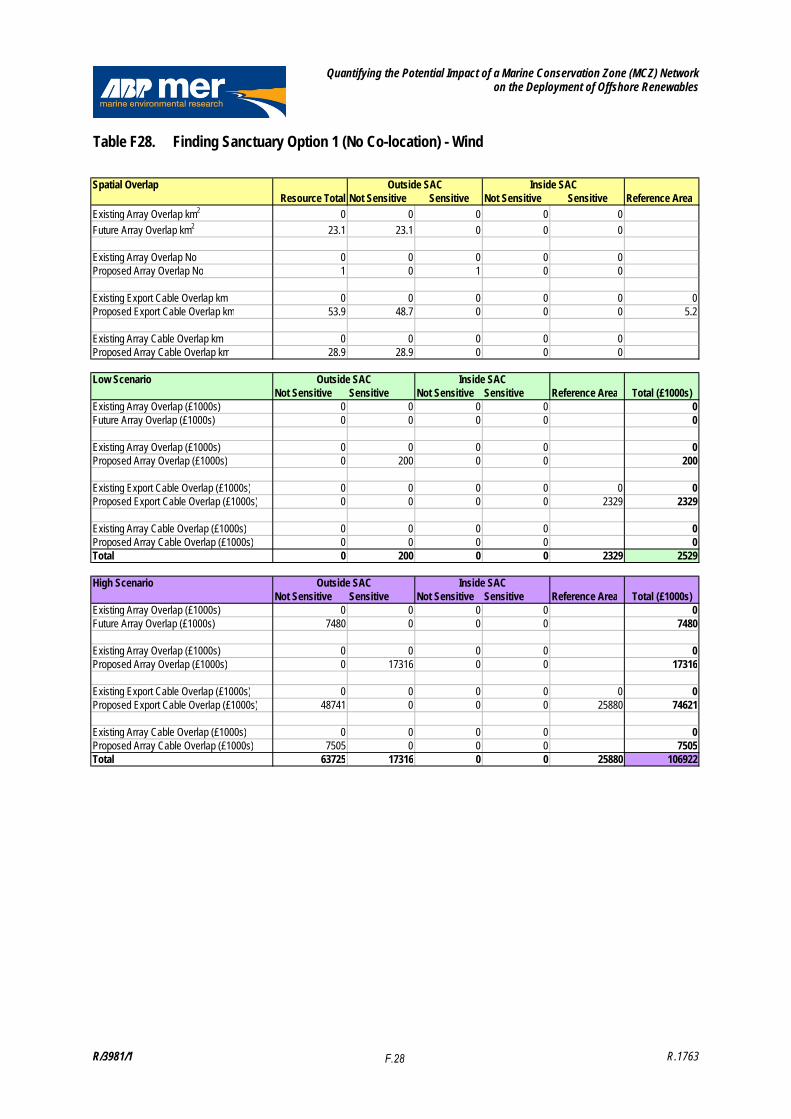
Quantifying the Potential Impact of a Marine Conservation Zone (MCZ) Network on the Deployment of Offshore Renewables
R/3981/1 R.1763
Table F28. Finding Sanctuary Option 1 (No Co-location) - Wind
Spatial OverlapResource Total Not Sensitive Sensitive Not Sensitive Sensitive Reference Area
Existing Array Overlap km2 0 0 0 0 0
Future Array Overlap km2 23.1 23.1 0 0 0
Existing Array Overlap No 0 0 0 0 0Proposed Array Overlap No 1 0 1 0 0
Existing Export Cable Overlap km 0 0 0 0 0 0Proposed Export Cable Overlap km 53.9 48.7 0 0 0 5.2
Existing Array Cable Overlap km 0 0 0 0 0Proposed Array Cable Overlap km 28.9 28.9 0 0 0
Low ScenarioNot Sensitive Sensitive Not Sensitive Sensitive Reference Area Total (£1000s)
Existing Array Overlap (£1000s) 0 0 0 0 0Future Array Overlap (£1000s) 0 0 0 0 0
Existing Array Overlap (£1000s) 0 0 0 0 0Proposed Array Overlap (£1000s) 0 200 0 0 200
Existing Export Cable Overlap (£1000s) 0 0 0 0 0 0Proposed Export Cable Overlap (£1000s) 0 0 0 0 2329 2329
Existing Array Cable Overlap (£1000s) 0 0 0 0 0Proposed Array Cable Overlap (£1000s) 0 0 0 0 0Total 0 200 0 0 2329 2529
High ScenarioNot Sensitive Sensitive Not Sensitive Sensitive Reference Area Total (£1000s)
Existing Array Overlap (£1000s) 0 0 0 0 0Future Array Overlap (£1000s) 7480 0 0 0 7480
Existing Array Overlap (£1000s) 0 0 0 0 0Proposed Array Overlap (£1000s) 0 17316 0 0 17316
Existing Export Cable Overlap (£1000s) 0 0 0 0 0 0Proposed Export Cable Overlap (£1000s) 48741 0 0 0 25880 74621
Existing Array Cable Overlap (£1000s) 0 0 0 0 0Proposed Array Cable Overlap (£1000s) 7505 0 0 0 7505Total 63725 17316 0 0 25880 106922
Outside SAC Inside SAC
Outside SAC Inside SAC
Outside SAC Inside SAC
F.28

Quantifying the Potential Impact of a Marine Conservation Zone (MCZ) Network on the Deployment of Offshore Renewables
R/3981/1 R.1763
Table F29. Finding Sanctuary Option 1 (No Co-location) - Wave
Spatial OverlapResource Total Not Sensitive Sensitive Not Sensitive Sensitive Reference Area
Existing Array Overlap km2 0.0 0.0 0.0 0.0 0.0
Future Array Overlap km2 0.9 0.7 0.1 0.0 0.1
Existing Array Overlap No 0 0 0 0 0Proposed Array Overlap No 0.5 0.4 0.1 0.0 0.0
Existing Export Cable Overlap km 0.7 0.6 0.0 0 0 0.1Proposed Export Cable Overlap km 2.1 1.9 0 0 0 0.2
Existing Array Cable Overlap km 0 0 0 0 0Proposed Array Cable Overlap km 9.3 7.2 1.2 0.3 0.5
Low ScenarioNot Sensitive Sensitive Not Sensitive Sensitive Reference Area Total (£1000s)
Existing Array Overlap (£1000s) 0 0 0 0 0Future Array Overlap (£1000s) 0 0 0 0 0
Existing Array Overlap (£1000s) 0 0 0 0 0Proposed Array Overlap (£1000s) 0 1 0 0 1
Existing Export Cable Overlap (£1000s) 0 0 0 0 1 2Proposed Export Cable Overlap (£1000s) 0 0 0 0 89 89
Existing Array Cable Overlap (£1000s) 0 0 0 0 0Proposed Array Cable Overlap (£1000s) 0 12 0 0 12Total 0 13 0 0 90 103
High ScenarioNot Sensitive Sensitive Not Sensitive Sensitive Reference Area Total (£1000s)
Existing Array Overlap (£1000s) 0 0 0 0 0Future Array Overlap (£1000s) 0 0 0 0 0
Existing Array Overlap (£1000s) 0 0 0 0 0Proposed Array Overlap (£1000s) 290 48 10 17 366
Existing Export Cable Overlap (£1000s) 323 11 0 0 36 370Proposed Export Cable Overlap (£1000s) 1855 0 0 0 985 2840
Existing Array Cable Overlap (£1000s) 0 0 0 0 0Proposed Array Cable Overlap (£1000s) 1883 313 0 0 2196Total 4352 373 10 17 1021 5773
Outside SAC Inside SAC
Outside SAC Inside SAC
Outside SAC Inside SAC
F.29
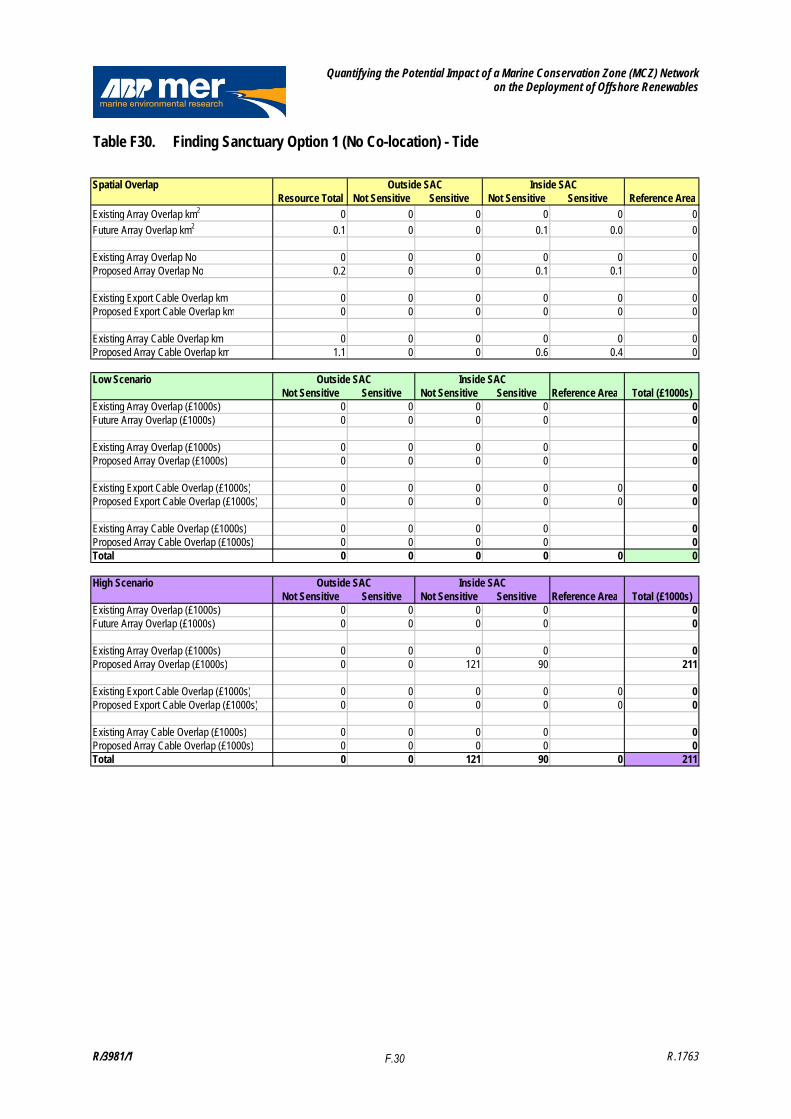
Quantifying the Potential Impact of a Marine Conservation Zone (MCZ) Network on the Deployment of Offshore Renewables
R/3981/1 R.1763
Table F30. Finding Sanctuary Option 1 (No Co-location) - Tide
Spatial OverlapResource Total Not Sensitive Sensitive Not Sensitive Sensitive Reference Area
Existing Array Overlap km2 0 0 0 0 0 0
Future Array Overlap km2 0.1 0 0 0.1 0.0 0
Existing Array Overlap No 0 0 0 0 0 0Proposed Array Overlap No 0.2 0 0 0.1 0.1 0
Existing Export Cable Overlap km 0 0 0 0 0 0Proposed Export Cable Overlap km 0 0 0 0 0 0
Existing Array Cable Overlap km 0 0 0 0 0 0Proposed Array Cable Overlap km 1.1 0 0 0.6 0.4 0
Low ScenarioNot Sensitive Sensitive Not Sensitive Sensitive Reference Area Total (£1000s)
Existing Array Overlap (£1000s) 0 0 0 0 0Future Array Overlap (£1000s) 0 0 0 0 0
Existing Array Overlap (£1000s) 0 0 0 0 0Proposed Array Overlap (£1000s) 0 0 0 0 0
Existing Export Cable Overlap (£1000s) 0 0 0 0 0 0Proposed Export Cable Overlap (£1000s) 0 0 0 0 0 0
Existing Array Cable Overlap (£1000s) 0 0 0 0 0Proposed Array Cable Overlap (£1000s) 0 0 0 0 0Total 0 0 0 0 0 0
High ScenarioNot Sensitive Sensitive Not Sensitive Sensitive Reference Area Total (£1000s)
Existing Array Overlap (£1000s) 0 0 0 0 0Future Array Overlap (£1000s) 0 0 0 0 0
Existing Array Overlap (£1000s) 0 0 0 0 0Proposed Array Overlap (£1000s) 0 0 121 90 211
Existing Export Cable Overlap (£1000s) 0 0 0 0 0 0Proposed Export Cable Overlap (£1000s) 0 0 0 0 0 0
Existing Array Cable Overlap (£1000s) 0 0 0 0 0Proposed Array Cable Overlap (£1000s) 0 0 0 0 0Total 0 0 121 90 0 211
Outside SAC Inside SAC
Outside SAC Inside SAC
Outside SAC Inside SAC
F.30
Quantifying the Potential Impact of a Marine Conservation Zone (MCZ) Network on the Deployment of Offshore Renewables
R/3981/1 R.1763
Table F31. Finding Sanctuary Option 2 - Wind
Spatial OverlapResource Total Not Sensitive Sensitive Not Sensitive Sensitive Reference Area
Existing Array Overlap km2 0 0 0 0 0
Future Array Overlap km2 100.0 98.7 1.4 0 0
Existing Array Overlap No 0 0 0 0 0Proposed Array Overlap No 1 0 1 0 0
Existing Export Cable Overlap km 0 0 0 0 0Proposed Export Cable Overlap km 115.8 104.7 0 0 0 11.1
Existing Array Cable Overlap km 0 0 0 0 0Proposed Array Cable Overlap km 125.0 123.3 1.7 0 0
Low ScenarioNot Sensitive Sensitive Not Sensitive Sensitive Reference Area Total (£1000s)
Existing Array Overlap (£1000s) 0 0 0 0 0Future Array Overlap (£1000s) 0 6 0 0 6
Existing Array Overlap (£1000s) 0 0 0 0 0Proposed Array Overlap (£1000s) 0 200 0 0 200
Existing Export Cable Overlap (£1000s) 0 0 0 0 0 0Proposed Export Cable Overlap (£1000s) 0 0 0 0 5004 5004
Existing Array Cable Overlap (£1000s) 0 0 0 0 0Proposed Array Cable Overlap (£1000s) 0 17 0 0 17Total 0 223 0 0 5004 5227
High ScenarioNot Sensitive Sensitive Not Sensitive Sensitive Reference Area Total (£1000s)
Existing Array Overlap (£1000s) 0 0 0 0 0Future Array Overlap (£1000s) 31956 439 0 0 32394
Existing Array Overlap (£1000s) 0 4321 0 0 4321Proposed Array Overlap (£1000s) 0 17316 0 0 17316
Existing Export Cable Overlap (£1000s) 0 0 0 0 0 0Proposed Export Cable Overlap (£1000s) 104708 0 0 0 55597 160306
Existing Array Cable Overlap (£1000s) 0 0 0 0 0Proposed Array Cable Overlap (£1000s) 32063 440 0 0 32503Total 168727 22516 0 0 55597 246840
Outside SAC Inside SAC
Outside SAC Inside SAC
Outside SAC Inside SAC
F.31
Quantifying the Potential Impact of a Marine Conservation Zone (MCZ) Network on the Deployment of Offshore Renewables
R/3981/1 R.1763
Table F32. Finding Sanctuary Option 2 - Wave
Spatial OverlapResource Total Not Sensitive Sensitive Not Sensitive Sensitive Reference Area
Existing Array Overlap km2 0.0 0.0 0.0 0.0 0.0
Future Array Overlap km2 2.2 1.3 0.1 0.4 0.4
Existing Array Overlap No 0 0 0 0 0Proposed Array Overlap No 1.1 0.7 0.0 0.2 0.2
Existing Export Cable Overlap km 0 0 0 0 0Proposed Export Cable Overlap km 4.4 4.0 0 0 0 0.4
Existing Array Cable Overlap km 0 0 0 0 0Proposed Array Cable Overlap km 22.1 13.2 0.8 4.4 3.8
Low ScenarioNot Sensitive Sensitive Not Sensitive Sensitive Reference Area Total (£1000s)
Existing Array Overlap (£1000s) 0 0 0 0 0Future Array Overlap (£1000s) 0 0 0 0 0
Existing Array Overlap (£1000s) 0 0 0 0 0Proposed Array Overlap (£1000s) 0 0 0 0 0
Existing Export Cable Overlap (£1000s) 0 0 0 0 0 0Proposed Export Cable Overlap (£1000s) 0 0 0 0 190 190
Existing Array Cable Overlap (£1000s) 0 0 0 0 0Proposed Array Cable Overlap (£1000s) 0 8 0 0 8Total 0 8 0 0 190 199
High ScenarioNot Sensitive Sensitive Not Sensitive Sensitive Reference Area Total (£1000s)
Existing Array Overlap (£1000s) 0 0 0 0 0Future Array Overlap (£1000s) 0 0 0 0 0
Existing Array Overlap (£1000s) 0 0 0 0 0Proposed Array Overlap (£1000s) 527 31 140 119 817
Existing Export Cable Overlap (£1000s) 0 0 0 0 0 0Proposed Export Cable Overlap (£1000s) 3986 0 0 0 2116 6102
Existing Array Cable Overlap (£1000s) 0 0 0 0 0Proposed Array Cable Overlap (£1000s) 3420 202 0 0 3622Total 7932 233 140 119 2116 10541
Outside SAC Inside SAC
Outside SAC Inside SAC
Outside SAC Inside SAC
F.32

Quantifying the Potential Impact of a Marine Conservation Zone (MCZ) Network on the Deployment of Offshore Renewables
R/3981/1 R.1763
Table F33. Finding Sanctuary Option 2 - Tide
Spatial OverlapResource Total Not Sensitive Sensitive Not Sensitive Sensitive Reference Area
Existing Array Overlap km2 0 0 0 0 0 0
Future Array Overlap km2 3.8 0 0 2.3 1.5 0
Existing Array Overlap No 0 0 0 0 0 0Proposed Array Overlap No 1.9 0 0 1.1 0.7 0
Existing Export Cable Overlap km 0 0 0 0 0 0Proposed Export Cable Overlap km 4.7 0 0 0.9 3.4 0.5
Existing Array Cable Overlap km 0 0 0 0 0 0Proposed Array Cable Overlap km 37.6 0 0 22.6 14.9 0
Low ScenarioNot Sensitive Sensitive Not Sensitive Sensitive Reference Area Total (£1000s)
Existing Array Overlap (£1000s) 0 0 0 0 0Future Array Overlap (£1000s) 0 0 0 0 0
Existing Array Overlap (£1000s) 0 0 0 0 0Proposed Array Overlap (£1000s) 0 0 0 0 0
Existing Export Cable Overlap (£1000s) 0 0 0 0 0 0Proposed Export Cable Overlap (£1000s) 0 0 0 0 204 204
Existing Array Cable Overlap (£1000s) 0 0 0 0 0Proposed Array Cable Overlap (£1000s) 0 0 0 0 0Total 0 0 0 0 204 204
High ScenarioNot Sensitive Sensitive Not Sensitive Sensitive Reference Area Total (£1000s)
Existing Array Overlap (£1000s) 0 0 0 0 0Future Array Overlap (£1000s) 0 0 0 0 0
Existing Array Overlap (£1000s) 0 0 0 0 0Proposed Array Overlap (£1000s) 0 0 1229 809 2038
Existing Export Cable Overlap (£1000s) 0 0 0 0 0 0Proposed Export Cable Overlap (£1000s) 0 0 0 0 2263 2263
Existing Array Cable Overlap (£1000s) 0 0 0 0 0Proposed Array Cable Overlap (£1000s) 0 0 0 0 0Total 0 0 1229 809 2263 4302
Outside SAC Inside SAC
Outside SAC Inside SAC
Outside SAC Inside SAC
F.33

Quantifying the Potential Impact of a Marine Conservation Zone (MCZ) Network on the Deployment of Offshore Renewables
R/3981/1 R.1763
Table F34. Finding Sanctuary Option 3 - Wind
Spatial OverlapResource Total Not Sensitive Sensitive Not Sensitive Sensitive Reference Area
Existing Array Overlap km2 0 0 0 0 0
Future Array Overlap km2 117.9 117.0 0.9 0 0
Existing Array Overlap No 0 0 0 0 0Proposed Array Overlap No 1 0.7 0.3 0 0
Existing Export Cable Overlap km 0 0 0 0 0Proposed Export Cable Overlap km 5.6 5.0 0 0 0 0.5
Existing Array Cable Overlap km 0 0 0 0 0Proposed Array Cable Overlap km 163.7 162.5 1.2 0 0
Low ScenarioNot Sensitive Sensitive Not Sensitive Sensitive Reference Area Total (£1000s)
Existing Array Overlap (£1000s) 0 0 0 0 0Future Array Overlap (£1000s) 0 4 0 0 4
Existing Array Overlap (£1000s) 0 0 0 0 0Proposed Array Overlap (£1000s) 0 67 0 0 67
Existing Export Cable Overlap (£1000s) 0 0 0 0 0 0Proposed Export Cable Overlap (£1000s) 0 0 0 0 241 241
Existing Array Cable Overlap (£1000s) 0 0 0 0 0Proposed Array Cable Overlap (£1000s) 0 12 0 0 12Total 0 83 0 0 241 324
High ScenarioNot Sensitive Sensitive Not Sensitive Sensitive Reference Area Total (£1000s)
Existing Array Overlap (£1000s) 0 0 0 0 0Future Array Overlap (£1000s) 37897 285 0 0 38183
Existing Array Overlap (£1000s) 0 2811 0 0 2811Proposed Array Overlap (£1000s) 11544 5772 0 0 17316
Existing Export Cable Overlap (£1000s) 0 0 0 0 0 0Proposed Export Cable Overlap (£1000s) 5045 0 0 0 2679 7723
Existing Array Cable Overlap (£1000s) 0 0 0 0 0Proposed Array Cable Overlap (£1000s) 42249 318 0 0 42567Total 96735 9186 0 0 2679 108600
Outside SAC Inside SAC
Outside SAC Inside SAC
Outside SAC Inside SAC
F.34
Quantifying the Potential Impact of a Marine Conservation Zone (MCZ) Network on the Deployment of Offshore Renewables
R/3981/1 R.1763
Table F35. Finding Sanctuary Option 3 - Wave
Spatial OverlapResource Total Not Sensitive Sensitive Not Sensitive Sensitive Reference Area
Existing Array Overlap km2 0 0 0 0 0
Future Array Overlap km2 0.3 0 0 0.2 0.1
Existing Array Overlap No 0 0 0 0 0Proposed Array Overlap No 0.2 0 0 0.1 0.1
Existing Export Cable Overlap km 0 0 0 0 0 0Proposed Export Cable Overlap km 0.2 0.2 0 0 0 0.0
Existing Array Cable Overlap km 0 0 0 0 0Proposed Array Cable Overlap km 3.5 0 0 1.8 1.4
Low ScenarioNot Sensitive Sensitive Not Sensitive Sensitive Reference Area Total (£1000s)
Existing Array Overlap (£1000s) 0 0 0 0 0Future Array Overlap (£1000s) 0 0 0 0 0
Existing Array Overlap (£1000s) 0 0 0 0 0Proposed Array Overlap (£1000s) 0 0 0 0 0
Existing Export Cable Overlap (£1000s) 0 0 0 0 0 0Proposed Export Cable Overlap (£1000s) 0 0 0 0 10 10
Existing Array Cable Overlap (£1000s) 0 0 0 0 0Proposed Array Cable Overlap (£1000s) 0 0 0 0 0Total 0 0 0 0 10 10
High ScenarioNot Sensitive Sensitive Not Sensitive Sensitive Reference Area Total (£1000s)
Existing Array Overlap (£1000s) 0 0 0 0 0Future Array Overlap (£1000s) 0 0 0 0 0
Existing Array Overlap (£1000s) 0 0 0 0 0Proposed Array Overlap (£1000s) 0 0 57 42 99
Existing Export Cable Overlap (£1000s) 0 0 0 0 0 0Proposed Export Cable Overlap (£1000s) 199 0 0 0 106 305
Existing Array Cable Overlap (£1000s) 0 0 0 0 0Proposed Array Cable Overlap (£1000s) 0 0 0 0 0Total 199 0 57 42 106 404
Outside SAC Inside SAC
Outside SAC Inside SAC
Outside SAC Inside SAC
F.35

Quantifying the Potential Impact of a Marine Conservation Zone (MCZ) Network on the Deployment of Offshore Renewables
R/3981/1 R.1763
Table F36. Finding Sanctuary Option 3 - Tide
Spatial OverlapResource Total Not Sensitive Sensitive Not Sensitive Sensitive Reference Area
Existing Array Overlap km2 0 0 0 0 0 0
Future Array Overlap km2 0.0 0 0 0.0 0.0 0
Existing Array Overlap No 0 0 0 0 0 0Proposed Array Overlap No 0.0 0 0 0.0 0.0 0
Existing Export Cable Overlap km 0 0 0 0 0 0Proposed Export Cable Overlap km 0 0 0 0 0 0
Existing Array Cable Overlap km 0 0 0 0 0 0Proposed Array Cable Overlap km 0.4 0 0 0.2 0.2 0
Low ScenarioNot Sensitive Sensitive Not Sensitive Sensitive Reference Area Total (£1000s)
Existing Array Overlap (£1000s) 0 0 0 0 0Future Array Overlap (£1000s) 0 0 0 0 0
Existing Array Overlap (£1000s) 0 0 0 0 0Proposed Array Overlap (£1000s) 0 0 0 0 0
Existing Export Cable Overlap (£1000s) 0 0 0 0 0 0Proposed Export Cable Overlap (£1000s) 0 0 0 0 0 0
Existing Array Cable Overlap (£1000s) 0 0 0 0 0Proposed Array Cable Overlap (£1000s) 0 0 0 0 0Total 0 0 0 0 0 0
High ScenarioNot Sensitive Sensitive Not Sensitive Sensitive Reference Area Total (£1000s)
Existing Array Overlap (£1000s) 0 0 0 0 0Future Array Overlap (£1000s) 0 0 0 0 0
Existing Array Overlap (£1000s) 0 0 0 0 0Proposed Array Overlap (£1000s) 0 0 25 19 44
Existing Export Cable Overlap (£1000s) 0 0 0 0 0 0Proposed Export Cable Overlap (£1000s) 0 0 0 0 0 0
Existing Array Cable Overlap (£1000s) 0 0 0 0 0Proposed Array Cable Overlap (£1000s) 0 0 0 0 0Total 0 0 25 19 0 44
Outside SAC Inside SAC
Outside SAC Inside SAC
Outside SAC Inside SAC
F.36

Quantifying the Potential Impact of a Marine Conservation Zone (MCZ) Network on the Deployment of Offshore Renewables
R/3981/1 R.1763
Table F37. Finding Sanctuary Option 4 - Wind
Spatial OverlapResource Total Not Sensitive Sensitive Not Sensitive Sensitive Reference Area
Existing Array Overlap km2 0 0 0 0 0
Future Array Overlap km2 1178.8 1170.0 8.8 0 0
Existing Array Overlap No 0 0 0 0 0Proposed Array Overlap No 10 6.7 3.3 0 0
Existing Export Cable Overlap km 0 0 0 0 0Proposed Export Cable Overlap km 22.3 20.2 0 0 0 2.1
Existing Array Cable Overlap km 0 0 0 0 0Proposed Array Cable Overlap km 654.9 650.0 4.9 0 0
Low ScenarioNot Sensitive Sensitive Not Sensitive Sensitive Reference Area Total (£1000s)
Existing Array Overlap (£1000s) 0 0 0 0 0Future Array Overlap (£1000s) 0 40 0 0 40
Existing Array Overlap (£1000s) 0 0 0 0 0Proposed Array Overlap (£1000s) 0 667 0 0 667
Existing Export Cable Overlap (£1000s) 0 0 0 0 0 0Proposed Export Cable Overlap (£1000s) 0 0 0 0 964 964
Existing Array Cable Overlap (£1000s) 0 0 0 0 0Proposed Array Cable Overlap (£1000s) 0 49 0 0 49Total 0 755 0 0 964 1720
High ScenarioNot Sensitive Sensitive Not Sensitive Sensitive Reference Area Total (£1000s)
Existing Array Overlap (£1000s) 0 0 0 0 0Future Array Overlap (£1000s) 378972 2853 0 0 381826
Existing Array Overlap (£1000s) 0 28107 0 0 28107Proposed Array Overlap (£1000s) 115439 57720 0 0 173159
Existing Export Cable Overlap (£1000s) 0 0 0 0 0 0Proposed Export Cable Overlap (£1000s) 20179 0 0 0 10714 30893
Existing Array Cable Overlap (£1000s) 0 0 0 0 0Proposed Array Cable Overlap (£1000s) 168996 1272 0 0 170268Total 683587 89952 0 0 10714 784253
Outside SAC Inside SAC
Outside SAC Inside SAC
Outside SAC Inside SAC
F.37
Quantifying the Potential Impact of a Marine Conservation Zone (MCZ) Network on the Deployment of Offshore Renewables
R/3981/1 R.1763
Table F38. Finding Sanctuary Option 4 - Wave
Spatial OverlapResource Total Not Sensitive Sensitive Not Sensitive Sensitive Reference Area
Existing Array Overlap km2 1.6 1.6 0 0 0
Future Array Overlap km2 1.7 0 0 0.9 0.7
Existing Array Overlap No 0.2 0.2 0 0 0Proposed Array Overlap No 0.8 0 0 0.4 0.3
Existing Export Cable Overlap km 1.6 1.4 0.0 0 0 0.2Proposed Export Cable Overlap km 1.3 1.2 0 0 0 0.1
Existing Array Cable Overlap km 15.9 15.9 0 0 0Proposed Array Cable Overlap km 21.1 0 0 11.1 8.3
Low ScenarioNot Sensitive Sensitive Not Sensitive Sensitive Reference Area Total (£1000s)
Existing Array Overlap (£1000s) 0 0 0 0 0Future Array Overlap (£1000s) 0 0 0 0 0
Existing Array Overlap (£1000s) 0 0 0 0 0Proposed Array Overlap (£1000s) 0 0 0 0 0
Existing Export Cable Overlap (£1000s) 0 1 0 0 3 4Proposed Export Cable Overlap (£1000s) 0 0 0 0 57 57
Existing Array Cable Overlap (£1000s) 0 0 0 0 0Proposed Array Cable Overlap (£1000s) 0 0 0 0 0Total 0 1 0 0 60 61
High ScenarioNot Sensitive Sensitive Not Sensitive Sensitive Reference Area Total (£1000s)
Existing Array Overlap (£1000s) 0 0 0 0 0Future Array Overlap (£1000s) 0 0 0 0 0
Existing Array Overlap (£1000s) 68 0 0 0 68Proposed Array Overlap (£1000s) 0 0 283 211 494
Existing Export Cable Overlap (£1000s) 692 25 0 0 76 793Proposed Export Cable Overlap (£1000s) 1196 0 0 0 635 1832
Existing Array Cable Overlap (£1000s) 4140 0 0 0 4140Proposed Array Cable Overlap (£1000s) 0 0 0 0 0Total 6096 25 283 211 711 7326
Outside SAC Inside SAC
Outside SAC Inside SAC
Outside SAC Inside SAC
F.38

Quantifying the Potential Impact of a Marine Conservation Zone (MCZ) Network on the Deployment of Offshore Renewables
R/3981/1 R.1763
Table F39. Finding Sanctuary Option 4 - Tide
Spatial OverlapResource Total Not Sensitive Sensitive Not Sensitive Sensitive Reference Area
Existing Array Overlap km2 0 0 0 0 0 0
Future Array Overlap km2 0.2 0 0 0.1 0.1 0
Existing Array Overlap No 0 0 0 0 0 0Proposed Array Overlap No 0.4 0 0 0.2 0.1 0
Existing Export Cable Overlap km 0 0 0 0 0 0Proposed Export Cable Overlap km 0 0 0 0 0 0
Existing Array Cable Overlap km 0 0 0 0 0 0Proposed Array Cable Overlap km 2.1 0 0 1.1 0.8 0
Low ScenarioNot Sensitive Sensitive Not Sensitive Sensitive Reference Area Total (£1000s)
Existing Array Overlap (£1000s) 0 0 0 0 0Future Array Overlap (£1000s) 0 0 0 0 0
Existing Array Overlap (£1000s) 0 0 0 0 0Proposed Array Overlap (£1000s) 0 0 0 0 0
Existing Export Cable Overlap (£1000s) 0 0 0 0 0 0Proposed Export Cable Overlap (£1000s) 0 0 0 0 0 0
Existing Array Cable Overlap (£1000s) 0 0 0 0 0Proposed Array Cable Overlap (£1000s) 0 0 0 0 0Total 0 0 0 0 0 0
High ScenarioNot Sensitive Sensitive Not Sensitive Sensitive Reference Area Total (£1000s)
Existing Array Overlap (£1000s) 0 0 0 0 0Future Array Overlap (£1000s) 0 0 0 0 0
Existing Array Overlap (£1000s) 0 0 0 0 0Proposed Array Overlap (£1000s) 0 0 201 150 351
Existing Export Cable Overlap (£1000s) 0 0 0 0 0 0Proposed Export Cable Overlap (£1000s) 0 0 0 0 0 0
Existing Array Cable Overlap (£1000s) 0 0 0 0 0Proposed Array Cable Overlap (£1000s) 0 0 0 0 0Total 0 0 201 150 0 351
Outside SAC Inside SAC
Outside SAC Inside SAC
Outside SAC Inside SAC
F.39
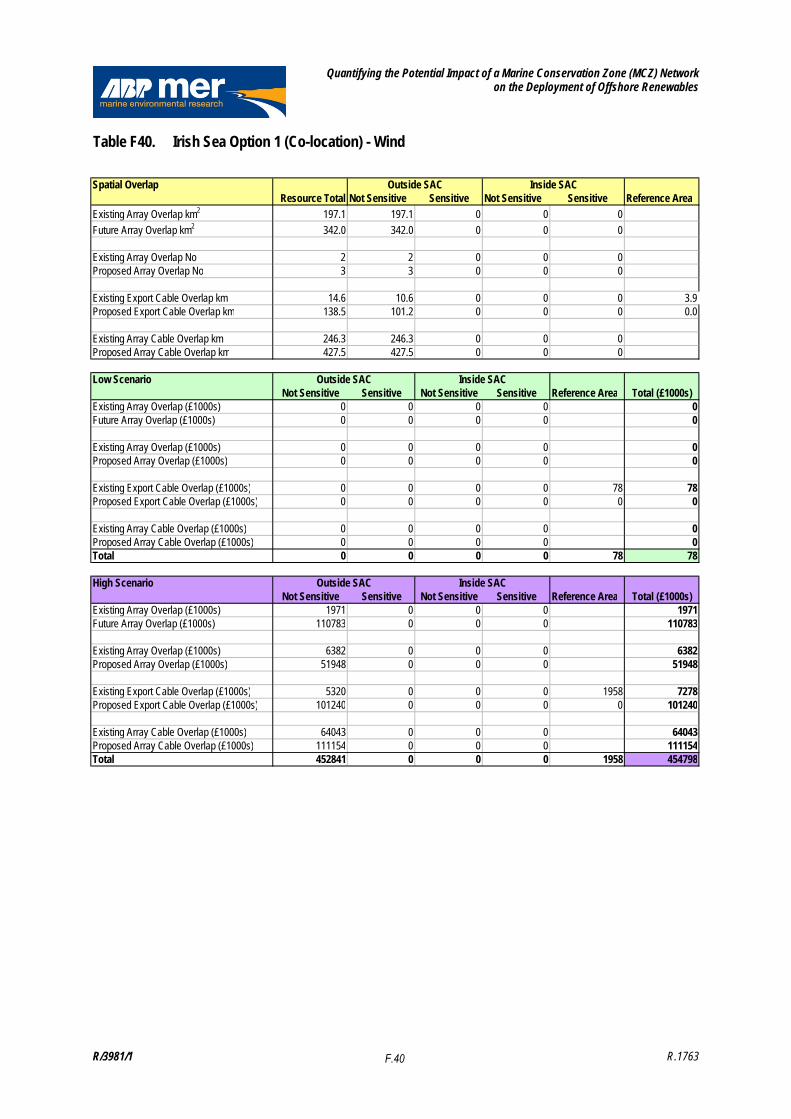
Quantifying the Potential Impact of a Marine Conservation Zone (MCZ) Network on the Deployment of Offshore Renewables
R/3981/1 R.1763
Table F40. Irish Sea Option 1 (Co-location) - Wind
Spatial OverlapResource Total Not Sensitive Sensitive Not Sensitive Sensitive Reference Area
Existing Array Overlap km2 197.1 197.1 0 0 0
Future Array Overlap km2 342.0 342.0 0 0 0
Existing Array Overlap No 2 2 0 0 0Proposed Array Overlap No 3 3 0 0 0
Existing Export Cable Overlap km 14.6 10.6 0 0 0 3.9Proposed Export Cable Overlap km 138.5 101.2 0 0 0 0.0
Existing Array Cable Overlap km 246.3 246.3 0 0 0Proposed Array Cable Overlap km 427.5 427.5 0 0 0
Low ScenarioNot Sensitive Sensitive Not Sensitive Sensitive Reference Area Total (£1000s)
Existing Array Overlap (£1000s) 0 0 0 0 0Future Array Overlap (£1000s) 0 0 0 0 0
Existing Array Overlap (£1000s) 0 0 0 0 0Proposed Array Overlap (£1000s) 0 0 0 0 0
Existing Export Cable Overlap (£1000s) 0 0 0 0 78 78Proposed Export Cable Overlap (£1000s) 0 0 0 0 0 0
Existing Array Cable Overlap (£1000s) 0 0 0 0 0Proposed Array Cable Overlap (£1000s) 0 0 0 0 0Total 0 0 0 0 78 78
High ScenarioNot Sensitive Sensitive Not Sensitive Sensitive Reference Area Total (£1000s)
Existing Array Overlap (£1000s) 1971 0 0 0 1971Future Array Overlap (£1000s) 110783 0 0 0 110783
Existing Array Overlap (£1000s) 6382 0 0 0 6382Proposed Array Overlap (£1000s) 51948 0 0 0 51948
Existing Export Cable Overlap (£1000s) 5320 0 0 0 1958 7278Proposed Export Cable Overlap (£1000s) 101240 0 0 0 0 101240
Existing Array Cable Overlap (£1000s) 64043 0 0 0 64043Proposed Array Cable Overlap (£1000s) 111154 0 0 0 111154Total 452841 0 0 0 1958 454798
Outside SAC Inside SAC
Outside SAC Inside SAC
Outside SAC Inside SAC
F.40

Quantifying the Potential Impact of a Marine Conservation Zone (MCZ) Network on the Deployment of Offshore Renewables
R/3981/1 R.1763
Table F41. Irish Sea Option 1 (Co-location) - Wave
Spatial OverlapResource Total Not Sensitive Sensitive Not Sensitive Sensitive Reference Area
Existing Array Overlap km2 0.0 0.0 0.0 0.0 0.0
Future Array Overlap km2 0.2 0.2 0.0 0.0 0.0
Existing Array Overlap No 0 0 0 0 0Proposed Array Overlap No 0.1 0.1 0.0 0.0 0.0
Existing Export Cable Overlap km 0 0 0 0 0 0Proposed Export Cable Overlap km 2.1 1.5 0 0 0 0.6
Existing Array Cable Overlap km 0 0 0 0 0Proposed Array Cable Overlap km 1.9 1.6 0.1 0.0 0.2
Low ScenarioNot Sensitive Sensitive Not Sensitive Sensitive Reference Area Total (£1000s)
Existing Array Overlap (£1000s) 0 0 0 0 0Future Array Overlap (£1000s) 0 0 0 0 0
Existing Array Overlap (£1000s) 0 0 0 0 0Proposed Array Overlap (£1000s) 0 0 0 0 0
Existing Export Cable Overlap (£1000s) 0 0 0 0 0 0Proposed Export Cable Overlap (£1000s) 0 0 0 0 252 252
Existing Array Cable Overlap (£1000s) 0 0 0 0 0Proposed Array Cable Overlap (£1000s) 0 1 0 0 1Total 0 1 0 0 252 253
High ScenarioNot Sensitive Sensitive Not Sensitive Sensitive Reference Area Total (£1000s)
Existing Array Overlap (£1000s) 0 0 0 0 0Future Array Overlap (£1000s) 0 0 0 0 0
Existing Array Overlap (£1000s) 0 0 0 0 0Proposed Array Overlap (£1000s) 63 4 1 6 73
Existing Export Cable Overlap (£1000s) 0 0 0 0 0 0Proposed Export Cable Overlap (£1000s) 1520 0 0 0 2797 4318
Existing Array Cable Overlap (£1000s) 0 0 0 0 0Proposed Array Cable Overlap (£1000s) 406 25 0 0 431Total 1989 29 1 6 2797 4822
Outside SAC Inside SAC
Outside SAC Inside SAC
Outside SAC Inside SAC
F.41
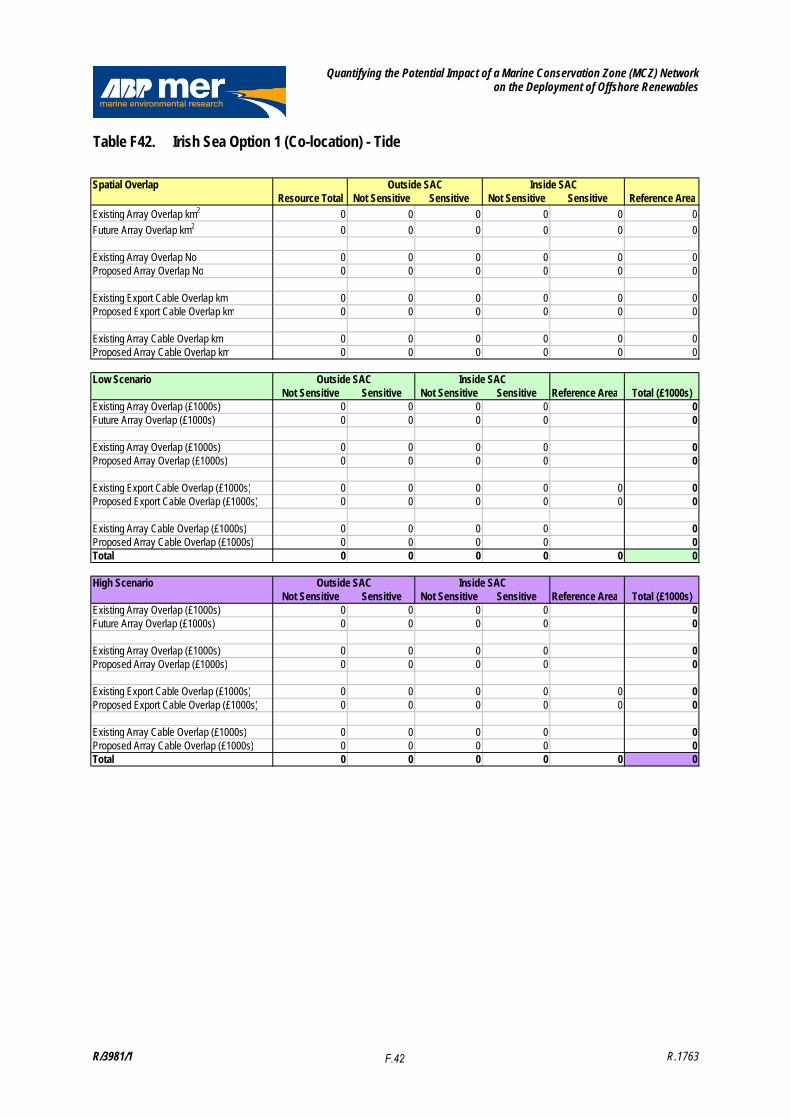
Quantifying the Potential Impact of a Marine Conservation Zone (MCZ) Network on the Deployment of Offshore Renewables
R/3981/1 R.1763
Table F42. Irish Sea Option 1 (Co-location) - Tide
Spatial OverlapResource Total Not Sensitive Sensitive Not Sensitive Sensitive Reference Area
Existing Array Overlap km2 0 0 0 0 0 0
Future Array Overlap km2 0 0 0 0 0 0
Existing Array Overlap No 0 0 0 0 0 0Proposed Array Overlap No 0 0 0 0 0 0
Existing Export Cable Overlap km 0 0 0 0 0 0Proposed Export Cable Overlap km 0 0 0 0 0 0
Existing Array Cable Overlap km 0 0 0 0 0 0Proposed Array Cable Overlap km 0 0 0 0 0 0
Low ScenarioNot Sensitive Sensitive Not Sensitive Sensitive Reference Area Total (£1000s)
Existing Array Overlap (£1000s) 0 0 0 0 0Future Array Overlap (£1000s) 0 0 0 0 0
Existing Array Overlap (£1000s) 0 0 0 0 0Proposed Array Overlap (£1000s) 0 0 0 0 0
Existing Export Cable Overlap (£1000s) 0 0 0 0 0 0Proposed Export Cable Overlap (£1000s) 0 0 0 0 0 0
Existing Array Cable Overlap (£1000s) 0 0 0 0 0Proposed Array Cable Overlap (£1000s) 0 0 0 0 0Total 0 0 0 0 0 0
High ScenarioNot Sensitive Sensitive Not Sensitive Sensitive Reference Area Total (£1000s)
Existing Array Overlap (£1000s) 0 0 0 0 0Future Array Overlap (£1000s) 0 0 0 0 0
Existing Array Overlap (£1000s) 0 0 0 0 0Proposed Array Overlap (£1000s) 0 0 0 0 0
Existing Export Cable Overlap (£1000s) 0 0 0 0 0 0Proposed Export Cable Overlap (£1000s) 0 0 0 0 0 0
Existing Array Cable Overlap (£1000s) 0 0 0 0 0Proposed Array Cable Overlap (£1000s) 0 0 0 0 0Total 0 0 0 0 0 0
Outside SAC Inside SAC
Outside SAC Inside SAC
Outside SAC Inside SAC
F.42
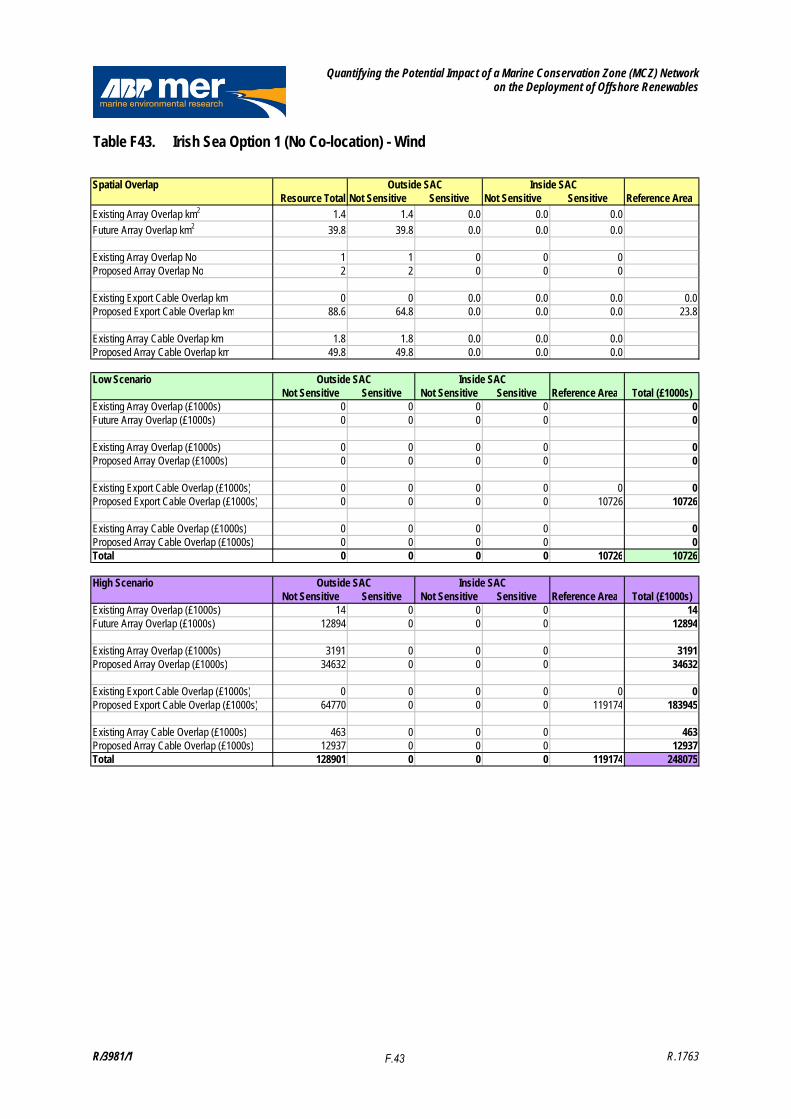
Quantifying the Potential Impact of a Marine Conservation Zone (MCZ) Network on the Deployment of Offshore Renewables
R/3981/1 R.1763
Table F43. Irish Sea Option 1 (No Co-location) - Wind
Spatial OverlapResource Total Not Sensitive Sensitive Not Sensitive Sensitive Reference Area
Existing Array Overlap km2 1.4 1.4 0.0 0.0 0.0
Future Array Overlap km2 39.8 39.8 0.0 0.0 0.0
Existing Array Overlap No 1 1 0 0 0Proposed Array Overlap No 2 2 0 0 0
Existing Export Cable Overlap km 0 0 0.0 0.0 0.0 0.0Proposed Export Cable Overlap km 88.6 64.8 0.0 0.0 0.0 23.8
Existing Array Cable Overlap km 1.8 1.8 0.0 0.0 0.0Proposed Array Cable Overlap km 49.8 49.8 0.0 0.0 0.0
Low ScenarioNot Sensitive Sensitive Not Sensitive Sensitive Reference Area Total (£1000s)
Existing Array Overlap (£1000s) 0 0 0 0 0Future Array Overlap (£1000s) 0 0 0 0 0
Existing Array Overlap (£1000s) 0 0 0 0 0Proposed Array Overlap (£1000s) 0 0 0 0 0
Existing Export Cable Overlap (£1000s) 0 0 0 0 0 0Proposed Export Cable Overlap (£1000s) 0 0 0 0 10726 10726
Existing Array Cable Overlap (£1000s) 0 0 0 0 0Proposed Array Cable Overlap (£1000s) 0 0 0 0 0Total 0 0 0 0 10726 10726
High ScenarioNot Sensitive Sensitive Not Sensitive Sensitive Reference Area Total (£1000s)
Existing Array Overlap (£1000s) 14 0 0 0 14Future Array Overlap (£1000s) 12894 0 0 0 12894
Existing Array Overlap (£1000s) 3191 0 0 0 3191Proposed Array Overlap (£1000s) 34632 0 0 0 34632
Existing Export Cable Overlap (£1000s) 0 0 0 0 0 0Proposed Export Cable Overlap (£1000s) 64770 0 0 0 119174 183945
Existing Array Cable Overlap (£1000s) 463 0 0 0 463Proposed Array Cable Overlap (£1000s) 12937 0 0 0 12937Total 128901 0 0 0 119174 248075
Outside SAC Inside SAC
Outside SAC Inside SAC
Outside SAC Inside SAC
F.43
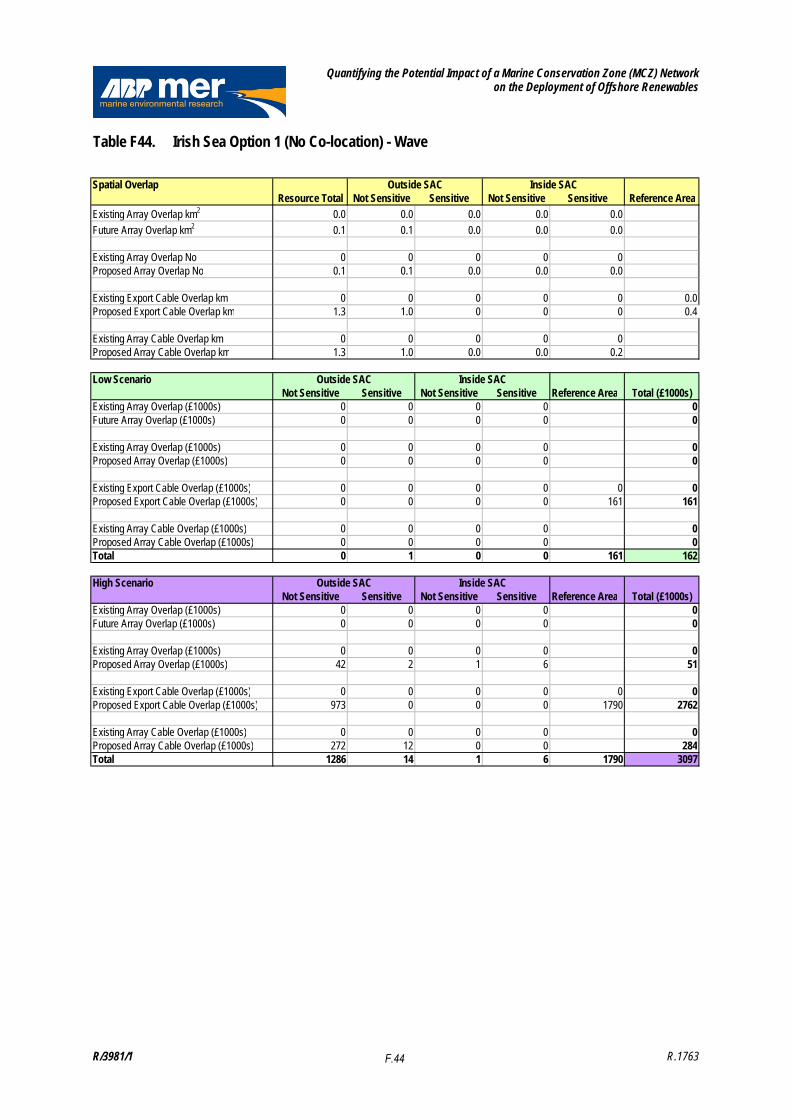
Quantifying the Potential Impact of a Marine Conservation Zone (MCZ) Network on the Deployment of Offshore Renewables
R/3981/1 R.1763
Table F44. Irish Sea Option 1 (No Co-location) - Wave
Spatial OverlapResource Total Not Sensitive Sensitive Not Sensitive Sensitive Reference Area
Existing Array Overlap km2 0.0 0.0 0.0 0.0 0.0
Future Array Overlap km2 0.1 0.1 0.0 0.0 0.0
Existing Array Overlap No 0 0 0 0 0Proposed Array Overlap No 0.1 0.1 0.0 0.0 0.0
Existing Export Cable Overlap km 0 0 0 0 0 0.0Proposed Export Cable Overlap km 1.3 1.0 0 0 0 0.4
Existing Array Cable Overlap km 0 0 0 0 0Proposed Array Cable Overlap km 1.3 1.0 0.0 0.0 0.2
Low ScenarioNot Sensitive Sensitive Not Sensitive Sensitive Reference Area Total (£1000s)
Existing Array Overlap (£1000s) 0 0 0 0 0Future Array Overlap (£1000s) 0 0 0 0 0
Existing Array Overlap (£1000s) 0 0 0 0 0Proposed Array Overlap (£1000s) 0 0 0 0 0
Existing Export Cable Overlap (£1000s) 0 0 0 0 0 0Proposed Export Cable Overlap (£1000s) 0 0 0 0 161 161
Existing Array Cable Overlap (£1000s) 0 0 0 0 0Proposed Array Cable Overlap (£1000s) 0 0 0 0 0Total 0 1 0 0 161 162
High ScenarioNot Sensitive Sensitive Not Sensitive Sensitive Reference Area Total (£1000s)
Existing Array Overlap (£1000s) 0 0 0 0 0Future Array Overlap (£1000s) 0 0 0 0 0
Existing Array Overlap (£1000s) 0 0 0 0 0Proposed Array Overlap (£1000s) 42 2 1 6 51
Existing Export Cable Overlap (£1000s) 0 0 0 0 0 0Proposed Export Cable Overlap (£1000s) 973 0 0 0 1790 2762
Existing Array Cable Overlap (£1000s) 0 0 0 0 0Proposed Array Cable Overlap (£1000s) 272 12 0 0 284Total 1286 14 1 6 1790 3097
Outside SAC Inside SAC
Outside SAC Inside SAC
Outside SAC Inside SAC
F.44

Quantifying the Potential Impact of a Marine Conservation Zone (MCZ) Network on the Deployment of Offshore Renewables
R/3981/1 R.1763
Table F45. Irish Sea Option 1 (No Co-location) - Tide
Spatial OverlapResource Total Not Sensitive Sensitive Not Sensitive Sensitive Reference Area
Existing Array Overlap km2 0 0 0 0 0 0
Future Array Overlap km2 0 0 0 0 0 0
Existing Array Overlap No 0 0 0 0 0 0Proposed Array Overlap No 0 0 0 0 0 0
Existing Export Cable Overlap km 0 0 0 0 0 0Proposed Export Cable Overlap km 0 0 0 0 0 0
Existing Array Cable Overlap km 0 0 0 0 0 0Proposed Array Cable Overlap km 0 0 0 0 0 0
Low ScenarioNot Sensitive Sensitive Not Sensitive Sensitive Reference Area Total (£1000s)
Existing Array Overlap (£1000s) 0 0 0 0 0Future Array Overlap (£1000s) 0 0 0 0 0
Existing Array Overlap (£1000s) 0 0 0 0 0Proposed Array Overlap (£1000s) 0 0 0 0 0
Existing Export Cable Overlap (£1000s) 0 0 0 0 0 0Proposed Export Cable Overlap (£1000s) 0 0 0 0 0 0
Existing Array Cable Overlap (£1000s) 0 0 0 0 0Proposed Array Cable Overlap (£1000s) 0 0 0 0 0Total 0 0 0 0 0 0
High ScenarioNot Sensitive Sensitive Not Sensitive Sensitive Reference Area Total (£1000s)
Existing Array Overlap (£1000s) 0 0 0 0 0Future Array Overlap (£1000s) 0 0 0 0 0
Existing Array Overlap (£1000s) 0 0 0 0 0Proposed Array Overlap (£1000s) 0 0 0 0 0
Existing Export Cable Overlap (£1000s) 0 0 0 0 0 0Proposed Export Cable Overlap (£1000s) 0 0 0 0 0 0
Existing Array Cable Overlap (£1000s) 0 0 0 0 0Proposed Array Cable Overlap (£1000s) 0 0 0 0 0Total 0 0 0 0 0 0
Outside SAC Inside SAC
Outside SAC Inside SAC
Outside SAC Inside SAC
F.45

Quantifying the Potential Impact of a Marine Conservation Zone (MCZ) Network on the Deployment of Offshore Renewables
R/3981/1 R.1763
Table F46. Irish Sea Option 2 - Wind
Spatial OverlapResource Total Not Sensitive Sensitive Not Sensitive Sensitive Reference Area
Existing Array Overlap km2 134.7 134.7 0 0 0
Future Array Overlap km2 225.1 225.0 0.1 0 0
Existing Array Overlap No 4 4 0 0 0Proposed Array Overlap No 2 1 1 0 0
Existing Export Cable Overlap km 146.3 50.3 3.7 18.1 8.4 39.4Proposed Export Cable Overlap km 128.3 52.7 6.0 6.9 18.5 34.5
Existing Array Cable Overlap km 168.4 168.4 0 0 0Proposed Array Cable Overlap km 281.4 281.3 0.1 0 0
Low ScenarioNot Sensitive Sensitive Not Sensitive Sensitive Reference Area Total (£1000s)
Existing Array Overlap (£1000s) 0 0 0 0 0Future Array Overlap (£1000s) 0 0 0 0 0
Existing Array Overlap (£1000s) 0 0 0 0 0Proposed Array Overlap (£1000s) 0 200 0 0 200
Existing Export Cable Overlap (£1000s) 0 74 0 0 787 861Proposed Export Cable Overlap (£1000s) 0 2683 0 0 15529 18211
Existing Array Cable Overlap (£1000s) 0 0 0 0 0Proposed Array Cable Overlap (£1000s) 0 1 0 0 1Total 0 2958 0 0 16316 19273
High ScenarioNot Sensitive Sensitive Not Sensitive Sensitive Reference Area Total (£1000s)
Existing Array Overlap (£1000s) 1347 0 0 0 1347Future Array Overlap (£1000s) 72893 32 0 0 72925
Existing Array Overlap (£1000s) 12764 312 0 0 13075Proposed Array Overlap (£1000s) 17316 17316 0 0 34632
Existing Export Cable Overlap (£1000s) 25157 1840 0 0 19676 46674Proposed Export Cable Overlap (£1000s) 52748 5961 0 0 172540 231249
Existing Array Cable Overlap (£1000s) 43780 0 0 0 43780Proposed Array Cable Overlap (£1000s) 73137 32 0 0 73169Total 299142 25492 0 0 192216 516851
Outside SAC Inside SAC
Outside SAC Inside SAC
Outside SAC Inside SAC
F.46

Quantifying the Potential Impact of a Marine Conservation Zone (MCZ) Network on the Deployment of Offshore Renewables
R/3981/1 R.1763
Table F47. Irish Sea Option 2 - Wave
Spatial OverlapResource Total Not Sensitive Sensitive Not Sensitive Sensitive Reference Area
Existing Array Overlap km2 0.0 0.0 0.0 0.0 0.0
Future Array Overlap km2 0.9 0.6 0.0 0.1 0.1
Existing Array Overlap No 0 0 0 0 0Proposed Array Overlap No 0.5 0.3 0.0 0.1 0.1
Existing Export Cable Overlap km 0 0 0 0 0 0Proposed Export Cable Overlap km 1.9 0.8 0.1 0.1 0.3 0.5
Existing Array Cable Overlap km 0 0 0 0 0Proposed Array Cable Overlap km 9.2 5.6 0.2 1.3 1.2
Low ScenarioNot Sensitive Sensitive Not Sensitive Sensitive Reference Area Total (£1000s)
Existing Array Overlap (£1000s) 0 0 0 0 0Future Array Overlap (£1000s) 0 0 0 0 0
Existing Array Overlap (£1000s) 0 0 0 0 0Proposed Array Overlap (£1000s) 0 0 0 0 0
Existing Export Cable Overlap (£1000s) 0 0 0 0 0 0Proposed Export Cable Overlap (£1000s) 0 40 0 0 233 273
Existing Array Cable Overlap (£1000s) 0 0 0 0 0Proposed Array Cable Overlap (£1000s) 0 2 0 0 2Total 0 43 0 0 233 276
High ScenarioNot Sensitive Sensitive Not Sensitive Sensitive Reference Area Total (£1000s)
Existing Array Overlap (£1000s) 0 0 0 0 0Future Array Overlap (£1000s) 0 0 0 0 0
Existing Array Overlap (£1000s) 0 0 0 0 0Proposed Array Overlap (£1000s) 224 9 41 37 310
Existing Export Cable Overlap (£1000s) 0 0 0 0 0 0Proposed Export Cable Overlap (£1000s) 792 90 0 0 2591 3473
Existing Array Cable Overlap (£1000s) 0 0 0 0 0Proposed Array Cable Overlap (£1000s) 1455 55 0 0 1511Total 2472 153 41 37 2591 5294
Outside SAC Inside SAC
Outside SAC Inside SAC
Outside SAC Inside SAC
F.47
Quantifying the Potential Impact of a Marine Conservation Zone (MCZ) Network on the Deployment of Offshore Renewables
R/3981/1 R.1763
Table F48. Irish Sea Option 2 - Tide
Spatial OverlapResource Total Not Sensitive Sensitive Not Sensitive Sensitive Reference Area
Existing Array Overlap km2 0 0 0 0 0 0
Future Array Overlap km2 0 0 0 0 0 0
Existing Array Overlap No 0 0 0 0 0 0Proposed Array Overlap No 0 0 0 0 0 0
Existing Export Cable Overlap km 0 0 0 0 0 0Proposed Export Cable Overlap km 0 0 0 0 0 0
Existing Array Cable Overlap km 0 0 0 0 0 0Proposed Array Cable Overlap km 0 0 0 0 0 0
Low ScenarioNot Sensitive Sensitive Not Sensitive Sensitive Reference Area Total (£1000s)
Existing Array Overlap (£1000s) 0 0 0 0 0Future Array Overlap (£1000s) 0 0 0 0 0
Existing Array Overlap (£1000s) 0 0 0 0 0Proposed Array Overlap (£1000s) 0 0 0 0 0
Existing Export Cable Overlap (£1000s) 0 0 0 0 0 0Proposed Export Cable Overlap (£1000s) 0 0 0 0 0 0
Existing Array Cable Overlap (£1000s) 0 0 0 0 0Proposed Array Cable Overlap (£1000s) 0 0 0 0 0Total 0 0 0 0 0 0
High ScenarioNot Sensitive Sensitive Not Sensitive Sensitive Reference Area Total (£1000s)
Existing Array Overlap (£1000s) 0 0 0 0 0Future Array Overlap (£1000s) 0 0 0 0 0
Existing Array Overlap (£1000s) 0 0 0 0 0Proposed Array Overlap (£1000s) 0 0 0 0 0
Existing Export Cable Overlap (£1000s) 0 0 0 0 0 0Proposed Export Cable Overlap (£1000s) 0 0 0 0 0 0
Existing Array Cable Overlap (£1000s) 0 0 0 0 0Proposed Array Cable Overlap (£1000s) 0 0 0 0 0Total 0 0 0 0 0 0
Outside SAC Inside SAC
Outside SAC Inside SAC
Outside SAC Inside SAC
F.48

Quantifying the Potential Impact of a Marine Conservation Zone (MCZ) Network on the Deployment of Offshore Renewables
R/3981/1 R.1763
Table F49. Irish Sea Option 3 - Wind
Spatial OverlapResource Total Not Sensitive Sensitive Not Sensitive Sensitive Reference Area
Existing Array Overlap km2 0.9 0.9 0 0 0
Future Array Overlap km2 13.3 13.3 0 0 0
Existing Array Overlap No 0.6 0.6 0 0 0Proposed Array Overlap No 0.7 0.7 0 0 0
Existing Export Cable Overlap km 0 0 0 0 0Proposed Export Cable Overlap km 32.8 24.0 0 0 0 8.8
Existing Array Cable Overlap km 0.8 0.8 0 0 0Proposed Array Cable Overlap km 18.4 18.4 0 0 0
Low ScenarioNot Sensitive Sensitive Not Sensitive Sensitive Reference Area Total (£1000s)
Existing Array Overlap (£1000s) 0 0 0 0 0Future Array Overlap (£1000s) 0 0 0 0 0
Existing Array Overlap (£1000s) 0 0 0 0 0Proposed Array Overlap (£1000s) 0 0 0 0 0
Existing Export Cable Overlap (£1000s) 0 0 0 0 0 0Proposed Export Cable Overlap (£1000s) 0 0 0 0 3972 3972
Existing Array Cable Overlap (£1000s) 0 0 0 0 0Proposed Array Cable Overlap (£1000s) 0 0 0 0 0Total 0 0 0 0 3972 3972
High ScenarioNot Sensitive Sensitive Not Sensitive Sensitive Reference Area Total (£1000s)
Existing Array Overlap (£1000s) 9 0 0 0 9Future Array Overlap (£1000s) 4298 0 0 0 4298
Existing Array Overlap (£1000s) 1994 0 0 0 1994Proposed Array Overlap (£1000s) 11544 0 0 0 11544
Existing Export Cable Overlap (£1000s) 0 0 0 0 0 0Proposed Export Cable Overlap (£1000s) 23989 0 0 0 44139 68128
Existing Array Cable Overlap (£1000s) 206 0 0 0 206Proposed Array Cable Overlap (£1000s) 4791 0 0 0 4791Total 46831 0 0 0 44139 90970
Outside SAC Inside SAC
Outside SAC Inside SAC
Outside SAC Inside SAC
F.49
Quantifying the Potential Impact of a Marine Conservation Zone (MCZ) Network on the Deployment of Offshore Renewables
R/3981/1 R.1763
Table F50. Irish Sea Option 3 - Wave
Spatial OverlapResource Total Not Sensitive Sensitive Not Sensitive Sensitive Reference Area
Existing Array Overlap km2 0 0 0 0 0
Future Array Overlap km2 0.0 0.0 0.0 0.0 0.0
Existing Array Overlap No 0 0 0 0 0Proposed Array Overlap No 0.0 0.0 0.0 0.0 0.0
Existing Export Cable Overlap km 0 0 0 0 0Proposed Export Cable Overlap km 0.5 0.4 0 0 0 0.1
Existing Array Cable Overlap km 0 0 0 0 0Proposed Array Cable Overlap km 0.5 0.4 0.0 0.0 0.1
Low ScenarioNot Sensitive Sensitive Not Sensitive Sensitive Reference Area Total (£1000s)
Existing Array Overlap (£1000s) 0 0 0 0 0Future Array Overlap (£1000s) 0 0 0 0 0
Existing Array Overlap (£1000s) 0 0 0 0 0Proposed Array Overlap (£1000s) 0 0 0 0 0
Existing Export Cable Overlap (£1000s) 0 0 0 0 0 0Proposed Export Cable Overlap (£1000s) 0 0 0 0 62 62
Existing Array Cable Overlap (£1000s) 0 0 0 0 0Proposed Array Cable Overlap (£1000s) 0 0 0 0 0Total 0 0 0 0 62 62
High ScenarioNot Sensitive Sensitive Not Sensitive Sensitive Reference Area Total (£1000s)
Existing Array Overlap (£1000s) 0 0 0 0 0Future Array Overlap (£1000s) 0 0 0 0 0
Existing Array Overlap (£1000s) 0 0 0 0 0Proposed Array Overlap (£1000s) 16 1 0 2 19
Existing Export Cable Overlap (£1000s) 0 0 0 0 0 0Proposed Export Cable Overlap (£1000s) 374 0 0 0 688 1062
Existing Array Cable Overlap (£1000s) 0 0 0 0 0Proposed Array Cable Overlap (£1000s) 104 5 0 0 109Total 494 5 0 2 688 1190
Outside SAC Inside SAC
Outside SAC Inside SAC
Outside SAC Inside SAC
F.50

Quantifying the Potential Impact of a Marine Conservation Zone (MCZ) Network on the Deployment of Offshore Renewables
R/3981/1 R.1763
Table F51. Irish Sea Option 3 - Tide
Spatial OverlapResource Total Not Sensitive Sensitive Not Sensitive Sensitive Reference Area
Existing Array Overlap km2 0 0 0 0 0 0
Future Array Overlap km2 0 0 0 0 0 0
Existing Array Overlap No 0 0 0 0 0 0Proposed Array Overlap No 0 0 0 0 0 0
Existing Export Cable Overlap km 0 0 0 0 0 0Proposed Export Cable Overlap km 0 0 0 0 0 0
Existing Array Cable Overlap km 0 0 0 0 0 0Proposed Array Cable Overlap km 0 0 0 0 0 0
Low ScenarioNot Sensitive Sensitive Not Sensitive Sensitive Reference Area Total (£1000s)
Existing Array Overlap (£1000s) 0 0 0 0 0Future Array Overlap (£1000s) 0 0 0 0 0
Existing Array Overlap (£1000s) 0 0 0 0 0Proposed Array Overlap (£1000s) 0 0 0 0 0
Existing Export Cable Overlap (£1000s) 0 0 0 0 0 0Proposed Export Cable Overlap (£1000s) 0 0 0 0 0 0
Existing Array Cable Overlap (£1000s) 0 0 0 0 0Proposed Array Cable Overlap (£1000s) 0 0 0 0 0Total 0 0 0 0 0 0
High ScenarioNot Sensitive Sensitive Not Sensitive Sensitive Reference Area Total (£1000s)
Existing Array Overlap (£1000s) 0 0 0 0 0Future Array Overlap (£1000s) 0 0 0 0 0
Existing Array Overlap (£1000s) 0 0 0 0 0Proposed Array Overlap (£1000s) 0 0 0 0 0
Existing Export Cable Overlap (£1000s) 0 0 0 0 0 0Proposed Export Cable Overlap (£1000s) 0 0 0 0 0 0
Existing Array Cable Overlap (£1000s) 0 0 0 0 0Proposed Array Cable Overlap (£1000s) 0 0 0 0 0Total 0 0 0 0 0 0
Outside SAC Inside SAC
Outside SAC Inside SAC
Outside SAC Inside SAC
F.51

Quantifying the Potential Impact of a Marine Conservation Zone (MCZ) Network on the Deployment of Offshore Renewables
R/3981/1 R.1763
Table F52. Irish Sea Option 4 - Wind
Spatial OverlapResource Total Not Sensitive Sensitive Not Sensitive Sensitive Reference Area
Existing Array Overlap km2 5.3 5.3 0 0 0
Future Array Overlap km2 132.7 132.7 0 0 0
Existing Array Overlap No 3.8 3.8 0 0 0Proposed Array Overlap No 6.7 6.7 0 0 0
Existing Export Cable Overlap km 0 0 0 0 0Proposed Export Cable Overlap km 131.3 96.0 0 0 0 35.3
Existing Array Cable Overlap km 3.8 3.8 0 0 0Proposed Array Cable Overlap km 73.7 73.7 0 0 0
Low ScenarioNot Sensitive Sensitive Not Sensitive Sensitive Reference Area Total (£1000s)
Existing Array Overlap (£1000s) 0 0 0 0 0Future Array Overlap (£1000s) 0 0 0 0 0
Existing Array Overlap (£1000s) 0 0 0 0 0Proposed Array Overlap (£1000s) 0 0 0 0 0
Existing Export Cable Overlap (£1000s) 0 0 0 0 0 0Proposed Export Cable Overlap (£1000s) 0 0 0 0 15890 15890
Existing Array Cable Overlap (£1000s) 0 0 0 0 0Proposed Array Cable Overlap (£1000s) 0 0 0 0 0Total 0 0 0 0 15890 15890
High ScenarioNot Sensitive Sensitive Not Sensitive Sensitive Reference Area Total (£1000s)
Existing Array Overlap (£1000s) 53 0 0 0 53Future Array Overlap (£1000s) 42979 0 0 0 42979
Existing Array Overlap (£1000s) 11966 0 0 0 11966Proposed Array Overlap (£1000s) 115439 0 0 0 115439
Existing Export Cable Overlap (£1000s) 0 0 0 0 0 0Proposed Export Cable Overlap (£1000s) 95956 0 0 0 176554 272510
Existing Array Cable Overlap (£1000s) 978 0 0 0 978Proposed Array Cable Overlap (£1000s) 19166 0 0 0 19166Total 286538 0 0 0 176554 463092
Outside SAC Inside SAC
Outside SAC Inside SAC
Outside SAC Inside SAC
F.52

Quantifying the Potential Impact of a Marine Conservation Zone (MCZ) Network on the Deployment of Offshore Renewables
R/3981/1 R.1763
Table F53. Irish Sea Option 4 - Wave
Spatial OverlapResource Total Not Sensitive Sensitive Not Sensitive Sensitive Reference Area
Existing Array Overlap km2 0 0 0 0 0
Future Array Overlap km2 0.2 0.2 0.0 0.0 0.0
Existing Array Overlap No 0 0 0 0 0Proposed Array Overlap No 0.1 0.1 0.0 0.0 0.0
Existing Export Cable Overlap km 0 0 0 0 0Proposed Export Cable Overlap km 3.1 2.2 0 0 0 0.8
Existing Array Cable Overlap km 0 0 0 0 0Proposed Array Cable Overlap km 3.1 2.4 0.1 0.1 0.4
Low ScenarioNot Sensitive Sensitive Not Sensitive Sensitive Reference Area Total (£1000s)
Existing Array Overlap (£1000s) 0 0 0 0 0Future Array Overlap (£1000s) 0 0 0 0 0
Existing Array Overlap (£1000s) 0 0 0 0 0Proposed Array Overlap (£1000s) 0 0 0 0 0
Existing Export Cable Overlap (£1000s) 0 0 0 0 0 0Proposed Export Cable Overlap (£1000s) 0 0 0 0 372 372
Existing Array Cable Overlap (£1000s) 0 0 0 0 0Proposed Array Cable Overlap (£1000s) 0 1 0 0 1Total 0 1 0 0 372 373
High ScenarioNot Sensitive Sensitive Not Sensitive Sensitive Reference Area Total (£1000s)
Existing Array Overlap (£1000s) 0 0 0 0 0Future Array Overlap (£1000s) 0 0 0 0 0
Existing Array Overlap (£1000s) 0 0 0 0 0Proposed Array Overlap (£1000s) 78 4 2 11 94
Existing Export Cable Overlap (£1000s) 0 0 0 0 0 0Proposed Export Cable Overlap (£1000s) 2245 0 0 0 4130 6375
Existing Array Cable Overlap (£1000s) 0 0 0 0 0Proposed Array Cable Overlap (£1000s) 627 29 0 0 655Total 2949 32 2 11 4130 7124
Outside SAC Inside SAC
Outside SAC Inside SAC
Outside SAC Inside SAC
F.53

Quantifying the Potential Impact of a Marine Conservation Zone (MCZ) Network on the Deployment of Offshore Renewables
R/3981/1 R.1763
Table F54. Irish Sea Option 4 - Tide
Spatial OverlapResource Total Not Sensitive Sensitive Not Sensitive Sensitive Reference Area
Existing Array Overlap km2 0 0 0 0 0 0
Future Array Overlap km2 0 0 0 0 0 0
Existing Array Overlap No 0 0 0 0 0 0Proposed Array Overlap No 0 0 0 0 0 0
Existing Export Cable Overlap km 0 0 0 0 0 0Proposed Export Cable Overlap km 0 0 0 0 0 0
Existing Array Cable Overlap km 0 0 0 0 0 0Proposed Array Cable Overlap km 0 0 0 0 0 0
Low ScenarioNot Sensitive Sensitive Not Sensitive Sensitive Reference Area Total (£1000s)
Existing Array Overlap (£1000s) 0 0 0 0 0Future Array Overlap (£1000s) 0 0 0 0 0
Existing Array Overlap (£1000s) 0 0 0 0 0Proposed Array Overlap (£1000s) 0 0 0 0 0
Existing Export Cable Overlap (£1000s) 0 0 0 0 0 0Proposed Export Cable Overlap (£1000s) 0 0 0 0 0 0
Existing Array Cable Overlap (£1000s) 0 0 0 0 0Proposed Array Cable Overlap (£1000s) 0 0 0 0 0Total 0 0 0 0 0 0
High ScenarioNot Sensitive Sensitive Not Sensitive Sensitive Reference Area Total (£1000s)
Existing Array Overlap (£1000s) 0 0 0 0 0Future Array Overlap (£1000s) 0 0 0 0 0
Existing Array Overlap (£1000s) 0 0 0 0 0Proposed Array Overlap (£1000s) 0 0 0 0 0
Existing Export Cable Overlap (£1000s) 0 0 0 0 0 0Proposed Export Cable Overlap (£1000s) 0 0 0 0 0 0
Existing Array Cable Overlap (£1000s) 0 0 0 0 0Proposed Array Cable Overlap (£1000s) 0 0 0 0 0Total 0 0 0 0 0 0
Outside SAC Inside SAC
Outside SAC Inside SAC
Outside SAC Inside SAC
F.54