quantifying the impact of load-following on gas-fired
TRANSCRIPT

Graduate Theses, Dissertations, and Problem Reports
2021
Quantifying the Impact of Load-Following on Gas-fired Power Quantifying the Impact of Load-Following on Gas-fired Power
Plants Plants
Yifan Wang WVU, [email protected]
Follow this and additional works at: https://researchrepository.wvu.edu/etd
Part of the Process Control and Systems Commons
Recommended Citation Recommended Citation Wang, Yifan, "Quantifying the Impact of Load-Following on Gas-fired Power Plants" (2021). Graduate Theses, Dissertations, and Problem Reports. 8143. https://researchrepository.wvu.edu/etd/8143
This Dissertation is protected by copyright and/or related rights. It has been brought to you by the The Research Repository @ WVU with permission from the rights-holder(s). You are free to use this Dissertation in any way that is permitted by the copyright and related rights legislation that applies to your use. For other uses you must obtain permission from the rights-holder(s) directly, unless additional rights are indicated by a Creative Commons license in the record and/ or on the work itself. This Dissertation has been accepted for inclusion in WVU Graduate Theses, Dissertations, and Problem Reports collection by an authorized administrator of The Research Repository @ WVU. For more information, please contact [email protected].

Quantifying the Impact of Load-Following on Gas-fired
Power Plants
Yifan Wang
Dissertation submitted to the
Benjamin M. Statler College of Engineering and Mineral Resources
at West Virginia University
in partial fulfillment of the requirements for the degree of
Doctor of Philosophy
in
Chemical Engineering
Debangsu Bhattacharyya, PhD, Chair
Richard Turton, PhD
Fernando V. Lima, PhD
Xingbo Liu, PhD
Stephen E. Zitney, PhD
Department of Chemical and Biomedical Engineering
Morgantown, West Virginia
2021
Keywords: natural gas, load-following, thermal-mechanical stress, equipment health, dynamic
modeling, multi-objective optimization
Copyright 2021 Yifan Wang

Abstract
Quantifying the Impact of Load-Following on Gas-fired Power Plants
Yifan Wang
Due to rapid penetration of renewables into the grid, natural gas combined cycle (NGCC) power
plants are being forced to cycle their loads more frequently and rapidly than for which they were
designed. However, the impact of load-following operation on plant efficiency and equipment
health are currently poorly understood. The objective of this work is to quantify the impact of load-
following on the gas-fired plants by developing high-fidelity multi-scale dynamic models.
There are four main tasks in this project. First, dynamic model of an NGCC power plant has been
developed. The main components of the NGCC plants are the gas turbine (GT), heat recovery
steam generator (HRSG), and steam turbine (ST). The second task focuses on one of the undesired
phenomena known as ‘spraying to saturation’ being faced by the NGCC plants during load-
following, where the attemperator spray leads to saturation at the inlet of superheater and/or
reheater causing damage and eventual failure of the superheater and/or reheater tubes due to two-
phase flow. Different configurations of NGCC plants and operation strategies that can not only
eliminate ‘spraying to saturation’ but can maximize the plant efficiency have been developed and
evaluated. The third task focuses on modeling the unprecedented damages to the boiler
components due to rapid load-following, which is leading to higher operation and maintenance
(O&M) costs. Stress and wear models have been developed by accounting for creep and fatigue
damages in key HRSG components. Multiple locations at the component junctions have been
monitored and the most stressed part has been identified as the constraint in the dynamic
optimization of the load-following operation. A multi-objective dynamic optimization algorithm
has been developed for maximizing plant efficiency and minimizing deviation from desired ramp
rates while satisfying operational constraints such as those due to stress and wear. The fourth task
focuses on developing reduced order models. Since the modeling domain of interest includes
multiple time scales and multiple spatial scales, it can be computationally intractable to use the

detailed models for optimization/scheduling/control. Therefore, reduced order dynamic models
have been developed for the NGCC system including the health models so that they can be
computationally tractable for being used in dynamic optimization while providing desired
accuracy.

iv
Acknowledgements
I would like to express my deepest gratitude to Dr. Debangsu Bhattacharyya, my advisor and a
great mentor during my PhD study at WVU. His knowledge and expertise are extremely valuable
and helpful to me in understanding the dynamic modeling and optimization of the advance process
and energy system. His support, patience, and mentorship are of great importance in my
development as a young researcher. I would also like to extend my gratitude to Dr. Richard Turton
as my co-advisor, and other committee members, Dr. Fernando V. Lima, Dr. Xingbo Liu and Dr.
Stephen E. Zitney, for their insightful advices, guidances and supports in my research work.
I would like to thank U.S.-China Clean Energy Research Center and U.S. Department of Energy for
funding my research. I sincerely thank all the members from Dr. Debangsu’s research group, Dr.
Yuan, Dr. Zhang, Dr. Huang, Dr. Morgan, Dr. Mevawala, Pushpitha, Paul, Anca, Gautham, Ryan,
Eli, Katie, Parikshit, Vivek, Ana, Pavitra, Dr. Mihn, Vinayak and many others for sharing their
knowledges and insights, and building a friendly and interesting research environment. Thanks
also to my friends Xin, Rebecca, Lei, Xiao, Xinwei, Shuyun, Lingfeng, Liu, Jing, Xiaofei, Xuan,
Haiyang, Yihan, Yibing for making the life at Morgantown a memorable one.
Most importantly, I would like to thank my family members for supporting me with love all these
years.

v
Contents Abstract .......................................................................................................................................... ii
Acknowledgements ...................................................................................................................... iv List of Figures ............................................................................................................................. viii List of Tables ................................................................................................................................ xi NOMENCLATURE .................................................................................................................... xii Chapter 1. Introduction ............................................................................................................. 1
Chapter 2. NGCC power plant dynamic model ...................................................................... 5 2.1. Literature review ............................................................................................................ 5
2.2. NGCC plant model development .................................................................................. 6
2.2.1 Gas turbine (GT) .......................................................................................................... 7
2.2.2 Heat recovery steam generator (HRSG) .................................................................... 8
2.2.3 Steam turbine (ST) ....................................................................................................... 9
2.2.4 Regulatory and supervisory control layers.............................................................. 13
2.3. Results and discussion .................................................................................................. 14
2.3.1 Gas turbine ................................................................................................................. 14
2.3.2 Heat recovery steam generator (HRSG) .................................................................. 15
2.3.3 Steam turbine ............................................................................................................. 17
2.3.4 Dynamic model at full load ....................................................................................... 17
2.4. Conclusion ..................................................................................................................... 18
Chapter 3. Novel configurations of NGCC plant for load-following................................... 19 3.1. Literature Review ......................................................................................................... 19
3.2. NGCC configurations and control strategies for load-following operation............ 20
3.2.1 Configuration 1 .......................................................................................................... 21
3.2.2 Configuration 2 .......................................................................................................... 21
3.2.3 Configuration 3 .......................................................................................................... 23
3.2.4 Configuration 4 .......................................................................................................... 23
3.2.5 Configuration 5 .......................................................................................................... 24
3.3. Dynamic Optimization ................................................................................................. 25
3.4. Results and discussion .................................................................................................. 27
3.4.1 Configuration 1 .......................................................................................................... 28
3.4.2 Configuration 2 .......................................................................................................... 30
3.4.3 Configuration 3 .......................................................................................................... 32
3.4.4 Configuration 4 .......................................................................................................... 34
3.4.5 Configuration 5 .......................................................................................................... 37
3.4.6 Thermal efficiency analysis ....................................................................................... 38

vi
3.5. Conclusion ..................................................................................................................... 40
Chapter 4. Optimal load-following of NGCC plant with stress monitoring of high-
pressure boiler drum .................................................................................................................. 42 4.1. Literature Review ......................................................................................................... 42
4.2. HP Drum stress and fatigue damage .......................................................................... 45
4.2.1 Drum geometry .......................................................................................................... 46
4.2.2 Temperature transient and thermo-mechanical stress evolution .......................... 46
4.2.3 Simplified mechanical stress and thermal stress calculation ................................. 47
4.2.3 Stress concentration due to the component discontinuity ...................................... 48
4.2.4 Fatigue damage .......................................................................................................... 51
4.3. Dynamic optimization .................................................................................................. 52
4.4. Results and discussion .................................................................................................. 56
4.4.1 HP Drum stress transient under the load-following operation ............................. 56
4.4.2 Dynamic optimization under the load-following operation ................................... 60
4.5. Conclusion ..................................................................................................................... 71
Chapter 5. Optimal load-following of NGCC plant with stress monitoring of both HP drum
and superheater/reheater ........................................................................................................... 73
5.1. Literature review .......................................................................................................... 73
5.2. SH/RH geometry and stress monitoring location ...................................................... 74
5.2.1 SH/RH geometry ........................................................................................................ 74
5.2.2 SH/RH junction stress monitoring under the load-following operation ............... 74
5.3. Dynamic optimization .................................................................................................. 76
5.4. Results and discussion .................................................................................................. 78
5.4.1. Optimal process under a constant average ramp rate neglecting stress
constraint ............................................................................................................................. 78
5.4.2. Optimal process when the drum stresses are limiting ....................................... 81
5.4.3. Optimal operation when the SH stresses are limiting ....................................... 85
5.4. Conclusion ..................................................................................................................... 89
Chapter 6. Reduced order model development ..................................................................... 91
6.1. Literature Review ......................................................................................................... 91
6.2. Linear reduced-order state-space model.................................................................... 91
6.2.1 Linear SIMO state-space model ............................................................................... 92
6.2.2 Reduced-order model ................................................................................................ 92
6.3. Linear transfer function model ................................................................................... 96
6.4. Conclusion ..................................................................................................................... 97
Chapter 7. Final Remarks ....................................................................................................... 98

vii
Chapter 8. Future Work ........................................................................................................ 100
Appendix A: The thermo-hydraulic model of HRSG ............................................................ 102
A.1. ε-NTU method ............................................................................................................... 102
A.2. Heat transfer coefficients .............................................................................................. 102
Appendix B: Creep rupture assessment ................................................................................. 104 B.1 Creep damage model ...................................................................................................... 104
B.2. Creep rupture assessment using minimum commitment (MC) equation ................ 104
Appendix C: Publications and Presentations ......................................................................... 107 References .................................................................................................................................. 108

viii
List of Figures
Figure 2. 1. Process flow diagram of NGCC power plant .............................................................. 7 Figure 2. 2. Stage by stage model of steam turbine for moisture detection and correction (a) logic-
based Algorithm1 (b) without logic-based Algorithm2 ................................................................ 12 Figure 2. 3. GT thermal efficiency under off-design conditions ................................................. 14 Figure 2. 4. GT temperature and air/fuel mass flow ratio under off-design conditions (a) TET (b)
TIT and air/fuel ratio ..................................................................................................................... 15 Figure 3. 1. Series configuration with single-stage attemperation 21
Figure 3. 2. Series configuration with two-stage attemperation for HP SH2 and one-stage
attemperation for RH .................................................................................................................... 22 Figure 3. 3. Parallel configuration with single-stage attemperation ............................................. 23
Figure 3. 4. Parallel configuration with two-stage attemperation ................................................. 24 Figure 3. 5. Parallel configuration including damper control with two-stage attemperation for HP
SH2 and one-stage attemperation for RH ..................................................................................... 25
Figure 3. 6. Steam temperature transients under load-following operation using coordinated control
for Configuration 1: (a1) main steam temperature, (a2) HP SH2 inlet temperature, (b1) reheat
steam temperature, (b2) RH inlet temperature .............................................................................. 28
Figure 3. 7. Comparison between coordinated control and dynamic optimization for Configuration
2 (a) thermal efficiency (b) spray flow at the SH ATT1 and RH ATT ........................................ 30
Figure 3. 8. Steam temperature transients under load-following operation for Configuration 2: (a1)
main steam temperature, (a2) HP SH2 inlet temperature, (b1) reheat steam temperature, (b2) RH
inlet temperature ........................................................................................................................... 31
Figure 3. 9. Steam temperature transients under load-following operation using coordinated control
for Configuration 3: (a1) main steam temperature (a2) HP SH2 inlet temperature (b1) reheat steam
temperature (b2) RH inlet temperature ......................................................................................... 33 Figure 3. 10. Comparison between coordinated control and dynamic optimization for
Configuration 4 (a) thermal efficiency (b) spray flow at ATT1 (c) HP steam flow (d) IP steam flow
....................................................................................................................................................... 34
Figure 3. 11. Steam temperature transients under load-following operation for Configuration 4:
(a1) Main steam temperature (a2) HP SH2 inlet temperature (b1) Reheat steam temperature (b2)
RH inlet temperature ..................................................................................................................... 35 Figure 3. 12. Dynamic optimization for Configuration 5 (a) spray flow at SH ATT1 (b) IP steam
flow ............................................................................................................................................... 37 Figure 3. 13. Steam temperature transients under load-following operation for Configuration 5 (a1)
main steam temperature, (a2) HP SH2 inlet temperature, (b1) reheat steam temperature, (b2) RH
inlet temperature ........................................................................................................................... 38 Figure 3. 14. Load-following operation of NGCC plant (a) thermal efficiency (b) power output 39 Figure 4. 1. Parallel configuration with two-stage attemperation 45
Figure 4. 2. Schematic and approximation of cylindrical shell with a hole.................................. 49
Figure 4. 3. Drum pressure and temperature transients under load-following operation: (a) pressure
(b) temperature .............................................................................................................................. 57 Figure 4. 4. Tangential stress transient on drum inner surface under load-following .................. 57 Figure 4. 5. Stress amplitude with respect to the drum wall thickness at Positions A and B ....... 58 Figure 4. 6. Transients of circumferential stress at drum/downcomer junction .......................... 59

ix
Figure 4. 7. Comparison between dynamic optimization and coordinated control system: (a)
thermal efficiency (b) total spray flow at SH/RH ATT (c) HP steam flow from HP drum (d) HP
drum pressure ................................................................................................................................ 61 Figure 4. 8. Comparison of stress transient between dynamic optimization and conventional linear
approach: (a) tangential stress at drum inner surface (b) circumferential stress at drum/downcomer
junction at Position B .................................................................................................................... 62 Figure 4. 9. Comparison of linear and optimal profiles under different stress constraints for 5%
average ramp down in load per min: (a) power output (b) thermal efficiency (c) HP drum stress at
drum/downcomer junction at Position B ...................................................................................... 63 Figure 4. 10. Comparison of linear and optimal profiles under different stress constraints for 5%
average ramp up in load per min (a) Power output (b) Thermal efficiency (c) HP drum stress at
drum/downcomer junction at Position B ...................................................................................... 65
Figure 4. 11. Effect of the stress upper bound on the minimum ramprate relaxation and time
average thermal efficiency for a desired rate of 5% rampdown per minute ................................. 66 Figure 4. 12. Comparison of different ramp-down processes with the fixed/relaxed average ramp
rate: (a) power output (b) thermal efficiency (c) HP drum stress at drum/downcomer junction at
Position B ...................................................................................................................................... 67 Figure 4. 13. Effect of ramprate relaxation on time average efficiency for ramp down when stress
upper bound of 165 MPa and desired ramprate is 5% load change per min ................................ 69
Figure 4. 14. Effect of the stress lower bound on the minimum ramprate relaxation and time
average thermal efficiency for a desired rate of 5% rampup per minute ...................................... 69
Figure 4. 15. Comparison of different ramp-up processes with the fixed/relaxed average ramp rate:
(a) power output (b) plant thermal efficiency (c) HP drum stress at drum/downcomer junction at
Position B ...................................................................................................................................... 70
Figure 5. 1 Schematic of SH/RH header-tube junction 75
Figure 5. 2. Different locations for SH/RH head-tube junction stress monitoring ....................... 75 Figure 5. 3. SH(A) inlet performance under the load-following (a) steam temperature (b) steam
pressure (c) stress at Position A of junction(d) stress at Position B of junction ........................... 80
Figure 5. 4. SH(B) inlet performance under the load-following (a) steam temperature (b) steam
pressure (c) stress at Position A of junction(d) stress at Position B of junction ........................... 81
Figure 5. 5. Linear and optimal profiles under different drum stress constraints for 5% average
ramp down in load per min: (a) power output, (b) SH(B) inlet steam temperature, (c) stress at
SH(B) inlet junction Position B .................................................................................................... 82
Figure 5. 6. Comparison of linear and optimal profiles under different drum stress constraints for
5% average ramp up in load per min: (a) power output, (b) SH(B) inlet steam temperature, (c)
stress at SH(B) inlet junction Position B ...................................................................................... 84
Figure 5. 7. Linear and optimal profiles under different equipment stress constraints for ramp-
down process: (a) power output (b) thermal efficiency (c) stress at HP drum junction Position B
(d) stress at SH(B) inlet junction Position B ................................................................................. 85 Figure 5. 8. Linear and optimal profiles under different equipment stress constraints for ramp-up
process: (a) power output (b) thermal efficiency (c) stress at HP drum junction Position B (d) stress
at SH(B) inlet junction Position B ................................................................................................ 88 Figure 6. 1. Hankel singular values of the state-space model under full load condition 93
Figure 6. 2. Input variation for the ROM validation .................................................................... 93

x
Figure 6. 3. Output responses to the input variations for linear model generated at full load
condition (a) total power output (b) GT power output (c) main steam temperature (d) reheat steam
temperature ................................................................................................................................... 94 Figure 6. 4. Output responses to the input variations for linear model generated at 0.8load and
0.6load (a) total power output (b) GT power output (d) main steam temperature (e) reheat steam
temperature ................................................................................................................................... 95 Figure 6. 5. Random signals of input for system identification ................................................... 96
Figure 6. 6. Comparison between model in Aspen Plus Dynamics and identified process model96 Figure B. 1. Creep-rupture database of Grade 91 steel
104
Figure B. 2. Different isothermal curves and 95% confidence bounds for creep-rupture database
..................................................................................................................................................... 106

xi
List of Tables
Table 2. 1 Estimated coefficients for the dimensionless GT performance curves ........................ 14 Table 2. 2 HRSG model comparison ............................................................................................ 16
Table 2. 3. Operating parameters and the surface area of the three-pressure HRSG ................... 16 Table 2. 4. Computational times of different ST algorithms for load-following operation.......... 17 Table 2. 5. Comparison between the model results and NETL baseline Case B31A ................... 18 Table 3. 1. Key operating conditions and performance measures for variation in HP SH2 area ratio
at 40% load for Configuration 2 32
Table 3. 2. Key operating conditions and performance measures for variation in HP SH2 and RH
area ratio at 40% load for Configuration 4 ................................................................................... 36 Table 3. 3. Summary of different configurations for load-following operation .......................... 39
Table 3. 4. Performances of different configurations at 40% load ............................................... 40 Table 4. 1. HP Drum geometry and material 46
Table 4. 2. Relation of stress concentration factors at different positions .................................... 50
Table 4. 3. Fatigue damage estimation at drum/downcomer junction ......................................... 59 Table 4. 4. Plant average efficiency under different ramp-down processes with the fixed average
ramp rate ....................................................................................................................................... 64
Table 4. 5. Plant average efficiency under different ramp-up processes with the fixed average ramp
rate................................................................................................................................................. 64
Table 4. 6. Plant average efficiency under different ramp-down processes with the fixed/relaxed
average ramp rate .......................................................................................................................... 68 Table 5. 1. HP SH/IP RH geometry and material 74
Table 5. 2. Stress at SH/RH header-tube junction under load-following ..................................... 79
Table 5. 3. Maximum and minimum Stress and stress amplitude at SH inlet header-tube junction
under load-following ..................................................................................................................... 80 Table 5. 4. SH inlet header-tube junction stress under different ramp-down processes ............... 83
Table 5. 5. SH inlet header-tube junction stress under different ramp-up processes .................... 84 Table 5. 6. Comparison of linear and optimal ramp-down profiles under different equipment stress
constraints ..................................................................................................................................... 86 Table 5. 7. Comparison of linear and optimal ramp-up profiles under different equipment stress
constraints ..................................................................................................................................... 89 Table B. 1. Coefficients of MC equation for Grade91
105
Table B. 2. 95% confidence intervals for coefficients of MC equation ..................................... 105

xii
NOMENCLATURE
Af fin surface area (m2)
At bare tube surface area (m2)
Atot finned tube surface area (m2)
Cflow nozzle coefficient
C heat capacity rate
Df fatigue damage
d drum/tube inner diameter (mm)
dm drum mean diameter (mm)
E weld joint efficiency
Em Young’s modulus (N/mm2)
f friction factor of tube
Fa arrangement factor of tube banks
Fm mass flowrate (kg/hr)
F correction factor
h heat transfer coefficient (W/m2 K)
H enthalpy (J/kg)
�̇� isentropic head of turbine (m)
k thermal conductivity (W/m K)
kis stage head coefficient
LHV lower heating value (MJ/kg)
MAS maximum allowable stress of material (MPa)
N the number of cycling
n number of tube passes
NA maximum allowable cycle number
𝑛𝑓 normalized heat flux correction factor
Ns specific shaft speed
NTU number of transfer units
Nu Nusselt number
P pressure (bar)
𝑝𝑙 longitudinal tube pitch (m)
Pr Prandtl number

xiii
𝑝𝑡 transverse tube pitch (m)
P_r Reduced pressure
Q parameter for mechanical stress concentration factor
r drum radius (mm)
ramprate real-time plant load ramp rate
Re Reynolds number
RPM shaft revolution speed (RPM)
Rp tube surface roughness (μm)
Rx reaction in the blade
s wall thickness (mm)
t time (hr)
T temperature (K)
TEL total exhaust losses from the exhaust hood
Tm mean temperature through the wall (K)
u decision variable in optimization
U overall heat transfer coefficient (W/m2 K)
v mean diameter peripheral velocity (m/s)
�̇� volumetric flowrate (m3/s)
Vin velocity of the stream entering the stage (m/s)
Vrbl velocity of the rotating blade (m/s)
W parameter for mechanical stress concentration factor
X vapor fraction
z parameter for thermal stress concentration factor
Greek Symbols
ε heat exchanger effectiveness
𝜌 density (kg/m3)
η isentropic efficiency
η0 surface efficiency of the finned tube
ηf fin efficiency
𝜂𝑠𝑡 stage efficiency at 3000 RPM
Δ𝜂𝜔 efficiency penalty for operating at RPM higher than 3000

xiv
γ heat capacity ratio
ηth thermal efficiency
𝜆 stress concentration factor
𝛽 stress magnitude ratio
𝜑 position angle at the junction
Φ𝑤 shape factor
∅ heat flux (W/m2)
υ Poisson’s ratio
𝜎 stress (MPa)
αm thermal expansion coefficient (K-1)
𝛼𝑤 wall thermal diffusivity (m²/s)
Δ𝜎 stress amplitude (MPa)
£ parameter for mechanical stress concentration factor
Subscripts
ave average value
amp stress amplitude
b downcomer branch
c design condition
D dimensionless ratio
dew dew point
dry no moisture
ELEP the end-line end-point enthalpy
f liquid phase
FB flow boiling
fin final time for ramp-up/ramp-down
g gas phase
in inner surface/ inlet condition
ini initial time for ramp-up or ramp-down
is isentropic condition
k positions at drum/downcomer junction
lower lower bound

xv
m mechanical stress
max maximum
min minimum
MS main steam
NcB nucleate boiling
NG natural gas
out outer surface/ outlet condition
PF pressure correction
r radial direction
RH reheater
RS reheat steam
SH superheater
sp setpoint
t thermal stress/tube side
th thermal efficiency
TP two-phase
UEEP the used-energy end-point enthalpy
upper upper bound
z axial direction
θ tangential direction
𝜑 circumferential direction

1
Chapter 1. Introduction
In recent years, an increasing amount of electricity in the U.S. has been generated from renewable
sources. According to the United States Energy Information Administration (U.S. EIA, 2020),
renewable energy sources accounted for about 17% of the total U.S. electricity generation in 2019.
In addition, the share of the renewable sources in the electric grid is expected to continue to grow
in the foreseeable future. Due to intermittency of the renewable energy sources, conventional
fossil-fueled power plants are being forced to cycle their load more frequently and rapidly than for
which they were designed.
Besides the coal-fired power plants, natural gas combined cycle (NGCC) power plants are also
being subjected to load-following. Due to higher efficiency, lower emissions, and lower capital
cost of NGCC power plants, natural gas is leading the fossil-fuel based power generation,
accounting for about 38% of the U.S. generation capacity in 2019 (U.S. EIA, 2020). In addition,
NGCC plants show the high operational flexibility and rapid load-following capability. They
would be playing a key role in fulfilling the fluctuating grid demand.
Even though cycling operation may be unavoidable for many NGCC power plants, the impacts of
load-following on plant efficiency and equipment health are currently poorly understood. With
this motivation, high-fidelity multi-scale dynamic models are developed to assess and quantify the
impacts of load-following on the gas-fired power plants.
Specifically, this project includes four main tasks.
Specific Goal #1: Dynamic modeling of an NGCC power plant
Compared to the vast amount of literature on dynamic modeling of pulverized coal-fired power
plants (Lawal et al., 2012; Oko and Wang, 2014; Starkloff, et al., 2015; Hentschel et al., 2017;
Yan et al., 2020), the body of literature on detailed dynamic modeling of NGCC plants is much
lower. In addition, most of these studies are mainly focused on the specific components of NGCC
plant (e.g. Heat recovery stream generator). There are a few works in the open literature on
dynamic modeling of a complete combined cycle power plant. More details are discussed in
Section 2.1.

2
For an NGCC plant, while there are various designs of the boiler for the desired heat duty at the
nominal condition, the dynamics of the boiler can be very different depending on a specific design.
In other words, the plant dynamics strongly depend on the specific design.
The contributions of Task 1 are as follows. The boiler is optimally designed based on the operating
conditions outlined in NETL baseline Case B31A (Zoelle et al., 2015). Then a plant-wide dynamic
model of the NGCC plant is developed with detailed equipment level sub-models to capture the
plant load-following behavior. The NGCC dynamic model includes a model of the gas turbine
(GT) for estimating its performance under off-design conditions, a thermo-hydraulic model for the
heat recovery steam generator (HRSG), and a model of the steam turbine (ST) with moisture
detection and variable adaptation capability.
Specific Goal #2: Modeling and evaluating novel NGCC configurations and optimizing their
operation for avoiding spraying to saturation
Under the load-following, the main steam and reheat steam temperature should be well maintained
to avoid the ST damage or efficiency loss. At low load, the higher exhaust gas temperature from
the GT and the lower steam flowrate may lead to a higher final steam and reheat steam temperature
exceeding the maximum design steam temperature to the ST. Excessive spray is required at
attemperators before the inlet of the superheater/reheater for steam temperature control. That
would lead to two-phase flow through the superheater/reheater typically denoted in the utility
industry as ‘spraying to saturation’ (Moelling et al., 2015; Sorge et al., 2017). Since superheater
and reheater are not typically designed for two-phase flow, this undesired phenomenon should be
avoided. More details are shown in Section 3.1.
Damage in superheater/reheater tubes as a result of ‘spraying to saturation’ has been reported by
the utilities and the recent literature (Moelling et al., 2015; Sorge et al., 2017; Liese and Zitney,
2018). However, to the best of our knowledge, there has been no study on this issue in the open
literature using a mathematical model especially for mitigating this undesired phenomenon.
The contributions of Task 2 are as follows. Several novel configurations are proposed for
controlling the main steam and reheat steam temperatures while avoiding ‘spraying to saturation’
during fast load-following by considering different final high-pressure superheater (HP SH2)/
reheater (RH) arrangements (in series or in parallel) and attemperation strategies (single-stage,
two-stage, and damper-assisted attemperation). Load-following operation is studied under two

3
operational strategies- the industry-standard coordinated control strategy and dynamic
optimization. Dynamic optimization is formulated to maximize the plant efficiency while
satisfying the operational constraints and state transition constraints.
Specific Goal #3: Equipment damage model and optimal load-following of NGCC plant with
stress monitoring
Damage of the boiler components caused by rapid load-following is difficult to measure or identify
real-time. Typically, simplified expressions for cycling cost have been used as a measure of
damage due to load-following operation in unit commitment models (Troy et al., 2012; Rodilla et
al., 2013; Van den Bergh and Delarue, 2015). However, a damage model that can be executed real
time for equipment health analysis and optimal load-following operation is desired and for
reducing the adverse impact of load-following.
In an HRSG, the thick-walled HP drum is one of the most vulnerable components. It is mainly
subject to the fatigue damage. Load-following leads to cyclic variation in steam pressure and
temperature affecting the stress profiles in the HP drum. Moreover, the stress concentration due to
the discontinuity in the drum such as those due to drum-downcomer junctions can intensify the
stress amplitude under the load-following operation.
Superheaters (SH) and reheaters (RH), as the other vulnerable components, are subject to both
creep and fatigue damage due to the high operating temperature and the large inlet stream
temperature variation caused by the large amount of spray at the inlet attemperator under the load-
following. When the final main steam and reheat steam temperatures are well-maintained and
overheating is avoided, the creep damage on the SH/RH caused by load-following is not
significant. However, if the attemperator spray at the inlet of SH/RH is high, then it can lead to
large thermal stress and fatigue damage on SH/RH. Also, the SH/RH header-tube junctions can
experience high stress amplitude and fatigue damage during load-following operation.
Monitoring of stress evolution in the critical components can be useful not only for optimal
operation of NGCC power plants but also for improving their reliability and reducing the operating
and maintenance (O&M) costs. For assessing component damage, it is desired to develop a model
that is computationally inexpensive and can be used for model-based dynamic optimization. In
this work, available international standards and literature are leveraged for computing creep and
fatigue damages of boiler components.

4
The contributions of Task 3 are as follows. Fatigue/creep damage of boiler components is
estimated by developing a detailed plant model that can compute through-wall temperature
transients and thermo-mechanical stress evolutions in the critical components (i.e. HP drum,
superheater and reheater). EN Standard 12952-3 with consideration of additional positions at
junctions is used to monitor locations that can be more vulnerable to fatigue damage. Optimal
load-following operation with stress constraint is obtained by solving a dynamic multi-objective
optimization problem.
Specific Goal #4: Reduced order dynamic model development
There is scarcity of literature on reduced order dynamic modeling of NGCC plants especially when
damage models are considered. In the high-fidelity model, the equipment stress is calculated based
on the transient information of certain state variables. While in the reduced order model, it is hard
to capture the state variable transient for stress estimation. The contributions of Task 4 are as
follows. A state-space dynamic reduced order model (ROM) for the NGCC plant is generated.
Then a liner hybrid ROM for reasonable analysis of the equipment health with affordable
computational cost is developed for dynamic optimal dispatch of energy systems (Kim et al.,
2020).
The nonlinear NGCC plant model in Aspen Plus Dynamic can be linearized at the different load
conditions by using control design interface (CDI) tool to generate a large-scale full-order linear
state space model. The balanced truncation method is used for reducing the order of the linear full-
state model to a reduced order state-space model with a lower computational cost. This reduced
order model shows a good prediction in power output and steam temperature.
Since the state-space model may not accurately capture the transients in through-wall temperature
profile thus can lead to inaccuracies in the evaluation of thermal stress, the simple input-output
transfer function model is also developed to provide the thermal stress transients under the load-
following. The hybrid linear reduced order model is computationally tractable for being used in
the optimal scheduling.

5
Chapter 2. NGCC power plant dynamic model
2.1. Literature review
Dynamic behavior of NGCC plants and advanced control techniques for load-following operation
can be simulated and investigated using a high-fidelity dynamic model. Even though there are a
number of studies in the open literature on dynamic modeling and control of NGCC plants, most
of them are only focused on the specific component, such as the GT or ST or HRSG, while other
components of NGCC plant are considered as a boundary or fairly simple models are used for
those components.
Pletl (2005) developed a dynamic model of a single-pressure once-through heat recovery steam
generator (HRSG) model and demonstrated the importance of thermal inertia in the HRSG model
on accurate prediction of the boiler response. Alobaid et al (2008, 2009) developed dynamic
models of a subcritical drum-type HRSG and a supercritical once-through HRSG using the
Advanced Process Simulation Software (Apros®). In addition, a transient simulation of the start-
up of a subcritical HRSG was conducted by Alobaid et al (2014) using Aspen Plus Dynamics®
(APD). However, GT model was not included in these works and the exhaust temperature and
mass flow from GT were applied as dynamic boundary conditions. Horkeby (2012) developed a
dynamic model of an HRSG to evaluate the performance of different control strategies, but simple
models of the GT and ST were considered. Rieger (2009) evaluated various control concepts for a
once-through HRSG for rapid load changes from full load to 38% and vice versa. They observed
that the ramp rates can be improved through efficient control design. The studies noted before are
mainly focused on the HRSG, while other components of NGCC plant, such as the gas turbine
(GT) and steam turbine (ST) are considered as a boundary or fairly simple models are used for
those components.
However, there are considerable variabilities in the GT and ST performances under off-design
operation. Development of mathematical models for the behavior of the ST under off-design
conditions has been the focus of a number of studies. The Stodola equation is widely used for the
pressure-flow calculation (Cooke, 1983). A nonlinear mathematical model was developed by
Chaibakhsh and Ghaffari (2008) to study the transient dynamics of an ST. High-pressure (HP),
intermediate-pressure (IP) and low-pressure (LP) sections were considered separately in the
model. However, the turbine efficiency was assumed to be constant. A model of an ST with partial
6
arc admission was developed by Liese (2014). Separate models were developed for the first stage
and last stage, while the intermediate stages were considered to have constant efficiency. A stage-
by-stage approach was proposed by Lozza (1990) to estimate the ST efficiency based on the
operating conditions, and other key design parameters.
There are a few works in the open literature on dynamic modeling of a complete combined cycle
power plant using detailed models of the GT, ST, and HRSG that can be used for studying the off-
design transient behavior of the NGCC plants. Benato et al. (2015, 2016) developed a dynamic
model of a combined cycle plant to evaluate the transient behavior during load variations and
estimate the lifetime reduction of most stressed components. A dynamic model of an NGCC plant
with post-combustion CO2 capture (PCC) system was developed by Montañés et al. (2017). The
dynamic interaction between NGCC and PCC units was analyzed and different control structures
for the PCC plant were evaluated.
While there are various designs of the heat exchangers like HRSG for the desired heat duty,
dynamics of the HRSG can be very different (Jiang et al., 2018). Since HRSGs can be designed
for the same heat duty but different objective functions, such as minimizing the total area or
maximizing compactness (Franco and Giannini, 2006), their dynamics strongly depend on the
specific design. Hence, first the HRSG is optimally designed and then it is used to develop a plant-
wide dynamic model of an NGCC plant to assess the impact of load-following operation.
In this chapter, a high-fidelity plant-wide dynamic model of an NGCC power plant is developed
with detailed equipment level sub-models. A model of the gas turbine (GT) for estimating its
performance under off-design conditions, a thermo-hydraulic model for the heat recovery steam
generator (HRSG), and a model of the steam turbine (ST) with moisture detection and correction
capability are included in the NGCC plant model. It was observed that the steady-state results from
the dynamic model at full load shows a great agreement with the NETL baseline Case B31A
(Zoelle et al., 2015). Also, the off-design behavior of NGCC plant can be simulated using the
dynamic model.
2.2. NGCC plant model development
A nominal 641 MWe gross NGCC power plant is modeled based on the baseline Case B31A
conducted by the National Energy Technology Laboratory (NETL) (Zoelle et al., 2015). The

7
steady-state model is developed using Aspen Plus® and Aspen Custom Modeler® (ACM), and then
converted to the dynamic model, which is simulated using Aspen Plus Dynamics® (APD).
As shown in Figure 2.1, the exhaust heat from the GT is recovered in a triple-pressure HRSG with
reheat. The condensate from the condenser first passes through the 2-stage pre-heater (PRE HRT)
and deaerator. Then HP, IP and LP steams are generated by sending boiler feed water (BFW)
through a corresponding economizer (ECO), evaporator (EVA) and superheater (SH),
respectively. The heating sections can be arranged in series or in parallel for heat recovery.
Correspondingly, a triple-pressure ST is used for power generation. The main steam leaving the
HP ST, combined with IP steam, goes through the RH to produce reheat steam for the IP ST. The
attemperators are used to maintain the main steam and reheat steam temperature by spraying BFW
at the inlets of the HP SH2 and RH. The total steam from the LP ST is sent back to the condenser
thus completing the water cycle.
HPEVA
HP ECO2//LP SH
RH //HP SH2
HP SH1//IP SH
LPEVA
LPECO
IPEVA
IP ECO//HP ECO1
HPTurbine
IPTurbine
Generator LP TurbineCondenser
Hot Well
Condensate Pump
FW Makeup
PREHTR2
LP PumpIP Pump
HP Pump
Air InletFilter
AmbientAir
Natural Gas
Gas Turbine
Stack
LP/FW circuit
IP/RH circuit
HP circuit
LP DrumIP DrumHP Drum
RH Attemperator
HP SH2 Attemperator
Flue gas
PREHTR1
DeaeratorAir vent
Figure 2. 1. Process flow diagram of NGCC power plant
2.2.1 Gas turbine (GT)
Due to the fast response of the GT in comparison to the water/steam cycle, shaft and thermal
dynamics of the GT are neglected. Dimensionless performance curves are used to model the

8
dimensionless head and isentropic efficiency versus dimensionless flow under standard conditions
as shown in Equations 2.1-2.5.
�̇�𝐷 =�̇�
�̇�𝑇 (2.1)
𝜂𝐷 =𝜂
𝜂𝑇 (2.2)
�̇�𝐷 =�̇�
�̇�𝑇 (2.3)
�̇�𝐷 = 𝑎1�̇�𝐷2 + 𝑎2�̇�𝐷 + 𝑎3 (2.4)
𝜂𝐷 = 𝑏1�̇�𝐷2 + 𝑏2�̇�𝐷 + 𝑏3 (2.5)
where 𝐻 ̇ is the head, η is the isentropic efficiency, and 𝑉 ̇ is the volumetric flowrate under standard
conditions. The subscripts ‘D’ and ‘T’ represent dimensionless ratio and nominal condition,
respectively. Coefficients a and b are regressed using the literature data (Jordal et al. 2012).
2.2.2 Heat recovery steam generator (HRSG)
A triple-pressure HRSG with reheat is used for steam generation as shown in Figure 2.1. In order
to capture the load-following behavior, a thermo-hydraulic model is developed to size all the
heating sections in the HRSG with due considerations of their geometry, configuration, and other
design parameters.
For each heating section, finned tube heat exchangers in a staggered arrangement are modeled.
Exchangers with several tube passes and overall counter-flow is modeled using the ε-NTU method,
while each single pass is considered to be in a crossflow arrangement with the flue gas side mixed
and water/steam side unmixed. In addition, pressure drop on the tube side is also considered.
The heat transfer coefficient for the gas side is calculated using the following correlation (Khan
et al., 2006)
𝑁𝑢𝐷 = 0.35𝐹𝑎𝑅𝑒𝐷0.57𝑃𝑟0.31 (2.6)
where NuD and ReD denote Nusselt number and Reynolds number based on the tube diameter,
respectively. Pr denotes the Prandtl number and Fa is an arrangement factor related to the tube
pitch.
The heat transfer coefficients for the water/steam vary based on the phase. The Gnielinski
correlation (1976) is used for the liquid phase:

9
𝑁𝑢 =(𝑓/8)(𝑅𝑒−1000)𝑃𝑟
1+12.7√𝑓 8⁄ (𝑃𝑟2/3−1) (2.7)
where f denotes the friction factor for smooth tubes.
The Dittus-Boelter correlation (1930) is used for the vapor (steam) phase:
𝑁𝑢 = 0.023𝑅𝑒0.8𝑃𝑟0.4 (2.8)
For the evaporator, boiler circulation ratios vary depending on pressure levels (Ganapathy, 2013).
The convective heat transfer coefficient under boiling condition is given by (Collier and Thome,
2006):
ℎ𝐹𝐵 = [(ℎ𝑁𝑐𝐵𝐹𝑁𝑐𝐵)3 + (ℎ𝑓𝐹𝑇𝑃)3
]1/3
(2.9)
where hNcB is normalized nucleate pool boiling coefficient; hf is the liquid heat transfer coefficient
calculated by Gnielinski correlation; FNcB is a nucleate boiling correction factor, including the
effects of pressure, heat flux, tube diameter, and surface roughness; FTP is two-phase multiplier
related to the steam quality.
The overall heat transfer coefficient is calculated as:
𝑈 = [𝐴𝑡
ℎ𝑔𝐴𝑡𝑜𝑡𝜂0+
𝑠
𝑘+
1
ℎ𝑡]
−1
(2.10)
where η0 is the overall surface efficiency of the finned tube, s is tube thickness, k is thermal
conductivity of tube. hg and ht are gas side and tube side heat transfer coefficient, respectively. At
and Atot are bare tube and finned tube surface area, respectively.
Besides the surface area of each heating section, the wall thickness and component material for
specific equipment, such as HP drum and high temperature SH/RH, are determined to calculate
the thermo-mechanical stress evolution. More details will be discussed in the following chapter.
2.2.3 Steam turbine (ST)
Similar to the GT model, the shaft and thermal dynamics of the ST are neglected as the ST response
is much faster than the water/steam cycle. In an ST model, an impulse-type stage is used as the
governing stage while other stages typically have a 50% reaction, and the final stage operates under
a choked flow condition with a large variation in the amount of reaction from blade root to tip
(Liese, 2014). Hence, three separate ST models are considered to capture the off-design behavior
of the ST, i.e., leading (governing) stage, intermediate stages, and final stage. The turbine models

10
are developed in ACM. These custom models are then compiled into library blocks and used in
APD.
Leading/Governing Stage
Model of the leading stage is developed based on the work of Liese (2014). In the model, the
nozzle flow equation is used to calculate the pressure-flow relationship:
𝐹𝑚 = 𝐶𝑓𝑙𝑜𝑤𝑃𝑖𝑛
√𝑇𝑖𝑛
√𝛾
𝛾−1[(
𝑃𝑜𝑢𝑡
𝑃𝑖𝑛)
2
𝛾− (
𝑃𝑜𝑢𝑡
𝑃𝑖𝑛)
𝛾+1
𝛾] (2.11)
where Fm is the mass flowrate, γ is heat capacity ratio, Cflow is the nozzle coefficient and determined
according to the nominal condition.
The stage efficiency coefficient 𝜂is is calculated as:
𝜂𝑖𝑠 = 2𝜂𝑇 (𝑉𝑟𝑏𝑙
𝑉𝑖𝑛) [(√1 − 𝑅𝑥 −
𝑉𝑟𝑏𝑙
𝑉𝑖𝑛) + √(√1 − 𝑅𝑥 −
𝑉𝑟𝑏𝑙
𝑉𝑖𝑛)
2
+ 𝑅𝑥 ] (2.12)
𝑉𝑖𝑛 = 44.72√(1 − 𝑅𝑥)(𝐻𝑖𝑛 − 𝐻𝑖𝑠,𝑜𝑢𝑡) (2.13)
where 𝜂𝑇 is the efficiency under nominal condition, Rx is reaction in the blade and assumed to 1%
for the leading stage, Vrbl is the velocity of the rotating blade and determined according to the
nominal condition, Vin is the velocity of the stream entering the stage and related with the specific
enthalpy H.
Intermediate Stages
A model of the intermediate stage is developed according to the stage-by-stage approach (Lozza,
1990), which is uses the basis of the thermodynamic stage rather than the true stage.
For each stage, the isentropic enthalpy drop △His is related to the mean diameter peripheral velocity
v and the specific shaft speed Ns.
Δ𝐻𝑖𝑠 =𝑘𝑖𝑠𝑣2
2 (2.14)
𝑘𝑖𝑠 = 2.20 + 8.88exp (−42.83𝑁𝑠) (2.15)
𝑁𝑠 = (𝑅𝑃𝑀
60)
√�̇�𝑖𝑠,𝑜𝑢𝑡
Δ𝐻𝑖𝑠0.75
(2.16)
where kis is the stage head coefficient and obtained under the nominal operating condition, �̇�𝑖𝑠,𝑜𝑢𝑡
is the volume flowrate at stage outlet under the isentropic condition, RPM is the revolution speed.
11
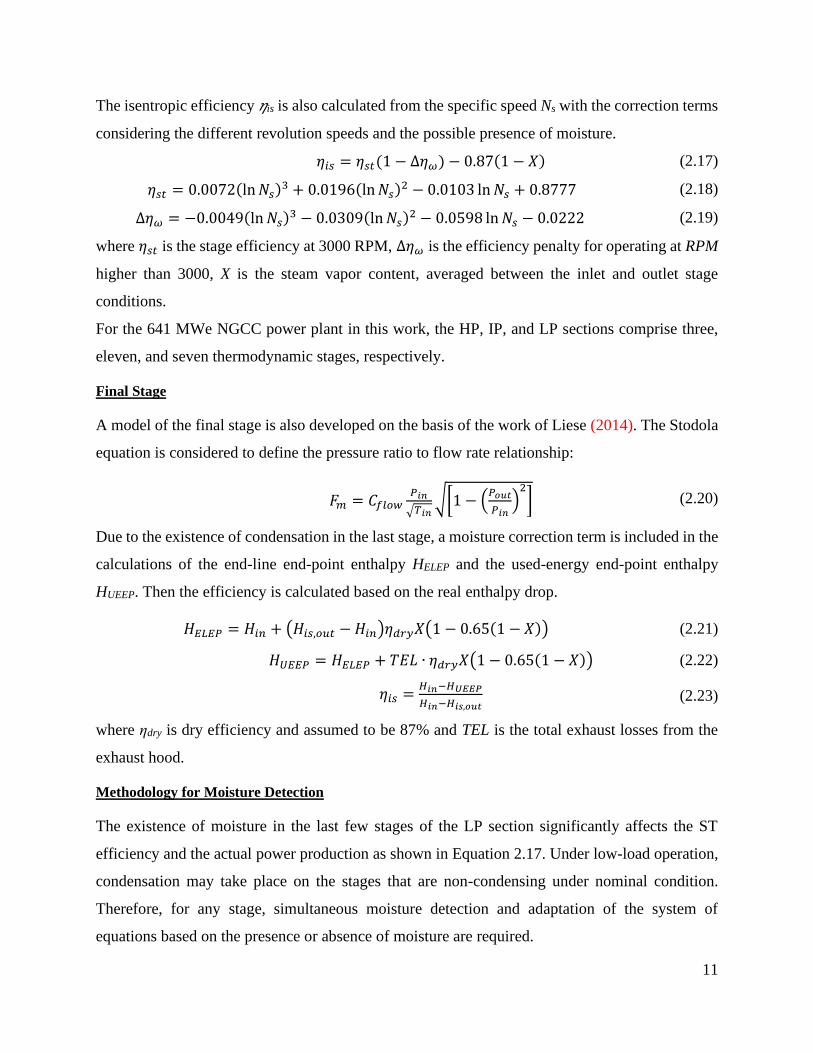
The isentropic efficiency 𝜂is is also calculated from the specific speed Ns with the correction terms
considering the different revolution speeds and the possible presence of moisture.
𝜂𝑖𝑠 = 𝜂𝑠𝑡(1 − Δ𝜂𝜔) − 0.87(1 − 𝑋) (2.17)
𝜂𝑠𝑡 = 0.0072(ln 𝑁𝑠)3 + 0.0196(ln 𝑁𝑠)2 − 0.0103 ln 𝑁𝑠 + 0.8777 (2.18)
Δ𝜂𝜔 = −0.0049(ln 𝑁𝑠)3 − 0.0309(ln 𝑁𝑠)2 − 0.0598 ln 𝑁𝑠 − 0.0222 (2.19)
where 𝜂𝑠𝑡 is the stage efficiency at 3000 RPM, Δ𝜂𝜔 is the efficiency penalty for operating at RPM
higher than 3000, X is the steam vapor content, averaged between the inlet and outlet stage
conditions.
For the 641 MWe NGCC power plant in this work, the HP, IP, and LP sections comprise three,
eleven, and seven thermodynamic stages, respectively.
Final Stage
A model of the final stage is also developed on the basis of the work of Liese (2014). The Stodola
equation is considered to define the pressure ratio to flow rate relationship:
𝐹𝑚 = 𝐶𝑓𝑙𝑜𝑤𝑃𝑖𝑛
√𝑇𝑖𝑛√[1 − (
𝑃𝑜𝑢𝑡
𝑃𝑖𝑛)
2
] (2.20)
Due to the existence of condensation in the last stage, a moisture correction term is included in the
calculations of the end-line end-point enthalpy HELEP and the used-energy end-point enthalpy
HUEEP. Then the efficiency is calculated based on the real enthalpy drop.
𝐻𝐸𝐿𝐸𝑃 = 𝐻𝑖𝑛 + (𝐻𝑖𝑠,𝑜𝑢𝑡 − 𝐻𝑖𝑛)𝜂𝑑𝑟𝑦𝑋(1 − 0.65(1 − 𝑋)) (2.21)
𝐻𝑈𝐸𝐸𝑃 = 𝐻𝐸𝐿𝐸𝑃 + 𝑇𝐸𝐿 ∙ 𝜂𝑑𝑟𝑦𝑋(1 − 0.65(1 − 𝑋)) (2.22)
𝜂𝑖𝑠 =𝐻𝑖𝑛−𝐻𝑈𝐸𝐸𝑃
𝐻𝑖𝑛−𝐻𝑖𝑠,𝑜𝑢𝑡 (2.23)
where ηdry is dry efficiency and assumed to be 87% and TEL is the total exhaust losses from the
exhaust hood.
Methodology for Moisture Detection
The existence of moisture in the last few stages of the LP section significantly affects the ST
efficiency and the actual power production as shown in Equation 2.17. Under low-load operation,
condensation may take place on the stages that are non-condensing under nominal condition.
Therefore, for any stage, simultaneous moisture detection and adaptation of the system of
equations based on the presence or absence of moisture are required.
12
Inlet condition
(P1,T1→S1,H1)
Isentropic enthalpy
drop △His(Ns)
Isentropic outlet S2s=S1, H2s
Pdew,Tdew
SV, SL, HV, HL
0<X<1
S2s, H2s→ P2s, T2s
H2a,P2a→T2a
No, Vapor-Only
Yes,Vapor-Liquid
X2s=X
P2s=Pdew,T2s=Tdew
Isentropic efficiency η(Ns)
Actual outlet H2a, P2a =P2s
X2s=1Condensation detection
Isentropic efficiency η(Ns)
Actual outlet H2a,P2a =P2s,X2a =1
SV, SL, HV, HL
0<X’<1
Condensation detection
No, Vapor-Only
T2a ≠T2s,X2a =1
H2a,P2a→T2a
T2a =T2s,X2a=X’
Yes,Vapor-Liquid
(a)
S1,H1 S2s,H2s T2s,X2s
P1,T1,X1 P2a,T2a,X2a
kis(Ns) Ns (△His)
△His ηisH2a,P2a
S1=S2s
P2s=P2a
P2s
pFlashPH
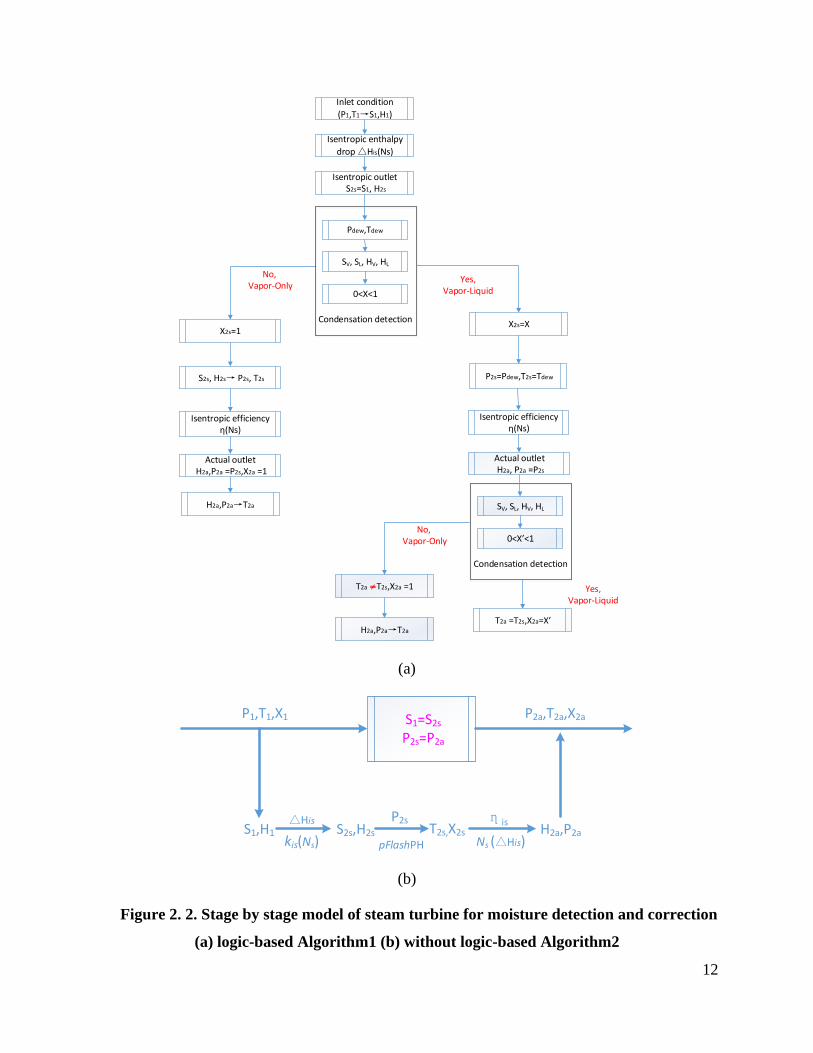
(b)
Figure 2. 2. Stage by stage model of steam turbine for moisture detection and correction
(a) logic-based Algorithm1 (b) without logic-based Algorithm2

13
For each stage, the isentropic enthalpy drop △His is calculated using Equation 2.14. Based on the
inlet condition and isentropic enthalpy drop △His, the corresponding isentropic outlet condition is
determined with the moisture detection. Then the isentropic efficiency is calculated based on the
isentropic outlet condition as shown in Equations 2.16-2.19, and the actual outlet condition is also
determined simultaneously with the moisture detection.
The strategy of moisture detection and model adaptation is implemented by two different
approaches. The first approach is logic-based as shown in Figure 2.2(a). Moisture is detected based
on the dew point calculation. If moisture is present at the outlet of a stage, the steam temperature
is fixed at its saturation temperature for a given pressure and the moisture fraction becomes the
calculated variable. Even though this approach is easy to implement, it leads to a change in the
problem structure due to a change in the variables. So, it may cause difficulties in convergence.
Another approach without the logic-based structure is proposed and shown in Figure2. 2(b) (Sarda
et al., 2018). Since pressure and enthalpy can fully define the system for both the presence and
absence of condensation, they are considered as the calculated variables for the stage-by-stage
model rather than pressure and temperature (non-condensing) or pressure and vapor fraction
(condensing). Then, Aspen Properties calls, which are external function calls, are used to obtain
the vapor fraction and temperature given the pressure and enthalpy. The key advantage of this
approach is that the set of calculated variables remain the same irrespective of moisture formation.
2.2.4 Regulatory and supervisory control layers
While the primary task of the regulatory control layer is plant stabilization, it is also used as the
degrees of freedom (i.e., the set points of the controllers at the regulatory control layer are used as
manipulated variables) by the supervisory control layer during nominal as well as load-following
operation. Therefore, the regulatory control layer plays a critical role in achieving the control
objective of the supervisory layer. The regulatory layer includes several flowrate controllers such
as the BFW flow controllers to HP, IP, and LP drums, makeup flow controller, fuel gas flow
controller, and air flow controller, as well as pressure controllers. In addition, during fast load
transients, liquid inventory control can be challenging especially because of the cascading effect
in the NGCC process. Liquid inventories for the LP, IP and HP drums, deaerator, and surface
condenser hotwell are controlled. Vapor phase inventories are maintained by operating the HP, IP,
and LP steam drums at their respective desired pressures.

14
The supervisory layer is similar to the industry-standard coordinated control system that includes
feedforward-augmented cascaded feedback controllers along with function approximation and
constraints (Sarda et al., 2018). Satisfying the load demand is the primary task of the supervisory
layer with due consideration of other process and operational constraints. It is also essential to
maintain the main steam and reheat steam temperatures at their desired set points during load-
following operation. If these temperatures are lower than their set points, it will lead to an
efficiency loss. On the other hand, if these temperatures are above their set points, equipment
damage can take place. Therefore, these steam temperatures should be maintained at or near their
set points during low-load operation and during transients.
2.3. Results and discussion
2.3.1 Gas turbine
Figure 2. 3. GT thermal efficiency under off-design conditions
Coefficients for Equations 2.4-2.5 are estimated using the data from the work of Jordal et al (2012).
Table 2.1 shows the coefficients and Figure 2.3 shows the resulting fit for the GT thermal
efficiency calculated on the basis of fuel LHV.
Table 2. 1 Estimated coefficients for the dimensionless GT performance curves
Coefficients for the
GT curves a1 a2 a3 b1 b2 b3
Results -0.2108 0.4828 0.7277 -0.4426 0.8875 0.5466

15
The GT efficiency decreases with the load decrease and this results in an increase in the turbine
exhaust temperature (TET) as shown in Figure 2.4(a). In the GT, the air flow rate is controlled by
closing or opening the inlet guide vane (IGV). The IGV helps to manipulate the air/fuel mass flow
rate ratio, so that turbine inlet temperature (TIT) is maintained to achieve a relatively higher GT
efficiency at part load condition (Apan-Ortiz et al., 2018). As shown in Figure 2.4(b), under the
relatively high load conditions (100% to 80% load), the air/fuel ratio remains essentially constant,
but as the load decreases below 80%, the air/fuel ratio increases and leads to a decrease in the TIT.
Figure 2.4(a) shows that at low load the TET increases relatively more slowly as the TIT is
reduced.
(a) (b)
Figure 2. 4. GT temperature and air/fuel mass flow ratio under off-design conditions
(a) TET (b) TIT and air/fuel ratio
2.3.2 Heat recovery steam generator (HRSG)
Results from the thermo-hydraulic model of the HRSG are compared with the work of Franco and
Giannini (2006). They have developed a detailed model of a three-pressure HRSG and have used
it for an optimal design of the HRSG. Since the number of tube passes and circulation ratio (CR)
are not provided in their work, these parameters were estimated to minimize the error in area. Table
2.2 compares the results from Franco and Giannini (2006) with the results obtained using the model
developed in this work.

16
Table 2. 2 HRSG model comparison
Components Heat Duty
(MW)
Estimated
Parameters
Area from
Literature (Zoelle
et al., 2015) (m2)
Area(m2)
│Error│
(%)
ECO LP 26.24 Pass=6 17,893 18,259 2.05
EVA LP 28.39 Pass=1,CR=30 18,454 18,733 1.51
SH LP 1.95 Pass=1 1,789 1,834 2.53
ECO IP 8.59 Pass=1 8,947 9,161 2.39
EVA IP 24.86 Pass=1,CR=20 17,893 18,734 4.70
SH IP 3.16 Pass=1 2,936 3,239 10.32
ECO HP 10.5 Pass=2 5,704 6,010 5.37
EVA HP 26.29 Pass=1, CR=4 14,763 13,816 6.42
SH HP 21.86 Pass=1 20,224 21,924 8.41
Table 2. 3. Operating parameters and the surface area of the three-pressure HRSG
Heating Section Flue Gas
Inlet (K)
Flue Gas
Outlet (K)
Water/Steam
Inlet (K)
Water/Steam
Outlet (K)
Heat Duty
(MW)
Area
(m2)
PRE HTR 1 429.1 376.4 311.3 395.4 57.80 21,895
HTR 2 445.9 429.1 395.4 421.9 18.52 11,234
LP
ECO 446.9 445.9 422.0 428.7 1.10 827
EVA 518.0 446.9 427.6 427.6 79.11 34,983
SH 648.4 551.1 427.6 552.5 10.23 11,052
IP
ECO 549.5 518.7 423.6 534.0 0.68 847
EVA 551.6 549.5 530.3 530.3 2.40 1,765
SH 799.1 725.6 530.3 760.9 0.89 1,170
RH 879.6 799.0 630.3 842.4 61.55 20,100
HP
ECO1 549.5 518.0 425.5 490.4 34.67 7,471
ECO2 648.4 551.6 490.4 633.1 100.26 44,467
EVA 725.4 648.4 632.5 632.5 89.79 29,295
SH1 799.1 725.4 632.5 750.0 86.60 21,104
SH2 879.6 799.3 746.1 841.7 35.59 15,800

17
The thermo-hydraulic model is then used to design the components for the nominal 641 MWe
gross NGCC power plant since the size information is not available in the NETL baseline studies
(Zoelle et al., 2015). Results are shown in Table 2.3. It should be noted that as opposed to many
industrial configurations, this plant has the 2-stage preheater (PRE HTR) before the economizer
resulting in a low duty of the LP economizer (LP ECO) duty. Also, the low IP steam flowrate in
this configuration leads to the low heat duties of the heating sections that are solely used for
generation of the superheated IP steam (Zoelle et al., 2015).
2.3.3 Steam turbine
The ST models using different algorithms for moisture detection and model adaptation are
implemented under load-following operation described in Chapter 3. Both algorithms give the
same solutions for all the load-following studies conducted in APD. Performances of
Configuration 1 and 3 are for the coordinated control system, and those of Configuration 2, 4 and
5 are for dynamic optimization. Computational times of different ST algorithms are presented in
Table 2.4.
It shows that the logic-based Algorithm1 is solved in lesser time. The possible reason is that the
external Aspen Property call in Algorithm2 takes a longer time to calculate the vapor fraction and
temperature given the pressure and enthalpy. While Algorithm 1 could converge all cases
considered here, authors believe that Algorithm 2 has better convergence properties especially
when there are rapid occurrences of moisture appearing/vanishing in some LP stages.
Table 2. 4. Computational times of different ST algorithms for load-following operation
Configuration No. 1 2 3 4 5
Algorithm1 4 min 57 s 5 min 32s 7 min 28s 6 min 10s 13 min 6s
Algorithm2 7 min 13 s 7 min 6s 11 min 32s 8 min 39s 21 min 32s
2.3.4 Dynamic model at full load
The steady-state results from the Aspen Plus Dynamics model at full load are compared with the
NETL baseline Case B31A (Zoelle et al., 2015) in Table 2.5. The great agreement is shown here.

18
Table 2. 5. Comparison between the model results and NETL baseline Case B31A
NETL Baseline Case
B31A (Zoelle et al., 2015)
Model
Results
|Error|
(%)
HP SH
Outlet
Mass flow(kg/hr) 439,079.23 440,400.22 0.30
Temperature(K) 838.71 838.71 -
Pressure(bar) 166.51 166.70 0.12
IP RH
Outlet
Mass flow(kg/hr) 444,504.65 446,037.91 0.34
Temperature(K) 838.71 838.71 -
Pressure(bar) 41.92 41.52 0.96
LP SH
Outlet
Mass flow(kg/hr) 137,131.41 136,123.20 0.74
Temperature(K) 553.71 552.51 0.22
Pressure(bar) 5.10 5.10 -
Power
Generation
ST Power (MWe) 219 218.61 0.18
GT Power (MWe) 422 422.39 0.09
Total Power (MWe) 641 641 0.00
2.4. Conclusion
For an NGCC plant, while there are various designs of the boiler for the desired heat duty at the
nominal condition, the dynamics of the boiler would be very different. In this study, the boiler is
optimally designed based on the NETL baseline Case B31A (Zoelle et al., 2015). Then a plant-
wide dynamic model of the NGCC plant is developed with detailed equipment level sub-models
to capture the plant load-following behavior.
A model of the gas turbine (GT) is developed for estimating its performance under off-design
conditions. A thermo-hydraulic model is used for the optimal design of heating sections in the heat
recovery steam generator (HRSG). A model of the steam turbine (ST) is developed with moisture
detection and correction capability. It was observed that the steady-state results from the dynamic
model at full load shows a great agreement with the NETL baseline Case B31A (Zoelle et al.,
2015). Also, the off-design behavior of NGCC plant can be simulated using the dynamic model.

19
Chapter 3. Novel configurations of NGCC plant for load-following
3.1. Literature Review
Under the load-following operation of power plants, the main steam temperature to the ST is tightly
controlled (Sarda et al., 2018). A lower main steam temperature not only results in lower plant
efficiency but can also lead to undesired moisture formation in intermediate ST stages where steam
condensation is not expected and/or higher amount of moisture formation in last stage or last few
stages than what those stages are designed for. Larger number of water droplets can cause
considerable damage to the turbine blades. If the steam temperature is higher than the design, then
severe damage of the ST blades can occur (JianPing et al., 2003). Therefore, a tight control of the
main steam temperature is desired.
At low-load operation, the temperature of the exhaust gas from the GT increases as the GT
efficiency decreases. In addition, the steam flowrate generated from the evaporator (EVA)
decreases. These two effects can lead to a higher final steam and reheat steam temperature
exceeding the maximum design steam temperature to the ST. Typically, the final/reheat steam
temperature is controlled by an attemperator, which is a device where boiler feedwater (BFW) is
sprayed to the steam to reduce its temperature. For single-stage superheater/reheater, attemperation
is provided before the inlet of the superheater/reheater. For designs with two or more stages of
superheaters/reheaters, additional attemperation is provided before the inlet of the intermediate
stage(s).
In order to maintain the steam temperature at its design value at the outlet of the final high-pressure
superheater (HP SH2)/reheater (RH) under off-design conditions, excessive spray may be required
at one or more attemperators (Liese and Zitney, 2018), leading to a two-phase flow through the
superheater/reheater typically denoted in the utility industry as ‘spraying to saturation’ (Moelling
et al., 2015; Sorge et al., 2017). Since superheater and reheater are not typically designed for two-
phase flow, free water, if present, can flow as a slug along with the steam at a high velocity. This
free water can hit the pipe wall, especially when it changes direction, creating a loud hammering
noise as well as large stress on the pipe. This phenomenon is called ‘water hammer’, which can
lead to considerable damage in tubes eventually leading to failure of tubes.

20
To the best of our knowledge, there has been no study on this issue in the open literature using a
mathematical model especially for mitigating this undesired phenomenon. A mathematical model
can be helpful in understanding the operating conditions that lead to this undesired problem and in
studying the impact of various configurations and control strategies to avoid this issue.
In this chapter, several novel configurations are proposed for controlling the main steam and reheat
steam temperatures while avoiding ‘spraying to saturation’ during fast load-following by
considering different final high-pressure superheater (HP SH2)/ reheater (RH) arrangements (in
series or in parallel) and attemperation strategies (single-stage, two-stage, and damper-assisted
attemperation). Load-following operation is studied under two operational strategies- the industry-
standard coordinated control strategy and dynamic optimization. Dynamic optimization is used to
maximize the plant efficiency while satisfying the operational constraints and state transition
constraints. It was observed that while more than one configuration can avoid spraying to
saturation and maintain the steam temperatures within their limits even during very fast load
transients, their efficiency can greatly vary and that dynamic optimization, when feasible, can lead
to superior efficiency than the coordinated control system. (Wang et al., 2020).
3.2. NGCC configurations and control strategies for load-following operation
As shown in Figure 2.1, the final superheater (HP SH2) and reheaeter (RH) are located at the front
end of the HRSG. Actually, they can be arranged in series or in parallel.
Under the steady-state operation at the nominal condition, these two arrangements would show no
difference in the power generation if the HP SH2 and RH are appropriately designed such that
their respective heat duties would remain the same irrespective of their arrangement. However,
their required surface area would vary due to the differences in the flue gas side conditions. In a
series structure, since the RH is located behind the HP SH2, it has much larger surface area because
of the lower inlet temperature of the flue gas. As a result, their respective volumes also change
depending on the arrangement. Therefore, these two arrangements show considerable differences
in their heat duties and temperature transients under load-following operation especially under part
load operations.
Five configurations are proposed in this work. In addition to details of each of the configuration,
this section also provides details of the coordinated control system specific to each configuration.
It should be noted that the coordinated control system implemented in the power plants is very

21
involved and can vary considerably from plant to plant. In this work, since the focus is on steam
temperature control with constraints on dew point, only the coordinated control system that is
specific to the steam temperature control corresponding to each of the configurations considered
here will be discussed. Therefore, any reference to ‘coordinated control’ in the subsequent text
would denote only the supervisory control layer specific to steam temperature control (i.e. in the
subsequent text the term ‘coordinated control’ does not include other supervisory/regulatory
controllers discussed in Section 2.2.4).
3.2.1 Configuration 1
Configuration 1, shown in Figure 3.1, is a series configuration with single-stage attemperation.
The flue gas first goes through the HP SH2 followed by the RH. For single-stage attemperation,
only one attemperator each located at the inlet of the HP SH2 and RH is used. Here as part of the
coordinated control, a cascaded control system is considered where two PID controllers are used
for the main and reheat steam temperature control. These controllers manipulate the set points of
respective attemperator spray flow controllers.
Steam from HP SH1
HP SH2
SH ATT
HP BFW Injection
Main Steam to HP ST
Steam from HP ST and IP SH
RH RH ATT
IP BFW Injection
Reheat Steam to IP ST
Flue Gas from GT
Flue Gas to HP SH1/IP SH
Figure 3. 1. Series configuration with single-stage attemperation
3.2.2 Configuration 2
In Configuration 2, the final superheater is divided into two sections HP SH2 (A) and HP SH2 (B)
with an additional attemperation between the sections as shown in Figure 3.2. In this configuration,

22
the ratio of the sizes of divided sections of HP SH2 is an additional degree of freedom while
keeping the total surface area of HP SH2 the same as Configuration 1.
During load-following operation, the two-stage attemperation provides additional flexibility in
maintaining the steam temperature. Here, as part of the coordinated control, a cascaded control
system is considered to control the main steam temperature where a PID controller manipulates
the set point of the spray flow controller for the second attemperator (SH ATT2) that is located
immediately before HP SH2 (B). Another cascaded PID controller manipulates the set point of
the spray flow controller for the first attemperator (SH ATT1) that is located immediately before
HP SH2 (A) to ensure that the opening of the spray flow control valve for SH ATT2 remains in
the desired range. This strategy is widely used in the industry as part of the coordinated control
system for similar configuration (Sarda et al., 2018). For the reheat steam temperature control,
another cascaded control system is considered where a PID controller manipulates the setpoint of
the spray flow controller for the reheat attemperator.
HP SH2 (A)
SH ATT1
Steam from HP SH1
HP SH2 (B)
HP BFW Injection 1
SH ATT2
HP BFW Injection 2
Main Steam to HP ST
HP SH2
Steam from HP ST and IP SH
RH
RH ATT
IP BFW Injection
Reheat Steam to IP ST
Flue Gas from GT
Flue Gas to HP SH1/IP SH
Figure 3. 2. Series configuration with two-stage attemperation for HP SH2 and one-
stage attemperation for RH
Since the RH is located downstream of the HP SH2 in the flue gas path, HP ATT1 does not only
assist SH ATT2 to maintain the main steam temperature but can affect the reheat attemperator (RH
ATT) that is located immediately before the RH for reheat steam temperature control. If the RH
ATT spray flowrate at part-load condition is low, the higher steam temperature profile leads to

23
lower heat exchange in the RH and a higher temperature of flue gas feeding to the downstream HP
EVA for HP steam generation, which leads to a higher thermal efficiency. Therefore, the SH ATT1
spray flowrate can be optimized to maximize the thermal efficiency while both main steam and
reheat temperature are maintained with acceptable deviation from their respective setpoints. Since
the conventional coordinated control may not be adequate to maximize thermal efficiency while
achieving steam temperature control, dynamic optimization can exploit this opportunity as
discussed later.
3.2.3 Configuration 3
Configuration 3 is a parallel configuration with single-stage attemperation for both superheater
and reheater. In this configuration, the RH is located in parallel with the HP SH2 at the front end
of the HRSG. For single-stage attemperation, only one attemperator is used and located at the inlet
of each heating section as shown in Figure 3.3. The split flue gas flow through each section cannot
be manipulated during load-following operation and therefore depends on the nominal design and
pressure drop through each section. For this configuration, the coordinated control system is
similar to Configuration 1.
Steam from HP SH1
HP SH2
SH ATT
HP BFW Injection
Main Steam to HP ST
Steam from HP ST and IP SH
RH
RH ATT
IP BFW Injection
Reheat Steam to IP ST
Flue Gas to HP SH1/IP SH
Flue Gas from GT
Figure 3. 3. Parallel configuration with single-stage attemperation
3.2.4 Configuration 4
In Configuration 4, both the HP SH2 and RH are divided into two sections with two-stage
attemperation as shown in Figure 3.4. The ratios of the sizes of divided sections of the HP SH2

24
and RH are additional degrees of freedom while keeping their respective total surface areas the
same as Configuration 3.
Here, the coordinated control system for both main and reheat steam temperature control is similar
to that for the main steam temperature control in Configuration 2, i.e. the second attemperator (SH
ATT2 or RH ATT2) spray flowrate is used to control the steam temperature whereas the first
attemperator (SH ATT1 or RH ATT1) spray flowrate is manipulated to ensure that the opening of
the spray flow control valve for the second attemperator remains in the desired range.
Similar to Configuration 2, HP ATT1 and RH ATT1 do not only assist ATT2 to maintain the main
/reheat steam temperature but can affect the steam flowrate generated at each pressure level and
consequently affect the thermal efficiency. If the ATT1 spray flowrate at part-load condition is
low, more exhaust heat is recovered in the HP EVA for HP steam generation, and it leads to a
higher thermal efficiency. However, one possible issue is that not enough IP steam can be produced
due to less heat available for the IP EVA, which results in a dry IP steam circuit.
Therefore, the ATT1 spray flowrate to both the SH and RH sections can be optimized to maximize
the thermal efficiency while ensuring that steam flowrate at each pressure level remains higher
than the lower bound (10% of the nominal condition).
HP SH2 (A)
SH ATT1
Steam from HP SH1
HP SH2 (B)
HP BFW Injection 1
SH ATT2
HP BFW Injection 2
Main Steam to HP ST
HP SH2
RH (A)
RH ATT1
Steam from HP ST and IP SH
RH (B)
IP BFW Injection 1
RH ATT2
IP BFW Injection 2
Reheat Steam to IP ST
RH
Flue Gas from GT
Flue Gas to HP SH1/IP SH
Figure 3. 4. Parallel configuration with two-stage attemperation
3.2.5 Configuration 5
Configuration 5, as shown in Figure 3.5, also considers the HP SH2 and RH are arranged in parallel
but the flue gas split between them can be adjusted by a damper. Here as part of the coordinated

25
control, a split-range control strategy is considered for the RH temperature control. During the
load-following operation, the reheat steam temperature is first controlled by manipulating the
opening of the damper that regulates the flue gas flowrate to the RH. When the opening of the
damper reaches its limit, the split-range controller manipulates the RH ATT spray like
Configuration 3. Due to the damper, less flue gas flowrate goes through the RH and almost no
spray is required for reheat steam temperature control even at low load. Thus, a two-stage
attemperation does not help to improve the efficiency as there is no more degrees of freedom.
Therefore, only one stage attemperation for the RH is considered. Since a two-stage attemperation
is considered for the HP SH2, the coordinated control system for the main steam temperature
control is similar to Configuration 4. Also, the SH ATT1 spray flowrate can be optimized to
maximize the thermal efficiency while satisfying the constraints of the steam temperature and dew
point, and that the steam flowrate at each pressure level remains higher than the lower bound.
HP SH2 (A)
SH ATT1
Steam from HP SH1
HP SH2 (B)
HP BFW Injection 1
SH ATT2
HP BFW Injection 2
Main Steam to HP ST
HP SH2
Steam from HP ST and IP SH RH
RH ATT
IP BFW Injection
Reheat Steam to IP ST
Flue Gas from GT
Flue Gas to HP SH1/IP SH Damper
Figure 3. 5. Parallel configuration including damper control with two-stage
attemperation for HP SH2 and one-stage attemperation for RH
3.3. Dynamic Optimization
The dynamic models for different configurations can be used to implement the load-following
operation. For the specific configuration, it was observed that there are several degrees of freedom
that can be used for maximizing the thermal efficiency under off-design conditions while satisfying
the constraints of maintaining the main/reheat steam temperature without reaching saturation

26
downstream of any of the attemperators while maintaining the flowrate of steam generated at each
pressure level above the lower bound.
The dynamic optimization problem is shown in Equation 3.1. It should be noted that here dynamic
optimization is used only for optimal operation and therefore design parameters are not included.
Two bound constraints are considered to ensure that the main/reheat steam temperature is
maintained with certain bounds. Two inequalities are considered to ensure that the steam
temperature remains above the corresponding dew point at the inlet of the respective SH/RH stage.
In the dynamic optimization problem, only the coordinated control layer (in the sense as discussed
in the beginning of Section 3.2) is removed and the setpoints of respective attemperator spray flow
controllers and the damper opening (only for Configuration 5) are considered as the decision
variables. Neither other supervisory/regulatory controllers discussed in Section 2.2.4 nor the
attemperator spray flow controllers are removed. While one might remove all controllers in the
dynamic optimization and consider the manipulated variables as the decision variables, that
approach is not pursued here since the focus of the paper is on steam temperature control and the
proposed approach makes solution of the dynamic optimization problem computationally tractable
in APD.
max𝑢
𝜂𝑡ℎ =𝑝𝑜𝑤𝑒𝑟 𝑜𝑢𝑡𝑝𝑢𝑡
𝐹𝑚,𝑁𝐺 × 𝐿𝐻𝑉
𝑠. 𝑡. 𝑓(𝑥, 𝑦, 𝑢) ≤ 0 𝑥, 𝑦, 𝑢 ∈ 𝑅𝑛
𝑇𝑠𝑝,𝑀𝑆 −△ 𝑇𝑀𝑆 ≤ 𝑇𝑀𝑆 ≤ 𝑇𝑠𝑝,𝑀𝑆 +△ 𝑇𝑀𝑆
𝑇𝑠𝑝,𝑅𝑆 −△ 𝑇𝑅𝑆 ≤ 𝑇𝑅𝑆 ≤ 𝑇𝑠𝑝,𝑅𝑆 +△ 𝑇𝑅𝑆
𝑇𝑆𝐻,𝑖 ≥ 𝑇𝑑𝑒𝑤,𝑆𝐻,𝑖 +△ 𝑇𝑑𝑒𝑤,𝑆𝐻
𝑇𝑅𝐻,𝑖 ≥ 𝑇𝑑𝑒𝑤,𝑅𝐻,𝑖 +△ 𝑇𝑑𝑒𝑤,𝑅𝐻
𝐹𝑚𝑗≥ 𝐹𝑚𝑙𝑜𝑤𝑒𝑟,𝑗 (3.1)
where ηth is the thermal efficiency of power plant, defined as the ratio of the power output over the
product of natural gas mass flowrate Fm,NG and its lower heating value LHV. f(x,y,u)≤0 denote the
process model equalities and inequalities where x, y, and u denote state/algebraic variables, output
and decision variables, respectively. T is the steam temperature, △T is the allowable temperature
deviation /difference, and Fm is the steam flow rate. The subscripts ‘sp’, ‘dew’, and ‘lower’ denote
setpoint, dew point and lower bound, respectively; ‘MS’ and ‘RS’ represent main steam and reheat
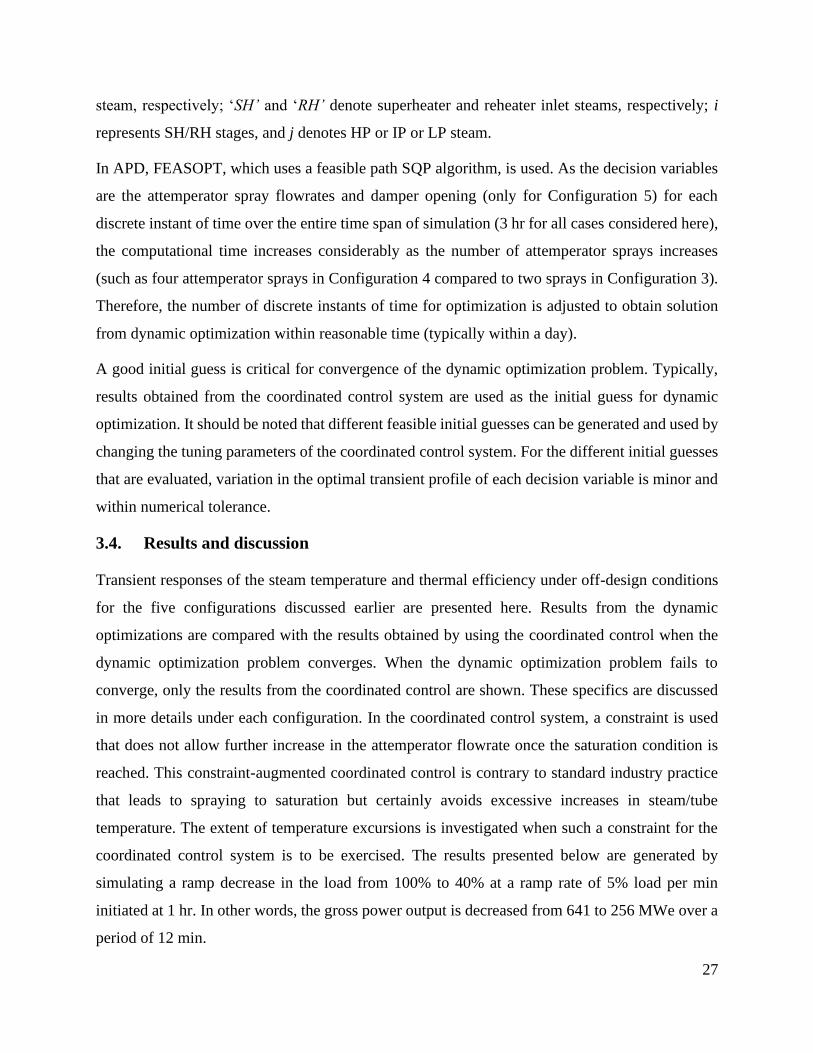
27
steam, respectively; ‘SH’ and ‘RH’ denote superheater and reheater inlet steams, respectively; i
represents SH/RH stages, and j denotes HP or IP or LP steam.
In APD, FEASOPT, which uses a feasible path SQP algorithm, is used. As the decision variables
are the attemperator spray flowrates and damper opening (only for Configuration 5) for each
discrete instant of time over the entire time span of simulation (3 hr for all cases considered here),
the computational time increases considerably as the number of attemperator sprays increases
(such as four attemperator sprays in Configuration 4 compared to two sprays in Configuration 3).
Therefore, the number of discrete instants of time for optimization is adjusted to obtain solution
from dynamic optimization within reasonable time (typically within a day).
A good initial guess is critical for convergence of the dynamic optimization problem. Typically,
results obtained from the coordinated control system are used as the initial guess for dynamic
optimization. It should be noted that different feasible initial guesses can be generated and used by
changing the tuning parameters of the coordinated control system. For the different initial guesses
that are evaluated, variation in the optimal transient profile of each decision variable is minor and
within numerical tolerance.
3.4. Results and discussion
Transient responses of the steam temperature and thermal efficiency under off-design conditions
for the five configurations discussed earlier are presented here. Results from the dynamic
optimizations are compared with the results obtained by using the coordinated control when the
dynamic optimization problem converges. When the dynamic optimization problem fails to
converge, only the results from the coordinated control are shown. These specifics are discussed
in more details under each configuration. In the coordinated control system, a constraint is used
that does not allow further increase in the attemperator flowrate once the saturation condition is
reached. This constraint-augmented coordinated control is contrary to standard industry practice
that leads to spraying to saturation but certainly avoids excessive increases in steam/tube
temperature. The extent of temperature excursions is investigated when such a constraint for the
coordinated control system is to be exercised. The results presented below are generated by
simulating a ramp decrease in the load from 100% to 40% at a ramp rate of 5% load per min
initiated at 1 hr. In other words, the gross power output is decreased from 641 to 256 MWe over a
period of 12 min.
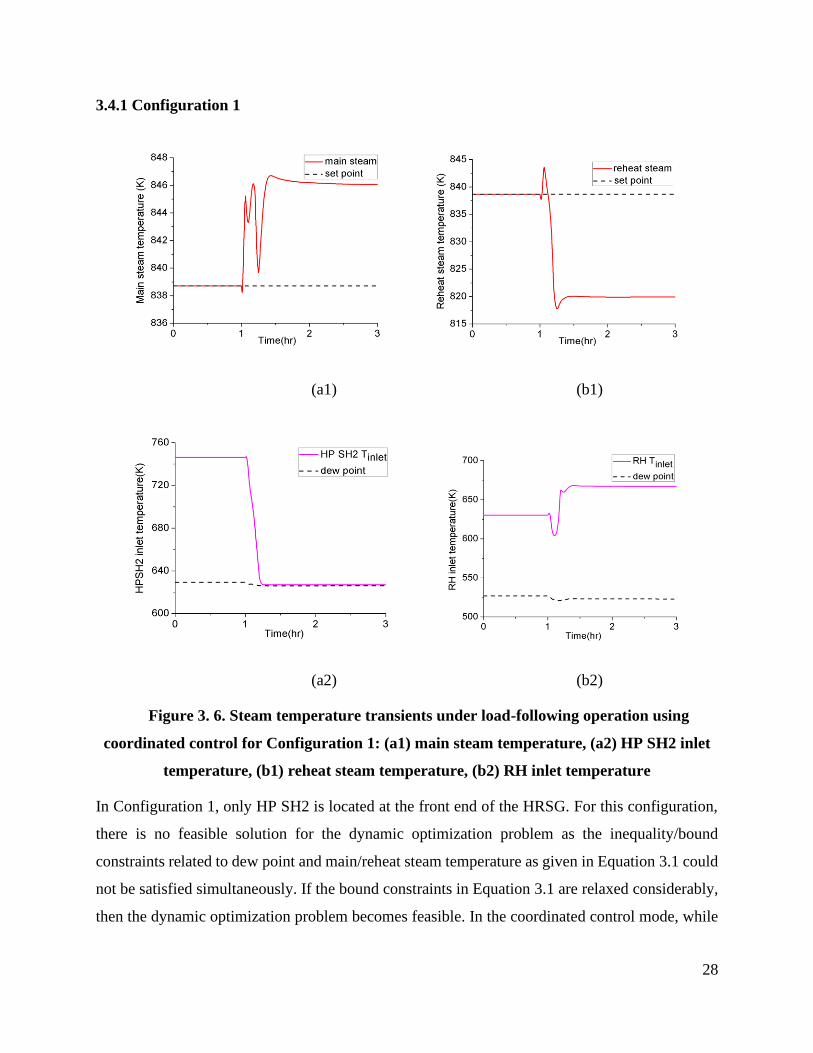
28
3.4.1 Configuration 1
(a1) (b1)
(a2) (b2)
Figure 3. 6. Steam temperature transients under load-following operation using
coordinated control for Configuration 1: (a1) main steam temperature, (a2) HP SH2 inlet
temperature, (b1) reheat steam temperature, (b2) RH inlet temperature
In Configuration 1, only HP SH2 is located at the front end of the HRSG. For this configuration,
there is no feasible solution for the dynamic optimization problem as the inequality/bound
constraints related to dew point and main/reheat steam temperature as given in Equation 3.1 could
not be satisfied simultaneously. If the bound constraints in Equation 3.1 are relaxed considerably,
then the dynamic optimization problem becomes feasible. In the coordinated control mode, while

29
there are dew point constraints, there is no constraint on main/reheat steam temperature. Therefore,
results could be generated when coordinated control is used. These results are presented below.
With the higher GT exhaust temperature and lower steam flowrate, the main steam temperature
first rises as load decreases as shown in Figure 3.6 (a1). When more feedwater is sprayed into the
HP SH2 attemperator, the temperature starts decreasing. Eventually, the SH steam inlet
temperature reaches its saturation condition as seen in Figure 3.6 (a2). As the spray water is not
increased any further, the main steam temperature rises again and an excursion (about 7 K) from
its desired setpoint is shown in Figure 3.6 (a1).
On the other hand, the reheat steam temperature first rises then decreases below the setpoint as
shown in Figure 3.6 (b1). Therefore, spray water to the RH attemperator is completely stopped by
the corresponding temperature controller. This results in an increase in the RH steam inlet
temperature that is much above the corresponding dew point as shown in Figure 3.6 (b2). In this
configuration, the reheat steam cannot be heated to the desired temperature. That is because as
high attemperator spray is used at the HP SH2 attemperator for the main steam temperature control,
the steam inlet temperature to HP SH2 becomes lower by more than 115 K compared to the
nominal value as shown in Figure 3.6 (a2). The overall higher driving force results in higher heat
exchange in HP SH2. Therefore, the temperature of flue gas from HP SH2 to RH becomes much
lower than its nominal value resulting in a reheat steam temperature that is about 20 K lower than
the desired value.
The deviation in the main/reheat steam temperature using the coordinated control provides
valuable insight into the infeasibility of the dynamic optimization problem for this configuration.
The results show that when the dew point constraint on the main steam temperature is reached, HP
SH2 attemperator flowrate cannot be increased any further (i.e. HP SH2 attemperator flowrate
reaches its upper limit) thus losing a degree of freedom in the dynamic optimization problem. In
addition, as noted above, even when the RH attemperator spray is completely stopped, RH
temperature is considerably lower than its set point. Thus, for the dynamic optimization problem,
the RH attemperator spray flow would reach its lower limit thus losing a degree of freedom. Since
both decision variables hit their upper/lower limits, steam temperature constraints could not be
satisfied.

30
3.4.2 Configuration 2
For this configuration, solution of the dynamic optimization problem is feasible, so results from
dynamic optimization are compared with the results from coordinated control system (CCS).
Figure 3.7 (a) shows that higher thermal efficiency could be obtained by using dynamic
optimization compared to the coordinated control system. Figure 3.7 (b) shows that more spray at
SH ATT1 is used under dynamic optimization. That leads to less spray at RH ATT for reheat steam
temperature control, and the RH ATT spray reaches its lower limit at part-load condition. Less
spray results in a higher steam inlet temperature and lower driving force for heat exchange in RH.
Therefore, more exhaust heat is recovered in HP EVA for HP steam generation leading to more
power generation and higher efficiency.
Steam temperature transients for Configuration 2 under dynamic optimization are shown in Figure
3.8. Figures 3.8 (a1) and 3.8 (b1) show that during load-following operation, both main steam and
reheat steam temperatures can be maintained at their respective set points with a small deviation.
Furthermore, Figures 3.8 (a2) and 3.8 (b2) show that a saturation condition is neither reached at
the inlet of HP SH2 nor at the inlet of RH.
(a) (b)
Figure 3. 7. Comparison between coordinated control and dynamic optimization for
Configuration 2 (a) thermal efficiency (b) spray flow at the SH ATT1 and RH ATT

31
(a1) (b1)
(a2) (b2)
Figure 3. 8. Steam temperature transients under load-following operation for
Configuration 2: (a1) main steam temperature, (a2) HP SH2 inlet temperature, (b1) reheat
steam temperature, (b2) RH inlet temperature
The results of dynamic optimization for Configuration 2 shown in Figure 3.8 are obtained with the
HP SH 2 (A) accounting for 50% of the total area.
Since the HP SH2 has two sections in Configuration 2, a sensitivity study is conducted to evaluate
the impact of the area ratio of the two sections. Obviously at full load, the change in the ratio is
not expected to show any difference in thermal efficiency or the steam temperature control
performance. At part load, the RH ATT spray is at its lower limit under dynamic optimization.

32
Only the SH ATT1 and SH ATT2 are activated for the steam temperature control. Table 3.1 shows
the key operating conditions and performance measures at 40% load for Configuration 2. It was
observed that there is practically no difference regardless of the area ratio. While a larger HP SH2
(A) requires the less spray at SH ATT2 for main steam temperature control, more spray is used at
SH ATT1. The total spray flowrate practically does not change. Consequently, the total heat duty
of HP SH2 and RH and power generation do not get affected as the ratio is changed. To avoid
carryover of free water to the turbine, there will be an upper limit of HP SH2 (A) to ensure that
there is sufficient residence time. Determination of this maximum limit will need to consider the
mass transfer rate with due consideration of the actual layout and configuration of the HP SH2 (B).
Since such a kinetic model is not considered here, the upper limit of HP SH2 (A) is specified to be
90% of the total area. The lower limiting of HP SH2 (A) is 30% of the total area, at which a zero
spray flowrate at SH ATT1 is reached. If the HP SH2 (A) area is less than the lower bound, the
reheat steam temperature would be lower than the setpoint even if there is no spray at RH ATT.
Table 3. 1. Key operating conditions and performance measures for variation in HP
SH2 area ratio at 40% load for Configuration 2
Area Ratio of HP SH2(A) to total area 50% 70% 90%
HPSH2 section
Spray at ATT1 (kg/hr) 22,870 39,824 50,452
Spray at ATT2 (kg/hr) 39,144 22,175 11,538
Total Spray (kg/hr) 62,014 61,999 61,990
Total duty (MW) 62.59 62.59 62.60
RH section Total duty (MW) 34.44 34.44 34.44
Power generation
GT (MWe) 135.94 135.94 135.94
ST(MWe) 120.06 120.06 120.06
Total (MWe) 256 256 256
Efficiency (%) 49.44 49.44 49.44
3.4.3 Configuration 3
Similar to Configuration1, convergence of the dynamic optimization problem is infeasible for
Configuration 3. Therefore, only results obtained using the coordinated control system is
presented.
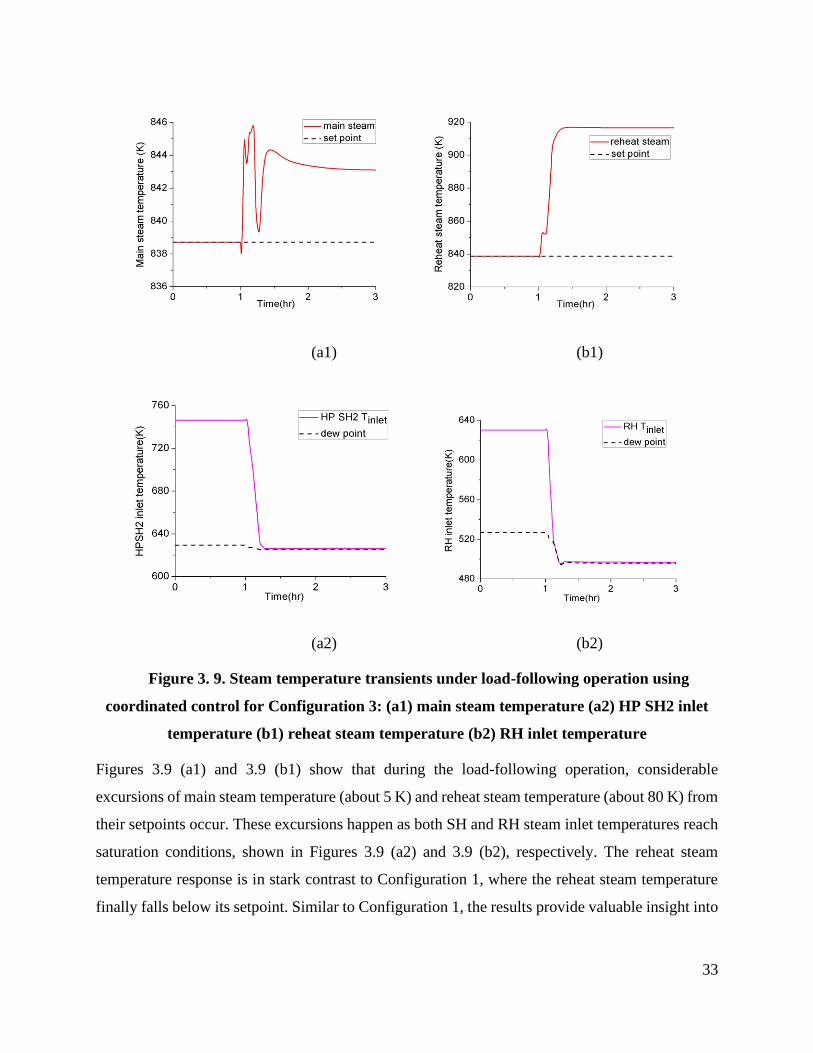
33
(a1) (b1)
(a2) (b2)
Figure 3. 9. Steam temperature transients under load-following operation using
coordinated control for Configuration 3: (a1) main steam temperature (a2) HP SH2 inlet
temperature (b1) reheat steam temperature (b2) RH inlet temperature
Figures 3.9 (a1) and 3.9 (b1) show that during the load-following operation, considerable
excursions of main steam temperature (about 5 K) and reheat steam temperature (about 80 K) from
their setpoints occur. These excursions happen as both SH and RH steam inlet temperatures reach
saturation conditions, shown in Figures 3.9 (a2) and 3.9 (b2), respectively. The reheat steam
temperature response is in stark contrast to Configuration 1, where the reheat steam temperature
finally falls below its setpoint. Similar to Configuration 1, the results provide valuable insight into

34
the infeasibility of dynamic optimization problem. The results show that when the dew point
constraints are satisfied, satisfying the constraints on main/reheat steam temperature is infeasible.
3.4.4 Configuration 4
(a) (b)
(c) (d)
Figure 3. 10. Comparison between coordinated control and dynamic optimization for
Configuration 4 (a) thermal efficiency (b) spray flow at ATT1 (c) HP steam flow (d) IP
steam flow
Similar to Configuration 2, solution of the dynamic optimization problem is feasible for
Configuration 4, so results from dynamic optimization are compared with the results from
coordinated control.

35
As we can see from Figure 3.10 (a-c), thermal efficiency is higher for dynamic optimization. That
is because less spray at ATT1 leads to more HP steam generation in the HP EVA and therefore
results in higher thermal efficiency. On the other hand, Figure 3.10 (d) indicates that the IP steam
flow would decrease as more exhaust heat is absorbed by the HP flow. This study shows that
during the load transient, a low limit on the spray flowrate at the HP ATT1 is required to keep the
IP steam flow higher than the lower bound.
(a1) (b1)
(a2) (b2)
Figure 3. 11. Steam temperature transients under load-following operation for
Configuration 4: (a1) Main steam temperature (a2) HP SH2 inlet temperature (b1) Reheat
steam temperature (b2) RH inlet temperature

36
The steam temperature transient performance for Configuration 4 under dynamic optimization is
shown in Figure 3.11. Both main steam and reheat steam temperature are maintained with a small
deviation. In addition, saturation condition can be avoided at the inlets. Since only a lower spray
flowrate is used at the ATT1, the inlet temperature of Section A rises during the transient.
The results of dynamic optimization for Configuration 4 shown above are obtained with Section
A accounting for 90% of the total area.
Similar to Configuration 2, a sensitivity study is done to understand the impact of the area ratio on
the efficiency. At part load, the ATT1 spray is at its lower limit under dynamic optimization. Only
the SH ATT2 and RH ATT2 are activated for the steam temperature control. Table 3.2 shows the
key operating conditions and performance measures at 40% load for Configuration 4. Opposed to
Configuration 2, it can be observed that the area ratio does affect the efficiency with the highest
efficiency being obtained when the Section A area ratio is the highest.
Table 3. 2. Key operating conditions and performance measures for variation in HP
SH2 and RH area ratio at 40% load for Configuration 4
Area Ratio of HPSH2(A) and RH(A) 50% 70% 90%
HPSH2 section Total duty (MW) 43.51 32.23 24.34
Total Spray (kg/hr) 34,396 24,770 19,235
RH section Total duty (MW) 74.64 59.49 50.22
Total Spray (kg/hr) 60,146 37,203 22862
Power generation
GT (MWe) 140.62 137.49 135.73
ST(MWe) 115.38 118.51 120.27
Total (MWe) 256 256 256
Efficiency (%) 48.46 49.11 49.48
It can be observed that the larger section A of HP SH2/RH requires less spray for main/reheat
steam temperature control and less heat is transferred in HP SH2 or RH as seen in Table 3.2, which
in turn improves the thermal efficiency by generating more steam in the steam cycle for power
production. Thus, a larger Section A leads to higher efficiency. The upper bound on Section A

37
area is assumed to be 90% of the total area to avoid free water carryover into the turbine. The lower
bound on Section A area is around 45% of the total area.
3.4.5 Configuration 5
For brevity, only the results from dynamic optimization are shown here. During the load following
operation, a minimum spray flowrate at the SH ATT1 is required to maintain the IP steam flow
above the lower bound as shown in Figure 3.12.
(a) (b)
Figure 3. 12. Dynamic optimization for Configuration 5 (a) spray flow at SH ATT1 (b)
IP steam flow
Figure 3.13 shows that both main steam and reheat steam temperature could be maintained with
small deviation. Furthermore, the saturation can be avoided at the inlets.
Similar to Configuration 4, larger Section A improves the thermal efficiency. Therefore, section
A of HP SH2 area is set to 90% of the total area for all studies presented here for Configuration 5.

38
(a1) (b1)
(a2) (b2)
Figure 3. 13. Steam temperature transients under load-following operation for
Configuration 5 (a1) main steam temperature, (a2) HP SH2 inlet temperature, (b1) reheat
steam temperature, (b2) RH inlet temperature
3.4.6 Thermal efficiency analysis
As discussed above, Configuration 1 and Configuration 3 with single-stage attemperation cannot
maintain the steam temperature as the load decreases without spraying to saturation. Therefore,
solution of the dynamic optimization is infeasible for those configurations. In the discussion and
results presented in this section, thermal efficiency presented for Configuration 1 and 3 is for
operation under the coordinated control system while thermal efficiency presented for

39
Configuration 2, 4, and 5 is what is obtained using the dynamic optimization problem. Table 3.3
shows that while Configuration 2, 4, and 5 each can satisfy the dew point and steam temperature
constraints, their efficiencies are different.
Table 3. 3. Summary of different configurations for load-following operation
Configuration No. 1 2 3 4 5
HP SH2/RH Structure In series In series In parallel In parallel In parallel
Attemperation 1-stage 2-stage 1-stage 2-stage 2-stage/damper
Constraints violation Yes No Yes No No
Thermal efficiency at 40% load (%) 49.39 49.44 48.52 49.48 49.73
As shown in Figure 3.14 (a), the plant efficiency decreases with the decrease in the load for all
three feasible configurations. Configuration 5 provides the highest efficiency. The thermal
efficiency transients show an undershoot during the load transient. Figure 3.14 (b) shows the power
transients for all three configurations could track the load setpoint very well, where the fast
response of the GT plays a key role.
(a) (b)
Figure 3. 14. Load-following operation of NGCC plant (a) thermal efficiency (b) power
output
Table 3.4 shows that in Configuration 5, the least spray is used and the least exhaust heat is
recovered by HP SH2 and RH. Consequently, higher amount of main steam is generated resulting

40
in higher ST power and lower GT power compared to Configuration 2 and 4. Obviously, the lowest
amount of natural gas is consumed in Configuration 5 leading to the highest efficiency.
Configuration 2 and 4 show similar efficiencies even though more main steam is generated in
Configuration 2. That is because main steam is the sum of the HP steam generated in HP EVA and
the attemperator spray flow to the HP SH2. More main steam is generated in Configuration 2 due
to the higher attemperator spray at the HP SH2 albeit at the expense of higher amount of natural
gas firing.
Table 3. 4. Performances of different configurations at 40% load
Configuration No. 2 4 5
RH section Total Duty (MW) 34.44 50.22 35.43
Total Spray (kg/hr) 0 22,862 0
HP SH2
section
Total Duty (MW) 62.59 24.34 31.63
Total Spray (kg/hr) 62,014 19,235 30,985
Operating
variables
Ratio of RH flue gas 1 (In sequence) 0.60 0.21
HP steam (kg/hr) 208,514 241,632 252,227
Main steam (kg/hr) 270,528 260,867 283,212
Natural gas (kg/hr) 39,407 39,376 39,177
Power
generation
GT (MWe) 135.94 135.73 133.54
ST(MWe) 120.06 120.27 122.46
Gross power (MWe) 256 256 256
Thermal Efficiency (%) 49.44 49.48 49.73
3.5. Conclusion
For load-following operation, five configurations of the NGCC plant with different HP SH2/RH
arrangements and attemperation strategies are proposed, and their performances are evaluated by
decreasing the load from 100% to 40% at a ramp rate of 5% load per min.
It was observed that the 1-stage attemperation, such as Configurations 1 and 3, leads to saturation
and cannot maintain the steam temperature irrespective of whether HP SH2 and RH are arranged
in series or in parallel. However, the configurations with 2-stage attemperation, such as
Configurations 2, 4, and 5, can maintain the main/reheat steam temperature at its set point without
leading to saturation. Configuration 5 with the least spray has the highest efficiency at low-load

41
operation. In Configuration 5, the least amount of heat is transferred in HP SH2 and RH sections,
leading to generation of more HP steam and thus improving the thermal efficiency. The area ratio
of HP SH2 (A) to the total area may or may not impact the efficiency depending on a particular
configuration. In case of Configuration 2, the area ratio does not have any impact, but for
Configurations 4 and 5, the highest efficiency is obtained when the area ratio is set to its maximum
limit of 90%. It was also observed that while the conventional coordinated control can satisfy
operational constraints depending on a specific configuration, there is an efficiency penalty in
comparison to the optimal profile. In summary, this study shows that an appropriate configuration
of the HRSG in an NGCC plant with optimal design and operational strategy can not only help to
avoid spraying to saturation and other operational constraints but also help to maximize the
efficiency during load-following operation of NGCC plants.

42
Chapter 4. Optimal load-following of NGCC plant with stress monitoring of
high-pressure boiler drum
4.1. Literature Review
Impacts of load-following on plant health is currently poorly understood. Electric Power Research
Institute (EPRI) utilized multivariate regression models to analyze the data from 158 operating
units, but no clear correlation was found between the plant cycling operation and cycling-induced
cost (Gray, 2001; Platt, 2002). It indicates that the equipment life expenditure due to cycling is
unit dependent. The constructive details of plant (such as equipment materials, joint types, and
component geometries) and operating patterns of plant (such as ramp rates, load ranges and
holding periods) are required to estimate the long-term wear and tear costs. Intertek APTECH
developed the COSTCOM software to estimate the cycling-related damage and quantify the
corresponding O&M costs by employing a combination of the top-down approach (depending on
damage models and statistical regression) and bottom-up approach (relying on real-time
monitoring data and plant surveys) (Lefton, 2004; Lefton and Hilleman, 2011). Intertek APTECH
has analyzed hundreds of generating units and found that the costs of cycling of the conventional
fossil-fired power plants are varied within a wide potential range depending on unit types and
operating history and design features. It has been reported that these costs are often highly
underestimated by the operators (Lefton and Hilleman, 2011; Lefton et al., 2006).
Besides the plant efficiency loss, load-following also leads to larger thermal and mechanical
stresses, and more wear-and-tear on the plant equipment compared to the base-loaded operation.
The damage caused by the load-following operation on the equipment items, especially the static
equipment such as the components of the heat recovery steam generator (HRSG), is difficult to
identify and quantify without inspection during plant shutdown. Even during plant shutdown, it
can be intractable to inspect all possible locations. Quite often this damage gets reflected during
plant operations leading to plant shutdown, thus raising the plant equivalent forced outage rate
(EFOR) and/or operation and maintenance (O&M) cost. Monitoring of stress evolution in the
critical components during load-following operation can be useful for optimal operation of NGCC
power plants.
In an NGCC plant, the thick-walled HP drum is one of the most vulnerable components that can
suffer from the fatigue damage due to the load-following operation. One way of computing the

43
fatigue damage is through development of detailed finite element method (FEM) model of stress
distribution in the drum (Taler et al., 2018; González-Gómez et al., 2019). However, FEM models
are computationally expensive and therefore dynamic optimization of the plant operation using the
FEM model coupled with the plant-wide model is not computationally tractable.
Another approach is to use the available international standards for assessing drum fatigue damage
and to enhance them, if needed, for higher accuracy for vulnerable, critical section(s) of the drum.
For example, standards such as EN 12952-3 and (2011) and German boiler regulation TRD 301
(2001) are widely accepted and provide useful and computationally tractable approaches to assess
fatigue damage due to stresses caused by pressure and thermal gradients. While both standards
noted above are similar, EN 12952-3 is less conservative than TRD 301. The main improvement
in EN 12952-3 compared to TRD 301 is in the determination of stress concentration factors and
consideration of cumulative damage.
Benato et al. (2015, 2016) proposed a comprehensive plant component lifetime estimation
procedure. Drum stress transient and fatigue damage are evaluated using EN 13445 under varying
plant load. However, EN 13455 does not account for the effect of thermo-mechanical stress
concentration at the locations of component discontinuity such as the drum-downcomer junctions.
Fontaine and Golopin (2007) compared standard EN12952-3 and TDR 301for HRSG cumulative
damage assessment and HRSG cyclic lifetime estimation. EN12952-3 appears to be less
conservative than TRD 301, and more representative of the underlying physics. Hübel et al. (2017)
incorporated the component stress constraint into an optimization approach for coal-fired power
plant start-up. The thermo-mechanical stress was calculated considering the notch effect using
EN12952-3. Taler et al. (2015, 2018) and González-Gómez et al. (2019) used both EN12952-3
and FEM to calculate the drum stress at the drum-downcomer junctions. They observed that other
than the specific location at the drum-downcomer junctions that EN12952-3 already accounts for,
there can be additional locations at the drum-downcomer junctions where stress concentration
should be evaluated during the start-up process. In this chapter, the fatigue damage is estimated
based on drum thermal-mechanical stress calculated using EN12952-3 with detailed drum design.
Multiple locations at the drum-downcomer junctions are assessed and the most stressed part is
used as the constraint in the dynamic optimization problem.

44
For optimizing the load-following operation of NGCC plants, it is desired that the fatigue damage
of the drum be accounted for. Kim et al. (2000) investigated the thermal stress evolution in the
drum of a single-pressure HRSG to optimize the cold start-up procedure by manipulating the flue
gas bypass flow. Rua et al. (2020) developed a model predictive control approach while
considering the drum stress as a constraint control for flexible operation of an NGCC plant. With
the proposed control methodology, the NGCC plant could respond to step changes in load without
exceeding the maximum stress limit of the drum. Kim et al. (2000) presented an optimization
framework for scheduling coal-fired and natural gas-fired power plants integrated with secondary
batteries and renewable energy sources where the drum stress was used as a constraint. However,
the plant and equipment models used in that work are reduced order models, thus only stress
magnitude given by von Mises stress is considered. In fact, for computing fatigue damage, stress
amplitude, i.e., not only the magnitude but also the directionality (i.e. tensile or compressive)
should be considered.
In this chapter, optimal load-following operation including both ramping-up and -down the plant
load is investigated. Depending on whether the plant is ramping-up or-down, operating conditions
of the NGCC plant can differ considerably and therefore stress characteristics of the drum can also
differ considerably. During the load-following operation, while it is desired that the drum stresses
do not exceed certain limit, it is also desired that the plant efficiency is maximized during the
transient operation. For trajectory optimization, a dynamic optimization approach is proposed for
maximizing efficiency during load-following operation of the NGCC plant while ensuring that the
stress limit is not exceeded and constraints such as spraying to saturation are not attained. The
optimizer also ensures that the main and reheat steam temperatures are constrained. If the desired
ramp rate is high, satisfying the constraints noted above may be infeasible. Therefore, relaxation
of ramprate (i.e. deviation of actual ramprate from the desired ramprate, while ensuring that the
actual ramprate is less than or equal to desired ramprate) is considered as a degrees-of-freedom to
satisfy the constraints. However, since the optimizer seeks to maximize efficiency, it can lead to a
solution, especially while ramping down, where relaxation of ramprate is higher than it is required
for satisfying the constraints. Thus, for power plants where such larger relaxations are not
admissible, it would be desired to minimize the relaxation while maximizing the plant efficiency.
This leads to a multi-objective dynamic optimization problem. A lexicographic approach is
proposed to solve this problem. In the lexicographic approach, the objectives are ordered

45
depending on their importance. Minimizing the relaxation is the more important objective so that
the plant can follow the desired load as close as possible without violating the stress and other
constraints.
4.2. HP Drum stress and fatigue damage
In Chapter 3, five configurations are modeled for the SH/RH sections. It was observed that
Configuration 4 with two-stage attemperation and parallel configuration of the SH and RH, as
shown in Figure 4.1, is one of the most efficient configurations that could maintain the main and
reheat steam temperatures without spraying to saturation, even for steep load changes. Another
key advantage of this configuration is the extra degrees of freedom due to the increased number of
attemperator sprays that helps to maximize the efficiency during dynamic optimization while
satisfying the operational constraints. Therefore, the drum stress and fatigue damage analysis and
optimal load-following are conducted using this configuration.
Figure 4. 1. Parallel configuration with two-stage attemperation
Load-following operation of NGCC plants can be done under fixed-pressure mode or sliding-
pressure mode (Apan-Ortiz et al., 2018). Under the fixed-pressure mode, the drum pressure and
therefore the temperature of the saturated steam from the drum remains fairly constant. Under the
sliding-pressure operation, the drum pressure slides as the load decreases. Sliding-pressure
operation leads to higher efficiency (Apan-Ortiz et al., 2018). However, under sliding-pressure

46
operation, the HP drum experiences large variations in steam pressure and temperature affecting
the transient response of mechanical and thermal stresses depending on the detailed drum design.
4.2.1 Drum geometry
In this study, the drum wall thickness is calculated using EN 12952-3 Standard (2011) given by
Equation 4.1:
𝒔𝒄 =𝒅𝒄𝑷𝒄
(𝟐𝑴𝑨𝑺−𝑷𝒄)𝑬 (4.1)
where Pc is internal design pressure, dc is inner diameter of the vessel, E is the joint efficiency,
MAS is the maximum allowable stress of material, and sc is the minimum required thickness of the
vessel.
Table 4. 1. HP Drum geometry and material
Inner Diameter (mm) Wall Thickness (mm) Material
HP Drum 1828.8 177.8 SA 516 Gr.70
Downcomer pipe 203.2 76.2 SA-105
Table 4.1 lists the drum geometry and material. The drum was fabricated using SA516 Grade 70
carbon steel and the downcomer pipe was made from SA-105 carbon steel (EPRI, 2005 and 2006).
It should be noted that the downcomer pipe can have a larger wall thickness near the junction with
the drum.
4.2.2 Temperature transient and thermo-mechanical stress evolution
As the boiler drum is horizontal and possess cylindrical symmetry, temperature of the drum wall
is assumed to vary only in the radial direction. Dynamic model of the drum wall can be written as:
1
𝑟
𝜕
𝜕𝑟(𝑟
𝜕𝑇
𝜕𝑟) =
1
𝛼𝑤
𝜕𝑇
𝜕𝑡 (4.2)
where 𝛼𝑤 is wall thermal diffusivity, r is drum radius.
Principal stresses on the component wall in a cylindrical coordinate are calculated by considering
superposition of both mechanical and thermal stresses.
𝜎𝑟 = 𝜎𝑚,𝑟 + 𝜎𝑡,𝑟 (4.3)
𝜎𝜃 = 𝜎𝑚,𝜃 + 𝜎𝑡,𝜃 (4.4)

47
𝜎𝑧 = 𝜎𝑚,𝑧 + 𝜎𝑡,𝑧 (4.5)
where subscripts r, θ and z denote radial, tangential, and axial directions, respectively. m and t
denote mechanical and thermal stresses, respectively. Using classic elasticity theory (Hetnarski et
al., 2009), thermo-mechanical principal stresses are calculated for each layer of the wall ri.
𝜎𝑚,𝑟(𝑟𝑖) =𝑃𝑖𝑛𝑟𝑖𝑛
2 −𝑃𝑜𝑢𝑡𝑟𝑜𝑢𝑡2
𝑟𝑜𝑢𝑡2 −𝑟𝑖𝑛
2 + (𝑃𝑜𝑢𝑡 − 𝑃𝑖𝑛)𝑟𝑖𝑛
2 𝑟𝑜𝑢𝑡2
𝑟𝑖2(𝑟𝑜𝑢𝑡
2 −𝑟𝑖𝑛2 )
(4.6)
𝜎𝑚,𝜃(𝑟𝑖) =𝑃𝑖𝑛𝑟𝑖𝑛
2 −𝑃𝑜𝑢𝑡𝑟𝑜𝑢𝑡2
𝑟𝑜𝑢𝑡2 −𝑟𝑖𝑛
2 − (𝑃𝑜𝑢𝑡 − 𝑃𝑖𝑛)𝑟𝑖𝑛
2 𝑟𝑜𝑢𝑡2
𝑟𝑖2(𝑟𝑜𝑢𝑡
2 −𝑟𝑖𝑛2 )
(4.7)
𝜎𝑚,𝑧(𝑟𝑖) =𝑃𝑖𝑛𝑟𝑖𝑛
2 −𝑃𝑜𝑢𝑡𝑟𝑜𝑢𝑡2
𝑟𝑜𝑢𝑡2 −𝑟𝑖𝑛
2 (4.8)
𝜎𝑡,𝑟(𝑟𝑖) =𝛼𝑚𝐸𝑚
1−υ
1
𝑟𝑖2 (
𝑟𝑖2−𝑟𝑖𝑛
2
𝑟𝑜𝑢𝑡2 −𝑟𝑖𝑛
2 ∫ 𝑇𝑟 𝑑𝑟𝑟𝑜𝑢𝑡
𝑟𝑖𝑛− ∫ 𝑇𝑟 𝑑𝑟
𝑟𝑖
𝑟𝑖𝑛) (4.9)
𝜎𝑡,𝜃(𝑟𝑖) =𝛼𝑚𝐸𝑚
1−υ
1
𝑟𝑖2 (
𝑟𝑖2+𝑟𝑖𝑛
2
𝑟𝑜𝑢𝑡2 −𝑟𝑖𝑛
2 ∫ 𝑇𝑟 𝑑𝑟𝑟𝑜𝑢𝑡
𝑟𝑖𝑛+ ∫ 𝑇𝑟 𝑑𝑟
𝑟𝑖
𝑟𝑖𝑛− 𝑇𝑟𝑖
2) (4.10)
𝜎𝑡,𝑧(𝑟𝑖) =𝛼𝑚𝐸𝑚
1−υ(
2
𝑟𝑜𝑢𝑡2 −𝑟𝑖𝑛
2 ∫ 𝑇𝑟 𝑑𝑟𝑟𝑜𝑢𝑡
𝑟𝑖𝑛− 𝑇) (4.11)
In Equations 4.6-4.11, P is pressure; αm is thermal expansion coefficient; Em is Young’s modulus,
and υ is Poisson’s ratio. Subscripts ‘in’ and ‘out’ indicate inner and outer surfaces, respectively.
4.2.3 Simplified mechanical stress and thermal stress calculation
While the models presented in Section 4.2.2 are generic and can be applied to any cylindrical
pressure vessels, mechanical and thermal stress models for the boiler drum can be simplified based
on their typical operating conditions and boundary conditions.
For the boiler drum, the radial mechanical stress on the drum’s inner and outer surfaces is much
smaller than tangential and axial mechanical stresses and can be neglected. Both tangential and
axial mechanical stresses are tensile. The tangential stress on the inner surface is the largest and
roughly twice of the axial stress, which is constant over the thickness. Therefore, only tangential
mechanical stress on drum inner surface is considered and calculated using Equation 4.12 as per
the standards such as EN 12952-3 (2011) and TRD 301 (2001).
𝜎𝜃𝑃 =
𝑑𝑚𝑃𝑖𝑛
2𝑠 (4.12)

48
where dm is mean diameter of shell and s is shell wall thickness.
Because there are no normal thermal expansion constraints on the drum inner and outer surfaces,
radial thermal stress is negligible. Tangential and axial stresses over the drum wall thickness are
similar in magnitude as well as in direction (compressive or tensile). Inner and outer walls would
experience stresses in different directions (compressive or tensile) during the temperature
transient. In addition, the inner wall surface experiences the largest thermal stress.
In standards such as EN 12952-3 (2011) and TRD 301 (2001), the tangential thermal stress on wall
inner surface is calculated using Equation 4.13:
𝜎𝜃𝑇 =
𝛼𝑚𝐸𝑚
1−𝜐𝛥𝑇 (4.13)
where 𝛥𝑇 is through-wall temperature difference, which is the difference between integral mean
wall temperature 𝑇𝑚 and inner surface temperature 𝑇𝑖𝑛. The plant-wide model along including the
drum wall energy conservation model shown in Equation 4.2 can be used to calculate 𝛥𝑇. A
simpler approach is used to calculate 𝛥𝑇 in EN 12952-3 (2011) and TRD 301 (2001) assuming a
quasi-steady-state temperature condition.
𝛥𝑇 = 𝑇𝑚 − 𝑇𝑖𝑛 =1
𝛼𝑤Φ𝑤𝑠2 𝜕𝑇
𝜕𝑡 (4.14)
where 𝜕𝑇
𝜕𝑡 is temperature change rate and Φ𝑤 is shape factor. It can be observed that the temperature
difference is proportional to the square of wall thickness and proportional to the temperature
change rate.
4.2.3 Stress concentration due to the component discontinuity
As we can see in Figure 4.2, the drum is connected to other pipes, e.g. the downcomer and riser
tubes. The discontinuity, such as the drum-downcomer junction, causes the stress concentration
and can lead to larger stress amplitude during load-following. In general, drum-downcomer
junction can be treated as a typical cylindrical shell with a hole. A similar computational approach
can be applied to other similar component junctions.
Since the radial stress in the shell is small compared to other principal stresses (Equations 4.6-
4.11), the shell with a hole is approximated as the plate with a hole as shown in Figure 4.2, where
Position A is located in the axial direction and Position B is located in the tangential direction.

49
This junction is stretched in the perpendicular directions to 𝜎 1, the tangential thermal or
mechanical stress of shell, and 𝜎2, the axial thermal or mechanical stress (Dzierwa and Taler, 2015;
Dzierwa, 2016).
Figure 4. 2. Schematic and approximation of cylindrical shell with a hole
Equations 4.15-4.18 are used to calculate 𝜆, the theoretical stress concentration factor, which is
defined as the corresponding circumferential stress 𝜎𝜑 divided by the tangential stress 𝜎𝜃 . As
shown in the system of equations, 𝜆 depends on the position angle 𝜑 and the ratio of stress
magnitude 𝛽 (Pilkey and Pilkey, 2008).
𝜎𝜑 = (𝜎1 + 𝜎2) + 2(𝜎1 − 𝜎2)cos2𝜑 (4.15)
𝜎2 𝜎1⁄ = 𝛽 (4.16)
𝜎𝜑 = 𝜎1(1 + 𝛽) + 2𝜎1(1 − 𝛽)𝑐𝑜𝑠2𝜑 (4.17)
𝜆 =𝜎𝜑
𝜎1= (1 + 𝛽) + 2(1 − 𝛽)𝑐𝑜𝑠2𝜑 (4.18)

50
The circumferential thermo-mechanical stresses around the junction are different depending on the
position. The theoretical stress concentration factors at Position A and B are determined as shown
in Table 4.2. Since the magnitude of thermal stresses in the axial and tangential directions is almost
the same, the ratio of thermal stress magnitude is considered to be 1 while the corresponding stress
concentration factor is considered to be 2 around the hole. As the magnitude of mechanical stress
in the axial direction is roughly half of that in the tangential direction, consequently, the
mechanical stress concentration factor at position B is only 1/5 of the stress concentration factor
at position A.
Table 4. 2. Relation of stress concentration factors at different positions
Thermal stress Mechanical stress
𝛽 𝜎𝜑 𝜆 β 𝜎𝜑 𝜆
Position A (𝜑=0°) 1 2σ1 2 0.5 2.5σ
1 2.5
Position B (𝜑=90°) 1 2σ1 2 0.5 0.5σ
1 0.5
The stress concentration factor is also affected by the shell-branch geometries and welded joint
type. The stress concentrations noted above can lead to a larger stress amplitude. For example,
TRD 301 (2001) assumes that the thermal stress concentration factor on the edge of a hole is
constant and is equal to 2 similar to what has been noted in Table 4.2. EN 12952-3 (2011) has been
improved by introducing a variable stress concentration factor 𝜆𝑡 , which depends on the heat
transfer coefficient on the drum inner surface and the drum-downcomer geometries. In addition,
an empirical correlation is given in EN 12952-3 (2011) for computing the mechanical stress
concentration factor 𝜆𝑚 at shell-branch junction.
𝜆𝑡 = {[2 −ℎ+2700
ℎ+1700𝑧 +
ℎ
ℎ+1700(exp−7𝑧 −1)]
2
+ 0.81𝑧2}1/2
(4.19)
𝑧 =𝑑𝑚𝑏
𝑑𝑚 (4.20)
𝜆𝑚 = 2.2 + exp𝑊 × £𝑄 (4.21)
W = −1.14 (𝑠𝑏
𝑠)
2
− 0.89 (𝑠𝑏
𝑠) + 1.43 (4.22)
𝑄 = 0.326 (𝑠𝑏
𝑠)
2
− 0.59 (𝑠𝑏
𝑠) + 1.08 (4.23)

51
£ =𝑑𝑚𝑏
𝑑𝑚√
𝑑𝑚
2𝑠 (4.24)
In Equations 4.19-4.24, 𝑑𝑚𝑏 is mean diameter of branch, 𝑠𝑏 is branch wall thickness, and h is heat
transfer coefficient.
It should be noted that the empirical correlations suggested in EN 12952-3 is applicable to Position
A. Concentration factors for Position B is calculated based on the stress concentration factor for
Position A from EN 12952-3 and the relation between Position A and B as shown in Table 2.
Overall, the circumferential stress at drum-downcomer junction is calculated using Equation 25.
𝜎𝜑,𝑘 = 𝜆𝑚,𝑘𝑑𝑚𝑃𝑖𝑛
2𝑠+ 𝜆𝑡,𝑘
𝛼𝑚𝐸𝑚
1−𝜈𝛥𝑇 (4.25)
where subscript k represents Position A or B.
4.2.4 Fatigue damage
Due to the relatively low operating temperature, the creep damage on HP drum is low. However,
it can undergo considerable fatigue damage if frequent cycling occurs. The fatigue damage is
defined as the actual cycle number of cycles divided by the maximum allowable cycle number as
given by Equation 26:
𝐷𝑓 =𝑁
𝑁𝐴(Δ𝜎) (4.26)
where NA is the maximum allowable cycle number under a certain stress range Δσ. NA is evaluated
according to the fatigue curves of material of construction (i.e. ferritic and austenitic steel for the
drum) given in EN 12952-3 (2011).
The Tresca criterion is widely used to determine the equivalent stress amplitude Δ𝜎 for fatigue
damage estimation. For a triaxial component, the principal stresses σj and the principal stress
differences Δσij are varied with respect to time under the load-following. According to the
variations of the principal stress differences, the maximum Δσij,max and the minimum Δσij,min during
the transient are determined. Then, the equivalent stress range is calculated.
Δ𝜎 = 𝑀𝑎𝑥(|Δ𝜎𝑟𝜃,𝑚𝑎𝑥 − Δ𝜎𝑟𝜃,𝑚𝑖𝑛|; |Δ𝜎𝑟𝑧,𝑚𝑎𝑥 − Δ𝜎𝑟𝑧,𝑚𝑖𝑛|; |Δ𝜎𝑧𝜃,𝑚𝑎𝑥 − Δ𝜎𝑧𝜃,𝑚𝑖𝑛|) (4.27)
In Equation 4.27, the term Δσij indicates the difference between i and j principal stresses.

52
4.3. Dynamic optimization
Dynamic optimization under load-following operations can be useful to maximize the plant
efficiency. Due to the lack of access to the plant-specific historical data for operation and
maintenance costs of the NGCC plant and lack of sufficient data in the open literature to develop
correlation between the plant cycling operation and equipment damage cost, constraints on stress
bounds are considered for dynamic optimization. In addition to stress, main steam and reheat steam
temperatures should also be bounded within a narrow range. It should also be ensured that the dew
points are not reached due to the attemperator sprays. When the desired ramp rate is high, the
solution to the above optimization problem can be infeasible without relaxing the ramp rate
constraint. In this work, we assume that:
• the plant needs to satisfy the average ramp rate, not the instantaneous ramp rate. This means
that if a utility desires to follow, say, a 5% load change/min ramp rate while decreasing its
load from 100% to 50%, then at any point in time, the ramp rate can be different than
5%/min, but the plant needs to reach 50% load exactly in 10 min if the ramp rate is not
relaxed.
• the plant cannot exceed the desired average ramp rate but can relax it if needed to satisfy
the constraints.
If the relaxation in the ramp rate is user-specified, then a single-objective dynamic optimization
problem as given by Equation 4.28 can be solved. In Equation 4.28, the first constraint denotes the
equality and inequality constraints due to the plant-wide model. The second and third constraints
are for the main and reheat steam temperatures, respectively. The fourth and fifth constraints are
for the temperatures at the inlet of the SH stages and RH stages, respectively, which must remain
above their respective dew points. The sixth constraint satisfies that the HP drum stress, with
maximum amplitude 𝑚𝑎𝑥𝑎𝑚𝑝 (𝜎𝐻𝑃 𝑑𝑟𝑢𝑚), is constrained within a certain upper/tensile bound and
lower/compressive bound. As the drum stresses at different locations in the drum have varied
amplitudes under load-following, this constraint considers the maximum stress variation during
transients considering all drum locations that are evaluated. The constraint for the average ramp
rate is given by the seventh constraint, where n denotes the desired ramp rate. The final constraint
satisfies the terminal constraint that the plant load reaches the desired load at the end of the ramp.
Obviously, as ramprate is relaxed, the end time for the ramp, tfin, needs to be modified accordingly.

53
These optimization studies are done using APD that employs a sequential optimization approach
where the process flowsheet is solved by using an embedded DAE solver. This approach makes it
difficult to optimize trajectories of a large number of decision variables. Therefore, trajectory of
the respective attemperator spray flow controller setpoints is considered as the decision variables
in this problem. In addition, trajectory of the ramp rate is also the decision variable. It should be
noted that even though real-time ramp rate can be different from the desired ramp rate (e.g. 5%
load change/min) in dynamic optimization, it has the upper and lower bound (e.g. 1% load
change/min to 7.5% load change/min). The setpoints and control of remaining controlled variables
are based on the coordinated control approach as described in Section 2.2.4.
max𝑢
∫ 𝜂𝑡ℎ𝑑𝑡
𝑡𝑓𝑖𝑛𝑡𝑖𝑛𝑖
𝑡𝑓𝑖𝑛−𝑡𝑖𝑛𝑖 (4.28)
𝑠. 𝑡. 𝑓(𝑥, 𝑦, 𝑢) ≤ 0 𝑥, 𝑦, 𝑢 ∈ 𝑅𝑛
𝑇𝑠𝑝,𝑀𝑆 −△ 𝑇𝑀𝑆 ≤ 𝑇𝑀𝑆 ≤ 𝑇𝑠𝑝,𝑀𝑆 +△ 𝑇𝑀𝑆
𝑇𝑠𝑝,𝑅𝑆 −△ 𝑇𝑅𝑆 ≤ 𝑇𝑅𝑆 ≤ 𝑇𝑠𝑝,𝑅𝑆 +△ 𝑇𝑅𝑆
𝑇𝑆𝐻,𝑖 ≥ 𝑇𝑑𝑒𝑤,𝑆𝐻,𝑖 +△ 𝑇𝑑𝑒𝑤,𝑆𝐻
𝑇𝑅𝐻,𝑖 ≥ 𝑇𝑑𝑒𝑤,𝑅𝐻,𝑖 +△ 𝑇𝑑𝑒𝑤,𝑅𝐻
𝜎𝑙𝑜𝑤𝑒𝑟 ≤ 𝑚𝑎𝑥𝑎𝑚𝑝 (𝜎𝐻𝑃 𝑑𝑟𝑢𝑚) ≤ 𝜎𝑢𝑝𝑝𝑒𝑟
𝑛% 𝑙𝑜𝑎𝑑 𝑐ℎ𝑎𝑛𝑔𝑒𝑑𝑒𝑠𝑖𝑟𝑒𝑑
𝑚𝑖𝑛−△ 𝑟𝑎𝑚𝑝𝑟𝑎𝑡𝑒𝑙𝑜𝑤𝑒𝑟 ≤ 𝑟𝑎𝑚𝑝𝑟𝑎𝑡𝑒𝑎𝑣𝑒 ≤
𝑛% 𝑙𝑜𝑎𝑑 𝑐ℎ𝑎𝑛𝑔𝑒𝑑𝑒𝑠𝑖𝑟𝑒𝑑
𝑚𝑖𝑛
𝐿𝑜𝑎𝑑 (𝑡 = 𝑡𝑓𝑖𝑛) = 𝐿𝑜𝑎𝑑𝑑𝑒𝑠𝑖𝑟𝑒𝑑(𝑡 = 𝑡𝑓𝑖𝑛)
where ηth is the thermal efficiency of power plant, T is the steam temperature and △T is the
allowable temperature deviation /difference. σ is the drum stress at the junction part, ramprate is
the plant load ramp rate under the load-following and △ramprate is the allowable average ramp
rate deviation. The subscripts ‘sp’, ‘dew’, ‘ave’ ,‘upper’ and ‘lower’ denote setpoint, dew point,
average value, upper bound and lower bound, respectively; ‘MS’ and ‘RS’ represent main steam
and reheat steam, respectively; ‘SH’ and ‘RH’ denote superheater and reheater inlet steams,
respectively; i represents SH/RH stages.
While the power plant operator may have the option to relax the ramprate in some cases, in many
cases it is desired that the deviation of the ramprate from the desired ramprate is minimized. Since
the minimum relaxation needed to satisfy the constraints 1-6 would depend on the state of the

54
system, desired ramprate, (whether the plant is ramping up or down), the plant design , and the
plant control system design, the user-specified relaxation may not be able to satisfy the constraints
or can largely exceed the minimum relaxation. At this point, one important question arises: will
the relaxation of the ramprate be minimized by the optimizer so that the user can simply provide a
larger relaxation for satisfying the equality and inequality constraints? To answer this question,
the important distinction between the ramp-up and ramp-down operation needs to be considered
with respect to their impact on efficiency. NGCC efficiency monotonically decreases as the load
is decreased. Therefore, when the dynamic optimization problem given by Equation 4.28 is solved
for ramp-up operation, the deviation of the average ramp rate from the desired ramp rate gets
minimized by the optimizer since doing so maximizes the efficiency. Therefore, so long as the
user specifies a large relaxation for the ramp rate while ramping up, the constraint boundary for
ramp relaxation will not be reached. On the other hand, if the plant load is to be ramped down,
then if a larger relaxation than what is needed to satisfy the constraints 1-6 in Equation 4.28, is
specified by the user, then the optimizer will relax the ramprate as much as possible (i.e., will reach
the maximum relaxation specified by the user) since lowering the ramp rate improves the
efficiency. Therefore, for the cases where the user may not be permitted to relax the ramprate
beyond the minimal value, the following multi-objective optimization problem can be solved:
min𝑢
△ 𝑟𝑎𝑚𝑝𝑟𝑎𝑡𝑒𝑙𝑜𝑤𝑒𝑟
max𝑢
∫ 𝜂𝑡ℎ𝑑𝑡
𝑡𝑓𝑖𝑛𝑡𝑖𝑛𝑖
𝑡𝑓𝑖𝑛−𝑡𝑖𝑛𝑖 (4.29)
𝑠. 𝑡. 𝑓(𝑥, 𝑦, 𝑢) ≤ 0 𝑥, 𝑦, 𝑢 ∈ 𝑅𝑛
𝑇𝑠𝑝,𝑀𝑆 −△ 𝑇𝑀𝑆 ≤ 𝑇𝑀𝑆 ≤ 𝑇𝑠𝑝,𝑀𝑆 +△ 𝑇𝑀𝑆
𝑇𝑠𝑝,𝑅𝑆 −△ 𝑇𝑅𝑆 ≤ 𝑇𝑅𝑆 ≤ 𝑇𝑠𝑝,𝑅𝑆 +△ 𝑇𝑅𝑆
𝑇𝑆𝐻,𝑖 ≥ 𝑇𝑑𝑒𝑤,𝑆𝐻,𝑖 +△ 𝑇𝑑𝑒𝑤,𝑆𝐻
𝑇𝑅𝐻,𝑖 ≥ 𝑇𝑑𝑒𝑤,𝑅𝐻,𝑖 +△ 𝑇𝑑𝑒𝑤,𝑅𝐻
𝜎𝑙𝑜𝑤𝑒𝑟 ≤ 𝑚𝑎𝑥𝑎𝑚𝑝 (𝜎𝐻𝑃 𝑑𝑟𝑢𝑚) ≤ 𝜎𝑢𝑝𝑝𝑒𝑟
𝑛% 𝑙𝑜𝑎𝑑 𝑐ℎ𝑎𝑛𝑔𝑒𝑑𝑒𝑠𝑖𝑟𝑒𝑑
𝑚𝑖𝑛−△ 𝑟𝑎𝑚𝑝𝑟𝑎𝑡𝑒𝑙𝑜𝑤𝑒𝑟 ≤ 𝑟𝑎𝑚𝑝𝑟𝑎𝑡𝑒𝑎𝑣𝑒 ≤
𝑛% 𝑙𝑜𝑎𝑑 𝑐ℎ𝑎𝑛𝑔𝑒𝑑𝑒𝑠𝑖𝑟𝑒𝑑
𝑚𝑖𝑛
𝐿𝑜𝑎𝑑 (𝑡 = 𝑡𝑓𝑖𝑛) = 𝐿𝑜𝑎𝑑𝑑𝑒𝑠𝑖𝑟𝑒𝑑(𝑡 = 𝑡𝑓𝑖𝑛)

55
For solving the multi-objective dynamic optimization problem given above, the lexicographic
approach is used (Bhattacharyya and Rengaswamy, 2010; Paul et al., 2017; Miettinen, 2002). If
there are n optimization objectives, then in the lexicographic approach, the objective functions are
arranged in order according to their importance and an n-stage optimization problem is solved. In
the first stage, the most important objective is optimized while in the second stage the next
important objective is optimized subject to the additional constraint introduced by the solution of
the first stage optimization problem. This approach continues till the nth stage optimization
problem where additional constraints based on the solution from n-1 stages are included. The
solution of the lexicographic approach is Pareto-optimal (Miettinen, 2002). The lexicographic
approach is very appropriate for the multi-objective optimization problem given above, since the
power plant operational objectives are ordered in terms of their importance/priorities during load
following. For a load-following power plant responding to the grid demand, following the desired
ramprate as closely as possible is often the most important objective. Therefore, minimizing the
deviation from the desired ramp rate is the most important objective. Thus, the following two-
stage optimization problem is proposed:
Stage 1 optimization:
min𝑢
△ 𝑟𝑎𝑚𝑝𝑟𝑎𝑡𝑒𝑙𝑜𝑤𝑒𝑟 (4.30)
𝑠. 𝑡. 𝑓(𝑥, 𝑦, 𝑢) ≤ 0 𝑥, 𝑦, 𝑢 ∈ 𝑅𝑛
𝑇𝑠𝑝,𝑀𝑆 −△ 𝑇𝑀𝑆 ≤ 𝑇𝑀𝑆 ≤ 𝑇𝑠𝑝,𝑀𝑆 +△ 𝑇𝑀𝑆
𝑇𝑠𝑝,𝑅𝑆 −△ 𝑇𝑅𝑆 ≤ 𝑇𝑅𝑆 ≤ 𝑇𝑠𝑝,𝑅𝑆 +△ 𝑇𝑅𝑆
𝑇𝑆𝐻,𝑖 ≥ 𝑇𝑑𝑒𝑤,𝑆𝐻,𝑖 +△ 𝑇𝑑𝑒𝑤,𝑆𝐻
𝑇𝑅𝐻,𝑖 ≥ 𝑇𝑑𝑒𝑤,𝑅𝐻,𝑖 +△ 𝑇𝑑𝑒𝑤,𝑅𝐻
𝜎𝑙𝑜𝑤𝑒𝑟 ≤ 𝑚𝑎𝑥𝑎𝑚𝑝 (𝜎𝐻𝑃 𝑑𝑟𝑢𝑚) ≤ 𝜎𝑢𝑝𝑝𝑒𝑟
𝑛% 𝑙𝑜𝑎𝑑 𝑐ℎ𝑎𝑛𝑔𝑒𝑑𝑒𝑠𝑖𝑟𝑒𝑑
𝑚𝑖𝑛−△ 𝑟𝑎𝑚𝑝𝑟𝑎𝑡𝑒𝑙𝑜𝑤𝑒𝑟 ≤ 𝑟𝑎𝑚𝑝𝑟𝑎𝑡𝑒𝑎𝑣𝑒 ≤
𝑛% 𝑙𝑜𝑎𝑑 𝑐ℎ𝑎𝑛𝑔𝑒𝑑𝑒𝑠𝑖𝑟𝑒𝑑
𝑚𝑖𝑛
𝐿𝑜𝑎𝑑 (𝑡 = 𝑡𝑓𝑖𝑛) = 𝐿𝑜𝑎𝑑𝑑𝑒𝑠𝑖𝑟𝑒𝑑(𝑡 = 𝑡𝑓𝑖𝑛)
Stage 2 optimization:
max𝑢
∫ 𝜂𝑡ℎ𝑑𝑡
𝑡𝑓𝑖𝑛𝑡𝑖𝑖𝑛
𝑡𝑓𝑖𝑛−𝑡𝑖𝑛𝑖 (4.31)
𝑠. 𝑡. 𝑓(𝑥, 𝑦, 𝑢) ≤ 0 𝑥, 𝑦, 𝑢 ∈ 𝑅𝑛

56
𝑇𝑠𝑝,𝑀𝑆 −△ 𝑇𝑀𝑆 ≤ 𝑇𝑀𝑆 ≤ 𝑇𝑠𝑝,𝑀𝑆 +△ 𝑇𝑀𝑆
𝑇𝑠𝑝,𝑅𝑆 −△ 𝑇𝑅𝑆 ≤ 𝑇𝑅𝑆 ≤ 𝑇𝑠𝑝,𝑅𝑆 +△ 𝑇𝑅𝑆
𝑇𝑆𝐻,𝑖 ≥ 𝑇𝑑𝑒𝑤,𝑆𝐻,𝑖 +△ 𝑇𝑑𝑒𝑤,𝑆𝐻
𝑇𝑅𝐻,𝑖 ≥ 𝑇𝑑𝑒𝑤,𝑅𝐻,𝑖 +△ 𝑇𝑑𝑒𝑤,𝑅𝐻
𝜎𝑙𝑜𝑤𝑒𝑟 ≤ 𝑚𝑎𝑥𝑎𝑚𝑝 (𝜎𝐻𝑃 𝑑𝑟𝑢𝑚) ≤ 𝜎𝑢𝑝𝑝𝑒𝑟
𝑛% 𝑙𝑜𝑎𝑑 𝑐ℎ𝑎𝑛𝑔𝑒𝑑𝑒𝑠𝑖𝑟𝑒𝑑
𝑚𝑖𝑛−△ 𝑟𝑎𝑚𝑝𝑟𝑎𝑡𝑒𝑙𝑜𝑤𝑒𝑟,𝑚𝑖𝑛 ≤ 𝑟𝑎𝑚𝑝𝑟𝑎𝑡𝑒𝑎𝑣𝑒 ≤
𝑛% 𝑙𝑜𝑎𝑑 𝑐ℎ𝑎𝑛𝑔𝑒𝑑𝑒𝑠𝑖𝑟𝑒𝑑
𝑚𝑖𝑛
𝐿𝑜𝑎𝑑 (𝑡 = 𝑡𝑓𝑖𝑛) = 𝐿𝑜𝑎𝑑𝑑𝑒𝑠𝑖𝑟𝑒𝑑(𝑡 = 𝑡𝑓𝑖𝑛)
In Eq. (4.31), △ 𝑟𝑎𝑚𝑝𝑟𝑎𝑡𝑒𝑙𝑜𝑤𝑒𝑟,𝑚𝑖𝑛 is the optimal objective obtained from the first stage of
optimization.
In APD, FEASOPT (a feasible path SQP algorithm) and DMO (Dynamic Multi-Objective solver)
optimizers are used. The initial guesses of spray flow rate are from the coordinated control system
as discussed in Section 3.3, while the initial value of the ramprate is constant as the desired average
ramprate. Therefore, results obtained from the coordinated control system under the linear load-
following operation are used as the initial guess for dynamic optimization.
4.4. Results and discussion
4.4.1 HP Drum stress transient under the load-following operation
These studies are conducted considering that the plant load starts ramping down in the first hour
from 100%, reaching 25% in 15 min (i.e., 5% load change per min) , then stays at 25% load for 4
hr 45 min, then ramps up to 100% at a constant ramp rate of 5% load change per min. The total
simulation time is 12 hr to fully capture the HP drum stress transient.
Tangential stress on wall inner surface
Figure 4.3 shows the drum pressure and temperature transients under the load-following scenario,
reflecting the sliding pressure operation of the plant. Figure 4.4 shows the transients in the
tangential thermo-mechanical stress on the drum inner surface. As expected, the mechanical stress
is always in the tensile direction and proportional to the drum internal pressure, thus decreasing as
the drum pressure drops and then rising back as the plant ramps up to the full load. Thermal stress
shows some interesting behavior. First, as the load decreases, the inner surface temperature
becomes lower than the outer surface. During this time, the thermal stress on the inner surface is

57
tensile. As the plant load stays at 25%, the temperature difference between the inner and outer
surfaces reduces thus the thermal stress decreases and eventually becomes negligible. When the
load starts ramping up, the inner temperature becomes larger than the outer surface temperature
thus leading to compressive stress. As the plant load becomes steady, the temperature difference
between inner and outer surfaces becomes very small leading to negligible thermal stress.
(a) (b)
Figure 4. 3. Drum pressure and temperature transients under load-following operation:
(a) pressure (b) temperature
Figure 4. 4. Tangential stress transient on drum inner surface under load-following

58
As the drum wall thickness is high, the magnitude of the thermal stress is large. It can be observed
that the thermal stress is compensated by the mechanical stress as they are opposite in direction
during both ramp-up and -down. As a result, even though the thermal stress is compressive during
ramp up operation, the total stress remains slightly tensile due to the increase in the mechanical
stress that is tensile.
Circumferential stress at drum/downcomer junction
Under load-following operations, through-wall temperature difference and corresponding thermal
stress increase roughly as the square of wall thickness, as shown in Equation 4.14, and mechanical
stress decreases proportionally to the wall thickness as shown in Equation 4.12. As wall thickness
keeps increasing, the thermal stress becomes predominant, which leads to an increase in stress
amplitude.
Figure 4. 5. Stress amplitude with respect to the drum wall thickness at Positions A and B
Resulting stress amplitude calculated over the entire ramp down and ramp up operation for
different drum wall thickness is shown in Figure 4.5 for Position A and B. As noted before, only
Position A is considered in many of the existing codes such as EN 12952-3. However, Figure 4.5
shows that the dominating stress amplitude strongly depends on the drum wall thickness. Figure
4.5 shows that the minimum stress amplitude for Position A occurs at around 150 mm wall
thickness, which is less than the minimum required thickness (sc=169.9 mm) calculated using EN
12952-3 Standard (2011) for the nominal operating conditions and material of construction given
in Table 4.1. Considering the drum design thickness of 177.8 mm, given in Table 4.1, Position B

59
experiences a larger stress amplitude as shown in Figure 4.5. Therefore, besides Position A, the
fatigue damage should also be assessed at Position B.
Table 4.3 shows that compared to Position A, more fatigue damage is accumulated at Position B
due to the larger stress amplitude Δσ. In Table 4.3, the allowable number of cycles before a failure
is likely to occur is relative to that for Position A, which is shown as unity. It shows that allowable
number of cycles for Position B is about 7% of that for Position A. These results show that Position
B is considerably more vulnerable to failure due to cycling than Position A. Figure 4.6 shows the
circumferential stress profile in Positions A and B during the simulated load-following scenario.
It shows that Position B can be subjected to compressive stress, for which most materials have
lower tolerance (Shankar et al., 2006).
Since Position B is the most stressed part of the drum under the load-following and more
vulnerable to failure given the design, the circumferential stress at drum/downcomer junction
Position B 𝜎𝜑,𝐵 is considered to be the constraint (i.e. 𝜎𝜑,𝐵 = 𝑚𝑎𝑥𝑎𝑚𝑝(𝜎𝐻𝑃 𝑑𝑟𝑢𝑚))in the dynamic
optimization problem.
Figure 4. 6. Transients of circumferential stress at drum/downcomer junction
Table 4. 3. Fatigue damage estimation at drum/downcomer junction
Drum-downcomer junction
𝜆𝑡 𝜆𝑚 Δσ (MPa) Allowable number
of Cycles NA
Relative Allowable
Number of Cycles
Position A
(𝜑=0°) 1.44 3.07 188.3 7.5×10⁶ 1
Position B
(𝜑=90°) 1.44 0.614 267.6 525,265 0.07

60
4.4.2 Dynamic optimization under the load-following operation
Results from the dynamic optimization are generated by considering a load ramp down from 100%
to 25% then back to 100% at a desired average ramprate of 5% load change per minute, similar to
Section 4.4.1. In the typical power plant operation under sliding pressure mode, the steam pressure
is changed linearly with respect to load. Thus, if a 5% load change per minute is desired then that
ramprate is imposed for all instants of time until the plant load reaches its new steady state set
point. As a result, the drum pressure changes linearly over the entire load following scenario till it
reaches the new steady state value. This typical industrial approach is denoted as ‘Linear’ in the
results presented below. These results will be compared with the results from dynamic
optimization studies denoted as ‘Optimal’.
Optimal process under a constant ramp rate neglecting stress constraint
Results in this subsection are generated by neglecting the stress constraint. Since the plant
configuration considers a 2-stage attemperation for both SH and RH, all constraints including the
main steam temperature could be satisfied by the conventional ‘linear’ approach as well, while
avoiding spraying to saturation. Since ramprate relaxation is not needed for satisfying the
constraints under this scenario, only the single objective optimization problem given by Equation
4.28 is solved without the stress constraint. As the steam temperature can be maintained very close
to its setpoint, steam temperature transients are not shown in subsequent results.
It was found that dynamic optimization leads to about 1% higher thermal efficiency at low load
than the linear operation. Also, the least spray at ATT leads to the highest plant efficiency (Wang
et al., 2020). Figures 4.7 (a-d) compare the results between the conventional linear approach and
dynamic optimization. The dynamic optimization leads to an overall higher thermal efficiency. It
is observed that the optimizer reduces the spray at both HP SH2 and RH ATT resulting in a higher
steam inlet temperature and a lower driving force for heat exchange in HP SH2 and RH.
Consequently, more exhaust heat is recovered in the downstream HP EVA for more HP steam
generation leading to higher plant efficiency. It is also observed that the drum steam pressure is
higher for the optimal profile at low load as seen in Figure 4.7 (d).

61
(a) (b)
(c) (d)
Figure 4. 7. Comparison between dynamic optimization and coordinated control
system: (a) thermal efficiency (b) total spray flow at SH/RH ATT (c) HP steam flow from
HP drum (d) HP drum pressure
Figure 4.8(a) shows the profile of tangential mechanical and thermal stresses on the drum inner
surface for the linear approach as well as for dynamic optimization. Figure 4.8 (b) shows the stress
profile at the drum/downcomer junction at Position B. There are only minor differences in the
stress profile between the linear approach and dynamic optimization for all locations evaluated.

62
(a) (b)
Figure 4. 8. Comparison of stress transient between dynamic optimization and
conventional linear approach: (a) tangential stress at drum inner surface (b)
circumferential stress at drum/downcomer junction at Position B
In fact, drum stream pressure difference between linear approach and dynamic optimization results
in negligible mechanical stress difference. On the other hand, since thermal stress is proportional
to the temperature change rate as shown in Equation 4.14, nonlinear optimal operation with varied
real-time ramprate could lead to more flexible steam temperature change and corresponding
thermal stress during the transient than the conventional linear operation. More details will be
shown in the next subsection.
Optimal process under a constant ramp rate with different stress constraints
Results in this subsection are generated by considering different stress constraints. These stress
constraints not only depend on the specific material of construction, but also on the operational
history of a plant as well as the level of conservatism exercised by plant operators. It should be
noted that for ramp down studies, only 𝜎𝑢𝑝𝑝𝑒𝑟 may be active, if at all, while for ramp up, only
𝜎𝑙𝑜𝑤𝑒𝑟 may be active, if at all, depending on the value of the constraint bound. Sensitivities to
different upper and lower bounds of stress, i.e. 𝜎𝑙𝑜𝑤𝑒𝑟 and 𝜎𝑢𝑝𝑝𝑒𝑟 are evaluated. In particular, the
following bounds are evaluated, 𝜎𝑙𝑜𝑤𝑒𝑟 = −70, −82, −95 MPa and 𝜎𝑢𝑝𝑝𝑒𝑟 = 200, 191, 175
MPa. The rationale behind selecting these bounds is given as follows. Out of these bounds,
𝜎𝑙𝑜𝑤𝑒𝑟 = −82 MPa and 𝜎𝑢𝑝𝑝𝑒𝑟 = 191MPa are the same as the values that would be reached by

63
following a strictly linear profile for 5% per min ramp up and ramp down, respectively. The other
two bounds are selected such that they are above or below the values reached using the linear
profile, but such that the average ramprate is not relaxed compared to the desired ramprate. Since
no relaxation of ramprate is required, only single objective optimization problems are solved for
the results presented in this section. For ease of analysis, the studies presented here are presented
separately for ramp-down and ramp-up operations.
(a)
(b) (c)
Figure 4. 9. Comparison of linear and optimal profiles under different stress constraints
for 5% average ramp down in load per min: (a) power output (b) thermal efficiency (c) HP
drum stress at drum/downcomer junction at Position B

64
Figures 4.9(a), (b), (c) compare power, thermal efficiency and drum stress at the junction (the
maximum stress), respectively, for the linear profile vs. the optimal profile for 5% average ramp
down. As shown in Table 4.4, dynamic optimization leads to about 1% higher efficiency than the
linear profile, even if the upper bound for stress is set at the same value as the linear profile. It is
observed that the optimal ramp rate is considerably slower early in the beginning of ramp down
compared to the linear profile, thus taking advantage of the higher thermal efficiency at higher
loads. It then follows a steeper profile than the linear rate. Subsequently, the optimal ramprate
becomes much lower than the linear profile to avoid the maximum stress bound and finally
increases again to satisfy the average ramp constraint. When the stress upper bound is set at 200
MPa, the optimal ramp rate is even slower in the beginning than when the stress limit is 191 MPa,
since a faster ramprate could be followed for rest of the profile without exceeding the stress limit.
In this case, the dynamic optimization leads to about 1.4% higher thermal efficiency than the linear
profile. When the stress constraint is lower than the linear profile (i.e., at 175 MPa), the ramp rate
at the beginning is higher than the linear profile, but as the system approaches the stress limit, the
ramprate decreases but can still achieve the desired average ramprate. As shown in Table 4.4, the
time average thermal efficiency for this case is 0.3% lower than the linear profile.
Table 4. 4. Plant average efficiency under different ramp-down processes with the fixed
average ramp rate
Linear Optimal
Stress upper bound (MPa) 191 200 191 175
Time average thermal efficiency (%) 50.3 51.7 51.3 50.0
Table 4. 5. Plant average efficiency under different ramp-up processes with the fixed
average ramp rate
Linear Optimal
Stress lower bound (MPa) -82 -95 -82 -70
Time average thermal efficiency (%) 53.5 54.6 54.5 54.3
Figures 4.10 (a), (b), (c) compare power, thermal efficiency and drum stress at the junction (point
of maximum stress), respectively, for the linear profile vs. the optimal profile for 5% average
ramp-up in load per min. Table 4.5 shows that the dynamic optimization leads to about 1% higher
efficiency than the linear profile even though the lower bound of stress is set at the same value as

65
the linear profile. Opposed to the ramp-down process, the ramp up profile is steeper early in the
process since higher efficiency is obtained at higher load. To avoid reaching the stress constraint,
the ramprate becomes slower at a later time. The higher the value of the stress lower bound, the
earlier the ramprate starts becoming slower, as expected. As a result, as the value of the stress
constraint becomes higher, the improvement in efficiency with respect to the linear profile
becomes smaller as shown in Table 4.5. For all the stress bounds considered in this study,
efficiency obtained through dynamic optimization is superior to the linear profile.
(a)
(b) (c)
Figure 4. 10. Comparison of linear and optimal profiles under different stress
constraints for 5% average ramp up in load per min (a) Power output (b) Thermal
efficiency (c) HP drum stress at drum/downcomer junction at Position B

66
Optimal process under varied ramp rate with average ramprate relaxation
For the studies presented in this section, upper and lower bounds on drum stress are tightened
compared to the earlier section, thus relaxation of average ramp rate becomes necessary.
Therefore, the multi-objective optimization problem given by Equations 4.30 and 4.31 is solved.
Results in this section are those obtained at the end of second stage optimization given by Equation
4.31.
As noted earlier, while ramping up the load, a user can provide a large enough relaxation in the
ramprate and solve a single objective optimization problem since the optimizer will automatically
minimize the ramprate relaxation since doing so improves the efficiency. Thus, the multi-objective
problem is of importance mainly for ramping down the load.
Figure 4. 11. Effect of the stress upper bound on the minimum ramprate relaxation and
time average thermal efficiency for a desired rate of 5% rampdown per minute
Figure 4.11 shows the minimum relaxation in rate for rampdown as the stress upper bound is
changed. It shows that when the upper bound of stress is higher than 175 MPa, ramparate does not
need to be relaxed, which was also captured in the studies presented in the earlier section. As the
upper bound on stress is decreased further, the minimum ramprate relaxation required for
satisfying the stress constraints keeps increasing. When the stress upper bound is above 175 MPa,
time average thermal efficiency keeps decreasing as the stress upper bound is reduced as shown in
earlier section. However, as the ramprate relaxation keeps increasing, the efficiency goes up again

67
as the average ramprate becomes lower. Corresponding profiles presented in Figure 4.12 make
these trends clear.
(a)
(b) (c)
Figure 4. 12. Comparison of different ramp-down processes with the fixed/relaxed
average ramp rate: (a) power output (b) thermal efficiency (c) HP drum stress at
drum/downcomer junction at Position B
Figures 4.12(a), (b), (c) compare power output, thermal efficiency and HP drum stress at the
junction of the drum and downcomer for various ramprate relaxations when the desired rate is 5%
average ramp down in load per min. For reference, it also includes the case when the stress upper
bound is 175 MPa, where no relaxation is needed. When the stress upper limit is reduced to 165

68
MPa, the multi-objective optimization leads to a minimum relaxation of 0.7% average ramprate,
i.e., about 4.3% time average ramprate. Corresponding results when the ramprate relaxation is
1.7%, i.e., the average ramprate of 3.3%, are also shown. As expected, as ramprate relaxation
increases, it leads to an increase in the efficiency. Table 4.6 shows that compared to the case when
there was no relaxation in ramprate (i.e. the upper limit of stress constraint was 175 MPa), the time
average-thermal efficiency improves by 0.3% and 2.5% when the ramprate relaxation is at its
minimum and at 1.7% for the stress constraint of 165 MPa. The reason for the increase in thermal
efficiency becomes clear by analyzing Figure 4.12(a) that shows that the duration of the initial
slower ramprate keeps increasing as the ramprate is relaxed more, thus leading to a higher
efficiency as shown in Figure 4.12(b).
Table 4. 6. Plant average efficiency under different ramp-down processes with the
fixed/relaxed average ramp rate
Δrampratelower (% load change/min) 0 (mininum) 0.7(mininum) 1.7
Stress constraint (MPa) 175 165 165
Time Average Thermal eff (%) 50.0 50.3 52.5
Figure 4.13 shows the time average thermal efficiency as the ramprate is relaxed more than the
minimum when the stress upper bound is 165 MPa. As expected, a considerably higher time
average efficiency can be obtained by relaxing the ramprate. The study shows that depending on
the operational flexibility on ramprate relaxation, time-average efficiency for the rampdown
operation can be improved.
Figure 4.14 shows the minimum relaxation in the rampup rate required as the stress lower bound
is changed when the desired time average rampup rate is 5% per minute. As presented in the
previous section, ramprate does not need to be relaxed when the lower bound of stress is below -
70 MPa. As the lower bound on stress is increased above -70 MPa, the minimum relaxation in the
ramprate required for satisfying the stress constraints keeps increasing. As shown in an earlier
section, with the increase in the lower bound on stress, the time average thermal efficiency keeps
dropping since a slower ramprate is required towards the end of the ramp to avoid violating the
stress constraint. This trend continues with further tightening of the stress constraint leading to a
steeper fall in the efficiency.

69
Figure 4. 13. Effect of ramprate relaxation on time average efficiency for ramp down
when stress upper bound of 165 MPa and desired ramprate is 5% load change per min
Figure 4. 14. Effect of the stress lower bound on the minimum ramprate relaxation and
time average thermal efficiency for a desired rate of 5% rampup per minute
Figures 4.15 (a), (b), (c) compare power output, thermal efficiency and HP drum stress at the
drum/downcomer junction for two values of stress lower bound, -70 MPa, when no relaxation is
needed, and -60 MPa, when the minimum relaxation is about 0.7%. It is observed that at the
beginning of rampup, the rate of increase is similar for both cases while the slope becomes less

70
steep when the stress lower bound is -60 MPa leading to a loss in efficiency of 0.3% compared to
the case with lower bound of -70 MPa. As noted earlier, for ramp up, even though the ramprate is
relaxed further and a single objective optimization problem is solved, the results do not change
from that obtained when relaxation is the minimum since the minimum ramparte relaxation leads
to the maximum efficiency while ramping up.
(a)
(b) (c)
Figure 4. 15. Comparison of different ramp-up processes with the fixed/relaxed
average ramp rate: (a) power output (b) plant thermal efficiency (c) HP drum stress at
drum/downcomer junction at Position B

71
Optimal process analysis
Under the load-following condition, spray flow rate at HP SH2/RH ATT can be optimized to not
only maintain the main and reheat steam temperature within the saturation constraint but also
achieve a higher efficiency than the case using traditional coordinated control system. However,
the effect of attemperator spray flowrate on the HP drum pressure variation and stress transient is
limited.
Using a nonlinear load-following profile, rather than the conventional linear profile, provides the
additional flexibility to not only satisfy the drum stress constraint but also obtain a higher plant
efficiency. A higher ramp rate is conducive for the ramp-up process, while a lower ramp rate is
beneficial for the ramp-down process because of the increase in the efficiency at higher plant load
and efficiency.
The tightened stress constraint requires a lower average ramp rate to prevent the stress violation.
For the ramp down process, the multi-objective optimization can help to obtain the minimum
deviation from the desired average ramp rate while maximizing the efficiency. When the average
ramp rate can be further relaxed, the trade-off between load-following deviation and transient
efficiency loss is nonlinear. for the ramp up process, the single-objective optimization is sufficient
to maximize the efficiency since minimal deviation from the desired ramprate is automatically
achieved.
4.5. Conclusion
The HP drum fatigue damage is estimated by considering the through-wall temperature transients
and thermo-mechanical stress evolutions in the HP drum. Multiple locations at the drum-
downcomer junction are monitored and the most stressed part is identified as the constraint in the
dynamic optimization of the load-following operation.
It was observed that the maximum circumferential stress amplitude occurs at the edge of the
drum/downcomer junction. The spray flow rate at HP SH2/RH ATT can be optimized to not only
satisfy the saturation constraint of the main and reheat steam temperature but also to achieve a
higher efficiency than the traditional coordinated control system.
Several sensitivity studies were conducted by ramping down the load from 100% to 25% then back
to 100% at a desired average ramprate of 5% load change per minute. When the stress constraint
72
is not considered, dynamic optimization lead to about 1.4% and 1.1% improvements in time
average efficiency for ramp-down and ramp-up respectively compared to the conventional linear
profile. Sensitivities to a number of upper and lower bounds on stress constraints were evaluated
where ramprate relaxation was not required for satisfying stress constraints. While ramping down,
dynamic optimization lead to about a 1% improvement in time average thermal efficiency
compared to the linear profile even if the stress upper bound was set at the same value as the linear
profile. When the stress upper bound was changed from 200 MPa to 175 MPa, optimal time
average thermal efficiency dropped by about 1.7% during ramping down. While ramping up,
optimization also lead to about a 1% improvement in time average thermal efficiency compared
to that using the linear profile, even though the lower bound of stress is same to that reached by
the linear profile. When the stress upper bound was changed from -95 MPa to -70 MPa, optimal
time average thermal efficiency dropped by about 0.3% during ramping up. Sensitivity studies
were also conducted by tightening stress constraints further when the multi-objective optimization
problem was solved while ramping down to minimize relaxation in the stress constraint while
maximizing efficiency. It was observed that relaxing the ramprate more than the minimum lead to
an increase in the time average efficiency. While ramping up, it was observed that as the lower
bound on stress is increased beyond a threshold, the minimum relaxation in the ramprate kept
increasing and the time average thermal efficiency kept dropping. Compared to the case when the
stress lower bound was -70 MPa, where no relaxation was needed, the time average efficiency was
0.3% lower for the case when the stress lower bound was -60 MPa, where the minimum ramprate
relaxation was about 0.7%.
The study shows that the industry standard linear profile can not only lead to lower efficiency but
can violate the stress constraints depending on the desired ramprate as well as upper and lower
bounds on the constraints. The multi-objective dynamic optimization approach can play a critical
role for load trajectory optimization not only for maximizing efficiency during load-following but
also for avoiding violation of stress constraints at critical locations and for avoiding spraying to
saturation. The study also shows that there is strong tradeoff between the relaxation in ramprate
and the time- average thermal efficiency.
73
Chapter 5. Optimal load-following of NGCC plant with stress monitoring of
both HP drum and superheater/reheater
5.1. Literature review
Besides the thick-walled HP drum, superheater (SH) and reheater (RH) are also the vulnerable
components in NGCC plant under the load-following. Both SH and RH sections are particularly
susceptible to overheating during part load operation (Modliński et al., 2019; Jackson et al., 2019).
The creep rupture failure of SH/RH tubes caused by overheating is a major cause of forced outages
of power plants (Viswanathan et al., 2014). This would be expected by looking at the creep rupture
data shown in Appendix B for a typical material of construction for SH/RH tubes (Bendick et al.,
2010). As the temperature keep increasing, the expected rupture time can reduce considerably
even at a lower stress magnitude. In order to avoid overheating and resulting creep rupture in the
SH/RH, it is crucial to maintain the final main/reheat steam temperature during load-following.
The cracking of SH headers at ligament locations (header-tube junctions) caused by severe
temperature fluctuation and thermal transient is another important issue for fossil power plants.
Brevus et al. (2014) evaluated the probability of fracture for the superheater collector by
considering the shape factor and fatigue crack depth on the inner surface. The stress calculation of
SH header with tube holes is required for the development of fatigue crack model. One way is
using a stress transfer function (Chen et al., 1993; Rosario et al., 1995). It can convert measured
temperatures, pressures and flowrates into stresses without a thermo-mechanical stress model.
Another approach is through development of detailed finite element method (FEM) model of
thermo-mechanical stress distribution in the SH header with tube holes (Mukhopadhyay et al.,
2001; Kwon et al., 2006; Yasniy et al., 2016 and 2017). The first approach is unit dependent and
large amount of operating data are required to determine the transfer function parameters. The
FEM models show the high accuracy in stress analysis, but they are computationally expensive
and intractable for the dynamic optimization of the plant operation. Therefore, the similar stress
calculation approach for drum-downcomer junction shown in Chapter 4 would be used for SH/RH
header-tube junction.
In the literature, ligament cracking in superheater headers is either associated with thermal
transients that occur during startup/ shutdown (Rosario et al., 1995) or under the fluctuations at
steady state operation (Kwon et al., 2006; Yasniy et al., 2016 and 2017). Few works in the literature

74
on the effect of load-following operation on the SH section. Madejski and Taler (2013) conducted
a thermo-mechanical stress analysis of the superheater tubes under transient operation. It was
observed that a large amount of spray in the attemperator can lead to high stress variation in
superheater section due to fast steam cooling. Therefore, the impact of steam attemperation under
the fast load-following on the SH/RH fatigue cracking should be further investigated.
In this chapter, SH/RH transient performances under the load-following operation are evaluated.
Multiple location in SH/RH sections are monitored and the most stressed location is identified.
Dynamic optimization of the load-following operation under plant-wide equipment stress
constraints, including drum and SH/RH stress constraints, is formulated. Transient responses of
the optimal load-following processes under different stress constraints are investigated and
compared with the conventional linear operation using coordinated control system (CCS).
5.2. SH/RH geometry and stress monitoring location
5.2.1 SH/RH geometry
Table 1 lists the SH/RH geometry and material. Grade 91 steel (SA-213 T-91) is widely used for
the high temperature components of boiler, such as HP SH and IP RH (Bendick et al., 2010). The
SH/RH wall thickness is also determined using EN 12952-3 Standard (2011) with consideration
of internal pressure, equipment geometry as well as material properties. Due to the higher
operating pressure, HP SH section has a larger wall thickness, which leads to higher thermal stress.
Table 5. 1. HP SH/IP RH geometry and material
Outer Diameter(mm) Wall Thickness(mm) Material
HP SH Tube A/B 38 5.08 SA-213 T-91
HP SH Header A/B 216 44.45 SA-335 P-91
IP RH Tube A/B 51 3.05 SA-213 T-91
IP RH Header A/B 324 21.44 SA-335 P-91
5.2.2 SH/RH junction stress monitoring under the load-following operation
Due to the stress concentration caused by component discontinuity, SH/RH header-tube junctions
experience much higher stress variation than SH/RH tubes under the load-following operation.
Two specific locations on the edge of header-tube joint are considered. As shown in Figure 5.1,

75
Position A is located in the axial direction of header and Position B is located in the tangential
direction. The details about the header-tube junction stress calculation have been discussed in
previous Section 4.2.3
Figure 5. 1 Schematic of SH/RH header-tube junction
Also, NGCC plant with two-stage attemperation and parallel configuration of the SH and RH is
adopted for load-following operation and SH/RH stress analysis. As shown in Figure 5.2, the
transient response of SH/RH header-tube junction at eight locations of HRSG are monitored for
the equipment health analysis.
Figure 5. 2. Different locations for SH/RH head-tube junction stress monitoring

76
Similar to Chapter 4, following load following operation is simulated for the results presented
below. The plant load starts ramping down at 1st hr from 100% to 25% at 5% load change per min,
stays at 25% load for 4 hr 45 min, then ramps up to 100% at a constant ramp rate of 5% load
change per min. The total simulation time is 12 hr. The ramp operation mimics a situation where
the fossil-fired power load is brought to the minimum load when solar energy becomes available
and then rises back up again as the solar energy becomes unavailable. Obviously, how long the
plant stays at the lowest load will depend on a specific region and a particular day, but the transients
of interest mainly takes place during ramp up and down as shown in the following study.
The typical linear operation using industrial coordinate control system (CCS) is denoted as
‘Linear’ in the results presented below. The results from the dynamic optimization is denoted as
‘Optimal’. In the ‘Linear’ operation, the ramprate is constant, (i.e. linear) and due to the sliding
pressure operation of the plant, the pressure decreases with the decrease in the load or vice versa
during the increase in load.
5.3. Dynamic optimization
Since the SH/RH header-tube junction stress at different locations are monitored under the load-
following, all the locations with large stress amplitude leading to fatigue damage can be identified.
Then stress constraints of SH and RH at one or more vulnerable locations are added into the
dynamic optimization formulation shown in Chapter 4 to generate a new dynamic optimization
problem with plant-wide equipment stress constraints.
In Equation 5.1, the objective and most of constraints are the same with those in Equation 4.28.
Seventh and eighth constraints denote the SH and RH header-tube junction stresses.
max𝑢
∫ 𝜂𝑡ℎ𝑑𝑡
𝑡𝑓𝑖𝑛𝑡𝑖𝑛𝑖
𝑡𝑓𝑖𝑛−𝑡𝑖𝑛𝑖 (5.1)
𝑠. 𝑡. 𝑓(𝑥, 𝑦, 𝑢) ≤ 0 𝑥, 𝑦, 𝑢 ∈ 𝑅𝑛
𝑇𝑠𝑝,𝑀𝑆 −△ 𝑇𝑀𝑆 ≤ 𝑇𝑀𝑆 ≤ 𝑇𝑠𝑝,𝑀𝑆 +△ 𝑇𝑀𝑆
𝑇𝑠𝑝,𝑅𝑆 −△ 𝑇𝑅𝑆 ≤ 𝑇𝑅𝑆 ≤ 𝑇𝑠𝑝,𝑅𝑆 +△ 𝑇𝑅𝑆
𝑇𝑆𝐻,𝑖 ≥ 𝑇𝑑𝑒𝑤,𝑆𝐻,𝑖 +△ 𝑇𝑑𝑒𝑤,𝑆𝐻
𝑇𝑅𝐻,𝑖 ≥ 𝑇𝑑𝑒𝑤,𝑅𝐻,𝑖 +△ 𝑇𝑑𝑒𝑤,𝑅𝐻
𝜎𝑑𝑟𝑢𝑚,𝑙𝑜𝑤𝑒𝑟 ≤ 𝑚𝑎𝑥𝑎𝑚𝑝 (𝜎𝐻𝑃 𝑑𝑟𝑢𝑚) ≤ 𝜎𝑑𝑟𝑢𝑚,𝑢𝑝𝑝𝑒𝑟

77
𝝈𝑺𝑯,𝒍𝒐𝒘𝒆𝒓 ≤ 𝒎𝒂𝒙𝒂𝒎𝒑 (𝝈𝑺𝑯) ≤ 𝝈𝑺𝑯,𝒖𝒑𝒑𝒆𝒓
𝝈𝑹𝑯,𝒍𝒐𝒘𝒆𝒓 ≤ 𝒎𝒂𝒙𝒂𝒎𝒑 (𝝈𝑹𝑯) ≤ 𝝈𝑹𝑯,𝒖𝒑𝒑𝒆𝒓
𝑛% 𝑙𝑜𝑎𝑑 𝑐ℎ𝑎𝑛𝑔𝑒𝑑𝑒𝑠𝑖𝑟𝑒𝑑
𝑚𝑖𝑛−△ 𝑟𝑎𝑚𝑝𝑟𝑎𝑡𝑒𝑙𝑜𝑤𝑒𝑟 ≤ 𝑟𝑎𝑚𝑝𝑟𝑎𝑡𝑒𝑎𝑣𝑒 ≤
𝑛% 𝑙𝑜𝑎𝑑 𝑐ℎ𝑎𝑛𝑔𝑒𝑑𝑒𝑠𝑖𝑟𝑒𝑑
𝑚𝑖𝑛
𝐿𝑜𝑎𝑑 (𝑡 = 𝑡𝑓𝑖𝑛) = 𝐿𝑜𝑎𝑑𝑑𝑒𝑠𝑖𝑟𝑒𝑑(𝑡 = 𝑡𝑓𝑖𝑛)
where σ is the stress at the junction part, ‘SH’ and ‘RH’ denote superheater and reheater section,
respectively.
Similar to Chapter 4, a multi-objective optimization is also formulated by appending SH and RH
header-tube junction stresses to the Lexicographic optimization approach for cases when the ramp
rate needs to be relaxed.
Stage 1 optimization:
min𝑢
△ 𝑟𝑎𝑚𝑝𝑟𝑎𝑡𝑒𝑙𝑜𝑤𝑒𝑟 (5.2)
𝑠. 𝑡. 𝑓(𝑥, 𝑦, 𝑢) ≤ 0 𝑥, 𝑦, 𝑢 ∈ 𝑅𝑛
𝑇𝑠𝑝,𝑀𝑆 −△ 𝑇𝑀𝑆 ≤ 𝑇𝑀𝑆 ≤ 𝑇𝑠𝑝,𝑀𝑆 +△ 𝑇𝑀𝑆
𝑇𝑠𝑝,𝑅𝑆 −△ 𝑇𝑅𝑆 ≤ 𝑇𝑅𝑆 ≤ 𝑇𝑠𝑝,𝑅𝑆 +△ 𝑇𝑅𝑆
𝑇𝑆𝐻,𝑖 ≥ 𝑇𝑑𝑒𝑤,𝑆𝐻,𝑖 +△ 𝑇𝑑𝑒𝑤,𝑆𝐻
𝑇𝑅𝐻,𝑖 ≥ 𝑇𝑑𝑒𝑤,𝑅𝐻,𝑖 +△ 𝑇𝑑𝑒𝑤,𝑅𝐻
𝜎𝑑𝑟𝑢𝑚,𝑙𝑜𝑤𝑒𝑟 ≤ 𝑚𝑎𝑥𝑎𝑚𝑝 (𝜎𝐻𝑃 𝑑𝑟𝑢𝑚) ≤ 𝜎𝑑𝑟𝑢𝑚,𝑢𝑝𝑝𝑒𝑟
𝜎𝑆𝐻,𝑙𝑜𝑤𝑒𝑟 ≤ 𝑚𝑎𝑥𝑎𝑚𝑝 (𝜎𝑆𝐻) ≤ 𝜎𝑆𝐻,𝑢𝑝𝑝𝑒𝑟
𝜎𝑅𝐻,𝑙𝑜𝑤𝑒𝑟 ≤ 𝑚𝑎𝑥𝑎𝑚𝑝 (𝜎𝑅𝐻) ≤ 𝜎𝑅𝐻,𝑢𝑝𝑝𝑒𝑟
𝑛% 𝑙𝑜𝑎𝑑 𝑐ℎ𝑎𝑛𝑔𝑒𝑑𝑒𝑠𝑖𝑟𝑒𝑑
𝑚𝑖𝑛−△ 𝑟𝑎𝑚𝑝𝑟𝑎𝑡𝑒𝑙𝑜𝑤𝑒𝑟 ≤ 𝑟𝑎𝑚𝑝𝑟𝑎𝑡𝑒𝑎𝑣𝑒 ≤
𝑛% 𝑙𝑜𝑎𝑑 𝑐ℎ𝑎𝑛𝑔𝑒𝑑𝑒𝑠𝑖𝑟𝑒𝑑
𝑚𝑖𝑛
𝐿𝑜𝑎𝑑 (𝑡 = 𝑡𝑓𝑖𝑛) = 𝐿𝑜𝑎𝑑𝑑𝑒𝑠𝑖𝑟𝑒𝑑(𝑡 = 𝑡𝑓𝑖𝑛)
Stage 2 optimization:
max𝑢
∫ 𝜂𝑡ℎ𝑑𝑡
𝑡𝑓𝑖𝑛𝑡𝑖𝑖𝑛
𝑡𝑓𝑖𝑛−𝑡𝑖𝑛𝑖 (5.3)
𝑠. 𝑡. 𝑓(𝑥, 𝑦, 𝑢) ≤ 0 𝑥, 𝑦, 𝑢 ∈ 𝑅𝑛
𝑇𝑠𝑝,𝑀𝑆 −△ 𝑇𝑀𝑆 ≤ 𝑇𝑀𝑆 ≤ 𝑇𝑠𝑝,𝑀𝑆 +△ 𝑇𝑀𝑆
𝑇𝑠𝑝,𝑅𝑆 −△ 𝑇𝑅𝑆 ≤ 𝑇𝑅𝑆 ≤ 𝑇𝑠𝑝,𝑅𝑆 +△ 𝑇𝑅𝑆

78
𝑇𝑆𝐻,𝑖 ≥ 𝑇𝑑𝑒𝑤,𝑆𝐻,𝑖 +△ 𝑇𝑑𝑒𝑤,𝑆𝐻
𝑇𝑅𝐻,𝑖 ≥ 𝑇𝑑𝑒𝑤,𝑅𝐻,𝑖 +△ 𝑇𝑑𝑒𝑤,𝑅𝐻
𝜎𝑑𝑟𝑢𝑚,𝑙𝑜𝑤𝑒𝑟 ≤ 𝑚𝑎𝑥𝑎𝑚𝑝 (𝜎𝐻𝑃 𝑑𝑟𝑢𝑚) ≤ 𝜎𝑑𝑟𝑢𝑚,𝑢𝑝𝑝𝑒𝑟
𝜎𝑆𝐻,𝑙𝑜𝑤𝑒𝑟 ≤ 𝑚𝑎𝑥𝑎𝑚𝑝 (𝜎𝑆𝐻) ≤ 𝜎𝑆𝐻,𝑢𝑝𝑝𝑒𝑟
𝜎𝑅𝐻,𝑙𝑜𝑤𝑒𝑟 ≤ 𝑚𝑎𝑥𝑎𝑚𝑝 (𝜎𝑅𝐻) ≤ 𝜎𝑅𝐻,𝑢𝑝𝑝𝑒𝑟
𝑛% 𝑙𝑜𝑎𝑑 𝑐ℎ𝑎𝑛𝑔𝑒𝑑𝑒𝑠𝑖𝑟𝑒𝑑
𝑚𝑖𝑛−△ 𝑟𝑎𝑚𝑝𝑟𝑎𝑡𝑒𝑙𝑜𝑤𝑒𝑟,𝑚𝑖𝑛 ≤ 𝑟𝑎𝑚𝑝𝑟𝑎𝑡𝑒𝑎𝑣𝑒 ≤
𝑛% 𝑙𝑜𝑎𝑑 𝑐ℎ𝑎𝑛𝑔𝑒𝑑𝑒𝑠𝑖𝑟𝑒𝑑
𝑚𝑖𝑛
𝐿𝑜𝑎𝑑 (𝑡 = 𝑡𝑓𝑖𝑛) = 𝐿𝑜𝑎𝑑𝑑𝑒𝑠𝑖𝑟𝑒𝑑(𝑡 = 𝑡𝑓𝑖𝑛)
5.4. Results and discussion
5.4.1. Optimal process under a constant average ramp rate neglecting stress constraint
In this section, the results of SH/RH from the dynamic optimization are generated by neglecting
all stress constraints. For the conventional linear load-following approach, the constraints
including the SH/RH steam temperature while avoiding spraying to saturation could be satisfied
as well. We found that dynamic optimization leads to a higher thermal efficiency than the linear
operation mainly due to less total spray at attemperator (ATT). Here, only stress amplitudes of
SH/RH header-tube junctions are summarized in Table 5.2.
Table 5.2 shows that due to the large wall thickness and thermal stress, SH sections generally
experience larger stress amplitude than RH sections. Specifically, since large amount of spray is
used at ATT located at the inlet of SH, the header-tube junctions at SH inlets are the most stressed
components. On the other hand, since the final steam temperature are well maintained, the SH(B)
outlet experiences the small stress amplitude, which is mainly subjected to mechanical stress.
Unlike the drum, both Positions A and B at header-tube junction can be vulnerable one depending
on whether the thermal stress is intensified or compensated by mechanical stress.
Figure 5.3(a) shows that the profile of SH(A) inlet steam temperature under dynamic optimization
is considerably different compared to the linear operation. In fact, the SH(A) inlet steam
temperature rises slightly under dynamic optimization instead of decreasing as observed in the
linear operation. As a result, the SH(A) inlet experiences smaller stress amplitude for dynamic
optimization as shown in Figure 5.3 (c) and (d). Figure 5.3(b) compares the steam pressure profile

79
between the linear and optimal load-following. It is observed that during low load, the steam
pressure is slightly higher under dynamic optimization.
Table 5. 2. Stress at SH/RH header-tube junction under load-following
Linear operation
using CCS
Dynamic optimization
without stress constraint
𝑚𝑎𝑥 (𝜎𝑎𝑚𝑝)
(MPa) Most stressed part
𝑚𝑎𝑥 (𝜎𝑎𝑚𝑝)
(MPa) Most stressed part
RH(A) inlet 108 Position B 53 Position A
RH(A) outlet 64 Position A 68 Position A
RH(B) inlet 189 Position B 223 Position B
RH(B) outlet 36 Position A 30 Position A
SH(A) inlet 369 Position B 221 Position A
SH(A) outlet 174 Position A 211 Position B
SH(B) inlet 551 Position B 595 Position B
SH(B) outlet 52 Position A 46 Position A
It should be noted that SH(A) inlet steam temperature shows an initial overshoot under dynamic
optimization as the load is ramped up as shown in Figure 5.3(a). The main reason for this is due to
the considerably faster dynamics of GT compared to the steam cycle. As the load is ramped up,
the temperature of flue gas going through final SH(B) rises fast compared to the slow rise in the
steam flowrate due to the large thermal holdup of the tubes and other solids. It should be noted
that even though the steam temperature at the inlet of SH(A) rises, it still remains lower than the
limiting temperature of 850 K for the corresponding materials of construction (MOC).
Figure 5.4 (a) and (b) show that there is slightly lesser change in the steam temperature and
pressure at SH(B) inlet due to dynamic optimization. Figure 3(c) and (d) show that the there is
only a minor difference in the stress profile between the linear approach and dynamic optimization
for all locations evaluated.
Table 5.3 shows the maximum and minimum stress as well as stress amplitude under linear
operation and dynamic optimization both at SH(A) and SH(B) inlet for position A and B at the
header/tube junction. It shows that while the header-tube junctions at the inlet of SH(A)
experiences lower stress under dynamic optimization, header-tube junctions at SH(B) inlet
experiences higher stress. It can be noted that for the study presented in this section no constraint
with respect to stress is considered in the dynamic optimization.

80
(b) (b)
(c) (d)
Figure 5. 3. SH(A) inlet performance under the load-following (a) steam temperature
(b) steam pressure (c) stress at Position A of junction(d) stress at Position B of junction
Table 5. 3. Maximum and minimum Stress and stress amplitude at SH inlet header-
tube junction under load-following
Linear operation
using CCS
Dynamic optimization
without stress constraint σ (MPa) Position A Position B Position A Position B
SH (A) inlet
𝜎𝑚𝑎𝑥 287 217 203 115
𝜎𝑚𝑖𝑛 -64 -151 -18 -75
𝜎𝑎𝑚𝑝 351 369 221 190
SH (B) inlet
𝜎𝑚𝑎𝑥 380 327 386 333
𝜎𝑚𝑖𝑛 -162 -223 -197 -262
𝜎𝑎𝑚𝑝 542 551 583 595

81
(a) (b)
(c) (d)
Figure 5. 4. SH(B) inlet performance under the load-following (a) steam temperature
(b) steam pressure (c) stress at Position A of junction(d) stress at Position B of junction
5.4.2. Optimal process when the drum stresses are limiting
The results presented in this subsection correspond to the cases when the drum stress is limiting,
i.e. those presented in Section 4.4.2. As presented earlier, as the stress upper and lower limits are
tightened, relaxing the ramp rate becomes necessary for satisfying the stress constraints. The most
stressed SH part at the SH(B) inlet junction Position B is evaluated. Therefore, results are presented
only for that location.
Optimal ramp-down process with different stress constraints

82
Figure 5.5 (a), (b) and (c) show the linear and optimal profiles of plant power, SH(B) inlet steam
temperature and stress at junction Position B, respectively, under ramp down operation. For the
linear profile, the maximum drum stress reached is 191 MPa, while for dynamic optimization,
following drum stress limits are considered: 200, 191, 175, and 165 MPa. It can be noted that when
the drum stress limit is set to 165 MPa, ramp rate relaxation becomes necessary. It can be observed
that there is considerable difference in the steam temperature profiles and stress profiles at SH(B)
inlet between the linear and optimal profiles and among the optimal profiles depending on the
drum stress limit.
(a)
(b) (c)
Figure 5. 5. Linear and optimal profiles under different drum stress constraints for 5%
average ramp down in load per min: (a) power output, (b) SH(B) inlet steam temperature,
(c) stress at SH(B) inlet junction Position B

83
Figure 5.5(c) shows that the linear operation leads to the similar stress magnitude at SH(B) inlet
junction as the optimal case with maximum drum stress upper bound. When the drum stress upper
bound keeps decreasing, the maximum stress at SH(B) inlet junction decreases. In fact, the stress
evolution depends on the load transition. Figure 5.5 (a) and (b) indicate that no matter the average
ramprate is fixed or relaxed, when the real-time ramp rate is higher, the steam temperature transient
is more aggressive. Correspondingly, the stress at the junction rises more quickly since the larger
thermal stress is induced by the larger temperature gradient.
Table 5.4 lists the maximum stress magnitude at SH(B) inlet junction under the different drum
stress upper bounds. It can be observed in Table 5.4 and Figure 5.5(c) that as the maximum drum
stress is lowered, it also leads to lower maximum stress at the SH(B) inlet junction. It can be noted
that depending on the upper stress bound of SH(B) inlet junction, it can be the limiting stress
during load-following operation. This aspect is evaluated in the following sections.
Table 5. 4. SH inlet header-tube junction stress under different ramp-down processes
Linear Optimal
Drum stress upper bound (MPa) 191 200 191 175 165
Maximum stress at SH(B) inlet junction (MPa) 327 333 295 231 189
Optimal ramp-up process with different stress constraints
Figures 5.6 (a), (b) and (c) show the linear and optimal profiles of plant power, SH(B) inlet steam
temperature and stress at junction Position B, respectively, under ramp up operation. It can be
observed that while there are considerable differences in the SH(B) inlet temperature between the
linear and optimal profiles, there is not much differences in the SH(B) inlet temperature profiles
under dynamic optimization for all drum stress bounds that are evaluated. As a result, there is not
much difference in the stress profiles under dynamic optimization as seen in Figure 5.6(c).
However, it is interesting to note that the dynamic optimization when the drum stress is limiting,
it also led to a much lower value of stress compared to the linear operation.
Table 5.5 lists the minimum stress (i.e. maximum magnitude of compressive stress) at SH(B) inlet
junction under linear operation and under different drum stress lower bounds. As the stress is
compressive, the high magnitude is not acceptable. Therefore, it is important to consider the SH(B)
inlet junction stress constraint for optimizing the ramp-up operation.

84
(a)
(b) (c)
Figure 5. 6. Comparison of linear and optimal profiles under different drum stress
constraints for 5% average ramp up in load per min: (a) power output, (b) SH(B) inlet
steam temperature, (c) stress at SH(B) inlet junction Position B
Table 5. 5. SH inlet header-tube junction stress under different ramp-up processes
Linear Optimal
Drum stress lower bound (MPa) -82 -95 -82 -70 -60
Minimum stress at SH(B) inlet junction (MPa) -223 -262 -262 -262 -262

85
5.4.3. Optimal operation when the SH stresses are limiting
The optimal results presented in this section are for the cases when SH stresses are limiting
including those when the ramp relaxation may or may not be necessary. It should be noted that
when SH constraints are satisfied, RH constraints are also satisfied due to a lesser thermal stress
in RH. The linear operation is included for comparison.
Optimal ramp-down process with different stress constraints
(a) (b)
(c) (d)
Figure 5. 7. Linear and optimal profiles under different equipment stress constraints for
ramp-down process: (a) power output (b) thermal efficiency (c) stress at HP drum junction
Position B (d) stress at SH(B) inlet junction Position B

86
Three different optimal cases are simulated here for ramp-down process. In Case 1, the drum and
SH stress upper bounds are set to 191 MPa and 327 MPa, respectively. The stress bounds are set
at the same value as the maximum stress under the linear operation. This case is included here only
for comparison of the results. In Case 2, the drum and SH stress upper bounds are set to 191 MPa
and 260 MPa, respectively. In Case 3, the drum and SH stress upper bounds are set to 170 MPa
and 210 MPa, respectively. It should be noted that SH is made from the alloy steel T/P 91 with
higher tensile and yield strength than carbon steel SA516 Grade 70 used for drum (Bendick et al.,
2010; EPRI, 2005 and 2006). Therefore, stress bounds are higher for the SH materials.
Figure 5.7 (a), (b), (c) and (d) show the linear and optimal profiles of plant power, plant thermal
efficiency, stress at drum junction and stress at SH(B) inlet junction, respectively, under ramp
down operation for all three cases. Figure 5.7 (a) and (b) show considerable difference in the load-
following profiles and thermal efficiency depending on the equipment stress limit. As the drum/SH
stress is lowered, it leads to lower thermal efficiency.
Table 5. 6. Comparison of linear and optimal ramp-down profiles under different
equipment stress constraints
Linear Optimal
Stress upper bound at drum
junction (MPa) Na 191 191 170
Stress upper bound at SH(B)
inlet junction (MPa) Na 327 260 210
Time average thermal
efficiency (%) 50.3 51.3 50.9 50.1
Maximum stress at drum
junction (MPa) 191
191
(active) 186
170
(active)
Maximum stress at SH(B) inlet
junction (MPa) 327 295
260
(active)
210
(active)
Δrampratelower
(% load change/min) 0 0 0 0.5
Table 5.6 lists the thermal efficiency and maximum equipment stress magnitude as well as average
ramprate relaxation under the different equipment stress upper bound constraints.
For the linear profile, the maximum drum stress is 191 MPa and maximum SH stress is 327 MPa.
In Case 1, the drum stress is still limiting and dynamic optimization leads to about 1% higher
efficiency than the linear profile. In Case 2, the SH stress becomes active constraint and leads to a

87
lower thermal efficiency than the optimal profile obtained in Case 1, but it is still higher than the
linear operation by 0.6%. In Case 3, both drum stress and SH stress become limiting. The thermal
efficiency is lower than the linear operation by 0.2% due to the lower stress upper bound. For this
case, even though the ramp rate is high at the beginning of ramp down, the ramprate becomes
considerably small towards the end leading to an overall ramprate relaxation of about 0.5% for
satisfying the stress constraints.
Optimal ramp-up process with different stress constraints
Similar to the ramp-down process, three different optimal cases are simulated here for the ramp-
up. In Case 1, the drum and SH stress lower bounds are set to -82 MPa and -262 MPa, respectively.
This case is included here only for comparison as the result under the limiting drum stress. In Case
2, the drum and SH stress lower bounds are set to -82 MPa and -223 MPa, respectively. The stress
bounds are set at the same value as the minimum stress under the linear operation. In Case 3, the
drum and SH stress lower bounds are set to -82 MPa and -150 MPa, respectively. Also, stress
bounds are lower for the SH materials due to the higher alloy steel strength (Bendick et al., 2010;
EPRI, 2005 and 2006).
Figure 5.8 (a), (b), (c) and (d) show the linear and optimal profiles of plant power, plant thermal
efficiency, stress at drum junction and stress at SH(B) inlet junction, respectively, under ramp-up
operation for all three cases. Even though the minimum drum stresses (i.e. maximum magnitude
of compressive stress) are same for linear and optimal process shown in Figure 5.8 (c), the load-
following profiles and corresponding thermal efficiency shown in Figure 5.8 (a) and (b) are varied
depending on the different SH stress lower bounds shown in Figure 5.8 (d). As the SH stress lower
bound increases, it leads to lower thermal efficiency.
Table 5.7 lists the thermal efficiency and minimum equipment stress as well as average ramprate
relaxation under the different equipment stress lower bound constraints.
For the linear profile, the minimum drum stress is -82 MPa and minimum SH stress is -223 MPa.
In Case 1, the drum stress is still limiting and dynamic optimization leads to about 1.3% higher
efficiency than the linear profile. However, the minimum SH stress reaches -262 MPa and it is
lower than the linear operation. In Case 2, the SH lower bound of -223 MPa is same as linear
operation. Both drum and SH stress constraint are active constraints and lead to a lower thermal

88
efficiency than the optimal profile obtained in Case 1, but it’s still higher than the linear operation
by 0.8%. In Case 3, both drum stress and SH stress are limiting constraints. Since the SH lower
bound increases to -150 MPa, a lower ramprate is required in the early stage of ramp-up process
leading to an overall ramprate relaxation of about 0.7% for satisfying the stress constraints. Also,
the thermal efficiency is even lower than the linear operation by 0.1%.
(a) (b)
(c) (d)
Figure 5. 8. Linear and optimal profiles under different equipment stress constraints for
ramp-up process: (a) power output (b) thermal efficiency (c) stress at HP drum junction
Position B (d) stress at SH(B) inlet junction Position B

89
Table 5. 7. Comparison of linear and optimal ramp-up profiles under different
equipment stress constraints
Linear Optimal
Stress lower bound at drum
junction (MPa) Na -82 -82 -82
Stress lower bound at SH(B)
inlet junction (MPa) Na -265 -223 -150
Time average thermal
efficiency (%) 53.2 54.5 54 53.1
Minimum stress at drum
junction (MPa) -82
-82
(active)
-82
(active)
-82
(active)
Minimum stress at SH(B) inlet
junction (MPa) -223 -262
-223
(active)
-150
(active)
Δrampratelower
(% load change/min) 0 0 0 0.7
5.4. Conclusion
In order to avoid overheating and resulting creep rupture in the SH/RH, it is crucial to maintain
the final main/reheat steam temperature under the load-following operation. Since a large amount
of boiler feed water spray is required in the attemperator, located at the inlet of SH/RH, during the
transient, the fast steam cooling leads to the large stress amplitude at the SH/RH inlet header-tube
junction. Due to the higher operation pressure, SH has a larger wall thickness and higher thermal
stress. In other words, SH stress rather than RH stress would be the limiting constraint in dynamic
optimization.
Depending on the stress constraints in the drum and SH, the limiting constraint can change. It was
observed that when SH stress constraint was not considered or the SH stress bound was large, the
stress constraints are limiting and the obtained optimal trajectories correspond to the cases in
Chapter 4. Then the resulting stress magnitude in the SH section can be high and may not be
acceptable. When the drum stress upper limits for ramp-down are lowered, it leads to lower stress
in the SH section as well. For ramp-up process, the different drum stress lower limits lead to the
same minimum SH stress. The magnitude of SH compressive stress is high so that it is important
to consider the SH stress constraint for optimizing the ramp-up operation.
For ramp-down process, three sensitivity studies with different SH stress constraints were
conducted, and the drum constraint is set at the same/lower value as the linear profile. In Case 1,

90
SH stress and drum stress constraint are set at the values of 327MPa and 191MPa, respectively,
which are the same as the linear operation. It was observed that drum stress is limiting constraint
and dynamic optimization leads to about 1% higher efficiency than the linear profile. In Case 2,
the drum stress constraint is same as Case 1 and SH stress upper bound decreases to 260 MPa.
Then, SH stress becomes the active constraint and leads to a lower thermal efficiency than the
optimal profile obtained in Case 1, but it is still higher than the linear operation by 0.6%. In Case
3, drum stress and SH stress decrease to 170MPa and 210MPa, respectively. Both stresses are the
limiting constraints. The thermal efficiency is even lower than the linear operation by 0.2% and an
overall ramprate relaxation of about 0.5% is required for satisfying the stress constraints.
Similarly, three sensitivity studies with different SH stress lower bounds were conducted for ramp-
up process, and the drum lower bound is set at the same value of -82 MPa as the linear profile. In
Case 1, SH stress constraint is set at the values of -265MPa and drum stress is limiting. Dynamic
optimization leads to about 1.3% higher efficiency than the linear profile. In Case 2, the SH lower
bound is set at the same value of -223 MPa as linear operation. Both drum and SH stress constraint
are limiting and thermal efficiency is lower than that in Case 1, but it’s still higher than the linear
operation by 0.8%. In Case 3, SH lower bound increase to -150 MPa and both drum stress and SH
stress are limiting constraints. The thermal efficiency is lower than the linear operation by 0.1%
and an overall ramprate relaxation of about 0.7% is required for satisfying the stress constraints.

91
Chapter 6. Reduced order model development
6.1. Literature Review
Due to the computational tractability and accuracy, reduced order models (ROMs) of the dynamic
high-fidelity plant models can be used for optimization/scheduling/control of the power plant
with/without CO2 capture. Zhang et al. (2016, 2018) developed different ROMs for linear or
nonlinear model predictive control (MPC) of an MEA-based CO2 capture process. A transfer
function model of dynamic process was considered in the linear MPC and a nonlinear, additive,
autoregressive model with exogenous (NAARX) was used in the nonlinear MPC. He and Lima
(2019) extended the MPC application to the coal-fired power plant with carbon capture and
compared different MPC strategies, i.e. dynamic matrix control (DMC)- based linear MPC, and
two nonlinear MPCs (NLMPC).
There are few other literatures on reduced order dynamic modeling of power plants. Rua et al.
(2020) developed the local model network (LMN) of linear ARX models for an NGCC plant. A
model predictive control approach was proposed to conduct the NGCC plant load-following of
step change without exceeding the maximum stress limit of the drum. A LMN (also known as bank
of linear models) has been proposed by Johansen and Foss (1993), and Prasad et al. (1998). It
includes several local linear models for different operating regimes and their interpolation
according to the operating conditions. Then, a Gaussian validity function is associated to each local
ARX model and all the predicted responses are combined into the final output.
The reduced order dynamic model of the NGCC plant with the equipment health analysis, i.e.
stress constraints, is required in the dynamic optimal dispatch of energy systems by our project
partner (Kim et al., 2020). In this work, the linear reduced order state-space model is first generated
in Aspen Plus Dynamic (APD). Since the model may not accurately capture the transients in
through-wall temperature profile thus can lead to inaccuracies in the evaluation of thermal stress,
the simple input-output transfer function model is also developed to provide the thermal stress
transient under the load-following. This hybrid linear reduced order model is computationally
tractable for being used in the optimal scheduling.
6.2. Linear reduced-order state-space model
The nonlinear NGCC plant model in APD can be linearized at the different operating conditions
by using a featured built-in tool called control design interface (CDI) to generate a large-scale full-

92
order linear state space model. Then it may be desired to reduce the order of this model further for
computational tractability. Two widely used methods for order reduction of very large-scale linear
dynamic systems are the balanced truncation method and the Hankel norm approximation method.
Both methods are based on Hankel singular value (HSV) decomposition. (Glover, 1984; Wang
and Safonovet, 1990; Antoulas, 1999; Antoulas and Sorensen, 2001; Willcox and Peraire, 2002).
Both methods guarantee two of the most important ROM properties: (i) preserving stability of the
original system and (ii) satisfying the global error bound (Paul et al. 2016). In this study, the
balanced truncation method is used for reducing the order of the linear full-state model generated
using APD.
6.2.1 Linear SIMO state-space model
The nonlinear model of NGCC plant in APD is linearized at different load conditions (e.g. full
load, 80% load, and 60% load) to generate the linear SIMO state-space models using the Control
Design Interface (CDI) tool.
In the state-space model, input or decision variable is:
1. Natural gas flowrate (kg/hr)
The outputs are:
1. Total power output (MWe)
2. Gas turbine power output (MWe)
3. Main steam temperature (°C)
4. Reheat steam temperature (°C)
Since 582 state variables are included in the large-scale state-space model, the ROM is required
for reducing computational cost.
6.2.2 Reduced-order model
Balanced truncation method is used to eliminate the weakly coupled states and generate the ROM
on the basis of Hankel singular value (HSV) decomposition. Figure 6.1 shows that only 35 state
variables are sufficient for the ROM with the HSV tolerance set at 10-5.

93
Figure 6. 1. Hankel singular values of the state-space model under full load condition
For evaluating the accuracy of ROM, the natural gas flowrate is varied between the full load to 0.4
load as shown in Figure 6.2.
Figure 6. 2. Input variation for the ROM validation
Here, the output responses to the input variation are compared among the nonlinear plant in APD,
the full-ordered state space model (FOM), and the ROM.
The FOM and ROM shown in Figure 6.3 are generated at full load condition. Results from the
ROM not only compares well with the FOM but also with the high-fidelity nonlinear model in

94
APD. Since FOM and ROM are linearized at full load, the discrepancy at low load condition is
larger. However, all these discrepancies are less than 10%.
On the other hand, the computation times of different models are varied. The load-following
simulation in APD takes 12 min 8s, while it only takes 0.572s using FOM and 0.263s using ROM.
(a) (b)
(c) (d)
Figure 6. 3. Output responses to the input variations for linear model generated at full
load condition (a) total power output (b) GT power output (c) main steam temperature (d)
reheat steam temperature

95
Similarly, the ROMs can be generated at different loads (0.8load and 0.6load) and compared with
the high-fidelity nonlinear model. The orders of these ROMs are both 35. Also, good agreement
between nonlinear model and ROMs can be seen in Figure 6.4.
(a) (b)
(c) (d)
Figure 6. 4. Output responses to the input variations for linear model generated at
0.8load and 0.6load (a) total power output (b) GT power output (d) main steam
temperature (e) reheat steam temperature

96
6.3. Linear transfer function model
Since the thermal stress is proportional to the first-order temperature derivative as shown in
Equation 4.14, the highly nonlinear transient is presented under the load-following. A transfer
function model of dynamic process is identified for computing thermal stress.
Figure 6. 5. Random signals of input for system identification
Figure 6. 6. Comparison between model in Aspen Plus Dynamics and identified process
model

97
Pseudorandom binary sequence (PRBS) signals of input are used for obtaining the output
performance for system identification. The signal amplitude generated by the PRBS Signal
Generator is set to be variable (random value between 0 and 1, instead of either 0 or 1) at each step
to ensure the convergence of Aspen Plus Dynamics model over the tested sequence. The random
input signals used for natural gas flow rate are shown in Figure 6.5.
The tangential thermal stress on drum inner surface is identified using the transfer function
estimation in MATLAB. The obtained transfer function can also be converted to a discrete state-
space form. Figure 6.6 shows comparisons between the output of the dynamic simulation and the
identified model.
6.4. Conclusion
The reduced order state-space models linearized at different load conditions (full load, 0.8 load
and 0.6 load) show a good prediction in power output and steam temperature. The input-output
transfer function model can provide the thermal stress transient under the load-following. The
hybrid linear ROM with highly computational efficiency is a good representation of the nonlinear
plant model with equipment damage estimation.

98
Chapter 7. Final Remarks
In this work, a plant-wide dynamic model of the NGCC plant has been developed with detailed
equipment level sub-models to capture the plant load-following behavior. Five novel
configurations have been proposed for controlling the main steam and reheat steam temperatures
while avoiding ‘spraying to saturation’ during fast load-following by considering different final
high-pressure superheater (HP SH2)/ reheater (RH) arrangements (in series or in parallel) and
attemperation strategies (single-stage, two-stage, and damper-assisted attemperation). Load-
following operation has been studied under two operational strategies- the industry-standard
coordinated control strategy and dynamic optimization. Also, the fatigue/creep damage has been
estimated by developing a damage model that can compute through-wall temperature transients
and thermo-mechanical stress evolutions in the critical components (i.e. HP drum, superheater and
reheater). Multiple locations at the component junctions have been monitored and the most
stressed part has been identified as the constraint in the dynamic optimization of the load-following
operation. In addition, the reduced order dynamic model of NGCC plant including equipment
stress transient has been generated for dynamic optimal scheduling of multiple energy systems.
The main components of the NGCC plant are the GT, HRSG, and ST. Under the load-following,
the 1-stage attemperation configuration leads to saturation and cannot maintain the steam
temperature irrespective of whether HP SH2 and RH are arranged in series or in parallel. However,
the configurations with 2-stage attemperation can maintain the main/reheat steam temperature at
its set point without leading to saturation. The spray flow rate at HP SH2/RH ATT can be
optimized to not only satisfy the saturation constraint of the main and reheat steam temperature
but also to achieve a higher efficiency than the traditional coordinated control system.
The HP drum fatigue damage has been estimated and the maximum circumferential stress
amplitude occurs at the edge of the drum/downcomer junction. It was observed that the industry
standard linear profile can not only result in lower efficiency but can violate the drum stress
constraints depending on the desired ramprate and upper and lower bounds on the constraints. The
multi-objective dynamic optimization approach can play a critical role for load trajectory
optimization not only for maximizing efficiency during load following but also for avoiding
violation of drum stress constraints and for avoiding spraying to saturation. There is a strong
tradeoff between the relaxation in ramprate and the time- average thermal efficiency.

99
In order to avoid overheating and resulting creep rupture in the SH/RH, it is crucial to maintain
the final main/reheat steam temperature under the load-following. Since a large amount of boiler
feed water is sprayed in the attemperator during the transient, the fast steam cooling leads to the
large stress amplitude at the SH(B) inlet header-tube junction. The dynamic optimization of the
load-following with SH stress and drum stress constraints are formulated. It was observed that the
limiting constraint can change depending on the stress constraints in the drum and SH. Also, the
different load trajectories and thermal efficiency performances are obtained. The proper equipment
stress constraint should be based on the specific material of construction, the operational history
of a plant as well as the level of conservatism exercised by plant operators.
The high-fidelity dynamic models include multiple time scales and multiple spatial scales, it can
be computationally intractable to use the detailed models for optimization/scheduling/control. A
hybrid reduced order dynamic models have been developed for the NGCC system including the
equipment stress estimation so that they can be computationally tractable for being used in
dynamic optimization while providing desired accuracy.

100
Chapter 8. Future Work
In this research, mainly creep and fatigue damages are considered. However, the actual power
plant can face many other damaging mechanisms, that often act synergistically to cause accelerated
failure of boiler components. The feed water chemistry leads to various types of corrosion on the
inner surface of the superheater and reheater. In addition, thick oxide scale can form at the tube
interiors, that not only causes accelerated failure due to inferior rupture properties and dissimilarity
with the tube MOC, but also due to rise in the local tube temperature because of poor thermal
properties of the oxide scales. Sulfidic corrosion on the outer surface of the tubes resulting from
the sulfur -bearing compounds in the flue gas of coal-fired boilers can lead to reduction in the tube
wall thickness. A more comprehensive damage model considering the effect of external and
internal corrosion and deposit and consideration of the combined effects of all mechanisms along
with creep and fatigue will be highly desired.
Material properties of importance for damage models have uncertainties. Uncertainties in Young’s
modulus and thermal properties would affect the equipment stress and temperature distribution
and transients. Uncertainties in the creep rupture data would affect the creep damage assessment
as shown in Appendix B. Therefore, quantifying uncertainties in prediction of failure as a result of
material uncertainties will be also desired.
Supplemental firing or duct firing in NGCC plants enables the plant to produce more steam when
it is desired to produce more power than the typical base-loaded operation. Supplemental firing
can significantly elevate the local temperature near superheater/reheater and can be very damaging
to their health. When a duct burner is installed, usually some special alloys are used especially in
first few rows following the duct burner. Investigation of the impact of supplemental firing on
plant transient response, equipment health, and consideration of the amount of supplemental firing
as a degree of freedom in dynamic optimization will be very valuable.
CO2 capture from pulverized coal power plants is widely investigated, while there are few studies
on CO2 capture from NGCC plants. When the capture plant is integrated with an NGCC plant and
the host plant undergoes rapid load following, then the transients in the capture plant are affected
not only by the transients in the flue gas flow and composition, but also the change in the extraction
pressure of the steam from the ST that is sent to the reboiler thus affecting the capture system
performance significantly. On the other hand, the capture system affects the performance of the

101
NGCC plant due to the transients of steam consumption in the reboiler and transients of other
parasitic loads in the capture plant. Therefore, the impact of load-following on the performance of
the capture system and synergistic interaction of the capture and NGCC plant should be studied.
We have developed a steady-state rate-based model for CO2 capture using MDEA/PZ solvent. The
NGCC plant integrated with CO2 capture process was investigated in the steady state condition.
Based on the steady-state model, the dynamic equilibrium model of CO2 capture using Murphree-
efficiency approach can be developed. Furthermore, the synergy of CO2 capture with NGCC plant
can be investigated.
In term of reduced order model, a local model network (LMN) of linear state-space models can be
developed. When additional local linear models for different operating loads can be identified and
included in the LMN especially for capturing the stress transient more accurately. Also, nonlinear
reduced order models can be developed and used in the advanced nonlinear model predictive
control and optimal nonlinear scheduling problem.

102
Appendix A: The thermo-hydraulic model of HRSG
A.1. ε-NTU method
The effectiveness ε is the ratio of the actual heat transfer rate for a heat exchanger to the maximum
possible heat transfer rate. When the heat exchanger includes n tube passes, ε is calculated as
follows:
ε =[(1−εiCr)/(1−εi)]n−1
[(1−εiCr)/(1−εi)]n−Cr (A.1)
where Cr is the ratio between the flow heat capacity rate Cmin and Cmax.
The Number of Transfer Units (NTU) and Effectiveness ε relation is calculated considering a single
pass crossflow with the gas flow mixed and the water/steam flow unmixed (Bergman et al., 2011).
𝑁𝑇𝑈𝑖 = −ln [1 +1
𝐶𝑟ln(1 − 𝜀𝑖C𝑟)] (A.2)
The total surface area Atot of the heat exchanger is calculated as:
𝐴𝑡𝑜𝑡 =𝑛∙𝑁𝑇𝑈𝑖∙𝐶𝑚𝑖𝑛
𝑈 (A.3)
where U is the overall heat transfer coefficient.
A.2. Heat transfer coefficients
The heat transfer for gas flow across the staggered tube banks in Equation 2.6 includes an
arrangement factor Fa (Khan et al., 2006):
𝐹𝑎 = 1 + 0.1𝑎 + 0.34/𝑏 (A.4)
where a and b represent longitudinal tube pitch and transverse tube pitch.
The liquid phase heat transfer in Equation 2.7 includes the friction factor f for smooth tubes
(Gnielinski, 1976):
𝑓 = [0.7904 ln(𝑅𝑒) − 1.64]−2 (A.5)
The heat transfer under boiling condition in Equation 9 includes boiling coefficient, liquid-phase
coefficient and the corresponding correlation factors (Collier and Thome, 2006). The normalized
nucleate pool boiling coefficient hNcB,o is 25580 W/m2 K. The liquid-phase forced convection
103
coefficient hFO is calculated using Gnelinski correlation as shown in Equation 2.7. The factors are
calculated as:
𝐹𝑁𝑐𝐵 = 0.72𝐹𝑃𝐹(∅/150000)𝑛𝑓(𝑑 0.01⁄ )−0.4(𝑅𝑝 1⁄ )0.133 (A.6)
𝐹𝑃𝐹 = 2.816𝑃_𝑟0.45 + (3.4 +1.7
1−𝑃_𝑟7)𝑃_𝑟3.7 (A.7)
𝑛𝑓 = 0.8 − 0.1exp (1.75𝑃_𝑟) (A.8)
𝑃𝑟 =𝑃
𝑃𝐶𝑅𝐼𝑇 (A.9)
𝐹𝐹𝐵 = [(1 − 𝑥)1.5 + 1.9𝑥0.6(𝜌𝑓 𝜌𝑔⁄ )0.35]1.1 (A.10)
where FNcB is a nucleate boiling correlation factor, including the effects of pressure P_r, heat flux
∅, tube diameter d, surface roughness Rp; FFB is two-phase multiplier, depending on the vapor
fraction x and the density ratio between liquid phase 𝜌𝑓 and gas phase 𝜌𝑔.
η0 is the efficiency of a finned surface used to calculate the overall heat transfer coefficient U in
Equation 2.10.
𝜂0 = 1 −𝐴𝑓
𝐴𝑡𝑜𝑡(1 − 𝜂𝑓) (A.11)
where Af is the fin surface area, ηf is the efficiency of the single fin related with the fin height L,
fin thickness t, thermal conductivity of fin k and gas side heat transfer coefficient hg (Bergman et
al., 2011).
𝜂𝑓 =tanh (𝑚𝐿)
𝑚𝐿 (A.12)
𝑚 = √2ℎ𝑔
𝑘𝑡 (A.13)

104
Appendix B: Creep rupture assessment
B.1 Creep damage model
Creep is due to the prolonged exposure to high stress and temperature operation conditions. The
creep damage is defined as operating duration divided by the expected rupture time.
𝐷𝐶 =𝑡𝑜
𝑡𝑟(𝜎,𝑇) (B.1)
where 𝑡𝑟(𝜎, 𝑇 ) is the time to rupture failure at the stress σ and temperature T. The rupture time 𝑡𝑟
is estimated using the creep curves under different temperature conditions.
Figure B. 1. Creep-rupture database of Grade 91 steel
Creep curves of SH/RH material (i.e. T/P 91 steel) as shown in Figure B.1 can be found in the
literature (Bendick et al., 2010). It was observed that the steepness of creep curves increases as the
operating temperature rises. Under the certain stress magnitude, when temperature keeps
increasing, the expected rupture time can reduce considerably.
B.2. Creep rupture assessment using minimum commitment (MC) equation
Since creep rupture test is conducted using uniaxial tensile specimens, the Von Mises equivalent
stress is considered when the creep curves are used to estimate the rupture time.
= [𝜎𝑟2 + 𝜎𝜃
2 + 𝜎𝑧2 − (𝜎𝑟𝜎𝜃 + 𝜎𝑟𝜎𝑧 + 𝜎𝑧𝜎𝜃)]1/2 (B.1)

105
A total of 1238 creep data are obtained from the work of Bendick et al. (2010) as shown in Figure
B.1. The testing temperature varies from 500 °C up to 700 °C, and most of the data are concentrated
around 550°C, 600°C and 650°C.
The Minimum Commitment (MC) equation is used to assess the database.
log 𝑡𝑟 = 𝑎0 + 𝑎1 log+𝑎2+𝑎32+𝑎4𝑇 +
𝑎5
𝑇 (B.2)
where tr is the predicted time (hr), is the stress (MPa), T is the temperature (K) and a is the
coefficient. The coefficients determined by MC equation are listed in Table B.1.
Table B. 1. Coefficients of MC equation for Grade91
𝑎0 𝑎1 𝑎2 𝑎3 𝑎4 𝑎5
-6.55 -3.53 -0.015 -4.98×10-06 -0.0068 22283.77
The scatters of material creep rupture data lead to the uncertainties in creep rupture assessment.
Figure B.2 shows the fitted isothermal curves and 95% confidence intervals. Confidence intervals
for the MC coefficients are calculated and listed in Table B.2.
Table B. 2. 95% confidence intervals for coefficients of MC equation
Coefficient Baseline value Confidence interval
𝑎0 -6.55 [-7.74, -5.36]
𝑎1 -3.53 [-4.08, -2.99]
𝑎2 -0.015 [-0.018, -0.011]
𝑎3 -4.98×10⁻⁶ [-1.07×10⁻⁵, 7.13×10⁻⁷]
𝑎4 -0.0068 [-0.0077, -0.0059]
𝑎5 22283.77 [22283.76, 22283.77]

106
Figure B. 2. Different isothermal curves and 95% confidence bounds for creep-rupture
database

107
Appendix C: Publications and Presentations
Publications
1. Wang, Y., Bhattacharyya, D., Turton, R (2021). Optimal Load-following Operation of NGCC Power
Plants with Stress Monitoring of the HP drum and Superheater header. In Preparation.
2. Wang, Y., Bhattacharyya, D., Turton, R. (2021). Optimal Load-following of Natural Gas Combined
Cycle (NGCC) Power Plants with Stress Monitoring of the Thick-walled Boiler Drum. Applied Energy,
Submitted.
3. Wang, Y., Bhattacharyya, D., Turton, R. (2020). Evaluation of Novel Configurations of Natural Gas
Combined Cycle (NGCC) Power Plants for Load-Following Operation using Dynamic Modeling and
Optimization. Energy & Fuel, 34(1), 1053-1070.
4. Wang, Y., Bhattacharyya, D., Turton, R. (2019). Dynamic Modeling and Control of a Natural Gas
Combined Cycle Power Plant for Load-Following Operation. In Computer Aided Chemical
Engineering, 47, 101-106. Elsevier, 2019.
5. Kim, R., Wang, Y., Vudata, S. P., Bhattacharyya, D., Lima, F. V., & Turton, R. (2020). Dynamic
Optimal Dispatch of Energy Systems with Intermittent Renewables and Damage
Model. Mathematics, 8(6), 868.
6. He, X., Wang, Y., Bhattacharyya, D., Lima, F. V., Turton, R. (2018). Dynamic Modeling and
Advanced Control of Post-combustion CO2 Capture Plants. Chemical Engineering Research and
Design, 131, 430-439.
Selected Presentations
1. Wang, Y., Bhattacharyya, D., Turton, R. Optimal Load-Following Operation of NGCC Power Plants
with Quantified Uncertainty of Equipment Health. 2020 AIChE Annual Meeting, San Francisco, CA,
November 15-20, 2020
2. Wang, Y., Bhattacharyya, D., Turton, R. Dynamic Optimization of an NGCC Power Plant for Load-
Following Operation. 2019 AIChE Annual Meeting, Orlando, FL, November 10-15, 2019
3. Wang, Y., Bhattacharyya, D., Turton, R. Dynamic Modeling and Control of an NGCC Power Plant for
Load-following Operation. 2019 FOCAPD Conference, Copper Mountain, CO, July14-18, 2019
4. Wang, Y., Bhattacharyya, D., Turton, R. Dynamic Modeling and Control of an NGCC Power Plant
with a Damage Model. 2018 AIChE Annual Meeting, Pittsburgh, PA, October 28 - November 2, 2018
5. Wang, Y., Bhattacharyya, D., Turton, R. Design and Optimization of an NGCC Power Plant with CO2
Capture for Optimal Load-Following. 2017 ISA POWID Symposium, Cleveland, OH, June 27-29,
2017

108
References
Alobaid, F., Postler, R., Ströhle, J., Epple, B., & Kim, H. G. (2008). Modeling and investigation
start-up procedures of a combined cycle power plant. Applied Energy, 85(12), 1173-1189.
Alobaid, F., Ströhle, J., Epple, B., & Kim, H. G. (2009). Dynamic simulation of a supercritical
once-through heat recovery steam generator during load changes and start-up
procedures. Applied Energy, 86(7-8), 1274-1282.
Alobaid, F., Karner, K., Belz, J., Epple, B., & Kim, H. G. (2014). Numerical and experimental
study of a heat recovery steam generator during start-up procedure. Energy, 64, 1057-1070.
Antoulas, A. C. (1999). Approximation of linear dynamical systems. Wiley Encyclopedia of
Electrical and Electronics Engineering, 11, 403-422.
Antoulas, A. C., & Sorensen, D. C. (2001). Approximation of large-scale dynamical systems: An
overview.
Apan-Ortiz, J. I., Sanchez-Fernández, E., & González-Díaz, A. (2018). Use of steam jet booster as
an integration strategy to operate a natural gas combined cycle with post-combustion CO2
capture at part-load. Energy, 165, 126-139.
Bergman, T. L., Incropera, F. P., Lavine, A. S., & DeWitt, D. P. (2011). Introduction to heat
transfer. John Wiley & Sons.
Benato, A., Stoppato, A., & Mirandola, A. (2015). Dynamic behaviour analysis of a three pressure
level heat recovery steam generator during transient operation. Energy, 90, 1595-1605.
Benato, A., Bracco, S., Stoppato, A., & Mirandola, A. L. T. E. (2016). LTE: A procedure to predict
power plants dynamic behaviour and components lifetime reduction during transient
operation. Applied energy, 162, 880-891.
Bendick, W., Cipolla, L., Gabrel, J., & Hald, J. (2010). New ECCC assessment of creep rupture
strength for steel grade X10CrMoVNb9-1 (Grade 91). International Journal of Pressure
Vessels and Piping, 87(6), 304-309.
Bhattacharyya, D., and Rengaswamy, R. (2010). Dimensional optimization of a tubular solid oxide
fuel cell. Computers & Chemical Engineering, 34(11), 1789-1802.

109
Brevus, V., Yasniy, O., & Lapusta, Y. (2014). Structural integrity assessment of thermal power
plant superheater collector. Procedia materials science, 3, 1394-1399.
Chaibakhsh, A., & Ghaffari, A. (2008). Steam turbine model. Simulation Modelling Practice and
Theory, 16(9), 1145-1162.
Chen, K. L., Deardorf, A. F., Copeland, J. F., Pflasterer, R., & Beckerdite, G. (1993). Creep-fatigue
monitoring system for header ligaments of fossil power plants. In Fracture mechanics:
Applications and new materials.
Collier, J. G., & Thome, J. R. (1994). Convective boiling and condensation. Clarendon Press.
Oxford, England, UK
Cooke, D. H. (1983, November). Modeling of off-design multistage turbine pressures by Stodola’s
ellipse. In Energy Incorporated PEPSE User’s Group Meeting, Richmond, VA, 2-3.
Dong-mei, J., Jia-qi, S., Quan, S., Heng-Chao, G., Jian-Xing, R., and Quan-jun, Z. (2018).
Optimization of start-up scheduling and life assessment for a steam turbine. Energy, 160,
19-32.
Dittus, F. W. and Boelter, L. M. K. (1930). Heat transfer in automobile radiators of the tubular
type. University of California Publications in Engineering, 2,443-461.
Dzierwa, P. (2016). Optimum heating of pressure components of steam boilers with regard to
thermal stresses. Journal of Thermal Stresses, 39(7), 874-886.
Dzierwa, P., and Taler, J. (2015). Optimum heating of pressure vessels with holes. Journal of
pressure vessel technology, 137(1).
DOE/OE, What is the Smart Grid? https://www.smartgrid.gov/the_smart_grid/smart_grid.html
ECCC (European Creep Collaborative Committee). Data sheet. Robertson DG, editor. ERA
Technology Ltd; 2005.
EIA, Electricity in the United States is produced with diverse energy sources and technologies.
https://www.eia.gov/energyexplained/index.php?page=electricity_in_the_united_states#t
ab1
EPRI, Investigation of Cracking in Fossil Boiler Drums: Finite-Element Stress and Fracture
Mechanics Analyses. EPRI, Palo Alto, CA: 2005. 1011916.
110
EPRI, Investigation of Cracking in a Fossil Natural Circulation Boiler Drum: Finite Element Stress
and Fracture Mechanics Analyses. Palo Alto, CA: 2006. 1013268.
European Committee For Standardization. EN 13445 part 3 unfired pressure vessels, clause 17;
simplified assessment of fatigue life, and clause 18; detailed assessment of fatigue life;
2002.
Franco, A., & Giannini, N. (2006). A general method for the optimum design of heat recovery
steam generators. Energy, 31(15), 3342-3361.
Fontaine, P., and Golopin, J. F. (2007, October). HRSG Optimization for cycling duty based on
Euro Norm EN 12952-3. In ETD Conference on Cyclic Operation of Power Plant (Vol. 5,
No. 1, pp. 1-14).
German Boiler Regulations. TRD 301 annex 1 calculation for cyclic loading due to pulsating
internal pressure or combined changes of internal pressure and temperature; 2001.
Glover, K. (1984). All optimal Hankel-norm approximations of linear multivariable systems and
their L,∞-error bounds. International journal of control, 39(6), 1115-1193.
Gnielinski, V. (1976). New equations for heat and mass transfer in turbulent pipe and channel
flow. Int. Chem. Eng., 16(2), 359-368.
González-Gómez, P. A., Gómez-Hernández, J., Ferruzza, D., Haglind, F., and Santana, D. (2019).
Dynamic performance and stress analysis of the steam generator of parabolic trough solar
power plants. Applied Thermal Engineering, 147, 804-818.
González-Gómez, P. A., Gómez-Hernández, J., Briongos, J. V., & Santana, D. (2018). Transient
thermo-mechanical analysis of steam generators for solar tower plants. Applied
energy, 212, 1051-1068.
Gray, D. (2001). Correlating cycle duty with cost at fossil fuel power plants (p. 64). Tech. rep.
1004010. EPRI, Palo Alto, CA. 2002.
He, X., & Lima, F. V. (2019). Development and implementation of advanced control strategies for
power plant cycling with carbon capture. Computers & Chemical Engineering, 121, 497-
509.

111
Hentschel, J., Zindler, H., & Spliethoff, H. (2017). Modelling and transient simulation of a
supercritical coal-fired power plant: Dynamic response to extended secondary control
power output. Energy, 137, 927-940.
Hetnarski, R. B., Eslami, M. R., and Gladwell, G. M. L. (2009). Thermal stresses: advanced theory
and applications. Springer Netherlands.
Horkeby, K. (2012). Simulation of heat recovery steam generator in a combined cycle power plant.
Linkopings, Sveden: Linköpings Universitet.
Hübel, M., Meinke, S., Andrén, M. T., Wedding, C., Nocke, J., Gierow, C., ... and Funkquist, J.
(2017). Modelling and simulation of a coal-fired power plant for start-up
optimisation. Applied Energy, 208, 319-331.
Khan, W. A., Culham, R. J., & Yovanovich, M. M. (2006). Analytical model for convection heat
transfer from tube banks. Journal of Thermophysics and Heat transfer, 20(4), 720-727.
Kim, R., Wang, Y., Vudata, S. P., Bhattacharyya, D., Lima, F. V., & Turton, R. (2020). Dynamic
Optimal Dispatch of Energy Systems with Intermittent Renewables and Damage
Model. Mathematics, 8(6), 868.
Kim, T. S., Lee, D. K., and Ro, S. T. (2000). Analysis of thermal stress evolution in the steam
drum during start-up of a heat recovery steam generator. Applied Thermal
Engineering, 20(11), 977-992.
Kumar, N., Besuner, P., Lefton, S., Agan, D., & Hilleman, D. (2012). Power plant cycling
costs (No. NREL/SR-5500-55433). National Renewable Energy Lab. (NREL), Golden,
CO (United States).
Kwon, O., Myers, M., Karstensen, A. D., & Knowles, D. (2006). The effect of the steam
temperature fluctuations during steady state operation on the remnant life of the
superheater header. International journal of pressure vessels and piping, 83(5), 349-358.
Jackson, P. S., Fabricius, A., & Wholey, A. (2019, July). Failure Analysis of SA-213 T91 HRSG
Superheater Tube Weld. In ASME Power Conference (Vol. 59100, p. V001T03A002).
American Society of Mechanical Engineers.

112
Jiang, Y., Liese, E., Zitney, S. E., & Bhattacharyya, D. (2018). Optimal design of microtube
recuperators for an indirect supercritical carbon dioxide recompression closed Brayton
cycle. Applied energy, 216, 634-648.
Jiang, Y., Liese, E., Zitney, S. E., & Bhattacharyya, D. (2018). Design and dynamic modeling of
printed circuit heat exchangers for supercritical carbon dioxide Brayton power
cycles. Applied energy, 231, 1019-1032.
JianPing, J., Guang, M., Yi, S., and SongBo, X. (2003). An effective continuum damage mechanics
model for creep–fatigue life assessment of a steam turbine rotor. International Journal of
Pressure Vessels and Piping, 80(6), 389-396.
Johansen, T. A., & FOSS, B. (1993). Constructing NARMAX models using ARMAX
models. International journal of control, 58(5), 1125-115
Jordal, K., Ystad, P. A. M., Anantharaman, R., Chikukwa, A., & Bolland, O. (2012). Design-point
and part-load considerations for natural gas combined cycle plants with post combustion
capture. International Journal of Greenhouse Gas Control, 11, 271-282.
Lawal, A., Wang, M., Stephenson, P., & Obi, O. (2012). Demonstrating full-scale post-combustion
CO2 capture for coal-fired power plants through dynamic modelling and
simulation. Fuel, 101, 115-128.
Lefton, S. A., & Besuner, P. (2006). The cost of cycling coal fired power plants. Coal Power
Magazine, 2006, 16-20.
Lefton, S. (2004). Profitable operation requires knowing how much it costs to cycle your
unit. Combined Cycle Journal, 49-52.
Lefton, S. A., & Hilleman, D. (2011). Make your plant ready for cycling
operations. Power, 155(8), 58-58.
Lefton, S. A., Besuner, P. M., & Agan, D. D. (2006). The real cost of on/off cycling. Modern
power systems, (OCT), 11-13.
Liese, E. (2014). Modeling of a steam turbine including partial arc admission for use in a process
simulation software environment. Journal of Engineering for Gas Turbines and
Power, 136(11), 112605.

113
Liese, E., & Zitney, S. E. (2018). Using Dynamic Simulation to Evaluate Attemperator Operation
in a Natural Gas Combined Cycle With Duct Burners in the Heat Recovery Steam
Generator. Journal of Engineering for Gas Turbines and Power, 140(1), 011801.
Lozza, G. (1990). Bottoming steam cycles for combined gas steam power plants: a theoretical
estimation of steam turbine performance and cycle analysis. In Proceedings of the 1990
ASME Cogen Turbo, New Orleans, LA, August, 27-29.
Madejski, P., & Taler, D. (2013). Analysis of temperature and stress distribution of superheater
tubes after attemperation or sootblower activation. Energy conversion and
management, 71, 131-137.
Miettinen, K. M. (2002). Nonlinear multiobjective optimization. Massachusetts, USA: Kluwer
Academic Publishers.
Modliński, N., Szczepanek, K., Nabagło, D., Madejski, P., & Modliński, Z. (2019). Mathematical
procedure for predicting tube metal temperature in the second stage reheater of the
operating flexibly steam boiler. Applied Thermal Engineering, 146, 854-865.
Moelling, D., Jackson, P., Malloy, J. (2015) Protecting steam cycle components during low-load
operation of combined cycle gas turbine plants. Power, 159 (3), 42-45.
Montañés, R. M., GarÐarsdóttir, S. Ó, Normann, F., Johnsson, F., & Nord, L. O. (2017).
Demonstrating load-change transient performance of a commercial-scale natural gas
combined cycle power plant with post-combustion CO 2 capture. International Journal of
Greenhouse Gas Control, 63, 158-174.
Mukhopadhyay, N. K., Dutta, B. K., & Kushwaha, H. S. (2001). On-line fatigue–creep monitoring
system for high-temperature components of power plants. International Journal of
Fatigue, 23(6), 549-560.
Oko, E., & Wang, M. (2014). Dynamic modelling, validation and analysis of coal-fired subcritical
power plant. Fuel, 135, 292-300.
Paul, P., Bhattacharyya, D., Turton, R., and Zitney, S. E. (2017). Nonlinear Dynamic Model-Based
Multiobjective Sensor Network Design Algorithm for a Plant with an Estimator-Based
Control System. Industrial & Engineering Chemistry Research, 56(26), 7478-7490.

114
Platt, J. (2002). Determining the Cost of Cycling and Varied Load Operation: Methodology. Tech.
Rep. 1004412, EPRI, Palo Alto, CA. 2002.
Pilkey, W. D., and Pilkey, D. F. (2008). Peterson's stress concentration factors. John Wiley and
Sons.
Pletl, C. (2005). Experiments and numerical simulation on th dynamic behaviour of a waste heat
boiler with once-through cycle; Experimente und numerische Simulation zum
dynamischen Verhalten eines Abhitzedampferzeugers mit Zwangdurchlauf.
Prasad, G., Swidenbank, E., & Hogg, B. W. (1998). A local model networks based multivariable
long-range predictive control strategy for thermal power plants. Automatica, 34(10), 1185-
1204.
Rodilla, P., Cerisola, S., & Batlle, C. (2013). Modeling the major overhaul cost of gas-fired plants
in the unit commitment problem. IEEE Transactions on Power Systems, 29(3), 1001-1011.
Rosario, D. A., Riccardella, P. C., Bisbee, L. H., Luttrell, M. E., Nelson, S., Eastman, A. D., &
Rogers, M. D. (1995). Remaining life assessment of a secondary superheater outlet
header (No. CONF-950740-). American Society of Mechanical Engineers, New York, NY
(United States).
Rúa, J., Agromayor, R., Hillestad, M., and Nord, L. O. (2020). Optimal Dynamic Operation of
Natural Gas Combined Cycles Accounting for Stresses in Thick-Walled Components. Applied
Thermal Engineering, 114858
Rúa, J., and Nord, L. O. (2020). Optimal control of flexible natural gas combined cycles with stress
monitoring: Linear vs nonlinear model predictive control. Applied Energy, 265, 114820.
Sarda, P., Hedrick, E., Reynolds, K., Bhattacharyya, D., Zitney, S. E., & Omell, B. (2018).
Development of a Dynamic Model and Control System for Load-Following Studies of
Supercritical Pulverized Coal Power Plants. Processes, 6(11), 226.
Shankar, V., Valsan, M., Rao, K. B. S., Kannan, R., Mannan, S. L., and Pathak, S. D. (2006). Low
cycle fatigue behavior and microstructural evolution of modified 9Cr–1Mo ferritic
steel. Materials Science and Engineering: A, 437(2), 413-422.

115
Sorge, J., Taft, C., Boohaker, C., Seachman, S. (2017, June). HRSG Damage Reduction through
Improved Controls – Phase 1 and 2 Findings. In 60th Annual ISA POWID Symposium,
Cleveland, OH.
Starkloff, R., Alobaid, F., Karner, K., Epple, B., Schmitz, M., & Boehm, F. (2015). Development
and validation of a dynamic simulation model for a large coal-fired power plant. Applied
Thermal Engineering, 91, 496-506.
Taler, J., Węglowski, B., Taler, D., Sobota, T., Dzierwa, P., Trojan, M., Madejski, P. and Pilarczyk,
M., (2015). Determination of start-up curves for a boiler with natural circulation based on
the analysis of stress distribution in critical pressure components. Energy, 92, 153-159.
Taler, J., Taler, D., Kaczmarski, K., Dzierwa, P., Trojan, M., and Sobota, T. (2018). Monitoring
of thermal stresses in pressure components based on the wall temperature
measurement. Energy, 160, 500-519.
Troy, N., Flynn, D., Milligan, M., & O'Malley, M. (2012). Unit commitment with dynamic cycling
costs. IEEE Transactions on Power Systems, 27(4), 2196-2205.
UNI – Ente Nazionale di Normazione. UNI EN 12952-5:2011. Water-tube Boilers Standards;
2011.
Van den Bergh, K., & Delarue, E. (2015). Cycling of conventional power plants: technical limits
and actual costs. Energy Conversion and Management, 97, 70-77.
Viswanathan, R., Paterson, S. R., Grunloh, H., & Gehl, S. (1994). Life assessment of
superheater/reheater tubes in fossil boilers.
Wang, W., & Safonov, M. G. (1990). A tighter relative-error bound for balanced stochastic
truncation. Systems & Control Letters, 14(4), 307-317.
Wang, Y., Bhattacharyya, D., & Turton, R. (2019). Dynamic Modeling and Control of a Natural
Gas Combined Cycle Power Plant for Load-Following Operation. In Computer Aided
Chemical Engineering (Vol. 47, pp. 101-106). Elsevier.
Wang, Y., Bhattacharyya, D., Turton, R. (2020). Evaluation of Novel Configurations of Natural
Gas Combined Cycle (NGCC) Power Plants for Load-Following Operation using Dynamic
Modeling and Optimization. Energy & Fuel, 34(1), 1053-1070.

116
Willcox, K., & Peraire, J. (2002). Balanced model reduction via the proper orthogonal
decomposition. AIAA journal, 40(11), 2323-2330.
Yan, H., Li, X., Liu, M., Chong, D., & Yan, J. (2020). Performance analysis of a solar-aided coal-
fired power plant in off-design working conditions and dynamic process. Energy Conversion
and Management, 220, 113059.
Yasniy, O., Pyndus, Y., Brevus, V., Iasnii, V., & Lapusta, Y. (2016). Lifetime estimation of
superheater header. Procedia Structural Integrity, 2, 840-846.
Yasniy, O., Pyndus, Y., Iasnii, V., & Lapusta, Y. (2017). Residual lifetime assessment of thermal
power plant superheater header. Engineering Failure Analysis, 82, 390-403.
Zhang, Q., Turton, R., & Bhattacharyya, D. (2016). Development of model and model-predictive
control of an MEA-based postcombustion CO2 capture process. Industrial & Engineering
Chemistry Research, 55(5), 1292-1308.
Zhang, Q., Turton, R., & Bhattacharyya, D. (2018). Nonlinear model predictive control and H∞
robust control for a post-combustion CO2 capture process. International Journal of
Greenhouse Gas Control, 70, 105-116.
Zoelle, A., Keairns, D., Pinkerton, L. L., Turner, M. J., Woods, M., Kuehn, N. & Chou, V.
(2015). Cost and Performance Baseline for Fossil Energy Plants Volume 1a: Bituminous
Coal (PC) and Natural Gas to Electricity Revision 3 (No. DOE/NETL-2015/1723). NETL