quantifying the effectiveness of systems engineering the effectiveness of systems engineering...
TRANSCRIPT

Quantifying the Effectiveness of Systems Engineering
Presenters: Joseph P. Elm
The Software Engineering Institute (SEI)a DoD Research FFRDC

2Quantifying the Effectiveness of SE01-Oct-2014© 2014 Carnegie Mellon University
Copyright 2014 Carnegie Mellon University and IEEE
This material is based upon work funded and supported by the Department of Defense under Contract No. FA8721-05-C-0003 with Carnegie Mellon University for the operation of the Software Engineering Institute, a federally funded research and development center.
NO WARRANTY. THIS CARNEGIE MELLON UNIVERSITY AND SOFTWARE ENGINEERING INSTITUTE MATERIAL IS FURNISHED ON AN “AS-IS” BASIS. CARNEGIE MELLON UNIVERSITY MAKES NO WARRANTIES OF ANY KIND, EITHER EXPRESSED OR IMPLIED, AS TO ANY MATTER INCLUDING, BUT NOT LIMITED TO, WARRANTY OF FITNESS FOR PURPOSE OR MERCHANTABILITY, EXCLUSIVITY, OR RESULTS OBTAINED FROM USE OF THE MATERIAL. CARNEGIE MELLON UNIVERSITY DOES NOT MAKE ANY WARRANTY OF ANY KIND WITH RESPECT TO FREEDOM FROM PATENT, TRADEMARK, OR COPYRIGHT INFRINGEMENT.
This material has been approved for public release and unlimited distribution.
This material may be reproduced in its entirety, without modification, and freely distributed in written or electronic form without requesting formal permission. Permission is required for any other use. Requests for permission should be directed to the Software Engineering Institute at [email protected].
CMMI® is registered in the U.S. Patent and Trademark Office by Carnegie Mellon University.
DM-0001639
3Quantifying the Effectiveness of SE01-Oct-2014© 2014 Carnegie Mellon University
The Software Engineering Institute (SEI)
Who we are• A Federally Funded Research and Development Center (FFRDC)• Sponsored by the Department of Defense
– but we work for all government agencies• Created in 1984 / CERT program founded in 1988• A Part of Carnegie Mellon University
What we do
Our MissionTo advance the technologies and practices needed to acquire,
develop, operate, and sustain software systems that are innovative, affordable, trustworthy, and enduring.
• Software Engineering• Software Research
• Cybersecurity• Assurance
• Acquisition Solutions• Emerging Technologies

4Quantifying the Effectiveness of SE01-Oct-2014© 2014 Carnegie Mellon University
SEI R&D Technical Priorities and Goals
Major Areas SEI Technical Priorities Goals Include . . .
Software Engineering
Development methods, empiricalanalysis methods, cost estimation, validation, sustainment
Create and sustain affordable,trustworthy, effective and enduring software systems with acceptable urgency
Assurance Designed-in security, evidence, acquisition guidance, tools
Improve the level of assurance in software systems using evidence
Specific Capabilities
Algorithms, networks and networking, mobile applications, embedded/real-time distributed systems
Maintain and expand the toolbox of techniques in critical, emerging and pervasive areas
Cybersecurity Forensics, coding standards, insider threat behavior, malware and code analysis, workforce education
Improve base and operational security, understand adversaries, spreading cyber competence
5Quantifying the Effectiveness of SE01-Oct-2014© 2014 Carnegie Mellon University
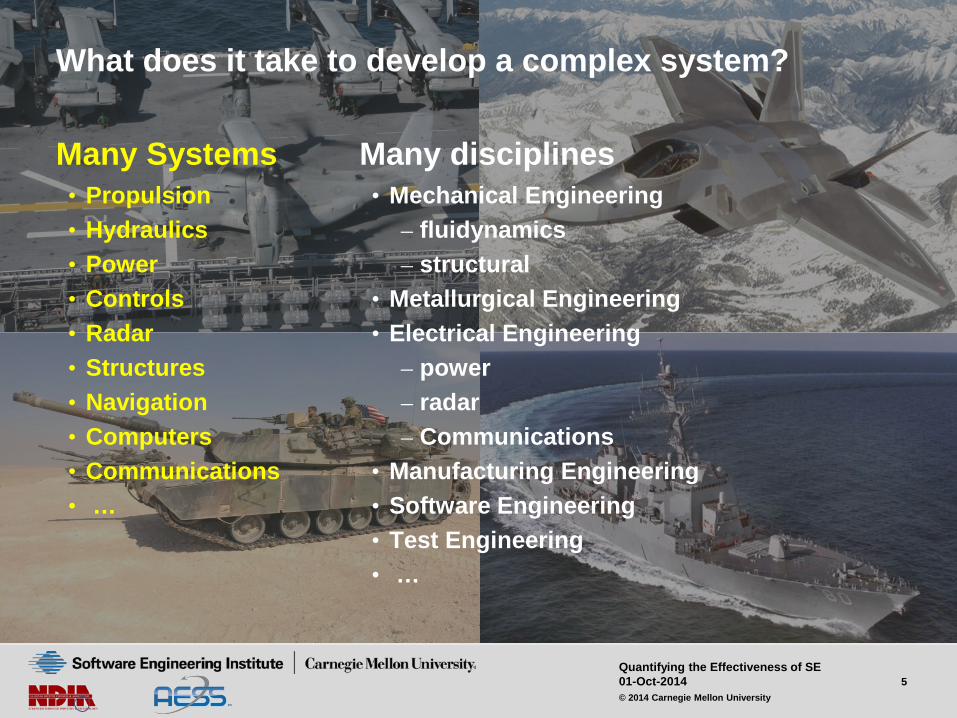
What does it take to develop a complex system?
Many Systems• Propulsion• Hydraulics• Power• Controls• Radar• Structures• Navigation• Computers• Communications• …
Many disciplines• Mechanical Engineering
– fluidynamics– structural
• Metallurgical Engineering• Electrical Engineering
– power– radar– Communications
• Manufacturing Engineering• Software Engineering• Test Engineering• …

6Quantifying the Effectiveness of SE01-Oct-2014© 2014 Carnegie Mellon University
But, Not Everything Fits Cleanlyinto One DisciplineRequirements Development and Management• Decomposition of requirements• Allocation of requirements among multiple
systems
Interdisciplinary Trade Studies• Requirements implementation in hardware vs.
software• Exotic alloys for low weight vs. more common
materials for low cost• Lower radar cross section vs. higher
aerodynamic performance
Architecture Development• Model Driven Design• Quality Attribute Driven Architecture
Business DriversSystem
ArchitectureArchitectural Approaches
Quality Attributes
Risks
Non-Risks
Sensitivity Points
Tradeoffs
Architectural Decisions
Scenarios
Risk Themes
Analysis
Architecture Development
and Evaluation Process
User Needs
System A Req’ts
Contracted Req’ts
System B Req’ts
SubsystemA1 Req’ts
SubsystemA2 Req’ts
System M Req’ts
SubsystemAn Req’ts
ComponentA1a Req’ts
ComponentA1b Req’ts
ComponentA1x Req’ts

7Quantifying the Effectiveness of SE01-Oct-2014© 2014 Carnegie Mellon University
Who Pulls it All Together ?
Required skills• Global system-wide
perspective• Full life-cycle perspective• Forward-looking• Multidisciplinary technical
knowledge• Fact-based decision-making• Multi-tasking
Tasks Performed *• Requirements Development• Requirements Management• Trade Studies• System Architecture Development• Interface Management• Configuration Management• Program Planning• Program Monitoring and Control• Risk Management• Product Integration Planning and
Oversight• Verification Planning and Oversight• Validation Planning and Oversight
The Systems Engineer
How likely is program
success if these
activities are not done
well?
* Some tasks are done in partnership with the Program Manager

8Quantifying the Effectiveness of SE01-Oct-2014© 2014 Carnegie Mellon University
Challenges in DoD Acquisition
GAO-09-362T - Actions Needed to Overcome Long-standing Challenges with Weapon SystemsAcquisition and Service Contract Management
• “costs … increased 26% and development costs increasedby 40% from first estimates”
• “programs … failed to deliver capabilities when promised—often forcing warfighters to [maintain] legacy systems”
• “current programs experienced, on average, a 21-monthdelay in delivering initial capabilities to the warfighter”
Although DoD is the largest acquirer in theworld, acquisition troubles remain 1
• 2011 MDAP RDT&E cost growth (mean) 84%• 2011 MDAP Procurement cost growth (mean) 28%• Effectiveness (1984-2011) 89%• Suitability (1984-2011) 72%• Nunn-McCurdy breach rate from 1997-2011 31% 1. “Performance of the Defense Acquisition System 2013
Annual Report” Table 2-3, page 34)
9Quantifying the Effectiveness of SE01-Oct-2014© 2014 Carnegie Mellon University
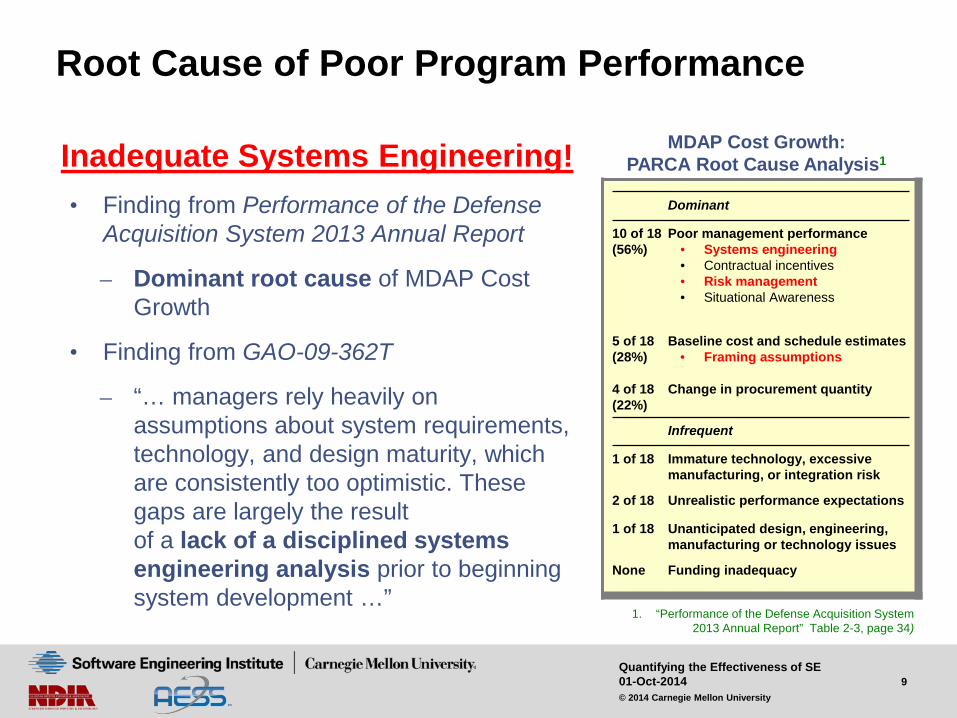
Root Cause of Poor Program Performance
Inadequate Systems Engineering!• Finding from Performance of the Defense
Acquisition System 2013 Annual Report
– Dominant root cause of MDAP Cost Growth
• Finding from GAO-09-362T
– “… managers rely heavily on assumptions about system requirements, technology, and design maturity, which are consistently too optimistic. These gaps are largely the result of a lack of a disciplined systems engineering analysis prior to beginning system development …”
Dominant
10 of 18(56%)
Poor management performance• Systems engineering• Contractual incentives• Risk management• Situational Awareness
5 of 18(28%)
Baseline cost and schedule estimates• Framing assumptions
4 of 18(22%)
Change in procurement quantity
Infrequent
1 of 18 Immature technology, excessive manufacturing, or integration risk
2 of 18 Unrealistic performance expectations
1 of 18 Unanticipated design, engineering, manufacturing or technology issues
None Funding inadequacy
MDAP Cost Growth:PARCA Root Cause Analysis1
1. “Performance of the Defense Acquisition System 2013 Annual Report” Table 2-3, page 34)

10Quantifying the Effectiveness of SE01-Oct-2014© 2014 Carnegie Mellon University
Perceptions of SE
The SE efforts on my program are critical because they …
We need to minimize the SE efforts on this program because …
… pay off in the end.… ensure that stakeholder
requirements are identified and addressed.
… provide a way to manage program risks.
… establish the foundation for all other aspects of the design.
… optimize the design through evaluation of alternate solutions.
… including SE costs in our bid will make it non-competitive.
… we don’t have time for ‘paralysis by analysis.’ We need to get the design started.
… we don’t have the budget or the people to support these efforts.
… SE doesn’t produce deliverable outputs.
… our customer won’t pay for them.
These are the ASSERTIONS, but what are the FACTS?

11Quantifying the Effectiveness of SE01-Oct-2014© 2014 Carnegie Mellon University
What is the ROI for SE?
It’s difficult to justify the costs of SE in terms that program managers and corporate managers can relate to.
• The costs of SE are evident– Cost of resources– Schedule time
• The benefits are less obvious and less tangible– Cost avoidance (e.g., reduction of rework from interface mismatches)– Risk avoidance (e.g., early risk identification and mitigation)– Improved efficiency (e.g., clearer organizational boundaries and
interfaces)– Better products (e.g., better understanding and satisfaction of
stakeholder needs)`
We need to quantify the effectiveness and value of SE by examining its effect on program performance?

12Quantifying the Effectiveness of SE01-Oct-2014© 2014 Carnegie Mellon University
Measuring ROI
quantitativeevidence
Obtainof the costs and
associated benefits ofSystems Engineering
activities via a survey ofdevelopment
programs

13Quantifying the Effectiveness of SE01-Oct-2014© 2014 Carnegie Mellon University
The SE Effectiveness Study
Purpose• Strengthen the business case for SE by relating
program performance to the use of SE practices.
Method• Contact development programs using the
resources of NDIA, AESS, and INCOSE.• Survey programs to assess their
– SE activities– Program performance– Degree of challenge
• Process responses to identify statistical relationships between parameters.
Survey Tenets• All data is submitted anonymously and handled confidentially by the SEI.• Only aggregated non-attributable data is released.

14Quantifying the Effectiveness of SE01-Oct-2014© 2014 Carnegie Mellon University
Artifact-based assessment of SE Practices
CMMI-SE/SW/IPPD v1.1
• 25 Process Areas• 179 Goals• 614 Practices• 476 Work Products
• 14 Process Areas• 31 Goals• 87 Practices• 199 Work Products
SystemsEngineering-related Filter
• 12 Process Areas• 23 Goals• 42 Practices• 61 Work Products
Size Constraint Filter
Considered significant to Systems Engineering
Survey content is based on a recognized standard (CMMI)

15Quantifying the Effectiveness of SE01-Oct-2014© 2014 Carnegie Mellon University
Assessment of Program Performance
Assess TOTAL Program Performance• Program Cost, Program Schedule, Technical Performance• Focus on commonly used measurements
– EVMS, baseline management– requirements satisfaction– budget re-baselining and growth– milestone and delivery satisfaction
Assessment of Other Factors• Program Challenge – some programs are more complex than others
• Prior Experience – some acquirers are more capable than others

16Quantifying the Effectiveness of SE01-Oct-2014© 2014 Carnegie Mellon University
Study Participants
Participant Solicitation• Contacted key members of major defense
contractors to promote study participation• Contacted the memberships of NDIA SE Division,
IEEE AESS, and INCOSE
Collected 148 valid responses
116
7 2 0 2 9 0 1 100
20406080
100120140
Ind.
Mfg
& S
vc:
defe
nse
Ind.
Mfg
& S
vc:
Ele
ctro
nic…
Ind.
Mfg
and
Svc
:O
ther
Tran
spor
tatio
n
Ene
rgy
Com
mun
icat
ions
Con
sum
er G
oods
&S
vc
Hea
lth C
are
Oth
er
Which of these best describes your industry or service?
130
6 3 2 2 1 1 1 10
20406080
100120140
US
A
UK
Sou
thA
frica
Aus
tralia
Can
ada
Indi
a
The
Net
herla
n…
Sw
eden
Finl
and
Please enter the country in which most of the design and development engineering will be/was
performed.
17Quantifying the Effectiveness of SE01-Oct-2014© 2014 Carnegie Mellon University
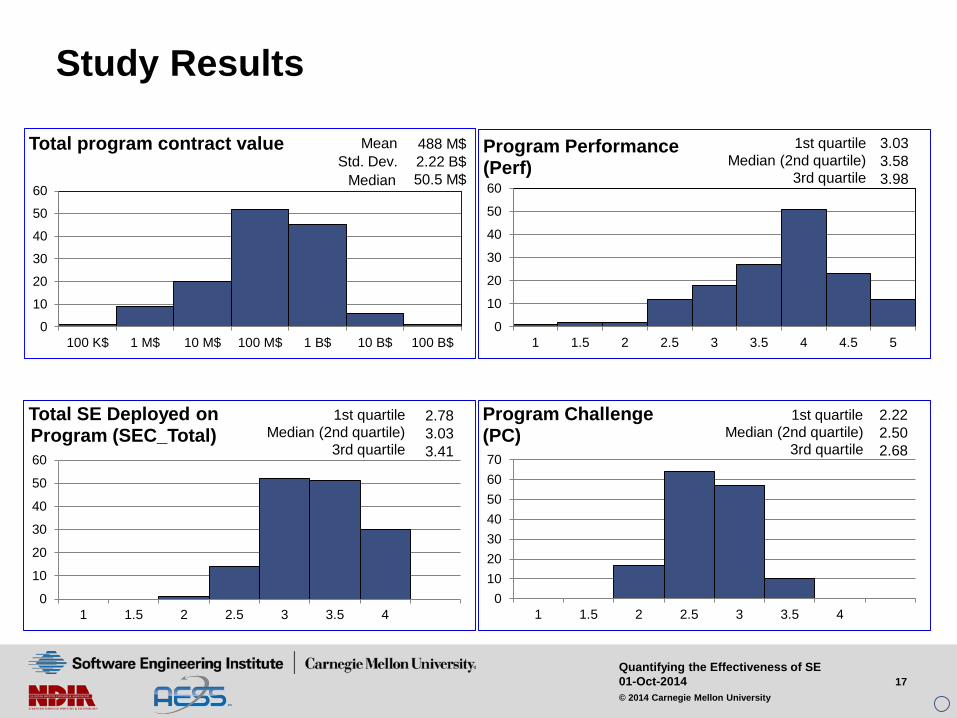
Study Results
0
10
20
30
40
50
60
100 K$ 1 M$ 10 M$ 100 M$ 1 B$ 10 B$ 100 B$
Total program contract valueStd. Dev.
Mean
Median
488 M$2.22 B$50.5 M$
0
10
20
30
40
50
60
1 1.5 2 2.5 3 3.5 4 4.5 5
Program Performance(Perf)
3.033.583.98
Median (2nd quartile)1st quartile
3rd quartile
010203040506070
1 1.5 2 2.5 3 3.5 4
Program Challenge(PC)
2.222.502.68
Median (2nd quartile)1st quartile
3rd quartile
0
10
20
30
40
50
60
1 1.5 2 2.5 3 3.5 4
Total SE Deployed onProgram (SEC_Total)
2.783.033.41
Median (2nd quartile)1st quartile
3rd quartile

18Quantifying the Effectiveness of SE01-Oct-2014© 2014 Carnegie Mellon University
The Bottom Line: SE = Performance
Across ALL programs, 1/3 are at each performance level
For Lower SECprograms, only 15%deliver higher performance
For Middle SECprograms, 24% deliver higher performance
For Higher SEC programs, 57% deliver higher performance
Gamma = 0.49 represents a VERY STRONG relationship
52%29% 20%
33%
47%
24%
15% 24%
56%
Gamma = 0.49 p-value < 0.001

19Quantifying the Effectiveness of SE01-Oct-2014© 2014 Carnegie Mellon University
For Challenging ProgramsSE is even MORE important
32%19% 12%
45%58%
36%
23% 23%52%
0%10%20%30%40%50%60%70%80%90%
100%
Lower SEC(n=22)
Middle SEC(n=26)
Higher SEC(n=25)
Perf vs. SEC_Total (Low PC)
Gamma = 0.34 p-value = 0.029
69%39% 27%
23%
35%
12%
8%26%
62%
0%10%20%30%40%50%60%70%80%90%
100%
Lower SEC(n=26)
Middle SEC(n=23)
Higher SEC(n=26)
Perf vs. SEC_Total (High PC)
Gamma = 0.62 p-value = 0.000
A STRONG relationship between Total SE and Program Performance for LOWER CHALLENGE programs
A VERY STRONG relationship between Total SE and Program Performance for HIGHER CHALLENGE programs
20Quantifying the Effectiveness of SE01-Oct-2014© 2014 Carnegie Mellon University
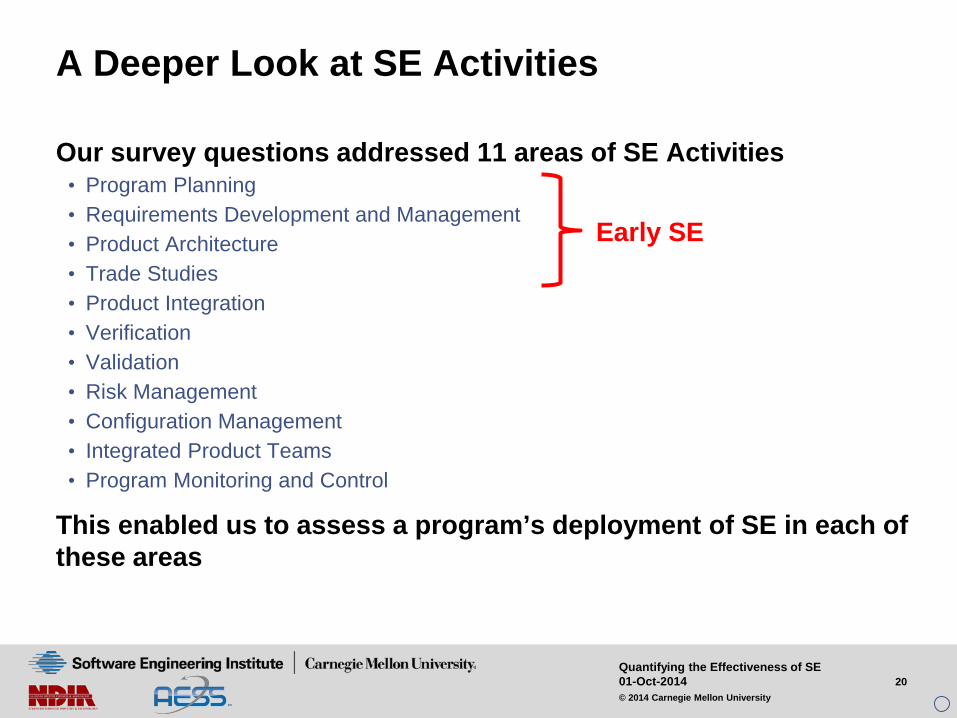
A Deeper Look at SE Activities
Our survey questions addressed 11 areas of SE Activities• Program Planning• Requirements Development and Management• Product Architecture• Trade Studies• Product Integration• Verification• Validation• Risk Management• Configuration Management• Integrated Product Teams• Program Monitoring and Control
This enabled us to assess a program’s deployment of SE in each of these areas
Early SE

21Quantifying the Effectiveness of SE01-Oct-2014© 2014 Carnegie Mellon University
68%43%
14%
26%
22%
19%
6%35%
67%
0%
20%
40%
60%
80%
100%
Lower Early SE(n=31)
Middle Early SE(n=23)
Higher Early SE(n=21)
Perf vs. EarlySE (High PC)
Gamma = 0.69
32% 17% 17%
47%53%
38%
21% 30%46%
0%
20%
40%
60%
80%
100%
Lower Early SE(n=19)
Middle Early SE(n=30)
Higher Early SE(n=24)
Perf vs. EarlySE (Low PC)
Gamma = 0.25
54%28%
13%
34%
40%
38%
12%32%
48%
0%10%20%30%40%50%60%70%80%90%
100%
Lower Early SE(n=50)
Middle Early SE(n=53)
Higher Early SE(n=52)
Perf vs. EarlySE
Gamma = 0.53
All
Higher Perf
Middle Perf
Lower Perf
Early SE is the MOST Important
The relationship:for the set of all programs 0.53 = Very Strongfor the set of Low Challenge programs 0.25 = Moderatefor the set of High Challenge programs 0.69 = Very Strong

22Quantifying the Effectiveness of SE01-Oct-2014© 2014 Carnegie Mellon University
Program Planning vs. Performance
54%
24% 22%
33%
42%28%
13%34%
50%
0%
20%
40%
60%
80%
100%
Lower SEC (n=48) Middle SEC(n=50)
Higher SEC(n=50)
Perf vs. SEC-PP
Gamma = 0.46 p-value = 0.000
All
Higher Perf
Middle Perf
Lower Perf
24% 19% 21%
59%44% 41%
18%37% 38%
0%
20%
40%
60%
80%
100%
Lower SEC(n=17)
Middle SEC(n=27)
Higher SEC(n=29)
Perf vs. SEC-PP (Low PC)
Gamma = 0.16 p-value = 0.313
71%
30% 24%
19%
39%
10%
10%30%
67%
0%
20%
40%
60%
80%
100%
Lower SEC(n=31)
Middle SEC(n=23)
Higher SEC(n=21)
Perf vs. SEC-PP (High PC)
Gamma = 0.65 p-value = 0.000
The relationship:for the set of all programs 0.46 = Very Strongfor the set of Low Challenge programs 0.16 = Weakfor the set of High Challenge programs 0.65 = Very Strong

23Quantifying the Effectiveness of SE01-Oct-2014© 2014 Carnegie Mellon University
Requirements Dev’t & Mg’t vs. Performance
50%30% 20%
29%52%
22%
21% 18%
58%
0%
20%
40%
60%
80%
100%
Lower SEC (n=48) Middle SEC(n=50)
Higher SEC(n=50)
Perf vs. SEC-REQ
Gamma = 0.44 p-value = 0.000
All
Higher Perf
Middle Perf
Lower Perf
35%15% 15%
40% 69%
30%
25% 15%
56%
0%
20%
40%
60%
80%
100%
Lower SEC(n=20)
Middle SEC(n=26)
Higher SEC(n=27)
Perf vs. SEC-REQ (Low PC)
Gamma = 0.36 p-value = 0.017
61% 46%26%
21%33%
13%
18% 21%
61%
0%
20%
40%
60%
80%
100%
Lower SEC(n=28)
Middle SEC(n=24)
Higher SEC(n=23)
Perf vs. SEC-REQ (High PC)
Gamma = 0.5 p-value = 0.001
The relationship:for the set of all programs 0.44 = Very Strongfor the set of Low Challenge programs 0.36 = Strongfor the set of High Challenge programs 0.50 = Very Strong

24Quantifying the Effectiveness of SE01-Oct-2014© 2014 Carnegie Mellon University
Verification vs. Performance
45% 38%19%
39%38%
28%
16% 24%
54%
0%
20%
40%
60%
80%
100%
Lower SEC (n=44) Middle SEC(n=50)
Higher SEC(n=54)
Perf vs. SEC-VER
Gamma = 0.43 p-value = 0.000
All
Higher Perf
Middle Perf
Lower Perf
22% 26% 15%
57% 52%
33%
22% 22%52%
0%
20%
40%
60%
80%
100%
Lower SEC(n=23)
Middle SEC(n=23)
Higher SEC(n=27)
Perf vs. SEC-VER (Low PC)
Gamma = 0.27 p-value = 0.084
71%48%
22%
19%
26%
22%
10%26%
56%
0%
20%
40%
60%
80%
100%
Lower SEC(n=21)
Middle SEC(n=27)
Higher SEC(n=27)
Perf vs. SEC-VER (High PC)
Gamma = 0.6 p-value = 0.000
The relationship:for the set of all programs 0.43 = Very Strongfor the set of Low Challenge programs 0.27 = Moderatefor the set of High Challenge programs 0.60 = Very Strong

25Quantifying the Effectiveness of SE01-Oct-2014© 2014 Carnegie Mellon University
Architecture vs. Performance
49%33%
18%
36%
35%
33%
16%31%
49%
0%
20%
40%
60%
80%
100%
Lower SEC (n=45) Middle SEC(n=54)
Higher SEC(n=49)
Perf vs. SEC-ARCH
Gamma = 0.41 p-value = 0.000
All
Higher Perf
Middle Perf
Lower Perf
33% 21% 8%
43%50%
46%
24% 29%46%
0%
20%
40%
60%
80%
100%
Lower SEC(n=21)
Middle SEC(n=28)
Higher SEC(n=24)
Perf vs. SEC-ARCH (Low PC)
Gamma = 0.31 p-value = 0.051
63%46%
28%
29%
19%20%
8%35%
52%
0%
20%
40%
60%
80%
100%
Lower SEC(n=24)
Middle SEC(n=26)
Higher SEC(n=25)
Perf vs. SEC-ARCH (High PC)
Gamma = 0.49 p-value = 0.001
The relationship:for the set of all programs 0.41 = Very Strongfor the set of Low Challenge programs 0.31 = Strongfor the set of High Challenge programs 0.49 = Very Strong
26Quantifying the Effectiveness of SE01-Oct-2014© 2014 Carnegie Mellon University
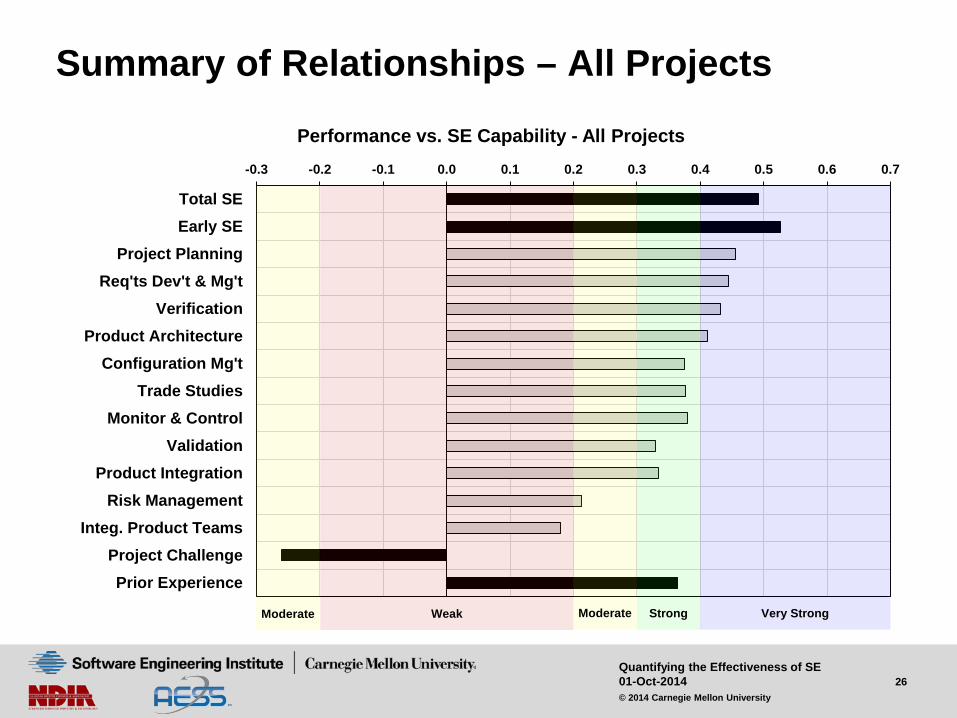
Summary of Relationships – All Projects
-0.3 -0.2 -0.1 0.0 0.1 0.2 0.3 0.4 0.5 0.6 0.7
Total SEEarly SE
Project PlanningReq'ts Dev't & Mg't
VerificationProduct Architecture
Configuration Mg'tTrade Studies
Monitor & ControlValidation
Product IntegrationRisk Management
Integ. Product TeamsProject ChallengePrior Experience
Performance vs. SE Capability - All Projects
StrongModerateWeakModerate Very Strong

27Quantifying the Effectiveness of SE01-Oct-2014© 2014 Carnegie Mellon University
Summary of Relationships - Challenging Projects
-0.3 -0.2 -0.1 0.0 0.1 0.2 0.3 0.4 0.5 0.6 0.7
Total SE
Early SE
Project Planning
Verification
Configuration Mg't
Monitor & Control
Req'ts Dev't & Mg't
Product Architecture
Validation
Trade Studies
Product Integration
Integ. Product Teams
Risk Management
Project Challenge
Prior Experience
Performance vs. SE Capability - High Challenge
StrongModerateWeakModerate Very Strong

28Quantifying the Effectiveness of SE01-Oct-2014© 2014 Carnegie Mellon University
Comparison with 2007 SE Effectiveness Study
On the whole, relationships identified in this study are noticeably stronger than those from the previous study• Probably due to reduction in noise resulting from the larger sample size
Most results from the two studies are generally in agreementprogram Performance vs. Total SE (2007)
39%
46%
15%
29%
59%
12%
31%
13%
56%
BestPerformance( x > 3.0 )
ModeratePerformance( 2.5 ≤ x ≤ 3.0 )
Lower Performance( x < 2.5 )
Lower Capability
( x ≤ 2.5 )N = 13
Moderate Capability
( 2.5 < x < 3.0 )N = 17
HigherCapability
(x ≥ 3.0 )N = 16
Gamma = 0.32p = 0.04
program PERFORMANCE vs. TOTAL SE CAPABILITY (2007)
1.00
0.75
0.50
0.25
0.00
52%
29%20%
33%
47%
24%
15% 24%
56%
Gamma = 0.49 p-value < 0.001

29Quantifying the Effectiveness of SE01-Oct-2014© 2014 Carnegie Mellon University
Using the Findings of This Study -1
System Developers can use this report to:• plan SE capability improvement efforts focusing on those SE activities most
strongly associated with improved program performance• serve as an industry benchmark for their organization’s SE performance.
– Assess programs within the organization and compare with the study results to leverage strengths, and improve weaknesses
• justify and defend SE activities applied to programs.
System Acquirers may use this report to:• incorporate SE requirements into RFPs and source selection activities
– Ensure that SE activities are included in schedules and budgets– Demand SE deliverables (e.g. SE Management Plan) during program execution– Require SE evaluations of contractors during source selection and during program
execution
• employ this survey or similar methods to collect data from during program execution as a means of identifying supplier SE deficiencies contributing to program risks.

30Quantifying the Effectiveness of SE01-Oct-2014© 2014 Carnegie Mellon University
Using the Findings of This Study -2
SE Educators may use this report to:• Focus curricula on key aspects of SE• Convey to students the value of SE
All may use this report to:• identify critical SE capabilities to guide Workforce Development

31Quantifying the Effectiveness of SE01-Oct-2014© 2014 Carnegie Mellon University
Defense vs. Non-defense Projects -1
The data from the 2012 SE Effectiveness Study included responses from both defense-domain and non-defense-domain projects
• Cross-domain comparison of SE deployment, project performance and the relationships between them can identify improvement opportunities through transplantation of best practices between domains
2.50
2.70
2.90
3.10
3.30
3.50Total SEC
Early SE
ProjectPlanning
Req'ts Dev't& Mg't
Verification
ProductArchitecture
ConfigurationMg't
TradeStudies
Monitor &Control
Validation
ProductIntegration
RiskManagement
Integ ProductTeams
DEF
Non-DEF
SYSTEMS ENGINEERING DEPLOYMENT
3.453.503.553.603.653.70
PerfS
PerfT
PerfC
Perf
DEF
Non-DEF
PROJECT PERFORMANCE
NEW !

32Quantifying the Effectiveness of SE01-Oct-2014© 2014 Carnegie Mellon University
Defense vs. Non-defense Projects -2
Next Steps: Investigate the differences between SE deployment / effectiveness in defense and non-defense domains to find “transplantable” best practices

33Quantifying the Effectiveness of SE01-Oct-2014© 2014 Carnegie Mellon University
Next Steps
Download the 2012 SE Effectiveness reports from the SEI website http://www.sei.cmu.edu/measurement/research/acquisition/Business-Case-SE.cfm
• The Business Case for Systems Engineering Study: Results of the Systems Engineering Effectiveness Survey
• The Business Case for Systems Engineering Study: Detailed Response Data
• The Business Case for Systems Engineering Study: Assessing Project Performance from Sparse Data
• The Business Case for Systems Engineering: Comparison of Defense Domain and Non-Defense Projects
Search for ways to apply the findings within your own work and your own organization.
Contact the SEI with questions or to obtain assistance.

34Quantifying the Effectiveness of SE01-Oct-2014© 2014 Carnegie Mellon University
SEI –Your Resource for Softwareand Systems Engineering
For more information, contact
Software Engineering Institute4500 Fifth AvenuePittsburgh, PA [email protected]
ORJoseph P. [email protected]

BACK UP
36Quantifying the Effectiveness of SE01-Oct-2014© 2014 Carnegie Mellon University
References
Elm, J.; Goldenson, D.; El Emam, K.; Donatelli, N.; Neisa, A. “A Survey of Systems Engineering Effectiveness – Initial Results”. Carnegie Mellon University; Pittsburgh, PA. 2007(available at http://resources.sei.cmu.edu/library/asset-view.cfm?assetid=8493)
Elm, J.; Goldenson, D. “The Business Case for Systems Engineering Study: Results of the Systems Engineering Effectiveness Survey”. Carnegie Mellon University; Pittsburgh, PA 2012 (available at http://resources.sei.cmu.edu/library/asset-view.cfm?assetid=34061)
Elm, J.; Goldenson, D. “The Business Case for Systems Engineering Study: Detailed Response Data”. Carnegie Mellon University; Pittsburgh, PA 2012(available at http://resources.sei.cmu.edu/library/asset-view.cfm?assetid=73582)
Elm, J. “The Business Case for Systems Engineering Study: Assessing Project Performance from Sparse Data”. Carnegie Mellon University; Pittsburgh, PA 2012(available at http://resources.sei.cmu.edu/library/asset-view.cfm?assetid=34055)
Elm, J.; Goldenson, D. “The Business Case for Systems Engineering: Comparison of Defense Domain and Non-Defense Projects”. Carnegie Mellon University; Pittsburgh, PA 2014(available at http://resources.sei.cmu.edu/library/asset-view.cfm?assetid=?????)
37Quantifying the Effectiveness of SE01-Oct-2014© 2014 Carnegie Mellon University
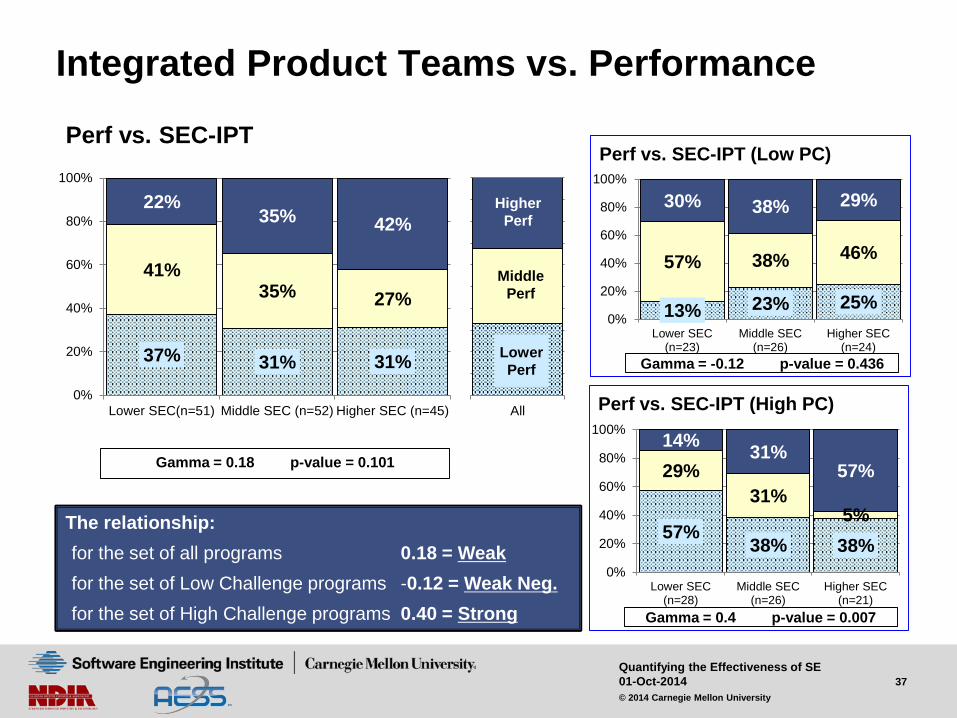
37% 31% 31%
41%35% 27%
22%35% 42%
0%
20%
40%
60%
80%
100%
Lower SEC(n=51) Middle SEC (n=52) Higher SEC (n=45)
Perf vs. SEC-IPT
Gamma = 0.18 p-value = 0.101
All
Higher Perf
Middle Perf
Lower Perf
13% 23% 25%
57% 38% 46%
30% 38% 29%
0%
20%
40%
60%
80%
100%
Lower SEC(n=23)
Middle SEC(n=26)
Higher SEC(n=24)
Perf vs. SEC-IPT (Low PC)
Gamma = -0.12 p-value = 0.436
57%38% 38%
29%31%
5%
14% 31%57%
0%
20%
40%
60%
80%
100%
Lower SEC(n=28)
Middle SEC(n=26)
Higher SEC(n=21)
Perf vs. SEC-IPT (High PC)
Gamma = 0.4 p-value = 0.007
Integrated Product Teams vs. Performance
The relationship:for the set of all programs 0.18 = Weakfor the set of Low Challenge programs -0.12 = Weak Neg.for the set of High Challenge programs 0.40 = Strong

38Quantifying the Effectiveness of SE01-Oct-2014© 2014 Carnegie Mellon University
38% 36% 26%
38% 36%30%
24% 29%43%
0%
20%
40%
60%
80%
100%
Lower SEC (n=50) Middle SEC (n=45) Higher SEC (n=53)
Perf vs. SEC-RSKM
Gamma = 0.21 p-value = 0.05
All
Higher Perf
Middle Perf
Lower Perf
14%33%
12%
67% 33%44%
19% 33% 44%
0%
20%
40%
60%
80%
100%
Lower SEC(n=21)
Middle SEC(n=27)
Higher SEC(n=25)
Perf vs. SEC-RSKM (Low PC)
Gamma = 0.18 p-value = 0.256
55%39% 39%
17% 39%18%
28% 22%43%
0%
20%
40%
60%
80%
100%
Lower SEC(n=29)
Middle SEC(n=18)
Higher SEC(n=28)
Perf vs. SEC-RSKM (High PC)
Gamma = 0.24 p-value = 0.124
Risk Management vs. Performance
The relationship:for the set of all programs 0.21 = Moderatefor the set of Low Challenge programs 0.18 = Weakfor the set of High Challenge programs 0.24 = Moderate

39Quantifying the Effectiveness of SE01-Oct-2014© 2014 Carnegie Mellon University
43% 33% 23%
43%
34%25%
13%33%
52%
0%
20%
40%
60%
80%
100%
Lower SEC (n=46) Middle SEC (n=58) Higher SEC (n=44)
Perf vs. SEC-TRD
Gamma = 0.38 p-value = 0
All
Higher Perf
Middle Perf
Lower Perf
26% 17% 21%
63%50% 29%
11%33%
50%
0%
20%
40%
60%
80%
100%
Lower SEC(n=19)
Middle SEC(n=30)
Higher SEC(n=24)
Perf vs. SEC-TRD (Low PC)
Gamma = 0.29 p-value = 0.062
56% 50%25%
30%18%
20%
15%32%
55%
0%
20%
40%
60%
80%
100%
Lower SEC(n=27)
Middle SEC(n=28)
Higher SEC(n=20)
Perf vs. SEC-TRD (High PC)
Gamma = 0.43 p-value = 0.004
Trade Studies vs. Performance
The relationship:for the set of all programs 0.38 = Strongfor the set of Low Challenge programs 0.29 = Moderatefor the set of High Challenge programs 0.43 = Very Strong

40Quantifying the Effectiveness of SE01-Oct-2014© 2014 Carnegie Mellon University
36% 38%21%
47% 34%
23%
17% 27%56%
0%
20%
40%
60%
80%
100%
Lower SEC (n=36) Middle SEC (n=73) Higher SEC (n=39)
Perf vs. SEC-VAL
Gamma = 0.33 p-value = 0.003
All
Higher Perf
Middle Perf
Lower Perf
18% 26% 12%
55% 50%
29%
27% 24%59%
0%
20%
40%
60%
80%
100%
Lower SEC(n=22)
Middle SEC(n=34)
Higher SEC(n=17)
Perf vs. SEC-VAL (Low PC)
Gamma = 0.23 p-value = 0.127
64% 49%27%
36%
21%
18%
0%31%
55%
0%
20%
40%
60%
80%
100%
Lower SEC(n=14)
Middle SEC(n=39)
Higher SEC(n=22)
Perf vs. SEC-VAL (High PC)
Gamma = 0.48 p-value = 0.002
Validation vs. Performance
The relationship:for the set of all programs 0.33 = Strongfor the set of Low Challenge programs 0.23 = Moderatefor the set of High Challenge programs 0.48 = Very Strong

41Quantifying the Effectiveness of SE01-Oct-2014© 2014 Carnegie Mellon University
50%30% 26%
34%
38%26%
16%32%
49%
0%
20%
40%
60%
80%
100%
Lower SEC (n=32) Middle SEC (n=81) Higher SEC (n=35)
Perf vs. SEC-PI
Gamma = 0.33 p-value = 0.003
All
Higher Perf
Middle Perf
Lower Perf
33%17% 18%
47%51% 35%
20% 32% 47%
0%
20%
40%
60%
80%
100%
Lower SEC(n=15)
Middle SEC(n=41)
Higher SEC(n=17)
Perf vs. SEC-PI (Low PC)
Gamma = 0.23 p-value = 0.153
65%43% 33%
24%
25%17%
12%33%
50%
0%
20%
40%
60%
80%
100%
Lower SEC(n=17)
Middle SEC(n=40)
Higher SEC(n=18)
Perf vs. SEC-PI (High PC)
Gamma = 0.42 p-value = 0.01
Product Integration vs. Performance
The relationship:for the set of all programs 0.33 = Strongfor the set of Low Challenge programs 0.23 = Moderatefor the set of High Challenge programs 0.42 = Very Strong

42Quantifying the Effectiveness of SE01-Oct-2014© 2014 Carnegie Mellon University
46%27% 21%
37%
33%32%
17%39% 47%
0%
20%
40%
60%
80%
100%
Lower SEC (n=59) Middle SEC (n=51) Higher SEC (n=38)
Perf vs. SEC-CM
Gamma = 0.38 p-value = 0.001
All
Higher Perf
Middle Perf
Lower Perf
27% 16% 17%
53%40% 44%
20%44% 39%
0%
20%
40%
60%
80%
100%
Lower SEC(n=30)
Middle SEC(n=25)
Higher SEC(n=18)
Perf vs. SEC-CM (Low PC)
Gamma = 0.22 p-value = 0.203
66%38% 25%
21%
27%20%
14%35%
55%
0%
20%
40%
60%
80%
100%
Lower SEC(n=29)
Middle SEC(n=26)
Higher SEC(n=20)
Perf vs. SEC-CM (High PC)
Gamma = 0.53 p-value = 0
Configuration Management vs. Performance
The relationship:for the set of all programs 0.38 = Strongfor the set of Low Challenge programs 0.22 = Moderatefor the set of High Challenge programs 0.53 = Very Strong

43Quantifying the Effectiveness of SE01-Oct-2014© 2014 Carnegie Mellon University
46%33%
21%
38%37%
29%
17%31%
50%
0%
20%
40%
60%
80%
100%
Lower SEC (n=48) Middle SEC (n=52) Higher SEC (n=48)
Perf vs. SEC-PMC
Gamma = 0.38 p-value = 0
All
Higher Perf
Middle Perf
Lower Perf
27% 20% 14%
54%44%
41%
19%36% 45%
0%
20%
40%
60%
80%
100%
Lower SEC(n=26)
Middle SEC(n=25)
Higher SEC(n=22)
Perf vs. SEC-PMC (Low PC)
Gamma = 0.27 p-value = 0.092
68%44%
27%
18%30%
19%
14% 26%54%
0%
20%
40%
60%
80%
100%
Lower SEC(n=22)
Middle SEC(n=27)
Higher SEC(n=26)
Perf vs. SEC-PMC (High PC)
Gamma = 0.53 p-value = 0
Program Monitoring & Control vs. Performance
The relationship:for the set of all programs 0.38 = Strongfor the set of Low Challenge programs 0.27 = Moderatefor the set of High Challenge programs 0.53 = Very Strong