quantifying pm emissions and assessing health impacts · 03/03/2017 · quantifying pm emissions...
TRANSCRIPT

Quantifying PM emissions and assessing health impacts
Jing Wang
Air Quality and Particle Technology Institute of Environmental Engineering
ETH Zurich/Empa

CO2
H2O
NOx
CO
UHC
Soot
Chemical
Reactions
Microphysical
Processes
O3 Formation
Secondary Aerosol Formation
Contrail Formation
Modification of Cloud Properties
Climate
Change
Environmental
Degradation
SO2
Social
Welfare
Human
Health
Aircraft Emissions and Impact
2 Air Quality & Particle Technology (APT)

Aircraft Engine Emission Measurement
Our project contributes significantly to a certification requirement and an international standard for aircraft engine PM emissions by the International Civil Aviation Organization (ICAO).
3
1950 1960 1970 1980 1990 2000 20100
10
20
30
40
50
60
GE90 (B777)GEnx (B787)
PW4000 (B747)CFM56 (A320, B737)
JT9D (B747)
JT8D (B727)
Max
. Sm
oke
Num
ber [
-]
JT3D (B707)
current smoke regulations introduced
From smoke number to PM (particulate matter) number and mass.
Air Quality & Particle Technology (APT)

ICAO Standard on Particulates
4
2016/02/02: The Committee on Aviation Environmental Protection of the International Civil Aviation Organization (ICAO) approved a preliminary standard governing the emission of particulates by aircraft engines. 2017/03/03: Final approval of the standard by the ICAO council. 2020/01/01: All engine types for passenger aircrafts should be certified in accordance with the new standard.
Air Quality & Particle Technology (APT)

A-PRIDE Campaigns Aviation Particle Regulatory Instrumentation Demonstration Experiments
5
Lobo et al. AS&T, 2015. Kilic et al. ES&T 2017.
Air Quality & Particle Technology (APT)

Particle Size Distribution
6
GMD CFM56-7B26/3 GMD CFM56-7B24/3 GMD CFM56-7B24 GMD PW4168A GSD CFM56-7B26/3 GSD CFM56-7B24/3 GSD CFM56-7B24 GSD PW4168A
0 20 40 60 80 1000
5
10
15
20
25
30
35
40
45
50
55
R2=0.935
FC,rel [% F00]
geom
etric
mea
n di
amet
er [n
m] R2=0.991
1.41.61.82.02.22.42.62.83.03.23.43.63.8
geom
etric
sta
ndar
d de
viat
ion
Durdina et al, Atmospheric Environment, 2014. Liati et al. ES&T, 2014. Johnson et al, J. Propulsion & Power, 2015. Abegglen et al, J. Aerosol Sci, 2015. Boies et al, AS&T, 2015. Abegglen et al, Atmospheric Environment, 2016.
10 1000.0
5.0E5
1.0E6
1.5E6
2.0E6
2.5E6
3.0E6
CMD: 50nmGSD: 1.67
dN/ d
LogD
p [c
m-3]
Electrical Mobility Diameter [nm]
7 % Engine Power 98 % Engine Power
CMD: 24nmGSD: 1.51
Air Quality & Particle Technology (APT)

Non-volatile PM Emission Indices • CFM56-7B, 90’s technology mid-size turbofan: used on Boeing 737; one of
the most common aircraft engines worldwide, more than 20,000 units built
• High number emissions at low engine fuel flow that do not correlate with
mass emissions • Engine maintenance status and temperature effects visible in the number
emissions
Mass Number
0 1000 2000 3000 4000 5000
0.00
0.05
0.10
0.15
0.20
121113 130809 130823 130604 130319 130327 130521 130719
Ei P
MM
ass [
g kg
-1]
Engine Fuel Flow [kg hr-1]
-5 0 5 10 15 20 25 30
Ambient Temperature [°C]
0 1000 2000 3000 4000 50000.0
5.0E14
1.0E15
1.5E15
2.0E15
2.5E15
121113 130809 130823 130604 130319 130327 130521 130719
Ei P
MN
umbe
r [kg
-1]
Engine Fuel Flow [kg hr-1]
Ambient Temperature [°C]
-5 0 5 10 15 20 25 30
7 Air Quality & Particle Technology (APT)

Fuel Aromatics and Emissions
(Bockhorn 1983)
8
Fuel rich pockets within the flame promote reactions that form heavy PAHs which subsequently pyrolyze and form soot particles.
18 19 20 21 22 23 24
1.0
1.2
1.4
1.6 Solvesso 150ND Solvesso 150
Ei nv
PM N
umbe
r / E
i nvPM
Num
ber @
Tot
al A
rom
atic
s =
17.8
% v
/v
Total Aromatics [% v/v]
25.00
40.00
55.00
70.00
85.00
100.0
Thrust
13.8 13.9 14.0 14.1 14.2 14.3
1.0
1.2
1.4
1.6b) Solvesso 150ND
Solvesso 150
Ei nv
PM N
umbe
r / E
i nvPM
Num
ber @
H =
14.
31%
m/m
H [% m/m]
25.00
40.00
55.00
70.00
85.00
100.0
Thrust [%]
Air Quality & Particle Technology (APT)
Brem et al. ES&T, 2015. Durdina et al. ES&T, 2017.

Alternative Aviation Fuel Effect
9
CFM56-2 50/50 Shell FT/JP-8
CFM56-2 50/50 Sasol FT/JP-8
CFM56-7 50/50 FT/Jet A-1 Aerodyne
CFM56-7 50/50 FT/Jet A-1 MST
F117 50/50 JP-8/HRJ(tallow)
F117 50/25/25 JP-8/HRJ/FT(Ctl)
TF33 50/50 FT/JP-8
JT15D 50/50 F1/FT
JT15D50/50 F2/FT
PW308C 50/50 FT/JP-8
T63 50/50 Shell FT/JP-8 Blend
T63 50/50 Sasol FT/JP-8 Blend
No
rmali
zed
Part
icle
Nu
mb
er
EI
(EI n
Fu
el/
EI n
Base
lin
e F
uel)
Power (%)
JP-8/Jet A1
APU
300 350 400 450 500 550 600 650
APU Exhaust Gas Tempture(°C)
APU 50/50 HEFA/Jet A-1 Blend
0 20 40 60 80 100
0.0
0.2
0.4
0.6
0.8
1.0
1.2
F117PW308C
CFM56-7
The low aromatic content levels of AAFs lead to significant reduction of particle emissions at low engine power settings. Air Quality & Particle Technology (APT)

Comparing Airplane and Vehicle Emissoins
• Model plane: Boeing 737NG (~30% of all 100+ seater
airliners)
Air Quality & Particle Technology (APT)
Durdina et al. ES&T, 2017.
10

Flight Profiles
11
Flight profile used in the model (blue line) based on flight radar data (gray lines). Note the different time scale for the cruise data.
Air Quality & Particle Technology (APT)

Emission Depends on Engine Power
thrust:
0.5
2
5
20
50
1
10
100
2E13
5E13
2E14
5E14
2E15
1E13
1E14
1E15
100%85%30%
combustor inlet temperature T3
EI m
[mg/
kgfu
el]
combustor inlet temperature T3
7%
EI n [#
/kg fu
el]
100%85%30%7%
Air Quality & Particle Technology (APT) 12

Ground Data to Flight Conditions
13
1E-3
0.01
0.1
EI m
[g/k
g fue
l]
combustor inlet temperature T3
Eim,SLS
EIm = EIm,SLS x KP3 x KAFR x KTFL
Combustor inlet pressure effect Air-fuel ratio effect
Adiabatic flame temperature effect ≈1
1E16
1E17
1E18
[#
/g n
vPM
]
combustor inlet temperature T3
EIn = ν(T3) x EIm
Howard et al. AEDC-TR-96-3 1996
Assumption: GMD is a function of T3 independent of altitude
Air Quality & Particle Technology (APT)

Emission Dependence on Flight Time
14
• Flight profile (climb, descent) based on flight radar data for Boeing 737 flights
• LTO and climb emissions are dominant for short flights
1 2 3 4 5 6 70.0
0.5
1.0
1.5
2.0
15.0% H2
BC m
ass
[mg/
pass
enge
rkm
-1]
flight time without LTO [h]
600 1400 2200 3000 3800 4600 5400 great circle distance [km]
13.8% H2
0.0E+00
1.0E+13
2.0E+13
3.0E+13
4.0E+13
5.0E+13
6.0E+13
BC n
umbe
r [#
/pas
seng
erk
m-1]
Air Quality & Particle Technology (APT)

Emissions Comparison
15
• Assumed plane occupancy 80% (130 pass.), 30 bus passengers, and 2 car passengers
• Mass emissions comparable with gasoline vehicles • Number emissions relatively high, comparable with old diesel
cars
bus D
bus DPF
car D
car DPF
car GDI
car PFI
this study
0.01 0.1 1 10
b)
BC mass [mg/passenger/km]
3h, 1
4.3%
H2
a)
bus D
bus DPF
car D
car DPF
car GDI
car PFI
this study
1E10 1E11 1E12 1E13 1E14
3h, 1
4.3%
H2
BC number [#/passenger/km]
Air Quality & Particle Technology (APT)

PM Health Impacts
16
- Vehicle emissions There exist strong evidence that exposure to diesel exhaust
particles is associated with an increased risk of lung cancer. International Agency for Research on Cancer classified diesel
engine exhaust as carcinogenic to humans (Group 1) (IARC, 2012).
The exhaust of gasoline engines is also suspected as carcinogenic (Group 2B) (IARC, 2012).
- Aircraft emissions Only a few studies have established a specific link between
exposure to pollution in an airport work environment and respiratory problems.
The link is weak and there are not enough data to demonstrate a cause-effect relationship.
Air Quality & Particle Technology (APT)

Reported Respiratory Symptoms
17
People exposed Respiratory symptoms References
Airport vicinity exposure
Coughing, shortness of
breath, wheezing onset and
decreased lung function
Staatsen et al. 1994;
Schiphol Airport,
Amsterdam.
Exacerbation of pre-existing
respiratory diseases
Health Council of the
Netherlands, 1999.
Airport occupational
exposure
A runny nose and a cough
with phlegm
Tunnicliffe et al. 1999;
Birmingham Airport
Chest illnesses Whelan et al. 2003; flight
attendants.
Exacerbation of pre-existing
respiratory diseases
LaPuma et al. 1999; aircraft
painting operation.
Air Quality & Particle Technology (APT)

Health Impact on Airport Workers
18
Exposu
re
group
Workers Subject
s n
Comments Median
time in
aircraft
taxiing
area h/day
Crude prevalence of respiratory
problems
Running
nose
Cough with
phlegm
Shortness
of breath
Wheezing
High Baggage handlers;
Airport hands;
Marshalers;
Operational
Engineers
53 Considerable
proportion of
working day in close
proximity to in-
service aircrafts
8 58% 36% 25% 13%
Mediu
m
Security staff; Fire
fighters; Airfield
operation managers
83 Some of working
time on the airport
apron, in reasonable
proximity of aircrafts
1 42% 16% 22% 17%
Low Terminal and office
workers
86 0 45% 36% 24% 20%
Occupational exposure of Birmingham International Airport workers and respiratory disorders.
Tunnicliffe et al. Occup Environ Med 1999; Touri et al. Eur Respir Rev 2013.
Air Quality & Particle Technology (APT)

PM Based Modeling for Health Impact
19
Barrett group used concentration-response functions to estimate premature deaths due to population exposure to aviation-attributable emissions: - It is reported that global aircraft emissions of PM2.5 caused ∼10 000 premature deaths per year globally, with 80% due to cruise emissions (Barrett et al. ES&T 2010). - The current UK aviation emissions caused ∼110 premature deaths per year (Yim et al. Atmos. Environ. 2013). - Aviation emissions of PM2.5 and ozone cause∼16 000 (90% CI: 8300–24 000) premature deaths per year, costs of ∼$21 bn per year (Yim et al. Environ. Res. Lett. 2015).
Air Quality & Particle Technology (APT)
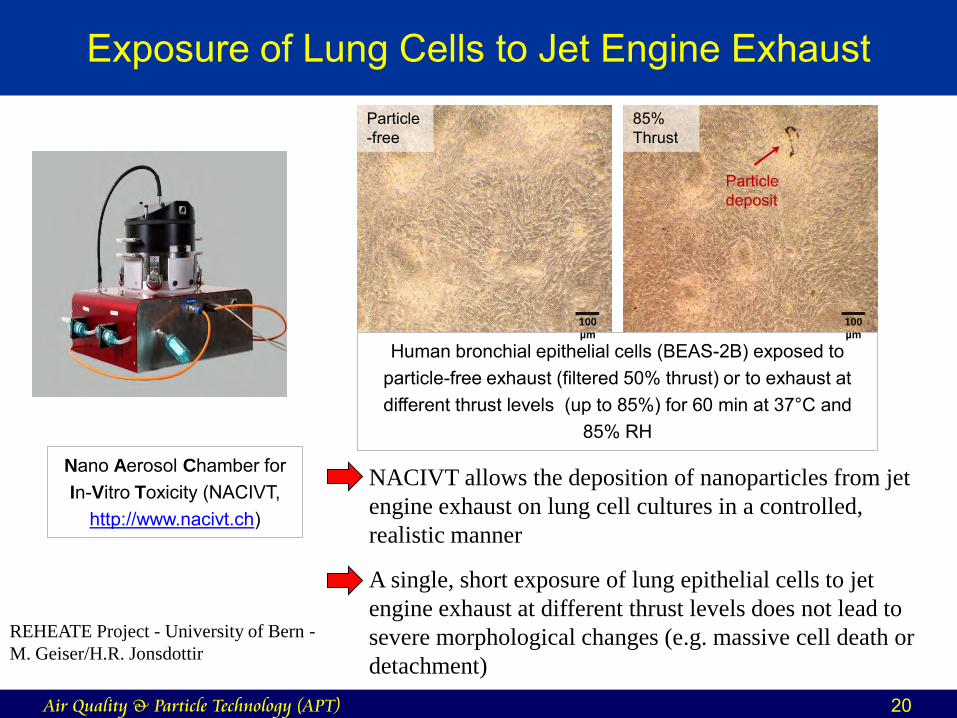
Exposure of Lung Cells to Jet Engine Exhaust
REHEATE Project - University of Bern -
M. Geiser/H.R. Jonsdottir
Particle-free
Human bronchial epithelial cells (BEAS-2B) exposed to particle-free exhaust (filtered 50% thrust) or to exhaust at different thrust levels (up to 85%) for 60 min at 37°C and
85% RH
Nano Aerosol Chamber for In-Vitro Toxicity (NACIVT,
http://www.nacivt.ch)
NACIVT allows the deposition of nanoparticles from jet
engine exhaust on lung cell cultures in a controlled,
realistic manner
A single, short exposure of lung epithelial cells to jet
engine exhaust at different thrust levels does not lead to
severe morphological changes (e.g. massive cell death or
detachment)
85% Thrust
Particle deposit
100
µm
100
µm
Air Quality & Particle Technology (APT) 20

Summary
21
• Mass and number based particle emission indices depend on engine type, conditions, and are sensitive to fuel composition.
• The emission particle sizes are small, generally the peak size is below 50 nm. The size is smaller at lower thrust.
• Higher fuel aromatic contents lead to higher particle emissions. Alternative aviation fuels can reduce the emissions.
• PM from Boeing 737NG is comparable with gasoline vehicles in terms of mass, and higher in terms of number.
• The aircraft emissions have been shown related to respiratory symptom for airport workers and nearby residents in limited studies, however, no cause-effect relationship is demonstrated.
Air Quality & Particle Technology (APT)