quantification of the potential biocontrol and direct...
TRANSCRIPT
Biological Control 90 (2015) 173–186
Contents lists available at ScienceDirect
Biological Control
journal homepage: www.elsevier .com/locate /ybcon
Quantification of the potential biocontrol and direct plant growthpromotion abilities based on multiple biological traits distinguishdifferent groups of Pseudomonas spp. isolates q
http://dx.doi.org/10.1016/j.biocontrol.2015.07.0031049-9644/� 2015 Elsevier Inc. All rights reserved.
q Rizobacter Argentina S.A. has priority access to the bacterial isolates reported here.⇑ Corresponding author at: Laboratorio de Bioquímica, Microbiología e Interacciones Biológicas en el Suelo, Departamento de Ciencia y Tecnología, Universidad Na
Quilmes, Roque Sáenz Peña 352, Bernal B1876BXD, Buenos Aires, Argentina.E-mail addresses: [email protected], [email protected] (B.C. Agaras).
Betina C. Agaras a,⇑, Mercedes Scandiani b, Alicia Luque b, Leticia Fernández c, Florencia Farina a,Marcelo Carmona d, Marcela Gally d, Ana Romero d, Luis Wall a, Claudio Valverde a
a Laboratorio de Bioquímica, Microbiología e Interacciones Biológicas en el Suelo, Departamento de Ciencia y Tecnología, Universidad Nacional de Quilmes, Buenos Aires, Argentinab Centro de Referencia de Micología, Facultad de Ciencias Bioquímicas y Farmacéuticas, Universidad Nacional de Rosario, Santa Fe, Argentinac Departamento de Agronomía, Universidad Nacional del Sur, Buenos Aires, Argentinad Cátedra de Fitopatología, Facultad de Agronomía, Universidad de Buenos Aires, Argentina
h i g h l i g h t s
� Nineteen pseudomonads withantifungal activity were isolated andcharacterized.� Antagonism against 12 fungi and
multiple promotion traits werequantified.� PCA clustered isolates into two
groups: biocontrol and directpromotion potentials.� Novel indexes could help to classify
native isolates by their potential asPGPR.� Results suggest biocontrol and direct
promotion traits do not converge insame strains.
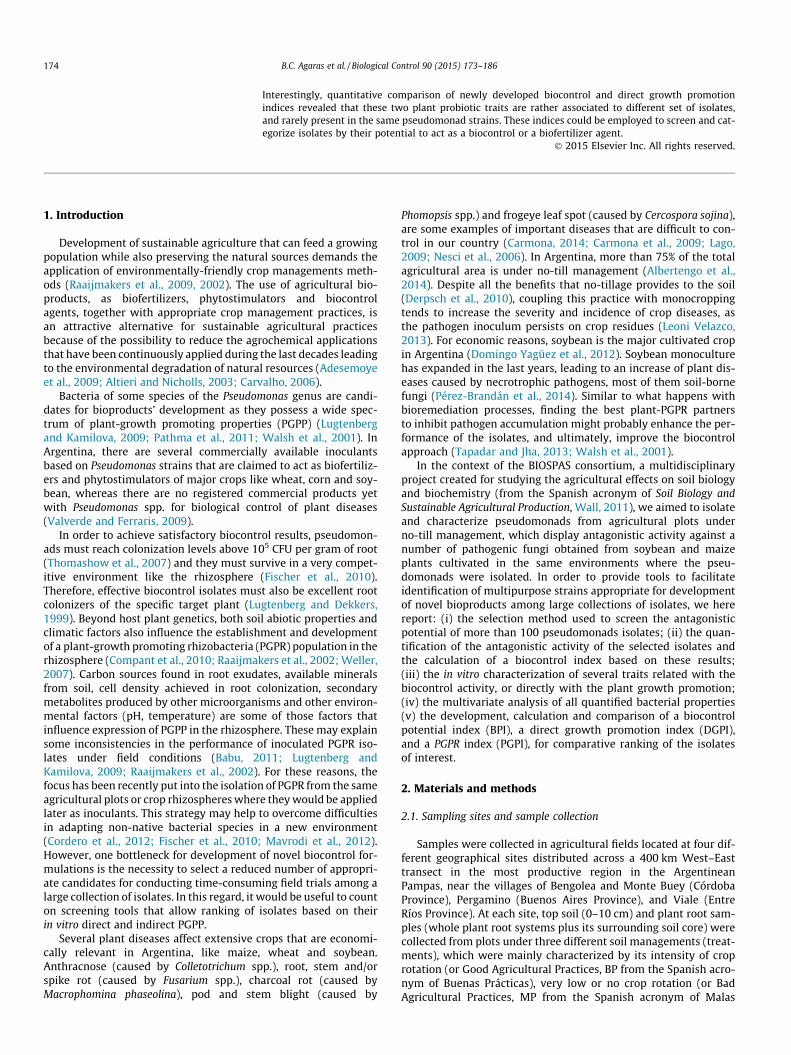
g r a p h i c a l a b s t r a c t
a r t i c l e i n f o
Article history:Received 19 January 2015Revised 22 June 2015Accepted 9 July 2015Available online 10 July 2015
Keywords:PseudomonasFungal antagonismPlant probiotic traitsBiological indicesPGPR
a b s t r a c t
Members of the Pseudomonas genus colonize the rhizosphere of different plant species and displayplant-probiotic traits. Therefore, they are interesting candidates for biological agricultural inputs to stim-ulate plant development and/or promote crop health. We have generated a collection of 19 isolates ofpseudomonads obtained from either bulk soil or the rhizosphere of healthy individuals of major exten-sive crops from different plots under no-till management located in Argentina. Isolates were selectedfor their ability to antagonize several fungal pathogens recovered from infected soybean and maizeplants. Partial sequencing of 16S rDNA, oprF and rpoB genes positioned isolates within all major pseu-domonads groups. Most isolates colonized the rhizosphere of soybean and maize seedlings withoutaffecting germination or development. Members of the Pseudomonas chlororaphis subgroup, and one iso-late of the Pseudomonas putida subgroup, displayed the widest antifungal spectrum and strongest antag-onistic potential. A principal component analysis based on the outcome of quantitative and qualitativetests related to biocontrol of fungal pathogens, direct plant growth promotion, and other rootcolonization-related traits, showed that isolates with the highest antagonistic potential and mostly of soilorigin were grouped together, whereas rhizospheric isolates and those with strong flagellar-dependentmotility, exoprotease production and biofilm development, were clustered in a separate group.
cional de
174 B.C. Agaras et al. / Biological Control 90 (2015) 173–186
Interestingly, quantitative comparison of newly developed biocontrol and direct growth promotionindices revealed that these two plant probiotic traits are rather associated to different set of isolates,and rarely present in the same pseudomonad strains. These indices could be employed to screen and cat-egorize isolates by their potential to act as a biocontrol or a biofertilizer agent.
� 2015 Elsevier Inc. All rights reserved.
1. Introduction
Development of sustainable agriculture that can feed a growingpopulation while also preserving the natural sources demands theapplication of environmentally-friendly crop managements meth-ods (Raaijmakers et al., 2009, 2002). The use of agricultural bio-products, as biofertilizers, phytostimulators and biocontrolagents, together with appropriate crop management practices, isan attractive alternative for sustainable agricultural practicesbecause of the possibility to reduce the agrochemical applicationsthat have been continuously applied during the last decades leadingto the environmental degradation of natural resources (Adesemoyeet al., 2009; Altieri and Nicholls, 2003; Carvalho, 2006).
Bacteria of some species of the Pseudomonas genus are candi-dates for bioproducts’ development as they possess a wide spec-trum of plant-growth promoting properties (PGPP) (Lugtenbergand Kamilova, 2009; Pathma et al., 2011; Walsh et al., 2001). InArgentina, there are several commercially available inoculantsbased on Pseudomonas strains that are claimed to act as biofertiliz-ers and phytostimulators of major crops like wheat, corn and soy-bean, whereas there are no registered commercial products yetwith Pseudomonas spp. for biological control of plant diseases(Valverde and Ferraris, 2009).
In order to achieve satisfactory biocontrol results, pseudomon-ads must reach colonization levels above 105 CFU per gram of root(Thomashow et al., 2007) and they must survive in a very compet-itive environment like the rhizosphere (Fischer et al., 2010).Therefore, effective biocontrol isolates must also be excellent rootcolonizers of the specific target plant (Lugtenberg and Dekkers,1999). Beyond host plant genetics, both soil abiotic properties andclimatic factors also influence the establishment and developmentof a plant-growth promoting rhizobacteria (PGPR) population in therhizosphere (Compant et al., 2010; Raaijmakers et al., 2002; Weller,2007). Carbon sources found in root exudates, available mineralsfrom soil, cell density achieved in root colonization, secondarymetabolites produced by other microorganisms and other environ-mental factors (pH, temperature) are some of those factors thatinfluence expression of PGPP in the rhizosphere. These may explainsome inconsistencies in the performance of inoculated PGPR iso-lates under field conditions (Babu, 2011; Lugtenberg andKamilova, 2009; Raaijmakers et al., 2002). For these reasons, thefocus has been recently put into the isolation of PGPR from the sameagricultural plots or crop rhizospheres where they would be appliedlater as inoculants. This strategy may help to overcome difficultiesin adapting non-native bacterial species in a new environment(Cordero et al., 2012; Fischer et al., 2010; Mavrodi et al., 2012).However, one bottleneck for development of novel biocontrol for-mulations is the necessity to select a reduced number of appropri-ate candidates for conducting time-consuming field trials among alarge collection of isolates. In this regard, it would be useful to counton screening tools that allow ranking of isolates based on theirin vitro direct and indirect PGPP.
Several plant diseases affect extensive crops that are economi-cally relevant in Argentina, like maize, wheat and soybean.Anthracnose (caused by Colletotrichum spp.), root, stem and/orspike rot (caused by Fusarium spp.), charcoal rot (caused byMacrophomina phaseolina), pod and stem blight (caused by
Phomopsis spp.) and frogeye leaf spot (caused by Cercospora sojina),are some examples of important diseases that are difficult to con-trol in our country (Carmona, 2014; Carmona et al., 2009; Lago,2009; Nesci et al., 2006). In Argentina, more than 75% of the totalagricultural area is under no-till management (Albertengo et al.,2014). Despite all the benefits that no-tillage provides to the soil(Derpsch et al., 2010), coupling this practice with monocroppingtends to increase the severity and incidence of crop diseases, asthe pathogen inoculum persists on crop residues (Leoni Velazco,2013). For economic reasons, soybean is the major cultivated cropin Argentina (Domingo Yagüez et al., 2012). Soybean monoculturehas expanded in the last years, leading to an increase of plant dis-eases caused by necrotrophic pathogens, most of them soil-bornefungi (Pérez-Brandán et al., 2014). Similar to what happens withbioremediation processes, finding the best plant-PGPR partnersto inhibit pathogen accumulation might probably enhance the per-formance of the isolates, and ultimately, improve the biocontrolapproach (Tapadar and Jha, 2013; Walsh et al., 2001).
In the context of the BIOSPAS consortium, a multidisciplinaryproject created for studying the agricultural effects on soil biologyand biochemistry (from the Spanish acronym of Soil Biology andSustainable Agricultural Production, Wall, 2011), we aimed to isolateand characterize pseudomonads from agricultural plots underno-till management, which display antagonistic activity against anumber of pathogenic fungi obtained from soybean and maizeplants cultivated in the same environments where the pseu-domonads were isolated. In order to provide tools to facilitateidentification of multipurpose strains appropriate for developmentof novel bioproducts among large collections of isolates, we herereport: (i) the selection method used to screen the antagonisticpotential of more than 100 pseudomonads isolates; (ii) the quan-tification of the antagonistic activity of the selected isolates andthe calculation of a biocontrol index based on these results;(iii) the in vitro characterization of several traits related with thebiocontrol activity, or directly with the plant growth promotion;(iv) the multivariate analysis of all quantified bacterial properties(v) the development, calculation and comparison of a biocontrolpotential index (BPI), a direct growth promotion index (DGPI),and a PGPR index (PGPI), for comparative ranking of the isolatesof interest.
2. Materials and methods
2.1. Sampling sites and sample collection
Samples were collected in agricultural fields located at four dif-ferent geographical sites distributed across a 400 km West–Easttransect in the most productive region in the ArgentineanPampas, near the villages of Bengolea and Monte Buey (CórdobaProvince), Pergamino (Buenos Aires Province), and Viale (EntreRíos Province). At each site, top soil (0–10 cm) and plant root sam-ples (whole plant root systems plus its surrounding soil core) werecollected from plots under three different soil managements (treat-ments), which were mainly characterized by its intensity of croprotation (or Good Agricultural Practices, BP from the Spanish acro-nym of Buenas Prácticas), very low or no crop rotation (or BadAgricultural Practices, MP from the Spanish acronym of Malas
B.C. Agaras et al. / Biological Control 90 (2015) 173–186 175
Prácticas), and natural grassland nearby BP and MP plots where noagriculture was practiced for at least 30 years (natural environ-ment, AN from the Spanish acronym of Ambiente Natural). Thegeographical coordinates, physicochemical properties and therecords of agricultural management and crop yields of the sampledfields are reported elsewhere (Agaras et al., 2012; Figuerola et al.,2012). Samples were kept at 4 �C until processing in the lab.
2.2. Isolation and conservation of pseudomonads
Soil and rhizosphere samples from samplings done in July 2009and February 2010 were processed as described previously todetermine quantitative and qualitatively their pseudomonads pop-ulation (Agaras et al., 2014, 2012). After performing plate counts onPseudomonas-selective medium S1 (Gould et al., 1985), those colo-nies with morphological differences among samplings, werere-streaked on S1 plates and on nutrient agar plates (tryptonesoy agar 40 g/l; yeast extract 5 g/l; Biokar). A collection of morethan 100 different isolates was generated from all agriculturaltreatment samples from all locations. Isolates were stored at�80 �C in multiwell plates containing per well 200 ll of an over-night culture in nutrient-yeast broth (NYB, nutrient broth 20 g/l;yeast extract 5 g/l; Biokar) supplemented with glycerol at 20%.We designated the isolates’ names as acronyms of the sample type(S, bulk soil; R, rhizosphere); the sampling site (B, Bengolea; M,Monte Buey; P, Pergamino; V, Viale) and the agricultural manage-ment (AN, BP or MP, see Section 2.1 for references), followed by itsserial number. For instance, isolate SVBP6 corresponds to isolate#6 from bulk soil (S) of a plot located in Viale (V) that was man-aged under good agricultural practices (BP).
2.3. Isolation and characterization of the fungal pathogens
Fungi associated with stems, shoots and roots were isolatedduring 2010 from selected diseased plants from the same afore-mentioned agricultural plots (Table 1). Plants were carefullyremoved from plots, stored in paper bags and returned to the lab-oratory for isolation of fungi. Symptomatic fragments of roots andshoots were washed in tap water, cut in 1 cm pieces and surfacedisinfested for 2–3 min in sodium hypochlorite (0.1%), washedwith sterilized distilled water 2–3 min, and allowed to dry on ster-ilized paper. Small fragments of tissues were transferred to Petridishes containing potato dextrose agar (Laboratorios Britania)amended with streptomycin 100 mg/L (PDAS) (Singleton et al.,1993). Plates were incubated at 25 �C for 7 days in the dark. Aftercolony development, myceliar fragments were transferred ontoPDAS plates, and pure cultures were obtained by dilution plating.Isolates were grown on PDA slants, identified using morphology(Leslie and Summerell, 2006; Scandiani and Luque, 2009), andstored in the Culture Collection of CEREMIC (Centro deReferencia de Micología, Rosario, Argentina). The fungal pathogenC. sojina CCC 172-2009 was originally isolated from leaves of thesame area, but not the same plots, during 2009 and it was charac-terized in earlier studies (Carmona et al., 2009; Scandiani et al.,2012).
2.4. Antifungal-based selection of Pseudomonas isolates
To select pseudomonads isolates with biocontrol potential, bac-teria and fungi were challenged in PDA plates. Fungi were grown inmalt extract (1.5 g/l, Biokar, France) at 24 �C and 200 rpm (between4 and 10 days, depending on the isolate). One hundred microlitresfrom each culture were spread as a lawn onto PDA plates, and then,sets of 20–30 Pseudomonas isolates were streaked on each PDAplate (Supplementary Fig. 1a). The incubation period was between4 and 10 days at 24–25 �C, i.e., the time that the fungal mycelium
took to reach the border of a control plate without bacteria.Those pseudomonads that showed an inhibition halo around theirstreaks in the screening plates were selected to perform singleantagonism assays (Supplementary Fig. 1b) by streaking the isolateon opposite sides of a PDA plate, and placing an agar plug from afresh culture of each fungal pathogen in the center. Incubation con-ditions were the same as for the screening assays. Isolates that con-firmed their antagonistic potential against two or more fungalpathogens were finally selected for further characterization.
2.5. Taxonomical assignment of the selected Pseudomonas isolates
16S rDNA, rpoB and oprF gene fragments were amplified by PCRfrom thermal cell lysates and partially sequenced by Macrogen Inc.(Seoul, Korea), as previously described (Agaras et al., 2012; Tayebet al., 2005). The obtained 16S rDNA sequences were first used toquery the Seqmatch tool of the Ribosomal database project II(Cole et al., 2009), and partial oprF and rpoB sequences were ana-lyzed with the BlastN tool in the NCBI database. In order toapproach the taxonomical position within the establishedPseudomonas complexes (Bodilis et al., 2011; Mulet et al., 2010;Ramette et al., 2011), phylogenetic analyses were carried out withconcatenated partial 16S rDNA, rpoB and oprF sequences (Muletet al., 2010; Agaras et al., 2012). For this, we selected 510 nt withinthe 5’ region of the 16S rRNA gene (positions 110–619 inPseudomonas protegens Pf-5, AJ417072) plus 480 nt within the 5’region of the rpoB gene (positions 1575–2085 in P. protegensPf-5; NC_004129.6) and 510 nt of the oprF gene (positions 263–742in P. protegens Pf-5, NC004129). The corresponding concatenatedsequences of reference strains were included in the analysis.Neighbor-joining trees were inferred from evolutionary distancescalculated with the Kimura 2-parameter formula, using the soft-ware MEGA v6 (Tamura et al., 2013). Confidence analyses wereundertaken using 1000 bootstrap replicates. All positions contain-ing alignment gaps and missing data were eliminated only in pair-wise sequence comparisons (Pairwise deletion option). A subgroupof 16S rDNA and oprF sequences has been already published(Agaras et al., 2012). Novel 16S rDNA and oprF sequences, andthe complete set of partial rpoB sequences have been depositedinto GenBank under accession numbers KP710764 to KP71082.
2.6. In vitro quantification of the antagonistic potential and calculationof the antagonism potential index
To quantify the fungal growth inhibitory activity of selected iso-lates, conidia suspensions of each fungus were prepared from freshplate cultures (4–10 days old, depending on every fungal patho-gen) with 3 ml of saline solution (NaCl 0.85%), and counted in aNeubauer chamber. Suspensions were normalized to a final con-centration of 2–4 � 108 conidia per ml. One hundred microlitresof these suspensions were spread onto triplicate PDA plates, andtwo 3 cm-streaks of each selected Pseudomonas isolate were madeat the middle of those plates (Supplementary Fig. 1b). Uponincubation (same conditions as described above), the length ofthe inhibition zones was measured to the nearest mm.
Based on the results of the average inhibition zones generatedby a single isolate against all tested fungi, we calculated the antag-onism potential index (API) as follows: ([hi/hmax
i])/n) � (number ofinhibited fungi/n). In this formula hi is the average inhibitory haloof the pseudomonad isolate over each of the tested fungi (n = 12,i.e., the total number of fungi tested; i = 1–12), and hmax
i is theaverage inhibitory halo of the pseudomonad isolate with the high-est antagonistic activity in the collection against each of the testedfungi.
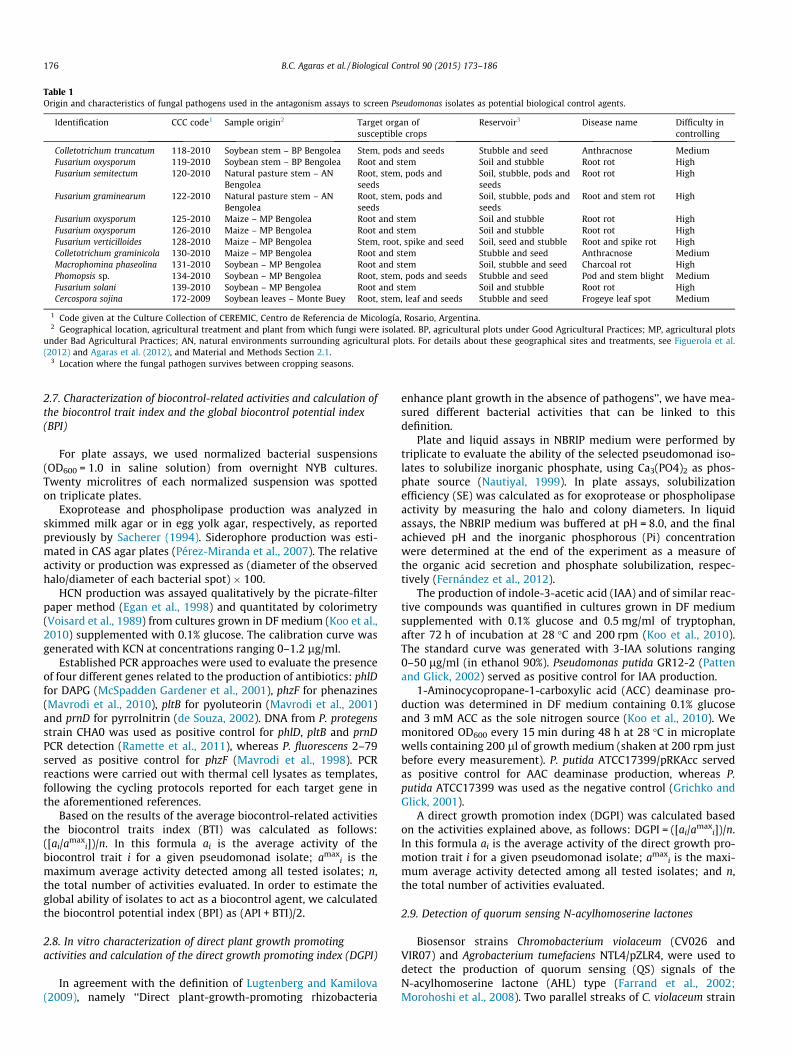
Table 1Origin and characteristics of fungal pathogens used in the antagonism assays to screen Pseudomonas isolates as potential biological control agents.
Identification CCC code1 Sample origin2 Target organ ofsusceptible crops
Reservoir3 Disease name Difficulty incontrolling
Colletotrichum truncatum 118-2010 Soybean stem – BP Bengolea Stem, pods and seeds Stubble and seed Anthracnose MediumFusarium oxysporum 119-2010 Soybean stem – BP Bengolea Root and stem Soil and stubble Root rot HighFusarium semitectum 120-2010 Natural pasture stem – AN
BengoleaRoot, stem, pods andseeds
Soil, stubble, pods andseeds
Root rot High
Fusarium graminearum 122-2010 Natural pasture stem – ANBengolea
Root, stem, pods andseeds
Soil, stubble, pods andseeds
Root and stem rot High
Fusarium oxysporum 125-2010 Maize – MP Bengolea Root and stem Soil and stubble Root rot HighFusarium oxysporum 126-2010 Maize – MP Bengolea Root and stem Soil and stubble Root rot HighFusarium verticilloides 128-2010 Maize – MP Bengolea Stem, root, spike and seed Soil, seed and stubble Root and spike rot HighColletotrichum graminicola 130-2010 Maize – MP Bengolea Root and stem Stubble and seed Anthracnose MediumMacrophomina phaseolina 131-2010 Soybean – MP Bengolea Root and stem Soil, stubble and seed Charcoal rot HighPhomopsis sp. 134-2010 Soybean – MP Bengolea Root, stem, pods and seeds Stubble and seed Pod and stem blight MediumFusarium solani 139-2010 Soybean – MP Bengolea Root and stem Soil and stubble Root rot HighCercospora sojina 172-2009 Soybean leaves – Monte Buey Root, stem, leaf and seeds Stubble and seed Frogeye leaf spot Medium
1 Code given at the Culture Collection of CEREMIC, Centro de Referencia de Micología, Rosario, Argentina.2 Geographical location, agricultural treatment and plant from which fungi were isolated. BP, agricultural plots under Good Agricultural Practices; MP, agricultural plots
under Bad Agricultural Practices; AN, natural environments surrounding agricultural plots. For details about these geographical sites and treatments, see Figuerola et al.(2012) and Agaras et al. (2012), and Material and Methods Section 2.1.
3 Location where the fungal pathogen survives between cropping seasons.
176 B.C. Agaras et al. / Biological Control 90 (2015) 173–186
2.7. Characterization of biocontrol-related activities and calculation ofthe biocontrol trait index and the global biocontrol potential index(BPI)
For plate assays, we used normalized bacterial suspensions(OD600 = 1.0 in saline solution) from overnight NYB cultures.Twenty microlitres of each normalized suspension was spottedon triplicate plates.
Exoprotease and phospholipase production was analyzed inskimmed milk agar or in egg yolk agar, respectively, as reportedpreviously by Sacherer (1994). Siderophore production was esti-mated in CAS agar plates (Pérez-Miranda et al., 2007). The relativeactivity or production was expressed as (diameter of the observedhalo/diameter of each bacterial spot) � 100.
HCN production was assayed qualitatively by the picrate-filterpaper method (Egan et al., 1998) and quantitated by colorimetry(Voisard et al., 1989) from cultures grown in DF medium (Koo et al.,2010) supplemented with 0.1% glucose. The calibration curve wasgenerated with KCN at concentrations ranging 0–1.2 lg/ml.
Established PCR approaches were used to evaluate the presenceof four different genes related to the production of antibiotics: phlDfor DAPG (McSpadden Gardener et al., 2001), phzF for phenazines(Mavrodi et al., 2010), pltB for pyoluteorin (Mavrodi et al., 2001)and prnD for pyrrolnitrin (de Souza, 2002). DNA from P. protegensstrain CHA0 was used as positive control for phlD, pltB and prnDPCR detection (Ramette et al., 2011), whereas P. fluorescens 2–79served as positive control for phzF (Mavrodi et al., 1998). PCRreactions were carried out with thermal cell lysates as templates,following the cycling protocols reported for each target gene inthe aforementioned references.
Based on the results of the average biocontrol-related activitiesthe biocontrol traits index (BTI) was calculated as follows:([ai/amax
i])/n. In this formula ai is the average activity of thebiocontrol trait i for a given pseudomonad isolate; amax
i is themaximum average activity detected among all tested isolates; n,the total number of activities evaluated. In order to estimate theglobal ability of isolates to act as a biocontrol agent, we calculatedthe biocontrol potential index (BPI) as (API + BTI)/2.
2.8. In vitro characterization of direct plant growth promotingactivities and calculation of the direct growth promoting index (DGPI)
In agreement with the definition of Lugtenberg and Kamilova(2009), namely ‘‘Direct plant-growth-promoting rhizobacteria
enhance plant growth in the absence of pathogens’’, we have mea-sured different bacterial activities that can be linked to thisdefinition.
Plate and liquid assays in NBRIP medium were performed bytriplicate to evaluate the ability of the selected pseudomonad iso-lates to solubilize inorganic phosphate, using Ca3(PO4)2 as phos-phate source (Nautiyal, 1999). In plate assays, solubilizationefficiency (SE) was calculated as for exoprotease or phospholipaseactivity by measuring the halo and colony diameters. In liquidassays, the NBRIP medium was buffered at pH = 8.0, and the finalachieved pH and the inorganic phosphorous (Pi) concentrationwere determined at the end of the experiment as a measure ofthe organic acid secretion and phosphate solubilization, respec-tively (Fernández et al., 2012).
The production of indole-3-acetic acid (IAA) and of similar reac-tive compounds was quantified in cultures grown in DF mediumsupplemented with 0.1% glucose and 0.5 mg/ml of tryptophan,after 72 h of incubation at 28 �C and 200 rpm (Koo et al., 2010).The standard curve was generated with 3-IAA solutions ranging0–50 lg/ml (in ethanol 90%). Pseudomonas putida GR12-2 (Pattenand Glick, 2002) served as positive control for IAA production.
1-Aminocycopropane-1-carboxylic acid (ACC) deaminase pro-duction was determined in DF medium containing 0.1% glucoseand 3 mM ACC as the sole nitrogen source (Koo et al., 2010). Wemonitored OD600 every 15 min during 48 h at 28 �C in microplatewells containing 200 ll of growth medium (shaken at 200 rpm justbefore every measurement). P. putida ATCC17399/pRKAcc servedas positive control for AAC deaminase production, whereas P.putida ATCC17399 was used as the negative control (Grichko andGlick, 2001).
A direct growth promotion index (DGPI) was calculated basedon the activities explained above, as follows: DGPI = ([ai/amax
i])/n.In this formula ai is the average activity of the direct growth pro-motion trait i for a given pseudomonad isolate; amax
i is the maxi-mum average activity detected among all tested isolates; and n,the total number of activities evaluated.
2.9. Detection of quorum sensing N-acylhomoserine lactones
Biosensor strains Chromobacterium violaceum (CV026 andVIR07) and Agrobacterium tumefaciens NTL4/pZLR4, were used todetect the production of quorum sensing (QS) signals of theN-acylhomoserine lactone (AHL) type (Farrand et al., 2002;Morohoshi et al., 2008). Two parallel streaks of C. violaceum strain
B.C. Agaras et al. / Biological Control 90 (2015) 173–186 177
CV026 or strain VIR07 were done along the middle of triplicate NAplates, with a separation of 1 cm from each other. At both sides ofthe streaks, 3 drops (10 ll) of normalized bacterial suspensions(OD600 = 1.0) were spotted. Violacein production by the AHL repor-ter strains was recorded after 48 h of incubation at 28 �C. P. aerug-inosa PAO1 was employed as a positive control whereas Escherichiacoli K12 served as a negative control. For the assay with A. tumefa-ciens, 3-ml overlays of soft water agar (0.7% w/v) containing 0.5 mlof a saturated culture from the indicator strain and 40 lg/ml of5-bromo-3-indolyl-b-D-galactopyranoside (X-Gal) was pouredonto NA plates. Upon solidification of the indicator overlays, 5 lldrops of normalized bacterial suspensions (OD600 = 1.0) were spot-ted. Plates were incubated at 28 �C for 48 h. A. tumefaciensNT1/pTiC58DaccR was employed as a positive control whereas A.tumefaciens NTL4 served as negative control (Cha et al., 1998;Farrand et al., 2002).
2.10. Motility assays
Swimming, swarming and twitching motility were evaluatedfor each selected isolate by triplicate plate assays using NYB sup-plemented with different agar concentrations (3, 5 and 7 g/l,respectively) (Rashid and Kornberg, 2000). Bacterial progress wasmeasured after 18 h of incubation at 28 �C.
2.11. Biofilm formation
We carried out static cultures in 96-multiwell polystyreneplates to analyze biofilm formation by the crystal violet methodafter 8 h of incubation at 28 �C (O’Toole and Kolter, 1998).Triplicate cultures were started with 100 ll of bacterial suspen-sions of OD600 = 0.2 in M63 medium supplemented with 0.4% ofglucose and 0.4% of casaminoacids. After the incubation period,the liquid phase was removed for measurement of OD600, theplanktonic cells and growth medium remnants were washed outtwice with saline solution and the surface attached cells werestained with 0.2% (w/v) crystal violet. After 15 min, we added100 ll of ethanol 95% (v/v) to solubilize the dye and we measuredthe absorbance at 570 nm (Merritt et al., 2011). Additionally, weinspected biofilms that were developed statically during 20 h in24-multiwell plates, under an inverted microscope (LeicaDMI6000B). Images were taken with a DFC450 camera controlledby the Leica Applications Suite 3.7.0 software.
2.12. Calculation of the plant growth promoting index (PGPI)
In order to estimate an integrative index that takes into accountantagonism, biocontrol, direct growth promotion and colonizationtraits we calculated the PGPI as follow: PGPI = ([ai/amax
i])/n. In thisformula ai is the average activity of the trait i for a given pseu-domonad isolate; amax
i is the maximum average activity detectedamong all tested isolates; and n, the total number of activitiesevaluated.
2.13. Effects of the isolates on early germination and seedlingdevelopment of maize and soybean
We carried out greenhouse experiments with the 19 pseu-domonads isolates using 330 cm3 pots filled with vermiculite(n = 10). Maize seeds (Zea mays, experimental hybrid Sursem C3;germinative power, GP = 99%) were surfaced disinfected by soakingin 70% v/v ethanol for 1 min followed by treatment with 1% w/vsodium hypochlorite for 10 min. After six washes with 100 ml ofsterilized distilled water, surface-disinfected seeds were inocu-lated with 10 ml of a normalized bacterial suspensions ofOD600 = 1.0 or saline solution as a negative control. Soybean seeds
(Glycine max, Don Mario DM4970, GP = 93%) were not disinfected,as their PG decreased strongly after this process. Two seeds per potwere sown for both plants, and pots were kept watered bysub-irrigation with sterilized Jensen solution (Vincent, 1970).Germination (% emerged plants relative to sown seeds) and plantdevelopment (whole plant fresh weight) was evaluated after14 days (maize) or 21 days (soybean) of incubation in the green-house at 24–26 �C. To confirm a proper seed bacterization, inocu-lated seeds as well as root pieces from harvested plants, weredeposited onto S1 agar plates at 28 �C and incubated during 48 h,before inspecting the aspect of the bacterial outgrowth.
2.14. Statistics
Experiments were repeated at least twice and done by triplicateeach time. Average and standard deviation values were calculatedfrom recorded data and used to carry out ANOVA, t-test or linearregression analysis with the Infostat software (Di Rienzo et al.,2013). When appropriate, multiple comparison tests were donewith the algorithm Di Rienzo, Guzmán and Casanoves (DGC, basedon cluster) to evaluate if the differences among values were statis-tically significant. The tool ‘‘Difference between proportions’’ of the‘‘Inference based on two samples’’ analysis that belong to theInfostat software (Di Rienzo et al., 2013) was used to evaluate ger-mination percentages of inoculated versus control seeds. Unlessclarified in the text, all the analyses were done at p < 0.05.
Every quantified activity was considered to perform a PrincipalComponent Analysis (PCA) with the Infostat software (Di Rienzoet al., 2013). Average values for each quantitative test determinedfor every selected Pseudomonas isolate were included in the PCA.PCR and QS results for each isolate were given the following val-ues: 1 for positive, and 0 for negative. Other qualitative assayswere not included.
3. Results
3.1. Diversity of pseudomonads with antifungal activity isolated fromsoils and rhizospheres of agricultural plots of the Pampean Region inArgentina
A collection of 128 isolates with morphologically different col-ony types was generated from bulk soil and rhizosphere samplesfrom healthy crop plants obtained from agricultural plots underno tillage management between July 2009 and February 2010(Agaras et al., 2012). After screening for antagonism against a panelof 12 pathogenic fungus (Supplementary Fig. 1a), 19 of those iso-lates proved to inhibit the growth of two or more fungal pathogenslisted in Table 1. Therefore, they were selected for identificationand further characterization. There was no evident trend at firstglance in the geographical, soil management, type of sample (bulkor rhizosphere soil), or crop origin for the selected isolates(Supplementary Table 1).
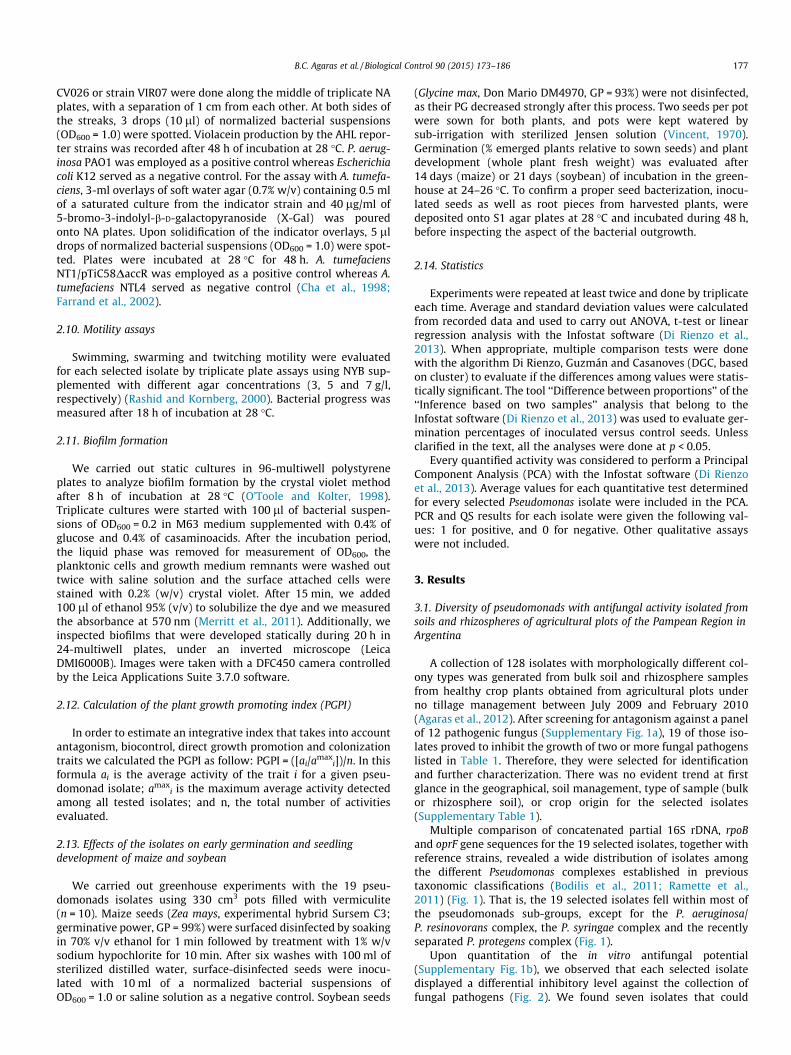
Multiple comparison of concatenated partial 16S rDNA, rpoBand oprF gene sequences for the 19 selected isolates, together withreference strains, revealed a wide distribution of isolates amongthe different Pseudomonas complexes established in previoustaxonomic classifications (Bodilis et al., 2011; Ramette et al.,2011) (Fig. 1). That is, the 19 selected isolates fell within most ofthe pseudomonads sub-groups, except for the P. aeruginosa/P. resinovorans complex, the P. syringae complex and the recentlyseparated P. protegens complex (Fig. 1).
Upon quantitation of the in vitro antifungal potential(Supplementary Fig. 1b), we observed that each selected isolatedisplayed a differential inhibitory level against the collection offungal pathogens (Fig. 2). We found seven isolates that could
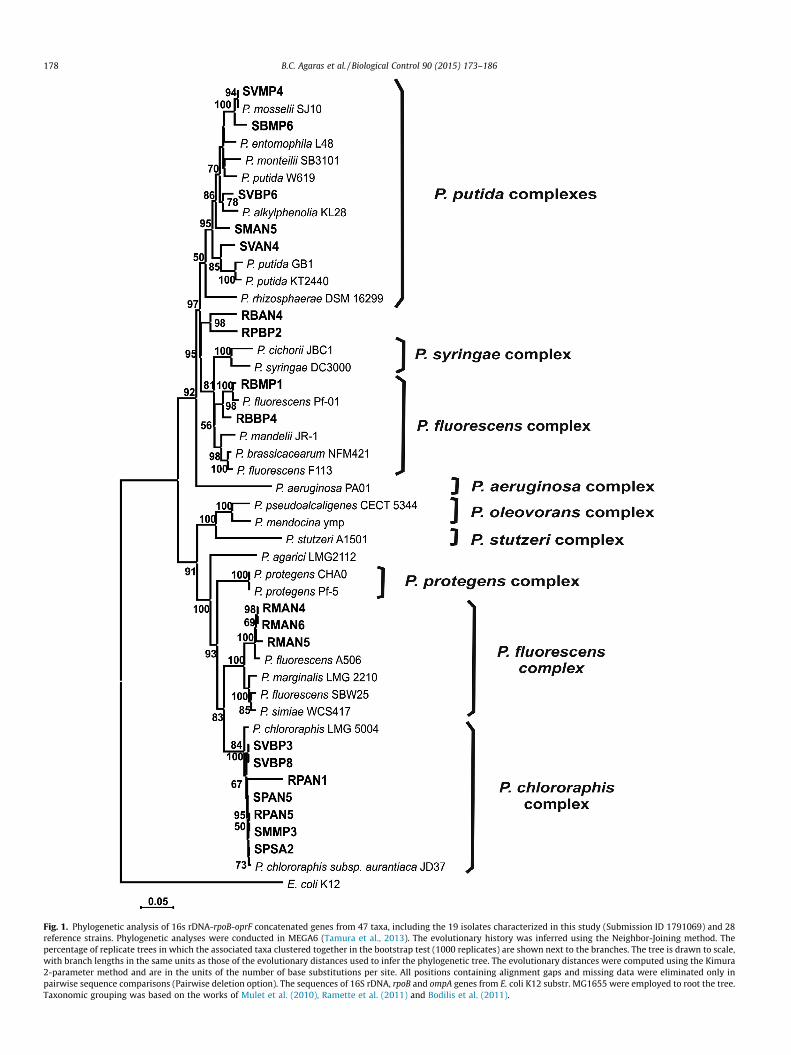
Fig. 1. Phylogenetic analysis of 16s rDNA-rpoB-oprF concatenated genes from 47 taxa, including the 19 isolates characterized in this study (Submission ID 1791069) and 28reference strains. Phylogenetic analyses were conducted in MEGA6 (Tamura et al., 2013). The evolutionary history was inferred using the Neighbor-Joining method. Thepercentage of replicate trees in which the associated taxa clustered together in the bootstrap test (1000 replicates) are shown next to the branches. The tree is drawn to scale,with branch lengths in the same units as those of the evolutionary distances used to infer the phylogenetic tree. The evolutionary distances were computed using the Kimura2-parameter method and are in the units of the number of base substitutions per site. All positions containing alignment gaps and missing data were eliminated only inpairwise sequence comparisons (Pairwise deletion option). The sequences of 16S rDNA, rpoB and ompA genes from E. coli K12 substr. MG1655 were employed to root the tree.Taxonomic grouping was based on the works of Mulet et al. (2010), Ramette et al. (2011) and Bodilis et al. (2011).
178 B.C. Agaras et al. / Biological Control 90 (2015) 173–186

Fig. 2. Fungal antagonistic potential of selected pseudomonads isolates. Vertical axis shows the cumulative values (in mm) of the inhibition halos that were measured forevery fungus challenged with each of the 19 pseudomonads isolates (x axis). The antagonistic potential against every fungal pathogen (i.e., the size of the inhibition halo) isrepresented by the high of the section bar assigned for every fungus (see legend).
Table 2Antagonism potential against fungal pathogens, quantitative indices based on in vitro PGPP, and taxonomic identification of each of the 19 tested Pseudomonas isolates.
Bacterial isolates Number of fungi inhibited1 API2 BTI3 BPI4 DGPI5 PGPI6 Pseudomonas complex7
RPAN5 12 0.78 0.65 0.72 0.49 0.60 P. chlororaphisSPSA2 12 0.74 0.68 0.71 0.50 0.60 P. chlororaphisSPAN5 12 0.77 0.64 0.70 0.48 0.58 P. chlororaphisSVBP3 12 0.70 0.64 0.67 0.13 0.45 P. chlororaphisSVBP8 12 0.69 0.60 0.65 0.33 0.49 P. chlororaphisSMMP3 12 0.61 0.59 0.60 0.37 0.49 P. chlororaphisSVBP6 12 0.75 0.32 0.53 0.46 0.47 P. putidaRPAN1 6 0.08 0.69 0.38 0.22 0.37 P. chlororaphisSVAN4 7 0.08 0.59 0.34 0.55 0.36 P. putidaRBAN4 4 0.02 0.62 0.32 0.54 0.39 P. aspleniiSMAN5 3 0.02 0.52 0.27 0.44 0.31 P. putidaRBMP1 2 0.01 0.51 0.26 0.37 0.28 P. fluorescensRMAN6 8 0.24 0.29 0.26 0.36 0.30 P. fluorescensRBBP4 2 0.01 0.37 0.19 0.55 0.27 P. fluorescensSBMP6 4 0.04 0.29 0.17 0.36 0.28 P. putidaSVMP4 4 0.05 0.24 0.14 0.42 0.31 P. putidaRMAN4 4 0.03 0.22 0.12 0.51 0.27 P. fluorescensRPBP2 4 0.02 0.21 0.12 0.43 0.23 P. aspleniiRMAN5 3 0.01 0.17 0.09 0.35 0.17 P. fluorescens
Isolates are arranged by their BPI values.1 Number of the fungi inhibited in vitro from the total of 12 fungi tested.2 Antagonism potential index, calculated with the formula explained in Section 2.6.3 Biocontrol traits index, calculated with the formula explained in Section 2.7.4 Biocontrol potential index, calculated with the formula explained in Section 2.7.5 Direct growth potential index, calculated with the formula explained in Section 2.8.6 Plant growth promoting index, calculated with the formula explained in Section 2.12.7 Taxonomic positions based on major phylogenetic subgroups shown in Fig. 1.
B.C. Agaras et al. / Biological Control 90 (2015) 173–186 179
inhibit the growth of all tested fungi (SMMP3, SPAN5, SPSA2,SVBP3, SVBP6, SVBP8 and RPAN5; highlighted in dark gray inTable 2 and Fig. 2); three isolates with an intermediate antagonisticactivity (SVAN4, RMAN6 and RPAN1; highlighted in light gray inTable 2 and Fig. 2); and nine isolates that could inhibit 30% or lessof the fungi tested (SBMP6, SMAN5, SVMP4, RBAN4, RBBP4,RBMP1, RMAN4, RMAN5 and RPBP2; Fig. 2). This qualitative classi-fication is consistent with the corresponding calculated API shownin Table 2. Pseudomonas chlororaphis-related isolates and isolateSVBP6, which has been tentatively assigned to the P. putida cluster,but phylogenetically closer to the P. alkylphenolia species (Fig. 1),had the highest antagonistic potential in terms of the number offungi antagonized and the individual fungal growth inhibition(Fig. 2). Interestingly, this API-based ranking also grouped
Pseudomonas isolates by their taxonomic identity, linking the bio-control potential with the phylogenetic classification (Table 2).
3.2. Biocontrol traits of the selected pseudomonad isolates
The antibiotic biosynthetic potential was studied by PCR detec-tion of the corresponding genes. The phzF gene, involved in phena-zine production, was detected in all P. chlororaphis-related isolates(Table 3). The prnD gene, required for pyrrolnitrin synthesis, wasdetected in some members of P. chlororaphis and P. putida com-plexes (Table 3). Only four isolates may be pyoluteorin producers,as they were positive for the pltB gene (Table 3). By contrast, noneof the 19 isolates was PCR positive for the phlD gene, involved inthe DAPG production.
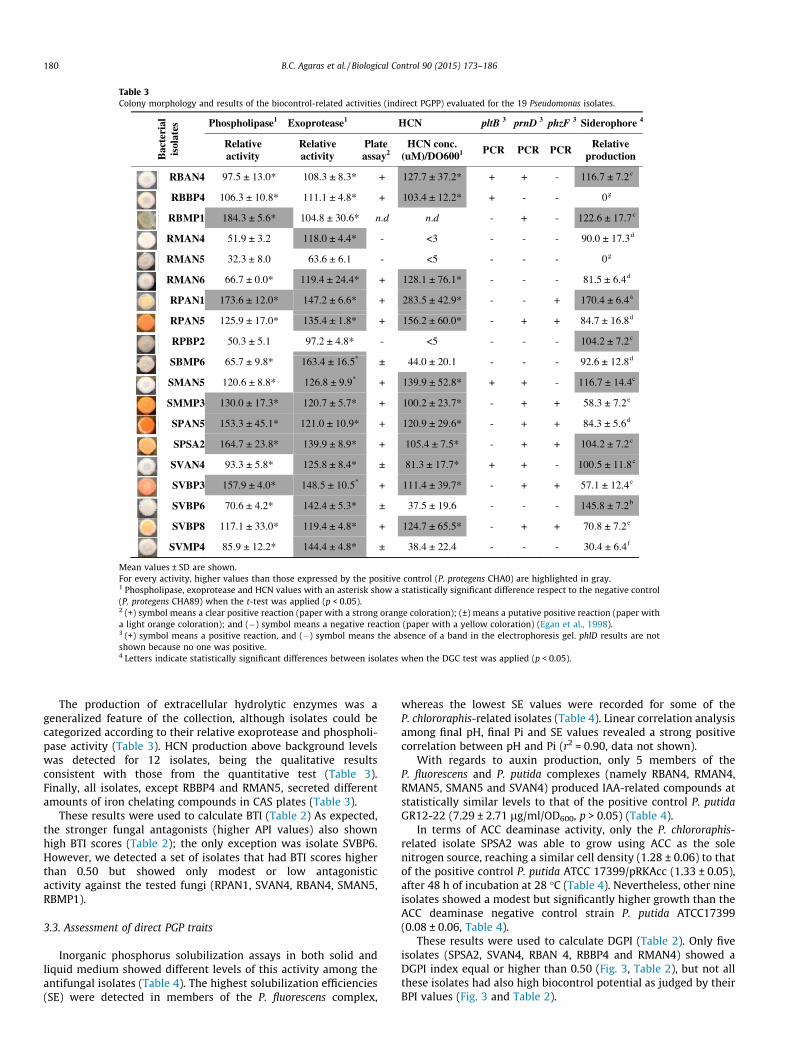
Table 3Colony morphology and results of the biocontrol-related activities (indirect PGPP) evaluated for the 19 Pseudomonas isolates.
Bac
teri
al
isol
ates Phospholipase1 Exoprotease1 HCN pltB 3 prnD 3 phzF 3 Siderophore 4
Relativeactivity
Relativeactivity
Plate assay2
HCN conc. (uM)/DO6001 PCR PCR PCR Relative
production
RBAN4 97.5 ± 13.0* 108.3 ± 8.3* + 127.7 ± 37.2* + + - 116.7 ± 7.2c
RBBP4 106.3 ± 10.8* 111.1 ± 4.8* + 103.4 ± 12.2* + - - 0g
RBMP1 184.3 ± 5.6* 104.8 ± 30.6* n.d n.d - + - 122.6 ± 17.7c
RMAN4 51.9 ± 3.2 118.0 ± 4.4* - <3 - - - 90.0 ± 17.3d
RMAN5 32.3 ± 8.0 63.6 ± 6.1 - <5 - - - 0g
RMAN6 66.7 ± 0.0* 119.4 ± 24.4* + 128.1 ± 76.1* - - - 81.5 ± 6.4d
RPAN1 173.6 ± 12.0* 147.2 ± 6.6* + 283.5 ± 42.9* - - + 170.4 ± 6.4a
RPAN5 125.9 ± 17.0* 135.4 ± 1.8* + 156.2 ± 60.0* - + + 84.7 ± 16.8d
RPBP2 50.3 ± 5.1 97.2 ± 4.8* - <5 - - - 104.2 ± 7.2c
SBMP6 65.7 ± 9.8* 163.4 ± 16.5* ± 44.0 ± 20.1 - - - 92.6 ± 12.8d
SMAN5 120.6 ± 8.8* 126.8 ± 9.9* + 139.9 ± 52.8* + + - 116.7 ± 14.4c
SMMP3 130.0 ± 17.3* 120.7 ± 5.7* + 100.2 ± 23.7* - + + 58.3 ± 7.2e
SPAN5 153.3 ± 45.1* 121.0 ± 10.9* + 120.9 ± 29.6* - + + 84.3 ± 5.6d
SPSA2 164.7 ± 23.8* 139.9 ± 8.9* + 105.4 ± 7.5* - + + 104.2 ± 7.2c
SVAN4 93.3 ± 5.8* 125.8 ± 8.4* ± 81.3 ± 17.7* + + - 100.5 ± 11.8c
SVBP3 157.9 ± 4.0* 148.5 ± 10.5* + 111.4 ± 39.7* - + + 57.1 ± 12.4e
SVBP6 70.6 ± 4.2* 142.4 ± 5.3* ± 37.5 ± 19.6 - - - 145.8 ± 7.2b
SVBP8 117.1 ± 33.0* 119.4 ± 4.8* + 124.7 ± 65.5* - + + 70.8 ± 7.2e
SVMP4 85.9 ± 12.2* 144.4 ± 4.8* ± 38.4 ± 22.4 - - - 30.4 ± 6.4f
Mean values ± SD are shown.For every activity, higher values than those expressed by the positive control (P. protegens CHA0) are highlighted in gray.1 Phospholipase, exoprotease and HCN values with an asterisk show a statistically significant difference respect to the negative control(P. protegens CHA89) when the t-test was applied (p < 0.05).2 (+) symbol means a clear positive reaction (paper with a strong orange coloration); (±) means a putative positive reaction (paper witha light orange coloration); and (�) symbol means a negative reaction (paper with a yellow coloration) (Egan et al., 1998).3 (+) symbol means a positive reaction, and (�) symbol means the absence of a band in the electrophoresis gel. phlD results are notshown because no one was positive.4 Letters indicate statistically significant differences between isolates when the DGC test was applied (p < 0.05).
180 B.C. Agaras et al. / Biological Control 90 (2015) 173–186
The production of extracellular hydrolytic enzymes was ageneralized feature of the collection, although isolates could becategorized according to their relative exoprotease and phospholi-pase activity (Table 3). HCN production above background levelswas detected for 12 isolates, being the qualitative resultsconsistent with those from the quantitative test (Table 3).Finally, all isolates, except RBBP4 and RMAN5, secreted differentamounts of iron chelating compounds in CAS plates (Table 3).
These results were used to calculate BTI (Table 2) As expected,the stronger fungal antagonists (higher API values) also shownhigh BTI scores (Table 2); the only exception was isolate SVBP6.However, we detected a set of isolates that had BTI scores higherthan 0.50 but showed only modest or low antagonisticactivity against the tested fungi (RPAN1, SVAN4, RBAN4, SMAN5,RBMP1).
3.3. Assessment of direct PGP traits
Inorganic phosphorus solubilization assays in both solid andliquid medium showed different levels of this activity among theantifungal isolates (Table 4). The highest solubilization efficiencies(SE) were detected in members of the P. fluorescens complex,
whereas the lowest SE values were recorded for some of theP. chlororaphis-related isolates (Table 4). Linear correlation analysisamong final pH, final Pi and SE values revealed a strong positivecorrelation between pH and Pi (r2 = 0.90, data not shown).
With regards to auxin production, only 5 members of theP. fluorescens and P. putida complexes (namely RBAN4, RMAN4,RMAN5, SMAN5 and SVAN4) produced IAA-related compounds atstatistically similar levels to that of the positive control P. putidaGR12-22 (7.29 ± 2.71 lg/ml/OD600, p > 0.05) (Table 4).
In terms of ACC deaminase activity, only the P. chlororaphis-related isolate SPSA2 was able to grow using ACC as the solenitrogen source, reaching a similar cell density (1.28 ± 0.06) to thatof the positive control P. putida ATCC 17399/pRKAcc (1.33 ± 0.05),after 48 h of incubation at 28 �C (Table 4). Nevertheless, other nineisolates showed a modest but significantly higher growth than theACC deaminase negative control strain P. putida ATCC17399(0.08 ± 0.06, Table 4).
These results were used to calculate DGPI (Table 2). Only fiveisolates (SPSA2, SVAN4, RBAN 4, RBBP4 and RMAN4) showed aDGPI index equal or higher than 0.50 (Fig. 3, Table 2), but not allthese isolates had also high biocontrol potential as judged by theirBPI values (Fig. 3 and Table 2).
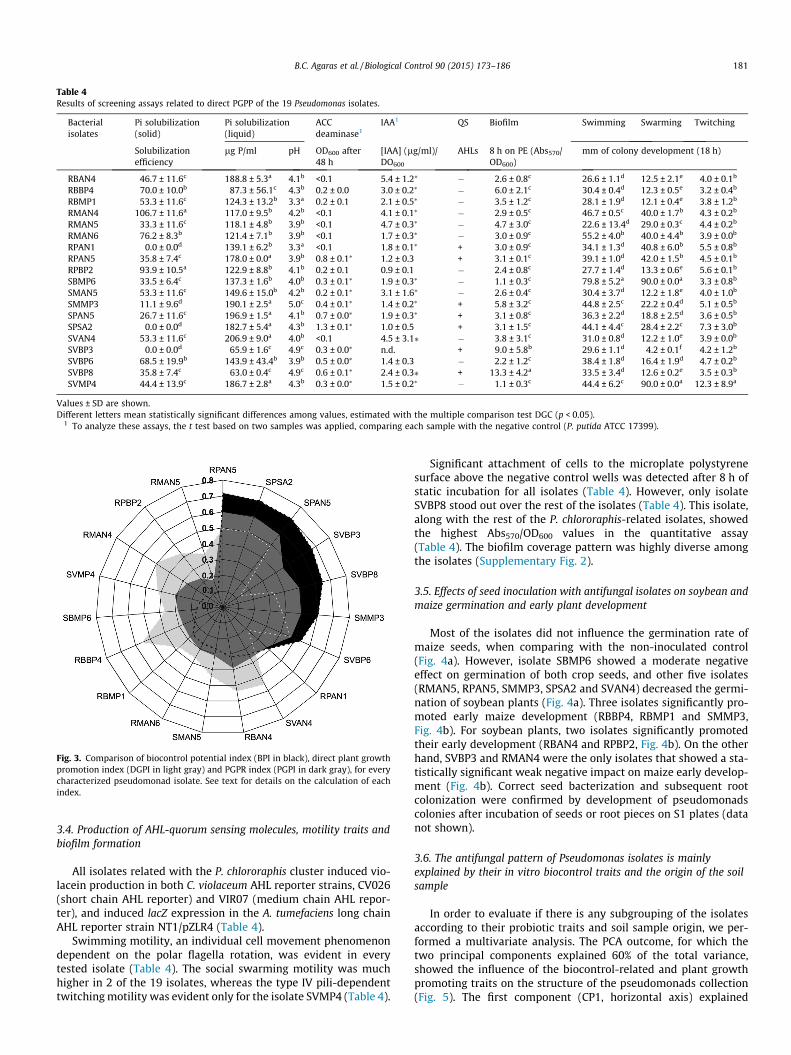
Table 4Results of screening assays related to direct PGPP of the 19 Pseudomonas isolates.
Bacterialisolates
Pi solubilization(solid)
Pi solubilization(liquid)
ACCdeaminase1
IAA1 QS Biofilm Swimming Swarming Twitching
Solubilizationefficiency
lg P/ml pH OD600 after48 h
[IAA] (lg/ml)/DO600
AHLs 8 h on PE (Abs570/OD600)
mm of colony development (18 h)
RBAN4 46.7 ± 11.6c 188.8 ± 5.3a 4.1b <0.1 5.4 ± 1.2⁄ � 2.6 ± 0.8c 26.6 ± 1.1d 12.5 ± 2.1e 4.0 ± 0.1b
RBBP4 70.0 ± 10.0b 87.3 ± 56.1c 4.3b 0.2 ± 0.0 3.0 ± 0.2⁄ � 6.0 ± 2.1c 30.4 ± 0.4d 12.3 ± 0.5e 3.2 ± 0.4b
RBMP1 53.3 ± 11.6c 124.3 ± 13.2b 3.3a 0.2 ± 0.1 2.1 ± 0.5⁄ � 3.5 ± 1.2c 28.1 ± 1.9d 12.1 ± 0.4e 3.8 ± 1.2b
RMAN4 106.7 ± 11.6a 117.0 ± 9.5b 4.2b <0.1 4.1 ± 0.1⁄ � 2.9 ± 0.5c 46.7 ± 0.5c 40.0 ± 1.7b 4.3 ± 0.2b
RMAN5 33.3 ± 11.6c 118.1 ± 4.8b 3.9b <0.1 4.7 ± 0.3⁄ � 4.7 ± 3.0c 22.6 ± 13.4d 29.0 ± 0.3c 4.4 ± 0.2b
RMAN6 76.2 ± 8.3b 121.4 ± 7.1b 3.9b <0.1 1.7 ± 0.3⁄ � 3.0 ± 0.9c 55.2 ± 4.0b 40.0 ± 4.4b 3.9 ± 0.0b
RPAN1 0.0 ± 0.0d 139.1 ± 6.2b 3.3a <0.1 1.8 ± 0.1⁄ + 3.0 ± 0.9c 34.1 ± 1.3d 40.8 ± 6.0b 5.5 ± 0.8b
RPAN5 35.8 ± 7.4c 178.0 ± 0.0a 3.9b 0.8 ± 0.1⁄ 1.2 ± 0.3 + 3.1 ± 0.1c 39.1 ± 1.0d 42.0 ± 1.5b 4.5 ± 0.1b
RPBP2 93.9 ± 10.5a 122.9 ± 8.8b 4.1b 0.2 ± 0.1 0.9 ± 0.1 � 2.4 ± 0.8c 27.7 ± 1.4d 13.3 ± 0.6e 5.6 ± 0.1b
SBMP6 33.5 ± 6.4c 137.3 ± 1.6b 4.0b 0.3 ± 0.1⁄ 1.9 ± 0.3⁄ � 1.1 ± 0.3c 79.8 ± 5.2a 90.0 ± 0.0a 3.3 ± 0.8b
SMAN5 53.3 ± 11.6c 149.6 ± 15.0b 4.2b 0.2 ± 0.1⁄ 3.1 ± 1.6⁄ � 2.6 ± 0.4c 30.4 ± 3.7d 12.2 ± 1.8e 4.0 ± 1.0b
SMMP3 11.1 ± 9.6d 190.1 ± 2.5a 5.0c 0.4 ± 0.1⁄ 1.4 ± 0.2⁄ + 5.8 ± 3.2c 44.8 ± 2.5c 22.2 ± 0.4d 5.1 ± 0.5b
SPAN5 26.7 ± 11.6c 196.9 ± 1.5a 4.1b 0.7 ± 0.0⁄ 1.9 ± 0.3⁄ + 3.1 ± 0.8c 36.3 ± 2.2d 18.8 ± 2.5d 3.6 ± 0.5b
SPSA2 0.0 ± 0.0d 182.7 ± 5.4a 4.3b 1.3 ± 0.1⁄ 1.0 ± 0.5 + 3.1 ± 1.5c 44.1 ± 4.4c 28.4 ± 2.2c 7.3 ± 3.0b
SVAN4 53.3 ± 11.6c 206.9 ± 9.0a 4.0b <0.1 4.5 ± 3.1⁄ � 3.8 ± 3.1c 31.0 ± 0.8d 12.2 ± 1.0e 3.9 ± 0.0b
SVBP3 0.0 ± 0.0d 65.9 ± 1.6c 4.9c 0.3 ± 0.0⁄ n.d. + 9.0 ± 5.8b 29.6 ± 1.1d 4.2 ± 0.1f 4.2 ± 1.2b
SVBP6 68.5 ± 19.9b 143.9 ± 43.4b 3.9b 0.5 ± 0.0⁄ 1.4 ± 0.3 � 2.2 ± 1.2c 38.4 ± 1.8d 16.4 ± 1.9d 4.7 ± 0.2b
SVBP8 35.8 ± 7.4c 63.0 ± 0.4c 4.9c 0.6 ± 0.1⁄ 2.4 ± 0.3⁄ + 13.3 ± 4.2a 33.5 ± 3.4d 12.6 ± 0.2e 3.5 ± 0.3b
SVMP4 44.4 ± 13.9c 186.7 ± 2.8a 4.3b 0.3 ± 0.0⁄ 1.5 ± 0.2⁄ � 1.1 ± 0.3c 44.4 ± 6.2c 90.0 ± 0.0a 12.3 ± 8.9a
Values ± SD are shown.Different letters mean statistically significant differences among values, estimated with the multiple comparison test DGC (p < 0.05).
1 To analyze these assays, the t test based on two samples was applied, comparing each sample with the negative control (P. putida ATCC 17399).
Fig. 3. Comparison of biocontrol potential index (BPI in black), direct plant growthpromotion index (DGPI in light gray) and PGPR index (PGPI in dark gray), for everycharacterized pseudomonad isolate. See text for details on the calculation of eachindex.
B.C. Agaras et al. / Biological Control 90 (2015) 173–186 181
3.4. Production of AHL-quorum sensing molecules, motility traits andbiofilm formation
All isolates related with the P. chlororaphis cluster induced vio-lacein production in both C. violaceum AHL reporter strains, CV026(short chain AHL reporter) and VIR07 (medium chain AHL repor-ter), and induced lacZ expression in the A. tumefaciens long chainAHL reporter strain NT1/pZLR4 (Table 4).
Swimming motility, an individual cell movement phenomenondependent on the polar flagella rotation, was evident in everytested isolate (Table 4). The social swarming motility was muchhigher in 2 of the 19 isolates, whereas the type IV pili-dependenttwitching motility was evident only for the isolate SVMP4 (Table 4).
Significant attachment of cells to the microplate polystyrenesurface above the negative control wells was detected after 8 h ofstatic incubation for all isolates (Table 4). However, only isolateSVBP8 stood out over the rest of the isolates (Table 4). This isolate,along with the rest of the P. chlororaphis-related isolates, showedthe highest Abs570/OD600 values in the quantitative assay(Table 4). The biofilm coverage pattern was highly diverse amongthe isolates (Supplementary Fig. 2).
3.5. Effects of seed inoculation with antifungal isolates on soybean andmaize germination and early plant development
Most of the isolates did not influence the germination rate ofmaize seeds, when comparing with the non-inoculated control(Fig. 4a). However, isolate SBMP6 showed a moderate negativeeffect on germination of both crop seeds, and other five isolates(RMAN5, RPAN5, SMMP3, SPSA2 and SVAN4) decreased the germi-nation of soybean plants (Fig. 4a). Three isolates significantly pro-moted early maize development (RBBP4, RBMP1 and SMMP3,Fig. 4b). For soybean plants, two isolates significantly promotedtheir early development (RBAN4 and RPBP2, Fig. 4b). On the otherhand, SVBP3 and RMAN4 were the only isolates that showed a sta-tistically significant weak negative impact on maize early develop-ment (Fig. 4b). Correct seed bacterization and subsequent rootcolonization were confirmed by development of pseudomonadscolonies after incubation of seeds or root pieces on S1 plates (datanot shown).
3.6. The antifungal pattern of Pseudomonas isolates is mainlyexplained by their in vitro biocontrol traits and the origin of the soilsample
In order to evaluate if there is any subgrouping of the isolatesaccording to their probiotic traits and soil sample origin, we per-formed a multivariate analysis. The PCA outcome, for which thetwo principal components explained 60% of the total variance,showed the influence of the biocontrol-related and plant growthpromoting traits on the structure of the pseudomonads collection(Fig. 5). The first component (CP1, horizontal axis) explained
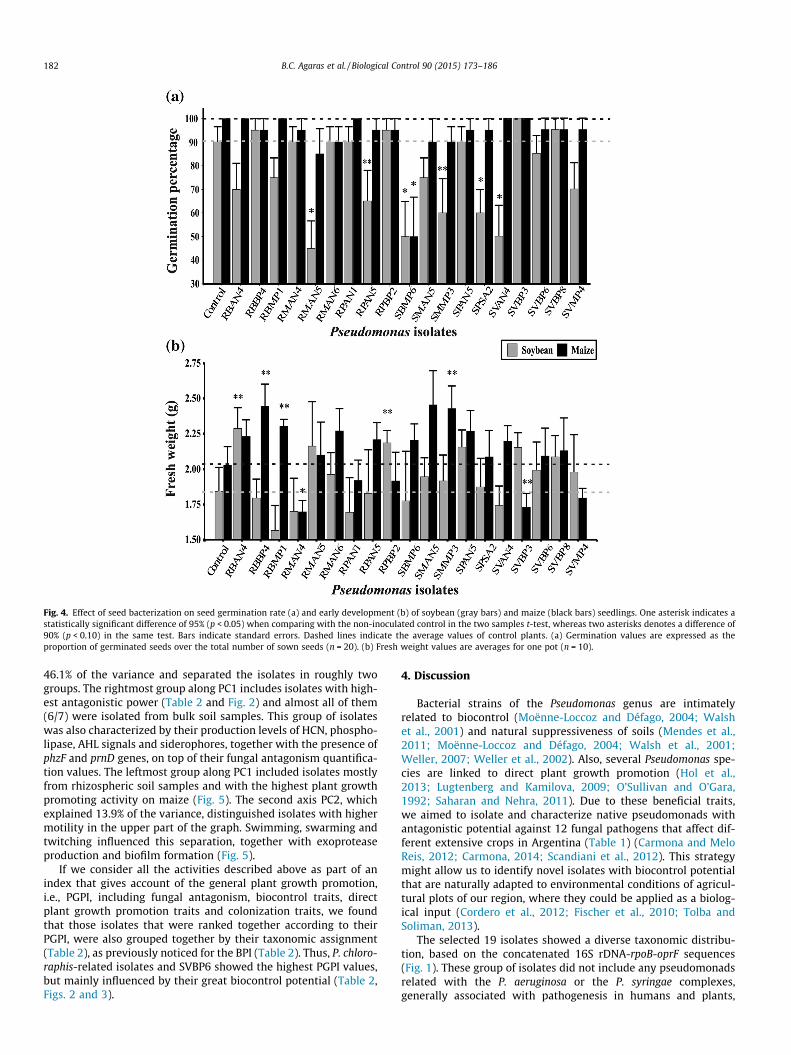
Fig. 4. Effect of seed bacterization on seed germination rate (a) and early development (b) of soybean (gray bars) and maize (black bars) seedlings. One asterisk indicates astatistically significant difference of 95% (p < 0.05) when comparing with the non-inoculated control in the two samples t-test, whereas two asterisks denotes a difference of90% (p < 0.10) in the same test. Bars indicate standard errors. Dashed lines indicate the average values of control plants. (a) Germination values are expressed as theproportion of germinated seeds over the total number of sown seeds (n = 20). (b) Fresh weight values are averages for one pot (n = 10).
182 B.C. Agaras et al. / Biological Control 90 (2015) 173–186
46.1% of the variance and separated the isolates in roughly twogroups. The rightmost group along PC1 includes isolates with high-est antagonistic power (Table 2 and Fig. 2) and almost all of them(6/7) were isolated from bulk soil samples. This group of isolateswas also characterized by their production levels of HCN, phospho-lipase, AHL signals and siderophores, together with the presence ofphzF and prnD genes, on top of their fungal antagonism quantifica-tion values. The leftmost group along PC1 included isolates mostlyfrom rhizospheric soil samples and with the highest plant growthpromoting activity on maize (Fig. 5). The second axis PC2, whichexplained 13.9% of the variance, distinguished isolates with highermotility in the upper part of the graph. Swimming, swarming andtwitching influenced this separation, together with exoproteaseproduction and biofilm formation (Fig. 5).
If we consider all the activities described above as part of anindex that gives account of the general plant growth promotion,i.e., PGPI, including fungal antagonism, biocontrol traits, directplant growth promotion traits and colonization traits, we foundthat those isolates that were ranked together according to theirPGPI, were also grouped together by their taxonomic assignment(Table 2), as previously noticed for the BPI (Table 2). Thus, P. chloro-raphis-related isolates and SVBP6 showed the highest PGPI values,but mainly influenced by their great biocontrol potential (Table 2,Figs. 2 and 3).
4. Discussion
Bacterial strains of the Pseudomonas genus are intimatelyrelated to biocontrol (Moënne-Loccoz and Défago, 2004; Walshet al., 2001) and natural suppressiveness of soils (Mendes et al.,2011; Moënne-Loccoz and Défago, 2004; Walsh et al., 2001;Weller, 2007; Weller et al., 2002). Also, several Pseudomonas spe-cies are linked to direct plant growth promotion (Hol et al.,2013; Lugtenberg and Kamilova, 2009; O’Sullivan and O’Gara,1992; Saharan and Nehra, 2011). Due to these beneficial traits,we aimed to isolate and characterize native pseudomonads withantagonistic potential against 12 fungal pathogens that affect dif-ferent extensive crops in Argentina (Table 1) (Carmona and MeloReis, 2012; Carmona, 2014; Scandiani et al., 2012). This strategymight allow us to identify novel isolates with biocontrol potentialthat are naturally adapted to environmental conditions of agricul-tural plots of our region, where they could be applied as a biolog-ical input (Cordero et al., 2012; Fischer et al., 2010; Tolba andSoliman, 2013).
The selected 19 isolates showed a diverse taxonomic distribu-tion, based on the concatenated 16S rDNA-rpoB-oprF sequences(Fig. 1). These group of isolates did not include any pseudomonadsrelated with the P. aeruginosa or the P. syringae complexes,generally associated with pathogenesis in humans and plants,
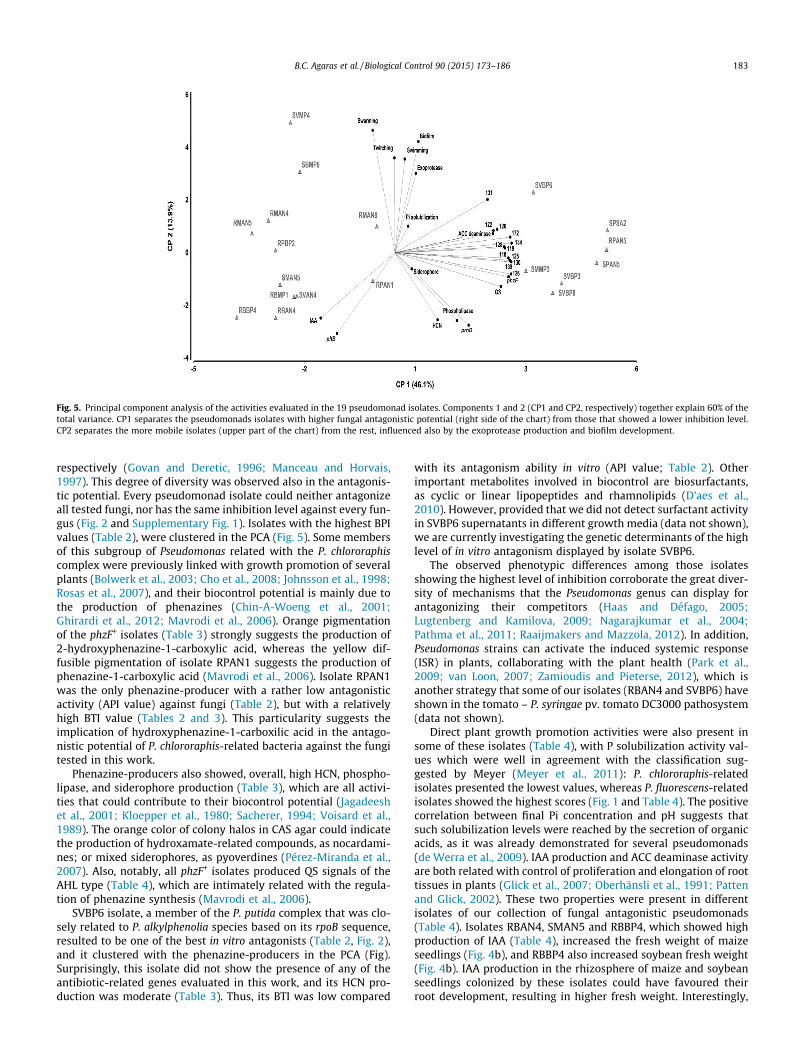
Fig. 5. Principal component analysis of the activities evaluated in the 19 pseudomonad isolates. Components 1 and 2 (CP1 and CP2, respectively) together explain 60% of thetotal variance. CP1 separates the pseudomonads isolates with higher fungal antagonistic potential (right side of the chart) from those that showed a lower inhibition level.CP2 separates the more mobile isolates (upper part of the chart) from the rest, influenced also by the exoprotease production and biofilm development.
B.C. Agaras et al. / Biological Control 90 (2015) 173–186 183
respectively (Govan and Deretic, 1996; Manceau and Horvais,1997). This degree of diversity was observed also in the antagonis-tic potential. Every pseudomonad isolate could neither antagonizeall tested fungi, nor has the same inhibition level against every fun-gus (Fig. 2 and Supplementary Fig. 1). Isolates with the highest BPIvalues (Table 2), were clustered in the PCA (Fig. 5). Some membersof this subgroup of Pseudomonas related with the P. chlororaphiscomplex were previously linked with growth promotion of severalplants (Bolwerk et al., 2003; Cho et al., 2008; Johnsson et al., 1998;Rosas et al., 2007), and their biocontrol potential is mainly due tothe production of phenazines (Chin-A-Woeng et al., 2001;Ghirardi et al., 2012; Mavrodi et al., 2006). Orange pigmentationof the phzF+ isolates (Table 3) strongly suggests the production of2-hydroxyphenazine-1-carboxylic acid, whereas the yellow dif-fusible pigmentation of isolate RPAN1 suggests the production ofphenazine-1-carboxylic acid (Mavrodi et al., 2006). Isolate RPAN1was the only phenazine-producer with a rather low antagonisticactivity (API value) against fungi (Table 2), but with a relativelyhigh BTI value (Tables 2 and 3). This particularity suggests theimplication of hydroxyphenazine-1-carboxilic acid in the antago-nistic potential of P. chlororaphis-related bacteria against the fungitested in this work.
Phenazine-producers also showed, overall, high HCN, phospho-lipase, and siderophore production (Table 3), which are all activi-ties that could contribute to their biocontrol potential (Jagadeeshet al., 2001; Kloepper et al., 1980; Sacherer, 1994; Voisard et al.,1989). The orange color of colony halos in CAS agar could indicatethe production of hydroxamate-related compounds, as nocardami-nes; or mixed siderophores, as pyoverdines (Pérez-Miranda et al.,2007). Also, notably, all phzF+ isolates produced QS signals of theAHL type (Table 4), which are intimately related with the regula-tion of phenazine synthesis (Mavrodi et al., 2006).
SVBP6 isolate, a member of the P. putida complex that was clo-sely related to P. alkylphenolia species based on its rpoB sequence,resulted to be one of the best in vitro antagonists (Table 2, Fig. 2),and it clustered with the phenazine-producers in the PCA (Fig).Surprisingly, this isolate did not show the presence of any of theantibiotic-related genes evaluated in this work, and its HCN pro-duction was moderate (Table 3). Thus, its BTI was low compared
with its antagonism ability in vitro (API value; Table 2). Otherimportant metabolites involved in biocontrol are biosurfactants,as cyclic or linear lipopeptides and rhamnolipids (D’aes et al.,2010). However, provided that we did not detect surfactant activityin SVBP6 supernatants in different growth media (data not shown),we are currently investigating the genetic determinants of the highlevel of in vitro antagonism displayed by isolate SVBP6.
The observed phenotypic differences among those isolatesshowing the highest level of inhibition corroborate the great diver-sity of mechanisms that the Pseudomonas genus can display forantagonizing their competitors (Haas and Défago, 2005;Lugtenberg and Kamilova, 2009; Nagarajkumar et al., 2004;Pathma et al., 2011; Raaijmakers and Mazzola, 2012). In addition,Pseudomonas strains can activate the induced systemic response(ISR) in plants, collaborating with the plant health (Park et al.,2009; van Loon, 2007; Zamioudis and Pieterse, 2012), which isanother strategy that some of our isolates (RBAN4 and SVBP6) haveshown in the tomato – P. syringae pv. tomato DC3000 pathosystem(data not shown).
Direct plant growth promotion activities were also present insome of these isolates (Table 4), with P solubilization activity val-ues which were well in agreement with the classification sug-gested by Meyer (Meyer et al., 2011): P. chlororaphis-relatedisolates presented the lowest values, whereas P. fluorescens-relatedisolates showed the highest scores (Fig. 1 and Table 4). The positivecorrelation between final Pi concentration and pH suggests thatsuch solubilization levels were reached by the secretion of organicacids, as it was already demonstrated for several pseudomonads(de Werra et al., 2009). IAA production and ACC deaminase activityare both related with control of proliferation and elongation of roottissues in plants (Glick et al., 2007; Oberhänsli et al., 1991; Pattenand Glick, 2002). These two properties were present in differentisolates of our collection of fungal antagonistic pseudomonads(Table 4). Isolates RBAN4, SMAN5 and RBBP4, which showed highproduction of IAA (Table 4), increased the fresh weight of maizeseedlings (Fig. 4b), and RBBP4 also increased soybean fresh weight(Fig. 4b). IAA production in the rhizosphere of maize and soybeanseedlings colonized by these isolates could have favoured theirroot development, resulting in higher fresh weight. Interestingly,
184 B.C. Agaras et al. / Biological Control 90 (2015) 173–186
isolates able to grow on ACC were associated with high antagonis-tic potential in the PCA analysis (Figs. 2 and 5). As ACC deaminaseactivity may enhance the survival of plant seedlings under variousabiotic and biotic stresses (Grichko and Glick, 2001;Saravanakumar and Samiyappan, 2007), this property is an addi-tional factor that could improve the biocontrol potential of pseu-domonads isolates.
The screening of several in vitro activities is a common strategyused to evaluate the PGPP of new isolates (Laslo et al., 2012;Mavrodi et al., 2012). However, in general, those activities aremainly used to explain the results from biological control or PGPassays. The wide range of in vitro PGP traits that we assessed, basedon simple published methods, allowed us to develop numericalindices that could express the potential of a particular isolate toact as putative biocontrol or PGP agent. Thus, it would be feasibleto isolate a large number of bacteria and to select the best PGPRcandidates, extending the possibilities to find new promising PGPagents. With this strategy, we linked the screening of direct andindirect PGP traits for our collection of selected fungal antagonisticpseudomonads with numerical indices. An index is a useful tool tocategorize several isolates according to their properties showedin vitro (Laslo et al., 2012). In our work, we could categorize thePseudomonas isolates based on their biocontrol, direct growth pro-motion and general PGPR potential (Fig. 3). Interestingly, ourresults revealed that taxonomically related isolates, irrespectiveof their geographic or biological origin, were also linked by theirBPI and PGPI values (Table 2). This is the first report that connectspseudomonads taxonomy with PGPR potential. In addition, thisclassification suggests that, in general, the best potential biocontrolagents do not necessarily converge with the best direct plantgrowth promoting agents within the Pseudomonas genus (Fig. 3).To our knowledge, there is no published evidence in this regard.Analysis of a wide spectrum of pseudomonads could clarify thispresumption. With our consistent results, we think that PGPIwould be a useful tool that could be employed as a complementfor classifying Pseudomonas isolates of agronomic interest, supple-menting the genotypic and phenotypic information.
5. Conclusions
We found that in spite of the significant phylogenetic biodiver-sity, PCA clustered isolates in two major groups sharing, on the onehand, a bulk soil origin and superior biocontrol potential but ratherweak direct PGP properties, and a second group with the oppositetraits and mostly rhizospheric origin. These findings, along withthe quantitative indices calculated on the basis of the individualtested traits, revealed that there are isolates with promising bio-control potential (high BPI) but rather weak direct probiotic activ-ities (low DGPI) (e.g., SVBP3 or SVBP8), or vice versa, withpromising direct plant growth promoting traits and low biocontrolpotential (e.g., RBBP4 or RBAN4). Thus, these indices could beemployed to categorize large numbers of isolates by their potentialto act as a biocontrol or a biofertilizer agent before performingtime-consuming in planta assays with native isolates. Overall, ourresults support two relevant considerations related to the selectionof pseudomonads of potential agronomical use: (1) biocontrol andPGPR potential of a Pseudomonas isolate could be linked with itstaxonomy; (2) top fungal antagonistic potential together with thehighest direct plant growth promotion potential rarely convergein a single Pseudomonas isolate.
Acknowledgments
This work was supported by Grants PAE 36976-PID 52, PAE36976-PID 89 and PME 2006-1730 (Agencia Nacional de
Promoción Científica y Tecnológica, Argentina), PIP112-200801-02271 (CONICET, Argentina), PUNQ 0395/07 and1009/11 (Universidad Nacional de Quilmes, Argentina), UBACyT20020100100493 and 20020130100604BA (Universidad deBuenos Aires, Argentina) and by Rizobacter Argentina S.A. B.A.holds a Post-doctoral fellowship from CONICET. L.F., L.G.W. andC.V. are members of CONICET. M.S. is a member of RizobacterArgentina S.A.
Appendix A. Supplementary data
Supplementary data associated with this article can be found, inthe online version, at http://dx.doi.org/10.1016/j.biocontrol.2015.07.003.
References
Adesemoye, A., Torbert, H., Kloepper, J., 2009. Plant growth-promoting rhizobacteriaallow reduced application rates of chemical fertilizers. Microb. Ecol. 58, 921–929.
Agaras, B., Wall, L.G., Valverde, C., 2012. Specific enumeration and analysis of thecommunity structure of culturable pseudomonads in agricultural soils underno-till management in Argentina. Appl. Soil Ecol. 61, 305–319.
Agaras, B., Wall, L.G., Valverde, C., 2014. Influence of agricultural practices andseasons on the abundance and community structure of culturablepseudomonads in soils under no-till management in Argentina. Plant Soil382, 117–131.
Albertengo, J., Belloso, C., Giraudo, M.B., Peiretti, R., Permingeat, H., Wall, L., 2014.Conservation agriculture: global prospects and challenges, Conservationagriculture: global prospects and challenges. CABI, Wallingford.
Altieri, M.a., Nicholls, C.I., 2003. Soil fertility management and insect pests:harmonizing soil and plant health in agroecosystems. Soil Tillage Res. 72,203–211.
Babu, S., 2011. Pseudomonas fluorescens-mediated biocontrol in the post-genomicera: from lap to lab to land. Biotechnol. J. 6, 488–491.
Bodilis, J., Nsigue Meilo, S., Cornelis, P., De Vos, P., Barray, S., 2011. A long-branchattraction artifact reveals an adaptive radiation in Pseudomonas. Mol. Biol. Evol.28, 2723–2726.
Bolwerk, A., Lagopodi, A.L., Wijfjes, A.H.M., Lamers, G.E.M., Chin-A-Woeng, T.F.C.,Lugtenberg, B.J.J., Bloemberg, G.V., 2003. Interactions in the tomato rhizosphereof two Pseudomonas biocontrol strains with the phytopathogenic fungusFusarium oxysporum f. sp. radicis-lycopersici. MPMI 16, 983–993.
Carmona, M., 2014. Enfermedades de fin de ciclo y Mancha Ojo de Rana en el cultivode soja: desarrollo y validación de un sistema de puntuación y determinacióndel umbral de control (Ph.D. thesis). Universidad Nacional de La Plata.
Carmona, M., Melo Reis, E., 2012. Enfermedades en cultivos bajo siembra directa enArgentina y Brasil : pasado, presente y prospectivas de manejo. Rev. Soja enSiembra Directa - AAPRESID 48–55.
Carmona, M.A., Scandiani, M., Luque, A., 2009. Severe outbreaks of soybean frogeyeleaf spot caused by Cercospora sojina in the Pampean region. Argentina PlantDis. 93, 966–966.
Carvalho, F.P., 2006. Agriculture, pesticides, food security and food safety. Environ.Sci. Policy 9, 685–692.
Cha, C., Gao, P., Chen, Y.C., Shaw, P.D., Farrand, S.K., 1998. Production of acyl-homoserine lactone quorum-sensing signals by gram-negative plant-associatedbacteria. MPMI 11, 1119–1129.
Chin-A-Woeng, T.F., van den Broek, D., de Voer, G., van der Drift, K.M., Tuinman, S.,Thomas-Oates, J.E., Lugtenberg, B.J., Bloemberg, G.V., 2001. Phenazine-1-carboxamide production in the biocontrol strain Pseudomonas chlororaphisPCL1391 is regulated by multiple factors secreted into the growth medium.MPMI 14, 969–979.
Cho, S.M., Kang, B.R., Han, S.H., Anderson, A.J., Park, J.-Y., Lee, Y.-H., Cho, B.H., Yang,K.-Y., Ryu, C.-M., Kim, Y.C., 2008. 2R,3R-butanediol, a bacterial volatile producedby Pseudomonas chlororaphis O6, is involved in induction of systemic toleranceto drought in Arabidopsis thaliana. MPMI 21, 1067–1075.
Cole, J.R., Wang, Q., Cardenas, E., Fish, J., Chai, B., Farris, R.J., Kulam-Syed-Mohideen,A.S., McGarrell, D.M., Marsh, T., Garrity, G.M., Tiedje, J.M., 2009. The ribosomaldatabase project: improved alignments and new tools for rRNA analysis.Nucleic Acids Res. 37, D141–D145.
Compant, S., van der Heijden, M.G.a., Sessitsch, A., 2010. Climate change effects onbeneficial plant-microorganism interactions. FEMS Microbiol. Ecol. 73, 197–214.
Cordero, P., Cavigliasso, A., Príncipe, A., Godino, A., Jofré, E., Mori, G., Fischer, S.,2012. Genetic diversity and antifungal activity of native Pseudomonas isolatedfrom maize plants grown in a central region of Argentina. Syst. Appl. Microbiol.35, 342–351.
D’aes, J., De Maeyer, K., Pauwelyn, E., Höfte, M., 2010. Biosurfactants in plant-Pseudomonas interactions and their importance to biocontrol. Environ.Microbiol. Rep. 2, 359–372.
De Souza, J.T., 2002. Ditribution, Diversity and Activity of Antibiotic-ProducingPseudomonas spp. (Ph.D. thesis). Wageningen University.
B.C. Agaras et al. / Biological Control 90 (2015) 173–186 185
De Werra, P., Péchy-Tarr, M., Keel, C., Maurhofer, M., 2009. Role of gluconic acidproduction in the regulation of biocontrol traits of Pseudomonas fluorescensCHA0. Appl. Environ. Microbiol. 75, 4162–4174.
Derpsch, R., Friedrich, T., Kassam, A., Hongwen, L., 2010. Current status of adoptionof no-till farming in the world and some of its main benefits. Int. J. Agric. Biol.Eng. 3, 1–26.
Di Rienzo, J.A., Casanoves, F., Balzarini, M., Gonzalez, L., Tablada, M., Robledo, C.W.,2013. InfoStat versión 2013.
Domingo Yagüez, J., Ferreyra, A., Langhi, R., Pausich, G., Pezzola, A., Coma, C., 2012.Campaña sojera 2010–2011 – República Argentina. RIAN - INTA 1–24.
Egan, S.V., Yeoh, H.H., Bradbury, J.H., 1998. Simple picrate paper kit fordetermination of the cyanogenic potential of cassava flour. J. Sci. Food Agric.76, 39–48.
Farrand, S., Qin, Y., Oger, P., 2002. Quorum-Sensing system of Agrobacteriumplasmids: analysis and utility. In: Clark, V.L., Bavoil, P.M. (Eds.), Methods inEnzymology – Bacterial Pathogenesis Part C: Identification, Regulation, andFunction of Virulence Factors. Elsevier Science, pp. 452–484.
Fernández, L., Agaras, B., Zalba, P., Wall, L.G., Valverde, C., 2012. Pseudomonas spp.isolates with high phosphate-mobilizing potential and root colonizationproperties from agricultural bulk soils under no-till management. Biol. Fertil.Soils 48, 763–773.
Figuerola, E.L.M., Guerrero, L.L., Rosa, S.S.S., Simonetti, L., Duval, M., Galantini, J.A.,Bedano, J.C., Wall, L.G., Erijman, L., 2012. Bacterial indicator of agriculturalmanagement for soil under no-till crop production. PLoS ONE 7, 1–12.
Fischer, S.E., Jofré, E.C., Cordero, P.V., Gutiérrez Mañero, F.J., Mori, G.B., 2010.Survival of native Pseudomonas in soil and wheat rhizosphere and antagonistactivity against plant pathogenic fungi. Antonie Van Leeuwenhoek 97, 241–251.
Ghirardi, S., Dessaint, F., Mazurier, S., Corberand, T., Raaijmakers, J.M., Meyer, J.-M.,Dessaux, Y., Lemanceau, P., 2012. Identification of traits shared by rhizosphere-competent strains of fluorescent pseudomonads. Microb. Ecol. 64, 725–737.
Glick, B.R., Cheng, Z., Czarny, J., Duan, J., 2007. Promotion of plant growth by ACCdeaminase-producing soil bacteria. Eur. J. Plant Pathol.
Gould, W.D., Hagedorn, C., Bardinelli, T.R., Zablotowicz, R.M., 1985. New selectivemedia for enumeration and recovery of fluorescent pseudomonads from varioushabitats. Appl. Environ. Microbiol.
Govan, J.R., Deretic, V., 1996. Microbial pathogenesis in cystic fibrosis: mucoidPseudomonas aeruginosa and Burkholderia cepacia. Microbiol. Rev. 60, 539–574.
Grichko, V.P., Glick, B.R., 2001. Amelioration of flooding stress by ACC deaminase-containing plant growth-promoting bacteria. Plant Physiol. Biochem. 39, 11–17.
Haas, D., Défago, G., 2005. Biological control of soil-borne pathogens by fluorescentpseudomonads. Nat. Rev. Microbiol. 3, 307–319.
Hol, W.H.G., Bezemer, T.M., Biere, A., 2013. Getting the ecology into interactionsbetween plants and the plant growth-promoting bacterium Pseudomonasfluorescens. Front. Plant Sci. 4, 1–9.
Jagadeesh, K., Kulkarni, J.H., Krishnaraj, P., 2001. Evaluation of the role of fluorescentsiderophore in the biological control of bacterial wilt in tomato using Tn5mutants of fluorescent Pseudomonas sp. Curr. Sci. 81, 882–883.
Johnsson, L., Hökeberg, M., Gerhardson, B., 1998. Performance of the Pseudomonaschlororaphis biocontrol agent MA 342 against cereal seed-borne diseases in fieldexperiments. Eur. J. Plant Pathol. 104, 701–711.
Kloepper, J.W., Leong, J., Teintze, M., Schroth, M.N., 1980. Enhanced plant growth bysiderophores produced by plant growth-promoting rhizobacteria. Nature 286,885–886.
Koo, S.-Y., Hong, S.H., Ryu, H.W., Cho, K., 2010. Plant growth-promoting trait ofrhizobacteria isolated from soil contaminated with petroleum and heavymetals. J. Microbiol. Biotechnol. 20, 587–593.
Lago, M., 2009. Enfermedades de talle y raíz en soja. Para Mejor. la Prod. 42 – INTA119–123.
Laslo, É., György, É., Mara, G., Tamás, É., Ábrahám, B., Lányi, S., 2012. Screening ofplant growth promoting rhizobacteria as potential microbial inoculants. CropProt. 40, 43–48.
Leoni Velazco, C., 2013. Crop rotation Design in View of Soilborne PathogenDynamics. A Methodological Approach Illustrated with Sclerotium rolfsii andFusarium oxysporum f.sp. cepae. Wageningen University.
Leslie, J., Summerell, B., 2006. The Fusarium laboratory manual. BlackwellPublishing, Ames, Iowa, USA.
Lugtenberg, B.J., Dekkers, L.C., 1999. What makes Pseudomonas bacteria rhizospherecompetent? Environ. Microbiol. 1, 9–13.
Lugtenberg, B., Kamilova, F., 2009. Plant-growth-promoting rhizobacteria. Annu.Rev. Microbiol. 63, 541–556.
Manceau, C., Horvais, A., 1997. Assessment of genetic diversity among strains ofPseudomonas syringae by PCR-restriction fragment length polymorphismanalysis of rRNA operons with special emphasis on P. syringae pv. tomato.Appl. Environ. Microbiol. 63, 498–505.
Mavrodi, D.V., Ksenzenko, V.N., Bonsall, R.F., Cook, R.J., Boronin, a M., Thomashow,L.S., 1998. A seven-gene locus for synthesis of phenazine-1-carboxylic acid byPseudomonas fluorescens 2–79. J. Bacteriol. 180, 2541–2548.
Mavrodi, O.V., McSpadden Gardener, B.B., Mavrodi, D.V., Bonsall, R.F., Weller, D.M.,Thomashow, L.S., 2001. Genetic diversity of phlD from 2,4-diacetylphloroglucinol-producing fluorescent Pseudomonas spp. Phytopathology 91, 35–43.
Mavrodi, D.V., Blankenfeldt, W., Thomashow, L.S., 2006. Phenazine compounds influorescent Pseudomonas spp. biosynthesis and regulation. Annu. Rev.Phytopathol. 44, 417–445.
Mavrodi, D.V., Peever, T.L., Mavrodi, O.V., Parejko, J.a., Raaijmakers, J.M., Lemanceau,P., Mazurier, S., Heide, L., Blankenfeldt, W., Weller, D.M., Thomashow, L.S., 2010.
Diversity and evolution of the phenazine biosynthesis pathway. Appl. Environ.Microbiol. 76, 866–879.
Mavrodi, O.V., Walter, N., Elateek, S., Taylor, C.G., Okubara, P.a., 2012. Suppression ofrhizoctonia and pythium root rot of wheat by new strains of pseudomonas. Biol.Control 62, 93–102.
McSpadden Gardener, B.B., Mavrodi, D.V., Thomashow, L.S., Weller, D.M., 2001. Arapid polymerase chain reaction-based assay characterizing rhizospherepopulations of 2,4-diacetylphloroglucinol-producing bacteria. Phytopathology91, 44–54.
Mendes, R., Kruijt, M., de Bruijn, I., Dekkers, E., van der Voort, M., Schneider, J.H.M.,Piceno, Y.M., DeSantis, T.Z., Andersen, G.L., Bakker, P.a H.M., Raaijmakers, J.M.,2011. Deciphering the rhizosphere microbiome for disease-suppressivebacteria. Science 332, 1097–1100.
Merritt, J.H., Kadouri, D.E., O’Toole, G.A., 2011. Growing and analyzing staticbiofilms. In: John Wiley and sons (Ed.), Current Protocols in Microbiology. Wileyonline library, pp. 1–18.
Meyer, J.B., Frapolli, M., Keel, C., Maurhofer, M., 2011. Pyrroloquinoline quinonebiosynthesis gene pqqC, a novel molecular marker for studying the phylogenyand diversity of phosphate-solubilizing pseudomonads. Appl. Environ.Microbiol. 77, 7345–7354.
Moënne-Loccoz, Y., Défago, G., 2004. Life as a biocontrol pseudomonad. In: Ramos,J.L. (Ed.), Pseudomonas: Genomics, Life Style and Molecular Architecture. KluwerAcademic/Plenum Publishers, New York, pp. 457–476.
Morohoshi, T., Kato, M., Fukamachi, K., Kato, N., Ikeda, T., 2008. N-acylhomoserinelactone regulates violacein production in Chromobacterium violaceum typestrain ATCC 12472. FEMS Microbiol. Lett. 279, 124–130.
Mulet, M., Lalucat, J., García-Valdés, E., 2010. DNA sequence-based analysis of thePseudomonas species. Environ. Microbiol. 12, 1513–1530.
Nagarajkumar, M., Bhaskaran, R., Velazhahan, R., 2004. Involvement of secondarymetabolites and extracellular lytic enzymes produced by Pseudomonasfluorescens in inhibition of Rhizoctonia solani, the rice sheath blight pathogen.Microbiol. Res. 159, 73–81.
Nautiyal, C.S., 1999. An efficient microbiological growth medium for screeningphosphate solubilizing microorganisms. FEMS Microbiol. Lett. 170, 265–270.
Nesci, A., Barros, G., Castillo, C., Etcheverry, M., 2006. Soil fungal population inpreharvest maize ecosystem in different tillage practices in Argentina. SoilTillage Res. 91, 143–149.
O’Sullivan, D.J., O’Gara, F., 1992. Traits of fluorescent Pseudomonas spp. involved insuppression of plant root pathogens. Microbiol. Rev. 56, 662–676.
O’Toole, G.A., Kolter, R., 1998. Initiation of biofilm formation in Pseudomonasfluorescens WCS365 proceeds via multiple, convergent signalling pathways: agenetic analysis. Mol. Microbiol. 28, 449–461.
Oberhänsli, T., Dfago, G., Haas, D., 1991. Indole-3-acetic acid (IAA) synthesis in thebiocontrol strain CHA0 of Pseudomonas fluorescens: role of tryptophan sidechain oxidase. J. Gen. Microbiol. 137, 2273–2279.
Park, M.R., Kim, Y.C., Lee, S., Kim, I.S., 2009. Identification of an ISR-relatedmetabolite produced by rhizobacterium Klebsiella oxytoca C1036 active againstsoft-rot disease pathogen in tobacco. Pest Manag. Sci. 65, 1114–1117.
Pathma, J., Kennedy, R.K., Sakthivel, N., 2011. Mechanisms of fluorescentpseudomonads that mediate biological control of phytopathogens and plantgrowth promotion of crop plants. In: Maheshwari, D.K. (Ed.), Bacteria inAgrobiology: Plant Growth Responses. Springer Berlin Heidelberg, Berlin,Heidelberg, pp. 77–105.
Patten, C.L., Glick, B.R., 2002. Role of Pseudomonas putida indoleacetic acid indevelopment of the host plant root system. Appl. Environ. Microbiol. 68,3795–3801.
Pérez-Brandán, C., Huidobro, J., Grümberg, B., Scandiani, M.M., Luque, A.G., Meriles,J.M., Vargas-Gil, S., 2014. Soybean fungal soil-borne diseases: a parameter formeasuring the effect of agricultural intensification on soil health. Can. J.Microbiol. 60, 1–12.
Pérez-Miranda, S., Cabirol, N., George-Téllez, R., Zamudio-Rivera, L.S., Fernández,F.J., 2007. O-CAS, a fast and universal method for siderophore detection. J.Microbiol. Methods 70, 127–131.
Raaijmakers, J.M., Mazzola, M., 2012. Diversity and natural functions of antibioticsproduced by beneficial and plant pathogenic bacteria. Annu. Rev. Phytopathol.50, 403–424.
Raaijmakers, J.M., Vlami, M., de Souza, J.T., 2002. Antibiotic production by bacterialbiocontrol agents. Antonie Van Leeuwenhoek 81, 537–547.
Raaijmakers, J.M., Paulitz, T.C., Steinberg, C., Alabouvette, C., Moënne-Loccoz, Y.,2009. The rhizosphere: a playground and battlefield for soilborne pathogensand beneficial microorganisms. Plant Soil 321, 341–361.
Ramette, A., Frapolli, M., Fischer-Le Saux, M., Gruffaz, C., Meyer, J.-M., Défago, G.,Sutra, L., Moënne-Loccoz, Y., 2011. Pseudomonas protegens sp. nov., widespreadplant-protecting bacteria producing the biocontrol compounds 2,4-diacetylphloroglucinol and pyoluteorin. Syst. Appl. Microbiol. 34, 180–188.
Rashid, M.H., Kornberg, A., 2000. Inorganic polyphosphate is needed for swimming,swarming, and twitching motilities of Pseudomonas aeruginosa. Proc. Natl. Acad.Sci. USA 97, 4885–4890.
Rosas, S.B., Pastor, N.A., Guiñazú, L.B., Andrés, J.A., Carlier, E., Vogt, V., Bergesse, J.,Rovera, M., 2007. Efficacy of Pseudomonas chlororaphis subsp. aurantiaca SR1for improving productivity of several crops. In: Sharma, P. (Ed.), CropProduction Technologies. InTech, pp. 199–210.
Sacherer, P., 1994. Extracellular protease and phospholipase C are controlled by theglobal regulatory gene gacA in the biocontrol strain Pseudomonas fluorescensCHAO. FEMS Microbiol. Lett. 12, 2477–160.
186 B.C. Agaras et al. / Biological Control 90 (2015) 173–186
Saharan, B.S., Nehra, V., 2011. Plant growth promoting rhizobacteria: a criticalreview. Life Sci. Med. Res. 2011, 1–30.
Saravanakumar, D., Samiyappan, R., 2007. ACC deaminase from Pseudomonasfluorescens mediated saline resistance in groundnut (Arachis hypogea) plants.J. Appl. Microbiol. 102, 1283–1292.
Scandiani, M., Luque, A., 2009. Manual de identificación de patógenos en semilla desoja, Suplemento especial No 2. Análisis de semillas. Rosario, Argentina.
Scandiani, M., Ferri, M., Ferrari, B., Formento, N., Carmona, M., Luque, A., Balatti, P.,2012. First report of races 11 and 12 of Cercospora sojina, the causal agent ofsoybean frogeye leaf spot, in Argentina. Plant Dis. 96, 1067–1067.
Singleton, L., Mihail, J., Rush, C., 1993. Methods for research on soilbornephytopathogenic fungi, 2nd ed. American Phytopathological Society, St. Paul.
Tamura, K., Stecher, G., Peterson, D., Filipski, A., Kumar, S., 2013. MEGA6: Molecularevolutionary genetics analysis version 6.0. Mol. Biol. Evol. 30, 2725–2729.
Tapadar, S.A., Jha, D.K., 2013. Disease management in staple crops: a bacteriologicalapproach. In: Maheshwari, D.K. (Ed.), Bacteria in Agrobiology: DiseaseManagement. Springer, Berlin, Heidelberg.
Tayeb, L., Ageron, E., Grimont, F., Grimont, P.a D., 2005. Molecular phylogeny of thegenus Pseudomonas based on rpoB sequences and application for theidentification of isolates. Res. Microbiol. 156, 763–773.
Thomashow, L.S., Weller, D.M., Mavrodi, Olga, V., Mavrodi, D.V., 2007. Selecting,monitoring and enhancing the performance of bacterial biocontrol agents:principles, pitfalls and progress. In: Vurro, M., Gressel, J. (Eds.), NovelBiotechnologies for Biocontrol Agent Enhancement and Management.Springer, pp. 87–105.
Tolba, I.H., Soliman, M.a., 2013. Efficacy of native antagonistic bacterial isolates inbiological control of crown gall disease in Egypt. Ann. Agric. Sci. 58, 43–49.
Valverde, C., Ferraris, G., 2009. Las Pseudomonas: un grupo heterogéneo condiversos mecanismos promotores del desarrollo vegetal. In: Puente, M., García,J., Perticari, A. (Eds.), Uso Actual Y Potencial de Microorganismos Para MejorarLa Nutricion Y El Desarrollo En Trigo Y Maíz. Ediciones INTA, Buenos Aires, pp.22–43.
Van Loon, L.C., 2007. Plant responses to plant growth-promoting rhizobacteria. Eur.J. Plant Pathol. 119, 243–254.
Vincent, J., 1970. A manual for practical study of root-nodule bacteria. IBPHandbook. Backwell Scientific Publications, Oxford, p. 164.
Voisard, C., Keel, C., Haas, D., Dèfago, G., 1989. Cyanide production by Pseudomonasfluorescens helps suppress black root rot of tobacco under gnotobioticconditions. EMBO J. 8, 351–358.
Wall, L.G., 2011. The BIOSPAS consortium soil biology and agricultural production.In: Brujin, F. (Ed.), Handbook of Molecular Microbial Ecology I: Metagenomicsand Complementary Approaches. John Wiley & Sons Inc, pp. 299–306.
Walsh, U.F., Morrissey, J.P., O’Gara, F., 2001. Pseudomonas for biocontrol ofphytopathogens: from functional genomics to commercial exploitation. Curr.Opin. Biotechnol. 12, 289–295.
Weller, D.M., 2007. Pseudomonas biocontrol agents of soilborne pathogens: lookingback over 30 years. Phytopathology 97, 250–256.
Weller, D.M., Raaijmakers, J.M., Gardener, B.B.M., Thomashow, L.S., 2002. Microbialpopulations responsible for specific soil suppressiveness to plant pathogens.Annu. Rev. Phytopathol. 40, 309–348.
Zamioudis, C., Pieterse, C.M.J., 2012. Modulation of host immunity by beneficialmicrobes. MPMI 25, 139–150.