quant trader chart
TRANSCRIPT

Quant Trader
Presented by Quant Trade Technologies, Inc.
Intelligent Expert Adviser and Trade Execution Platform

Charting basics Styles and options Chart studies Technical indicators

Basic charting principles

Opening a chart Select data provider and data source Select a symbol through symbol lookup
• Use ‘Chart’ button to see the chart

Symbol lookup • Select from
drop-down list - or -
• Type into symbol field - or -
• Use search on multiple fields
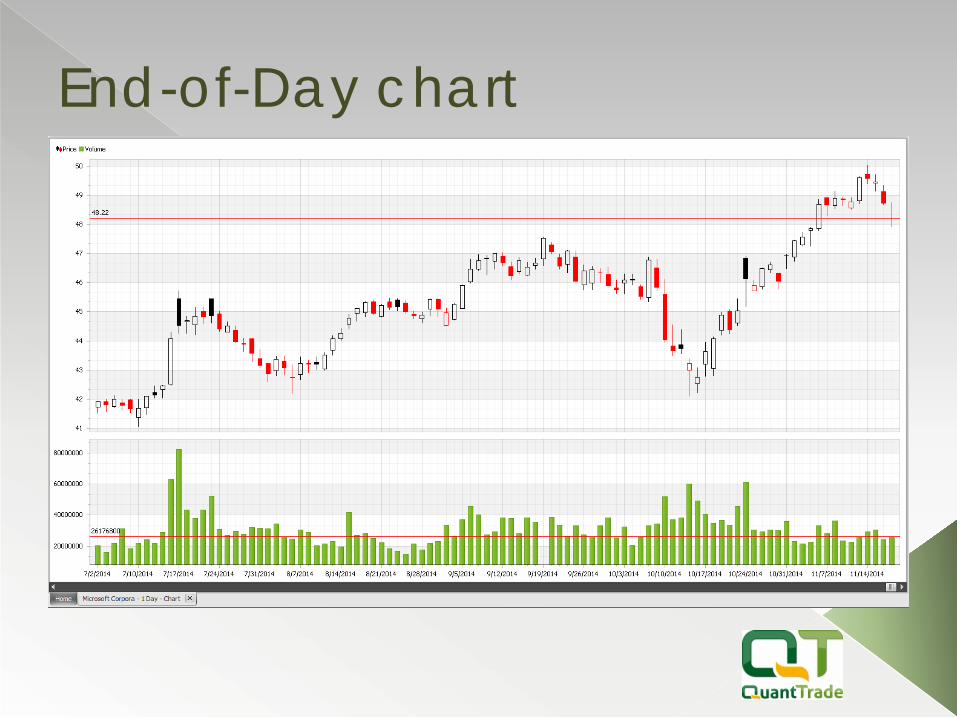
End-of-Day chart

Real time mode Default mode to watch live data Available only for real time data providers Automatically scrolls to the last bar Switch to this mode through ribbon
Chart Analysis > Chart > Connect

Real time chart
• No scroll bar available
Historical mode
Use historical mode to view market history
Horizontal chart scroll bar is only visible in historical mode
Historical mode is the only one available for end-of-day data providers
Switch to this mode through ribbon Chart Analysis > Chart > Disconnect
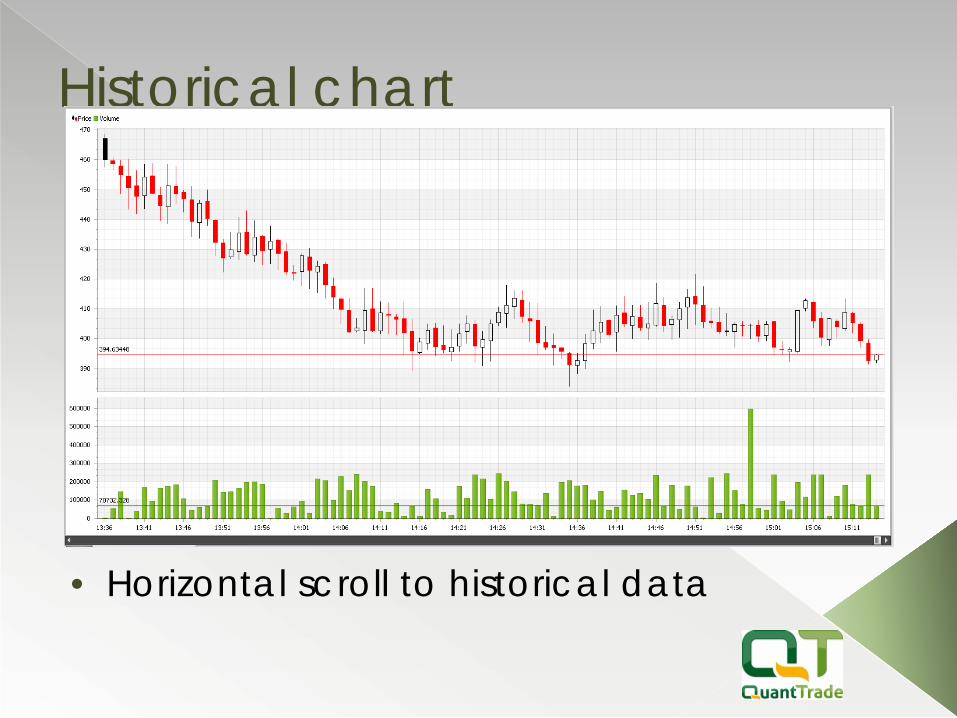
Historical chart
• Horizontal scroll to historical data

Tick chart • Real time data fluctuations • Update on every tick • Dynamic range scaling • Open level (green) • Close level (red) • Recycled on bar closing • Sync with bar data panel

Bar data panel • Time, Open, High, Low, Close
and Volume of the bar • Forecasted price and time of
the forecast (if selected) • Expert advise for the next
trade (if selected) • Values of technical indicators
attached to chart

Selecting Periodicity • Home & Basics > Periods • Instantly switch between
various periods of bars • Take advantage of
unusual and intermediate periods
• Larger periods may be not available for short history depths

Flying hint • Automatic data hint • Pops up on mouse move • Bar data under cursor • Time and bar prices • Attached indicators • Forecasted value • Trading advise
Charting Styles and Options
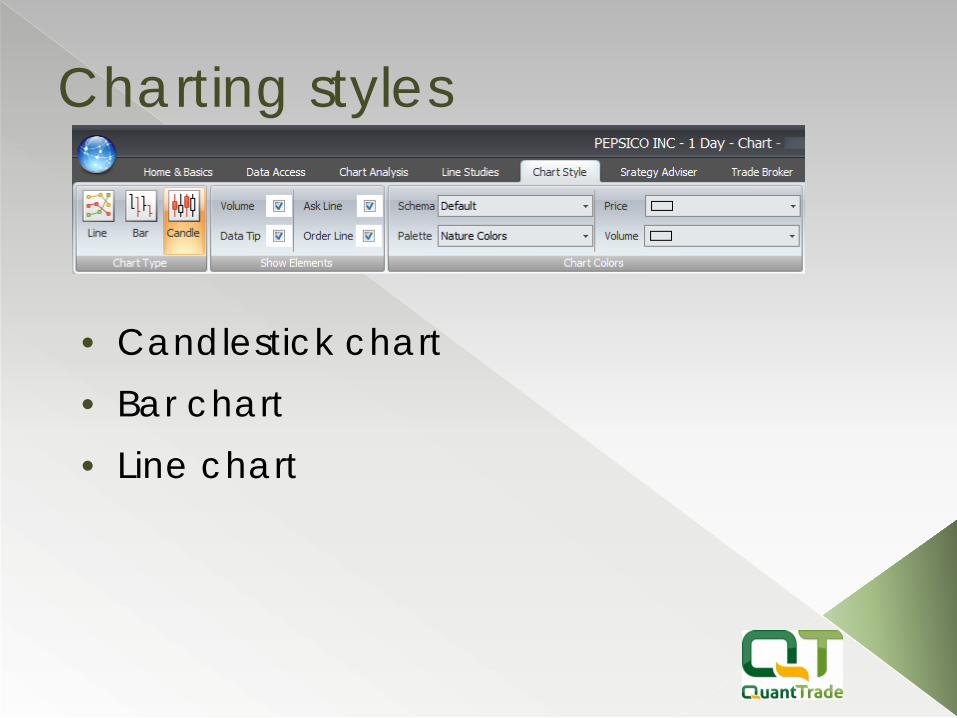
Charting styles
• Candlestick chart • Bar chart • Line chart

Candle chart

Bar chart

Line chart
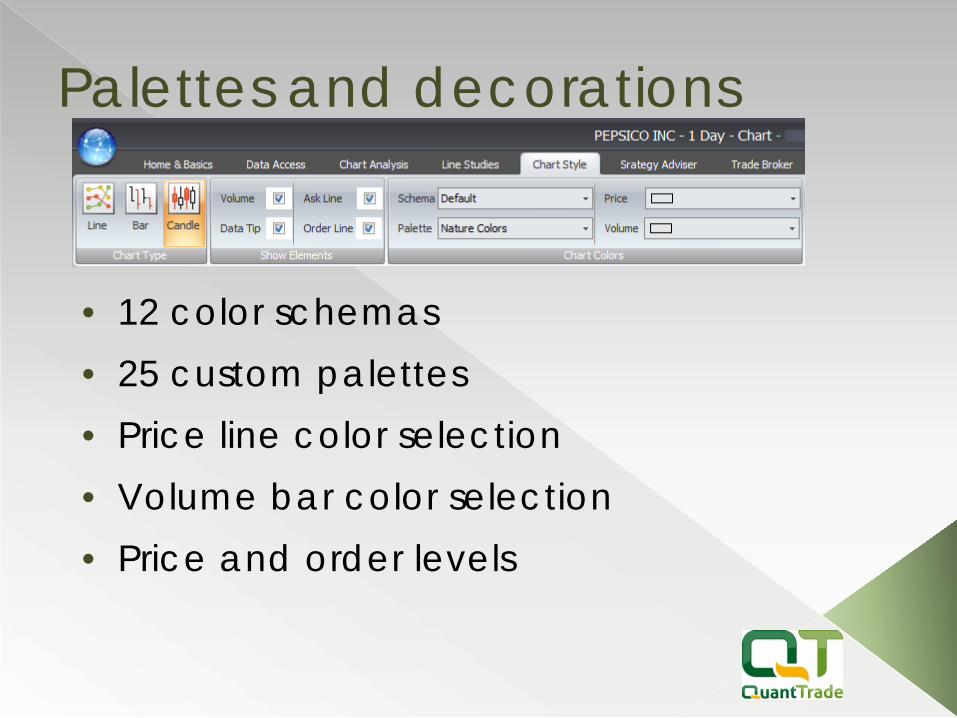
Palettes and decorations
• 12 color schemas • 25 custom palettes • Price line color selection • Volume bar color selection • Price and order levels
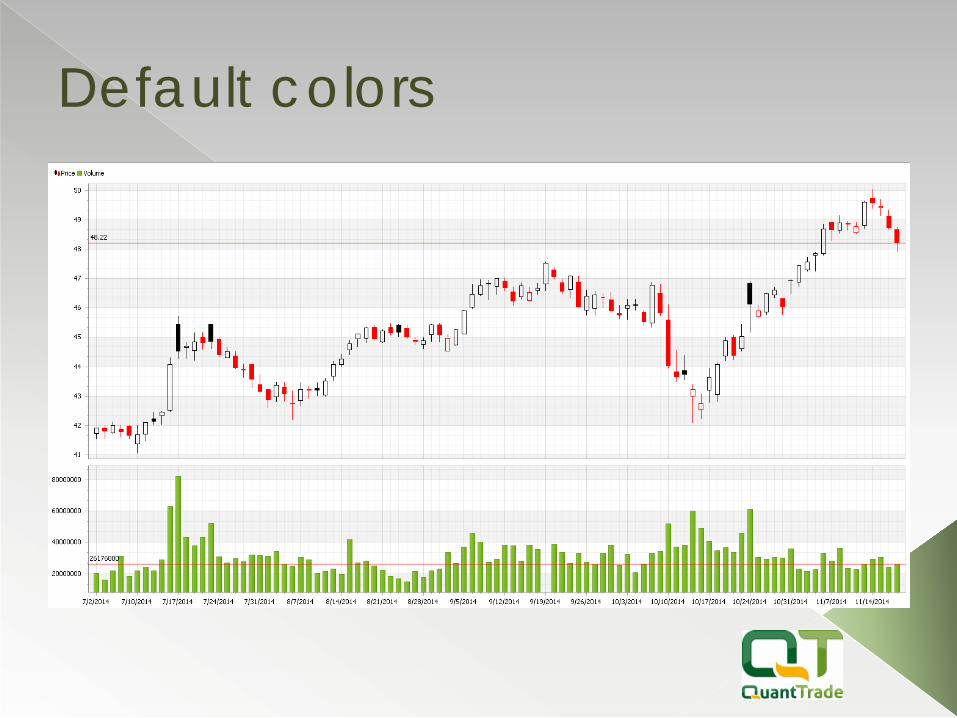
Default colors
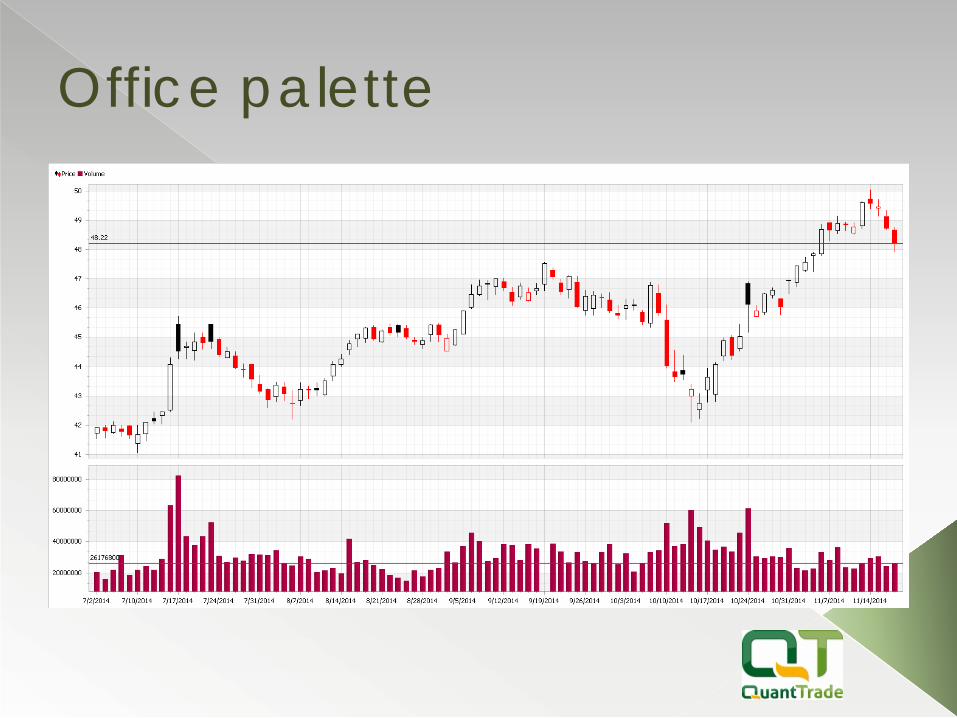
Office palette

Dark palette

Black financial

Scale and zooming
• Default zoom 100 points • Minimum zoom of 10 points • Maximum zoom 800 points • Zoom reset button
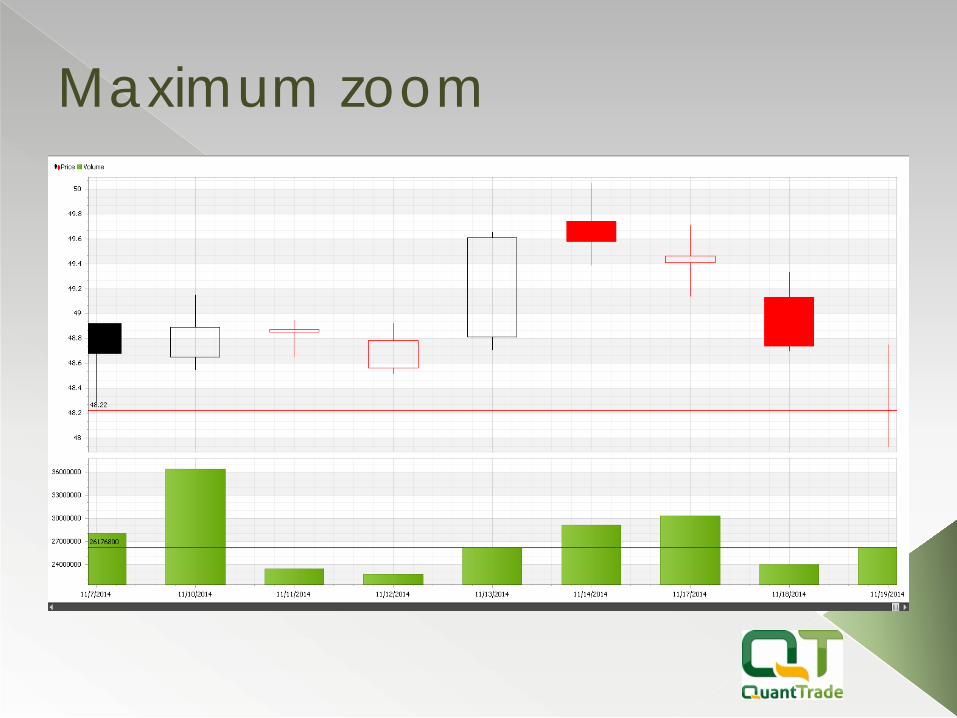
Maximum zoom

Minimum zoom

Chart Studies

Scale and zooming
• Trend and regression • Fibonacci analysis • Moving averages • Custom settings and line styles • Automatic update on every tick

Regression line

Trend line
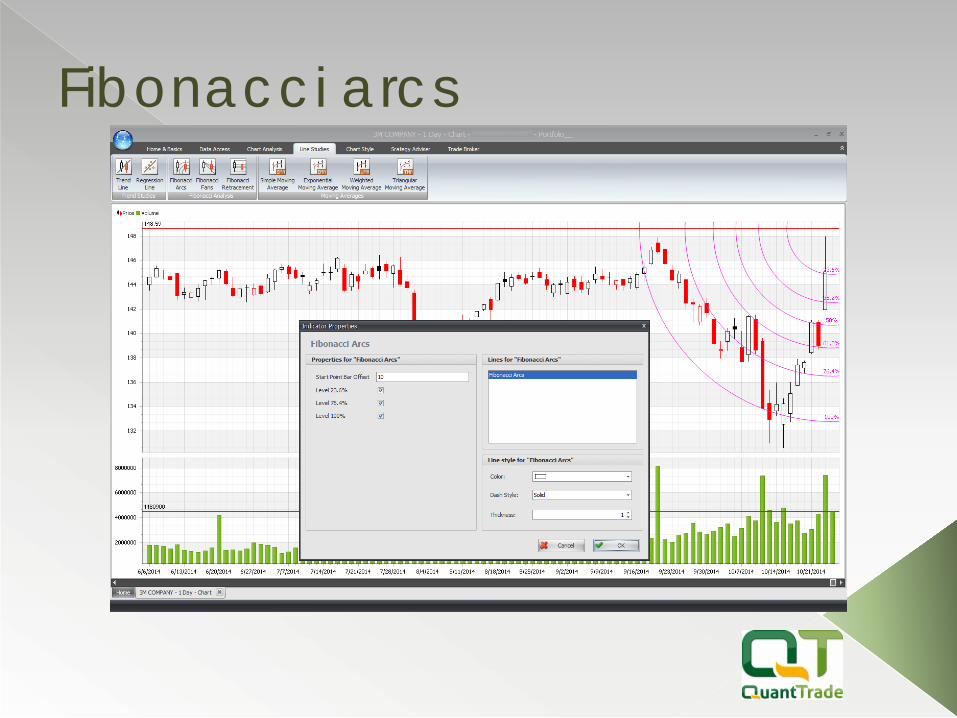
Fibonacci arcs

Fibonacci fans

Fibonacci retrace

Moving averages
Technical Indicators

Indicator library
• Chart Analysis > Chart • All standard technical indicators • Collection of over 100 indicators • Extensible through open API
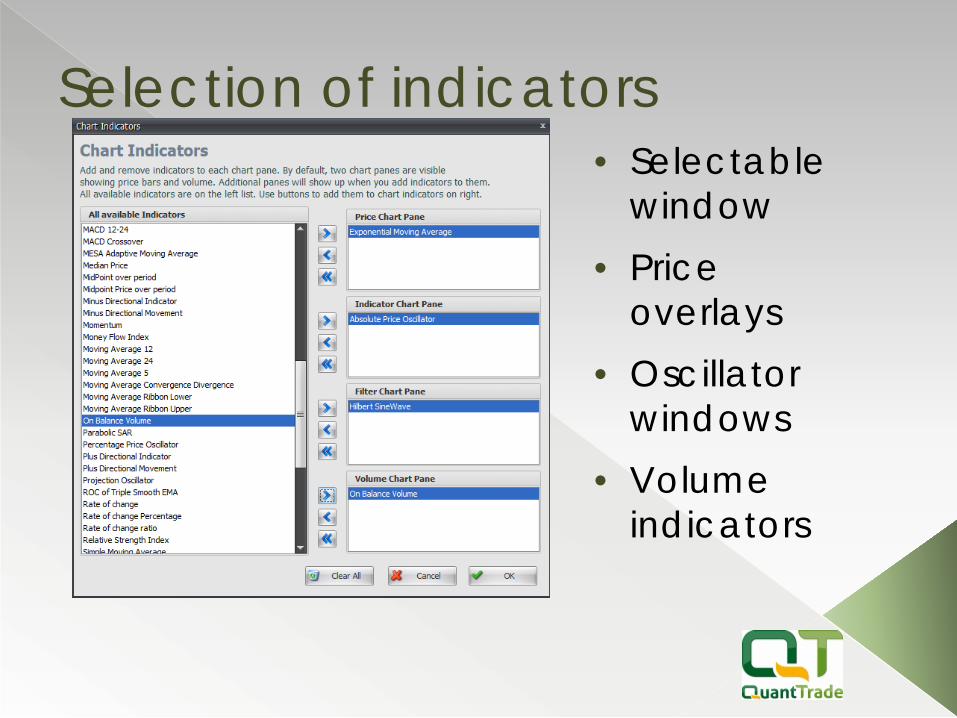
Selection of indicators • Selectable
window • Price
overlays • Oscillator
windows • Volume
indicators
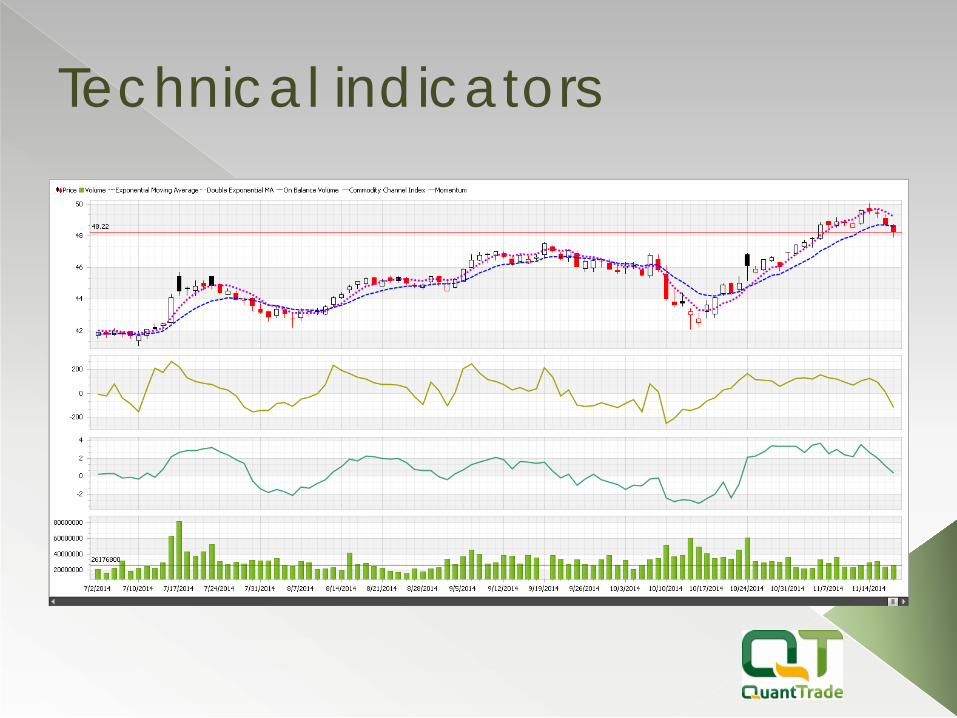
Technical indicators
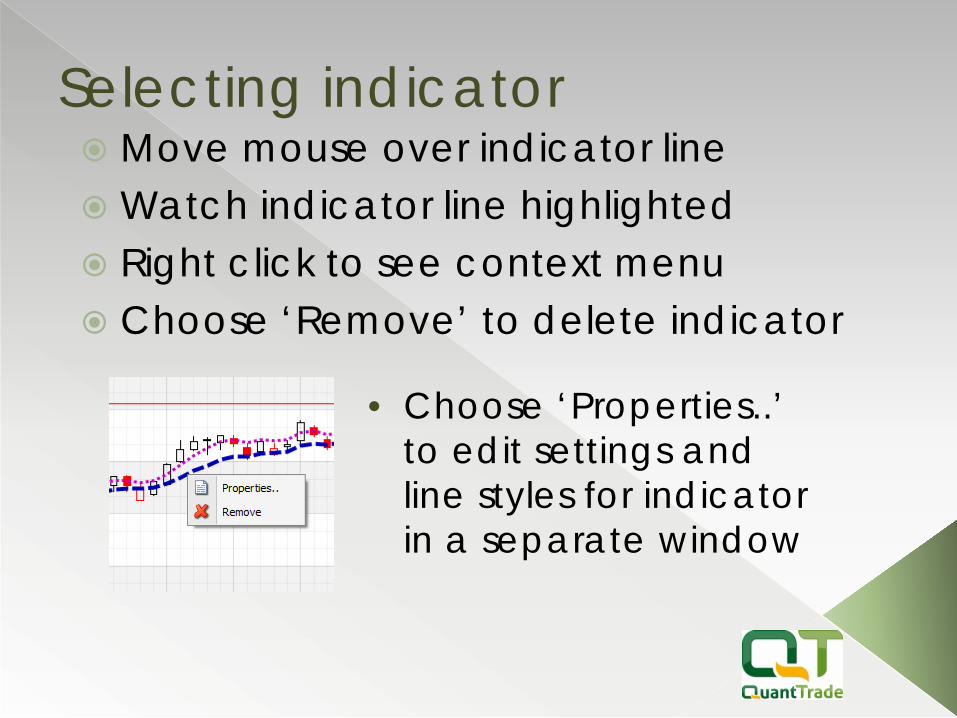
Selecting indicator Move mouse over indicator line Watch indicator line highlighted Right click to see context menu Choose ‘Remove’ to delete indicator
• Choose ‘Properties..’ to edit settings and line styles for indicator in a separate window

Properties of indicator

42
Pioneers in the fractal exploration of financial markets
Trading futures and options involves the risk of loss. You should consider carefully whether futures or options are appropriate to your financial situation. You must review the customer account agreement and risk disclosure prior to establishing an account. Only risk capital should be used when trading futures or options. Investors could lose more than their initial investment. Past results are not necessarily indicative of futures results. The risk of loss in trading futures or options can be substantial, carefully consider the inherent risks of such an investment in light of your financial condition. Information contained, viewed, sent or attached is considered a solicitation for business.
Quant Trade, LLC has been a Commodity Futures Trading Commission (CFTC) registered Commodity Trading Advisor (CTA) since September 4, 2007 and a member of the National Futures Association (NFA).
Copyright @ 2012 Quant Trade, LLC. All rights reserved. No part of the materials including graphics or logos, available in this Web site may be copied, reproduced, translated or reduced to any electronic medium or machine-readable form, in whole or in part without written permission.
2 N Riverside Plaza Suite 2325 Chicago, Illinois 60606 Quant Trade LLC (872) 225-2110