quality - ulisboa · some authors refer to the process as dmedi (d_m_explore_d_implement) deg/fhc...
TRANSCRIPT

DEG/FHC 1
Quality
Six Sigma

DEG/FHC 2
Definitions
Management philosophy focused on business process
improvements to:
• Eliminate waste, rework, and mistakes
• Increase customer satisfaction
• Increase profitability and competitiveness
Statistical measure to objectively evaluate processes.
Six Sigma is a set of tools— The Six Sigma expert uses qualitative
and quantitative techniques to drive process improvement. A few
such tools include statistical process control (SPC), failure mode
and effects analysis and flowcharting.

Definitions
Six sigma is an organized and systematic problem-solving
method for strategic system improvement and new product and
service development that relies on statistical methods and the
scientific method to make dramatic reductions in customer
defined defect rates and/or improvements in key output
variables. (Linderman et al (2003)-Journal of Operations Mgt)
“Six Sigma: A comprehensive and flexible system for achieving,
sustaining and maximizing business success. Six Sigma is
uniquely driven by a close understanding of customer needs,
disciplined use of facts, data, and statistical analysis and diligent
attention to managing, improving, and reinventing business
processes.” (Pande, P.S., Neuman, R.P., & Cavanagh, R.R. (2000). The Six Sigma Way: How GE,
Motorola and other Top Companies are Honing Their Performance. New York, New York: McGraw Hill.)
DEG/FHC 3

Brief history
1979-Motorola quality imperative roots of six sigma
1981-Motorola quest to improve 10 fold in 5 years
1988-Motorola wins MBQA
1992-Motorola, Texas Instruments,IBM, and others
start to deveop the 6sigma Black Belt program
1995-GE starts its 6 sigma program
1997/8-GE invests large sums with huge payoffs
DEG/FHC 4

DEG/FHC 5
Brief history
Before Six-Sigma methodology, 3-sigma tolerance levels (for any process)
used to be the benchmark for quality measurements.
One of Motorola's most significant contributions was to change the discussion of
quality from one where quality levels were measured in percentages (parts per
hundred) to a discussion of parts per million.
Motorolas’s Process Capability measured in sigmas
Aim: improve every process – whether for products or services – to have a 6-
sigma capability, that is, the number of defects (nonconformances) produced in
the process is less than 3.4 ppm (DPMO-defects per million opportunities).
The Six-Sigma Process started at the production function was later extended
throughout the company. Many other companies followed: GE, Honeywell,HP,
Boing,...

DEG/FHC 6
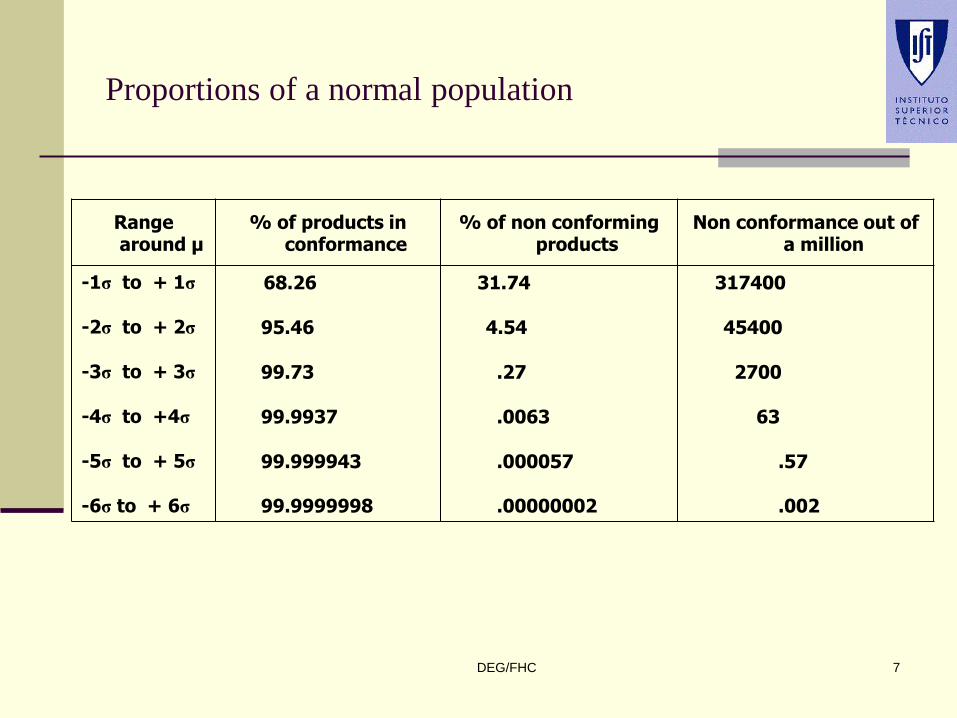
Statistical concept
The starting point for the six-sigma capability is the normal
probability distribution and the areas lying under different
regions of the normal curve.
The following table shows the proportions of a normal
population under different regions of the normal distribution
curve.
The expected non-conformances are 0.002 parts per million
(two parts per billion) for a process which specification are
located at between +6 and -6 sigmas from the center. The
process is said to have a six-sigma capability.
DEG/FHC 7
Proportions of a normal population
Range around µ
% of products in conformance
% of non conforming products
Non conformance out of a million
-1σ to + 1σ
-2σ to + 2σ
-3σ to + 3σ
-4σ to +4σ
-5σ to + 5σ
-6σ to + 6σ
68.26
95.46
99.73
99.9937
99.999943
99.9999998
31.74
4.54
.27
.0063
.000057
.00000002
317400
45400
2700
63
.57
.002

Static Process (no movement of mean)
6s
m (Mean)
0.01ppm
LSL
s
USL
Distance between USL and LSL is 12 .(12 times of )
Probability of out-of-spec is 0.02ppm
12s
6s
0.01ppm

DEG/FHC 9
(Motorola) Six-Sigma Table (long-term) (values may be slightly different from table to table)
yield %: DPMO: Sigma :
30.2 697,000 1.0
69.2 308,000 2.0
93.3 66,800 3.0
99.4 6,210 4.0
99.98 230 5.0
99.9997 3.4 6.0

DEG/FHC 10
Statistical concept
Which one - 0.002 (normal curve) or 3.4 ppm?
The difference occurs because that the process’ mean can drift1.5 sigma in either direction in the long run. The area of anormal distribution beyond 4.5 sigma from the mean is indeed3.4 parts per million.
Thus, to accommodate 1.5 sigma shift, they (Motorola) aimed at6 sigma capability.

DEG/FHC 11
Process not centered:1.5 sigma shift (or ‘drift’)

Statistical concept
In six sigma methodology ~99.9997% (or more) of
process data lies within +/- six sigma from the mean,
thus having only 3.4 defects per million opportunities
(DPMO).
Now, ~99.9997% value is actually for 4.5 sigma level
in Normal curve, but keeping in view the 1.5 sigma
process shift, the process’ sigma level is actually six.
DEG/FHC 12
Statistical concept
Six Sigma short-term capability occurs when the process is
centered on the target and there is no distribution shift
(variability due to common causes). It also assumes continuous
uniform process with no changes.
Six Sigma long-term capability assumes that the process mean
changes due to variability (random and special causes) . This
change could result in an average of 1.5 sigma distribution shift
in either direction for long-term performance.
DEG/FHC 13
DPMO calculation
DPO-defects per opportunity
D/ (U*O)
D: number of defects observed in a sample
U: number of units in a sample
O: number of defect opportunities per unit
DPMO= DPO*106
DEG/FHC 14

example
Consider that in 100 invoices there are 10
with defects. Also, there are 5 opportunities
for errors (defects) for every invoice.
Then:
DPO= 10/ (100*5) = 0.02
DPMO= 0.02*106 = 20,000 sigma=3.55
DEG/FHC 15

DEG/FHC 16
The Six-Sigma System
Six themes
Three strategies
Improvement processes
Road Map
The organization for six-sigma

DEG/FHC 17
Six themes for Six-Sigma
Focus on the Customer
Data and fact-driven management
Process focus
Proactive Management
Boundaryless collaboration
Drive for perfection

DEG/FHC 18
Three strategies
Process Improvement (DMAIC)
Process design/redesign (DMADV)
Process management
Not mutually exclusive
DEG/FHC 19
Improvement-DMAIC
DMAIC methodology is aimed at improving a Process or
product (through reduction in Variation) in an incremental
fashion:
Define -> Measure -> Analyse -> Improve -> Control -> Define...
Define
Identify the problem(s)
Identify requirements (VOC: Critical to Quality-CTQ-
characteristics)
Define the Goals:
Involving customers (VOC, QFD), employees
Strategic (e.g., increase market share,...); Operation
(increase output); Project (e.g., reduce the defects
level)
DEG/FHC 20
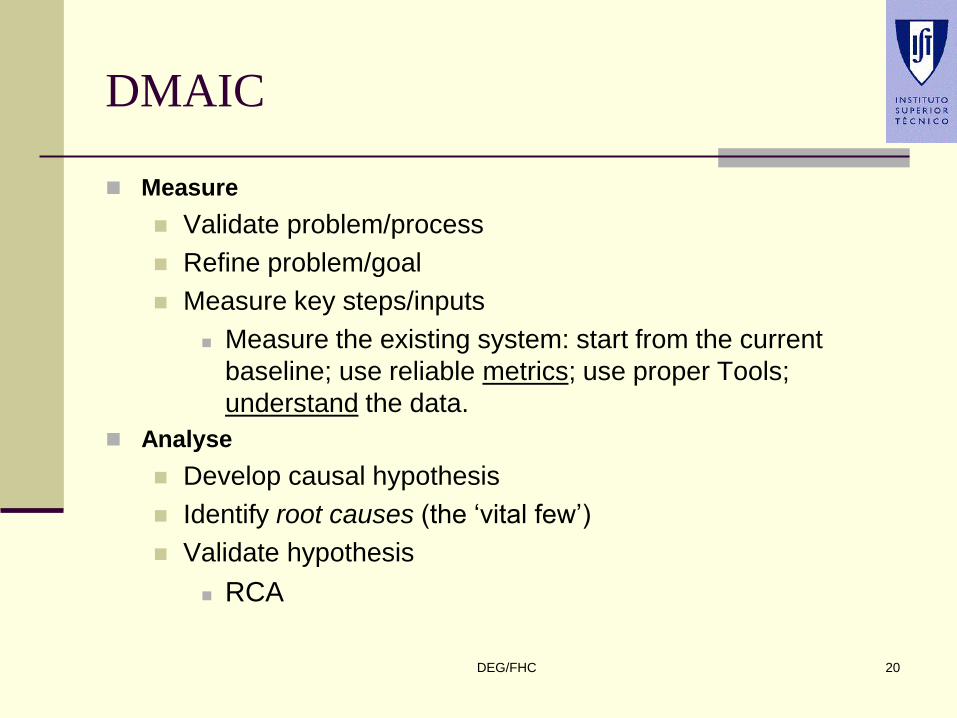
DMAIC
Measure
Validate problem/process
Refine problem/goal
Measure key steps/inputs
Measure the existing system: start from the current
baseline; use reliable metrics; use proper Tools;
understand the data.
Analyse
Develop causal hypothesis
Identify root causes (the ‘vital few’)
Validate hypothesis
RCA

DEG/FHC 21
DMAIC
Improve
Develop ideas to remove root causes
Test solutions
Standardize solutions
Measure the results
Iterate whenever necessary
Control
Establish standard measures to maintain performance
Create and use documentation
Correct problems as needed
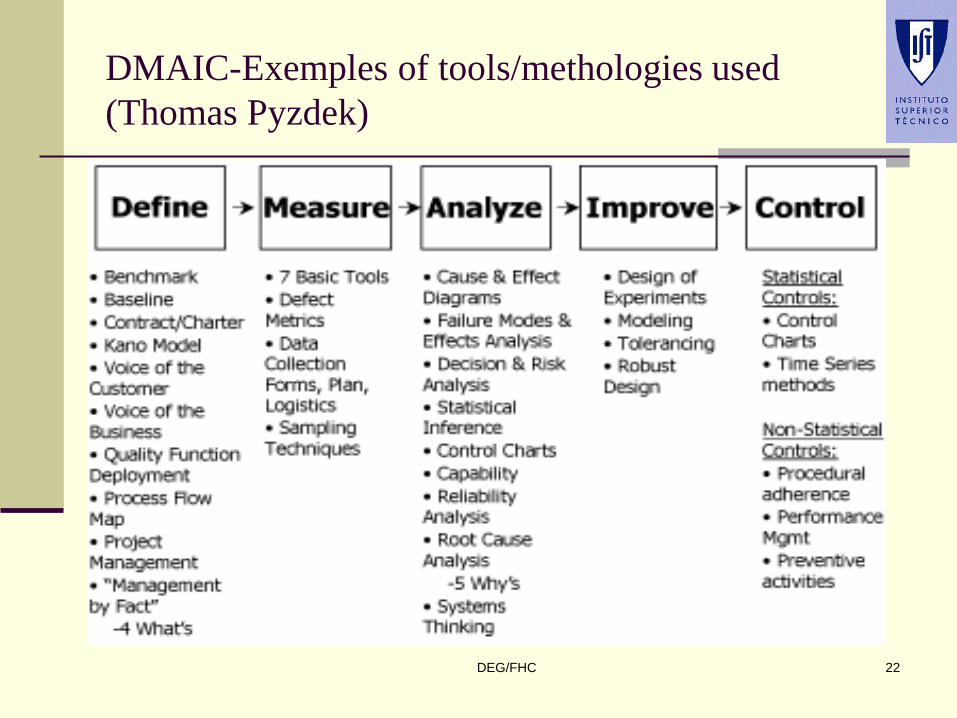
DMAIC-Exemples of tools/methologies used
(Thomas Pyzdek)
DEG/FHC 22

DEG/FHC 23
DMAIC exemple
DEG/FHC 24
DFSS-Designing For Six-Sigma
The DMADV model is the Design for Six Sigma (DFSS) model
used to create major new features of existing products, services,
or processes, or to create entirely new products, services, or
processes. It has 5 phases:
Define -> Measure -> Analyse -> DESIGN-> Validate -> Define
Some authors refer to the Process as DMEDI
(D_M_Explore_D_Implement)
DEG/FHC 25
The Roadmap
Five steps to implementing Six-Sigma
1-Identify core processes and key customers
2-Define customer requirements
3-Measure current performance
4-Prioritize, analyze, implement improvements
5-Expand and integrate the Six-Sigma system
DEG/FHC 26
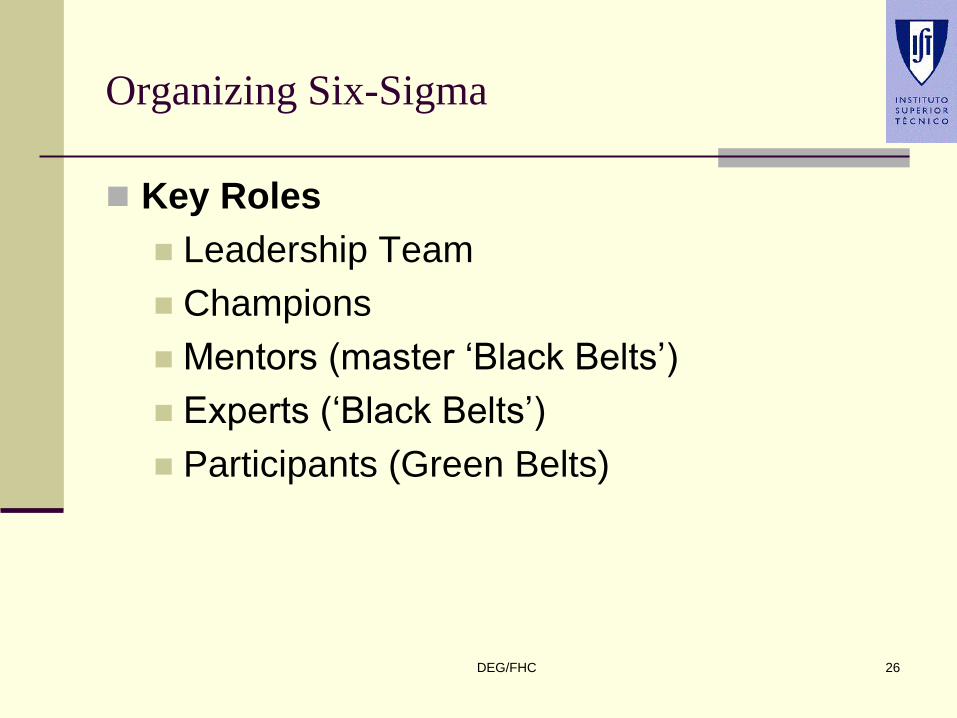
Organizing Six-Sigma
Key Roles
Leadership Team
Champions
Mentors (master ‘Black Belts’)
Experts (‘Black Belts’)
Participants (Green Belts)

DEG/FHC 27
Organizing Six-Sigma
The Leadership Group
Be actively involved from outset
Develop a strategic plan
Establish Roles and Infrastructure
Establish supporting policies
Job descriptions
Reward/Compensation systems
Career paths
Select projects
Prioritize projects and allocate resources
Facilitate, guide, manage

DEG/FHC 28
Organizing Six Sigma
The Champions
Find appropriate projects
Represent projects to the leadership
Provide coaching
Ensure allocation of resources
Resolve issues
Master Back Belts
Coach and support project leaders
Work as a change agent
Train others in the use of Six-Sigma tools

DEG/FHC 29
Organizing Six Sigma
Black Belts
Highly trained experts
Manage project leaders
Lead project teams
Green Belts
Trained in the use of statistical tools
Lead project teams
Participate on project teams
Fad... Or not!
DEG/FHC 30

References
Quality Mgt-Goetsch/Davies (Ch. 1)
The Certified Manager of Quality Handbook-Westcott (Ch. 13).
First Course in Quality Engineering-Krishnamoorthi (Ch. 5)
DMAICtools
DEG/FHC 31