quality parameters in smart fisheries farming
TRANSCRIPT

computers
Review
Recent Advancement of the Sensors for Monitoring the WaterQuality Parameters in Smart Fisheries Farming
Fowzia Akhter 1,*, Hasin Reza Siddiquei 1, Md Eshrat E. Alahi 2 and Subhas C. Mukhopadhyay 1
�����������������
Citation: Akhter, F.; Siddiquei, H.R.;
Alahi, M.E.E.; Mukhopadhyay, S.C.
Recent Advancement of the Sensors
for Monitoring the Water Quality
Parameters in Smart Fisheries
Farming. Computers 2021, 10, 26.
https://doi.org/10.3390/computers
10030026
Academic Editor: George K. Adam
Received: 1 February 2021
Accepted: 22 February 2021
Published: 27 February 2021
Publisher’s Note: MDPI stays neutral
with regard to jurisdictional claims in
published maps and institutional affil-
iations.
Copyright: © 2021 by the authors.
Licensee MDPI, Basel, Switzerland.
This article is an open access article
distributed under the terms and
conditions of the Creative Commons
Attribution (CC BY) license (https://
creativecommons.org/licenses/by/
4.0/).
1 Department of Engineering, Macquarie University, Sydney NSW 2109, Australia;[email protected] (H.R.S.); [email protected] (S.C.M.)
2 Shenzhen Institute of Advanced Technology, Chinese Academy of Sciences, Shenzhen 518055, China;[email protected]
* Correspondence: [email protected]
Abstract: Water quality is the most critical factor affecting fish health and performance in aquacultureproduction systems. Fish life is mostly dependent on the water fishes live in for all their needs.Therefore, it is essential to have a clear understanding of the water quality requirements of the fish.This research discusses the critical water parameters (temperature, pH, nitrate, phosphate, calcium,magnesium, and dissolved oxygen (DO)) for fisheries and reviews the existing sensors to detect thoseparameters. Moreover, this paper proposes a prospective solution for smart fisheries that will help tomonitor water quality factors, make decisions based on the collected data, and adapt more quickly tochanging conditions.
Keywords: water quality; fisheries; sensors; IoT
1. Introduction
Water contamination is a significant problem worldwide, and it is essential to monitorthe contaminating ions to keep the water safe regularly. Moreover, fresh water and marinewater fisheries contribute significantly to various countries such as Australia, Vietnam,Japan, and the Philippines [1]. It is accepted worldwide that good water quality mustmaintain viable aquaculture production and compete with the growing aquaculture indus-try [2]. The poor water quality outcomes result in inferior quality products, health risks forhumans, and low profit. Water contaminants harm the growth, development, reproduction,and mortality of the fishes cultured on a farm, which vastly reduces farm production [3].Some pollutants may remain in small quantities but may threaten human health [4].
The fishes breathe, excrete waste, feed, reproduce, and maintain salt balance insidethe water they live in [5]. Hence, maintaining water quality is the key to ensure the successand failure of an aquaculture project. It is necessary to have a guideline for the farmers onthe essential water quality factor and any parameters’ safe level. Otherwise, continuouswater quality degradation because of anthropogenic sources would reduce the farm’sproductivity and profit [6,7]. Therefore, control and management of water quality in waterresources are pivotal for both fresh water and marine aquaculture.
The water quality of fisheries can be controlled by monitoring the water quality pa-rameters such as temperature, pH, nitrate, phosphate, calcium, magnesium, and dissolvedoxygen regularly using sensors. Inclusion of the Internet of Things (IoT) and communica-tion technology with the sensors will bring significant advantages to monitoring the farmeven from a remote location. Suppose the collected data are stored in a cloud server andshared with experts. In that case, the farmers can receive expert feedback from anywhereglobally, irrespective of their time and location. Figure 1 shows a typical diagram of smartfisheries. That is why, nowadays, agricultural countries such as Australia, New Zealand,Japan, and the USA are interested in incorporating agriculture with technology. This
Computers 2021, 10, 26. https://doi.org/10.3390/computers10030026 https://www.mdpi.com/journal/computers

Computers 2021, 10, 26 2 of 20
necessitates a clear understanding of the vital water quality factors, their impact, and thedevelopment of smart systems that can be used by the farmers with minimal training.
Computers 2021, 10, x FOR PEER REVIEW 2 of 20
New Zealand, Japan, and the USA are interested in incorporating agriculture with tech-nology. This necessitates a clear understanding of the vital water quality factors, their im-pact, and the development of smart systems that can be used by the farmers with minimal training.
Figure 1. A typical diagram of smart fisheries.
This review article discusses the parameters of deciding water quality, the optimum requirement for various fishes, and sensors associated with those parameters. This paper also reviews the software related to water quality management and related research and discusses those algorithms’ advantages and disadvantages. Moreover, it also proposes a low-cost, low-power system as a solution to smart farming. Access to real-time data through IoT-enabled sensors will allow farmers to identify issues affecting farms’ condi-tions and make decisions to improve productivity efficiently. Due to the collection of a large amount of data, predicting situations is also possible to ensure that farmworkers are engaged most productively.
2. Factors Deciding Water Quality and Related Sensors The essential parameters defining water quality are water temperature, pH, nitrate,
phosphate, calcium, magnesium, and dissolved oxygen. Numerous studies have been car-ried out on detecting and measuring the amount of those parameters. These are discussed in this section.
2.1. Water Temperature Fishes are poikilothermic animals whose body temperatures are almost the same as
the water temperature they live in [8]. Water temperature and fish metabolism are closely related to each other. The fishes in higher temperatures have a more significant metabo-lism than those living in lower temperature water [9]. This applies to warm-water fishes. The optimum temperature range for tropical water fish is 24~27 °C, whereas for cold-wa-ter fish it is below 20 °C. Cold-water fishes such as whitefish, salmonids, and burbot have higher metabolism at a lower temperature. They become less active due to consuming less food at a temperature above 20 °C. Fish diseases may initiate and spread because of water temperature [10]. Different fishes require different temperatures for their health and well-being. These are summarised in Table 1 [11]. Most of the fishes have the highest immunity at a temperature of about 15 °C. Fishes naturally adapt to seasonal changes such as, at 0 °C in the winter and 20 ℃ to 30 °C in the summer. However, the temperature should not change abruptly as fishes are shocked if they are put in a new environment with a tem-perature change of 12 °C than the original water [12,13]. Fishes may be paralysed or die
Figure 1. A typical diagram of smart fisheries.
This review article discusses the parameters of deciding water quality, the optimumrequirement for various fishes, and sensors associated with those parameters. This paperalso reviews the software related to water quality management and related research anddiscusses those algorithms’ advantages and disadvantages. Moreover, it also proposes alow-cost, low-power system as a solution to smart farming. Access to real-time data throughIoT-enabled sensors will allow farmers to identify issues affecting farms’ conditions andmake decisions to improve productivity efficiently. Due to the collection of a large amountof data, predicting situations is also possible to ensure that farmworkers are engagedmost productively.
2. Factors Deciding Water Quality and Related Sensors
The essential parameters defining water quality are water temperature, pH, nitrate,phosphate, calcium, magnesium, and dissolved oxygen. Numerous studies have been car-ried out on detecting and measuring the amount of those parameters. These are discussedin this section.
2.1. Water Temperature
Fishes are poikilothermic animals whose body temperatures are almost the same asthe water temperature they live in [8]. Water temperature and fish metabolism are closelyrelated to each other. The fishes in higher temperatures have a more significant metabolismthan those living in lower temperature water [9]. This applies to warm-water fishes. Theoptimum temperature range for tropical water fish is 24~27 ◦C, whereas for cold-waterfish it is below 20 ◦C. Cold-water fishes such as whitefish, salmonids, and burbot havehigher metabolism at a lower temperature. They become less active due to consumingless food at a temperature above 20 ◦C. Fish diseases may initiate and spread because ofwater temperature [10]. Different fishes require different temperatures for their healthand wellbeing. These are summarised in Table 1 [11]. Most of the fishes have the highestimmunity at a temperature of about 15 ◦C. Fishes naturally adapt to seasonal changes suchas, at 0 ◦C in the winter and 20 ◦C to 30 ◦C in the summer. However, the temperatureshould not change abruptly as fishes are shocked if they are put in a new environment witha temperature change of 12 ◦C than the original water [12,13]. Fishes may be paralysedor die under these circumstances. The young fry may show these symptoms, even thetemperature variation is as low as 1.5 ◦C to 3 ◦C. The digestive systems of fishes may slowdown or stop if they are transferred to colder water by 8 ◦C or more after feeding. When

Computers 2021, 10, 26 3 of 20
the food is not entirely digested, gases are produced. Fishes become bloated, imbalanced,and finally, die [14–17]. Figure 2 depicts the influence of water temperature on fish lives.Therefore, monitoring water temperature is essential to control and maintain optimumconditions so that all the potential fishes can gain maximum weight.
Table 1. Temperature requirement for different fishes.
Type of Fish Optimum Temperature Range (◦C)
Crappie 22~24Smallmouth Bass 18~21Largemouth Bass 18~23
Walleye 18~21White Bass 18~21Rock Bass 21~23
Channel Catfish 28~31Rainbow Trout 16~17
Brown Trout 13~19Yellow Perch 20~22Lake Trout 10~13
Steelhead Trout 13~16Chinook and Coho Salmon 13~15
Computers 2021, 10, x FOR PEER REVIEW 3 of 20
under these circumstances. The young fry may show these symptoms, even the tempera-ture variation is as low as 1.5 ℃ to 3 °C. The digestive systems of fishes may slow down or stop if they are transferred to colder water by 8 °C or more after feeding. When the food is not entirely digested, gases are produced. Fishes become bloated, imbalanced, and fi-nally, die [14–17]. Figure 2 depicts the influence of water temperature on fish lives. There-fore, monitoring water temperature is essential to control and maintain optimum condi-tions so that all the potential fishes can gain maximum weight.
Table 1. Temperature requirement for different fishes.
Type of Fish Optimum Temperature Range (°C) Crappie 22~24
Smallmouth Bass 18~21 Largemouth Bass 18~23
Walleye 18~21 White Bass 18~21 Rock Bass 21~23
Channel Catfish 28~31 Rainbow Trout 16~17
Brown Trout 13~19 Yellow Perch 20~22 Lake Trout 10~13
Steelhead Trout 13~16 Chinook and Coho Salmon 13~15
Figure 2. Influence of water temperature on fish lives.
Numerous studies have been carried out on developing a sensor for measuring water temperature. Some researchers used Lithium niobate (LiNbO3) interdigital sensor, whereas some researchers used fibre Bragg grating (FBG) sensors for measuring water temperature [18,19]. The detection range and limit are deficient, and these sensors need complex electronics to make them suitable for the IoT environment. Several sensors are
Figure 2. Influence of water temperature on fish lives.
Numerous studies have been carried out on developing a sensor for measuringwater temperature. Some researchers used Lithium niobate (LiNbO3) interdigital sensor,whereas some researchers used fibre Bragg grating (FBG) sensors for measuring watertemperature [18,19]. The detection range and limit are deficient, and these sensors needcomplex electronics to make them suitable for the IoT environment. Several sensors arecommercially available for measuring water temperature. The most used sensor is anoptical sensor (DS18B20) [20–22]. It provides a wide detection range (−55 ◦C~+125 ◦C),response fast within a second, and suitable for smart aquaculture. However, the cost is veryhigh. Therefore, it is necessary to develop a low-cost, low-power, wide range detectiontemperature sensor applicable for fresh water and marine fisheries.

Computers 2021, 10, 26 4 of 20
2.2. pH
The pH level is another critical parameter for water corrosivity. It measures water’sacidity or alkalinity by determining hydrogen ions (H+) [23]. Water with a pH value of lessthan 7.0 is acid, whereas a pH level above 7.0 is considered a base. The range of pH valuesfor natural waters is from 5.0~10.0, whereas for seawater, it is from 5.0~8.3 [24].
Rapid changes in the pH level of water may have a significant impact on manyorganisms. Different organisms (fish, eggs, and fry) are adapted to live in water, have aspecific pH, and die whenever a slight change in pH value [25]. The pH also varies dueto other factors such as hardness, alkalinity, and dissolved carbon dioxide. The toxicityoccurred because this may influence other elements such as ammonia, heavy metals,cyanides, and hydrogen sulphide. All these phenomena change the pH level in aquacultureand affect fish health, as mentioned in Table 2 [26].
Table 2. Impact of pH level on aquaculture.
Value of pH Impact on Warm-Water Fish
Less than 4.0 Reach to the point of acid death4.0 to 5.0 Not productive6.5 to 9.0 Fish production desirable range
9.0 to 11.0 Slow growthGreater than 11.0 Reach to an of alkaline death
The ideal pH range for marine fishes is from 7.5 to 8.5, whereas most freshwater fishescan sustain within a wide range of pH, ideally from 6.5–9.0. Table 3 shows the preferredpH level for various freshwater fish [27].
Table 3. Optimum pH level for various freshwater fish.
Name of the Fish Optimum pH Level
Zebra Danio 6.5–7.0Tiger Barb 6.0–6.5
Silver Dollar 6.0–7.0Plecostomus 5.0–7.0Neon Tetra 5.8–6.2Hatchet fish 6.0–7.0
Harlequin Rasbora 6.0–6.5Goldfish 7.0–7.5
Clown Loach 6.0–6.5Angelfish 6.5–7.0
The desired range for producing cold-water fishes is between 6.4–8.4, which is dif-ferent from the warm-water fishes. The optimum pH range for freshwater and marinefisheries usually varies from country to country, mainly between 5.0 and 9.0. In Australia,freshwater’s pH level is 5.0–9.0, and marine water is 6.0–9.0 [28–30]. Therefore, it is neces-sary to have accurate pH management in freshwater to produce healthy fishes. Numerousstudies have been conducted on developing a pH sensor, and there are commerciallyavailable sensors. A summary of the existing sensors is given in Table 4.
Table 4. A comparative study on the water pH level measurement.
Sensing Material Detection Range Detection Limit Ref
Ag/AgCl 4.01–6.86 4.01 [31]Platinum 4–10 4 [32]
SEN-10972 (commercial) 1–14 1 [33]Colorimetric pH sensor 1–10 1 [34]Polysulfone/Polyaniline 4–12 4 [35]
Ruthenium (IV) oxide (RuO2) 1.5–12 1.51 [36]

Computers 2021, 10, 26 5 of 20
Most lab-based sensors are cost-effective and provide a wide range of pH leveldetection but still need improvement to apply in a real-life scenario such as corrosion-free. The commercially available sensors are wide range, fast response, IoT compatiblebut expensive.
2.3. Nitrites and Nitrates
Nitrites exist in the surface water with nitrates and ammonia nitrogen, albeit at lowconcentrations due to instability. They transform into nitrate or ammonia both chemicallyand biochemically through bacteria [37]. Nitrates are formed due to organic nitrogencompounds’ aerobic decomposition [38]. Retention soil does not contain nitrate andleached to lakes, ponds, or creeks so easily. The surface water becomes nitrate pollutedbecause of using manures on arable land and nitrogen fertilisers. These are diffused in thesoil and discharge into sewage, lakes, or ponds [39]. Figure 3 shows a typical example ofnitrate leaching.
Computers 2021, 10, x FOR PEER REVIEW 6 of 20
Figure 3. A typical example of nitrate leaching and the nitrogen cycle.
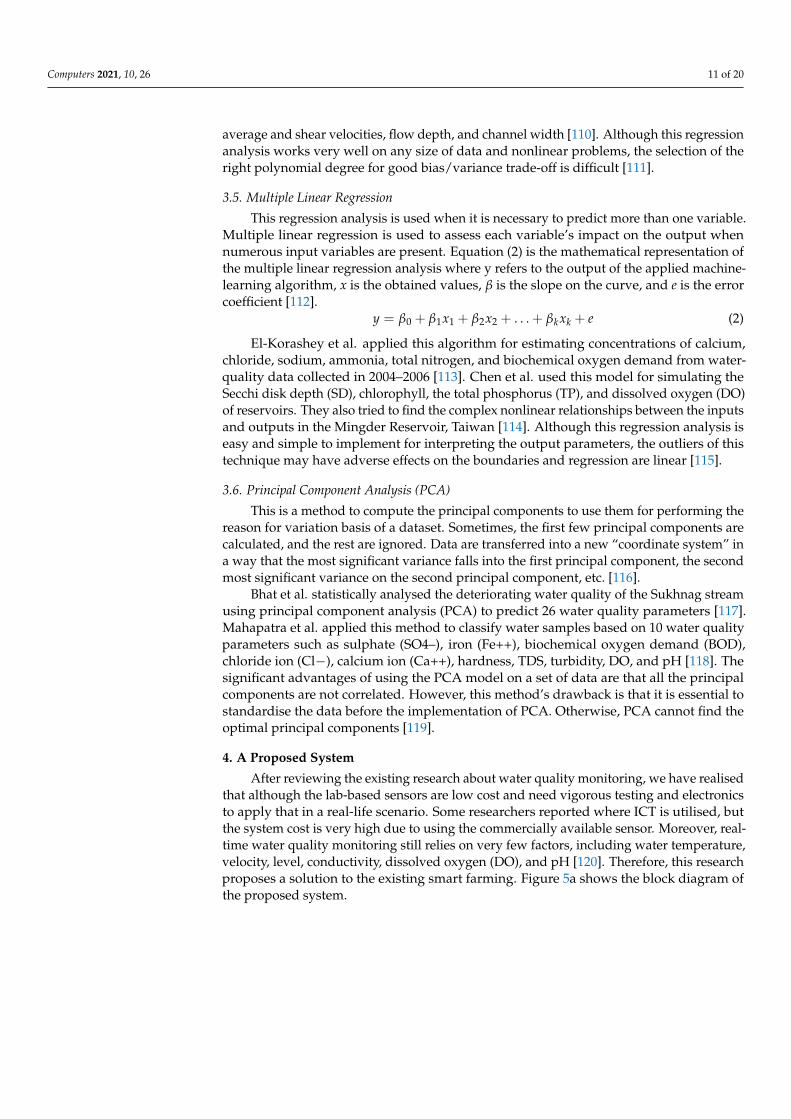
Some researchers used graphene-based electrochemical sensing methods [45–52], whereas some researchers used the colorimetric [53] method for detecting nitrate in water samples. A summary of the existing nitrate sensors is included in Table 6. Although these sensors can detect a wide range of nitrate concentrations, the process still needs improve-ment of response time, high-sensitivity, low-power, low-cost, and easily operable sensors applicable to real-time monitoring in any environmental condition.
Table 6. A comparative study on nitrate detection in water.
Sensing Material Detection Range Detection Limit Ref AuNps/SG 10~3960 0.2 [45]
AuNps/Graphene sheet 0.3~720 0.1 [46] Ni@Pt/Graphene sheet 10~1500 10 [47]
rGO/TEBAC 0.2~200 0.2 [48] AuNPs/rGO 0.1~20 0.1 [49]
Cu@Pt/Graphene 1~1000 1 [50] MMA-DMA copolymer 0.5~10 0.55 [51]
AuNPs/ERGO 0.1~10 M 0.1 [52] Colorimetric 0.03~5.19 0.03 [53]
Figure 3. A typical example of nitrate leaching and the nitrogen cycle.
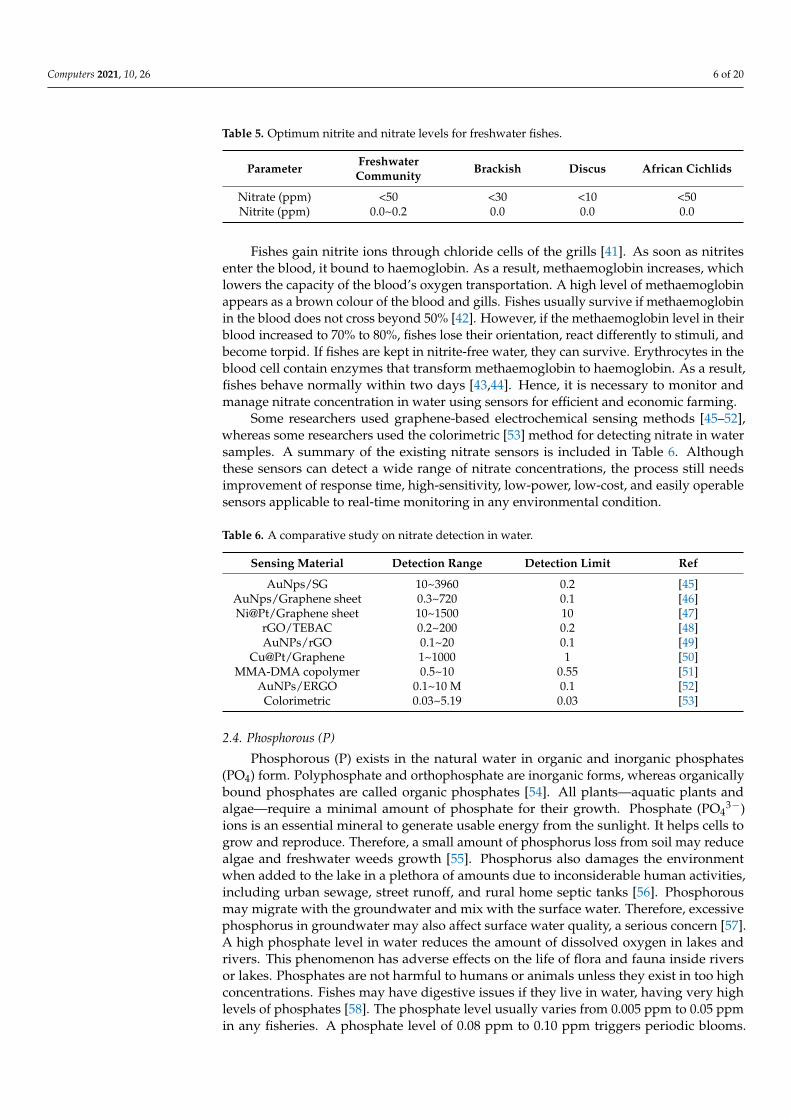
Nitrate leaching to aquaculture affects the life of aquatic animals, although differentspecies are affected differently. The maximum tolerable limits of nitrate for freshwater andmarine water fisheries are 110 ppm and 40 ppm, respectively. A nitrite range of 0.0~0.2 ppmis ideal for both freshwater and marine water fisheries, whereas any concentration of morethan 0.5 ppm is considered harmful, and 1.6 ppm is considered lethal. The optimum nitritesand nitrate levels for freshwater fisheries are summarised in Table 5 [40].
Computers 2021, 10, 26 6 of 20
Table 5. Optimum nitrite and nitrate levels for freshwater fishes.
Parameter FreshwaterCommunity Brackish Discus African Cichlids
Nitrate (ppm) <50 <30 <10 <50Nitrite (ppm) 0.0~0.2 0.0 0.0 0.0
Fishes gain nitrite ions through chloride cells of the grills [41]. As soon as nitritesenter the blood, it bound to haemoglobin. As a result, methaemoglobin increases, whichlowers the capacity of the blood’s oxygen transportation. A high level of methaemoglobinappears as a brown colour of the blood and gills. Fishes usually survive if methaemoglobinin the blood does not cross beyond 50% [42]. However, if the methaemoglobin level in theirblood increased to 70% to 80%, fishes lose their orientation, react differently to stimuli, andbecome torpid. If fishes are kept in nitrite-free water, they can survive. Erythrocytes in theblood cell contain enzymes that transform methaemoglobin to haemoglobin. As a result,fishes behave normally within two days [43,44]. Hence, it is necessary to monitor andmanage nitrate concentration in water using sensors for efficient and economic farming.
Some researchers used graphene-based electrochemical sensing methods [45–52],whereas some researchers used the colorimetric [53] method for detecting nitrate in watersamples. A summary of the existing nitrate sensors is included in Table 6. Althoughthese sensors can detect a wide range of nitrate concentrations, the process still needsimprovement of response time, high-sensitivity, low-power, low-cost, and easily operablesensors applicable to real-time monitoring in any environmental condition.
Table 6. A comparative study on nitrate detection in water.
Sensing Material Detection Range Detection Limit Ref
AuNps/SG 10~3960 0.2 [45]AuNps/Graphene sheet 0.3~720 0.1 [46]Ni@Pt/Graphene sheet 10~1500 10 [47]
rGO/TEBAC 0.2~200 0.2 [48]AuNPs/rGO 0.1~20 0.1 [49]
Cu@Pt/Graphene 1~1000 1 [50]MMA-DMA copolymer 0.5~10 0.55 [51]
AuNPs/ERGO 0.1~10 M 0.1 [52]Colorimetric 0.03~5.19 0.03 [53]
2.4. Phosphorous (P)
Phosphorous (P) exists in the natural water in organic and inorganic phosphates(PO4) form. Polyphosphate and orthophosphate are inorganic forms, whereas organicallybound phosphates are called organic phosphates [54]. All plants—aquatic plants andalgae—require a minimal amount of phosphate for their growth. Phosphate (PO4
3−)ions is an essential mineral to generate usable energy from the sunlight. It helps cells togrow and reproduce. Therefore, a small amount of phosphorus loss from soil may reducealgae and freshwater weeds growth [55]. Phosphorus also damages the environmentwhen added to the lake in a plethora of amounts due to inconsiderable human activities,including urban sewage, street runoff, and rural home septic tanks [56]. Phosphorousmay migrate with the groundwater and mix with the surface water. Therefore, excessivephosphorus in groundwater may also affect surface water quality, a serious concern [57].A high phosphate level in water reduces the amount of dissolved oxygen in lakes andrivers. This phenomenon has adverse effects on the life of flora and fauna inside riversor lakes. Phosphates are not harmful to humans or animals unless they exist in too highconcentrations. Fishes may have digestive issues if they live in water, having very highlevels of phosphates [58]. The phosphate level usually varies from 0.005 ppm to 0.05 ppmin any fisheries. A phosphate level of 0.08 ppm to 0.10 ppm triggers periodic blooms.

Computers 2021, 10, 26 7 of 20
However, the eutrophication process will stop if phosphate levels remain at 0.05 ppm forthe long-term [59]. Hence, it is necessary to have the best phosphate management in waterused in farming and lakes or rivers for economic and environmental reasons.
Some researchers used graphene-based electrochemical sensing methods [60–66],whereas some researchers used the colorimetric [67] method for detecting phosphate in wa-ter samples. A summary of the existing phosphate sensors is included in Table 7. Althoughthe current sensors can detect a wide range of phosphate concentrations, the response timeis relatively high and needs vigorous testing to fit real-life scenarios. Therefore, there is alot to improve in the phosphate sensing research in terms of high-sensitivity, low-power,low-cost, and applicability in any environmental condition.
Table 7. A summary of the existing phosphate sensor applicable to water bodies.
Sensing Material Detection Range Detection Limit Ref
Ag/rGO 5~6000 1.20 [60]Al2O3/rGO 1~10 1 [61]rGO/ferritin 16.7~500 0.806 [62]
Co/Pt/C/Ag-AgCl 1~9500 0.3 [63]Poly vinyl chloride/Polyurethane 0.096~960 0.096 [64]
Cobalt/Glass 1~3300 0.08 [65]Wax paper 4~300 4 [66]
Coulometric titration 1.5~55 1.5 [67]
2.5. Calcium (Ca) and Magnesium (Mg)
Calcium (Ca) and magnesium (Mg) are vital nutrients necessary for aquatic animals.They gain these nutrients either from food or water. Calcium (Ca) is a crucial nutrient of wa-ter in a fish hatchery. Fish hatcheries having low calcium concentration may suffer becausethe eggs hydrate and do not mature to hatch appropriately in that water [68]. The requiredcalcium concentration varies based on the type of fishes. For example, the minimumconcentration for brown trout is 10 ppm, whereas it is 4 ppm for channel catfish [69].
Magnesium (Mg) is another essential mineral needed for the development of fresh-water fish. Some fish species such as tilapia, catfish, rainbow trout, and carp need dietaryintake for their development [70]. These fishes’ growth largely depends on Mg and proteindiets. Carp fishes’ activity and performance depend on various nutrients’ deposition rateson their bodies [71]. When the diet contains 0.08 g Mg kg−1 of Mg, the fishes’ growthreduces, muscle flaccidity, and skin haemorrhages may appear [72].
The fishes having a high protein diet may suffer due to Mg deficiency because thehigher the protein diet they receive; the higher the required Mg level [73]. However, thisgeneralisation does not apply to all fishes. The Tilapia, having a high protein diet, maysuffer Mg deficiency. This research outcome is found by measuring the feed efficiency ratio,specific growth rate, and weight gain [74]. Hence, it is essential to manage and control theCa and Mg level in fisheries to increase the farm’s quality, productivity, and profitability.In addition to fisheries farm, if someone wants to keep the aquarium, they also need tomaintain the calcium and magnesium-based on the type of aquarium. The optimum Caand Mg levels for different types of aquariums are summarised in Table 8 [75].
Table 8. Preferred calcium and magnesium concentrations for various aquariums.
Parameter Coral Reefs FOWLR Aquarium Reef Aquarium
Calcium (ppm) 380~420 350~450 350~450Magnesium (ppm) 1300 1150~1350 1250~1350
There are various methods of determining phosphate concentrations, including high-performance liquid chromatography (HPLC) [76], UV-spectroscopy [77], and chromatogra-phy [78]. These methods provide highly accurate results but are time-consuming, compli-cated, and require regular care such as cleaning, storage, and maintenance [79]. One has

Computers 2021, 10, 26 8 of 20
to be highly educated and trained to use these machines. Hence, it is essential to developlow-cost, low-power sensing devices for detecting nutrients accurately in different waterbodies, which anyone can use with minimal training for economic and effective farming.
2.6. Dissolved Oxygen (DO)
Oxygen is diffused into fisheries from the atmosphere during surface turbulence andwater when photosynthesis occurs in fisheries’ plants. However, oxygen is removed fromthe water due to all the organisms’ respiration and organic substances aerobic degradationcaused by bacteria [80]. The oxygen requirement varies among the fish species. Forexample, the optimum need for salmonids is 8 ppm to 10 ppm, and they suffocate if theconcentrations go below 3 ppm, whereas Cyprinids require less oxygen. They are veryactive and thrive in water having 6 ppm to 8 ppm of DO. However, they suffocate in casethe concentration goes low from 1.5 ppm to 2 ppm [81]. Silver perch can tolerate up to2 ppm of DO for few hours only. If it is exposed to this level for a long term, fish growthwill be reduced, and stress will be increased. The required DO level changes depending onthe species of fish. Worms, oysters, crabs, and bottom feeders require at least 1–6 ppm ofoxygen (1–6 ppm), whereas shallow-water fishes need more oxygen from 4 ppm to 15 ppm.Yellow Perch, White Perch, Largemouth Bass, and Bluegill are known as warm-water fishesand require DO levels of more than 5 ppm [82]. They cannot stay in the areas having lessthan 3 ppm of DO levels and suffer badly when the oxygen level is reduced to 2 ppm.The average DO level should be maintained around 5.5 ppm for survival and optimumgrowth [83].
The fishes’ oxygen requirement also depends on water temperature, the total weightof fish per unit water volume, and individual weight. Fishes demand more oxygen whenthey live at a higher temperature. The oxygen requirement becomes double if the watertemperature increases from 10 ◦C to 20 ◦C. When the number of fishes in a specific volumeof water increases, fishes become more active. As a result, they demand more oxygenbecause of increased respiration rate due to overcrowding [84,85]. Therefore, the balanceamong these factors needs to understand clearly. It is also important to remember thatan adequate oxygen level observed during the day does not ensure the same amount willremain at night. A sunny day indicates extreme oxygen deficiency at night [86].
Oxygen deficiency harms fish life. When the fishes are exposed to water havingoxygen deficiency, they stop eating, gather near the surface water where the oxygenlevel is high, gasp for air, not react to irritation, become torpid, and lose the strengthof escaping from capture, and finally die [87]. Figure 4 shows the impact of DO on thefishpond. The significant effect on fish health due to oxygen deficiency includes paleskin, small haemorrhages on the ocular cavity’s front and the covered grill, adherence ofthe gill lamellae, and congested cyanotic blood in the gills [88]. Therefore, it is essentialto monitor the amount of dissolved oxygen inside fisheries farms to take the necessaryactions beforehand.
Researchers have developed dissolved oxygen sensors using various detection meth-ods, including electrochemical, optical, and colorimetric. A summary of the existingDO sensors is shown in Table 9. Some lab-based sensors provide a wide range of detec-tion but need complex electronic circuitry to make the sensor applicable for a real-lifescenario [89–92]. They are also prone to corrosion. The commercial sensors respond fast,IoT compatible, but very costly [93]. Some researchers used sensors for real-time mon-itoring DO in water, whereas some researchers combined sensor and machine learningmodels to predict results if the sensor fails. Therefore, it is essential to develop low-cost,low-power, wide detection range, IoT compatible sensors applicable to the practical field.

Computers 2021, 10, 26 9 of 20
Computers 2021, 10, x FOR PEER REVIEW 9 of 20
Oxygen deficiency harms fish life. When the fishes are exposed to water having oxy-gen deficiency, they stop eating, gather near the surface water where the oxygen level is high, gasp for air, not react to irritation, become torpid, and lose the strength of escaping from capture, and finally die [87]. Figure 4 shows the impact of DO on the fishpond. The significant effect on fish health due to oxygen deficiency includes pale skin, small haem-orrhages on the ocular cavity’s front and the covered grill, adherence of the gill lamellae, and congested cyanotic blood in the gills [88]. Therefore, it is essential to monitor the amount of dissolved oxygen inside fisheries farms to take the necessary actions before-hand.
Figure 4. Dissolved oxygen and its effect.
Researchers have developed dissolved oxygen sensors using various detection meth-ods, including electrochemical, optical, and colorimetric. A summary of the existing DO sensors is shown in Table 9. Some lab-based sensors provide a wide range of detection but need complex electronic circuitry to make the sensor applicable for a real-life scenario [89–92]. They are also prone to corrosion. The commercial sensors respond fast, IoT compati-ble, but very costly [93]. Some researchers used sensors for real-time monitoring DO in water, whereas some researchers combined sensor and machine learning models to pre-dict results if the sensor fails. Therefore, it is essential to develop low-cost, low-power, wide detection range, IoT compatible sensors applicable to the practical field.
Table 9. A summary of the existing dissolved oxygen sensor.
Sensing Material Detection Range Detection Limit Ref PtOEP-C6/Poly
(St-TFEMA) 0.1~39.3 0.1 [89]
Ceramic Soil Microbial Fuel Cells 1.0~10.0 1.0 [90] Nitrogen and Boron-Doped Reduced
Graphene Oxide Membrane-Less 1.5~10.0 1.5 [91]
Ruthenium Complex Doped with Silver Nanoparticles
1.0~15.0 1.0 [92]
Seabird 63 DO 1.0~10.0 1.0 [93]
Figure 4. Dissolved oxygen and its effect.
Table 9. A summary of the existing dissolved oxygen sensor.
Sensing Material Detection Range Detection Limit Ref
PtOEP-C6/Poly(St-TFEMA) 0.1~39.3 0.1 [89]
Ceramic Soil Microbial Fuel Cells 1.0~10.0 1.0 [90]Nitrogen and Boron-Doped Reduced
Graphene Oxide Membrane-Less 1.5~10.0 1.5 [91]
Ruthenium Complex Doped withSilver Nanoparticles 1.0~15.0 1.0 [92]
Seabird 63 DO 1.0~10.0 1.0 [93]Polymer Optical Fibers (POF) 1.0~10.0 1.0 [94]
Cu (II) Complex ModifiedElectrode 2.1~8.5 2.1 [95]
3. Necessity of IoT-Based Farming and Related Research
The fascinating ability of the Internet of Things (IoT) is converting a dumb systeminto smart by incorporating it with the internet. It helps sense the physical objects andcontrol them from any remote location. It integrates the physical world with a computer-based system [96]. Data from IoT-enabled devices can guide farmers’ taking decisions,making farms smart enough to adapt more quickly to changing conditions. Remotelymonitoring the farm conditions and infrastructure helps in saving time, labour, and cost,enabling farmers to focus on other things. It also improves the ability to decide basedon data analysis. It helps build capabilities to respond to technological advancementby investing in research and development to contribute to innovation to improve theagricultural sector’s productivity and profit [97].
Nowadays, researchers utilise information and communications technology (ICT)with sensors to monitor, transmit, and manage fisheries’ quality of water and developefficient quality management based on the collected data. Some researchers used machine-learning algorithms to predict and analyse the water quality parameters. The most popularmachine-learning algorithms for water quality analysis are the K-nearest neighbour (KNN)algorithm, random forest (RF) model, decision tree regression, polynomial regression,

Computers 2021, 10, 26 10 of 20
multiple linear regression, and principal component analysis (PCA). The algorithms andapplications of these methods in water quality management are discussed in this section.
3.1. K-Nearest Neighbour (KNN)
K-nearest neighbour is one of the most popular supervised algorithms to identify anew entry’s patterns or behaviour based on the trained data. It classifies the incoming databy looking at similar data at the neighbours. Rose et al. used this algorithm to identifythe unknown solvents of water by determining known total dissolved solvents (TDS) [98].Adidrana et al. applied this method to predict nutrient conditions in a hydroponic nutritioncontrol system for lettuce [99]. Although this method is simple and easy to implement, ithas some shortcomings. The number of samples plays a vital role in the classification speedfor highly complex scenarios. The accuracy of this method significantly reduces when thesamples are unevenly distributed [100].
3.2. Random Forest (RF) Model
An RF machine-learning model solves the classification and regression problems. Thesystem is trained with a dataset, and a group of decision trees is constructed. A new entryis predicted based on the mean value from the set of decision trees. The users specify themaximum tree number for making the forest while developing the random forest model. Abootstrapped random sample is used to construct a tree from the training data set [101]
Devi et al. used this method for predicting the quality of water in the Kadapa Districtof India and classifying the regions into three classes such as excellent, good, or poor fordrinking [102]. Benedict et al. applied the RF model to predict water quality parameterssuch as pH, temperature, and turbidity from remote locations [103]. The major advantageof using this algorithm is that it can automatically handle missing values. However, thismodel requires more time for training as compared to decision trees. It also requiresgenerating a lot of trees to decide on the majority of votes [104].
3.3. Decision Tree Regression
A decision tree model is used for both regression and classification of data. The systemis trained with a set of data, and decision trees are constructed. After that, the system takesdecisions based on the relevant input parameter values. Using entropy, it selects the rootvariable and looks for values of other parameters. Different input parameters are given atvarious steps of the tree to finalise the decision based on the trained data [105].
Liao et al. used this model to predict and evaluate Chao Lake’s water quality. Theyalso improved the decision tree’s learning method for the faster, easier, and accurate forecastof data [106]. Saghebian et al. developed a simple and powerful decision tree to classify thequality of groundwater in Ardebil [107]. Although this method works well for both linearand nonlinear problems, it overfits data and provides inaccurate results on small datasets.
3.4. Polynomial Regression
The polynomial regression method is used if the input and output variables relationsare non-linear and complex. A higher-order variable (two or more) is used for capturingthe non-linear relationship between the input and output parameters. However, overfittingmay occur if a higher-order variable is used, as shown in Equation (1). In this equation,y refers to the output based on the applied machine learning algorithm, x represents theobtained value, i is the number of considered parameters, β is the scaling factor, k is thepolynomial equation order, and ei is the residuals of the ith predictor [108].
y = β0 + β1xi + β2x2i + . . . + βkxk
i + ei, where i = 1, 2, . . . , n (1)
Huang et al. used this model to assess the change-points and trends of water qualityparameters. This model successfully evaluates the efficiency of the strategies for controllingpollution and predicts the trends of water quality in Shanxi Reservoir [109]. Balf et al.proposed this model to predict longitudinal dispersion coefficient in rivers as a function of
Computers 2021, 10, 26 11 of 20
average and shear velocities, flow depth, and channel width [110]. Although this regressionanalysis works very well on any size of data and nonlinear problems, the selection of theright polynomial degree for good bias/variance trade-off is difficult [111].
3.5. Multiple Linear Regression
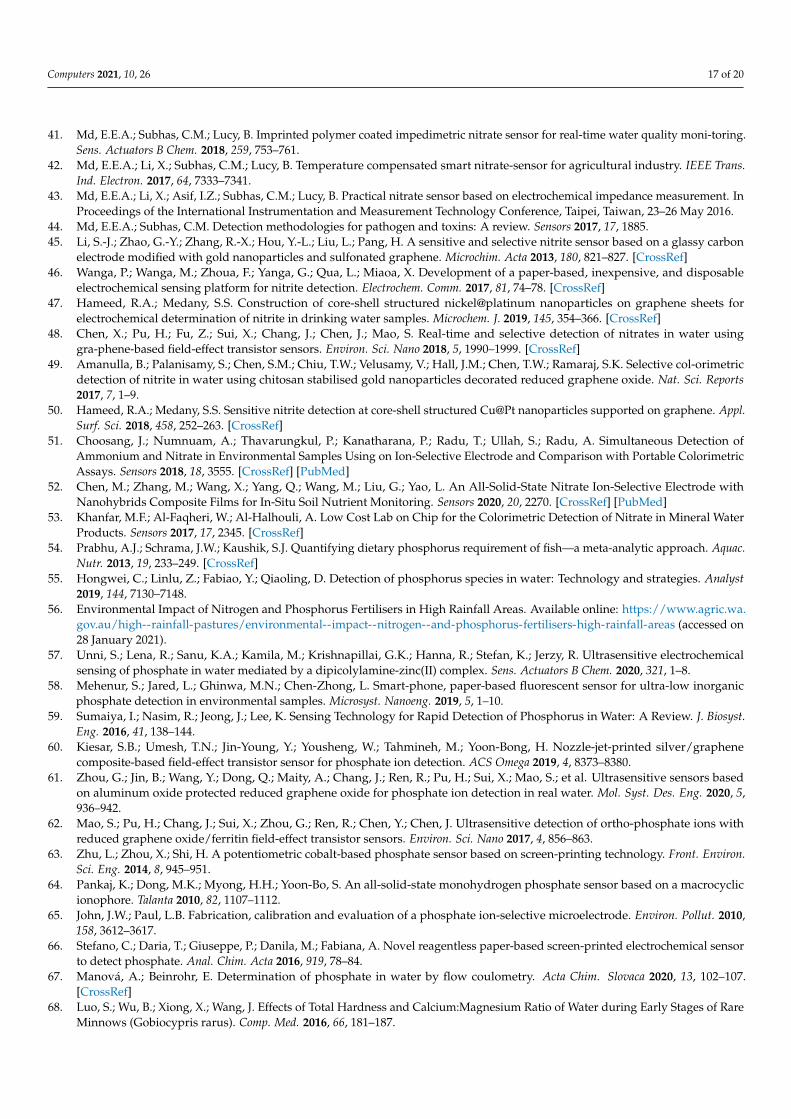
This regression analysis is used when it is necessary to predict more than one variable.Multiple linear regression is used to assess each variable’s impact on the output whennumerous input variables are present. Equation (2) is the mathematical representation ofthe multiple linear regression analysis where y refers to the output of the applied machine-learning algorithm, x is the obtained values, β is the slope on the curve, and e is the errorcoefficient [112].
y = β0 + β1x1 + β2x2 + . . . + βkxk + e (2)
El-Korashey et al. applied this algorithm for estimating concentrations of calcium,chloride, sodium, ammonia, total nitrogen, and biochemical oxygen demand from water-quality data collected in 2004–2006 [113]. Chen et al. used this model for simulating theSecchi disk depth (SD), chlorophyll, the total phosphorus (TP), and dissolved oxygen (DO)of reservoirs. They also tried to find the complex nonlinear relationships between the inputsand outputs in the Mingder Reservoir, Taiwan [114]. Although this regression analysis iseasy and simple to implement for interpreting the output parameters, the outliers of thistechnique may have adverse effects on the boundaries and regression are linear [115].
3.6. Principal Component Analysis (PCA)
This is a method to compute the principal components to use them for performing thereason for variation basis of a dataset. Sometimes, the first few principal components arecalculated, and the rest are ignored. Data are transferred into a new “coordinate system” ina way that the most significant variance falls into the first principal component, the secondmost significant variance on the second principal component, etc. [116].
Bhat et al. statistically analysed the deteriorating water quality of the Sukhnag streamusing principal component analysis (PCA) to predict 26 water quality parameters [117].Mahapatra et al. applied this method to classify water samples based on 10 water qualityparameters such as sulphate (SO4–), iron (Fe++), biochemical oxygen demand (BOD),chloride ion (Cl−), calcium ion (Ca++), hardness, TDS, turbidity, DO, and pH [118]. Thesignificant advantages of using the PCA model on a set of data are that all the principalcomponents are not correlated. However, this method’s drawback is that it is essential tostandardise the data before the implementation of PCA. Otherwise, PCA cannot find theoptimal principal components [119].
4. A Proposed System
After reviewing the existing research about water quality monitoring, we have realisedthat although the lab-based sensors are low cost and need vigorous testing and electronicsto apply that in a real-life scenario. Some researchers reported where ICT is utilised, butthe system cost is very high due to using the commercially available sensor. Moreover, real-time water quality monitoring still relies on very few factors, including water temperature,velocity, level, conductivity, dissolved oxygen (DO), and pH [120]. Therefore, this researchproposes a solution to the existing smart farming. Figure 5a shows the block diagram ofthe proposed system.

Computers 2021, 10, 26 12 of 20
Computers 2021, 10, x FOR PEER REVIEW 13 of 20
AD5933 impedance analyser is used to read each sensor data and convert it into meaningful water quality parameters applying a data processing algorithm. Once the sen-sors’ data are read, those can be transferred to the ThingSpeak (The MathWorks, Inc.,USA) server. The necessary coding to run the system is written in Arduino integrated develop-ment environment (IDE). A channel is open in ThingSpeak, and different fields are allo-cated to store each data. While writing the server code, the channel number and applica-tion programming interface (API) key are given so that the system data is stored in the allocated channel.
After developing the sensor node, it is installed at Macquarie university creek for data collection. Figure 6 shows the preliminary results of the collected data into the Thing-Speak cloud server. Sensors' performances deteriorate when used in the long term. There-fore, an auto-calibration algorithm will be developed based on the collected data in the future, enhancing the reliability of the proposed system.
The autonomous system can be installed in any fishers for monitoring water quality parameters. The farmers can use the system with minimal training and regularly check the water nutrient level to efficiently manage the farm’s productivity. They can also re-ceive feedback from experts whenever necessary from anywhere in the world. This smart prototype will significantly impact the agricultural industry, detecting any abnormality in an early stage and taking necessary measures before the situation goes out of hand.
(a)
(b)
(c)
Computers 2021, 10, x FOR PEER REVIEW 14 of 20
(d)
Figure 5. (a) Block diagram of the proposed system, (b) connection diagram of the system, (c) inset of the proposed system, and (d) the final prototype installed for monitoring water quality.
(a) (b)
(c) (d)
(e) (f)
Figure 5. (a) Block diagram of the proposed system, (b) connection diagram of the system, (c) inset of the proposed system,and (d) the final prototype installed for monitoring water quality.
Because all the sensors necessary for monitoring water quality are not yet commer-cially available, an electronic component is included with the existing sensors to make thesensors smart. Any interdigital electrochemical sensors can be converted into an intelligent

Computers 2021, 10, 26 13 of 20
sensor using the AD5933 impedance analyser (Analogue Devices, Wilmington, MA, USA).This research proposes a smart system that is a continuation of our previous study [121].The autonomous system consists of two pumps (SFDP1-010-035-21) [122], an LM298 pumpcontroller (DC Pumps Australia, Littlehampton, SA, Australia) [123], nitrate sensor, andAD5933 impedance analyser [124] for taking the impedance measurement, Arduino UNOmicrocontroller (Core Electronics, Kotara, NSW, Australia) [125] is the core of the sens-ing node, LoRa shield (IoT store, Perth, Australia) [126] for radio communication, 12 V10 W Solar Panel (Jaycar, Australia) [127], Dia Mec (DMU12-12(12V12AH/20HR) (Jaycar,Australia) [128] rechargeable battery for providing continuous energy, 12/24 V 10 A SolarCharge Controller (Jaycar, Australia) [129] with USB for converting the charging the bat-tery utilising solar energy. The system was used to measure the nitrate concentrations inreal-time from Macquarie Lake. This system is modified to monitor other water qualityparameters, including temperature, pH, nitrate, phosphate, calcium, magnesium, and DOcascading all the sensors. Therefore, the circuit diagram of the proposed system is modifiedas Figure 5b. All these sensors are very low-cost and fabricated in our lab. For nitratemeasurement, an FR4- based sensor proposed in our previous study is used [121]. Fortemperature, calcium, and magnesium measurement, an MWCNTs/PDMS sensor pro-posed by Akhter et al. is used [130]. For phosphate measurement, a graphite/PDMS sensorproposed by Nag et al. is used [131]. For pH measurement, a graphene sensor proposed byNag et al. is used [132]. For selective detection of DO, a Microelectromechanical systems(MEMS) sensor coated with rGO/CuO2 is fabricated in our lab. All these sensors can detecta wide range of parameters and respond very fast.
Figure 5c,d shows the inset and final prototype. A chamber is allocated for watercollection. Two pumps are used—one for water collection from the creek, and the otherone that empties the chamber after finishing the measurement. LM298 motor controllercontrols all these. The pump goes to ON and OFF state based on NAND gate logic. Whenboth inputs are in the same state, the pump remains OFF, and when both inputs are atdifferent states, the pump goes ON.
AD5933 impedance analyser is used to read each sensor data and convert it intomeaningful water quality parameters applying a data processing algorithm. Once thesensors’ data are read, those can be transferred to the ThingSpeak (The MathWorks, Inc.,Natick, MA, USA) server. The necessary coding to run the system is written in Arduinointegrated development environment (IDE). A channel is open in ThingSpeak, and differentfields are allocated to store each data. While writing the server code, the channel numberand application programming interface (API) key are given so that the system data is storedin the allocated channel.
After developing the sensor node, it is installed at Macquarie university creek for datacollection. Figure 6 shows the preliminary results of the collected data into the ThingSpeakcloud server. Sensors’ performances deteriorate when used in the long term. Therefore,an auto-calibration algorithm will be developed based on the collected data in the future,enhancing the reliability of the proposed system.
The autonomous system can be installed in any fishers for monitoring water qualityparameters. The farmers can use the system with minimal training and regularly check thewater nutrient level to efficiently manage the farm’s productivity. They can also receivefeedback from experts whenever necessary from anywhere in the world. This smartprototype will significantly impact the agricultural industry, detecting any abnormality inan early stage and taking necessary measures before the situation goes out of hand.

Computers 2021, 10, 26 14 of 20
Computers 2021, 10, x FOR PEER REVIEW 14 of 20
(d)
Figure 5. (a) Block diagram of the proposed system, (b) connection diagram of the system, (c) inset of the proposed system, and (d) the final prototype installed for monitoring water quality.
(a) (b)
(c) (d)
(e) (f)
Computers 2021, 10, x FOR PEER REVIEW 15 of 20
(g)
Figure 6. Sensor data collected into ThingSpeak server—(a) temperature, (b) nitrate, (c) phosphate, (d) calcium, (e) mag-nesium, (f) pH, and (g) dissolved oxygen (DO).
5. Conclusions The essential parameters deciding water quality, their impact on fresh water and ma-
rine fisheries are successfully discussed in this research. Moreover, the acceptable limits of each parameter for healthy fisheries are also discussed. The existing sensors for each parameter are discussed; their advantages and disadvantages are presented. Additionally, software-based water quality monitoring systems are also discussed. Moreover, an auton-omous system is proposed to monitor water quality for smart fisheries. The major ad-vantage of the proposed system is using low-cost, low-power sensors compared to the existing systems. The implementation cost of the proposed system is USD 250, which in-cludes purchasing electronic components in small numbers. However, the overall cost can be reduced significantly when the product is developed in large numbers. All the existing systems use commercially available sensors, and those are very expensive. Due to using the sensors fabricated in our lab, the system cost is significantly reduced. The proposed systems fulfil the motives of agriculture 4.0, which no longer only relies on applying pes-ticides and food into fishers but also running the farms with advanced technology, includ-ing sensors, machines, devices, and communication systems. The existence of these sys-tems in any fisheries will help farmers make informed decisions beforehand using ad-vanced technologies to improve productivity and profitability.
Author Contributions: F.A. and S.C.M.; Conceptualisation, F.A. and H.R.S.; writing—original draft preparation, F.A., H.R.S., and M.E.E.A.; writing—review and editing, S.C.M. and M.E.E.A.; supervision. All authors have read and agreed to the published version of the manuscript.
Funding: This research received no external funding.
Institutional Review Board Statement: Not applicable
Informed Consent Statement: Not applicable
Data Availability Statement: Not applicable
Conflicts of Interest: The authors declare no conflict of interest.
References 1. Aura, C.M.; Musa, S.; Yongo, E.; Okechi, J.K.; Njiru, J.M.; Ogari, Z.; Wanyama, R.; Charo-Karisa, H.; Mbugua, H.; Kidera, S.; et
al. Integration of mapping and socio-economic status of cage culture: Towards balancing lake-use and culture fisheries in Lake Victoria, Kenya. Aquac. Res. 2017, 49, 532–545, doi:10.1111/are.13484.
2. Curtis, J.; Stanley, B. Water quality and recreational angling demand in Ireland. J. Outdoor Recreat. Tour. 2016, 14, 27–34, doi:10.1016/j.jort.2016.04.005.
3. Giacomazzo, M.; Bertolo, A.; Brodeur, P.; Massicotte, P.; Goyette, J.O.; Magnan, P. Linking fisheries to land use: How an-thropo-genic inputs from the watershed shape fish habitat quality. Sci. Total Environ. 2020, 717, 1–11.
Figure 6. Sensor data collected into ThingSpeak server—(a) temperature, (b) nitrate, (c) phosphate, (d) calcium, (e)magnesium, (f) pH, and (g) dissolved oxygen (DO).

Computers 2021, 10, 26 15 of 20
5. Conclusions
The essential parameters deciding water quality, their impact on fresh water andmarine fisheries are successfully discussed in this research. Moreover, the acceptable limitsof each parameter for healthy fisheries are also discussed. The existing sensors for eachparameter are discussed; their advantages and disadvantages are presented. Addition-ally, software-based water quality monitoring systems are also discussed. Moreover, anautonomous system is proposed to monitor water quality for smart fisheries. The majoradvantage of the proposed system is using low-cost, low-power sensors compared to theexisting systems. The implementation cost of the proposed system is USD 250, whichincludes purchasing electronic components in small numbers. However, the overall costcan be reduced significantly when the product is developed in large numbers. All theexisting systems use commercially available sensors, and those are very expensive. Dueto using the sensors fabricated in our lab, the system cost is significantly reduced. Theproposed systems fulfil the motives of agriculture 4.0, which no longer only relies on apply-ing pesticides and food into fishers but also running the farms with advanced technology,including sensors, machines, devices, and communication systems. The existence of thesesystems in any fisheries will help farmers make informed decisions beforehand usingadvanced technologies to improve productivity and profitability.
Author Contributions: F.A. and S.C.M.; Conceptualisation, F.A. and H.R.S.; writing—original draftpreparation, F.A., H.R.S. and M.E.E.A.; writing—review and editing, S.C.M. and M.E.E.A.; supervi-sion. All authors have read and agreed to the published version of the manuscript.
Funding: This research received no external funding.
Institutional Review Board Statement: Not applicable.
Informed Consent Statement: Not applicable.
Data Availability Statement: Not applicable.
Conflicts of Interest: The authors declare no conflict of interest.
References1. Aura, C.M.; Musa, S.; Yongo, E.; Okechi, J.K.; Njiru, J.M.; Ogari, Z.; Wanyama, R.; Charo-Karisa, H.; Mbugua, H.; Kidera, S.; et al.
Integration of mapping and socio-economic status of cage culture: Towards balancing lake-use and culture fisheries in LakeVictoria, Kenya. Aquac. Res. 2017, 49, 532–545. [CrossRef]
2. Curtis, J.; Stanley, B. Water quality and recreational angling demand in Ireland. J. Outdoor Recreat. Tour. 2016, 14, 27–34. [CrossRef]3. Giacomazzo, M.; Bertolo, A.; Brodeur, P.; Massicotte, P.; Goyette, J.O.; Magnan, P. Linking fisheries to land use: How an-
thropogenic inputs from the watershed shape fish habitat quality. Sci. Total Environ. 2020, 717, 1–11. [CrossRef]4. MacNeil, M.A.; Mellin, C.; Matthews, S.; Wolff, N.H.; McClanahan, T.R.; Devlin, M.; Drovandi, C.; Mengersen, K.; Graham, N.A.J.
Water quality mediates resilience on the Great Barrier Reef. Nat. Ecol. Evol. 2019, 3, 620–627. [CrossRef]5. Achim, W.; Robert, F.; Robert, H.; Nina, B. Smart farming is key to developing sustainable agriculture. Proc. Natl. Acad. Sci. USA
2017, 114, 6148–6150.6. Jungsu, P.; Keug, T.K.; Woo, H.L. Recent advances in information and communications technology (ICT) and sensor tech-nology
for monitoring water quality. Water 2020, 510, 1–24.7. Dieisson, P.; Paulo, D.W.; Edson, T.; Caroline, P.S.F.; Vitor, F.D.C.; Giana, V.M. Scientific development of smart farming technologies
and their application in Brazil. Inf. Process. Agric. 2018, 5, 21–32.8. Munroe, D.; Narváez, D.; Hennen, D.; Jacobson, L.; Mann, R.; Hofmann, E.; Powell, E.; Klinck, J. Fishing and bottom water
temperature as drivers of change in maximum shell length in Atlantic surfclams (Spisula solidissima). Estuar. Coast. Shelf Sci. 2016,170, 112–122. [CrossRef]
9. Dadras, H.; Dzyuba, B.; Cosson, J.; Golpour, A.; Siddique, M.A.M.; Linhart, O. Effect of water temperature on the physiology offish spermatozoon function: A brief review. Aquac. Res. 2017, 48, 729–740. [CrossRef]
10. Jackson, F.; Hannah, D.M.; Fryer, R.; Millar, C.; Malcolm, I. Development of spatial regression models for predicting summerriver temperatures from landscape characteristics: Implications for land and fisheries management. Hydrol. Process. 2017, 31,1225–1238. [CrossRef]
11. Graf, R.; Zhu, S.; Sivakumar, B. Forecasting river water temperature time series using a wavelet–neural network hybrid modellingapproach. J. Hydrol. 2019, 578, 124115. [CrossRef]
12. Bowerman, T.; Roumasset, A.; Keefer, M.L.; Sharpe, C.S.; Caudill, C.C. Prespawn mortality of female Chinook salmon in-creaseswith water temperature and percent hatchery origin. Trans. Am. Fish. Soc. 2018, 147, 31–42. [CrossRef]

Computers 2021, 10, 26 16 of 20
13. Teffer, A.K.; Bass, A.L.; Miller, K.M.; Patterson, D.A.; Juanes, F.; Hinch, S.G. Infections, fisheries capture, temperature, and hostresponses: Multistressor influences on survival and behaviour of adult Chinook salmon. Can. J. Fish. Aquat. Sci. 2018, 75,2069–2083. [CrossRef]
14. Kedra, M.; Wiejaczka, Ł. Climatic and dam-induced impacts on river water temperature: Assessment and management im-plications. Sci. Total Environ. 2018, 626, 1474–1483. [CrossRef] [PubMed]
15. Cheung, W.W. The future of fishes and fisheries in the changing oceans. J. Fish Biol. 2018, 92, 790–803. [CrossRef] [PubMed]16. Shahjahan-Uddin, H.; Bain, V.; Haque, M. Increased water temperature altered hemato-biochemical parameters and structure of
peripheral erythrocytes in striped catfish Pangasianodon hypophthalmus. Fish. Physiol. Biochem. 2018, 44, 1309–1318. [CrossRef][PubMed]
17. The Thermal Optimum by David A. Ross. Available online: https://midcurrent.com/science/the-thermal-optimum/ (accessedon 28 January 2021).
18. Zhaozhao, T.; Wenyan, W.; Jinliang, G. A wireless passive SAW delay line temperature and pressure sensor for monitoring waterdistribution system. In Proceedings of the IEEE Sensors Conference, New Delhi, India, 28–31 October 2018.
19. Martin, A.; Peter, H.; Shima, T.; Simon, C.; Michael, J.W.; Heriberto, B.; Jose, G.; Louisa, V. Fibre optic temperature and humiditysensors for harsh wastewater environments. In Proceedings of the 19th International Conference on Sensing Technology (ICST),Sydney, Australia, 4–6 December 2017.
20. Pushkar, S.; Sanghamitra, S. Arduino-based smart irrigation using water flow Sensor, soil moisture sensor, temperature sensorand esp8266 wifi module. In Proceedings of the IEEE Region 10 Humanitarian Technology Conference (R10-HTC), Agra, India,21–23 December 2016.
21. Muhammad, D.K.; Endro, A.; Sidik, P. Design and implementation of smart bath water heater using Arduino. In Proceedings ofthe 6th International Conference on Information and Communication Technology (ICoICT), Bandung, Indonesia, 3–5 May 2018.
22. Waterproof DS18B20 Digital Temperature Sensor. Available online: https://core-electronics.com.au/waterproof-ds18b20-digital-temperature-sensor.html (accessed on 28 January 2021).
23. Dong, Y.; Son, D.-H.; Dai, Q.; Lee, J.-H.; Won, C.-H.; Kim, J.-G.; Kang, S.-H.; Lee, J.-H.; Chen, D.; Lu, H.; et al. AlGaN/GaNheterostructure pH sensor with multi-sensing segments. Sens. Actuators B Chem. 2018, 260, 134–139. [CrossRef]
24. Solovyev, M.M.; Izvekova, G.I.; Kashinskaya, E.N.; Gisbert, E. Dependence of pH values in the digestive tract of freshwater fisheson some abiotic and biotic factors. Hydrobiology 2017, 807, 67–85. [CrossRef]
25. Alavi, S.M.H.; Cosson, J.; Bondarenko, O.; Linhart, O. Sperm motility in fishes: (III) diversity of regulatory signals from membraneto the axoneme. Theriogenology 2019, 136, 143–165. [CrossRef]
26. Stevens, C.H.; Croft, D.P.; Paull, G.C.; Tyler, C.R. Stress and welfare in ornamental fishes: What can be learned from aqua-culture?J. Fish Biol. 2017, 91, 409–428. [CrossRef]
27. Ahmed, I.; Reshi, Q.M.; Fazio, F. The influence of the endogenous and exogenous factors on hematological parameters in differentfish species: A review. Aquac. Int. 2020, 28, 869–899. [CrossRef]
28. Shartau, R.B.; Baker, D.W.; Brauner, C.J. White sturgeon (Acipenser transmontanus) acid–base regulation differs in response todifferent types of acidoses. J. Comp. Physiol. B 2017, 187, 985–994. [CrossRef] [PubMed]
29. Borvinskaya, E.; Gurkov, A.; Shchapova, E.; Baduev, B.; Shatilina, Z.; Sadovoy, A.; Meglinski, I.; Timofeyev, M. Parallel in vivomonitoring of pH in gill capillaries and muscles of fishes using microencapsulated biomarkers. Biol. Open 2017, 6, 673–677.[CrossRef] [PubMed]
30. Stephenson, R.L.; Wiber, M.; Paul, S.; Angel, E.; Benson, A.; Charles, A.; Chouinard, O.; Edwards, D.; Foley, P.; Lane, D.; et al.Integrating diverse objectives for sustainable fisheries in Canada. Can. J. Fish. Aquat. Sci. 2019, 76, 480–496. [CrossRef]
31. Shogo, H.; Hironao, O.; Seiichi, T.; Toshihiro, I. Valve-actuator-integrated reference electrode for an ultra-long-life rumen pHsensor. Sensors 2020, 20, 1249.
32. Wen-Chi, L.; Klaus, B.; Charles, W.M.; Mark, A.B. Multifunctional water sensors for pH, ORP, and conductivity using onlymicrofabricated platinum electrodes. Sensors 2017, 17, 1655.
33. Tanomsak, W.; Sarawoot, B.; Songgrod, P. Wireless sensor network for monitoring of water quality for pond Tilapia. In Proceedingsof the 12th International Conference on UbiMedia Computing (UbiMedia), Bali, Indonesia, 5–8 August 2019.
34. Noor, A.A.; Lee, Y.H.; Faridah, S.; Mohd, H.M.Z.; Sharina, A.H. A colorimetric pH sensor based on clitoria sp. and brassica sp. formonitoring of food spoilage using chromametry. Sensors 2019, 19, 4813.
35. Nedal, A.T.; Yunusa, U.; Elaref, R.; Ayman, A.; Faraj, A.A. A flexible optical pH sensor based on polysulfone membranes coatedwith pH-responsive polyaniline nanofiber. Sensors 2016, 16, 986.
36. Wade, L.; Magdalena, W.; Kamal, A. RuO2 pH sensor with super-glue-inspired reference electrode. Sensors 2017, 17, 2036.37. Gerwing, T.G.; Plate, E. Effectiveness of nutrient enhancement as a remediation or compensation strategy of salmonid fisheries in
culturally oligotrophic lakes and streams in temperate climates. Restor. Ecol. 2018, 27, 279–288. [CrossRef]38. Liu, Y.; Lv, J.; Feng, J.; Liu, Q.; Nan, F.; Xie, S. Treatment of real aquaculture wastewater from a fishery utilizing phytoreme-diation
with microalgae. J. Chem. Technol. Biotechnol. 2019, 94, 900–910. [CrossRef]39. Wongkiew, S.; Hu, Z.; Chandran, K.; Lee, J.W.; Khanal, S.K. Nitrogen transformations in aquaponic systems: A review. Aquac.
Eng. 2017, 76, 9–19. [CrossRef]40. Md, E.E.A.; Anindya, N.; Subhas, C.M.; Lucy, B. A temperature-compensated graphene sensor for nitrate monitoring in real-time
application. Sens. Actuators A Phys. 2018, 269, 79–90.
Computers 2021, 10, 26 17 of 20
41. Md, E.E.A.; Subhas, C.M.; Lucy, B. Imprinted polymer coated impedimetric nitrate sensor for real-time water quality moni-toring.Sens. Actuators B Chem. 2018, 259, 753–761.
42. Md, E.E.A.; Li, X.; Subhas, C.M.; Lucy, B. Temperature compensated smart nitrate-sensor for agricultural industry. IEEE Trans.Ind. Electron. 2017, 64, 7333–7341.
43. Md, E.E.A.; Li, X.; Asif, I.Z.; Subhas, C.M.; Lucy, B. Practical nitrate sensor based on electrochemical impedance measurement. InProceedings of the International Instrumentation and Measurement Technology Conference, Taipei, Taiwan, 23–26 May 2016.
44. Md, E.E.A.; Subhas, C.M. Detection methodologies for pathogen and toxins: A review. Sensors 2017, 17, 1885.45. Li, S.-J.; Zhao, G.-Y.; Zhang, R.-X.; Hou, Y.-L.; Liu, L.; Pang, H. A sensitive and selective nitrite sensor based on a glassy carbon
electrode modified with gold nanoparticles and sulfonated graphene. Microchim. Acta 2013, 180, 821–827. [CrossRef]46. Wanga, P.; Wanga, M.; Zhoua, F.; Yanga, G.; Qua, L.; Miaoa, X. Development of a paper-based, inexpensive, and disposable
electrochemical sensing platform for nitrite detection. Electrochem. Comm. 2017, 81, 74–78. [CrossRef]47. Hameed, R.A.; Medany, S.S. Construction of core-shell structured nickel@platinum nanoparticles on graphene sheets for
electrochemical determination of nitrite in drinking water samples. Microchem. J. 2019, 145, 354–366. [CrossRef]48. Chen, X.; Pu, H.; Fu, Z.; Sui, X.; Chang, J.; Chen, J.; Mao, S. Real-time and selective detection of nitrates in water using
gra-phene-based field-effect transistor sensors. Environ. Sci. Nano 2018, 5, 1990–1999. [CrossRef]49. Amanulla, B.; Palanisamy, S.; Chen, S.M.; Chiu, T.W.; Velusamy, V.; Hall, J.M.; Chen, T.W.; Ramaraj, S.K. Selective col-orimetric
detection of nitrite in water using chitosan stabilised gold nanoparticles decorated reduced graphene oxide. Nat. Sci. Reports2017, 7, 1–9.
50. Hameed, R.A.; Medany, S.S. Sensitive nitrite detection at core-shell structured Cu@Pt nanoparticles supported on graphene. Appl.Surf. Sci. 2018, 458, 252–263. [CrossRef]
51. Choosang, J.; Numnuam, A.; Thavarungkul, P.; Kanatharana, P.; Radu, T.; Ullah, S.; Radu, A. Simultaneous Detection ofAmmonium and Nitrate in Environmental Samples Using on Ion-Selective Electrode and Comparison with Portable ColorimetricAssays. Sensors 2018, 18, 3555. [CrossRef] [PubMed]
52. Chen, M.; Zhang, M.; Wang, X.; Yang, Q.; Wang, M.; Liu, G.; Yao, L. An All-Solid-State Nitrate Ion-Selective Electrode withNanohybrids Composite Films for In-Situ Soil Nutrient Monitoring. Sensors 2020, 20, 2270. [CrossRef] [PubMed]
53. Khanfar, M.F.; Al-Faqheri, W.; Al-Halhouli, A. Low Cost Lab on Chip for the Colorimetric Detection of Nitrate in Mineral WaterProducts. Sensors 2017, 17, 2345. [CrossRef]
54. Prabhu, A.J.; Schrama, J.W.; Kaushik, S.J. Quantifying dietary phosphorus requirement of fish—a meta-analytic approach. Aquac.Nutr. 2013, 19, 233–249. [CrossRef]
55. Hongwei, C.; Linlu, Z.; Fabiao, Y.; Qiaoling, D. Detection of phosphorus species in water: Technology and strategies. Analyst2019, 144, 7130–7148.
56. Environmental Impact of Nitrogen and Phosphorus Fertilisers in High Rainfall Areas. Available online: https://www.agric.wa.gov.au/high--rainfall-pastures/environmental--impact--nitrogen--and-phosphorus-fertilisers-high-rainfall-areas (accessed on28 January 2021).
57. Unni, S.; Lena, R.; Sanu, K.A.; Kamila, M.; Krishnapillai, G.K.; Hanna, R.; Stefan, K.; Jerzy, R. Ultrasensitive electrochemicalsensing of phosphate in water mediated by a dipicolylamine-zinc(II) complex. Sens. Actuators B Chem. 2020, 321, 1–8.
58. Mehenur, S.; Jared, L.; Ghinwa, M.N.; Chen-Zhong, L. Smart-phone, paper-based fluorescent sensor for ultra-low inorganicphosphate detection in environmental samples. Microsyst. Nanoeng. 2019, 5, 1–10.
59. Sumaiya, I.; Nasim, R.; Jeong, J.; Lee, K. Sensing Technology for Rapid Detection of Phosphorus in Water: A Review. J. Biosyst.Eng. 2016, 41, 138–144.
60. Kiesar, S.B.; Umesh, T.N.; Jin-Young, Y.; Yousheng, W.; Tahmineh, M.; Yoon-Bong, H. Nozzle-jet-printed silver/graphenecomposite-based field-effect transistor sensor for phosphate ion detection. ACS Omega 2019, 4, 8373–8380.
61. Zhou, G.; Jin, B.; Wang, Y.; Dong, Q.; Maity, A.; Chang, J.; Ren, R.; Pu, H.; Sui, X.; Mao, S.; et al. Ultrasensitive sensors basedon aluminum oxide protected reduced graphene oxide for phosphate ion detection in real water. Mol. Syst. Des. Eng. 2020, 5,936–942.
62. Mao, S.; Pu, H.; Chang, J.; Sui, X.; Zhou, G.; Ren, R.; Chen, Y.; Chen, J. Ultrasensitive detection of ortho-phosphate ions withreduced graphene oxide/ferritin field-effect transistor sensors. Environ. Sci. Nano 2017, 4, 856–863.
63. Zhu, L.; Zhou, X.; Shi, H. A potentiometric cobalt-based phosphate sensor based on screen-printing technology. Front. Environ.Sci. Eng. 2014, 8, 945–951.
64. Pankaj, K.; Dong, M.K.; Myong, H.H.; Yoon-Bo, S. An all-solid-state monohydrogen phosphate sensor based on a macrocyclicionophore. Talanta 2010, 82, 1107–1112.
65. John, J.W.; Paul, L.B. Fabrication, calibration and evaluation of a phosphate ion-selective microelectrode. Environ. Pollut. 2010,158, 3612–3617.
66. Stefano, C.; Daria, T.; Giuseppe, P.; Danila, M.; Fabiana, A. Novel reagentless paper-based screen-printed electrochemical sensorto detect phosphate. Anal. Chim. Acta 2016, 919, 78–84.
67. Manová, A.; Beinrohr, E. Determination of phosphate in water by flow coulometry. Acta Chim. Slovaca 2020, 13, 102–107.[CrossRef]
68. Luo, S.; Wu, B.; Xiong, X.; Wang, J. Effects of Total Hardness and Calcium:Magnesium Ratio of Water during Early Stages of RareMinnows (Gobiocypris rarus). Comp. Med. 2016, 66, 181–187.

Computers 2021, 10, 26 18 of 20
69. Calcium and Magnesium Use in Aquaculture. Available online: https://www.aquaculturealliance.org/advocate/calcium-and-magnesium-use-in-aquaculture/ (accessed on 22 February 2021).
70. Butler, D.H.; Koivisto, S.; Brumfeld, V.; Shahack-Gross, R. Early Evidence for Northern Salmonid Fisheries Discovered usingNovel Mineral Proxies. Sci. Rep. 2019, 9, 1–12. [CrossRef]
71. Arias, D.; Rivas, M.; Guinez, R.; Cisternas, L.A. Modeling the calcium and magnesium removal from seawater by immobilisedbiomass of ureolytic bacteria Bacillus subtilis through response surface methodology and artificial neural networks. Desalinat.Water Treat. 2018, 118, 294–303. [CrossRef]
72. Joquiño, C.M.; Sarmiento, J.M.; Estaña, L.M.; Nañola, J.; Pedro, A.A. Seasonal Change, Fishing Revenues, and Nutrient In-takesof Fishers’ Children in Davao Gulf, Philippines. Philipp. J. Sci. 2021, 150, 307–323.
73. Zhang, H.; Meng, Y.; Wang, Y.; Hu, X.; Wang, Y.; Huang, Y.; Zhou, Q.; Li, A.; Wang, L.; Xing, X. Correlation analysis betweenpH, major organic acids, calcium and magnesium ions of stratified bottom-pit-mud from Chinese strong-flavor Baijiu pit. ShipinKexue/Food Sci. 2020, 41, 90–97.
74. Hicks, C.C.; Cohen, P.J.; Graham, N.A.J.; Nash, K.L.; Allison, E.H.; D’Lima, C.; Mills, D.J.; Roscher, M.; Thilsted, S.H.; Thorne-Lyman, A.L.; et al. Harnessing global fisheries to tackle micronutrient deficiencies. Nat. Cell Biol. 2019, 574, 95–98. [CrossRef][PubMed]
75. Mozharovskaya, P.N.; Lykova, Y.A.; Semenishchev, V.S. Systematisation of chemical pollutants in samples of river water inYekaterinburg city and Sverdlovsk Region. In Proceedings of the AIP Conference, Ekaterinburg, Russia, 20–23 May 2019.
76. Moshoeshoe, M.N.; Obuseng, V. Simultaneous determination of nitrate, nitrite and phosphate in environmental samples by highperformance liquid chromatography with UV detection. S. Afr. J. Chem. 2018, 71, 79–85. [CrossRef]
77. Drolc, A.; Vrtovšek, J. Nitrate and nitrite nitrogen determination in wastewater using on-line UV spectrometric method. Bioresour.Tech. 2010, 101, 4228–4233. [CrossRef]
78. Alahi, M.E.E.; Mukhopadhyay, S.C. Detection methods of nitrate in water: A review. Sens. Actuators A Phys. 2018, 280, 210–221.[CrossRef]
79. Azmi, A.; Azman, A.A.; Kaman, K.K.; Ibrahim, S.; Mukhopadhyay, S.C.; Nawawi, S.W.; Yunus, M.A.M. Performance of CoatingMaterials on Planar Electromagnetic Sensing Array to Detect Water Contamination. IEEE Sens. J. 2017, 17, 5244–5251. [CrossRef]
80. Coppola, L.; Legendre, L.; Lefevre, D.; Prieur, L.; Taillandier, V.; Riquier, E.D. Seasonal and inter-annual variations of dissolvedoxygen in the northwestern Mediterranean Sea (DYFAMED site). Prog. Oceanogr. 2018, 162, 187–201. [CrossRef]
81. Boyd, C.E.; Torrans, E.L.; Tucker, C.S. Dissolved Oxygen and Aeration in Ictalurid Catfish Aquaculture. J. World Aquac. Soc. 2018,49, 7–70. [CrossRef]
82. Kralj, M.; Lipizer, M.; Cermelj, B.; Celio, M.; Fabbro, C.; Brunetti, F.; Francé, J.; Mozetic, P.; Giani, M. Hypoxia and dissolvedoxygen trends in the northeastern Adriatic Sea (Gulf of Trieste). Deep. Sea Res. Part II Top. Stud. Oceanogr. 2019, 164, 74–88.[CrossRef]
83. Ren, Q.; Zhang, L.; Wei, Y.; Li, D. A method for predicting dissolved oxygen in aquaculture water in an aquaponics system.Comput. Electron. Agric. 2018, 151, 384–391. [CrossRef]
84. Ta, X.; Wei, Y. Research on a dissolved oxygen prediction method for recirculating aquaculture systems based on a convolutionneural network. Comput. Electron. Agric. 2018, 145, 302–310. [CrossRef]
85. Parra, L.; Lloret, G.; Lloret, J.; Rodilla, M. Physical Sensors for Precision Aquaculture: A Review. IEEE Sens. J. 2018, 18, 3915–3923.[CrossRef]
86. Defe, G.A.; Antonio, A.Z.C. Multi-parameter Water Quality Monitoring Device for Grouper Aquaculture. In Proceedings of the2018 IEEE 10th International Conference on Humanoid, Nanotechnology, Information Technology, Communication and Control,Environment and Management (HNICEM), Baguio, Philippines, 29 November–2 December 2018; IEEE: Piscataway, NJ, USA,2018; pp. 1–5.
87. Kramer, D.L. Dissolved oxygen and fish behavior. Environ. Boil. Fishes 1987, 18, 81–92. [CrossRef]88. Franklin, P. Dissolved oxygen criteria for freshwater fish in New Zealand: A revised approach. New Zealand J. Mar. Freshw. Res.
2013, 48, 112–126. [CrossRef]89. Honglin, Z.; Zhiguo, Z. Ratiometric sensor based on PtOEP-C6/Poly (St-TFEMA) film for automatic dissolved oxygen content
detection. Sensors 2020, 20, 6175.90. Lola, G.O.; Alba, R.O.; Petra, J.C.; Mirella, D.L. Ceramic soil microbial fuel cells sensors for early detection of eutrophication.
Proceedings 2020, 60, 1–12.91. Selvaraj, C.; Sumit, K.; Gert-Jan, W.E. Fabrication of a nitrogen and Boron-doped reduced graphene oxide membrane-less
amperometric sensor for measurement of dissolved oxygen in a microbial fermentation. Chemosensors 2020, 44, 1–10.92. Zike, J.; Xinsheng, Y.; Shikui, Z.; Yingyan, H. Ratiometric dissolved oxygen sensors based on ruthenium complex doped with
silver nanoparticles. Sensors 2017, 17, 548.93. Manuel, V.; Ryan, K.W.; Barbara, A.B.; Jose, E.C. Machine learning based predictions of dissolved oxygen in a small coastal
embayment. J. Mar. Sci. Eng. 2020, 1007, 1–16.94. Rune, I.; Emil, M.; Jonas, H.; Ole, B.; Jakob, J. Optimisation of all-polymer optical fiber oxygen sensors with antenna dyes and
improved solvent selection using hansen solubility parameters. Sensors 2021, 21, 5.
Computers 2021, 10, 26 19 of 20
95. Salvatore, G.L.; Maryam, B.; Kaushik, G.; Ashish, K.D.; Luca, L.; Nicola, D.; Giovanni, N. Development of a Novel Cu(II)Complex Modified Electrode and a Portable Electrochemical Analyzer for the Determination of Dissolved Oxygen (DO) in Water.Chemosensors 2016, 7, 1–10.
96. Fowzia, A.; Sam, K.; Hasin, R.S.; Md, E.E.A.; Subhas, C.M. IoT enabled intelligent sensor node for smart city: Pedestrian countingand ambient monitoring. Sensors 2019, 19, 3374.
97. Fowzia, A.; Sam, K.; Jordan, L.; Hasin, R.S.; Md, E.E.A.; Subhas, C.M. Design and development of an IoT enabled pedestriancounting and environmental monitoring system for a smart city. In Proceedings of the 13th International Conference on SensingTechnology (ICST), Sydney, Australia, 2–4 December 2019.
98. Lina, R.; Anitha, M. Sensor data classification using machine learning algorithm. J. Stat. Manag. Syst. 2020, 23, 363–371.99. Demi, A.; Nico, S. Hydroponic nutrient control system based on internet of things. In Proceedings of the International Conference
on Computer, Control, Informatics and Its Applications (IC3INA), Tangerang, Indonesia, 23–24 October 2019.100. Jaime, V.; Francesc, P.; Diego, A.T.; Maribel, A. A sensor data fusion system based on k-nearest neighbor pattern classification for
structural health monitoring applications. Sensors 2017, 17, 417.101. Hristos, T.; Georgia, P.; Andreas, L. A brief review of random forests for water scientists and practitioners and their recent history
in water resources. Water 2019, 11, 1–37.102. Devi, S.V.S.G. Random forest advice for water quality prediction in the regions of Kadapa district. Int. J. Innov. Technol. Explor.
Eng. 2019, 8, 1–3.103. Shajulin, B.; Nila, G.; Deepak, G.; Sreelakshmi, N. Real time water quality analysis framework using monitoring and prediction
mechanisms. In Proceedings of the Conference on Information and Communication Technology (CICT), Jabalpur, India,26–28 October 2018.
104. Kangyang, C.; Hexia, C.; Chuanlong, Z.; Yichao, H.; Xiangyang, Q.; Ruqin, S.; Fengrui, L.; Min, Z.; Xinyi, Z.; Jinfeng, W.; et al.Comparative analysis of surface water quality prediction performance and identification of key water parameters using differentmachine learning models based on big data. Water Res. 2020, 171, 1–10.
105. Consolata, G.; Jeniffer, J. A classification model for water quality analysis using decision tree. Eur. J. Comput. Sci. Inf. Technol.2019, 7, 1–8.
106. Hao, L.; Wen, S. Forecasting and evaluating water quality of Chao lake based on an improved decision tree method. ProcediaEnviron. Sci. 2010, 2, 970–979.
107. Saghebian, S.M.; Sattari, M.T.; Rasoul, M.; Mahesh, P. Ground water quality classification by decision tree method in Ardebilregion, Iran. Arab. J. Geosci. 2014, 7, 4767–4777. [CrossRef]
108. Saptami, R.; Protik, C.B.; Md, A.H.; Md, R.I.; John, C. Polynomial regression of multiple sensing variables for high-performancesmartphone colorimeter. OSA Contin. 2021, 4, 374–384.
109. Huang, H.; Wang, Z.; Xia, F.; Shang, X.; Liu, Y.; Zhang, M.; Dahlgren, R.A.; Mei, K. Water quality trend and change-point analysesusing integration of locally weighted polynomial regression and segmented regression. Environ. Sci. Pollut. Res. 2017, 24,15827–15837. [CrossRef] [PubMed]
110. Mohammad, R.B.; Roohollah, N.; Ronny, B.; Alireza, G.; Behzad, G. Evolutionary polynomial regression approach to predictlongitudinal dispersion coefficient in rivers. J. Water Supply Res. Technol. AQUA 2018, 67, 1–11.
111. Wei-Chih, H.; Pao-Yuan, C.; Chia-Sui, W.; Jen-Chieh, H.; Wesley, H. Application of regression analysis to achieve a smartmonitoring system for aquaculture. Information 2020, 387, 1–9.
112. Krishnan, K.S.D.; Bhuvaneswari, P.T.V. Multiple linear regression based water quality parameter modeling to detect hexa-valentchromium in drinking water. In Proceedings of the International Conference on Wireless Communications, Signal Processing andNetworking (WiSPNET), Chennai, India, 22–24 March 2017.
113. Reham, E.K. Using regression analysis to estimate water quality constituents in Bahr El Baqar drain. J. Appl. Sci. Res. 2009, 5,1067–1076.
114. Wei-Bo, C.; Wen-Cheng, L. Water quality modeling in reservoirs using multivariate linear regression and two neural networkmodels. Adv. Artif. Neural Syst. 2015, 521721, 1–12.
115. Abbaa, S.I.; Hadia, S.J.; Abdullah, J. River water modelling prediction using multi-linear regression, artificial neural network, andadaptive neuro-fuzzy inference system techniques. In Proceedings of the 9th International Conference on Theory and Applicationof Soft Computing, Computing with Words and Perception (ICSCCW), Budapest, Hungary, 24–25 August 2017.
116. Tao, X.F.; Huang, T.; Li, X.F.; Peng, D.P. Application of a PCA based water quality classification method in water qualityassessment in the Tongjiyan Irrigation Area, China. In Proceedings of the International Conference on Energy and EnvironmentalProtection (ICEEP), Shenzhen, China, 17–18 September 2016.
117. Salim, A.B.; Gowhar, M.; Sayar, Y.; Ashok, K.P. Statistical assessment of water quality parameters for pollution source identificationin sukhnag stream: An inflow stream of lake Wular (Ramsar Site), Kashmir Himalaya. J. Ecosyst. 2014, 898054, 1–18.
118. Mahapatra, S.S.; Sahu, M.; Patel, R.K.; Panda, B.N. Prediction of Water Quality Using Principal Component Analysis. Water Qual.Expo. Health 2012, 4, 93–104. [CrossRef]
119. Carlos, A.B.G.; Helenice, L.G.; Maria, C.S.; Anamália, F.S.; José, P.H.A.; Silvânio, S.L.C.; Geovanny, O.A.; Igor, S.S. Assessment ofwater quality using principal component analysis: A case study of the açude da Macela—Sergipe—Brazil. In Proceedings of the16th International World Water Congress (IWRC), Cancum, Mexico, 29 May–3 June 2017.
120. Emerson, N.; Nuno, C.; António, P. A Systematic Review of IoT Solutions for Smart Farming. Sensors 2020, 20, 2345.

Computers 2021, 10, 26 20 of 20
121. Md, E.E.A.; Najid, P.I.; Subhas, C.M.; Lucy, B. An internet-of-things enabled smart sensing system for nitrate monitoring. IEEEInternet Things J. 2018, 5, 4409–4417.
122. SEAFLO 21 Series Diaphragm Pump 12V. Available online: https://12voltpumps.com.au/product/12v-21-series-diaphragm-pump-sfdp1-010-035-21-seaflo/ (accessed on 28 January 2021).
123. Stepper Motor Controller Module for Arduino Projects. Available online: https://www.auselectronicsdirect.com.au/stepper-motor-controller-module-for-arduino-projec?gclid=Cj0KCQiA3smABhCjARIsAKtrg6LbnXTiUl9Rt4UCoPRYiUTLWGviqctaB_ilo-f3IJpFNeQ6Pp2DgwEaAtsDEALw_wcB (accessed on 28 January 2021).
124. AD5933. Analogue Devices, 1 MSPS, 12-Bit Impedance Converter, Network Analyzer. Available online: https://www.analog.com/media/en/technical-documentation/data-sheets/AD5933.pdf (accessed on 28 January 2021).
125. Arduino Uno Rev3. Available online: https://core-electronics.com.au/arduino-uno-r3.html (accessed on 28 January 2021).126. Lora Shield for Arduino—Long Range Transceiver. Available online: https://www.iot-store.com.au/products/lora-shield-for-
arduino-long-range-transceiver (accessed on 28 January 2021).127. 12V 10W Solar Panel with Clips. Available online: https://www.jaycar.com.au/12v-10w-solar-panel-with-clips/p/ZM9051?
gclid=Cj0KCQiA3smABhCjARIsAKtrg6JvnJioP4MJkkjeCcEs6E0V7_mhCHOc0f7f-R7TsYnqDVc_OIZX3yIaAsc2EALw_wcB (ac-cessed on 28 January 2021).
128. 12V 12Ah SLA Battery. Available online: https://www.jaycar.com.au/12v-12ah-sla-battery/p/SB2489 (accessed on 28 January2021).
129. 12/24V 10A Dual Battery PWM Solar Charge Controller with LED Indicator. Available online: https://www.jaycar.com.au/12-24v-10a-dual-battery-pwm-solar-charge-controller-with-led-indicator/p/MP3760 (accessed on 28 January 2021).
130. Fowzia, A.; Anindya, N.; Md, E.E.A.; Hangrui, L.; Subhas, C.M. Electrochemical detection of calcium and magnesium in waterbodies. Sens. Actuators A Phys. 2020, 305, 1–10.
131. Anindya, N.; Md, E.E.A.; Shilun, F.; Subhas, C.M. IoT-based sensing system for phosphate detection using Graphite/PDMSsensors. Sens. Actuators A Phys. 2019, 286, 43–50.
132. Anindya, N.; Omer, F.D.; Subhas, M.; Jurgen, K. pH sensing of printed flexible sensors. In Proceedings of the 12th Inter-nationalConference on Sensing Technology (ICST), Limerick, Ireland, 4–6 December 2018.