quality of provided care in vascular surgery
TRANSCRIPT
Chapter 7Treatment for Peripheral
Arterial Obstructive Disease:
An Appraisal of Economic
Outcome of Adverse Events
Flu HC, Hage vd JH, Knippenberg B, Merkus JWS, Hamming JF, Lardenoye JHP
Journal of Vascular Surgery 2008;48:368-76

162 Chapter 7
ABSTRACT
Objectives: To determine the average estimated total costs after treatment for pe-ripheral arterial occlusive disease (PAOD); to evaluate the effect of postoperative AEs (adverse events) and their consequences for the total costs.Materials and methods: A prospective analysis was made using the patient related risk factor and comorbidity (classified according to the SVS/ISCVS standards), primary and secondary treatment and prospective registered AEs. This cohort of patients was divided into patients without AEs (group A) and patients with AEs (group B) during the admission. Prospective registered AEs were divided into patient management (I), surgical technique (II), patient’s disease (III) and outside surgical department (IV). Their consequences were divided into minor AE, no long-term consequence (1A), additional medication or transfusion (1B), surgical reoperation (2A), prolonged hospital stay (2B), irreversible physical damage (3) and death (4). The main outcome measures were total costs of patients and costs per patient (PP) with or without the presence of AEs, cost of AEs and costs per complication (PC) and the costs of their consequences calculated in Euro (€).Results: A total of 90 patients (mean age 71.4 years, male 59 % and female 41%) were included. In group B a significantly higher ASA (4) and Fontaine (3) classification was seen, with more secondary procedures. The costs were €1,716,852: group A €512,811 (PP €12,820) and group B €1,204,042 (PP €24,081). The costs of the 115 AEs were €568,500 (PC €4,943). Split by the cause of the AE, costs were (I) €95,924 (PC €2,998), (II) €163,137 (PC €8,157), (III) €289,578 (PC €5,171) and (IV) €19,861 (PC €2,837). The increase of costs in group B is mainly caused by additional medication or transfusion (1B) 348,293 (61.3%) a surgical reoperation (2A) €118,054 (20.8%) or prolonged hospital stay (2B) €60,451 (10.6%). Patients that died were responsible for 23% of the total costs.Conclusion: AEs cause an increase of the average estimated total costs in the treatment for peripheral arterial occlusive disease. They are responsible for 33% of these total costs. The most expensive AEs were the error in surgical technique and patient’s disease, resulting in surgical reoperation and/or additional medication or transfusion, the two most expensive consequences.

An Appraisal of Economic Outcome of Adverse Events
Quality of Provided Care in Vascular Surgery Outcome assessment & Improvement strategies
163
INTRODUCTION
In today’s society, cost containment is a goal that extends into the health care sector. Rising health care costs represent a critical issue and they are important in decision mak-ing. Insurance organizations are playing an increasingly important role in the delivery of health care and will not permit patients to be admitted to medical centers that cannot deliver health care at lower costs than competing hospitals. Medical specialists in par-ticular are under significant pressure to decrease expenses and eliminate unnecessary costs by optimizing resource use.
The incidence of peripheral arterial occlusive disease (PAOD) in the western society is increasing due to an overall increase of cardiovascular disease, diabetes mellitus, hy-pertension and obesity 1-6. This increased incidence of PAOD directly results in increased overall health care related costs as well as specific treatment related costs. The treatment related costs of PAOD vary and range from minimal costs in case of conservative therapy to maximal costs in case of repetitive surgical interventions. Especially post interven-tional complications (such as redo bypass surgery) result in prolonged hospital admis-sion and re-operation procedures, ultimately leading to increased health care cost 7-9.
In general, the treatment aim is to assure the patient of a clinically optimal solution with long-term benefits in an acceptable economic frame. In time of restricted health care budgets, a detailed insight in costs related to treatment of specific diseases such as PAOD is essential in order to constrain unlimited health care expenses and to implement measurements to reduce health care costs. Whatever reimbursement system is used, if one wants to investigate cost effectiveness of treatment modalities from a hospital perspective, the actual cost is the preferred value to analyze 10, 11.
Many cost-identification analyses of treatment of PAOD have focused on the interven-tion itself 10, 11. Treatment cost of PAOD can be divided in primary treatment expenses and secondary cost due to post procedural adverse events (AEs). These AE related costs are frequently caused by wound care management, prolonged ICU and hospital admis-sion and re-operations. To our knowledge, a specific detailed analysis of AE related cost of treatment of PAOD has not been described in literature.
The goal of this study was to perform a detailed cost evaluation of patients admitted and treated for PAOD. In this analysis, the actual costs of primary treatment including pre-operative work-up and primary intervention were assessed. Furthermore, second-ary AE related costs were identified. Also, cause and consequence of AE were registered and related expenses assessed.

164 Chapter 7
MATERIALS AND METHODS
Patients
A 6-months survey was performed on ninety consecutive patients admitted and treated for peripheral arterial occlusive disease (PAOD) in the period from January 2007 till July 2007. Criteria for inclusion in the study population were intermittent claudication (IC) or critical lower limb ischaemia (CLI). IC was defined as extremity pain, discomfort, or weakness that is consistently produced by the same amount of walking or equivalent muscular activity in a given patient and that is promptly relieved by cessation of that activity with a pain free walking distance (PFWD) < 100 meters and an AP after exercise < 50 mmHG (Fontaine stage IIb). This corresponds with category 3 of the Society of Vas-cular Surgery / North American Chapter of the International Society for Cardiovascular surgery (SVS/ISCVS) standards 12, 13. CLI was defined as ischaemic rest pain (Fontaine classification 3) with a resting AP < 40 mmHG, and gangrene or nonhealing ischaemic ulceration (Fontaine classification 4) with a resting AP < 60 mmHG. This corresponds with categories 4, 5 and 6 of the SVS/ISCVS. The cohort of patients was divided into patients without AEs (group A) and with AEs (group B) during admission. This adjustment of the two groups allowed a meaningful comparison of costs related to AEs.
Risk factors and comorbidity
Risk factors and comorbidity were registered prospectively of all patients during their admission intake. Smoking, hypertension, cardiac disease, hyperlipidaemia, diabetes mellitus, renal disease, pulmonary disease, carotid disease and age were classified ac-cording to the SVS/ISCVS standards 12, 13. The risk factor and comorbidity management was either conducted by a vascular specialist or cardiologist preoperatively in the out patient clinic or during admission before operation when urgent intervention was indi-cated. The American Society of Anaesthesiologists (ASA) classification 14 of patients was determined according to their general preoperative condition prospectively. Data of the risk factor and comorbidity are listed in Table 1.
Treatment of PAOD
Treatment was divided in non-surgical, endovascular and surgical (vascular and non-vascular) treatment. The non-surgical treatment in our study indicates all treatment strategies outside the operating room. These strategies include local pain or wound management, antibiotic therapy, superficial necrotectomy performed on the ward and not in the operating room. Endovascular treatment reflected urokinase treatment

An Appraisal of Economic Outcome of Adverse Events
Quality of Provided Care in Vascular Surgery Outcome assessment & Improvement strategies
165
15-18 and percutaneous transluminal angioplasties (PTAs). The technique of thrombolysis used and the doses of urokinase administered were at the discretion of the interven-tional radiologist. The PTAs were carried out by conventional balloon dilatation of the lesion with or without stent placement. The vascular surgical treatment consisted of thrombectomy, endarterectomy or a bypass graft procedure (BGP). It was performed ac-cording to standard vascular techniques, using preferably reversed vein for infrainguinal femoropopliteal, crural or pedal bypass procedures and Dacron or polytetrafluoroeth-ylene (PTFE) for aortofemoral and femorofemoro bypass grafting. All these vascular operations were performed by or under the supervision of a vascular surgeon. The non-vascular surgical treatment consisted of drainage/debridement, a minor amputation,
Table 1. Baseline characteristics classified according to the SVS/ISCVS standards of the total sample (n=90) and stratified by absence (Group A) or presence (Group B) of AEs.
Characteristics Total
n = 90Group A
n = 40Group B
n = 50P-value
Gender
Male
Female
Age
Mean (SD), years
(min;max), years
Fontaine-classification
Classification 2b
Classification 3
Classification 4
ASA-classification
Classification 2
Classification 3
Classification 4
Comorbidity (SVS-ISCVS)
Cardiac disease
Pulmonary disease
Renal disease
Carotid disease
Diabetes mellitus
Hyperlipidaemia
Hypertension
Tobacco use
53 (59)
37 (41)
71.4 (13.3)
(46;93)
12 (13)
25 (28)
53 (59)
41 (46)
43 (48)
6 (7)
53 (59)
21 (23)
11 (12)
14 (16)
31 (34)
21 (23)
48 (53)
29 (32)
24 (60)
16 (40)
67.4 (13.1)
(36;88)
12 (30)
15 (38)
13 (33)
27 (68)
13 (33)
0 (0)
15 (38)
10 (25)
1 (3)
2 (5)
13 (33)
10 (25)
19 (48)
15 (38)
29 (58)
21 (42)
74.6 (12.7)
(39;93)
7 (0)
10 (20)
40 (80)
14 (28)
30 (60)
6 (12)
38 (76)
11 (22)
10 (20)
12 (24)
18 (36)
11 (22)
29 (58)
14 (28)
0.85
0.27
0.01
0.01
0.01
0.74
0.01
0.01
0.73
0.74
0.32
0.34
Data are presented as n and (%), unless otherwise specified. AE=adverse event; Group A=patients without AEs; Group B=patients with AEs; SD=standard deviation. ASA= American society of anaesthesiologists 14; SVS-ISCVS=the Society of Vascular Surgery/North American Chapter, International Society of Cardiovascular Surgery 11,12

166 Chapter 7
defined as toe - or transmetatarsal amputation, and a major amputation, defined as an amputation above - or below the level of the knee.
AEs: causes and consequences
The following general definition of a complication developed by the Association of Surgeons of the Netherlands (ASN) 19, 20 was used: an AE is a condition or event, unfavour-able to the patient’s health or treatment, causing unintentional damage or requiring a change in therapeutic policy or additional treatment, which arose during admission or within 30 days after discharge. A patient with gangrenous toes at the time of admission in which successful limb saving vascular reconstructions was performed followed by toe amputation was not considered as an AE. If a patient developed gangrenous toes dur-ing admission after vascular reconstruction ultimately leading to amputation this was considered an AE. All interventions performed after admission which were not foreseen at the time of admission were considered AEs and calculated as such. In this AE registra-tion system, the most severe AE was coded. For instance, if a patient had a myocardial infarction and recovered then of course this was coded as a myocardial infarction but when a patient died from a myocardial infarction this was coded as death. So the most invasive or most severe consequence of each AE was coded. This way of classification enabled us to evaluate the most severe AEs in our practice.
In brief, an AE is identified by one of the physicians in our surgical team who docu-ments the AE in an electronic medical file real time. This file is operational throughout the hospital and the outpatient clinic, which makes recording easy. In-hospital docu-mented AEs are automatically presented at the daily surgical conference in the morning and the afternoon. All causes of the AEs and their consequences were coded according to our AE registration system 21, 22 on a weekly basis as listed in the protocol outlined in Appendix 1. All senior surgeons, residents and interns joined this weekly meeting.
Appraisal of costs
To determine the economic effect of health care services on the budget, estimates of ac-tual economic costs are required to represent the value of the resources used. As listed in Appendix 2, cost data were obtained from several hospital accounting databases. As listed in Table 6 and Appendix 2, total hospital costs were divided in ‘primary treatment’ and costs ‘after primary treatment’.
As listed in Appendix 2, costs of the ‘primary treatment’ included the costs of the pre-operative work-up and standard initial care (non-surgical, endovascular or surgical). For example, patients with gangrenous toes at the time of admission in which successful limb saving vascular reconstructions were performed followed by toe amputation were

An Appraisal of Economic Outcome of Adverse Events
Quality of Provided Care in Vascular Surgery Outcome assessment & Improvement strategies
167
not considered complications (since the patient was admitted with already gangrenous toes) and all costs were primary treatment related costs.
The costs ‘after primary treatment’ included the costs of additional medication or transfusion (antibiotics, neurology, cardiac and blood bank), the total length of stay (defined as the number of days from date of admission to date of discharge), clinical laboratory services (haematology, microbiology and chemistry), imaging (X-ray, ultra-sound, CAT-scan, duplex ultrasound examination and electrocardiography), consulting specialist and secondary surgery. For example, if a patient developed gangrenous toes during admission after vascular reconstruction ultimately leading to amputation this was considered a complication (as defined by our complication registration system) and all costs related to this amputation were costs after primary treatment. Important to mention is that included in the costs of the ‘primary treatment’ and ‘after primary treat-ment’ were the fees of the DUE laboratory staff, haematology/microbiology laboratory staff, angiography staff, consultants (internal medicine, cardiology and neurologist), ra-diologist, anaesthesiologist, operating room staff and the vascular surgeon. All costs in this manuscript were calculated in 2007 Euro (€) and were defined as average estimated total costs.
Registration and statistical analysis
By using Access (Office XP from Microsoft) patient information was entered in a spe-cifically designed computerized analyze programme for vascular patients. Statistical analyses were performed through a computerized software package, using Excel (Office XP from Microsoft) and SPSS 12.01 for Windows. Using the Fisher’s exact test, Student’s T-test or Chi-square test assessed differences between both groups for a given param-eter. The secondary procedures were analysed with the Mann-Whitney U-Test. For all statistical analyses, a P-value <0.05 was considered to be statistically significant.
RESULTS
Patients
Fifty-three men (59%) and 37 women (41%) underwent treatment. Mean age was 71.4 years (range 36 - 93) years. Indication for treatment of PAOD was Fontaine 2b in 12 pa-tients (13%), Fontaine 3 in 25 patients (28%) and Fontaine 4 in 53 patients (59%). Mean duration of admission was 14 days (range 1 - 80). The 30-day postoperative mortality rate was 13%. Patients’ characteristics in terms of gender, age, Fontaine classification ASA-classification and comorbidity are listed in Table 1.

168 Chapter 7
Risk factors and comorbidity
No gender - or age differences were found between both groups as listed in Table 1. A significantly higher Fontaine classification was found in group B. The patients in group B also had a significantly higher ASA-classification: cardiac disease (P<0.01), renal disease (P<0.01) and carotid disease (P<0.01). No differences were found between both groups regarding pulmonary disease (P<0.74), diabetes mellitus (P<0.73), hyperlipidaemia (P<0.74), hypertension (P<0.32) and tobacco use (P<0.34).
Treatment
As listed in Table 2, no differences were found between both groups regarding primary treatment: non-surgical (7%, n=6), endovascular (35%, n=32) and surgical (58%, n=52). As listed in Table 3 and 4, a total of 115 AEs were registered from the time of admis-sion among the entire group of 90 patients during the 30-day postoperative period. Compared with the patients in group A, the patients in group B underwent significantly more secondary treatment (P<0.01) because of postoperative AEs.
Patients without AEs
As listed in Table 1, 40 patients (men n=24, 60% and women n=16, 40%) represented group A. Mean age was 67.4 years (range 36 - 88) years. Indication for treatment of PAOD was Fontaine 2b in 12 patients (30%), Fontaine 3 in 15 patients (38%) and Fontaine 4 in 13 patients (33%). Mean duration of admission was 7.4 days (range 1 - 17). Sixty-eight percent of the patients were classified ASA-2. Primary treatment consisted of non-surgical treatment in 3 patients (8%), endovascular treatment in 15 patients (38%) and surgical treatment in 22 patients (56%).
Patients with AEs
As listed in Table 1, 50 patients (men n=29, 58% and women n=21, 42%) represented group B. Mean age was 74.6 years (range 39 - 93) years. Indication for treatment of PAOD was Fontaine 3 in 10 patients (20%) and Fontaine 4 in 40 patients (80%). Mean duration of admission was 19.5 days (range 5 - 80). Sixty percent of the patients were classified ASA-3. Primary treatment consisted of conservative treatment in 3 patients (6%), endo-vascular treatment in 17 patients (34%) and surgical treatment in 30 patients (60%). A total of 13 secondary procedures; endovascular (n=2), vascular (n=5) and non-vascular treatment (n=6) were the consequences of the occurrence of the 115 postoperative AEs during the 30-day postoperative period (Table 2 and 3).

An Appraisal of Economic Outcome of Adverse Events
Quality of Provided Care in Vascular Surgery Outcome assessment & Improvement strategies
169
As listed in Table 5, 16 patients (17.7%) died during admission, 12 patients (13%) within the 30-day postoperative period. Mean age was 82 years (range 61 - 93) years. Indication for treatment of PAOD was Fontaine 3 in 3 patients (19%) and Fontaine 4 in 13 patients (81%). Mean duration of admission was 19 days (range 5 - 53). Eighty-one and thirteen percent of the patients were classified ASA-3 and ASA-4 respectively. Primary treatment consisted of non-surgical treatment in 6 patients (38%), endovascular treatment in two patients (12%) and surgical treatment in 8 patients (50%).
Table 2. Therapy at admission of the total sample (n=90) and stratified by absence (Group A) or presence (Group B) of AEs.
Treatment Total Group A Group B P-value
PRIMARY TREATMENT
NON-SURGICAL
Wound and pain treatment
ENDOVASCULAR
Urokinase
PTA + stent
SURGICAL
vascular
Thrombectomy
Endarterectomy + patch
Bypass graft
non-vascular
Drainage / debridement
Minor amputation
Major amputation
SECONDARY TREATMENT
ENDOVASCULAR
PTA + stent
SURGICAL
vascular
Thrombectomy
Endarterectomy + patch
Bypass graft
non-vascular
Drainage / debridement
Major amputation
90 (100)
6 (7)
13 (14)
19 (21)
3 (3)
8 (9)
26 (29)
1 (1)
5 (6)
9 (10)
13 (100)
2 (15)
1 (8)
3 (23)
1 (8)
4 (31)
2 (15)
40 (44)
3 (8)
5 (13)
10 (25)
1 (3)
4 (10)
14 (35)
0 (0)
3 (8)
0 (0)
0 (0)
0 (0)
0 (0)
0 (0)
0 (0)
0 (0)
0 (0)
50 (56)
3 (6)
8 (16)
9 (18)
2 (4)
4 (8)
12 (24)
1 (2)
2 (4)
9 (18)
13 (100)
2 (15)
1 (8)
3 (23)
1 (8)
4 (31)
2 (15)
0.82
0.01
Data are presented as n and (%), unless otherwise specified. AE=adverse event; Group A=patients without AEs; Group B=patients with AEs; PTA=percutaneous transluminal angioplasty.

170 Chapter 7
AEs: causes and consequences
As listed in Table 3 and 4, a total of 115 AEs were registered. Shortcomings in patient management (group I) reflected 28% of all AEs. Forty-seven percent resulted in addi-tional medication or transfusion, 25% were minor AEs, with no long-term consequence and 22% resulted in prolonged hospital stay. Shortcomings in surgical technique (group II) reflected 17% of all AEs. Forty-five percent resulted in a surgical reoperation, 30% resulted in additional medication or transfusion, and 20% were minor AEs, with no long-term consequence. Patient’s disease (group III) related AEs reflected 49% of all AEs.
Table 3. AEs (n=115) after treatment for PAOD of the total sample (n=90).
Averse event (cause) Total
n = 115
Shortcomings in patient management
Shortcoming in medication
Blister
Cardiac failure
Renal failure
Other
Shortcomings in surgical technique
Haemorrhage
Abscess
Woundinfection
Wounddehiscence
Woundhaematoma
Infection BGP
Occlusion BGP
Tthrombosis BGP
Patient’s disease
Cardiac failure
Pulmonary failure
Renal failure
Death
Other
Outside surgical department
Haemorrhage
Woundinfection
Occlusion BGP
Cardiac failure
32 (28)
4 (3)
4 (3)
3 (3)
7 (6)
14 (12)
20 (17)
3 (3)
1 (1)
6 (5)
2 (2)
2 (2)
1 (1)
4 (3)
1 (1)
56 (49)
16 (14)
5 (4)
3 (3)
16 (14)
16 (14)
7 (6)
4 (3)
1 (1)
1 (1)
1 (1)
Data are presented as n and (%), unless otherwise specified. AE=adverse event; PAOD=peripheral arterial occlusive disease; BGP=bypass graft procedure.

An Appraisal of Economic Outcome of Adverse Events
Quality of Provided Care in Vascular Surgery Outcome assessment & Improvement strategies
171
Fifty-four percent resulted in additional medication or transfusion and 29% resulted in the most severe consequence; early death. AEs that occurred outside the surgical de-partment (group IV) reflected 6% of all AEs. Forty-three percent resulted in a prolonged hospital stay and 29% in additional medication or transfusion.
In total, additional medication or transfusion was the consequence of 46% of all con-sequences, mainly caused by patient’s disease (group III) related AEs and shortcomings in patient management. Prolonged hospital stay (14%) was mainly caused by shortcom-ings in patient management. A surgical reoperation occurred in 12% of all consequences and was mainly caused by a shortcoming in surgical technique (group II).
As listed in Table 5, in the 16 patients that died, a total of 49 (43%) AEs occurred, includ-ing the AE death itself. Shortcomings in patient management (group I) reflected 18% of these AEs. Shortcomings in surgical technique (group II) reflected 14% and patient’s disease (group III) related AEs reflected 67% of these AEs.
Appraisal of costs
As listed in Table 7 the Fontaine-4 patients were responsible for 70.2% (€1,203,459) of the total costs; they were 2 times more expensive compared to the Fontaine-2b patients. Ac-cording to the ASA-classification, ASA-3 patients were responsible for 48.4% (€830,555) of the total costs, however the ASA-4 patients were 2 times more expensive compared to the ASA-2 patients.
The costs of the treatment for PAOD of the 90 patients were €1,716,852 during the study period (Table 6). The complication group consumed 70.1% of this amount, result-ing in a difference of €691,231 in total costs and in costs per patient of €11,261 between both groups. The primary treatment (€317,278), admission days (€780,111) and second-ary procedures (€53,432) were main drivers of the costs in the AE group. For the group
Table 4. AEs (causes and consequences) after treatment for PAOD of the total sample (n=115).
Consequences
Adverse events Total 1A 1B 2A 2B 3 4
Causes
Shortcomings in patient management
Shortcomings in surgical technique
Patient’s disease
Outside surgical department
Total
32 (28)
20 (17)
56 (49)
7 (6)
115 (100)
8 (25)
4 (20)
1 (2)
1 (14)
14 (12)
15 (47)
6 (30)
30 (54)
2 (29)
53 (46)
1 (3)
9 (45)
2 (4)
1 (14)
13 (12)
7 (22)
1 (5)
5 (9)
3 (43)
16 (14)
1 (3)
0 (0)
2 (4)
0 (0)
3 (3)
0 (0)
0 (0)
16 (29)
0 (0)
16 (14)
Data are presented as n and (%), unless otherwise specified. AE=adverse event; PAOD=peripheral arterial occlusive disease; 1A=minor complication, no long-term consequence; 1B=additional medication or transfusion 2A= surgical reoperation; 2B=prolonged hospital stay; 3=irreversible physical damage; 4=death.

172 Chapter 7
of patients without AEs the two main costs were primary treatment (€251,292) and admission days (€254,400). There was no difference in the costs per patient for primary treatment comparing group A (€6,282) with group B (€6,346). However, a difference of €11,197 was seen in case of the costs per patient after primary surgery between group A (€6,538) and group B (€17,735). The mean admission days in group B (19.5, P<0.07) caused a difference of €9,242 in costs of the length of stay in the hospital.
Table 5. Baseline characteristics of the patients (n=16, 17.7%) that died during the study period, classified according, gender, age, ASA-classification, Fontaine-classification. Also is included the length of stay, primary treatment, AEs (n=49, 43%) and cause of death.
Patient Primary
treatment
Adverse events Cause of
death
1: M; 90 yrs; A3; F4; LOS 11 Wound and pain treatment
None Septicaemia
2: M; 61 yrs; A3; F4; LOS 6 Urokinase None Cardiac failure
3: F; 85 yrs; A3; F4; LOS 15 Urokinase None Unknown
4: F; 80 yrs; A3; F4; LOS 7 Urokinase Cardiogenic shock Cardiac failure
5: F; 89 yrs; A3; F4; LOS 50 Urokinase CHF, MI, faeces culture, other neurology
Respiratory failure
6: M; 72 yrs; A3; F3; LOS 5 Urokinase Woundhaematoma Septicaemia
7: F; 93 yrs; A3; F3; LOS 7 Urokinase Woundhaematoma, other neurology Cardiac failure
8: F; 89 yrs; A3; F3; LOS 19 PTA + stent Urine tract infection, renal failure, electrolytes failure, decrease Hb, fracture
MOF
9: M, 80 yrs; A3 ; F3; LOS 7 Endarterectomy + patch
Thrombosis BGP, pneumonia, CHF Respiratory failure
10: M; 76 yrs; A2; F4; LOS 53 Endarterectomy + patch
Abscess, faeces culture Unknown
11: F; 89 yrs; A3; F4; LOS 12 Bypass graft Occlusion BGP faeces culture Unknown
12: M; 80 yrs; A3; F4; LOS 53 Bypass graft Patient management, wounddehiscence pneumonia, AF, asystolic, other neurology
Cardiac failure
13: M; 77 yrs; A3; F4; LOS 30 Bypass graft Hypotension, AF, other neurology Respiratory failure
14: F; 86 yr; A3; F4; LOS 6 Major amputation None MOF
15: M; 87 yrs; A4; F4; LOS 7 Major amputation CHF, renal failure Cardiac failure
16: M; 83 yrs; A4; F4; LOS 16 Major amputation Wounddehiscence, faeces culture Unknown
Data are presented as n, unless otherwise specified. Explanation: patient number; gender (M=male; F=female); age (yrs=years); ASA (A) = American society of anaesthesiologists 13; Fontaine (F); length of stay (LOS). AE=adverse event; PTA=percutaneous transluminal angioplasty; BGP=bypass graft procedure; CHF=congestive heart failure; MI=myocardial infarction; AF=atrium flutter; Hb=haemoglobin; MOF=multi organ failure. Important to stress is that the complication “death” is not included in the “complications” row.
An Appraisal of Economic Outcome of Adverse Events
Quality of Provided Care in Vascular Surgery Outcome assessment & Improvement strategies
173
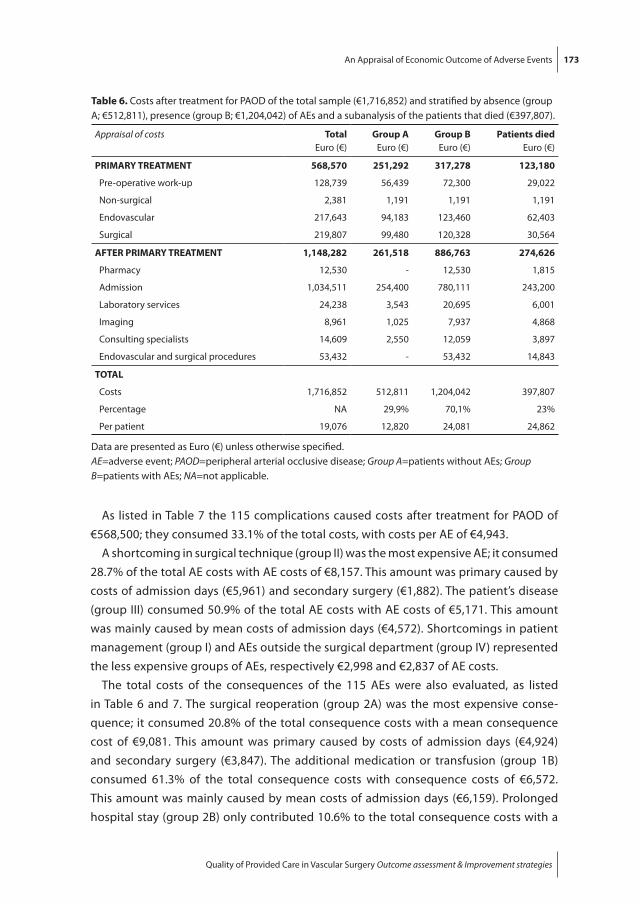
As listed in Table 7 the 115 complications caused costs after treatment for PAOD of €568,500; they consumed 33.1% of the total costs, with costs per AE of €4,943.
A shortcoming in surgical technique (group II) was the most expensive AE; it consumed 28.7% of the total AE costs with AE costs of €8,157. This amount was primary caused by costs of admission days (€5,961) and secondary surgery (€1,882). The patient’s disease (group III) consumed 50.9% of the total AE costs with AE costs of €5,171. This amount was mainly caused by mean costs of admission days (€4,572). Shortcomings in patient management (group I) and AEs outside the surgical department (group IV) represented the less expensive groups of AEs, respectively €2,998 and €2,837 of AE costs.
The total costs of the consequences of the 115 AEs were also evaluated, as listed in Table 6 and 7. The surgical reoperation (group 2A) was the most expensive conse-quence; it consumed 20.8% of the total consequence costs with a mean consequence cost of €9,081. This amount was primary caused by costs of admission days (€4,924) and secondary surgery (€3,847). The additional medication or transfusion (group 1B) consumed 61.3% of the total consequence costs with consequence costs of €6,572. This amount was mainly caused by mean costs of admission days (€6,159). Prolonged hospital stay (group 2B) only contributed 10.6% to the total consequence costs with a
Table 6. Costs after treatment for PAOD of the total sample (€1,716,852) and stratified by absence (group A; €512,811), presence (group B; €1,204,042) of AEs and a subanalysis of the patients that died (€397,807).
Appraisal of costs Total
Euro (€)Group A
Euro (€)Group B
Euro (€)Patients died
Euro (€)
PRIMARY TREATMENT
Pre-operative work-up
Non-surgical
Endovascular
Surgical
568,570
128,739
2,381
217,643
219,807
251,292
56,439
1,191
94,183
99,480
317,278
72,300
1,191
123,460
120,328
123,180
29,022
1,191
62,403
30,564
AFTER PRIMARY TREATMENT
Pharmacy
Admission
Laboratory services
Imaging
Consulting specialists
Endovascular and surgical procedures
1,148,282
12,530
1,034,511
24,238
8,961
14,609
53,432
261,518
-
254,400
3,543
1,025
2,550
-
886,763
12,530
780,111
20,695
7,937
12,059
53,432
274,626
1,815
243,200
6,001
4,868
3,897
14,843
TOTAL
Costs
Percentage
Per patient
1,716,852
NA
19,076
512,811
29,9%
12,820
1,204,042
70,1%
24,081
397,807
23%
24,862
Data are presented as Euro (€) unless otherwise specified. AE=adverse event; PAOD=peripheral arterial occlusive disease; Group A=patients without AEs; Group B=patients with AEs; NA=not applicable.

174 Chapter 7
mean consequence cost of €3,778. The minor AE with no long-term consequence (group 1A), the irreversible physical damage (group 3) and death (group 4) represented the less expensive groups of consequences, with respectively €2,210, €2,505 and €203 of the costs.
The period before the actual occurrence of death of a patient, is a period reflecting increased admission days (n=304) because of the occurrence of 43% of all registered AEs in these patients. As listed in Table 6, the costs after primary treatment (€274,626) of these patients reflect 31% of the costs after primary treatment of all patients with AEs
Table 7. Costs divided by Fontaine-classification, ASA-classification and AES.
Categoryn
Total
Euro (€) %Per patient
Euro (€ )
DIAGNOSIS & COMORBIDITY
Fontaine-classification
Classification 2b
Classification 3
Classification 4
ASA-classification
Classification 2
Classification 3
Classification 4
12
25
53
41
43
6
133,400
378,005
1,203,459
678,775
830,555
205,534
7.8
22.0
70.2
39.6
48.4
12.0
11,117
15,120
22,707
16,555
19,315
34,256
ADVERSE EVENTS
Causes
Group I
Group II
Group III
Group IV
Total
Consequences
Group 1A
Group 1B
Group 2A
Group 2B
Group 3
Group 4
32
20
56
7
115
14
53
13
16
3
16
95,924
163,137
289,578
19,861
568,500
30,939
348,293
118,054
60,451
7,516
3,248
16.9
28.7
50.9
3.5
NA
5.4
61.3
20.8
10.6
1.3
0.6
2,998
8,157
5,171
2,837
4,943
2,210
6,572
9,081
3,778
2,505
203
TOTAL 90 1,716,852 NA 19,076
Data are presented as n, % and Euro (€) unless otherwise specified.AE=adverse event; ASA= American society of anaesthesiologists 13; NA=not applicable; Group I=shortcomings in patient management; Group II=shortcomings in surgical technique; Group III=patient’s disease; Group IV=outside surgical department; Group 1A=minor complication, no long-term consequence; Group 1B=additional medication or transfusion; Group 2A=reintervention: by surgeon; Group 2B=prolonged hospital stay; Group 3=irreversible physical damage; Group 4=death.

An Appraisal of Economic Outcome of Adverse Events
Quality of Provided Care in Vascular Surgery Outcome assessment & Improvement strategies
175
(€886,763). The total costs of these 16 patients (€397,807) reflect 23% of the total costs (€1,716,852) of all 90 patients treated for PAOD in the study period.
DISCUSSION
The primary goal of this study was to provide insight in actual cost of treatment of PAOD in general and of additional cost of post procedural AEs. Secondary goal of the study was to analyze costs related to specific causes and consequences of AEs. Cost efficiency of treatment of PAOD is important in today’s world of financial constraints on health expenditure. Valid cost estimates may help identify the optimal treatment strategy for patients with PAOD. Cost accounting methods introduced in hospitals nationwide should improve cost estimates substantially. The in-hospital financial burden of treating PAOD can be divided into cost of primary treatment and cost after primary treatment (Table 6) and is considerable during admission. Of most concern in this respect, is the ex-cessive financial burden which each failed intervention procedure (either endovascular or surgical) can place upon our vascular unit. The study population included all patients admitted and treated for PAOD during a defined period from a defined population and therefore provides a good insight in the economic consequences of PAOD treatment. We make several observations that advance this field of inquiry.
First we found statistically significant differences of pretreatment symptoms (Fontaine classification) and comorbidity (ASA-classification) between group A and B. Concerning the costs represented by the Fontaine - and the ASA-classification, an elevating trend was observed in accordance of the classification. This could be explained by the fact that the patients (group B) classified Fontaine 4 and/or ASA 3-4, suffer from the highest form of PAOD and represent a high comorbidity group of patients. Both result in the most expensive form of preoperative work-up and high incidence of postoperative AE related costs. Fontaine-4 and ASA-4 patients were 2 times more expensive compared to Fontaine-2b and ASA-2 patients respectively.
Second, no differences were found concerning the kind of primary treatment between group A and B resulting in approximately the same costs per patient in both groups (€6,300). The overall costs of the primary treatment reflected 33% of the total costs.
Third, the results of our analyses indicate that considerable extra costs are incurred because of AEs after treatment of PAOD; they increased the total costs per admission substantially. The overall costs of the AEs reflected 33% of the total costs. The short-coming in surgical technique (group II) was the most expensive cause of an AE and the patient’s disease (group III) consumed half of the total AE costs. A likely explanation for these high additional costs is that patients with AEs need longer hospitalization (sec-ondary procedures) and may require more additional care compared to other patients.

176 Chapter 7
Shortcomings in patient management (group I) and surgical AEs (group II) are causes of AEs that could be prevented by structured changes in perioperative management and surgical protocol; they are susceptible for improvement and thereby cost reduction. Prevention of the occurrence of these causes of AEs would result in a significant reduc-tion in costs; they are responsible for 45.6% of the additional costs.
Fourth, patients in group B tended to undergo more frequently secondary treatment. If secondary treatment was involved, a new work-up, extra admission time, and the procedure itself added to the total costs in this group. Costs associated with secondary treatment constituted 20.8% of the total costs of the consequences and reflected the most expensive consequence per AE (€9,081). Additional medication or transfusions were responsible for 61.3% of the costs of all consequences.
Fifth, the consequence death itself was not very expensive; however the patients that died reflect a group which is responsible for 23% of the total costs of all patients. The period before the actual dying of a patient is a very expensive period because of the oc-currence of 43% of all registered AEs, automatically resulting in an increased admission period and therefore increasing total costs.
Sixth, as we realize, AEs will always occur in every surgical department and it is an illusion to strive for a practice without any AE. However, our goal is to strive for the high-est possible quality of care with as few as possible adverse events. We do realize that due to extensive pre-operative comorbid conditions especially in our specific patient population AEs are inevitable. However, in this and previous studies from our clinic 21,
22 we observed that a significant part of all AEs were caused by shortcomings in patient management or shortcomings in surgical technique. Especially these 2 categories are human errors and therefore preventable. For instance, one of the most frequent reg-istered AEs caused by shortcomings in patient management was postoperative fluid overload ultimately leading to congestive heart failure and even myocardial infarction. After analyzing our cardiac adverse events and causing shortcomings we altered the postoperative fluid protocol in order to prevent these AEs.
The Dutch financial health care system is still developing its methods of cost calcula-tions. In January 2006 a fairly rigid budget system, diagnosis treatment code (DTC) 23-25 was introduced to constrain hospital charges. In this system a diagnosis is related to a standardized budget per year. For instance, health care insurance companies reimburse the combination of the diagnosis with its treatment. These DTC prices are negotiated between individual health care providers and health care insurance companies. In this DTC, the specific treatment ranging from conservative treatment to extensive surgical interventions is not pre-defined. This study indicates that complication related costs of the treatment of PAOD are strongly correlated with ASA-classification and Fontaine-classification. The recently implemented Dutch DTC system takes these pre-operative patient specific co-morbidity and specific severity of disease not into account. In a
An Appraisal of Economic Outcome of Adverse Events
Quality of Provided Care in Vascular Surgery Outcome assessment & Improvement strategies
177
system in which health care providers receive, standardized, up-front negotiated, reimbursements independent of patients case mix treated, health care physicians pos-sibly tend to treat patients with minor co-morbidity in order to reduce the incidence of postoperative AEs and thereby costs.
Limitations of the study
This study is limited by its size with a total of 90 patients, 40 patients without - and 50 patients with AEs. A limitation of this study may be the restriction of data collection from only one hospital, which might not be completely representative for all hospitals. Also the sample was composed exclusively of patients with PAOD; therefore these financial results may not generalize to other vascular patient samples. We acknowledge the fact that all AE registration systems will have some sort of underestimation. However, we feel that our registration system contains several crucial aspects such as a prospective registration twice a day on the day of the occurrence of the AE (instead of registration at the time of discharge) and a plenary evaluation of all AEs once a week in an open constructive, non-accusing atmosphere. These aspects will limit under registration of AEs and AE related costs.
CONCLUSION
These results suggest that complications cause a significant increase of the costs in the treatment for PAOD. Shortcomings in surgical technique and patient’s disease were the most expensive causes of AEs. Surgical reoperation and/or alteration of additional medication or transfusion were the two most expensive consequences of AEs. We firmly believe vascular surgeons should take a leading role in helping to decrease health care expenses. A principle method to decrease hospital costs includes treatment strategies aimed at prevention of shortcomings in patient management and shortcomings in surgical technique.
REFERENCES
1. Dormandy JA, Rutherford RB. Management of peripheral arterial disease (pad). Tasc working group. Transatlantic inter-society consensus (tasc). J Vasc Surg 2000; 31(1 Pt 2): S1-S296.
2. Norgren L, Hiatt WR, Dormandy JA, Nehler MR, Harris KA, Fowkes FG, Bell K, Caporusso J, Durand-Zaleski I, Komori K, Lammer J, Liapis C, Novo S, Razavi M, Robbs J, Schaper N, Shigematsu H, Sapoval M, White C, White J, Clement D, Creager M, Jaff M, Mohler E, 3rd, Rutherford RB, Sheehan

178 Chapter 7
P, Sillesen H, Rosenfield K. Inter-society consensus for the management of peripheral arterial disease (tasc ii). Eur J Vasc Endovasc Surg 2007; 33 Suppl 1: S1-75.
3. A prospective epidemiological survey of the natural history of chronic critical leg ischaemia. The i.C.A.I. Group (gruppo di studio dell’ischemia cronica critica degli arti inferiori). Eur J Vasc Endovasc Surg 1996; 11(1): 112-20.
4. Long-term mortality and its predictors in patients with critical leg ischaemia. The i.C.A.I. Group (gruppo di studio dell’ischemia cronica critica degli arti inferiori). The study group of criticial chronic ischemia of the lower exremities. Eur J Vasc Endovasc Surg 1997; 14(2): 91-5.
5. Hooi JD, Stoffers HE, Kester AD, Rinkens PE, Kaiser V, van Ree JW, Knottnerus JA. Risk factors and cardiovascular diseases associated with asymptomatic peripheral arterial occlusive disease. The limburg paod study. Peripheral arterial occlusive disease. Scand J Prim Health Care 1998; 16(3): 177-82.
6. Cheng SW, Ting AC, Lau H, Wong J. Survival in patients with chronic lower extremity ischemia: A risk factor analysis. Ann Vasc Surg 2000; 14(2): 158-65.
7. Jansen RM, de Vries SO, Cullen KA, Donaldson MC, Hunink MG. Cost-identification analysis of revascularization procedures on patients with peripheral arterial occlusive disease. J Vasc Surg 1998; 28(4): 617-23.
8. Gupta SK, Veith FJ, Ascer E, Flores SA, Gliedman ML. Cost factors in limb-threatening ischaemia due to infrainguinal arteriosclerosis. Eur J Vasc Surg 1988; 2(3): 151-4.
9. Cheshire NJ, Wolfe JH, Noone MA, Davies L, Drummond M. The economics of femorocrural re-construction for critical leg ischemia with and without autologous vein. J Vasc Surg 1992; 15(1): 167-74; discussion 174-5.
10. Finkler SA. The distinction between cost and charges. Ann Intern Med 1982; 96(1): 102-9. 11. Collier PE. Do clinical pathways for major vascular surgery improve outcomes and reduce cost? J
Vasc Surg 1997; 26(2): 179-85. 12. Rutherford RB. Vascular surgery--comparing outcomes. J Vasc Surg 1996; 23(1): 5-17. 13. Rutherford RB, Baker JD, Ernst C, Johnston KW, Porter JM, Ahn S, Jones DN. Recommended stan-
dards for reports dealing with lower extremity ischemia: Revised version. J Vasc Surg 1997; 26(3): 517-38.
14. Anesthesiologists ASo. Asa physical status classification system. Available at http:/www.Asahq.Org/clinicalphysicalstatus.Htm. Accessed: Nov 3, 2007.; 2007. http:/www.asahq.org/clinicalphysi-calstatus.htm
15. Ouriel K. Current status of thrombolysis for peripheral arterial occlusive disease. Ann Vasc Surg 2002; 16(6): 797-804.
16. Ouriel K, Veith FJ, Sasahara AA. Thrombolysis or peripheral arterial surgery: Phase i results. Topas investigators. J Vasc Surg 1996; 23(1): 64-73; discussion 74-5.
17. Korn P, Khilnani NM, Fellers JC, Lee TY, Winchester PA, Bush HL, Kent KC. Thrombolysis for native arterial occlusions of the lower extremities: Clinical outcome and cost. J Vasc Surg 2001; 33(6): 1148-57.
18. Ouriel K, Veith FJ, Sasahara AA. A comparison of recombinant urokinase with vascular surgery as initial treatment for acute arterial occlusion of the legs. Thrombolysis or peripheral arterial surgery (topas) investigators. N Engl J Med 1998; 338(16): 1105-11.
19. Marang-van de Mheen PJ, Kievit J. [automated registration of adverse events in surgical patients in the netherlands: The current status]. Ned Tijdschr Geneeskd 2003; 147(26): 1273-7.
20. Roukema JA, van der Werken C, Leenen LP. [registration of postoperative complications to im-prove the results of surgery]. Ned Tijdschr Geneeskd 1996; 140(14): 781-4.

An Appraisal of Economic Outcome of Adverse Events
Quality of Provided Care in Vascular Surgery Outcome assessment & Improvement strategies
179
21. Schepers A, Klinkert P, Vrancken Peeters MP, Breslau PJ. Complication registration in patients after peripheral arterial bypass surgery. Ann Vasc Surg 2003; 17(2): 198-202.
22. Veen MR, Lardenoye JW, Kastelein GW, Breslau PJ. Recording and classification of complications in a surgical practice. Eur J Surg 1999; 165(5): 421-4; discussion 425.
23. http://NVvH.artsennet.nl/search/DBC. 24. http://www.farmacotherapeutischkompas.nl. 25. http://NVvH.artsennet.nl/search/CTG.
180 Chapter 7
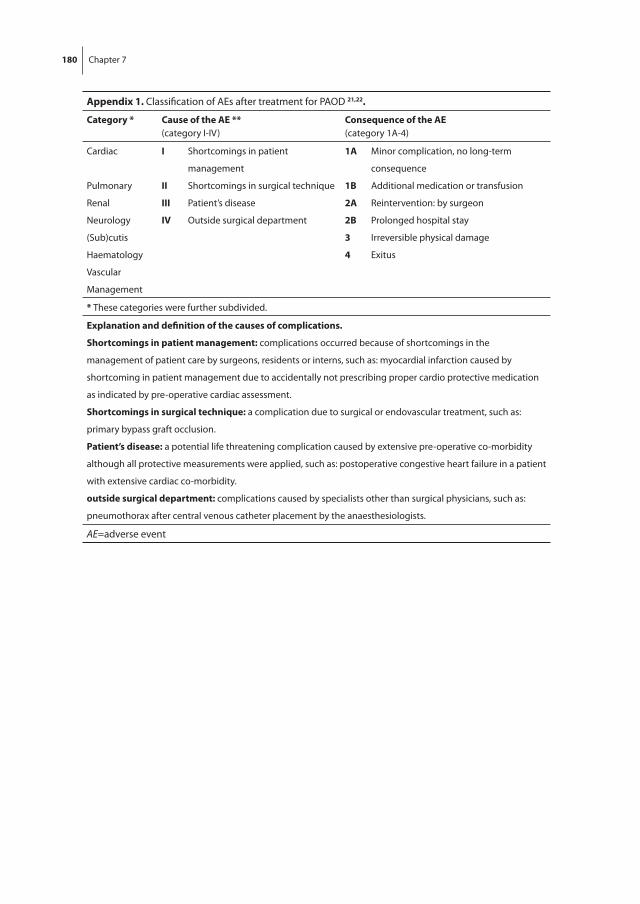
Appendix 1. Classification of AEs after treatment for PAOD 21,22.
Category * Cause of the AE **
(category I-IV)Consequence of the AE
(category 1A-4)
Cardiac
Pulmonary
Renal
Neurology
(Sub)cutis
Haematology
Vascular
Management
I
II
III
IV
Shortcomings in patient
management
Shortcomings in surgical technique
Patient’s disease
Outside surgical department
1A
1B
2A
2B
3
4
Minor complication, no long-term
consequence
Additional medication or transfusion
Reintervention: by surgeon
Prolonged hospital stay
Irreversible physical damage
Exitus
* These categories were further subdivided.
Explanation and definition of the causes of complications.
Shortcomings in patient management: complications occurred because of shortcomings in the
management of patient care by surgeons, residents or interns, such as: myocardial infarction caused by
shortcoming in patient management due to accidentally not prescribing proper cardio protective medication
as indicated by pre-operative cardiac assessment.
Shortcomings in surgical technique: a complication due to surgical or endovascular treatment, such as:
primary bypass graft occlusion.
Patient’s disease: a potential life threatening complication caused by extensive pre-operative co-morbidity
although all protective measurements were applied, such as: postoperative congestive heart failure in a patient
with extensive cardiac co-morbidity.
outside surgical department: complications caused by specialists other than surgical physicians, such as:
pneumothorax after central venous catheter placement by the anaesthesiologists.
AE=adverse event

An Appraisal of Economic Outcome of Adverse Events
Quality of Provided Care in Vascular Surgery Outcome assessment & Improvement strategies
181
Appendix 2. Summary of the appraisal of costs, what was calculated and from were the average estimated total costs were obtained.
Appraisal of costs Calculated items Cost obtainment
PRIMARY TREATMENT
PRE-OPERATIVE WORK-UP
DUE / ECG Laboratory, fee of staff, consumable items. DTC department.
Diagnostic angiography Angiography suite, fee of staff, consumable items.
Financial department radiology.
Haematology/microbiology Laboratory, fee of staff, consumable items. DTC department.
Pharmacy Medication. Financial department laboratory service.
Consulting specialists Internal medicine or cardiology for consultation.
Pharmacy therapeutic guide 24.
NON-SURGICAL DTC department.
Wound management Consumable items. Financial department vascular ward.
ENDOVASCULAR or SURGICAL procedures
Urokinase Medication. Pharmacy therapeutic guide 24.
Costs of the intervention Prosthetic materials, endovascular, vascular, non-vascular, fee vascular surgeon, fee anaesthesiologist, fee radiologist, fee staff.
CHC.Financial department anaesthesiology.CHC.
Operating room / recovery room
Sterile and non-sterile consumable items, Medication, blood bank, i.v. fluids.
Financial department laboratory service. Pharmacy therapeutic guide 24.
Post-operative pain protocol
Medication. Pharmacy therapeutic guide 24.
AFTER PRIMARY TREATMENT
PHARMACY
Antibiotics Medication. Pharmacy therapeutic guide 24.
Neurology / cardiac Medication. Pharmacy therapeutic guide 24.
Hydration / dehydration Medication. Pharmacy therapeutic guide 24.
Blood bank Laboratory, fee of staff, consumable items. Financial department vascular ward.
ADMISSION
Bandage, urine catheter Consumable items. Financial department vascular ward.
Length of stay ICU and vascular ward (days), fee of staff, service, housing.
Financial department vascular ward.
LABORATORY SERVICES
Haematology Laboratory, fee of staff, consumable items. Financial department laboratory service.
Microbiology (blood, urine, faeces)
Laboratory, fee of staff, consumable items. Financial department laboratory service.

182 Chapter 7
Appendix 2. Summary of the appraisal of costs, what was calculated and from were the average estimated total costs were obtained.
Appraisal of costs Calculated items Cost obtainment
IMAGING
DUE / ECG Laboratory, fee of staff, consumable items. DTC department.
Diagnostic angiography X-ray / ultrasound / CAT-
scan
Fee radiologist, laboratory, fee of staff, consumable items.
Financial department radiology.
CONSULTING SPECIALISTS
Internal medicine Fee internal medicine for consultation. DTC department.
Cardiology Fee cardiologist for consultation. DTC department.
Neurology Fee neurologist for consultation. DTC department.
ENDOVASCULAR or SURGICAL procedures
Costs of the intervention Prosthetic materials, endovascular, vascular, non-vascular, fee vascular surgeon, fee anaesthesiologist, fee radiologist, fee staff.
CHC.Financial department anaesthesiology.CHC.
Operating room / recovery room
Sterile and non-sterile consumable items, medication, blood bank, i.v. fluids.
Financial department laboratory service.Pharmacy therapeutic guide 24.
Post-operative pain protocol
Medication. Pharmacy therapeutic guide 24.
DUE=duplex ultrasound examination; ECG=electrocardiography; DTC=diagnosis treatment code 23; CHC=college of healthcare costs 25.