quality in ontario 2 report - legislative assembly of ontario · executive summar ontario borders...
TRANSCRIPT

Water Quality in
Ontario 2010
Repo
rt

WATER QUALITY IN ONTARIO 2010 REPORT AcknowledgementsThis report was prepared by the staff of the Environmental Monitoring and Reporting Branch of the Ontario Ministry of the Environment, unless noted otherwise. Their contributions of data, expertise, advice and comments are gratefully acknowledged. The following individuals contributed significantly to the content and organization of the report: Emily Awad, Nadine Benoit, Tom Browne, Kayley Collum and Peggy McMahon (Communications Branch), Anna DeSellas, Ngan Diep, Justin Dossett, Jennifer Grixti, Paul Helm, Todd Howell, Georgina Kaltenecker, Bill Keller (Laurentian University), Sonya Kleywegt (Standards Development Branch), Patrick McInnis, Andrew Paterson, Vasily Rogojin, Wolfgang Scheider, Eleanor Stainsby, Janis Thomas, Aaron Todd, Katherine Welch and Joelle Young.
PIBS 8483e © Queen’s Printer for Ontario, 2011 Le document Points clés du rapport de 2010 sur la qualité de l'eau en Ontario est disponible en français. Pour en obtenir une copie, veuillez communiquer avec le Centre d'information du Ministère par téléphone, au 1-800-565-4923, ou par courriel, à l’[email protected]. On peut aussi lire les points clés du rapport sur le site Web du Ministère à l’adresse www.ontario.ca/environnement.
For more information on this report please contact the Ontario Ministry of the Environment at [email protected]
You can also contact the ministry’s Public Information Centre at 1-800-565-4923, 416-325-4000, TTY 1-800-515-2759 or [email protected] To download copies of this report please visit the ministry’s website, www.ontario.ca/environment
Cover image: Big Cedar Point on the west side of Cook’s Bay, Lake Simcoe. Credit: Nick Wilson

Executive Summar Ontario borders on four of the five Great Lakes and we have more than a quarter of a million lakes, rivers and streams. These water resources are the cornerstone of the quality of life we enjoy in Ontario. Our health, the health of the environment and our economic prosperity depend on them. We believe that clean water should be available to everyone. That is why we are taking a leadership role in protecting our water and in bringing clean water to more people. Collecting and Analyzing Information Every year, the ministry collects and analyzes tens of thousands of samples from water, sediment, and aquatic life such as fish and algae. The ministry monitors water over the short and long term to examine impacts on specific sites as well as track conditions over time. Water samples are analyzed in the ministry’s laboratories and tested for basic water quality parameters such as pH and hardness. Samples are also tested for signs of pollution such as nutrients, mercury, lead, PCBs and pesticides. Using Monitoring Information The ministry’s water quality monitoring programs provide valuable scientific information for developing policies and programs to protect water resources, aquatic life and our health. For instance, monitoring has been instrumental in determining the target for reducing phosphorus in Lake Simcoe as well as for calculating the advisories in the Guide to Eating Ontario Sport Fish. Monitoring also helps to prioritize key issues and choose the geographic areas in which to concentrate to get a better understanding of what is happening. For this reason, Ontario extended its monitoring efforts to the far north. The ministry collected water and sediment core samples from several lakes in the far north region to examine the effects of climate change in this area. Results from this work will be published in future reports. Water Quality in Ontario 2010 Report The second Water Quality in Ontario Report presents findings on areas of focus for the ministry’s water monitoring program.
y
i

ii
The monitoring results show success and improvements in the Great Lakes, Lake Simcoe and other water bodies.
Wheatley Harbour in Lake Erie is no longer on the list of Great Lakes Areas of Concern. This revitalized harbour is now home to an abundant and diverse community of fish and wildlife, and water quality has improved.
Levels of PCBs, mercury, dioxins and furans are generally stable or decreasing in sport fish from the Canadian Great Lakes. As a result, sport fish from the Great Lakes are safer to eat today. The 2011-2012 Guide to Eating Ontario Sport Fish shows a modest decrease in consumption restrictions since the 2009-2010 guide.
Compared to past decades, phosphorus levels in Lake Simcoe are lower contributing to an increase in dissolved oxygen in the deep waters of the lake, an important coldwater fish habitat. Contaminants such as PCBs and DDT have generally declined in the lake’s sport fish.
Levels of three common lawn care pesticides decreased by about 80 per cent in urban streams in the first year of Ontario’s cosmetic pesticides ban. Pesticide levels in treated drinking water from surface water sources dropped substantially from 1986 to 2006.
The 2010 report has new information on a number of emerging and ongoing challenges.
New data indicates that a warming climate is affecting Ontario’s water resources. Warmer air temperatures in June and September have increased the length of time that the water in Lake Simcoe is separated into warm and cool layers. These changes are likely contributing to observed changes in the algae in the lake, which in turn is possibly impacting the food web of the lake.
Warmer air temperatures likely also played a role in the major die-offs of brook trout and white suckers in the Sutton River in Ontario’s far north region.
Monitoring results for invasive species in the Great Lakes and Lake Simcoe are featured in this report for the first time. In 2008, invasive mussels covered 47 per cent of the lake bottom in coastal areas of Lake Ontario. Invasive mussels in the Great Lakes are drastically altering the lakebed and the ecosystem. They are creating more favourable conditions for algae growth on the lakebed and for nearshore aquatic plant growth disrupting the habitat and food supply of native species.
New monitoring and research indicate the Rainy River is the largest single contributor of phosphorus to Lake of the Woods. Recent studies show phosphorus concentrations are highest in bays in the lake near the mouth of the river and that algal blooms appear first in this area.
Since the 2008 report, the province is acquiring more information on pathogens—microscopic organisms that can cause disease in humans and animals—and chemicals of emerging concern.

iii
An innovative device called a passive sampler was used to monitor concentrations of pharmaceuticals in the Great Lakes. The study found low but detectable concentrations in the water. Concentrations were similar to or lower than those found in other surface water studies. As expected, the highest concentrations were found in waters near sewage treatment plants of urban centres such as Hamilton and Toronto. For the first time, the report provides chloride monitoring results. Chloride concentrations in Ontario’s streams have increased over the last three decades. Concentrations in urban streams are typically higher and are increasing at a faster rate than the provincial average. Road salt is likely the major source. Average chloride concentrations in streams peak in the winter months. The highest concentrations generally occur in urbanized regions where there are more roads, parking lots and sidewalks and greater quantities of salts are used. Conclusions The monitoring results in the 2010 report show the investments and efforts by governments, industry and individuals to protect water quality in Ontario are successful. While improvements have been made we still need to do more to address new and ongoing challenges to protecting our valuable water resources.
Further reductions in phosphorus loads to Lake Simcoe are required to reach the target for dissolved oxygen necessary to support coldwater fish.
Continued efforts to reduce phosphorus levels and to better understand the role of invasive mussels in the Great Lakes and inland lakes are required to discourage excessive algae growth.
Ongoing actions to reduce toxics emissions and to clean up contaminated areas in lakes and streams are required to reduce restrictions on eating sport fish.

Table of Contents Executive Summary ................................................................................................................. i Table of Contents......................................................................................................................iv 1.0 Introduction ................................................................................................................. 1
What is water quality? ....................................................................................... 2 Things that affect water quality ......................................................................... 3 Water quality in Ontario .....................................................................................4
Ontario government’s role in protecting water quality.......................................6 2.0 Water Quality Monitoring ...................................................................................8
What is water quality monitoring?......................................................................8 Why is water quality monitoring necessary? ......................................................8
How do we measure water quality? ....................................................................9 Ministry of the Environment’s responsibility for water quality monitoring.......9
Water quality monitoring partnerships .............................................................11 Highlight story: The Great Lakes field crew....................................................12 3.0 Phosphorus Enrichment ........................................................................................... 13 What is phosphorus? .........................................................................................13 Where does phosphorus come from?................................................................13 Why is too much phosphorus a problem?.........................................................14 The phosphorus contamination cycle................................................................14 Acceptable phosphorus levels...........................................................................15
Phosphorus monitoring results..........................................................................15 3.1 Lake Simcoe ...............................................................................................16 3.2 Lake of the Woods………………………………………….………………….19 3.3 Great Lakes…………………....................................................................21 Great Lakes nuisance algae .......................................................................22 Fouling of shoreline by Cladophora and other algae on the lakebed........22 Cyanobacteria blooms ...............................................................................23
4.0 Toxic Substances........................................................................................................ 25 What substances are toxic? ...............................................................................25 Where do toxic substances come from?............................................................26 How is the ministry monitoring toxic substances? ...........................................26 What is monitoring telling us about toxic substances?.....................................27
Occurrence of toxic substances near urban areas .............................................27 Contaminant trends in sport fish .......................................................................29
4.1 Delisting of Wheatley Harbour Area of Concern (AOC) ............................... 31 PCB contamination in Wheatley Harbour................................................................... 32
Improvements in Wheatley Harbour.....................................................32
iv

v
4.2 Pesticides..............................................................................................33 Pesticides in urban streams ...................................................................34
Pesticides ban details ............................................................................34 Pesticides in Ontario’s treated municipal drinking water .....................35 Pesticide trends .....................................................................................35 Exceedances of drinking water quality standards.................................36 Pesticides in treated drinking water from surface water sources,
2001-2006 .............................................................................................37 Pesticides in treated drinking water from groundwater sources, 2001-2006 .............................................................................................38 4.3 Arsenic in Groundwater in Ontario ........................................................... 38 How do we monitor groundwater quality? ...........................................38
What is arsenic and where does it come from?.....................................39 How does arsenic get into groundwater? ..............................................39 What do we know about arsenic in groundwater in Ontario?...............40 5.0 Invasive Species...............................................................................................41 What are invasive species? ...............................................................................41
How are invasive species introduced? ..............................................................41 How is the ministry monitoring aquatic invasive species?...............................42
5.1 Invasive Species in Lake Simcoe........................................................42 5.2 Zebra and Quagga Mussels in the Great Lakes...............................44
6.0 Climate Change ......................................................................................................... 45
What is climate change? ...................................................................................45 Will Ontario’s water quality be affected by climate change?...........................45
Expected and observed effects of climate change on Ontario’s aquatic ecosystems............................................................................................45
Lake ecosystems ...................................................................................46 Stream and wetland ecosystems............................................................46 Groundwater ecosystems ......................................................................46 What is monitoring telling us?..........................................................................46 6.1 Climate Change Effects on Lake Simcoe.................................................47 How is climate change affecting the thermal structure of the lake? .....48 6.2 Climate Change Effects in Ontario’s Far North......................................... 50
Hawley Lake and the Sutton River .......................................................51 How are we investigating climate change in the far north?..................52 7.0 Issues on the Radar ................................................................................................... 53 What are “issues on the radar”? ........................................................................53 7.1 Chemicals of Emerging Concern........................................................53 Pharmaceuticals in the environment….................................................53 How is the ministry monitoring pharmaceuticals and other contaminants of emerging concern? .....................................................54
Pharmaceuticals and other emerging contaminants in drinking water .54

vi
Pharmaceuticals and other emerging contaminants in the Great Lakes ...........................................................................................56
7.2 Road Salts ............................................................................................58 Chloride in Ontario’s streams ...............................................................59 Chloride in Lake Simcoe ......................................................................60 7.3 Pathogens .............................................................................................62 What is Ontario doing to protect water from pathogen
contamination?......................................................................................62 Protecting sources of drinking water ....................................................62
Protecting recreational waters and beaches ..........................................63 E. coli sources at beaches in Lake Huron…………………..…………64
Bacteria associated with green algae Cladophora in Lake Ontario......65 8.0 Summary and Conclusions ....................................................................................... 66 9.0 References........................................................................................................68 10.0 Appendix: Monitoring Program Descriptions ........................................................ 72 10.1 Great Lakes Monitoring ............................................................................. 72 10.2 Lake Simcoe Monitoring ...................................................................74 10.3 Inland Lake Monitoring ............................................................................. 75 10.4 Stream Monitoring ...................................................................................... 78 10.5 Groundwater Monitoring .....................................................................79 10.6 Drinking Water Monitoring ....................................................................... 80 10.7 Biomonitoring .............................................................................................. 81 11.0 Glossary.............................................................................................................84

1.0 Introduction
Ontario has about one-third of the world’s fresh surface water. Our lakes, rivers, streams and groundwater supply our drinking water, and are home to many plant and animal communities. Our water also plays a vital role in industry, agriculture, recreation and food processing. Given its importance, it is critical that this resource be protected by all Ontarians. This second Water Quality in Ontario Report presents select findings from the Ministry of the Environment’s (MOE) programs for monitoring the province’s lakes, streams and groundwater. The report features results for the following focus areas in water monitoring: phosphorus enrichment, toxic substances, climate change, invasive species
1
and issues on the radar such as pharmaceuticals and other emerging contaminants.
Where does Ontario’s water come from? Water is continuously moving between the earth and the atmosphere in what is called the “water cycle”. Water vapour rises into the atmosphere through the evaporation of surface water and transpiration from plants. As this moist air rises, it condenses to form clouds. When the clouds become too saturated, water returns to the earth as rain, snow, hail or fog. When it reaches the ground, it may evaporate back into the atmosphere, flow into lakes or rivers, or seep into the soil. In the soil, the water may either evaporate directly, be taken up by the roots of plants and released by their leaves, or percolate downward as groundwater flow. Some of this groundwater drains into outlets such as wells and springs, or flows into lakes (Figure 1.1).

2
Figure 1.1: An image of the hydrologic or water cycle. Source: www.pollutionprobe.org/Reports/swpprimer.pdf What is water quality? Water quality refers to the physical, chemical and biological characteristics of water. Physical characteristics include:
colour taste odour turbidity (how cloudy the water appears)
Chemical characteristics include:
the presence of substances such as phosphorus, chloride, arsenic, fluoride and pesticides
the presence of metals such as mercury, lead and cadmium
Biological characteristics include: the presence of bacteria, viruses and protozoa the presence of invasive species the presence and composition of algae, zooplankton and benthos

3
In science, the term for an individual characteristic—particularly when it is measured—is “parameter”. Most of these parameters are linked to health concerns for humans and wildlife. For this reason, monitoring water for each of them is critical. To monitor water quality, samples are collected and analyzed in a laboratory. The results help us understand the health of the environment and the changes occurring in it. Things that affect water quality Water quality is affected by many things, including:
air pollutants (such as sulphur dioxide and nitrogen oxides) climate change invasive species (such as zebra and quagga mussels) nutrients (such as phosphorus) pathogens (such as E. coli and Cryptosporidium) toxic substances (such as metals and pesticides)
These are usually the result of both natural and human causes (Figure 1.2). For an example, see the section titled “Where does phosphorus come from?” in Chapter 3, Page 13 of this report. Although the things affecting water quality can come from human and natural sources, most of the sources listed in the example on page 13 are a consequence of human activities: agriculture, urban and industrial development, human settlements and recreation.
Figure 1.2: An image of how human activities introduce pollution into the water cycle at many points. Land use and land cover largely determine the type and amount of contaminants entering streams, lakes and underground pathways, including aquifers. The movement of contaminants is accelerated by rainfall that accentuates runoff and infiltrations. Source: www.pollutionprobe.org/Reports/swpprimer.pdf

Water Quality in Ontario Ontario’s geological history has shaped its regional land use patterns and water quality conditions. [For a further description please see the Water Quality in Ontario 2008 Report Chapter 1, Pages 1-3]. Southern Ontario is covered by thick, nutrient-rich soils and is surrounded by three of the five Great Lakes (Huron, Erie and Ontario). As a result, the area is densely populated and widely used for agriculture, industry and urban purposes. This has led to a range of water quality issues, from nutrient enrichment (excessive loading of nutrients to a water body due to human activities) to the release of toxic substances. In contrast, the Precambrian region of northern Ontario is typically covered by thin soils and is poorly drained, resulting in an area that is largely undeveloped. A few urban areas have developed around the mining and forestry industry, in addition to cottages found on the shores of some of the lakes in this region. Despite the lower population density, the region is also affected by water quality issues. In particular, the soft water that makes up the lakes and wetlands of northern Ontario is especially susceptible to the effects of acid deposition as well as nutrient enrichment. Finally, climate change is a growing concern for Ontario’s water quality. Water temperatures in some lakes in Ontario have increased over the last few decades and this has been correlated with increased air temperatures caused by climate change. Average annual temperatures in the province could rise by as much as 8°C over the next century, according to estimates from the Global Circulation Model (GCM) simulations of climate.1 A warmer climate could result in milder winters, longer growing seasons and increased frequency of severe weather events such as storms, floods, drought and heat waves.
Ontario has: About 230,000 inland lakes greater than a hectare in size2 More than 500,000 kilometres of rivers and streams3 10,000 kilometres of shoreline on four of the five Great Lakes, including
islands4 (See Figure 1.3)
4

5
Figure 1.3: A map of Ontario’s lakes and streams. Source: Ontario Ministry of Natural Resources.
OOnnttaarriioo hhaass aabboouutt 223300,,000000
iinnllaanndd llaakkeess ggrreeaatteerr tthhaann aa hheeccttaarree iinn
ssiizzee aanndd mmoorree tthhaann 550000,,000000 kkiilloommeettrreess
ooff rriivveerrss aanndd ssttrreeaammss..
6
Ontario government’s role in protecting water quality The Ontario government takes an active role in protecting the quality of our water and has put in place some of the most rigorous water protection measures in North America.
The Clean Water Act
helps protect sources of our drinking water before they enter the drinking water system
The Safeguarding and Sustaining Ontario’s Water Act
strengthens the protection and conservation of the Great Lakes and all of Ontario’s water resources, including a ban on water diversions from Ontario’s water basins
The Lake Simcoe Protection Act, passed in 2008, and the Lake Simcoe Protection Plan, 2009
will help restore and protect the health of this threatened lake
The 2007 Canada-Ontario Agreement Respecting the Great Lakes Basin Ecosystem (COA)
commits the provincial and federal government to restoring and protecting the Great Lakes watersheds, including the rivers and streams that drain into the Lakes
The Toxics Reduction Act and the Cosmetic Pesticides Ban Act
help reduce toxics in our environment The Far North Act
protects an area in Ontario that is three times the size of Lake Superior and includes the world’s largest wetland and the largest intact forest in Ontario, known as Canada’s boreal forest
The Water Opportunities and Water Conservation Act
supports the growth of clean-water technologies in Ontario encourages the use of sustainable infrastructure and conservation planning to
address water quantity and water quality challenges helps Ontarians use water more efficiently by providing information on water
use and conservation

7
Much of the scientific information that forms the basis for these legislative acts is a direct result of the information gathered though water quality monitoring and reporting. Chapter Two focuses more specifically on water quality monitoring.
Did you know?
More than 98 per cent of Ontario residents (13 million people) live in the Great Lakes Basin5
The Great Lakes basin is home to over 150 native species of fish6 and more than 3,000 species of plants
More than 70 per cent of Ontarians get their drinking water from the Great Lakes7
28.5 per cent of Ontarians (3.2 million people) get their drinking water from groundwater8

8
What is water quality monitoring? Water quality monitoring is the standardized collection and analysis of samples, observations and on-site measurements used to provide information and knowledge about a body of water. It is the foundation on which water quality management and protection activities in Ontario are based. Why is water quality monitoring necessary? Water quality monitoring measures the impact of efforts by governments, industries and individuals to protect water quality in Ontario. The ministry runs many water monitoring programs that monitor changes over the short term (fewer than five years) and long term (decades).
2.0 Water Quality Monitoring
2008 statistics show the scope and extent of the ministry’s investments in ambient water quality monitoring programs.
3,700 = locations across Ontario where samples were collected 30,000 = samples collected and analyzed, made up of:
20,000 samples of water 200 samples of sediment 9,800 samples of fish, benthic invertebrates and plankton
828,600 = number of individual pieces of water quality data from sampling
The ministry’s short-term monitoring studies consist largely of surveys that are designed to examine site-specific environmental impacts of known contaminant sources. Long-term monitoring studies such as the ministry’s ambient monitoring programs are designed to track the overall conditions in the environment over an extended period of time, and provide basic information on the quality of water resources across the province. Ontarians need this information to understand the state of the environment, the impact of their activities and the progress that is being made to protect water resources. The information gained from our monitoring programs helps with prioritizing the issues to be addressed and choosing the geographic areas in which to concentrate, thus ensuring the effective management of water resources.

9
How do we measure water quality? The ministry collects and analyzes tens of thousands of samples of water, sediment and aquatic life each year. The types of samples that are collected vary based on the objectives of each monitoring program. All water quality monitoring programs are designed based on the goal of the monitoring program. Design factors can include:
monitoring duration frequency timing location of sample collections data analysis interpretation and reporting
For example, water samples collected from Ontario’s lakes and streams are analyzed for phosphorus and nitrogen levels to assess the impacts of nutrient sources and the potential for excessive plant growth and algae blooms. For more information on how water quality samples are collected and analyzed, please see the Water Quality in Ontario 2008 Report (Chapter 2, pages 4-7). Additional innovative sampling strategies are also used in situations where conventional approaches are not enough. For example, the ministry's Great Lakes Nearshore Monitoring program uses a range of instruments moored in the lake over a survey season that collect real-time or remote information on circulation patterns, wave activity and other physical influences in the Great Lakes. Sensors such as the Acoustic Doppler Current Profilers (ADCPs) are placed in the lake for extended periods to measure water currents and wave action (Figure 2.1). The ministry has also deployed a monitoring buoy in Lake Ontario that collects a range of physical and water quality data that can be accessed in near real-time via the internet (Figures 2.2, 2.3). With this capability, the ministry can more closely monitor changing environmental conditions in the Great Lakes and improve our ability to understand and to manage emerging environmental issues. Ministry of the Environment’s responsibility for water quality monitoring The ministry’s Environmental Monitoring and Reporting Branch leads provincial-scale programs to monitor surface and groundwater quality across Ontario. Information on these monitoring programs can be found in the appendix. The ministry’s water monitoring activities are integrated with the sample analysis done at the ministry’s Laboratory Services Branch. Every year, thousands of water samples are analyzed in the ministry’s laboratories and tested for basic water quality parameters (pH and hardness for example) and for signs of

10
Figures 2.2 – 2.3: The Land Ocean Biophysical Observatory (LOBO), a real-time water quality monitoring buoy developed by Satlantic, a Canadian company specializing in oceanographic instrumentation, was deployed in Lake Ontario in 2008 and 2009.
Figure 2.1: An Acoustic Doppler Current Profiler (ADCP) being deployed on the lakebed of Lake Ontario for the 2009 survey season. Combined with other sensors that measure features such as water temperature, turbidity, oxygen, conductivity, chlorophyll a and levels of light for aquatic vegetation, longer-term information collected throughout the day over many months provides insight on dynamic features of water quality associated with storms and other events that can be difficult to capture with conventional field surveys.

11
pollution such as nutrients, metals (mercury and lead for example) and organic compounds (PCBs and pesticides for example). Analytical methods are continuously evolving to enable the detection and monitoring of contaminants of emerging concern such as pharmaceuticals and flame retardants.
Water quality monitoring partnerships Contributions from our partners are important to the success of the ministry’s monitoring programs. Valuable monitoring data could not be collected on such a wide scale without their help. The ministry works closely with our partners. They are specially trained to collect field observations and environmental samples according to established protocols, to make sure that results are comparable across the province. Partners include the federal government, other provincial ministries, municipalities, conservation authorities, the public, academic institutions and environmental organizations. Examples of our partnerships: Environment Canada – MOE Great Lakes Nearshore Monitoring Program Shared coordination of science and monitoring activities in the Great Lakes.
Ontario Ministry of Natural Resources (MNR) – MOE Sport Fish Contaminant Monitoring Program MNR and MOE collect sport fish from more than 1,950 locations across the province. Municipalities – MOE Drinking Water Surveillance Program (DWSP) Municipalities collect the samples. There are 110 water supplies in DWSP.
Lake Simcoe Region Conservation Authority (LSRCA) – MOE Lake Simcoe Monitoring Program Shared monitoring of Lake Simcoe and its watershed. LSRCA helped create a strong base of water quality information on Lake Simcoe, resulting in published reports on phosphorus levels and water quality. Volunteers – MOE Lake Partner Program Eight hundred dedicated volunteers monitor inland lakes across Ontario. They measure water clarity and collect water samples for total phosphorus analysis. For information on some of the ministry’s other programs and the partners associated with them see the appendix.

Highlight story: The Great Lakes field crew The 11.5-metre Great Lakes Guardian and its sister craft, the 8.6-metre Monitor VI, are research vessels specifically outfitted to collect water and sediment quality samples in the Great Lakes. As their names imply, the boats are used to gather data to help preserve a vast lake system that not only provides drinking water for one of North America’s most populous regions, but also supports power generation, recreation, agriculture and manufacturing. Both vessels conduct monitoring operations in deeper open waters, in shallower water close to shore, and in the inter-connecting rivers between the Great Lakes. These vessels are crewed by a capable field team led by Greg Hobson and Wendy Page (Figures 2.4 and 2.5). With over 40 years of joint experience, Greg and Wendy make sure that field data is collected regularly throughout the ice-free season, generally April to December. Rain or shine, Greg, Wendy and their team are on the water, collecting samples of water, sediment and aquatic life which are then analyzed to provide information on current environmental conditions. The samples collected provide valuable insight on the range of environmental conditions experienced during the ice-free season, often in real time. Over the course of their careers, Greg and Wendy have explored almost the entire length of the Canadian shoreline of the Great Lakes. The team travels from the southern tip of Lake Ontario to the far north of Lake Superior collecting valuable and reliable data. The environmental information they collect is essential for detecting adverse changes in the ambient condition of the Great Lakes, for tracking progress towards restoring Great Lakes Areas of Concern and for supporting policy development, abatement and/or enforcement activities.
12
Figures 2.4-2.5: Photographs of ministry personnel, Greg Hobson and Wendy Page of the Great Lakes field crew conducting field work on the Great Lakes.

3.0 Phosphorus Enrichment What is phosphorus?
Phosphorus (P): is an essential nutrient for plant and animal growth stimulates the growth of aquatic plants and algae, which provide food for
aquatic animals is the limiting nutrient in most water bodies because the availability of
phosphorus commonly controls the amount of plant and algae growth that can occur
Phosphorus exists in different forms in water. It can be dissolved, bound to particles of soil and other materials, or contained within living or decaying plants. Dissolved phosphorus is most readily used by plants and algae, and is typically found in low concentrations in unpolluted water bodies. Where does phosphorus come from? Phosphorus enters water from both natural processes and human activities.
Natural Processes Leading to Phosphorus in Water
Human Activities Leading to Phosphorus in Water
Weathering of rocks Erosion and runoff from agricultural lands that have been treated with P-containing fertilizers or manures or both
Erosion of soil Decay of organic material Deposition from the
atmosphere (e.g. pollen, dust) Discharges from sewage treatment plants
and septic systems Storm water runoff from urban areas Atmospheric deposition from the burning
of fossil fuels In the past, consumer products such as laundry detergents were a major source of phosphorus in water bodies. However, government regulations now control the amount of phosphates in laundry detergents. The ministry has also taken action to reduce phosphorus inputs to water from other major sources such as sewage treatment plants and industries. The government is also working with farmers to prepare nutrient management strategies (NMS), nutrient management plans (NMP) and non-agricultural source material (NASM) plans under the Nutrient Management Act, 2002 as part of the new agricultural operation requirements; this will help ensure the proper application of fertilizer and storage of nutrients on farm properties.
13

Why is too much phosphorus a problem? Excessive inputs of phosphorus to water bodies can disrupt the natural processes of a water system and its inhabitants. When the excessive loading of nutrients such as phosphorus results from human activities, it is called nutrient enrichment or eutrophication. This process can threaten aquatic habitats, spoil the natural beauty of lakes and streams, cause noxious algae blooms, and cause taste and odour problems in surface and drinking water. The phosphorus contamination cycle
1. A high concentration of phosphorus leads to extensive growth of plants and algae in the water.
2. Large amounts of organic material, caused by the algae, settle to the bottom of a water body and use up oxygen when they decompose (see Section 3.1)
3. Changes in the oxygen concentration in the water occur, harming aquatic habitats and animals.
4. As oxygen is used up, more phosphorus can be released from the bottom sediments. This exacerbates the problem by stimulating even more plant and algal growth.
5. Excessive algal growth from high concentrations of phosphorus can result in a “bloom”.
For more information, see the ministry’s fact sheet on blue-green algae
Algae and cyanobacteria blooms: can colour a water body green, brown or yellow reduce the clarity of water make the water taste and smell unpleasant can foul beaches by forming mats on the surface of a lake or clumps on
the bottom of a lake or lakebed may produce toxins, which can harm animals and humans
and Information for cottagers and home owners.
14

15
Acceptable phosphorus levels “Total Phosphorus” is a measure of all of the phosphorus in a water sample. The ministry has put in place objectives for acceptable levels of phosphorus, based on water type, to prevent excessive growth of aquatic plants. Accepted levels of phosphorus Inland Lakes Rivers and Streams Interim Provincial Water Quality Objective (PWQO) for total phosphorus of 20 µg/L (micrograms per litre, or parts per billion) in inland lakes
Interim Provincial Water Quality Objective (PWQO) for total phosphorus of 30 µg/L (micrograms per litre, or parts per billion) in rivers and streams
Precambrian Shield Lakes In May 2010, the ministry modified the interim PWQO for total phosphorus for Precambrian Shield lakes. The revised approach:
allows for a 50 per cent increase in the total phosphorus concentration of Shield lakes from a modeled baseline of the phosphorus concentration in the absence of human influence
enables each water body to have its own water quality objective, described with one number (i.e., “undeveloped” or “background” plus 50 per cent)
includes a cap of 20 µg/L of total phosphorus for lakes, which is the existing PWQO
Ontario does not currently set water quality objectives for phosphorus in the Great Lakes, but has been active in the binational effort to reduce Great Lakes phosphorus loadings. Ontario is supporting the review of the Canada-U.S. Great Lakes Water Quality Agreement, which includes phosphorus targets. Phosphorus monitoring results The ministry has several programs that monitor phosphorus in the Great Lakes, inland lakes and streams. For a review of past monitoring results, including general trends for phosphorus in Ontario’s surface water, please see the Water Quality in Ontario 2008 Report (Chapter 3.1). The trends presented in Chapter 3.1 of the 2008 report showed decreases in phosphorus levels in the Canadian Great Lakes and in Ontario’s streams and inland lakes. Most decreases occurred in the 1980s with the implementation of phosphorus reduction strategies. Phosphorus concentrations have also declined in lakes in undeveloped watersheds on the Canadian Shield, possibly due to acid deposition and climate change. Although phosphorus levels have improved since monitoring first began in Ontario’s surface water, there are still phosphorus related issues that need to be addressed. The rest of this chapter will focus on the current phosphorus-related issues
occurring in two inland lakes in Ontario—Lake Simcoe and Lake of the Woods—and in the Canadian side of the Great Lakes.
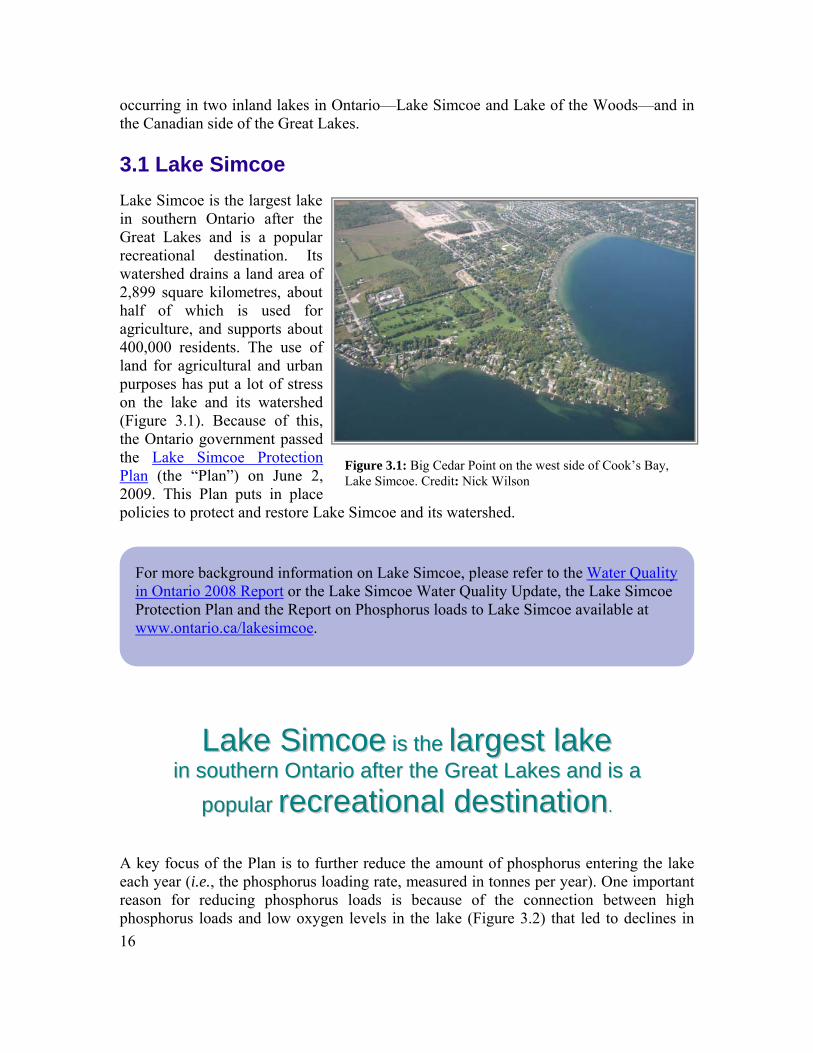
3.1 Lake Simcoe Lake Simcoe is the largest lake in southern Ontario after theGreat Lakes and is a popular recreational destination. Itswatershed drains a land area of 2,899 square kilometres, about half of which is used for agriculture, and supports about 400,000 residents. The use of land for agricultural and urban purposes has put a lot of stress on the lake and its watershed (Figure 3.1). Because of this,the Ontario government passed the Lake Simcoe Protection
16
Plan (the “Plan”) on June 2, 2009. This Plan puts in place policies to protect and restore Lake Simcoe and its watershed.
LLaakkee SSiimmccooee iiss tthhee llaarrggeesstt llaakkee iinn ssoouutthheerrnn OOnnttaarriioo aafftteerr tthhee GGrreeaatt LLaakkeess aanndd iiss aa
ppooppuullaarr rreeccrreeaattiioonnaall ddeessttiinnaattiioonn.. A key focus of the Plan is to further reduce the amount of phosphorus entering the lake each year (i.e., the phosphorus loading rate, measured in tonnes per year). One important reason for reducing phosphorus loads is because of the connection between high phosphorus loads and low oxygen levels in the lake (Figure 3.2) that led to declines in
For more background information on Lake Simcoe, please refer to the Water Quality in Ontario 2008 Report or the Lake Simcoe Water Quality Update, the Lake Simcoe Protection Plan and the Report on Phosphorus loads to Lake Simcoe available at www.ontario.ca/lakesimcoe.
Figure 3.1: Big Cedar Point on the west side of Cook’s Bay, Lake Simcoe. Credit: Nick Wilson

naturally occurring coldwater fish (e.g., lake trout) beginning in the 1960s. A target of 7 mg/L of oxygen was put in the Plan to improve the conditions for coldwater fish so that they can increase in numbers naturally. The Plan required the development of a Phosphorus Reduction Strategy for the Lake Simcoe watershed (available at www.ene.gov.on.ca/publications/7633e.pdf
17
), which was released in June 2010 and outlines the key actions that are needed to help reach this target.
Figure 3.2: A description of how lowering phosphorus loads results in more oxygen in the deepwater (#4). Less phosphorus coming into the lake leads to lower phosphorus concentrations in the lake (# 1), which should mean that there are fewer phytoplankton (#2). When phytoplankton die, they sink to the lake bottom and consume oxygen as they decompose, so fewer phytoplankton leads to less oxygen being used up and therefore more oxygen in the deepwater (#3). Before the Plan, actions were taken to reduce phosphorus inputs to Lake Simcoe starting in 1990. These efforts have helped to reduce phosphorus loading rates.9,10 In the 1980s and early 1990s, loads were about 100 tonnes/yr but in recent years have been about 70 tonnes/yr.11 These rates are still well above those estimated from the 1800s, which were closer to 30 tonnes/yr.9
Water samples have been collected from the lake to monitor the effect of the
phosphorus load reductions. (Figure 3.3)
3 2 1 Phosphorus loading rate
Phytoplanktonabundance
Deepwateroxygen
Phosphorusin the lake
4
Figure 3.3: A map of Lake Simcoe showing location of the Bays and the water treatment plants where water samples are collected.

18
With less phosphorus coming in from the watershed, significant decreases have been observed in spring phosphorus concentrations in the lake, as well as annual concentrations measured at the lake’s outflow and nearshore intake pipes of water treatment plants (Figure 3.4).12 Summer concentrations at the open lake stations have been more variable, with some declines occurring in the 1980s and 1990s. In response to the declines in phosphorus loads and lake concentrations, abundance of phytoplankton has also gone down over the past three decades, especially in the shallow Cook’s Bay at the south end of the lake (Figure 3.5)12. This reduction could also be partly due to zebra mussels (see Section 5.1 on invasive species in Lake Simcoe). With the reductions in phosphorus load, lake phosphorus concentrations and phytoplankton, we have seen an increase in deepwater oxygen levels (Figure 3.6)10,12. This has improved deepwater conditions for the coldwater fishes, but continued effort is needed because oxygen is not at the target level of 7 mg/L. Ministry scientists have estimated that the phosphorus load to the lake should be reduced to 44 tonnes/yr to achieve the 7 mg/L target for
0
5
10
15
20
25
30
35
1980 1985 1990 1995 2000 2005 2010
Phos
phor
us (u
g/L)
BeavertonKeswickGeorginaoutflow
Figure 3.4: Phosphorus concentrations at the intake pipes of three water treatment plants (WTPs) and the lake’s outflow.
0
200
400
600
800
1000
1200
1400
1980 1985 1990 1995 2000 2005
Phyt
opla
nkto
n bi
ovol
ume
(mm
3 /m3 ) Cook's Bay
Main BasinKempenfelt Bay
Figure 3.5: Total phytoplankton abundance at three lake stations, one representing each of its basins
0
1
2
3
4
5
6
7
8
9
1980 1985 1990 1995 2000 2005
deep
wat
er o
xyge
n (m
g/L)
Deepwater oxygen
5 year avg
Target
Figure 3.6: The minimum deepwater oxygen concentration by the end of the summer
deepwater oxygen. This goal is identified in the Phosphorus Reduction Strategy, and key actions have been outlined to help achieve it. This is important because while improvements have been made, further reductions in phosphorus loading are needed.
3.2 Lake of the Woods Lake of the Woods is an international water body shared by the Canadian provinces of Ontario and Manitoba, and the U.S. state of Minnesota. Among inland lakes in Ontario, Lake of the Woods:
19
is second only to Lake Nipigon in area has a hydrological complexity that is unmatched among Canadian lakes consists of hundreds of interconnected basins, more than 14,500 islands and
over 10,000 kilometres of shoreline including islands
provides benefits to thousands of local residents and tourists
is used for electricity generation, recreation and agriculture
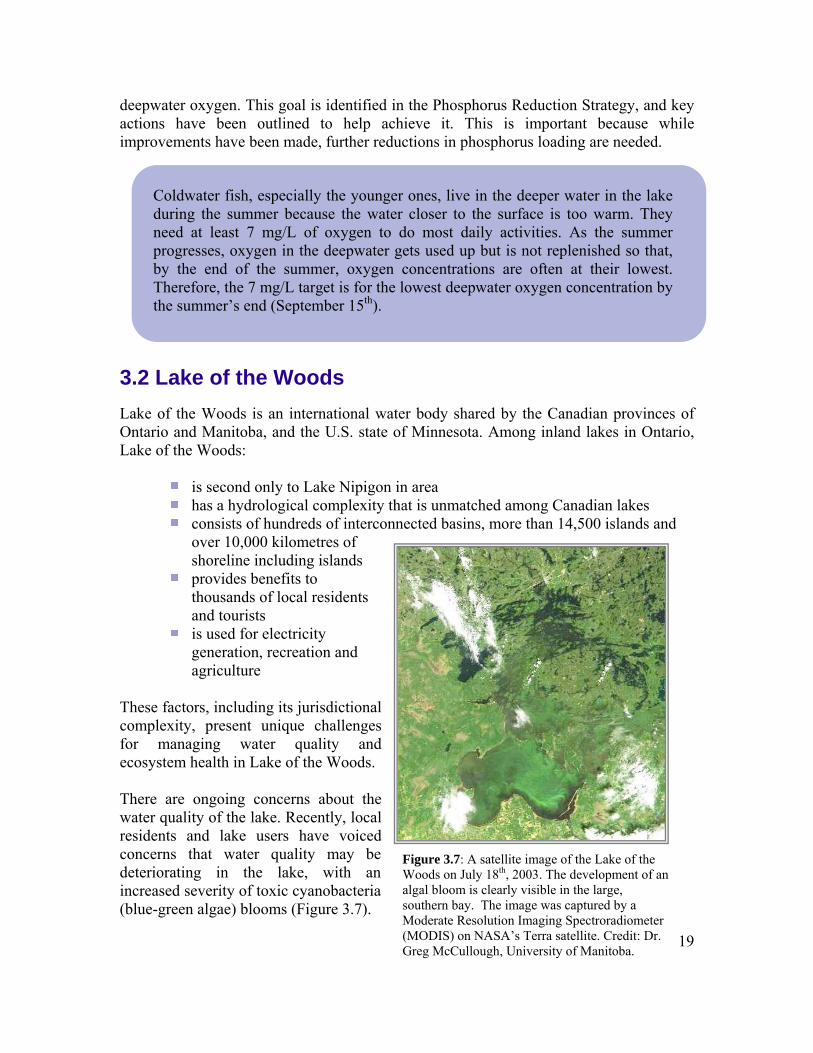
These factors, including its jurisdictional complexity, present unique challenges for managing water quality and ecosystem health in Lake of the Woods. There are ongoing concerns about the water quality of the lake. Recently, local residents and lake users have voiced concerns that water quality may be deteriorating in the lake, with an increased severity of toxic cyanobacteria (blue-green algae) blooms (Figure 3.7).
Coldwater fish, especially the younger ones, live in the deeper water in the lake during the summer because the water closer to the surface is too warm. They need at least 7 mg/L of oxygen to do most daily activities. As the summer progresses, oxygen in the deepwater gets used up but is not replenished so that, by the end of the summer, oxygen concentrations are often at their lowest. Therefore, the 7 mg/L target is for the lowest deepwater oxygen concentration by the summer’s end (September 15th).
Figure 3.7: A satellite image of the Lake of the Woods on July 18th, 2003. The development of an algal bloom is clearly visible in the large, southern bay. The image was captured by a Moderate Resolution Imaging Spectroradiometer (MODIS) on NASA’s Terra satellite. Credit: Dr. Greg McCullough, University of Manitoba.

20
In response to these concerns, new monitoring and research have been started by an international group of collaborators, including government agencies, academia, non-governmental organizations, and volunteers from the general public. Among other goals, these studies are aimed at measuring the relative importance of natural versus anthropogenic (human) sources of algal nutrients, such as phosphorus, to the lake. This work has identified a strong spatial gradient of water quality in Lake of the Woods, related to factors such as water depth and proximity to the Rainy River, the largest single contributor of phosphorus to the lake. Recent studies have shown that phosphorus concentrations are highest in southern bays in the lake, near the mouth of the Rainy River (Figure 3.8), and that algal blooms appear first in this region of the lake, in late summer. However, due to changing phosphorus concentrations throughout the summer months and between years, ongoing monitoring has been challenging.
Figure 3.8: Total phosphorus (TP) concentrations in the Lake of the Woods, organized by region within the lake (e.g., North central). There are notable differences in TP concentrations by region, with the highest concentrations occurring in the large, southern bays close to the mouth of the Rainy River.

21
3.3 Great Lakes The Great Lakes:
form the largest system of freshwater lakes in the world contain 20 per cent of the world’s fresh surface water contain 84 per cent
of North America’s fresh surface water
are replenished slowly—less than one per cent of the water in the Great Lakes is replenished each year13
provide over 70 per cent of Ontario’s drinking water
fuel our economy, assimilate our wastes, moderate our climate and
offer a source of recreation
Great Lakes monitoring
Phosphorus levels vary considerably from place to place in the Great Lakes. This variation is caused by regional and local differences in nutrient pollution (Figure 3.9), and differences in the geological morphology of the lake basins. Relative to Lakes Ontario and Erie, Lakes Superior and Huron are nutrient-poor and therefore less afflicted with lake-wide concerns caused by phosphorus enrichment such as nuisance algae. However, Lakes Superior and Huron are likely more sensitive to phosphorus enrichment at a local scale. Localized areas of phosphorus enrichment caused by human activity occur either adjacent to the activity or downstream of it where rivers carry phosphorus into the lakes. These differences in water quality make monitoring important on both a regional and local scale.
Figure 3.9: Annual average total phosphorus concentrations for 2005-2007 at stations in the Great Lakes Nearshore Reference and Index Station Network
The State of the Basin Report for the Lake of the Woods and Rainy River Basin esizes what is now known about the water
r quality information in this report, released in e for assessing future changes in response to
is a multi-agency report that synthquality of the lake. The wateMarch 2009, will serve as a baselinmanagement initiatives.

Great Lakes nuisance algae
Fouling of shoreline by Cladophora and other algae on the lakebed Fouling of the shoreline is associated with an overabundance of algae growing on the lakebed. In the Great Lakes, Cladophora, a single species of green algae, accounts for most of the incidents of shoreline fouling. Cladophora:
occurs naturally throughout the Great Lakes grows as branched filaments that attach to hard objects on the lakebed,
including rocks, mussel shells and breakwalls depend on a supply of phosphorus and adequate amounts of light reaching the
lakebed
In shallow areas of Lakes Ontario and Erie where habitat is suitable due to the presence of a rocky lakebed or the presence of zebra and quagga mussels, Cladophora has been found to completely cover the bottom of the lake, creating a “lawn” of algae that can be more than 10 centimetres thick (Figure 3.10). Periodically, Cladophora detaches from the lakebed and washes up on the shore (Figure 3.11). In recent years, the public and many scientists have noticed an increase in shoreline fouling by Cladophora. This apparent change is thought to be associated with the invasive zebra and quagga mussels. Zebra and quagga mussels, also called dreissenid mussels, may be creating ideal growing conditions for algae on the lakebed. This includes providing more light, more surfaces to attach to, and possibly an added phosphorus source. For more information see the Water Quality in Ontario 2008 Report (section 3.3 in the Phosphorus Management chapter).
Figure 3.10: Lawns of filaments of Cladophora covering the lakebed in the nearshore of Lake Ontario
22

23
Shoreline fouling by Cladophora and other algae species is considered an aesthetic problem. However, recent studies have documented a potential association of E. coli (a bacterium used as an indicator of faecal pollution) with Cladophora. The subject of microbial associations with Cladophora is an ongoing topic of research (see section 7.3 in the Issues on the Radar chapter). To date, there is little indication that Cladophora poses a health risk to humans.
Excessive growth of cyanobacteria, formerly called “blue-green algae”, is a problem in parts of the Great Lakes. In nutrient-rich conditions, cyanobacteria may grow quickly and concentrate on the surface of a lake (sometimes called blooms). The extent of cyanobacteria blooms seems to have increased in recent years. In the Great Lakes, heavy growth of cyanobacteria leading to blooms is usually limited to areas that are nutrient-enriched through human activity; however, not all nutrient-enriched locations experience cyanobacteria blooms and it is often difficult to determine which areas may be affected. In recent years, there have been blooms in mid- to late summer over parts of the Bay of Quinte, the western basin of Lake Erie (Figure 3.12), Hamilton Harbour and Sturgeon Bay (an embayment of northern Georgian Bay).
Figure 3.12: A true colour satellite image of the western basin of Lake Erie on September 12, 2009 at a time of heavy cyanobacteria growth. Note the light green coloration along the Ontario shoreline at the top of the image. The image was captured by a Moderate Resolution Imaging Spectroradiometer on NASA’s satellite. Credit: The Space Science and Engineering Center, University of Wisconsin-Madison. Image obtained from the National Oceanic and Atmospheric Administration (NOAA) Great Lakes Coastwatch
Cyanobacteria blooms
Figure 3.11: Fouling of shoreline by green algae Cladophora in Lake Ontario
website.

Apart from aesthetic concerns, some cyanobacteria produce toxic chemicals called cyanotoxins. The presence of blooms raises concerns that cyanotoxins may be present in the water. This poses risks for recreational activities on the water, for drinking water supplies, and for livestock and pets that drink straight from the water body. Monitoring by government agencies and academic researchers has confirmed the periodic production of cyanotoxins in areas of the Great Lakes including the Bay of Quinte, the western basin of Lake Erie and Hamilton Harbour. Cyanobacteria blooms are unpredictable, and this makes them challenging to monitor and study. Observations show that high phosphorus levels increase cyanobacteria growth. Several ministry programs monitor cyanobacteria in the Great Lakes. The year-round Great Lakes Intake Monitoring Program monitors the types and abundance of algae (cyanobacteria included) in water samples from selected municipal water intakes. Seasonal special surveys are done by the Drinking Water Surveillance
24
and Nearshore Water Quality Monitoring Programs to examine levels of selected cyanobacterial toxins (Figure 3.13). The ministry has developed a comprehensive protocol for responding to reports of cyanobacteria blooms, and works with partners such as the local Health Units to make sure that drinking water consumers and recreational users of the water are protected.
Figure 3.13: Sampling cyanobacteria blooms.

4.0 Toxic Substances What substances are toxic?
Naturally occurring substances such as heavy metals and cyanotoxins (mentioned in the earlier chapter), and human-made chemicals such as pesticides and industrial chemicals, may be toxic to organisms if exposure is enough to cause an adverse effect. An adverse effect may be an impact to the health, behaviour, reproduction, or even survival, of humans or of organisms in the environment. For some time, several chemicals have been known to be toxic at low environmental concentrations. Examples are pesticides such as dichloro-diphenyl-trichloroethane (DDT), and industrial chemicals such as polychlorinated biphenyls (PCBs). Such chemicals have been banned or are highly regulated in many jurisdictions including Ontario, Canada, and internationally under the United Nations Environment Program
25
. Many of these banned and regulated toxic chemicals do not easily break down and are therefore persistent or long-lived in the environment. They also do not dissolve easily in water and tend to accumulate in the organic matter in soils and sediments, and in fatty tissues of organisms. The accumulation in organisms is called bioaccumulation, and can result in the build up of chemical concentrations in fish, wildlife and humans to levels that can be harmful to human and ecosystem health. Once released into the environment, toxic substances are difficult and expensive to clean up, and remain a challenge in Ontario and in jurisdictions around the world. Many of these substances, such as DDT and PCBs, are man-made and have only been in existence for a relatively short time. Examples of naturally occurring toxic substances include polychlorinated dioxins and furans (PCDD/Fs) from burning of wood (through forest fires) and heavy metals such as mercury and arsenic. However, human processes such as chemical production, mining, and combustion, and subsequent use and disposal have allowed much larger amounts of these substances to enter the environment. In addition to environmental contamination from our historical use and production of chemicals such as DDT and PCBs, other chemicals have recently been identified as “chemicals of emerging concern”. Some chemicals of emerging concern have been shown to be persistent in the environment and have accumulated in organisms. Others break down more readily and are not persistent, but nonetheless continuously enter the environment through our waste streams due to ongoing use, resulting in continued exposures that may affect organisms.

26
Where do toxic substances come from? In the past, releases of toxic chemicals into air and water as emissions from industries, spills and pesticide applications were among the dominant sources of toxic chemicals in the environment. Government bans and restrictions have worked to limit the use of certain chemicals and pesticides. However, since many of the chemicals are persistent and difficult to break down, some amounts of the chemicals used are still present in the environment, in soils and sediments for example, and continue to redistribute between air, water, soil and organisms. Current regulatory efforts, such as Ontario’s Toxics Reduction Act, aim to further reduce the impacts of toxic substance emissions. This will be achieved by accounting for the use and creation of toxic substances, and examining ways to limit their emissions. Consumer use of chemicals included in pharmaceuticals and personal care products, in electronics and furniture, and in plastics and building products are increasingly found in the environment. Consumer use and disposal, rather than just industrial emissions are now major sources of such chemicals in the environment. For example, polybrominated diphenyl ether (PBDE) flame retardants enter the environment by leaching out of plastics, furniture, carpets and foam products into indoor and outdoor air. Pharmaceuticals and personal care products used by humans enter lakes and rivers via municipal wastewater treatment plants. Many of these chemicals tend to be more concentrated near urban areas, given the origin of their use. Some persistent, bioaccumulative and toxic substances, including PCBs, pesticides and PBDEs, can be carried long distances from their sources through the air in a process known as long-range transport. This results in some contamination in even the most remote lakes and streams in Ontario. How is the ministry monitoring toxic substances? The ministry routinely monitors for toxic substances in our environment by collecting and analyzing samples of water, sediment and fish tissue from lakes and streams across Ontario. Water monitoring is undertaken to:
see how much of the toxic substances are entering our lakes and streams monitor for pesticides in urban and agricultural areas identify ongoing sources of toxic substances, so action can be taken to reduce
or eliminate these sources
Long-term monitoring programs provide the scientific information necessary to: identify ongoing or emerging issues determine whether concentrations of toxic substances in the environment
exceed provincial guidelines or standards for the protection of humans, fish and wildlife
27
evaluate the effectiveness of regulatory actions and remediation efforts, and develop new policies and regulations
A partnership approach The Ministry of the Environment works closely with partner organizations to share scientific expertise and equipment, and to coordinate efforts in some of our environmental monitoring programs. For example: The Ontario Ministry of Natural Resources:
collects many of the fish that are analyzed for the Guide to Eating Ontario Sport Fish
Environment Canada:
monitors contaminants in the Canadian Great Lakes in conjunction with our ministry
Conservation Authorities:
conduct much of the stream water sampling across the province Other examples of partnerships include efforts to address contaminated sediments or sites, where the ministry works with Environment Canada and municipalities to assess the problem, guide remediation efforts and evaluate the effectiveness of these efforts. The ministry works to address issues such as emerging contaminants in collaboration with government and academic research partners from Ontario, Canada, and international universities and institutions. What is monitoring telling us about toxic substances? Many of the toxic substances that are included in monitoring programs tend to concentrate in sediments from lakes and rivers and in fish tissues. Long-term monitoring programs examining contaminant occurrence include sediment and fish to assess exposure and long-term trends. Examples of such programs are the Great Lakes Nearshore Monitoring Program and the Sport Fish Contaminant Monitoring Program. Results from these programs are highlighted below. Occurrence of toxic substances near urban areas Human land uses affect water quality through the alteration of stream flows, increased surface runoff, and inputs of nutrients and other chemicals, including toxic substances. These impacts are often more apparent in developed, urban areas where more of the chemicals are used and emitted. These trends are illustrated in Figure 4.1 and 4.2 for sediments collected from nearshore areas of the Great Lakes, and for stream water samples collected from urban streams in Ontario’s Greater Toronto Area (GTA) (Figure 4.3).

28
Polycyclic aromatic hydrocarbons (PAHs) (Figure 4.1). PAHs are mainly produced by burning fossil fuels such as oil, coal, diesel and gasoline for transportation, home heating and industry. Concentrations of PAHs in sediment collected from nearshore sites in the Great Lakes are highest next to locations where there are greater populations and major industries. This is particularly noticeable near the Hamilton and Toronto areas in Lake Ontario, and near the Detroit-Windsor corridor in Lake Erie. Following emissions to the air, often in very fine particles, some of the PAHs are deposited to nearby waters, air and urban surfaces such as roads, buildings and soils. A portion of the PAHs are washed from the urban landscape by stormwater intostreams or into sewage treatment plants, where most are captured but some are released to waterways. PolybrominPBDE flame retardants are found in plastics, electronics, household flooring and furniture, and have recently been subject to federal regulation. The highest sediment
concentrations were found in the lower Great Lakes nearest the urban centres in the Detroit - Windsor corridor, Niagara, Hamilton, Toronto and Kingston regions. PBDE concentrations are higher near urban areas, in part because they can leach out of products into the air. They can also be washed from products, along with dust and dirt, into our wastewater treatment facilities, where a small portion is released into nearby waters. PBDEs have properties that favour their accumulation in soils from air, or in sediment from water.
Figure 4.2: Concentrations (ng/g dry weight) of polybrominated diphenyl ether (PBDE) flame retardants in sediments from nearshore areas of the Great Lakes show that wide-scale use in materials and products result in greater amounts of these chemicals near urban areas.
ated diphenyl ether (PBDE) flame retardants (Figure 4.2).
Figure 4.1: Concentrations (ng/g dry weight) of polycyclic aromatic hydrocarbons (PAHs) in sediments from nearshore areas of the Great Lakes show that areas next to urban and industrial centres are more contaminated.

0
500
1000
1500
2000
2500
3000
Humber River nearKleinberg
Humber River inToronto
Don River in Toronto
Poly
cycl
ic A
rom
atic
Hyd
roca
rbon
s (P
AHs
) in
str
eam
s in
the
Toro
nto
Are
a (n
g/L
of
wat
er)
Dry WeatherWet Weather
0
4
8
12
Humber River nearKleinberg
Humber River inToronto
Don River in Toronto
Pol
ycho
rinat
ed B
iphe
nyls
(PCB
s)st
ream
s in
the
Toro
nto
Are
a (n
g/L
ofw
ater
)
16 in
Dry WeatherWet Weather
Urban streams (Figure 4.3).Greater concentrations of toxic substances are also found in streams and rivers that pass through urban areas. Sampling conducted in the GTA shows that stream water concentrations of PAHs and legacy contaminants such as PCBs are greater in highly urban areas than in upstream locations outside the city. Concentrations of PCBs and PAHs in rivers and streams are greatest during rain events, as the higher flows of water move soils, sediments and other particles containing these substances from areas within the watersheds.
Contaminant trends in sport fish The information collected as part of the Sport Fish Contaminant Monitoring program is published in the Guide to Eating Ontario Sport Fish
, which gives advice on how much fish of various sizes from a particular location may be eaten safely. PCBs and dioxins and furans (PCDD/Fs) are the major toxic substances of concern in Great Lakes fish, while mercury is the major substance of concern for many inland lakes. Long-term monitoring of chemical concentrations in sport fish from Ontario has shown that concentrations of toxic substances, particularly PCBs and PCDD/Fs in the Great Lakes, are generally decreasing. Figure 4.4(a) shows decreasing concentrations of PCDD/Fs in fish from the Great Lakes, especially Lake Ontario. However, lower levels
Figure 4.3: Polycyclic aromatic hydrocarbons (PAHs) and polychlorinated biphenyls (PCBs) are more commonly detected at higher concentrations in urban streams such as the Don River and Humber River, compared to streams in less urbanized areas, such as the headwaters of the Humber River, near Kleinburg, ON. During wet weather, higher water flows containing more soil and sediment carry more of these contaminants in the streams.
29

30
of contaminants remain due to the stable nature of these substances, their continued use in some applications, and the difficulty and cost of cleaning up contaminated areas. Mercury concentrations in fish from some of the Kawartha Lakes have stayed relatively stable over the years (Figure 4.4(b)). Concentrations of pesticides such as DDT (Figure 4.4(c)), toxaphene and mirex have decreased significantly and generally are no longer of concern. Heavy metals other than mercury generally do not accumulate in fish to an extent that would cause restrictions on human consumption. As Figures 4.4(d) shows, the concentrations of some metals in fish collected from Sudbury Lakes in 2004 were well below human consumption restriction levels. In sport fish from Lake Simcoe, contaminants such as PCBs and DDT have generally declined.14
4.4(a) 4.4(c)
0
500
1000
1500
2000
2500
1975 1980 1985 1990 1995 2000 2005Year
Tota
l DD
T in
60c
m L
ake
Trou
t fro
m th
e G
reat
La
kes
(ng/
g w
et w
eigh
t)
Lake Superior Lake Huron Lake Erie Lake Ontario
0
5
10
15
20
25
30
1975 1980 1985 1990 1995 2000 2005Year
Dio
xin
Toxi
c Eq
uiva
lenc
y (T
EQs)
in 6
0cm
La
ke T
rout
and
45c
m L
ake
Whi
tefis
h fr
om th
e G
reat
Lak
es (p
g/g
wet
wei
ght)
Lake Ontario Lake SuperiorLake Erie (Lake Whitefish) Lake Huron
0 meals/month
1 meal/month
8 meals/month
4 meals/month
2 meals/month
4.4(b) 4.4(d)
0.0
0.1
0.1
0.2
0.2
0.3
0.3
0.4
0.4
AshigamiLake
Long Lake MasseyLake
McFarlaneLake
RamseyLake
VermilionLake
WhitsonLake
Ars
enic
, cop
per a
nd n
icke
l in
45cm
Wal
leye
fr
om S
udbu
ry L
akes
(200
4) (µ
g/g
wet
w
eigh
t)
0
0.5
1
1.5
2
2.5
3
3.5
Sele
nium
in 4
5cm
Wal
leye
from
Sud
bury
La
kes
(200
4) (µ
g/g
wet
wei
ght)
Arsenic Copper Nickel dummy4 Selenium
0
0.1
0.2
0.3
0.4
0.5
0.6
0.7
0.8
0.9
1
1970 1975 1980 1985 1990 1995 2000 2005Year
Mer
cury
in 4
5cm
Wal
leye
in fo
ur O
ntar
io
(Kaw
arth
a) L
akes
(µg/
g w
et w
eigh
t)
Buckhorn Lake Stony Lake Lake ScugogBalsam Lake Rice Lake
General Population
Consumption Limit
Sensitive Population
Consumption Limit
Figure 4.4: Contaminant concentrations in sport fish from the Great Lakes and inland Lakes. (a) Dioxin Toxic Equivalency (TEQ) concentrations in Great Lakes fish (45cm lake whitefish from Lake Erie and 60cm lake trout from the other lakes). Consumption limits (recommended meals/month) are indicated by the dashed lines; (b) Total mercury in 45cm walleye from four Ontario (Kawartha) inland lakes. Consumption limits for the general and sensitive populations (women of childbearing age and children under 15) are indicated by the solid lines; (c) Total DDT concentrations (sum of metabolites) in 60cm lake trout from the Great Lakes have declined and are much lower than consumption limits; (d) Metal concentrations in 45cm walleye from these seven Sudbury Lakes are below consumption limits.

As the environment is affected by changing land uses, increasing urban development,
im
t Muddy Creek nada-U.S. Great
Re l ed “beneficial use
im
invasive species and climate change, ongoing monitoring will show how these changes pact the degree of chemical contamination in our lakes, streams and wildlife.
4.1 Delisting of Wheatley Harbour Area of Concern (AOC)
Wheatley Harbour is a major commercial fishing harbour located on the north shore of Lake Erie (Figure 4.5). In 1985, Wheatley Harbour and the adjacenWetland (Figure 4.6) were designated an Area of Concern under the CaLakes Water Quality Agreement (as amended in 1987). In 1987, a Wheatley Harbour
medial Action Plan (RAP) process was started to address and restore the beneficiauses of the harbour that were deemed impaired (also term
pairments”).
Beneficial use impairments within the AOC included: restrictions on fish and wildlife consumption degradation of fish and wildlife populations restrictions on dredging activities eutrophication or undesirable algae loss of fish and wildlife habitat
Figure 4.5: Orthophoto map of Wheatley Harbour AOC Orthophoto courtesy of Essex Region Conservation Authority
31

The first Wheatley Harbour RAP team was formed in 1988 consisting of representatives from Environment Canada and the Ontario government, including ministries of the Environment, Natural Resources and Agriculture, Food and Rural Affairs. The RAP team was led by the Ministry of the Environment. In 2004, the Wheatley Harbour Implementation Team led by both the Ministry of the Environment and Environment Canada was formed to oversee the RAP and coordinate the remaining priority actions needed for delisting. PCB Contamination in Wheatley Harbour One of the environmental issues to address in the AOC was PCB contaminated sediment. Extensive study and assessment showed that over time, PCB levels have declined in the harbour area of this AOC. This decline is likely due to the ban on the use of PCBs in 1978, efforts of the local industry to upgrade their waste treatment processes, and routine navigational dredging of the harbour, which resulted in the removal of historical accumulations of PCBs. However, elevated PCB levels in sediment were observed in a small area on the northern side of Muddy Creek. The concentrations were well below the Provincial Sediment Quality severe-effect-level and no active sources of PCBs were found. Sediment core samples taken in Muddy Creek revealed higher PCB levels in the deeper sediment which were naturally buried with cleaner material. Current PCB concentrations in the surface sediment and young-of-year fish were found to not pose a risk to piscivorous (fish eating) fish and wildlife.15 Improvements in Wheatley Harbour The environmental conditions of Wheatley Harbour have improved significantly since its designation as an AOC. These include:
improvements in water
clarity reduced bacterial
contamination dissolved oxygen
conditions now meeting the Provincial Water Quality Objectives
no AOC-specific fish consumption restrictions
no reports of persistent algal blooms or nuisance algae no restrictions to dredging activities as contaminant levels have decreased extensive habitat restoration and remediation activities have resulted in
increases in habitat quantity
Figure 4.6: Picture of Muddy Creek
32

33
The provincial and federal governments submitted the Wheatley Harbour Area of Concern Remedial Action Plan Stage 3 Report (or de-listing report) to the International Joint Commission for their review. The International Joint Commission endorsed the report’s recommendation to remove Wheatley Harbour from the list of Great Lakes Areas of Concern. On April 16, 2010, Wheatley Harbour was officially delisted. It is the fourth Great Lakes AOC to be removed from the list, three of which are located in Canada. 4.2 Pesticides Pesticides are:
chemical compounds used to control weeds, insects and other pests released into the environment primarily through their application to
agricultural lands and from non-agricultural applications in forests, urban areas, on golf courses, and along roads and other rights-of-way
transported through the atmosphere or can move through the hydrologic system to streams, lakes and groundwater
The following factors influence pesticide concentrations in the environment:
timing, amounts and methods of pesticide application properties of the pesticides applied (solubility, persistence) characteristics of watersheds (soils, land uses) hydrological conditions (rainfall, runoff)
The amount of pesticides used is generally the most important factor. Canada evaluates pesticides before registering them for sale and use. Evaluations determine pesticide risk to human health and the environment, and pesticide efficacy. Pesticides are re-evaluated periodically in light of new scientific information to ensure their use does not present an unacceptable risk. Some highly toxic pesticides (e.g., DDT) have been banned or phased out because of the evaluation process. Pesticides that are now in use are less persistent and less bioaccumulative; however, they have the potential to affect aquatic ecosystems if they occur at elevated levels. Water quality criteria, such as the Canadian Water Quality Guidelines and Provincial Water Quality Objectives, have been developed to assess the potential impacts of pesticides on aquatic life. Also, research is ongoing to assess the impacts of pesticide mixtures (two or more pesticides) on aquatic life, since some combinations of pesticides can be more toxic than individual pesticides.

According to a recent survey by the Ontario Ministry of Agriculture, Food and Rural Affairs (OMAFRA), over 4,800 tonnes of pesticides were applied to agricultural crops in Ontario in 200816. The survey also shows that there has been a 45 per cent reduction in total agricultural pesticide use in Ontario over the last 25 y
Pesticides in urban streams
On April 22, 2009, the Ontario government banned the sale and use of pesticides for cosmetic purposes.
Pesticides ban details
pesticides banned for use on lawns, vegetable and ornamental gardens, patios, driveways, cemeteries, and in parks and schoolyards
more than 250 pesticide products banned for sale cosmetic uses of more than 80 pesticide ingredients prohibited certain exceptions were allowed, such as controlling West Nile virus or poison
ivy
One of the expected outcomes of the cosmetic pesticides ban is lower concentrations of the banned pesticides in the environment. The recent ministry report, Changes in Urban Stream Water Pesticide Concentrations One Year after a Cosmetic Pesticides Ban, examined pesticide concentrations in 10 urban streams across Ontario before and after the ban (summer 2008 and summer 2009) (Figure 4.7)17. Samples were tested for over 105 pesticides and degradates (a product of pesticide breakdown). Results show that many pesticides and degradates were detected in urban stream water samples, but concentrations seldom exceeded water quality guidelines for the protection of aquatic life. Herbicides 2,4-dicholorophenoxyacetic acid (2,4-D) and methylchlorophenoxypropionic acid (MCPP), used to control lawn weeds, were among the most often detected pesticides in urban stream water samples. Average concentrations of these herbicides decreased by 86 per cent and 78 per cent respectively between 2008 and 2009, leading to the cautious
ears.
Figure 4.7: Water samples collected from an urban stream are prepared for shipment to the laboratory.
34

35
0.0
10.0
20.0
30.0
40.0
50.0
60.0
70.0
80.0
90.0
100.0
1986
1987
1988
1989
1990
1991
1992
1993
1994
1995
1996
1997
1998
1999
2000
2001
2002
2003
2004
2005
2006
Year
Perc
enta
ge o
f Sam
ples
with
One
or M
ore
Pest
icid
e D
etec
tions
Raw surface water
Treated surface water
conclusion that reductions in cosmetic pesticide use resulted in lower concentrations in streams. While the overall trend showed decreasing pesticide levels in urban streams, concentrations of some pesticides did not change after the cosmetic pesticides ban. The study continues to track changes in pesticides concentrations and further explore the influence of the cosmetic pesticides ban. Pesticides in Ontario’s treated municipal drinking water Pesticides are recognized as an important potential contaminant of drinking water quality as half of the chemical standards in the Ontario Drinking Water Quality Standards (ODWQS) are for pesticides. The recent ministry report, Pesticides in Ontario’s Treated Municipal Drinking Water, 1986-2006, examined the occurrence of pesticides in Ontario’s treated drinking water. The report focused on pesticide detection rates at surface water systems and groundwater systems. Data used in this study were from the Ministry of the Environment’s Drinking Water Surveillance Program (DWSP) and the Ministry of the Environment’s Drinking Water Inspection/Compliance Program. DWSP is a scientific monitoring program operated in partnership with municipalities. One focus of the program is non-regulated drinking water quality parameters, including emerging contaminants. DWSP routinely monitors 270 physical, chemical and radiological water quality parameters, including 104 pesticides. See the appendix for more information on DWSP. The Drinking Water Inspection/Compliance Program does annual inspections of municipal drinking water systems to determine compliance with the Safe Drinking Water Act. Pesticide trends From 1986 to 2006, the pesticide detection rate in treated surface water dropped from 86 per cent to three per cent (Figure 4.8). The trend in raw surface water was very similar; therefore the drop in the treated water detection rate was due to a decrease in source water pesticide concentrations rather than to improved treatment.
Figure 4.8: Pesticide detection rates in raw and treated surface water, 1986-2006

36
0.0
10.0
20.0
30.0
40.0
50.0
60.0
1986
1987
1988
1989
1990
1991
1992
1993
1994
1995
1996
1997
1998
1999
2000
2001
2002
2003
2004
2005
2006
Year
Perc
enta
ge o
f Sam
ples
with
Pest
icid
e D
etec
t 70.0
80.0
90.0
100.0
One
or M
ore
ions
Treated surface water
Treated groundwater
Most of the decline was due to the decrease in the occurrence of the pesticide alpha-HCH (alpha-hexachlorocyclohexane) and to a lesser degree lindane (gamma-HCH). Alpha-HCH and gamma-HCH were both components of insecticide formulations. Inthe 1970s, Canada and the U.S. banned the main product containing alpha-HCH and started phasing out gamma-HCH. Gamma-HCH was finally banned in 2005 for all but pharmaceutical use. For most of the period fromgroundwater was in the range zero to seven per in treated groundwater were generally much lower than detection rates in treated surface water, but the gap between them steadily decreased. In 2001 and 2006, detection rates in treated groundwater were slightly higher than those in treated surface water. Exceedances of drinking water quality standards From 1986 to 2006, there were only four exceedances of the Ontario Drinking Water Quality Standards for pesticides from over 16,000 samples of treated drinking water. Two of the exceedances were of atrazine and two were of terbufos. Atrazine is an agricultural herbicide commonly used to control broadleaf weeds. In 2003, atrazine was the third most heavily used agricultural pesticide in Ontario. Terbufos is an agricultural insecticide and nematicide. The atrazine exceedances occurred at systems drawing water from a river with a largely agricultural watershed. The terbufos exceedances occurred in a groundwater system that was under the direct influence of surface water. The exceedances all occurred at systems in southwestern Ontario, the region of Ontario with the highest agricultural use of pesticides. The last exceedance occurred in 2001. The systems at which the exceedances occurred have switched to better quality water sources.
1987 to 2006 the pesticide detection rate in treated cent (Figure 4.9). Pesticide detection rates
Figure 4.9: Pesticide detection rates in treated surface water and groundwater, 1986 - 2006

Pesticides in treated drinking water from surface water sources, 2001-2006 Seventeen pesticides and two pesticide degradates were detected in treated surface water. Of these, eleven have an Ontario drinking water quality standard and only one - atrazine - was detected above its standard (once). The other ten were detected well below their respective standards. Atrazine was the most frequently detected pesticide in treated surface water. Atrazine and its degradate de-ethylated atrazine together accounted for 66 per cent of pesticide detections in treated surface water. The surface water systems with the highest pesticide detection rates were in southwestern Ontario, the southeast corner of Ontario and along the lower Great Lakes and St. Lawrence River (Figure 4.10).
As reported by the Ontario Ministry of Agriculture, Food and Rural Affairs18, southwestern Ontario and the southeast corner of Ontario were the areas of highest agricultural pesticide use. High detection rates in drinking water from Lake Erie, Lake Ontario and the St. Lawrence River may have resulted from being downstream of agricultural and urban pesticide inputs into the Great Lakes. They may also have resulted from tributary river discharges in those areas.
Figure 4.10: Pesticide detection rates in treated surface water, 2001-2006
37

38
Pesticides in treated drinking water from groundwater sources, 2001-2006 Most groundwater systems had no pesticide detections in treated water (Figure 4.11). Seventeen pesticides and one pesticide degradate were detected in treated groundwater. Of these, fourteen have Ontario Drinking Water Quality Standards (ODWQS) and all detections were well below their respective standard. 2,4-D was the most frequently detected pesticide in treated groundwater. Unlike treated surface water, atrazine was rarely found in treated groundwater.
4.3 Arsenic in Groundwater in Ontario
How do we monitor groundwater quality?
Groundwater is the water that occupies the pore spaces and fractures in geological formations. Aquifers are geological formations that can both store and readily supply water for various purposes. Ontario has a Provincial Groundwater Monitoring Network (PGMN), that consists of more than 450 monitoring wells located throughout the province. These wells, carefully selected to measure representative groundwater conditions in various regions, provide scientific information on groundwater quality and levels. The information that is collected helps us understand groundwater conditions across the province.
Figure 4.11: Pesticide detection rates in treated groundwater, 2001-2006

39
Ambient groundwater chemistry information collected through the PGMN program is shared with local health units and Conservation Authorities, ensuring vital information on groundwater conditions, including any proper precautionary testing and treatment options, is shared with the public. While PGMN monitoring wells do not supply water, they do provide information on the aquifers that often serve water supply wells. Groundwater quality is also monitored at selected municipal drinking water systems under the Drinking Water Surveillance Program, which provides information on the quality of raw (untreated) water and treated drinking water. The raw water quality data can be used to assess ambient environmental conditions, and complements the information collected by the PGMN. What is arsenic and where does it come from?
Arsenic is a semi-metallic element that generally occurs in small concentrations in naturally occurring geological materials. Arsenic concentrations vary among different rock types. Arsenic also occurs in some manufactured materials, such as wood preservatives, animal feed additives and some medicines. It is important to monitor arsenic levels in water because it is a known carcinogen and can accumulate in internal organs, skin, hair and nails. As such, arsenic is one of many parameters monitored in groundwater under the PGMN. The Ontario Drinking Water Quality Standard for arsenic is 25 ug/L. Elevated arsenic concentrations in water can be reduced by water treatment technologies, such as:
iron oxide filters reverse osmosis distillation activated alumina filters anion exchange nano-filtration
How does arsenic get into groundwater? For arsenic to become dissolved in groundwater, the groundwater must come into contact with sources of arsenic long enough, and under the right chemical conditions, for it to dissolve and stay dissolved in the water. The solubility and movement of arsenic in groundwater depends primarily on the chemical conditions of the groundwater as well as the presence of other minerals, such as iron hydroxide and sulphides. These and other key factors influence the dissolution, transport and precipitation or absorption of arsenic in groundwater. Arsenic can sometimes also occur in groundwater at elevated levels after the draining of water from mine tailings, which can contain relatively high concentrations of arsenic.

40
What do we know about arsenic in groundwater in Ontario? Early findings from the PGMN indicate that, in general, typical arsenic concentrations in the PGMN wells in southern Ontario are far below the current Ontario Drinking Water Quality Standard of 25 ug/L (Figure 4.13). Although there are very limited PGMN wells located in northern Ontario, existing PGMN wells have generally reported relatively low concentrations of arsenic, which are below the current ODWQS. Early findings also indicate that, in general, southwestern Ontario has a wider range of arsenic concentrations in groundwater compared to southeastern Ontario (Figure 4.12), with a few PGMN wells reporting arsenic concentrations in the 10-25 ug/L range. The relatively higher arsenic concentrations observed in groundwater in southwestern Ontario are found within some relatively deep artesian aquifers located greater than 15 metres below the surface. Concentrations of arsenic observed in PGMN wells are thought to be the result of naturally occurring conditions.
Figure 4.12: Arsenic concentration in Provincial Groundwater Monitoring Network wells in southern Ontario

5.0 Invasive Species
Many of our lakes and streams have become home to many invasive species.
What are invasive species? Non-native (also known as introduced, foreign, alien or exotic) species are plants, animals or microorganisms introduced accidentally or deliberately by human actions into areas outside their normal range. Invasive species are those non-native species whose introduction and spread affect the environment, the economy and human and aquatic health. Invasive species pose a serious threat to global biodiversity and are one of the leading causes of native species becoming rare, threatened or endangered. In the Great Lakes alone, nearly 200 aquatic species are non-native. About 10 per cent of them are considered invasive19 and they include zebra and quagga mussels, the sea lamprey, the spiny water flea and the round goby. These species are a burden on the Great Lakes basin from an ecological, social and economic standpoint.19 For example, in the lower Great Lakes the native freshwater mussel population has been almost wiped out by zebra and quagga mussels.19 The filter-feeding activity of zebra and quagga mussels increases water clarity. This in turn creates a favourable environment for the growth of undesirable plants and algae on the lakebed. Similarly, Diporeia (a freshwater, shrimp-like organism) is in decline due to invasive mussels. Invasive species have affected water supplies, fisheries, and the natural ecosystems of our lakes. How are invasive species introduced? Most aquatic invasive species are introduced accidentally by human activities such as:
shipping, specifically the release of ballast water from ships and the attachment of foreign organisms to the ship’s hull (i.e., hull-fouling) and their eventual release into ports; most exotic species introductions first occurred this way
use of non-native species as live bait for fishing (e.g., round goby)
opening of canals and waterways; for instance, the number of invasive species in the Great Lakes increased markedly after the opening of the St. Lawrence Seaway in 1959
the movement of recreational boats from one water body to another
For more information on preventing the spread of invasive species, please visit the Ministry of Natural Resource’s website on Invasive Species: Taking Action.
41

42
scientific support to MNR through our monitoring programs. Several of the ministry’s programs monitor for the occurrence and spread of aquatic invasive species in Ontario’s waters. For example, the Great Lakes and Lake Simcoe Units routinely sample lake stations for the presence and spread of aquatic invasive species such as the spiny water flea. Also, the ministry supports research on invasive species through partnerships with universities. One such partnership is with York University. It examines the spread of the spiny water flea in Canadian Shield lakes and its impact on the food webs of those lakes. 5.1 Invasive Species in Lake Simcoe Many invasive species in Lake Simcoe arrived on boats from other lakes (the Trent-Severn Waterway for example) or were released from bait buckets or aquaria. Plants (eurasian watermilfoil and curly-leaf pondweed), zebra and quagga mussels, crustaceans (spiny water flea and rusty crayfish) and fishes (common carp, rain- bow smelt, black crappie, bluegill and round goby) are known to be in the lake.20
These invaders can dramatically alter the lake’s ecosystem and may have done so already.
Scientists estimate that 65 per cent of aquatic invasive species in the Great Lakes have been introduced by ocean-going ships.
Figure 5.1: Eurasion watermilfoil along the shoreline of Thorah Island in Lake Simcoe. © Lake Simcoe Region Conservation Authority.
How is the ministry monitoring aquatic invasive species? The Ontario Ministry of Natural Resources monitors and researches invasive species and develops policies and regulations on them. The Ministry of the Environment provides

Below is a list of some of the invaders in Lake Simcoe, when they were first seen in the lake and their possible effects to the lake:
43
1980
1984
1988
1992
1996
2000
2004
2008
Secc
hi d
isk
dept
h (m
)
0
2
4
6
8 Main BasinCook's BayKempenfelt Bay
zebra mussels
Invasive Species Date First Possible Effects Seen in Lake
Rainbow smelt 1962 Possibly responsible in part for declines in native planktivorous fishes in Lake Simcoe21
Eurasion watermilfoil (Figures 5.1-5.2)
1985 Can interfere with swimming and fishing and has caused increases in mosquito populations in other water bodies22
Zebra mussel Early 1990s Partly responsible for declines in phytoplankton23 (see Section 3.1) and other suspended particles in Lake Simcoe (Figure 5.3) Fewer particles in the water have helped make the lake clearer, allowing more light to reach the bottom of the nearshore areas of the lake where there has been excessive growth of aquatic plants24
Spiny water flea
Fall 1993 Appears to have reduced the numbers and types of native zooplankton species in Lake Simcoe, as it has in other Ontario lakes
Rusty crayfish and round goby
2004 and 2006 May be a factor preventing the natural lake trout respectively population from sustaining itself in Lake
Simcoe
It is very important to protect Lake Simcoe from the negative effects of invasive species. The Lake Simcoe Protection Plan recommends that further invasions be prevented and outlines several policies for education and outreach, development of potential regulations, risk assessments, and research.
Figure 5.2: Researcher from the LSRCA sampling Eurasion watermilfoil near Thorah Island in Lake Simcoe. © Lake Simcoe Region Conservation Authority.
Figure 5.3: Water clarity (measured as secchi disk depth) in three lake stations, one representing each of its basins.

5.2 Zebra and Quagga Mussels in the Great Lakes Dreissenid mussels (zebra and quagga mussels) colonized the Great Lakes more than two decades ago, resulting in strong modifications in the ecology of coastal areas throughout many parts of the lakes. While dreissenid mussels are often called zebra mussels, it is the more abundant quagga mussel that dominates many areas, having displaced zebra mussels. The similar looking zebra and quagga mussels have comparable biological features; however, quagga mussels have a greater tolerance to low water temperatures than zebra mussels, resulting in an expanded distribution and increased abundance of quagga mussels over the lakebed in deeper and colder water. More invasive species have arrived since dreissenid mussels first colonized the lakes, thereby exerting further pressures on the lake ecosystem, and sometimes (as with the lakebed-inhabiting round goby) acting in concert with dreissenid mussels. Zebra and quagga mussels stand out among recent invaders because of how they have modified the construction of the lakebed and modified the structure of the food web both near the shore and in the deeper portion of the lake. Layers of mussels cover the lakebed in many areas of the Great Lakes (Figure 5.4). For example in 2008, 47 per cent of the lake bottom in coastal areas of Lake Ontario was covered by dreissenid mussels, most of which were quagga mussels.
Effects of zebra and quagga mussels include:
increased water clarity reduced food availability for other native species increased stability and hardness of the lake bottom over areas where the
substrate is soft and susceptible to being disturbed by water movement creation or loss of habitats for other species of animals and plants due to
lakebed alteration increased retention of biological material and nutrients on the lakebed which
may lead to growth of problem algae (e.g., Cladophora) Recently, scientists from the ministry, in cooperation with other scientists from Canada and the United States, began a detailed study of the coastline of Lake Ontario aimed at better understanding the linkages between the ecology of the lake and water quality in coastal areas. As part of an intensive year of monitoring in 2008, biological surveys of the nearshore lakebed were conducted to better understand the influence of dreissenid-infested lakebeds on water quality. Findings from this ongoing study will be reported in a future water quality report.
Figure 5.4: Lakebed of Lake Ontario taken in 2008 illustrating mats of dreissenid mussels, most of which are quagga mussels.
44

6.0 Climate Change What is climate change?
Since the start of the industrial revolution, humans have been adding large amounts of greenhouse gases to the atmosphere, mainly by burning fossil fuels such as coal, oil and natural gas. Greenhouse gases, such as carbon dioxide, methane and nitrous oxide, trap radiation from the sun in the lower part of the Earth’s atmosphere. As the amount of greenhouse gases in the atmosphere increases, the amount of solar radiation that is trapped also increases, which raises temperatures. This is known as the “greenhouse effect” and the resulting increase in temperature is called “global warming.” When global warming affects weather patterns, it is called “climate change.” Climate change is a long-term shift in the typical weather conditions at a given location. It is measured by temperature, amounts and intensity of precipitation (rain and snow) and wind patterns.
Will Ontario’s water quality be affected by climate change? Climate change is already having an effect on Ontario’s water quality and further changes are expected to occur. Two areas the ministry is focusing on include the effects of climate change on Lake Simcoe, the largest inland lake in southern Ontario, as well as its effects on the far north of the province. A new study in the north may offer evidence of how warmer water temperatures influence lake ecosystems in this region. For more information on the effects of climate change and Ontario’s Action Plan on Climate Change, please visit the Ministry of the Environment’s website on Climate Change. To learn what you can do to reduce greenhouse gas emissions please visit Additup. Expected and observed effects of climate change on Ontario’s aquatic ecosystems
Climate change is expected to have many effects on Ontario’s lakes, streams and groundwater ecosystems.
Air temperatures in northwestern Ontario are the warmest they have been in more than a hundred years of instrumental record keeping.
45

46
Lake ecosystems may have longer open-water seasons because of earlier thawing and later freezing of lake ice.25 They may have lower water levels because of increased evaporation caused by drier and warmer conditions.25 This may in turn change the distribution of fish and other aquatic organisms. For example, warm water species such as smallmouth bass and bluegill are likely to expand northward in response to warmer water temperatures, while cold water species such as lake trout and lake whitefish will likely decline.26 Stream and wetland ecosystems may see a change in the timing and magnitude of stream flows due to earlier ice breakup and earlier peaks in spring runoff. Increases in heavy rainfall may also cause more frequent flooding.26 As a result, we may see a reduction in stream habitat (e.g., safe breeding sites) for wildlife due to changes in the timing and severity of flood events.26 Groundwater ecosystems may see reduced rates of groundwater recharge from melting snow due to decreases in precipitation that falls as snow, leading to a reduction in groundwater contributions (baseflow) to streams. This could lower the capacity of streams to assimilate runoff from the landscape and from discharges from sewage treatment plants. A drop in the groundwater table could also affect aquatic habitat, particularly for species such as brook trout that depend on groundwater inputs to streams. As indicated, climate change is expected to affect Ontario’s aquatic ecosystems in many ways. However, in the more southerly regions of Ontario, lake and stream ecosystems are also being altered by human disturbances such as:
urbanization agricultural growth the introduction of invasive species acidification
The effects of climate change can become blurred and difficult to measure as these disturbances can mask or override climate signals. For more information, see the Water Quality in Ontario 2008 Report (Chapter 6, pages 43-44). However, in regions of Ontario where human disturbances are minimal, such as the remote areas of northwestern Ontario, the impacts of climate change on aquatic ecosystems are clearer. What is monitoring telling us?
The ministry’s long-term monitoring programs are helping us understand and document the effects of climate change on aquatic ecosystems across the province, in areas both heavily and minimally affected. For heavily affected areas, the ministry’s monitoring activities are essential to understanding how the consequences of a changing climate are interacting, and will continue to interact with other environmental stressors to alter water quality.

47
For minimally affected areas, monitoring efforts are helping to separate the effects of climate change from the effects of land-use activities. These monitoring activities:
support our ability to make realistic forecasts of the future effects of climate change on aquatic ecosystems
help us make plans to protect water quality are crucial in identifying impacts associated with climate change and in
developing plans to adapt The rest of this chapter features recent work from our monitoring programs, illustrating the effects of climate change on water quality in Ontario, and adding to the existing body of evidence presented in the Water Quality in Ontario 2008 Report (Chapter 6). 6.1 Climate Change Effects on Lake Simcoe Climate change is expected to have major physical and biological effects on aquatic ecosystems. For example, the impact of climate change on Lake Simcoe can be seen by looking at the ministry’s long-term measurements of water temperature at Lake Simcoe. Water temperature measurements taken at representative stations from 1980 to 2008 were examined to look at changes to the thermal structure of the lake and relate it to observed increasing air temperature. Results indicate that the length of the stratified period has been increasing over time, corresponding to increases in air temperature. Lake Simcoe is a dimictic lake, meaning it mixes twice per year; once in the spring when the snow and ice melt and wash into the lake, and once in the fall as the lake begins to cool in response to cooling air temperatures. After mixing in the spring, the sun heats the surface waters of the lake and the temperature of the water begins to increase. The sun’s rays do not reach the deepest waters of the lake and the deep cold water is heavier or denser than the warmer water above. As the water temperature difference grows in late spring, the water separates into a cold layer in the deeper part of the lake with a warmer layer on the top (Figure 6.1). This process is called thermal stratification.
Summer stratification
Fall Overturn
2424°°2222°°2020°°1414°°1212°°1111°°1010°°
epilimnionmetalimnion
hypol imnion
WIND
1616°°1515°°1414°°1313°°1212°°1111°°1111°°
44°°44°°44°°44°°44°°44°°44°°
Spring Overturn WINDWIND
Figure 6.1: Seasonal stratification and overturn typically seen in Lake Simcoe.

60
80
100
120
140
1980 1985 1990 1995 2000 2005
Year
Leng
th o
f str
atifi
ed p
erio
d in
da
ys
Once the lake stratifies, it is difficult to mix the layers of water because of density differences between warmer and colder parts of the water column; this is called “thermal stability.” If the thermal stability is zero, there are no density differences and the lake is fully mixed. However, if the thermal stability is high, there are big differences in the density of the water at the surface of the lake, as compared to the deepest areas, and the lake is thermally stratified. As discussed in Section 3.1, coldwater species of fish such as lake trout and lake whitefish stay in the deeper waters of the lake during the summer months. Their decline has been attributed to low dissolved oxygen levels in the deeper waters of the lake, a challenge which could be added by a longer stratified period. How is climate change affecting the thermal structure of the lake? A ministry study evaluated Lake Simcoe’s thermal structure at three stations: Kempenfelt Bay, Cook’s Bay and the main basin (see Figure 3.3 for a map showing the location of the bays). The study determined the dates the lake stratified in the spring and mixed in the fall. The study also determined the length of the stratified period for each year from 1980 to 2008. Analysis showed that compared to 1980, in 2008 the lake stratified earlier in the spring, mixed later in the fall and stayed stratified for more than a month longer on average (Figure 6.2).
Figure 6.2: The length of the stratified period (in number of days) in the main basin of Lake Simcoe from 1980-2008.
48

Thermal stability study: Kempenfelt Bay, Cook’s Bay, and Main Basin
49
15
16
17
18
19
20
21
1980 1985 1990 1995 2000 2005
Year
Mea
n su
mm
er a
ir te
mpe
ratu
re
(°C
)Body of Water in Lake Study Findings Simcoe Kempenfelt Bay ● Onset of thermal stratification is about 20 days earlier
in the spring ● Mixing of the water is about 15 days later in the fall ● Length of time the bay stays stratified has increased
correspondingly; on average it stays stratified for about 33 days longer
Cook’s Bay ● Onset of stratification is about 25 days earlier in the spring
● The turnover of the bay is about 24 days later in the fall
● The average length of the stratified period has increased by 56 days
Main Basin ● Onset of stratification is about 13 days earlier in the spring
● Fall mixing is about 18 days later ● The average length of time the main basin stays
stratified has also increased by about 33 days (Figure 6.2)
temperature only occurred in June and September. On average, the mean June temperature has increased by 2.5 °C and the September temperature by 2.0 °C.
Figure 6.3: Mean summer air temperature (°C) (June 1 to Sept. 30) recorded at a nearby weather stations (Shanty Bay) from 1980-2008.
The observed changes in the thermal structure of Lake Simcoe are correlated with increasing air temperatures. The mean summer air temperature from June 1 to September 30 increased by 1.5 °C from 1980 to 2008 (Figure 6.3) at a weather station located near Kempenfelt Bay (Shanty Bay station). Interestingly, the study found that a significant increasing trend in monthly mean air

50
This study indicates that climate change is influencing the thermal structure of Lake Simcoe. The ministry’s observations in Lake Simcoe27 are like other studies that have documented an earlier onset of stratification and increase in the duration of stratification caused by warmer air temperatures.28,29 Changes in water column stability have likely contributed to observed changes in composition of the lake’s phytoplankton community.23
Future work planned for Lake Simcoe will include the assessment of climate change impacts on:
zooplankton abundance and community composition deep water dissolved oxygen and, by extension, coldwater-dependent species
such as lake trout and lake whitefish Climate change is expected to influence all elements of the Lake Simcoe watershed, including water quality and quantity, aquatic ecosystems, natural areas and shoreline. The Lake Simcoe Protection Plan commits the province to develop a Lake Simcoe Climate Change Adaptation Strategy by June, 2011. This strategy was recommended to be undertaken by the Ontario Expert Panel on Climate Change Adaptation as a pilot program in hopes that there may be strategy application for other watersheds. For more information, see the “Climate Change Adaptation” box in this report. 6.2 Climate Change Effects in Ontario’s Far North While significant warming is expected throughout the province, climate models predict that by the latter part of this century the largest increases in annual temperature (5 to 7 °C) will occur in northern Ontario, particularly in the regions around Hudson Bay and James Bay.30 Forecasted temperature increases for the rest of the province are generally 4 to 5 °C.30 Northern areas are expected to see dramatic increases in winter temperatures (9 to 10 °C) and decreases in precipitation of up to 30 per cent.30 Ontario’s far north is unique, with huge resources of freshwater draining to the marine environments of Hudson Bay and James Bay. Oceans are a major part of the global carbon cycle and it is expected that climate change will largely alter the storage and cycling of carbon in our northern ocean environments as ice cover changes and waters warm. Ontario’s far north, where the vast peatlands of the Hudson and James Bay Lowlands (the third largest wetland area in the world) connect to the marine environment, is a globally significant area. Studying this region will be key to developing a global understanding of the potential impacts of climate change. Aquatic ecosystems in the far north are very vulnerable to climate change. These ecosystems are adapted to cold temperatures and a short growing season. A warmer, drier climate is expected to fundamentally alter their nature in ways we are not able to predict. Information on lakes and rivers in the far north is limited.

Hawley Lake and the Sutton River
The area around Hawley Lake in Ontario’s far north provides a dramatic example of the effects of climate change on an aquatic ecosystem. Hawley Lake is the source of the Sutton River which drains to Hudson Bay (Figure 6.4). The Sutton River is famous for its
world class angling for trophy sea run brook trout. During the extremely warm summer of 2001, air temperatures in the area sometimes exceeded 30°C and surface water temperatures in the lake and river rose to over 20°C. Major die-offs of brook trout and white suckers resulted.31 The local residents have seen other such fish kills in recent years. However, the events were never scientifically documented. Residents have also seen other disturbing signs of recent changes in the area, including more aquatic weeds and pike.
Climate Change Adaptation Recognizing the importance of developing adaptation strategies for dealing with Climate Change, the ministry established the Ontario Expert Panel on Climate Change Adaptation in 2007. The Panel consulted broadly with the province and with external stakeholders, releasing its final report and recommendations in November 2009. The Panel made several key recommendations
Figure 6.4: A map of northern Ontario showing Hawley Lake - the source of the Sutton River which drains to Hudson Bay. Credit: Leo Lariviere, Laurentian University.
related to water.
51

How are we investigating climate change in the far north?
During the summer of 2009 the ministry, along with partners from Laurentian University, Queen’s University and the University of Ottawa, collected coresediment samples from the bottom of Hawley Lake and other area lakes (Figure 6.5). The samples will give a unique record of what has happened in and around the lakes in the past. By looking at the fossil remains of algae and contaminants in dated slices taken from the cores, scientists will gain evidence of how recent warming has changed these northern lakes. This knowledge will help researchers make better forecasts of how lakes are likely to change in the future.
Surveys have also been conducted on some lakes in the Hawley Lake area to collect basic information on their chemistry and biological communities (phytoplankton, zooplankton, benthic invertebrates). Such surveys will be completed on lakes in other areas of Ontario’s far north in the coming years. Studies have also been started to measure current mercury levels in fish in lakes in the far north and to determine whether fish mercury concentrations have changed through time. Results from these studies will be published in future water quality reports.
BByy llooookkiinngg aatt tthhee ffoossssiill rreemmaaiinnss ooff aallggaaee aanndd ccoonnttaammiinnaannttss iinn ddaatteedd sslliicceess ttaakkeenn ffrroomm tthhee ccoorreess,, sscciieennttiissttss
wwiillll ggaaiinn eevviiddeennccee ooff hhooww rreecceenntt wwaarrmmiinngg hhaass
cchhaannggeedd tthheessee nnoorrtthheerrnn llaakkeess..
Figure 6.5: Scientists collecting sediment cores from Hawley Lake.
52

7.0 Issues on the Radar What are “issues on the radar”?
“Issues on the radar” refer to issues affecting water quality that have received recent attention in Ontario. These include:
pharmaceuticals and other contaminants of emerging concern in water the effects of road salt use on water the contamination of water by pathogens
While the ministry has been monitoring some of these issues for decades, recent steps have been taken and new study approaches are underway to monitor these issues and to develop strategies for prevention and control. These issues will be monitored on a continuous basis moving forward and updated information will be provided in future water quality reports.
7.1 Chemicals of Emerging Concern Some chemicals and chemical classes that are used every day have become recognized as chemicals of emerging concern (CEC). These types of chemicals may also be called “new contaminants”, or “emerging contaminants”. These contaminants generally refer to a broad category of compounds that were previously unknown, unrecognized or unregulated in the environment. Pharmaceuticals in the environment
Pharmaceutical compounds are one class of chemicals for which concern has emerged. Types of pharmaceuticals entering the environment include:
over-the-counter medications such as pain-killers prescription drugs such as antibiotics and antidepressants hormones such as those administered for birth control
Pharmaceuticals can enter surface waters after we use them and excrete them, and through runoff from agricultural operations and land application of manure and biosolids. The challenge around water quality and pharmaceuticals is that our understanding of the effects of pharmaceuticals is limited to human exposure in the application for which they were designed. As a result, it is not known how many of these compounds interact and transform in the environment or what potential effect they may have on plants and animals.
53

54
How is the ministry monitoring pharmaceuticals and other contaminants of emerging concern? The ministry is monitoring pharmaceuticals and other emerging contaminants in the environment to:
determine their concentrations in drinking water and in the Great Lakes assess different treatment technologies to reduce these contaminants in
wastewater effluent encourage and implement practices to reduce their release to the environment
Two examples of current water monitoring studies being carried out by the ministry are described below. Pharmaceuticals and other emerging contaminants in drinking water
The recent ministry report, Survey of the Occurrence of Pharmaceuticals and Other Emerging Contaminants in Untreated Source and Finished Drinking Water in Ontario, examined the levels and occurrence of pharmaceuticals and other emerging contaminants in untreated source water and treated drinking water in Ontario. Below are the results: Water Sample Results In total, 258 samples were collected from 17 different drinking water systems that take part in the ministry’s Drinking Water Surveillance Program (DWSP). Water samples were analyzed for 46 compounds including pharmaceuticals, antibiotics, hormones and bisphenol A (BPA) at the ministry’s laboratory. Of the 46 compounds analyzed, most were either not detected or infrequently detected (less than 10 per cent of the samples) in both untreated source water and treated drinking water samples.
The most frequently detected compounds (detected in greater than 10 per cent of the samples analyzed) in source waters (rivers and lakes) are listed in descending order of detection in the table below:
SSoommee cchheemmiiccaallss aanndd cchheemmiiccaall ccllaasssseess tthhaatt aarree
uusseedd eevveerryy ddaayy hhaavvee bbeeccoommee rreeccooggnniizzeedd aass
cchheemmiiccaallss ooff eemmeerrggiinngg ccoonncceerrnn..

55
50
33
22 2125
1512
15
0
10
20
30
40
50
60
Carbamazepine Gemfibrozil Bisphenol A Ibuprofen
Perc
ent D
ecte
ctio
n (%
)
Untreated SourceFinished Drinking Water
Compounds Found Description in Surface Water Carbamazepine Anti-epileptic, anti-depressant Gemfibrozil Cholesterol regulating drug Bisphenol A Plasticizer Ibuprofen Non-steroidal anti-inflammatory drug (over the counter) Naproxen Non-steroidal anti-inflammatory drug (over the counter) Lincomycin Antibiotic Sulfamethoxazole Antibiotic Acetaminophen Non-steroidal anti-inflammatory drug (over the counter) Benzafibrate Cholesterol regulating drug Trimethoprim Antibiotic Sulfamethazine Antibiotic The most frequently detected compounds (detected in greater than 10 per cent of the samples analyzed) in treated drinking water are listed in the table below. These were generally found in lower measured concentrations than in untreated source water. The levels of these compounds in both source and treated waters were in parts per trillion or nanogram per litre (ng/L) range (Figure 7.1).
Compounds Found in Drinking Water Description Carbamazepine Anti-epileptic, anti-depressant Gemfibrozil Cholesterol regulating drug Ibuprofen Non-steroidal anti-inflammatory drug (over
the counter) BPA Plasticizer
Figure 7.1: Most frequently detected compounds (%) in untreated source and treated drinking waters in Ontario.

56
Comparisons of the distributions of the most frequently detected compounds in drinking water to those of source water indicate that the parent compounds detected most frequently in source water are reduced after being treated by a drinking water treatment system. The fact that a compound can be detected in drinking water does not mean that there is a direct risk to human health. The levels detected were well below any estimated maximum acceptable daily intake (ADI) reported in the literature for drinking water. For example, an individual would have to drink thousands of glasses of treated drinking water a day to exceed an ADI for any of the most frequently detected compounds in drinking water. Pharmaceuticals and other emerging contaminants in the Great Lakes Ministry scientists have been assessing the use of passive samplers to monitor for historical pollutants and chemicals of emerging concern in surface waters. Passive samplers are placed in the water for a set time, often one month, and chemicals that are dissolved in the water are gradually taken up into the sampler. The average concentration of a chemical that the sampler is exposed to is then calculated from the amount contained in the sampler. This passive sam ling approach replaces the need to collect many individual wate e to obtain average concentrations, and essentially mimics the s such as fish to chemicals in that area of water. This approa ns where water conditions change often, such as in stream earshore areas of the Great Lakes. Two types of passive samplers (F at selected stations in the Great Lakes. Deploying both type onitoring of a wide range of chemicals. Both samplers were Survey.
Figure 7.2: Ministry staff retrieve passive samplers from surface waters of the Great Lakes.
Figure 7.3: Semi-permeable membrane devices (long plastic tubing) and polar organic chemical integrative samplers (disks) after deployment in the Great Lakes.
over that period of timep
r samples over timexposure of organism
ch is useful in locatios and rivers, and the n
igures 7.2-7.3) have been used s at different sites allows for the m
developed by the United States Geological

57
Types of passive samplers Passive Sampler Type
Composition Chemical Type
semi-permeable • tube of thin flexible • hydrophobic chemicals that membrane device (SPMD)
polyethylene plastic dissolve in fat instead of water • fatty acid similar to fish • examples are PCBs, PAHs,
fat sealed inside DDT polar organic • resin powder pinched • water soluble chemicals chemical integrative between 2 membranes • examples are pharmaceuticals, sampler (POCIS) by large steel washers current-use pesticides In 2006, the ministry deployed passive samplers at selected sites in Lake Ontario that are part of the Great Lakes Nearshore Monitoring and Assessment Program. Working together with researchers from Trent University, the samplers were analyzed to determine average pharmaceutical concentrations. The results, shown in figure 7.4, indicate that concentrations were in the low nanogram per litre (ng/L) range, and that greater concentrations were found in the waters next to urban centres that are influenced by municipal wastewater, such as Hamilton and Toronto.
Pharmaceutical Concentrations at Lake Ontario Sites
0
5
10
15
20
25
30
35
Niagara R. HamiltonHarbour
Humber Bay TorontoHarbour
Newcastle Bay of Quinte West L.Ontario
Con
cent
ratio
ns (n
g/L)
Caffeine
Carbamazepine
Atenolol
Ibuprofen
Gemfibrozil
Venlafaxine
Figure 7.4: Pharmaceutical concentrations in Lake Ontario sites.
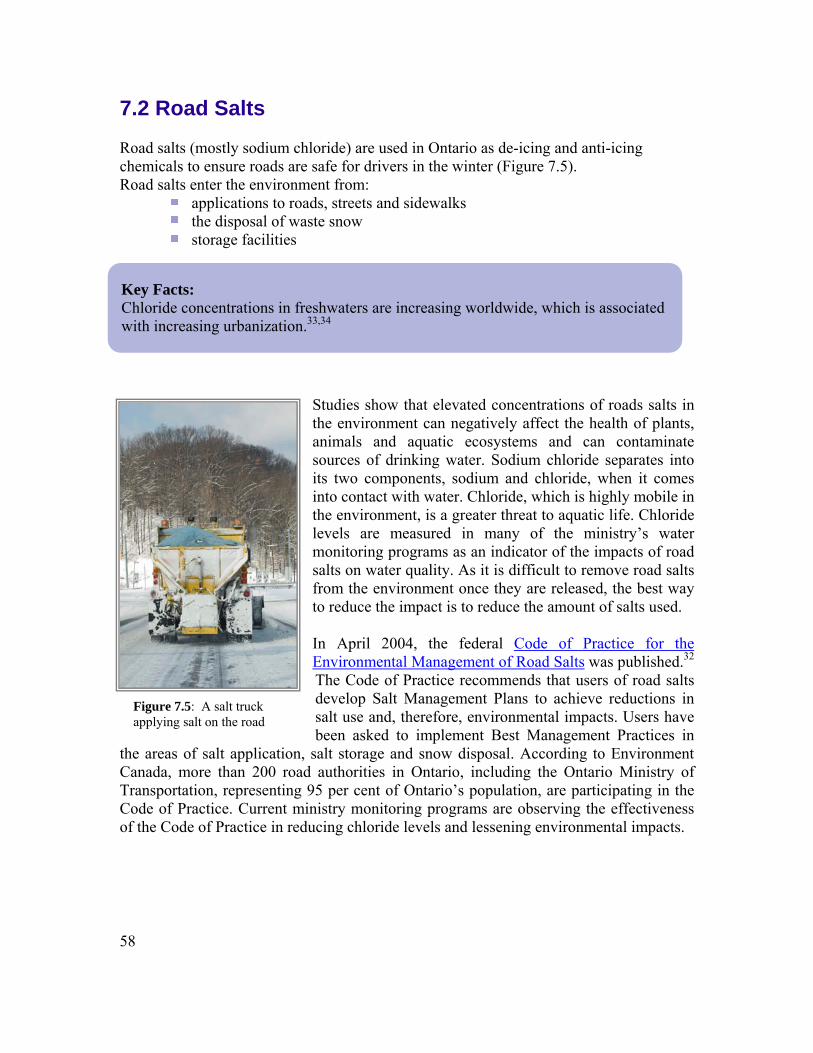
7.2 Road Salts Road salts (mostly sodium chloride) are used in Ontario as de-icing and anti-icing chemicals to ensure roads are safe for drivers in the winter (Figure 7.5). Road salts enter the environment from:
applications to roads, streets and sidewalks the disposal of waste snow storage facilities
Studies show that elevated concentrations of roads salts in the environment can negatively affect the health of plants, animals and aquatic ecosystems and can contaminate sources of drinking water. Sodium chloride separates into its two components, sodium and chloride, when it comes into contact with water. Chloride, which is highly mobile in the environment, is a greater threat to aquatic life. Chloride levels are measured in many of the ministry’s water monitoring programs as an indicator of the impacts of road salts on water quality. As it is difficult to remove road salts from the environment once they are released, the best way to reduce the impact is to reduce the amount of salts used. In April 2004, the federal Code of Practice for the Environmental Management of Road Salts was published.32 The Code of Practice recommends that users of road salts develop Salt Management Plans to achieve reductions in salt use and, therefore, environmental impacts. Users have been asked to implement Best Management Practices in
the areas of salt application, salt storage and snow disposal. According to Environment Canada, more than 200 road authorities in Ontario, including the Ontario Ministry of Transportation, representing 95 per cent of Ontario’s population, are participating in the Code of Practice. Current ministry monitoring programs are observing the effectiveness of the Code of Practice in reducing chloride levels and lessening environmental impacts.
Key Facts: Chloride concentrations in freshwaters are increasing worldwide, which is associated with increasing urbanization.33,34
Figure 7.5: A salt truck applying salt on the road
58

Results from the Provincial Water Quality Monitoring Network and Lake Simcoe are highlighted below. Chloride in Ontario’s streams
concentrations were calculated to represent overall conditions in Ontario’s streams.36 The results suggest that average chloride concentrations in Ontario’s streams have increased over the last three decades (Figure 7.6), from < 30 mg L-1 in 1975 to > 50 mg L-1 in 2009; however, concentrations vary from year to year and between watersheds. Chloride concentrations in urban streams are typically higher, and are increasing at a faster rate than the provincial average. The following factors influence the amount of road salts applied in a given year and subsequently, the amount of chlorides that enter streams:
Since 1975, the Ministry of the Environment’s Provincial Water Quality Monitoring Network has taken about 175,000 chloride measurements from almost 2,000 stream monitoring locations across Ontario. Results from all monitoring locations were compiled by year and annual average chloride
weather (e.g., amount of snowfall and freezing rain) salt management practices (e.g., salt application rates and techniques)
Changes in these factors help to explain some of the variability in average chloride concentrations.
The British Columbia water quality guidelines to protect aquatic life from chloride has a long-term guideline of 150 mg/L to prevent the harmful effects of chronic exposure and a short-term benchmark level of 600 mg/L to prevent exposure to occasional lethal concentrations.35
The Canadian Council of Ministers of the Environment is currently developing a Canadian Water Quality Guideline for chloride.
Figure 7.6: Average annual chloride concentration in Ontario’s streams (modified from Todd, Kaltenecker and Rocks in preparation).
59

Seasonal and spatial trends indicate the important contribution of road salts to the chloride concentrations in Ontario’s streams. Average
Chloride in Lake Simcoe Due to expanding human settlement, and associated increases in urban areas and infrastructure, chloride in Lake Simcoe and its watershed is a pollutant of concern. As a result, chloride has been listed as a water quality indicator in the Lake Simcoe Protection Plan.
Figure 7.7: Average chloride concentrations (2005-2009) in Ontario’s streams (modified from Todd, Kaltenecker and Rocks in preparation).
MOE co-sponsored the 1st International Conference on Urban Drainage and Road Salt Management in Cold Climates, which was held at the University of Waterloo from May 25 to 27, 2009. The conference attracted more than 100 delegates from five countries to discuss current knowledge on the environmental impacts of road salts with an emphasis on urban drainage design and best management practices in cold climates.
chloride concentrations in streams peak in the winter months. The highest average chloride concentrations generally occur in urbanized regions of Ontario where there are more roads, parking lots and sidewalks and greater quantities of salts are used (Figure 7.7). Ongoing chloride monitoring in Ontario streams will provide more information for tracking the effectiveness of best salt management practices in mitigating the environmental impacts of road salts.
60

0
5000
10000
15000
20000
98-99 99-00 00-01 01-02 02-03 03-04 04-05 05-06 06-07
Chl
orid
e lo
ad (t
25000
30000
35000
onne
s/yr
)Beaver Hawkestone BlackPefferlaw Upper Schomberg LoversEast Holland
0
5
10
15
20
25
30
35
40
45
50
1971 1976 1981 1986 1991 1996 2001 2006
Chlo
ride
(mg/
L)
BeavertonKeswickGeorginaoutflow
Chloride concentrations have increased significantly from 1993 to 2007 in eight out of 10 monitored tributaries in the Lake Simcoe watershed, and were highest in those draining the greatest proportion of urban area and roads.37 Recent concentrations often were above, or approached, the long-term guideline level of 150 mg/L. Very occasionally, in the North Schomberg and East Holland rivers, these were above the benchmark concentration of 600 mg/L. Chloride loads to the lake measured in seven tributaries from 1998 to 2007 have also increased significantly (Figure 7.8).36 Chloride concentrations in Lake Simcoe have increased significantly over the past three to four decades (Figure 7.9). Concentrations are currently about 40 mg/L, which is below the guideline level. If increases were to continue at the same rate as the past three decades, chloride concentrations in the lake could reach the long-term guideline level in about 140 years.
Whether the rate of chloride inputs will increase, decrease or stay the same is difficult to predict given the expected changes on the watershed. Population growth is forecasted for the Lake Simcoe watershed, which could mean an increase in chloride concentrations in rivers and loads to the lake. However, there will also be actions to reduce chloride inputs, such as those outlined in the Code of Practice as well as efforts in the Lake Simcoe Protection Plan to reduce the amount of stormwater getting into the lake. We will continue to monitor chloride concentrations in Lake Simcoe and will keep this issue on the radar.
Figure 7.8: Total chloride load estimated from 7 tributaries for each hydrological year (e.g., 98-99 is from June 1998 to May 1999).
Figure 7.9: Increasing chloride concentrations in Lake Simcoe at three water treatment plants and its outflow. To see the locations of the water treatment plants, please refer to the map in Figure 3.3.
61

62
7.3 Pathogens Pathogens are microscopic organisms that can cause disease in humans and animals. When they are found in water, we refer to them as waterborne pathogens. Some examples of waterborne pathogens include:
bacteria such as pathogenic Escherichia coli (e.g., E. coli O157:H7), Campylobacter and Salmonella
protozoa such as Giardia and Cryptosporidium (Figure 7.10) viruses such as Hepatitis A and Norwalk
The most common health effect caused by the consumption of water contaminated with pathogens is gastro-intestinal upset, including nausea, vomiting and diarrhea. Illness caused by waterborne pathogens usually lasts a few days to a week; however, in susceptible individuals such as children, the elderly, and individuals with a compromised or weakened immune system, the effects may be more severe. This might include chronic conditions (e.g., kidney damage) or even result in death. Most waterborne pathogens originate from fecal pollution from animals and humans. This pollution might enter water through:
untreated sewage treatment bypasses leaking septic tanks and sewer lines agricultural runoff improper disposal of wastes from boats waste droppings from pets and wildlife
What is Ontario doing to protect water from pathogen contamination? Protecting sources of drinking water Source water protection is a key component to protecting our drinking water, whether water in our community comes from groundwater, lakes or rivers. Regulations (e.g., O. Reg. 287/07 under the Clean Water Act, 2006) are now in place to help communities identify land-use activities that might contribute fecal pollution to water sources. Once identified, measures can be taken to reduce fecal pollution from entering our source water. These measures might include increased treatment of sewage or implementing activities to further reduce run-off after manure application to fields. Reducing the amount of pathogens entering source water will lessen the potential impact on our drinking water treatment systems.

In addition to the regulations under the Clean Water Act, the ministry regulates the spreading of manure and non-agricultural source materials (NASM) on farm land under the Nutrient Management Act, 2002 (O. Reg. 267/03). Management practices, such as maximum application rates and setback distances to streams, can also reduce the levels of pathogens entering surrounding waters after manure and NASM spreading.
e occurrence of pathogens in drinking water sources. Some of these projects involve measuring the levels of specific pathogens in water (Figure 7.10), including parasites such as Cryptosporidium and Giardia (Figure 7.11). Other studies have started to use advanced techniques to understand the origin of pathogens and fecal pollution.
Protecting recreational waters and beaches
sories is to protect people’s health. These the province by local public health units
mpling of the fecal indicator bacteria, E. coli. The cates that recent fecal pollution, which may also contain
e 7.12). A public health unit will issue a levels are over the Provincial Water Quality
of water (geometric average of at least five samples taken within a one month period). Along the shoreline of the Great Lakes, many factors can influence the levels of E. coli in the water, including:
Several ministry projects investigate th
The primary purpose of beach closures and adviclosures and advisories are issued throughoutand are based on the routine sapresence of E. coli in water indipathogens, has affected water quality (Figurwarning against swimming if E. coliObjective of 100 counts per 100 mL
heavy rainfall that may wash bacteria into the water high waves that stir up sand and sediment from the bottom
Figure 7.10: Ministry staff collecting water samples in the Grand River watershed to understand the occurrence and types of pathogens found in intensely farmed areas.
Figure 7.11: An image through a microscope of Giardia cysts (larger oval) and Cryptosporidium oocysts (smaller circles). These protozoa have been stained to fluoresce a green colour under the microscope for easier identification by laboratory staff.
63

64
The ministry has set up long-term monitoring programs within the Great Lakes to examine the level of pollution, including E. coli and some bacterial pathogens, along these shorelines. These programs help in understanding factors that influence a change in pollution levels in different parts of the lakes. Special studies are also conducted by the ministry and partners at universities to determine where these bacteria are originating from, and what factors influence changes in fecal pollution levels in these waters.
E. coli E. coli is no cal pollution at freshwater beaches across North America. Since any warm-blooded animal, including wildlife, farm animals and hum cult to know exactly where the main sources of fecal pollution at beaches are o In 2005 and 2006, the mi ith the University of Guelph set forth to investigate the probabl ination at select beaches in Lake Huron.38 Using advanced genetic tools, ny different sources including beach water, sand, nearby rivers, wildlife, far als and humans in the surrounding areas were analyzed to see how genetically related they were to one another. Using these innovative tools, it was shown that the E. coli at the beaches came from many different sources (including agriculture, wildlife and human sources).38 However, the main source of E. coli found at this beach was of agricultural origin, which had been transported to the beaches through nearby rivers. Since the land-uses in this area were mostly agricultural, these findings were expected. An interesting finding of the study showed that the second most common type of E. coli found at the beach was genetically distinct from any other type of E. coli isolated from fecal sources in the area. This group of E. coli appeared to be “naturalized”, meaning that these E. coli might be surviving for long periods of time at the beach and may be reproducing in the environment. If these E. coli persist at these beaches, they might be contributing to contamination of the water year after year. This finding may bring into question the long-standing belief that E. coli is regarded as an indicator of recent fecal pollution in water.
Figure 7.12: Laboratory staff at the ministry examining E. coli growing on agar plates. Counting the number of E. coli colonies on these plates helps to determine the levels of E. coli found in lake or river water samples.
sources at beaches in Lake Huron
w used as an indicator of recent feE. coli can come from
ans, it is diffiriginating.
nistry in partnership we sources of fecal contam
E. coli taken from mam anim

Other studies from around the world have also reported these naturalized E. coli at beaches. Since this research is new, many questions remain about how common this phenomenon is at beaches and how these types of naturalized E. coli might be influencing water quality. Studies continue in Ontario and across North America to further investigate these findings. Bacteria associated with green algae Cladophora in Lake Ontario Through its Great Lakes Monitoring Program, the ministry monitors the growth and extent of Cladophora along the shorelines of the Great Lakes. In addition to clogging up water intake pipes, these algae can wash up on the beach and begin to decompose and smell over time. Cladophora can therefore interfere with people’s enjoyment of the beaches.
Over recent years, research has begun to show that algae might be more than just a nuisance that causes an unsightly mess and odour at beaches. In Lake Michigan, studies have linked increases in the occurrence of E. coli, and possibly pathogens, to Cladophora occurrences at beaches. To examine if this occurrence was widespread in the Great Lakes, the ministry in partnership with Wilfred Laurier University examined Cladophora along a part of Lake Ontario’s shores (Figure 7.13). Like other research in the past, this study showed that E. coli was commonly found to be associated with Cladophora throughout its lifecycle, including when it was growing actively on the bottom sediment or when it was decaying on the shoreline. Changes in seasons, weather conditions or lake nutrient levels did not appear to affect the occurrence or numbers of E. coli present. These results may indicate that Cladophora might be providing nutrients and favourable conditions in which E. coli can thrive. Continued studies by many researchers working around the Great Lakes will increase our understanding of this association and how water quality at beaches might ultimately be affected by this relationship.
Figure 7.13: Green algae Cladophora washed up on the shores of Lake Ontario in the late summer of 2009. A study to examine the levels of E. coli associated with Cladophora found on beaches and in water was conducted in partnership with university researchers.
65

8.0 Summary and Conclusions The monitoring results presented in this report show that water quality improvement strategies have been successful, but continued vigilance is needed to restore and protect water quality in Ontario. Improvements in Water Quality
Due to actions taken since the 1990s, phosphorus loading rates into Lake Simcoe have decreased. This has contributed to increases in dissolved oxygen concentrations in the deep waters of the lake, an important coldwater fish habitat.
Phosphorus levels have generally decreased in our Great Lakes, inland lakes and
streams since monitoring first began. Most decreases occurred in the 1980s with the implementation of phosphorus reduction strategies.
Concentrations of toxic substances, including PCBs, mercury and dioxins and
furans, are generally stable or declining in sport fish from the Canadian Great Lakes.
Contaminants such as PCBs and DDT have generally declined in Lake Simcoe
sport fish.
Levels of three common lawn care pesticides have decreased about 80 per cent in urban streams in the first year of Ontario’s cosmetic pesticides ban.
From 1986 to 2006 there was a large drop in pesticide levels in Ontario’s treated
drinking water from surface water sources. Joint efforts of federal, provincial and local agencies have restored conditions in
environmental hotspots in the Great Lakes, with the most recent example being the removal of Wheatley Harbour from the list of Great Lakes Areas of Concern.
Ongoing Challenges
Further reductions in phosphorus loads to Lake Simcoe are needed to reach the target for dissolved oxygen necessary to support coldwater fish. Key actions to reduce phosphorus loads have been outlined in the Phosphorus Reduction Strategy.
Locally elevated phosphorus levels are a continuing concern, resulting in excessive
algae growth in some inland lakes. In the Great Lakes, excessive algae growth is also related to the colonization of invasive mussels.
66

Sport fish consumption advisories are still in place in many lakes and streams due
to contamination by toxic substances in those areas.
Invasive species continue to spread throughout Ontario’s Great Lakes and inland lakes, displacing native species and in the case of the zebra and quagga mussels, drastically altering the lakebed and the ecosystem.
A warming climate could already be affecting Ontario’s water resources.
Monitoring suggests that warmer air temperatures are changing the thermal structure of Lake Simcoe. Warmer temperatures are also believed to play a key role in the major die-offs of brook trout and white suckers seen in the Sutton River in Ontario’s far north region.
Chloride concentrations have been increasing in Lake Simcoe and Ontario’s
streams for the past three to four decades. The application of road salts for snow and ice control has been suggested as a major source.
The Ministry of the Environment is committed to protecting water quality. Our monitoring programs provide valuable information for this purpose.
67

9.0 References 1. Smith J, Lavender B, Auld H, Broadhurst D and Bullock T (1998) Adapting to climate variability and change in Ontario; Volume IV of the Canada Country Study: Climate
68
Impacts and Adaptation, Environment Canada. 2. Cox ET (1978) Counts and Measurements of Ontario Lakes: Watershed Unit Summaries Based on Maps of Various Scales by Watershed Units. Prepared by Fisheries Policy Development Section, Fisheries Branch, Ministry of Natural Resources for Surveys and Mapping Branch. 3. OMOE (2008) Number of lakes and streams in Ontario calculated using the MNR GIS stream layer for Ontario. 4. Coordinating Committee on Great Lakes Basic Hydraulic and Hydrologic Data (1977) Coordinated Great Lakes Physical Data. Chicago, IL and Cornwall, ON. 5. OMOE (2009) Percentage of Ontarians living within the Great Lakes basin calculated using data from Statistics Canada 2006 Census. 6. Bailey RM and Smith GR (1981) Origin and geography of the fish fauna of the Laurentian Great Lakes basin. Can. J. Fish. Aquat. Sci. 38:1539-1561. 7. COA (2007) Canada-Ontario Agreement: Respecting the Great Lakes Basin Ecosystem. Published by Environment Canada and the Ontario Ministry of the Environment. ISBN 978-1-4249-4707-2. 8. Statistics Canada (1996) Environment Accounts and Statistics Division, special compilation using data from Environment Canada, Municipal Water Use Database and Quarterly Estimates of the Population of Canada, the Provinces and the Territories, 11:3, Cat. no. 91-001, Ottawa. 9. Nicholls KH (1997) A limnological basis for a Lake Simcoe phosphorus loading objective. J. Lake Reserv. Manage. 13(3): 189–198. 10. Young JD, Winter JG and Molot L (2011) A re-evaluation of the empirical relationships connecting dissolved oxygen and phosphorus loading after dreissenid mussel invasion in Lake Simcoe. J. Great Lakes Res. 37 (Suppl. 3):7-14. 11. LSRCA and OMOE (2009) Report on the phosphorus loads to Lake Simcoe 2004–2007. Lake Simcoe Region Conservation Authority and Ontario Ministry of the Environment Joint Report. 12. Young J, Landre A, Winter J, Jarjanazi H and Kingston J (2010) Lake Simcoe water quality update. Ontario Ministry of the Environment technical report. PIBS 6932e
69
13. US EPA (2006) Great Lakes Fact Sheet. URL: http://www.epa.gov/glnpo/factsheet.html Last accessed: July 2010. 14. Gewurtz SB, Bhavsar SP, Jackson DA, Awad E, Winter JG, Kolic TM, Reiner EJ, Moody R and Fletcher R (2010) Trends of legacy and emerging-issue contaminants in Lake Simcoe fishes. J. Great Lakes Res. doi:10.1016/j.jglr.2010.07.001 15. ENVIRON (2007) Targeted ecological risk assessment for Muddy Creek, Wheatley Harbour, Lake Erie. Final Report. Environ International Corporation, Portland, Maine. Project No. 21-1822A. 16. McGee B, Berges H and Beaton D (2010) Survey of Pesticide Use in Ontario, 2008. Ontario Ministry of Agriculture, Food and Rural Affairs. ISBN 978-1-4435-3358-4 http://www.omafra.gov.on.ca/english/crops/facts/pesticide-use.htm 17. Todd AK (2010) Changes in Urban Stream Water Pesticide Concentrations One Year after a Cosmetic Pesticides Ban. Ontario Ministry of the Environment technical report. 18. McGee B, Berges H and Callow K (2004) Survey of Pesticide Use in Ontario, 2003. Ontario Ministry of Agriculture, Food and Rural Affairs. ISBN 0-7743-9959-7 19. Environment Canada and US EPA (2009) State of the Great Lakes 2009 report. 20. Lake Simcoe Science Advisory Committee (2008) Lake Simcoe and its watershed: report to the Minister of the Environment. 21. Evans DO and Waring P (1987) Changes in the multispecies winter angling fishery of Lake Simcoe, Ontario, 1961–1983: invasion by rainbow smelt and the roles of intra- and interspecific interactions. Can. J. Fish. Aquat. Sci. 44 (Suppl. 2):182–197. 22. Smith CS and Barko JW (1990) Ecology of eurasian watermilfoil. J. Aquat. Plant Manage. 28:55–64. 23. Winter JG, Young JD, Landre A, Stainsby E and Jarjanazi H (2010) Changes in the phytoplankton community composition of Lake Simcoe from 1980 to 2007 and relationships with multiple stressors. J. Great Lakes Res. doi:10.1016/j.jglr.2010.05.002 24. Depew D, Houben AJ, Ozersky T, Hecky RE and Guilford SJ (2011) Submerged aquatic vegetation in Cook’s Bay, Lake Simcoe: Asssessment of changes in response to increased water transparency. J. Great Lakes Res. 37 (Suppl. 3):72-82. 25. Keller W (2007) Implications of climate warming for Boreal Shield lakes: a review and synthesis. Environ. Reviews 15: 99-112. 26. Kling GW, Hayhoe K, Johnson LB, Magnuson JJ, Polasky S, Robinson SK, Shuter BJ, Wander MM, Wuebbles DJ, Zak DR, Lindroth RL, Moser SC, and Wilson ML

70
(2003) Confronting Climate Change in the Great Lakes Region: Impacts on our Communities and Ecosystems. Union of Concerned Scientists, Cambridge, Massachusetts, and Ecological Society of America, Washington, D.C. 27. Stainsby EA., Winter JG, Jarjanazi H, Paterson AM and Evans DO (2011) Changes in the thermal stability of Lake Simcoe from 1980 to 2008. J. Great Lakes Res. 37 (Suppl. 3):55-62. 28. King JR, Shuter BJ and Zimmerman AP (1997) The response of the thermal stratification of South Bay (Lake Huron) to climatic variability. Can. J. Fish. Aquat. Sci. 54:1873-1882. 29. Cahill KL, Gunn JM and Futter MN (2005) Modelling ice cover, timing of spring stratification, and end-of-season mixing depth in small Precambrian Shield lakes. Can. J. Fish. Aquat. Sci. 62:2134-2142. 30. Colombo SJ, McKenney DW, Lawrence KM and Gray PA (2007) Climate Change Projections for Ontario: Practical Information for Policymakers and Planners. Ontario Ministry of Natural Resources and Canadian Forest Service. Climate Change Research Report CCRR–0.5. 31. Gunn JM and Snucins E (2010) Brook charr mortalities during extreme temperature events in Sutton River, Hudson Bay Lowlands, Canada. Hydrobiologia. DOI 10.1007/s10750-010-0201-3. 32. Environment Canada (2004) Code of Practice for the Environmental Management of Road Salts. http://www.ec.gc.ca/nopp/roadsalt/cop/en/rs_main.htm 33. Thunqvist EL (2004) Regional increase of mean chloride concentration in water due to the application of de-icing salt. Sci. Tot. Environ. 325:29-37. 34. Kaushal SS, Groffman PM, Likens GE, Belt KT, Stack WP, Kelly VR, Band LE and Fisher GT (2005) Increased salinization of fresh water in the northeastern United States. Proc. Nat. Acad. Sci. 102:13517-13520. 35. Nagpal NK, Levy DA and MacDonald DD (2003) Ambient water quality guidelines for chloride. Water Quality Standards, British Columbia. http://www.env.gov.bc.ca/wat/wq/BCguidelines/chloride/chloride.html 36. Todd A, Kaltenecker G and Rocks C (in preparation) Chloride concentrations in Ontario’s streams. Ontario Ministry of the Environment technical report. 37. Winter JG, Landre A, Lembcke D, O’Connor EM and Young JD (under review) Increasing chloride concentrations in Lake Simcoe and its tributaries. Water Qual. Res. J. Can.

71
38. Kon T, Weir SC, Howell ET, Lee H and Trevors JT (2009) Repetitive elements (REP)-polymerase chain reaction (PCR) analysis of Escherichia coli isolates from recreational waters of southeastern Lake Huron. Can. J. Microbiol. 55:269-276.

10.1 Great Lakes Monitoring Great Lakes Index Station Network The Great Lakes Index Station Network is designed to provide information on where and how water quality conditions are changing over time by periodically monitoring about 60 sites for a comprehensive range of environmental indicators (sediment, plankton, benthic invertebrates, water chemistry). The 60 sites have been set up throughout the Great Lakes basin and sites are sampled on a lake-by-lake basis over a multi-year cycle. Great Lakes Reconnaissance and Mapping Surveys The Great Lakes Reconnaissance and Mapping Surveys measure a suite of environmental indicators in the nearshore—the area of the lakes that is most strongly and directly affected by land use. Spatial patterns in water quality are mapped along selected ranges of shorelinundertaken in the spring, summer and fall, and combine high-resolution mapping of water quality indicators using high tech sensors with ground-truth sample collection. Great Lakes Toxics Biomonitoring Long-term monitoring of contaminant levels in mussels, zebra mussels, juvenile fish and selected sport fish is undertaken to track levels of toxic contaminants through time across the Great Lakes. A basic network of about 50 sampling zones has been set up throughout the Great Lakes for juvenile fish monitoring with about 35 sampled in any given year. Also, an ongoing network of stations has been set up in the Niagara River for mussel biomonitoring.
10.0 Appendix: Monitoring Program Descriptions
e throughout the Great Lakes. Surveys are
72

Great Lakes Water Intake Monitoring The Great Lakes Water Intake Monitoring program measures trends in nutrient status using nutrient concentrations and phytoplankton biomass as indicators. Samples are collected year round at the intakes of 17 water treatment plants drawing water from the Great Lakes. Investigative Monitoring Investigative monitoring consists of surveys that are designed to examine site-specific environmental impacts of known contaminant sources. Great Lakes Tributary Toxics Monitoring This monitoring activity aims to identify tributaries with significant concentrations and loadings of persistent bioaccumulative substances to the Great Lakes by collecting information on toxic contaminants associated with high flow events. Currently, this effort is being concentrated at 10 locations in six Toronto area tributaries. Problem tributaries are identified with flow monitoring, biomonitoring and the collection of integrated large-volume samples.
For more information please contact: Duncan Boyd Supervisor Great Lakes Unit 416-235-6221 [email protected] http://www.ene.gov.on.ca/environment/en/subject/great_lakes/index.htm
73

10.2 Lake Simcoe Monitoring The ministry began routine monitoring of Lake Simcoe in 1980. In 1990, the Lake Simcoe Environmental Management Strategy (LSEMS) was formed to improve the water quality of the Lake Simcoe watershed ecosystem. LSEMS was made up of the Lake Simcoe Region Conservation Authority(LSRCA), Ontario ministries, municipalities and other stakeholders. Collaborative efforts on Lake Simcoe under LSEMS grew and lasted for over two decades. Current monitoring and research in Lake Simcoe has increased to support the Lake
Simcoe Protection Plan.
74
This Plan puts in place policies to help restore and protect the health of Lake Simcoe and its watershed. The monitoring and research results will inform actions and targets identified in the Plan and measure progress towards lake protection and restoration. Each year, from spring through fall, monitoring is conducted in the open lake and the mouth of the Holland River. Samples are collected and analyzed for water quality variables including nutrients (e.g., nitrogen and phosphorus), dissolved ions (e.g., chloride), dissolved organic carbon, metals and pH level. Water clarity, temperature and dissolved oxygen are measured, and samples are collected for phytoplankton and zooplankton analysis. Water samples from the intake pipes of three municipal water treatment plants on the lake are collected weekly, all year round, for water chemistry and phytoplankton analysis. Phosphorus, nitrogen and chloride levels in the major rivers flowing into the lake are also a part of the Lake Simcoe monitoring program, and wet (rain and snow) and dry (dust) deposition samples are collected to calculate atmospheric deposition rates of phosphorus. The ministry works with the LSRCA, and uses additional flow and weather data from Environment Canada, to estimate the total load of phosphorus delivered to the lake each year from all sources.
For more information please contact: Joelle Young Lake Simcoe Scientist 416-327-4864 [email protected] http://www.ene.gov.on.ca/environment/en/local/lake_simcoe_protection/index.htm

10.3 Inland Lake Monitoring Extensive Lake Monitoring Lake Partner Program The Lake Partner Program provides nutrient (total phosphorus) and water clarity information for Ontario’s inland lakes. More than 500 lakes are monitored annually with the support of volunteers. The program began in 1996 in partnership with the Federation of Ontario Cottagers’ Associations and the Lake of the Woods District Property Owners’ Association. The program grew out of the Self Help program which had been collecting chlorophyll and water clarity information since the early 1970s. A Lake Partner summary report is published annually on the water clarity and nutrient status of Ontario lakes.
For more information please contact: Anna DeSellas Coordinator, Lake Partner ProgramDorset Environmental Science Centre 705-766-2150 [email protected]
http://www.ene.gov.on.ca/environment/en/local/lake_partner_program/index.htm
75

76
Broadscale Monitoring Program The program began in 2008 to monitor the health of Ontario’s inland lakes and is operated by the Ministry of Natural Resources in partnership with the Ministry of the Environment. The program was developed to improve the Ontario government’s understanding of the current state of fishes and other aquatic resources, to identify stresses on these resources, and to report on changes over time. Broadscale monitoring takes place on certain lakes in each of the Fisheries Management Zones (FMZ) every five years. This monitoring will provide information on fish abundance, diversity, health and aquatic habitat, and also provide valuable water quality information for some of the smaller lakes and several large lakes over the long term. In 2009, Ministry of Natural Resources staff collected fish and water quality samples from about 200 lakes across the province. All water quality samples were sent to the Ministry of the Environment foranalysis at their laboratory in Dorset. Intensive Lake Monitoring Long-term Monitoring of Dorset Area LakesThe monitoring focuses on eight small lakeflowing streams that are located near Dorset, in south-central Ontario, which are representative of the tens of thousands of small, sensitive lakes on the Canadian Shield. Monitoring water quality and quantity, phytoplankton and zooplankton communities began in the mid 1970s. Benthic invertebrate data collection was added in the late 1980s. Partnerships in data collection and analysis began in 2000 with Trent University and York University. These partnerships have now expanded to include researchers from many government agencies and universities. Additional lakes are sampled periodically to supplement information collected on the core eight lakes. Data is used to develop long-term trends on lake and stream health with respect to recovery from acid deposition, mercury impacts and changes in nutrient status, as well as to analyze the impacts of climate change and invasive species.
For more information please contact: Andrew Paterson Research Scientist, Inland Lakes Dorset Environmental Science Centre 705-766-2951
s and the associated inflowing and out-
For more information please contact: Keith Somers Site Supervisor Dorset Environmental Science Centre 705-766-2408 [email protected] www.desc.ca

77
Long-term Monitoring of Sudbury Area Lakes The ministry has been monitoring the Sudbury area since the 1970s to understand the functioning of aquatic ecosystems damaged by industrial pollution, to assess and monitor the process of recovery and rehabilitation of these ecosystems, and to develop and test rehabilitation techniques that speed up the recovery process. Since 1989, moni-toring has been conducted by the Cooperative Freshwater EcologyUnit (Co-op Unit), a partnership between MOE, MNR and Laurentian University, with the support ofpartners including Vale Inco, Xstrata Nickel, Environment Canada, and the City of Greater Sudbury. The Co-op Unit attracts academic collaborators worldwide. Recently, the focus of the research conducted hmultiple stressor research. Mbut periodically includes other lakeCanadian Shield and globally that are the monitoring and related investigations are Workshop and other scientific conferences and published in scientific papers and technical reports. Summary information is presented to the public in information brochures.
For more information please contact: Jocelyn Heneberry Senior Coordinator, Northern Lake Monitoring Cooperative Freshwater Ecology Unit 705-671-3859 [email protected]
as shifted to include climate change and onitoring focuses on 54 lakes in the Greater Sudbury Area,
s in northern Ontario, and applies to other areas on the affected by industrial acid gas emissions. Results of
presented at the annual Sudbury Restoration
www.livingwithlakes.ca

10.4 Stream Monitoring Provincial (Stream) Water Quality Monitoring Network The Provincial (Stream) Water Quality Monitoring Network (PWQMN) measures water quality in rivers and streams across Ontario. Over 400 locations are monitored in partnership with Conservation Authorities, provincial parks and municipalities. Partners collect water samples on a monthly basis, on average, and deliver them to the ministry’s laboratory where they are analyzed for a suite of water quality parameters. Water quality data are shared freely between the partners and with the public. Recent data (2002-2009) are available for download on the ministry’s Data Download page
. The program has been operating since 1964, providing a valuable database for tracking changes in water quality over time. More recently, special studies have been implemented in agricultural and urban watersheds to collect additional information in support of source protection planning, nutrients, road salts and pesticides management.
For more information please contact: Aaron Todd Coordinator Provincial (Stream) Water Quality Monitoring Network 416-235-6240 [email protected] www.ene.gov.on.ca/programs/5310e.htm
78

10.5 Groundwater Monitoring Provincial Groundwater Monitoring Network The Provincial Groundwater Moni-toring Network (PGMN) measures groundwater levels and chemistry across Ontario. The program was started in 2000 and is implemented in partnership with Conservation Authorities and municipalities. Over 470 well sites are monitored. The program uses innovative technologies to send real-time groundwater level and precipitation information from well sites to a web-based information system. Groundwater levels are measured once per hour and groundwater chemistry is analyzed once per year. Data is stored in the program infor-mation system and made accessible to program partners. Local Health Units are notified when an Ontario Drinking Water Quality Standard for a health-related parameter is exceeded. Rain gauges are installed at selected well sites to integrate weather and groundwater information. Special studies and projects are also undertaken to address provincial issues and support ministry activities.
For more information please contact: Dajana Grgic Program Coordinator Provincial Groundwater Monitoring Network 416-235-6371 [email protected] www.ene.gov.on.ca/programs/5311e.htm
79

80
10.6 Drinking Water Monitoring Drinking Water Surveillance Program The Drinking Water Surveillance Program (DWSP) was developed in 1986 in cooperation with participating municipalities togather scientific data on drinking water quality in Ontario, with a particular focus on non-regulated drinking water quality parameters and emerging contaminants such as pharmaceuticals. The drinkingwater systems monitored by DWSP represent about 80 per cent of Ontario’s population that is served by municipal drinking water. Since 1986, DWSP has monitored 200 drinking water systems, generating over 4.8 million analytical results from samples of raw water, treated drinking water, and distribution system water.
For more information please contact: Patrick Cheung Supervisor Drinking Water Monitoring Unit 416-235-6236 [email protected]
www.ene.gov.on.ca/publications/7018e.pdf

10.7 Biomonitoring Ontario Benthos Biomonitoring Network Ontario’s Benthos Biomonitoring Network (OBBN) measures aquatic biological conditions in lakes, streams and wetlands using bottom-dwelling aquatic invertebrates as indicators. The program, which began in 2003, specifies standard biomonitoring methods and provides training and certification for its members. To date, OBBN members have monitored over 1,000 sites. The OBBN includes members from Conservation Authorities, provincial and national parks, universities and colleges, businesses, community groups, municipalities, and citizen-scientist volunteers. Ministry scientists are involved in many collaborative studies aimed at advancing biomonitoring techniques. As an example, the ministry released a database in 2010 that allows monitoring data to be shared among OBBN members. These advancements will allow region- or watershed-scale assessments of a water body condition to be made.
For more information please contact: Chris Jones Benthic Biomonitoring Scientist Dorset Environmental Science Centre 705-766-1724 [email protected] www.desc.ca/programs/OBBN
81
Freshwater Invertebrate Research Network of Northern Ontario The Freshwater Invertebrate Research Network of Northern Ontario (FIRNO) is defining the normal range in benthic invertebrate communities in lakes and streams of Northern Ontario. The network was created in 2003 as a collaboration between the federal and provincial governments, industry and academia to aid regulators and the metal mining industry in the assessment of mining effects on surface waters. Both reference (unimpacted) and impacted (discharge sites, historical mine impact and urban impacts) sites are being studied. Over 300 sites, some of which are being followed every year, have been sampled in the vicinity of four northern mining areas (Sudbury, Hemlo, Red Lake and Timmins). Modeling of the benthic community data from reference sites is being used to predict natural communities expected at impacted sites. Data is being shared among partners (e.g. OBBN) and outside collaborators via an online database to answer science questions. Various other impacts could be assessed using the network data including other industrial discharges, climate change, hydroelectric impounding, sewage discharges, urbanization and road construction.
Sport Fish and Juvenile Fish Contaminant Monitoring Program The Sport Fish Contaminant Monitoring Program provides advice to the public on safe levels of sport fish consumption through the biennial publication of the Guide to Eating Ontario Sport Fish. Sport fish monitoring in Ontario began in 1970, while the program officially started in 1976 with the first guide published in 1977. The 2011-12 version of the guide provides fish consumption advice for more than 1,950 locations in the province. About 6,000 sport fish are collected annually and analyzed for a variety of contaminants. Consumption advisories are calculated based on health protection guidelines provided by Health Canada. Copies of the guide are distributed across the province through government offices as well as various bait shops. An electronic copy of the guide is available at www.ontario.ca/fishguide
82
.
For more information please contact: Jocelyn Heneberry Senior Coordinator, Northern Lake Monitoring Cooperative Freshwater Ecology Unit 705-671-3859 [email protected] www.livingwithlakes.ca

In addition to sport fish contaminant monitoring, juvenile fish monitoring provides a means of identifying contaminant sources. Juvenile fish monitoring started in 1975 to monitor contaminant levels in the Great Lakes and selected inland lakes and rivers. The data have been published in scientific papers, ministry reports and technical memos. The data is also used by Conservation Authorities and other agencies in watershed report cards, State of the Great Lakes Reports and Remedial Action Plan (RAP) reports.
For more information please contact: Sport Fish Contaminant Monitoring Program 416 327-6816 1-800-820-2716 [email protected]
www.ontario.ca/fishguide
83

11.0 Glossary
Acidification: A process that increases the acidity (lowers the pH level) of a water body.
Algae: A group of aquatic organisms with all or most of the following features: they photosynthesize; they have simple vegetative structures without a vascular system; and they have reproductive bodies that lack a sterile layer of protecting cells. Ambient: Natural or background conditions in the environment away from areas where water quality is influenced by a specific discharge or source of pollution. Aquifer: A layer of soil, sand, gravel or rock that contains groundwater. Area of Concern: An area within the Great Lakes Basin where water quality problems have been identified. Background: Water quality conditions upstream of a source of pollution. Beneficial use: The role that the government decides a water body will fulfill (e.g., fish consumption, safe drinking water source, etc.). Restoring beneficial uses is the primary goal of Remedial Action Plans for Areas of Concern in the Great Lakes. See Remedial Action Plan and Area of Concern. Beneficial use impairment: A negative change in the quality (health) of a water body making it unusable for a beneficial use that has been assigned to it. See beneficial use. Benthic invertebrates: Insects, worms, crustaceans and other organisms without a backbone that live in, on, or near the bottom of water bodies. Benthos: Synonymous with benthic invertebrates. See also benthic invertebrates. Bioaccumulative: A substance with the potential to build up (accumulate) in an organism to concentrations higher than the surrounding environment. Bioavailable: Able to be taken up by an organism by ingestion or physical contact (e.g., metals dissolved in water are considered to be bioavailable to aquatic life). Chloride loads: Tonnes of chloride per year from the tributaries. Chlorophyll a: A green pigment in plants that is necessary for photosynthesis. The concentration of chlorophyll a is used to estimate the amount of algae in surface water. Community (aquatic): All of the species that interact in a body of water. Concentration: Amount of a substance in a given volume of sample. In water, concentration is usually expressed as milligrams per litre (parts per million), micrograms per litre (parts per billion) and nanograms per litre (parts per trillion). Contaminant: A substance that impairs water quality when released to the environment. Contamination: Degradation of water quality compared to natural or original conditions caused by the release of contaminants. See also Contaminant. Dichloro-diphenyl-trichloroethane (DDT): A now banned pesticide that was used to
84

85
control insect and bat populations. Dioxins and furans: Dioxins (polychlorinated dibenzodioxins) and furans (polychlorinated dibenzofurans) are a group of chemical compounds created as unwanted by-products in the manufacturing of other chemicals. Dissolved organic carbon (DOC): Microscopic pieces of organic (carbon-containing) matter in water. Dissolved oxygen: Oxygen dissolved in water. Discharge: A volume of water that flows past a given location in a given time interval. In streams, discharge is usually expressed in cubic metres per second. Ecosystem: A community of organisms and the environment in which they live. Emerging chemical: A substance of increasing interest to scientists and the public. Emission: The release of a substance into the environment. Erosion: The process by which rocks and soils are worn away and moved from one place to another. Exceedance: Violation of a limit for a contaminant as prescribed in the Ontario Drinking Water Quality Standards regulation (O.Reg. 169/03). Exposure: The process by which an organism comes into contact with a substance by direct physical contact or ingestion. Food web: The interconnected feeding relationships in an ecosystem. Guideline: Numerical concentration or narrative statement recommended to support a designated water use or to protect aquatic species. Groundwater: Water that occurs beneath the surface of the Earth in saturated soils and geologic formations. Inland: Away from large bodies of water (e.g., the Great Lakes) surrounded by land. Intake: The location where water is withdrawn from a lake or stream for domestic purposes. Load: The amount of a substance entering a water body over a given time interval. Mean: Average (the sum of the values divided by the number of values). Multiple stressors: Two or more stressors that have interactive and cumulative impacts on aquatic ecosystems (e.g., acid rain and climate change). Nearshore: Locations that are close to the shoreline of the Great Lakes, within a range of tens of meters to a couple of kilometres offshore. Nutrient: A substance that is necessary for the growth and survival of an organism. Ontario Drinking Water Quality Standard: Maximum acceptable concentrations of a given water quality parameter as prescribed in O.Reg. 169/03 under the Safe Drinking Water Act, 2002. Outflow: The waterway where water flows out of a lake.

86
Parameter: A measurable characteristic or feature of water quality. Persistent: Substances that are not easily broken down and stay in the environment for long periods of time. Pesticide: A chemical or mixture of chemicals used to kill unwanted species of plants and animals. Photosynthesis: The process by which green plants use light energy to convert water and carbon dioxide into carbohydrates and oxygen. Phytoplankton: Small, usually microscopic, suspended aquatic plants. See also Zooplankton. Planktivorous fishes: Fish species that generally do not eat other fish, but instead feed mostly on zooplankton.
Plankton: See Phytoplankton and Zooplankton. Pollutant: Any substance that, when released to the environment, degrades the environment such that living organisms can be harmed or human uses of natural resources are impaired. Pollution: The release of pollutants to the environment. See also Pollutant. Polybrominated diphenyl ethers (PBDEs): Human-made chemicals used as flame retardants in consumer products. Polychlorinated biphenyls (PCBs): Human-made chemicals used as coolants and lubricants. Population: Organisms of the same species that occupy a given area. Precipitation: All forms of water, liquid (rain) and solid (snow, hail), that falls from the atmosphere to the surface of the Earth. Provincial Water Quality Objective: Numerical and narrative criteria that are protective of all forms of aquatic life. Remedial Action Plan: A strategy developed to restore and protect an Area of Concern in the Great Lakes. Remediation: Taking action to reduce, isolate or remove contamination from the environment. Runoff: Water from melting snow and rain that moves from the landscape into receiving water bodies. Sediment: Particles, derived from rocks, soils and organic materials, which are suspended in, or deposited at the bottom of, a water body. Sediment core: A long, cylindrical sample of sediment from the bottom of a water body collected using a hollow tube. Sensitive species: An organism that is particularly vulnerable to harm with degraded water quality or changes in the environment.

87
Source: A place or object from which pollutants are released (pollution source). Also used to describe surface water bodies and groundwater aquifers that have the potential to supply a drinking water system (drinking water source). Stratification: See Thermal stratification. Stratified period: The duration between the onset of stratification in the spring and the overturn of a lake in the fall. Stressor: An event or factor that adversely affects the well-being of an organism. Surface water: Water on the Earth’s surface including lakes, streams and wetlands. Thermal stratification: The formation of layers of different water temperature and density in a lake. Toxin: A poisonous substance produced by living cells or organisms. Toxicity: The extent to which a substance can have harmful effects on organisms. Tributary: A stream that flows into a larger stream or a lake. Ultraviolet (UV) radiation: Invisible light from the sun with wavelengths between X-rays and visible light. Watershed: An area of land from which water drains to a given point. Synonymous with drainage area, basin and catchment. Weathering: The processes by which rocks are broken down. Young-of-the-year (fish): Juvenile fish that are less than one year old; often used for monitoring in the proximity of contaminant sources because the exposure period is known and their geographical range is limited. Zooplankton: Small, usually microscopic, aquatic animals that graze on phytoplankton. See also Phytoplankton.
