quality improvement for emergency laparotomy. · 2016-02-10 · quality improvement for emergency...
TRANSCRIPT

Quality Improvement for Emergency Laparotomy.
Nial QuineyRoyal Surrey County HospitalGuildford
Scaling Up Improvement
• Health Foundation ‘Shine Award’. 2012• Health Foundation ‘Scaling Up’ award 2015• LiDCO: provided cards/training for CO monitors• Travel expenses/Honorarium paid by LiDCO
Sources of funding/CI.


First report 1987Subsequent reports 1991, 1992, 1993, 1994, 1995‘Who operates when?’ 1996‘Changing the way we operate.’ 2001‘Who operates when.’ 2003‘Emergency admissions. A journey in the right direction?’ 2007‘Elective and emergency surgery in the elderly’ 2010 ‘Perioperative care. Knowing the risk’ 2011
National Confidential Enquiry into Perioperative Death. NCEPOD.

Who: Often unsupervised junior doctors. When: Late at night after long delays (diagnostics and
operating theatre delays)How: Poor resuscitation and risk assessment Where: Patients received poor post operative care not
in ICU.
Confidential Enquiry into Perioperative Death. NCEPOD.
Identify the problemQuantify the size of the problemWork out the solutionImplement solution and measure its effectsThe future
Improving outcomes after emergency laparotomy.

There were 4,117,727 surgical procedures; 2,893,432 were elective (12,704 deaths; 0.44%) and 1,224,295 were emergencies (65,674 deaths; 5.4%).
A high-risk population of 513,924 patients was identified (63,340 deaths; 12.3%), which accounted for 83.8% of deaths but for only 12.5% of procedures.
High risk population often elderly, comorbidities and emergency surgery Despite high mortality rates, fewer than 15% of these patients are
admitted to the ICU.
Crit Care 2006. Pearse et al.
Identification and characterisation of the high-risk surgical population in the United KingdomRupert M Pearse1, David A Harrison2, Philip James3, David Watson1, Charles Hinds1, Andrew Rhodes4, R Michael Grounds4 and E David Bennett4

Emergency Laparotomy Network Audit.Data collection 3 months in 201137 hospitals submitted data. 1853 patientsAverage 30 day mortality rate 14.9% Mortality range 3.7-41%Wide variation in:
Consultant Anaesthetic /Surgeon involvementICU admissionGoal directed resuscitation
www.networks.nhs.uk/nhs-networks/emergency-laparotomy-network


When is death inevitable after emergency laparotomy? Analysis of the American College of Surgeons National QIP database.
Retrospective data 2005-937,553 patients/similar criteria as UK ELNOverall crude mortality rate at 30 days was 14.1%Identified highest risk patients over 90 years with significant pre-morbid
state and shock. 90% mortality rate
Al Temimi et al. J Am Coll Surg 2012, 215:503-11.
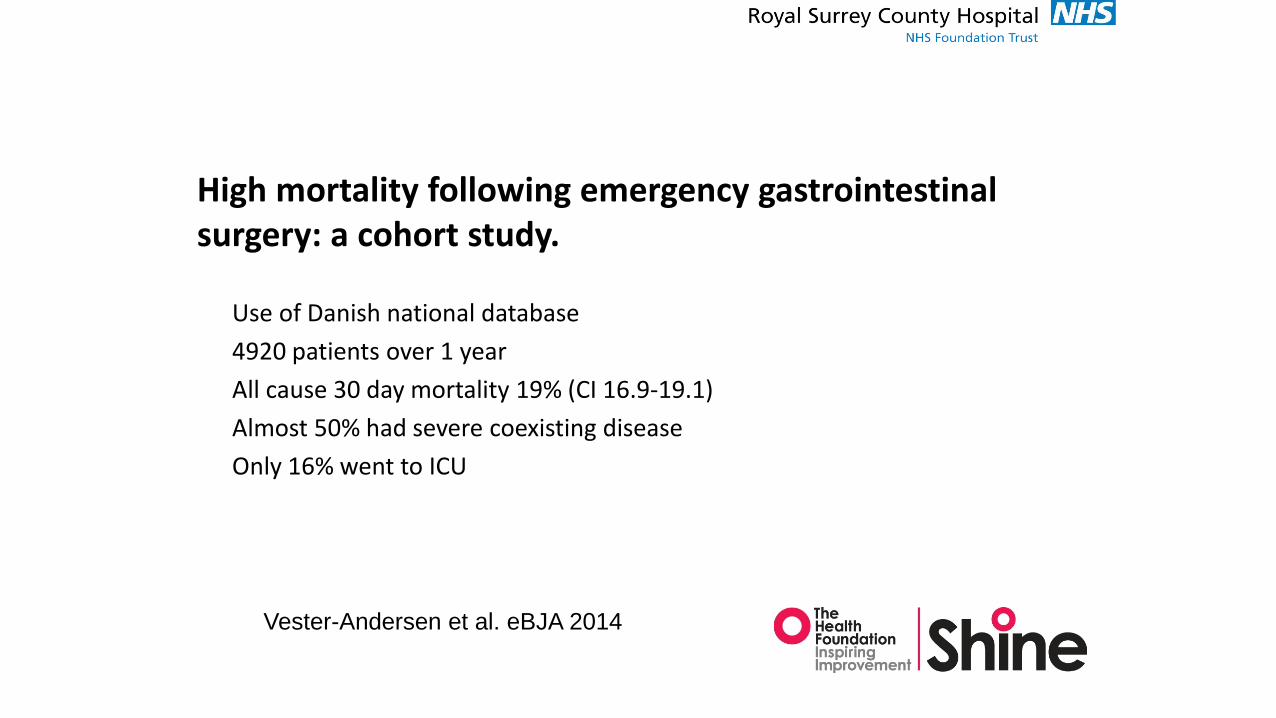
High mortality following emergency gastrointestinal surgery: a cohort study.
Use of Danish national database4920 patients over 1 yearAll cause 30 day mortality 19% (CI 16.9-19.1)Almost 50% had severe coexisting diseaseOnly 16% went to ICU
Vester-Andersen et al. eBJA 2014

100 pts >80 yrs old70% had post operative complicationsOverall mortality 45%Leading causes of death:
Sepsis 42%Underlying malignancy 29%Myocardial and intestinal ischaemiaDementia
Emergency laparotomy in octogenarians: A 5-year study of morbidity and mortality.Gemma Green, Irshad Shaikh, Roland Fernandes, Henk Wegstapel
World J Gastrointest Surg 2013 July 27; 5(7):216-221
Scaling Up Improvement

Incidence of emergency laparotomy 1:1000 per annumMortality rate UK 15%(Elective surgical outcomes 1-2%)UK 9000 deaths per annum (2000 deaths per annum
RTA)Modest improvement in outcomes save many livesEvidence of ‘substandard’ care
The scale of the problem.

Identify the problemQuantify the size of the problemWork out the solutionImplement solution and measure its effectsThe future
Improving outcomes after emergency laparotomy.

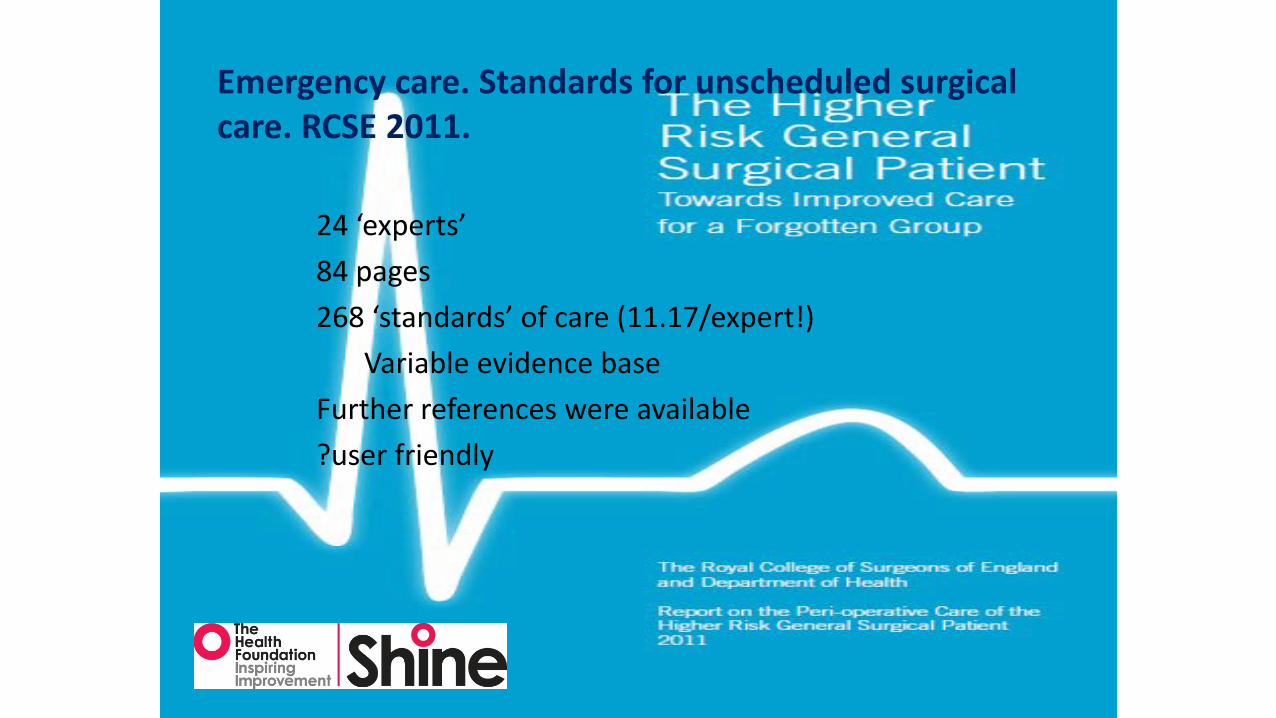
Emergency care. Standards for unscheduled surgical care. RCSE 2011.
24 ‘experts’84 pages268 ‘standards’ of care (11.17/expert!)
Variable evidence baseFurther references were available?user friendly

Emergency Laparotomy Pathway Quality Improvement Care Bundle
Small group developed ‘care bundle’ ELPQuiCFive elementsEvidence basedMeasurable
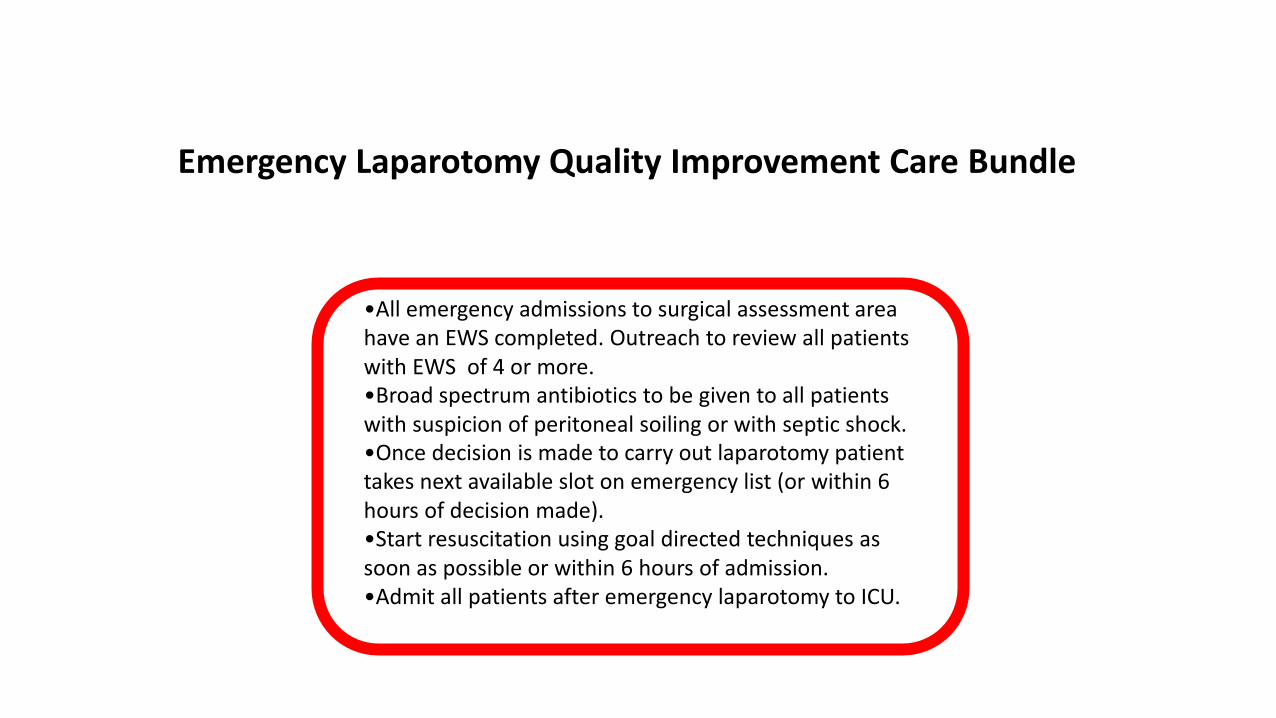
Emergency Laparotomy Quality Improvement Care Bundle
•All emergency admissions to surgical assessment area have an EWS completed. Outreach to review all patients with EWS of 4 or more.•Broad spectrum antibiotics to be given to all patients with suspicion of peritoneal soiling or with septic shock.•Once decision is made to carry out laparotomy patient takes next available slot on emergency list (or within 6 hours of decision made).•Start resuscitation using goal directed techniques as soon as possible or within 6 hours of admission.•Admit all patients after emergency laparotomy to ICU.

Emergency Laparotomy Pathway Quality Improvement Care Bundle
Four general hospitals in EnglandBaseline data for 299 patientsEight month prospective data collection (427 patients)Use of ‘statistical process control’ to identify changesMeet every 4-6 weeks for results/learning

Results

51
144
44
60
109
144
97
77
0
20
40
60
80
100
120
140
160
Site 1 Site 2 Site 3 Site 4
Cases per trust
Baseline (299)ELPQuiC (427)

0%
5%
10%
15%
20%
25%
30%
35%pr
port
ion
of p
atie
nts %
Underlying Pathology(proportion of all patients %)
Pre (299)
Post (427)

20.4%
14.0% 13.6% 13.3%14.0%
13.5% 13.2%
8.2% 7.8%
10.5%
0%
5%
10%
15%
20%
25%
Site 1 Site 2 Site 3 Site 4 All
Crude 30-day mortality
Pre-ELPQuiC
Post-ELPQuiC
25% reduction

27.8%
22.7%
16.1%
23% 22.6%
17%
19.7%
10.5%
14.0%15.8%
0.0%
5.0%
10.0%
15.0%
20.0%
25.0%
30.0%
Site 1 Site 2 Site 3 Site 4 ALL
ASA 3+ mortality
Baseline
ELPQuiC
p = 0.0830% reduction
25
Consecutive patient by operation date
Cum
ulat
ive
Exp
ecte
d-O
bser
ved
deat
hs
02
46
8
0 50 100
RDEH
05
10
0 50 100 150
RSCH
05
1015
20
0 50 100 150 200 250 300
RUH
02
46
0 50 100
TH
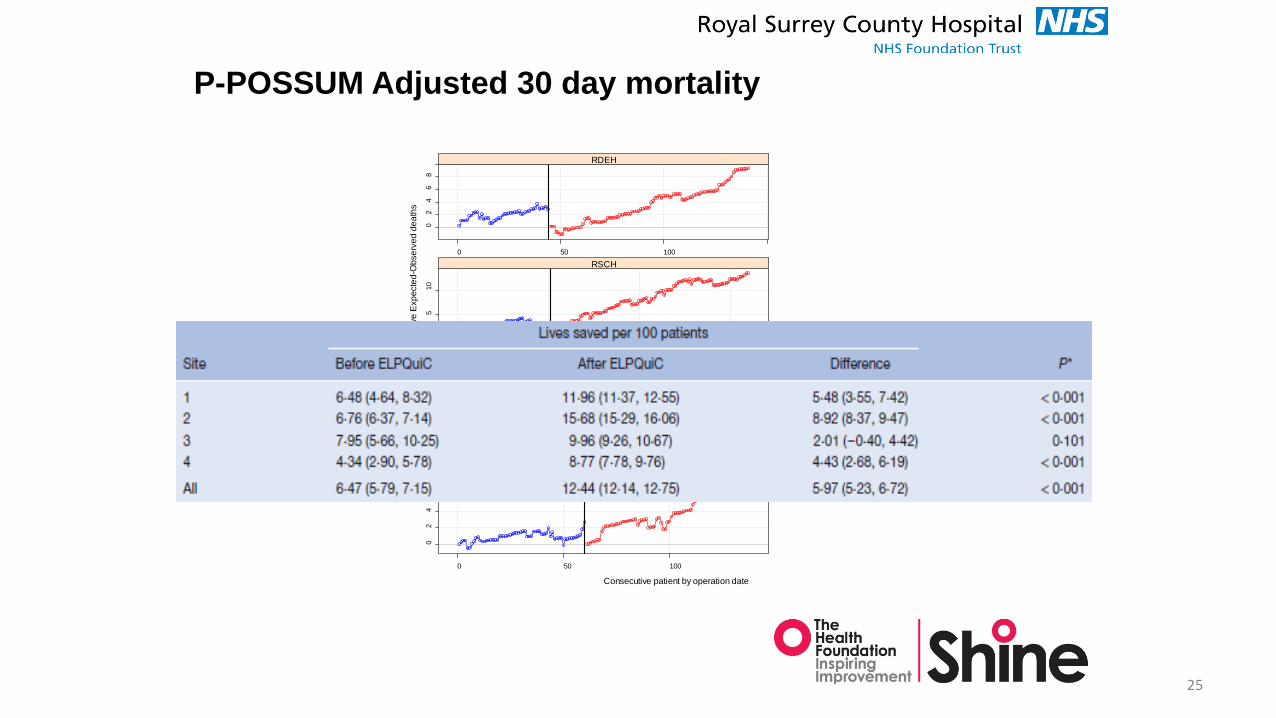
P-POSSUM Adjusted 30 day mortality
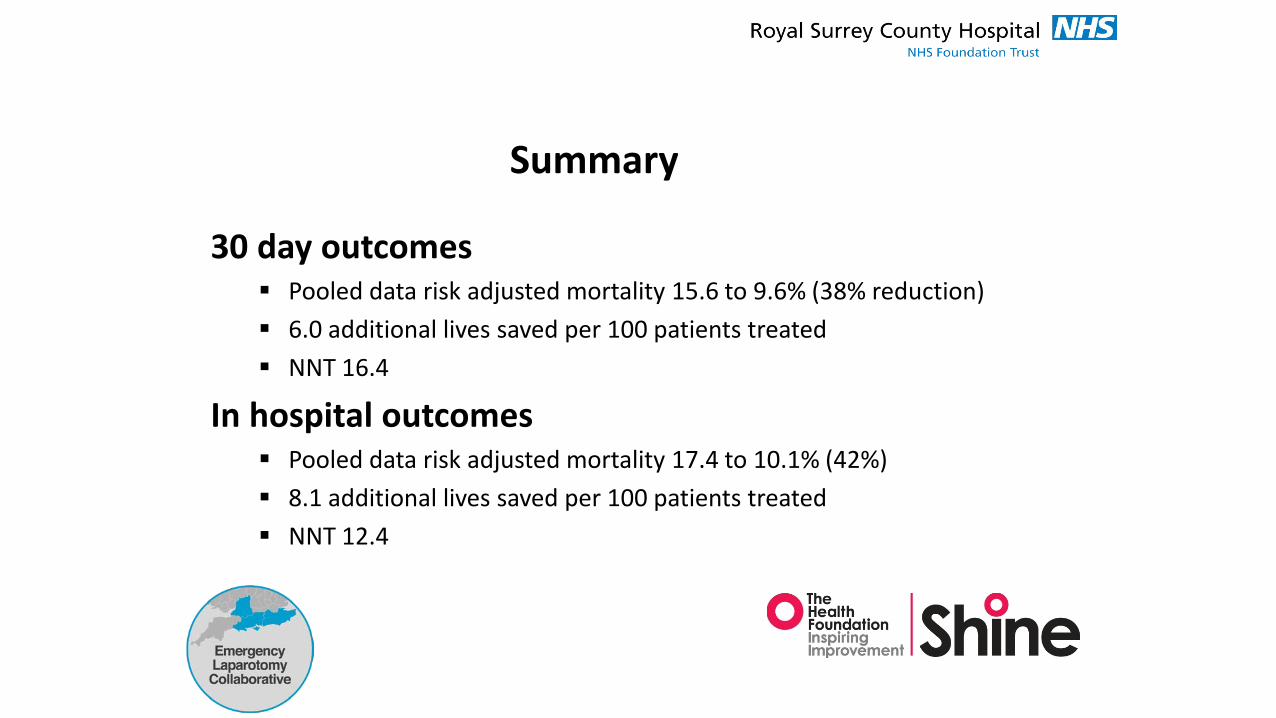
Summary
30 day outcomes Pooled data risk adjusted mortality 15.6 to 9.6% (38% reduction) 6.0 additional lives saved per 100 patients treated NNT 16.4
In hospital outcomes Pooled data risk adjusted mortality 17.4 to 10.1% (42%) 8.1 additional lives saved per 100 patients treated NNT 12.4

ResultsProcess compliance

40.5%
81.4%
100.0%
65.1%
77.8%
99.0% 98.7%
0%
10%
20%
30%
40%
50%
60%
70%
80%
90%
100%
Site 1 Site 2 Site 3 Site 4
Prop
ortio
n of
pat
ient
s
EWS taken on presentation
BaselineELPQuiC
No
base
line
data
ava
ilabl
e
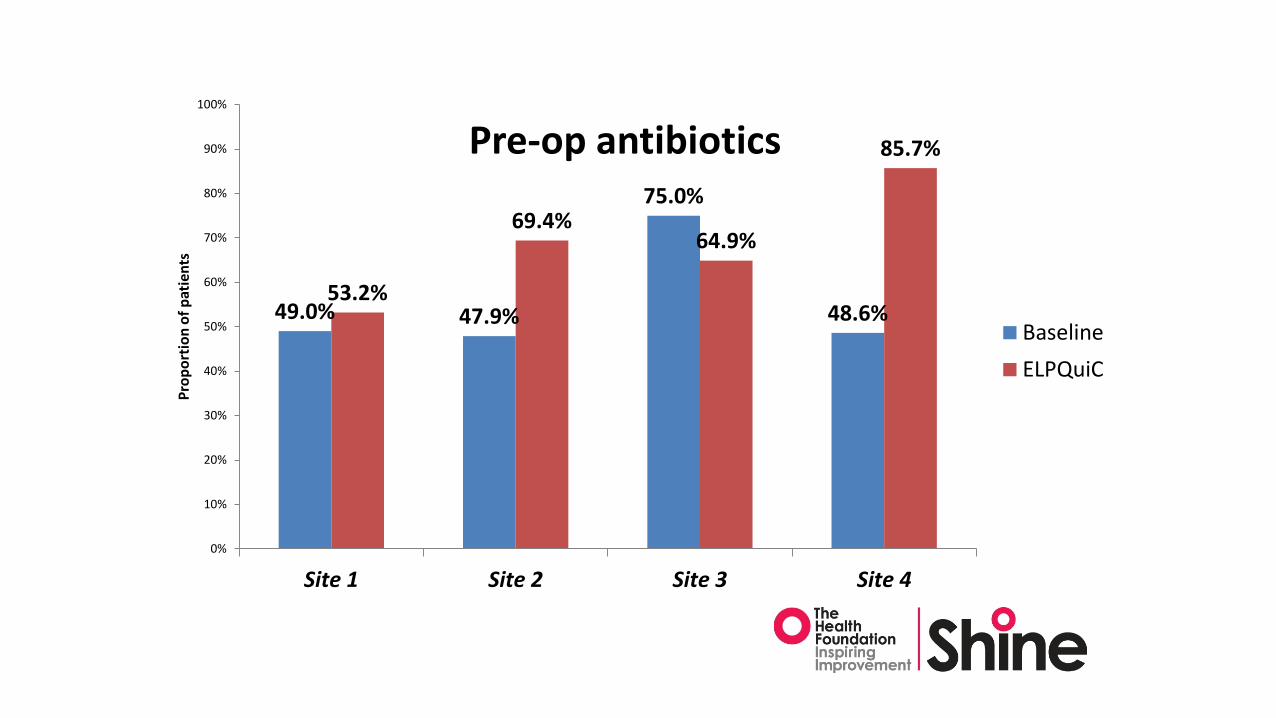
49.0% 47.9%
75.0%
48.6%53.2%
69.4%64.9%
85.7%
0%
10%
20%
30%
40%
50%
60%
70%
80%
90%
100%
Site 1 Site 2 Site 3 Site 4
Prop
ortio
n of
pat
ient
s
Pre-op antibiotics
BaselineELPQuiC

47% 46%50%
43%
77%
62%66%
74%
0%
10%
20%
30%
40%
50%
60%
70%
80%
90%
Site 1 Site 2 Site 3 Site 4
Prop
ortio
n of
All
Patie
nts
Decision to theatre less than 6 hours
Baseline
ELPQuiC
Scaling Up Improvement
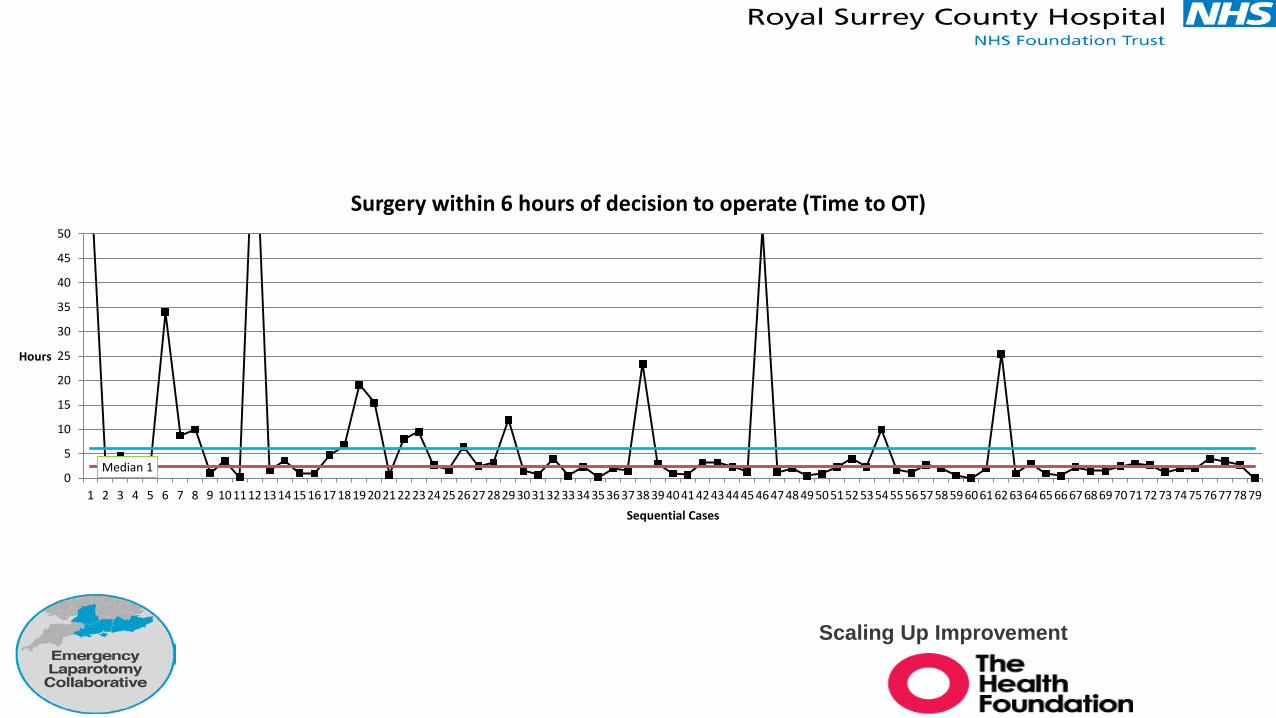
Median 10
5
10
15
20
25
30
35
40
45
50
1 2 3 4 5 6 7 8 9 10 11 12 13 14 15 16 17 18 19 20 21 22 23 24 25 26 27 28 29 30 31 32 33 34 35 36 37 38 39 40 41 42 43 44 45 46 47 48 49 50 51 52 53 54 55 56 57 58 59 60 61 62 63 64 65 66 67 68 69 70 71 72 73 74 75 76 77 78 79
Hours
Sequential Cases
Surgery within 6 hours of decision to operate (Time to OT)
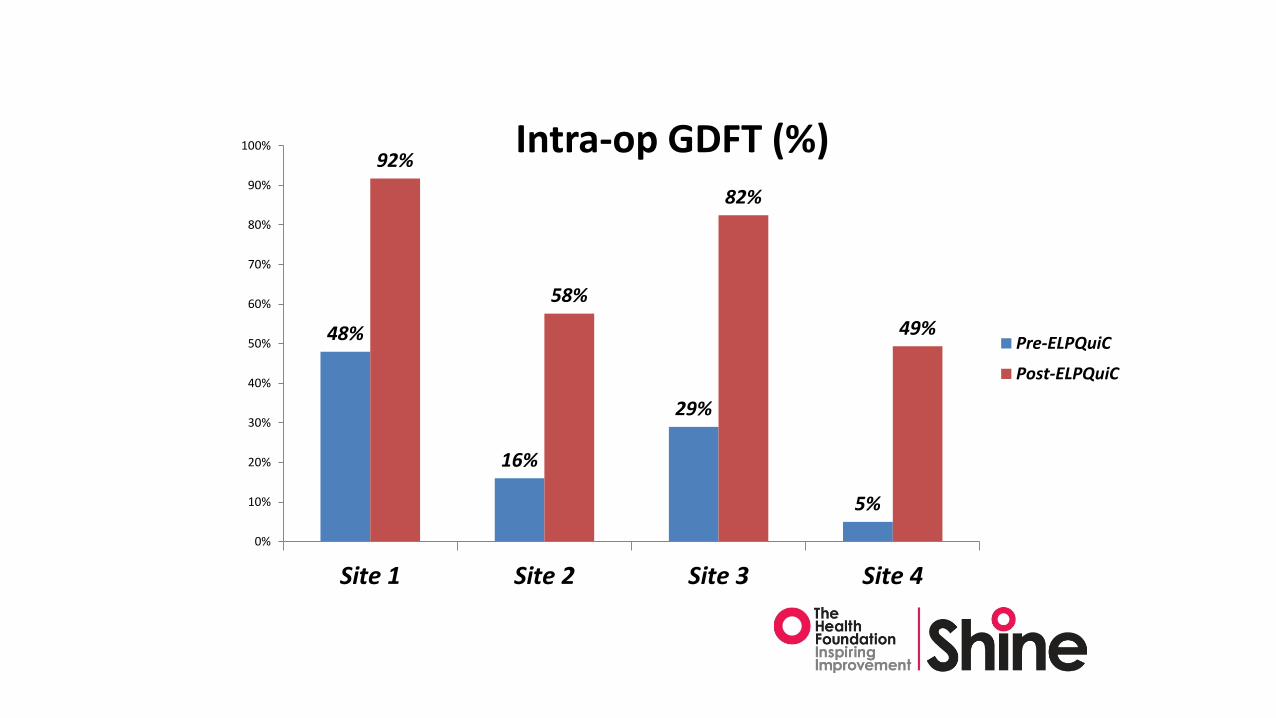
48%
16%
29%
5%
92%
58%
82%
49%
0%
10%
20%
30%
40%
50%
60%
70%
80%
90%
100%
Site 1 Site 2 Site 3 Site 4
Intra-op GDFT (%)
Pre-ELPQuiC
Post-ELPQuiC
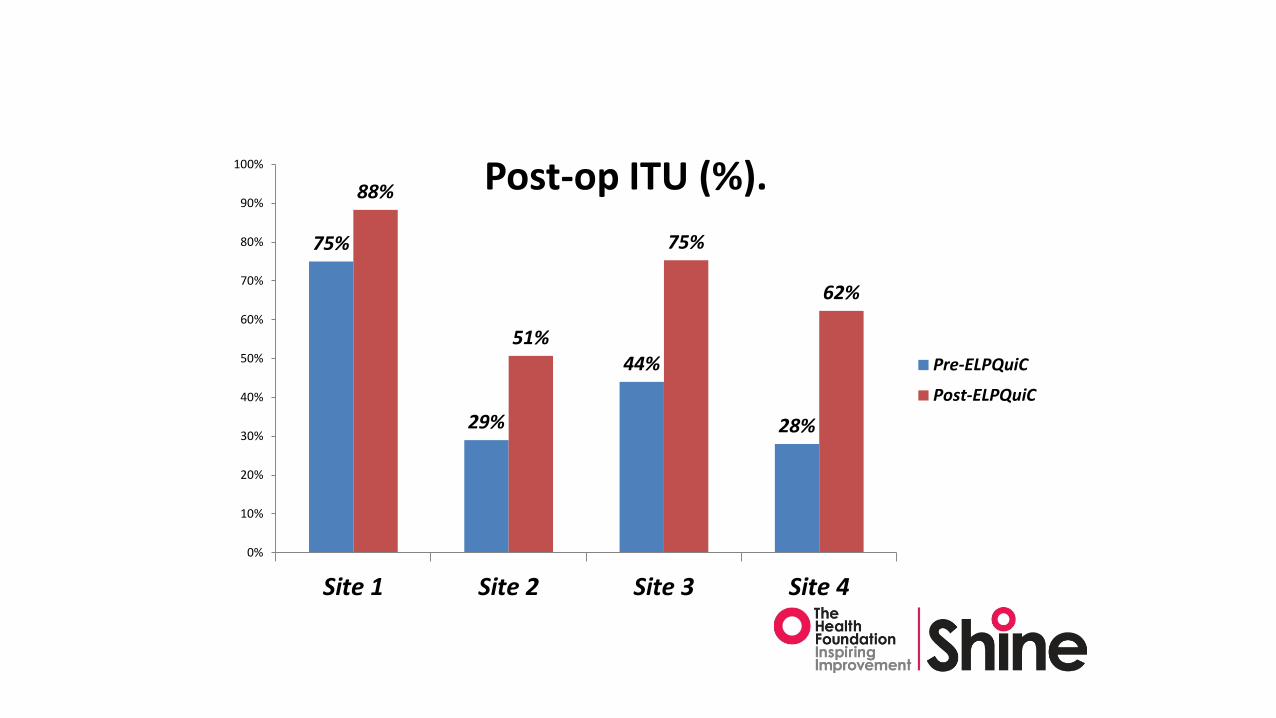
75%
29%
44%
28%
88%
51%
75%
62%
0%
10%
20%
30%
40%
50%
60%
70%
80%
90%
100%
Site 1 Site 2 Site 3 Site 4
Post-op ITU (%).
Pre-ELPQuiC
Post-ELPQuiC

48%56%
87%
49%
79%
65%
98%
56%
0%
10%
20%
30%
40%
50%
60%
70%
80%
90%
100%
Site 1 Site 2 Site 3 Site 4
Consultant Anaesthetist in Theatre
Pre-ELPQuiC
Post-ELPQuiC

0%
20%
40%
60%
80%
100%
Cons
ulta
nt A
naes
thet
ist /
% c
ases
Admission Month
Consultant delivered Anaesthesia
Consultant Anaesthetist Consultant Anaesthetist MeAN

44% 43%
82%76%
94%
54%
93%99%
0%
10%
20%
30%
40%
50%
60%
70%
80%
90%
100%
Site 1 Site 2 Site 3 Site 4
Post CCT Surgeon in theatre (%)
Pre-ELPQuiC
Post-ELPQuiC

Open Access. BJS Jan 2015.
Original article
Use of a pathway quality improvement care bundle to reduce mortality after emergency laparotomyS. Huddart, C. J. Peden, M. Swart, B. McCormick, M. Dickinson, M. A. Mohammed andN. Quiney on behalf of the ELPQuiC Collaborator Group
Scaling Up Improvement

Scaling Up Improvement
What other evidence is out there?

Moller et al.BJS 2011
Multicentre trial of a perioperative protocol to reduce mortality in patients with peptic ulcer perforation
804 M. H. Møller, S. Adamsen, R. W. Thomsen and A. M. Møller
Table 2 Compliance with the trial protocol
Before surgery
No. of patients (n = 117)
Evaluation by a consultant anaesthetist and a consultant surgeon with discussion of therapeutic options 104 (88·9) Surgery within 6 h of admission 74 (63·2) APACHE II scoring33* 97 (82·9) Sepsis screening20 105 (89·7) Standard blood samples and electrocardiogram 110 (94·0) Packed red blood cells if patient anaemic 23 (19·7) Broad-spectrum empirical antibiotics 113 (96·6) Measurement of bodyweight 108 (92·3) Respiratory and circulatory stabilization in the high-dependency unit 105
(89·7) Oxygen treatment leading to arterial oxygen saturation ≥ 94% Insertion of central venous catheter, arterial line, NGT and indwelling bladder catheter Early goal-directed fluid therapy34
During surgery Fluid balance chart 106 (90·6) Early goal-directed fluid therapy34 99 (84·6) Maintenance of normothermia using convective air warming system 112 (95·7) Insertion of double-barrelled NGT 89 (76·1)
After surgery Evaluation by a consultant anaesthetist and a consultant surgeon; postop. treatment planned 94 (80·3) Early goal-directed fluid therapy34 in recovery room 106 (90·6) Oxygen treatment leading to arterial oxygen saturation ≥ 94% on postop. days 1– 2 111 (94·9) Sepsis screening20 daily on postop. days 1– 3 83 (70·9) Standard systemic analgesia with opioids + paracetamol (acetaminophen), + continuous epidural analgesia, if indicated 117 (100) Chest physiotherapy on postop. days 1– 3 99 (84·6) Standard blood samples and electrocardiogram on postop. days 1– 3 105 (89·7) Proton pump inhibitor treatment 115 (98·3) Evaluation by anaesthesiologist if postop. condition deteriorates in recovery room 117 (100) Postop. plan of nutrition within 12 h of admission 103 (88·0) ≥ 12 h in recovery room 110 (94·0) Removal of central venous catheter, arterial line and indwelling bladder catheter when no longer indicated 117 (100) Written plan of treatment and monitoring in first 24 h in regular surgical ward after discharge from recovery room 97 (82·9) Monitoring of blood pressure, heart rate, respiratory rate, oxygen saturation and level of consciousness 3 times daily on postop. 63 (53·8)
days 1– 3 Fluid balance chart on postop. days 1– 3 101 (86·3) Bodyweight measurement daily on postop. days 1– 3 62 (53·0) Early mobilization 115 (98·3) Use of medical emergency team-calling criteria in regular surgical department35 12 (10·4)

• Conclusion: The 30-day mortality rate in patients with PPU was reduced by more than one-third after the implementation of a multimodal and multidisciplinary perioperative care protocol, compared with conventional treatment
Scaling Up Improvement
Moller et al. BJS 2011
Multicentre trial of a perioperative protocol to reduce mortality in patients with peptic ulcer perforation

Scaling Up Improvement
600 pts vs controlBundle: Early resuscitation
AntibioticsGDTRisk stratification and ICUConsultant inputFeeding, analgesia, ambulation
Results:30 day mortality: 21.8 vs 15.5% (29%)180 day mortality: 29.5 vs 22.2 (24%)
Total LOS: 10872 vs 9902d (8%)ICU stay: 1622 vs 1242d (23%)
Reduced mortality following the introduction of a multimodal multidisciplinary perioperative protocol in high risk emergency gastrointestinal surgery patients. A single center intervention study of a consecutive cohort
Tengberg LT, Bay-Nielsen M, Bisgaard T, Cihoric M, Lauritsen ML, Foss NB

Common goals of all published data to date
Identify sick patients (lactate/PPOSSUM/EWS)Aggressive antibioticsEarly surgerySenior involvementGDTICU usage

Scaling Up Collaborative.Saving 1000 lives together.
www.emergencylaparotomy.org.uk@ELCSavingLives
Scaling Up Improvement

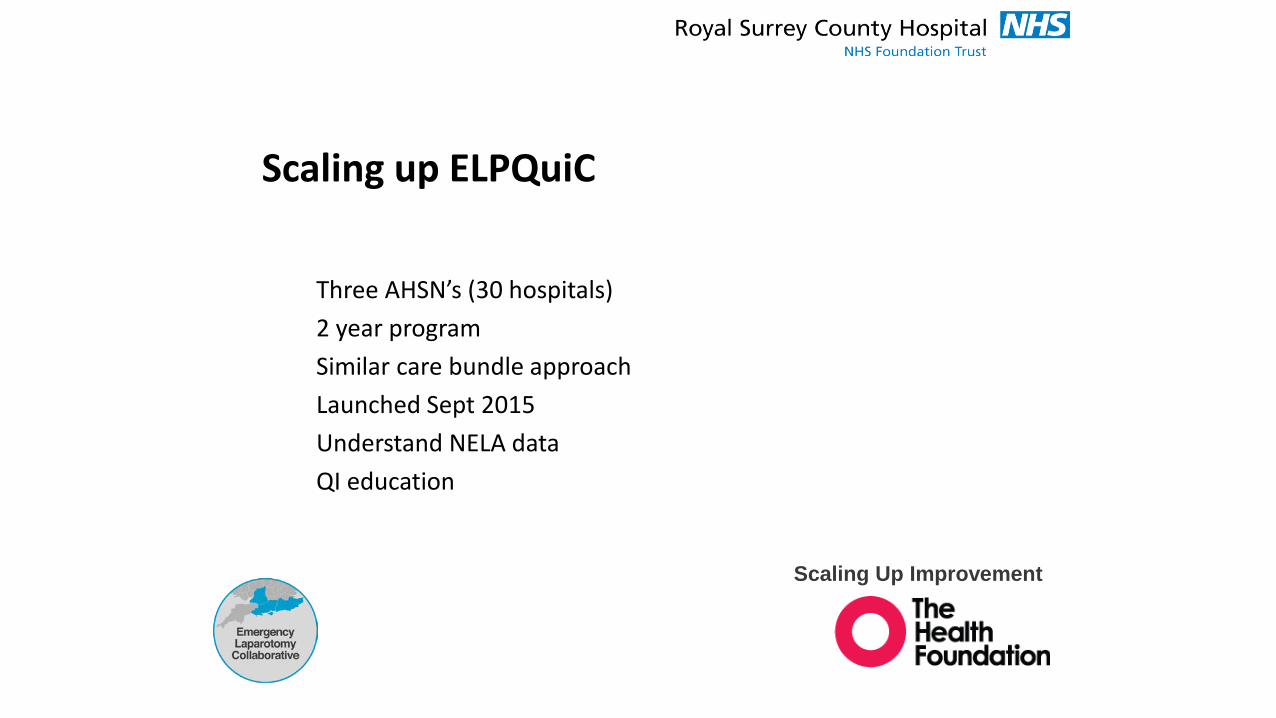
Scaling up ELPQuiC
Three AHSN’s (30 hospitals)2 year program Similar care bundle approachLaunched Sept 2015Understand NELA dataQI education
Scaling Up Improvement

Scaling up ELPQuiC
Plenary meetings:Care bundles, sepsis, care of elderly
Local AHSN QI meetings:Driver diagrams, variation, driver diagrams, CUSSUM.
Webex/webinar meetings:‘Show and tell’
QI macro run chart makerPosters and pamphlets, educational videos and publicationsVideo presentations from our meetings
Scaling Up Improvement


Quality improvement and performance
Scaling Up Improvement
‘Every system is perfectly designed to get the results it gets. The only way to get real change is to change the system. To do this you need ‘will, ideas and execution’.
You must have the Will to make the system better- this may be because you have identified poor performance or outcome through audit or patient experience
You must have Ideas about how you could change things for the better
You must have skills to make it happen: Execution.
Paul Batalden IHI 1984

Thank you.Dr Sam HuddartProf Carol PedenDr Bruce McCormickDr Mike SwartDr Geeta AggarwalAnd many others
[email protected] Up Improvement