quality handbook - cirrus logic
TRANSCRIPT

Quality Handbook
Experts in Low Power, Mixed-Signal Processing

First Choice in QualityCirrus Logic Quality Handbook
1Cirrus Logic Quality Handbook
Quality Policy
Quality Management System
Environmental and Social Responsibilities
Global Quality Network
Product Development Process
Software Quality
Supplier Quality Management
Customer Quality Management
Product Analysis
Appendix A: Product Reliability Operations
Appendix B: ESD Latch-Up Testing
Appendix C: Moisture Sensitivity Levels
Appendix D: White Papers
3
4
5
6
8
18
21
24
26
32
35
37
38

2 For more information, visit cirrus.com
At Cirrus Logic, Quality is Built InCirrus Logic is a world leader in low power, high precision,
mixed-signal processing solutions that create innovative user
experiences for the world’s top mobile and consumer
applications. The best known electronics OEMs rely on Cirrus
Logic’s superior engineering innovation and execution of highly
specialized, cutting-edge design, software and manufacturing
technology to meet their rapid, ultra high volume product
introductions.
Cirrus Logic has become a valued, strategic partner by weaving
quality into the processes and systems used at every level of
the organization. Cirrus Logic’s Quality Management System
(QMS) provides an all encompassing focus on quality that
flows throughout the company’s Product Development Process
(PDP). From the initial stages of product concept, all the way
through high volume production, the Cirrus Logic team stands
behind our track record of exceeding the expectations of our
customers by delivering proven results every day.
Corporate Vision First choice in signal processing products.
For our customers • For our shareholders • For our employees
Corporate Mission Cirrus Logic provides innovative, high performance analog
and digital signal processing products that “rock” (advances
our customers, benefits our shareholders and rewards our
employees).
• To exceed our customers’ expectations
• Deliver solid value to our shareholders
• Build confidence and pride in our company
Corporate Values • Continuous Improvement
• Innovation
• Integrity
• Communication
• Job Satisfaction
Cirrus Logic’s flagship quality product
development, reliability and analysis operations
in Austin, Texas

3Cirrus Logic Quality Handbook
Quality Policy Cirrus Logic is committed to deliver innovative signal processing solutions, exceed our customers’ expectations, drive continual improvement and comply with regulatory requirements.
In support of our Quality Policy we strive to achieve the following objectives:
• Understand the needs of our customers and strive to constantly meet or exceed their expectations
• Continually improve the effectiveness of our Quality Management System and integrate into critical processes, projects and systems
• Partner with customers and suppliers to establish quality guidelines and to ensure they are met
3Cirrus Logic Quality Handbook

4 For more information, visit cirrus.com
Quality Management SystemThe Cirrus Logic Quality Management System (QMS) defines how quality is built into every facet of the company’s
design and development processes, as well as the systems that govern the manufacturing supply chain through
fabrication, test and delivery. It is through our QMS that Cirrus Logic delivers innovative solutions that are built
with quality to exceed our customers’ expectations.
Cirrus Logic is compliant to the requirements set forth by ISO 9001:2015. It is through our QMS that we not
only maintain this compliance, but we also actually drive quality beyond expectation. Cirrus Logic measures
and continually improves the degree to which customer requirements and the quality policy are satisfied. Senior
management establishes goals for product conformity and business process effectiveness. Effectiveness is
measured by comparing actual results to expected results.
The efficiency and effectiveness of the QMS is reviewed on a regular basis. The Quality department participates
in each Quarterly Data Review (QDR) where metrics are reviewed by senior management to assess the relevance
and progress of the quality system. Actions pertaining to the quality system are assigned and documented at
this review. An annual summary of internal audits is published by the Quality department and distributed to
senior management. Findings are reviewed with each department manager for necessary corrective actions.
Change Management Cirrus Logic follows JEDEC standards (JESD46) for customer
notification of product/process changes. Prior to customer
notification, changes to datasheet, wafer fabrication, assembly,
or test undergo a rigorous internal change management
process. Evaluation and implementation plans are developed
by a cross-functional team of technical content experts and
then reviewed and approved by a board of management
representatives from several different areas within the company.
Quality Certifications Cirrus Logic requires all suppliers to be
ISO 9001:2015, ISO/TS16949, and ISO
14001 certified. Cirrus Logic also main-
tains a Sony Green Partner certification
for environmental standards.
Visual inspections support the product
quality evaluation process
ISO 9001QMS CERTIFIED

5Cirrus Logic Quality Handbook
Environmental and Social ResponsibilitiesCirrus Logic is actively committed to protecting the environment by reducing the amount of hazardous substances
in our products. Cirrus Logic is working with customers and suppliers to exemplify industry standards of
environmental and social responsibility.
RoHS (Restricted Use of Hazardous Substances)The Restriction of Hazardous Substances
Directive 2002/95/EC (RoHS 1) was adopted in
February 2003, effective July 2006 by the
European Union (EU). This regulation restricted the use of
Lead (Pb), Mercury (Hg), Cadmium (Cd), Hexavalent chromium
(Cr6+), Polybrominated biphenyls (PBB), and Polybrominated
diphenyl ether (PBDE). A RoHS recast 2011/65/EU (RoHS 2)
took effect in January 2013 clarifying scope and implementation
of the RoHS regulation. Directive 2015/863 amending Annex
II to Directive 2011/65/EU added four additional substances
Bis(2-ethylhexyl) phthalate (DEHP), Butyl benzyl phthalate
(BBP), Dibutyl phthalate (DBP), Diisobutyl phthalate (DIBP)
with enforcement by July 2019.
All integrated circuits (ICs) produced after 2021 are compliant
with the provisions of the RoHS agreement. Before 2021,
Cirrus Logic products use a “CS” prefix in their part numbers
and are designated with a “Z” suffix if they are also RoHS
compliant. Products acquired through the 2014 acquisition of
Wolfson Microelectronics use a “WM” prefix and are all RoHS
compliant if manufactured after 2007.
REACH (Registration, Evaluation, Authorization and Restriction of Chemical Substances)REACH is the European Union (EU) regulation on
chemicals and their safe use (EC 1907/2006). It
covers the Registration, Evaluation, Authorization
and Restriction of Chemical Substances. The law went into
force in the EU on July 1, 2007. The REACH regulation identifies
substances of very high concern (SVHC).
Substances of very high concern are not intentionally added
to Cirrus Logic products. For this reason, Cirrus Logic has
determined that its IC products are non-emitting articles as
defined by the REACH regulation. This means that SVHC are
not intended to be released under normal or reasonably
foreseeable conditions of use. Consequently, Cirrus Logic
products do not emit any SVHC in concentrations greater than
0.1% by weight. Because the SVHC list is updated several
times per year, Cirrus Logic does take the necessary steps to
monitor REACH regulations. If there are any material changes,
this disclosure will be updated as warranted.
Conflict MaterialsCirrus Logic takes very seriously the worldwide
concerns that the use of certain minerals that
originated in the Democratic Republic of Congo
(DRC) or an adjoining country may be directly or indirectly
financing human rights violations or benefiting armed groups
within those countries. In addition, Cirrus Logic is committed
to complying with all reporting requirements relating to these
“conflict minerals (3TG)” as adopted by the Securities and
Exchange Commission (SEC) on August 22, 2012.
Section 1502 of the 2010 Dodd-Frank Wall Street Reform Act
(US HR-4173) requires SEC reporting companies to make an
annual disclosure of any gold, tin, tantalum, and tungsten that
originates from conflict mines in the region of the Democratic
Republic of the Congo. Annual disclosure is necessary for the
ongoing production or sale of manufactured products.
As a member of the RMI organization, Cirrus Logic expects
its suppliers to obtain materials through environmentally and
socially responsible supply chains. In support of that effort,
we are utilizing the Responsible Minerals Initiative (RMI)
(previously CFSI), Responsible Business Alliance (RBA)
(previously EICC) and the Global e-Sustainability Initiative
(GeSI) Conflict-Free Smelter Program (CFSP), and Conflict
Minerals Reporting Template (CMRT).
Each year, all Cirrus Logic suppliers must use the industry
standard Conflict Minerals Reporting Template to report the
origin of the metals they use. In addition, they are required
to report:
• Evidence of a Corporate Policy on the use of metals from
the DRC
• Acknowledgement of Cirrus Logic’s Conflict Minerals
Policy Statement
• Verification of the procedures in place to demonstrate
compliance with this policy
RoHS
REACH
CFSI

6 For more information, visit cirrus.com
Global Quality NetworkCirrus Logic maintains an extensive network of facilities strategically located to support our global design
centers, supply chain partners and customer base. It is within this network where new products come to
life. Reliability labs are utilized to test the robust nature of product designs, and product analysis labs are
tasked with identifying the root causes of performance limitations once a product is deployed. In addition,
Cirrus Logic has strategically placed software development centers that support the development, testing
and implementation of our SoundClear® software.
Phoenix USASoftware Development
Center, Marketingand Sales
Cupertino USAProduct, Software
Development,Marketing and Sales
Salt Lake City USASoftware Development
Austin USAProduct, Software
Development, Reliability and Analysis Lab,
Marketing and Sales
Edinburgh, Londonand Newbury UK
Product, SoftwareDevelopment, Reliability
and Analysis Lab,Marketing and Sales
Seoul KRCustomer QualityEngineering Lab,
Marketing and Sales
Shanghai CHNCustomer QualityEngineering Lab,
Marketing and Sales
6 For more information, visit cirrus.com

7Cirrus Logic Quality Handbook
The Jason P. Rhode Center for Semiconductor Research encompasses more than 13,000 square feet and
houses the industry’s most advanced, state-of-the-art analytical equipment to support our quality management
initiatives. Located near the Cirrus Logic headquarters in downtown Austin, Texas, this lab facilitates collaboration
between our design engineering and support teams in the development and debugging of new product designs,
product qualification and product analysis. In addition, the state-of-the-art equipment is utilized to accelerate
environmental and product life cycle testing.
The Jason P. Rhode Center for Semiconductor Research in Austin, Texas

8 For more information, visit cirrus.com
Quality is built in from the beginning. It cannot be added in later.
The PDP is the process of building in quality.
The Product Development ProcessCirrus Logic’s Product Development Process (PDP) defines the company’s process for IC product development.
The PDP is the systematic execution of product development from concept through production release. The
PDP is tailored to fit each new project so there is flexibility to support the needs of multiple product lines. It is
through the PDP that Cirrus Logic integrates all the essential phases of product realization to achieve a rapid
and error-free ramp to production.
8 For more information, visit cirrus.com
Marketing Concept,Product Requirements
PHASE 0
PHASE 1
Architecture andDetailed Planning
PHASE 2
Development Implementationand Verification
Quality Builtat Every Phase
Cirrus Logic’sProduct Development
Process
PDP
PHASE 3
Silicon Bring-UpInitial Customer Samples
PHASE 4
Validation and Qualification
PHASE 5
Production Readinessand Ramp
USE THIS ONE FOR THE BOOK

9Cirrus Logic Quality Handbook
Phase gates are management checkpoints within the PDP. These checkpoints define the required deliverables
that must be evaluated at each phase. The decision is then made whether or not to proceed to the next phase.
PDP reviews are held at phase exits and within phases to help management make informed decisions for
product success. Continuous improvement is facilitated and corrective actions are driven as needed. All elements
of product development are coordinated to enable successful release to production. Corporate quality
specifications apply to all products and are woven into the PDP. Any custom products or sustained engineering
activities designed to enhance products already in the marketplace also follow the PDP.
PHASE 0
Marketing Concept and Product RequirementsPrior to Phase 0 is business review. This step, along with Phase
0, serves as the "think tank" for identifying potential new
product concepts. It is during this phase that a business case
is developed and the strategic fit of the project is determined,
taking into consideration its alignment with the company's
current technology, markets and customers. Phase 0 provides
the details on what is going to be built and feasibility for
readiness to ramp a team.
The key objectives of Business Review and Phase 0:
Product marketing identifies key customers and works to
build the business case. First pass requirements for
technical and financial milestones are defined.
Product features and performance requirements are
identified and evaluated, as well as any software requirements.
Preliminary intellectual property (IP) blocks are summarized
for both analog and digital design elements.
Quality and support requirements are specified with respect
to temperature grade, characterization and all necessary
qualification requirements.
Product support materials are defined by the applications
group. The product development schedule and a preliminary
product launch plan are drafted.

10 For more information, visit cirrus.com
PHASE 1
Architecture and Detailed PlanningPhase 1 takes the product concepts approved at Phase 0
and defines the key feature sets and the circuit architecture
for the new IC.
The key objectives of Phase 1:
Feasibility Assessment An engineering pre-architectural analysis is used to determine
if the requested requirements are achievable. Architectural
scoping is used to identify any potential limitations and the
necessary corrective actions.
Target IC Data SheetA draft product data sheet is generated that outlines the
preliminary product specifications and describes the function
of the IC in relation to the system level requirements. A block
diagram is used to capture the main functionality of the IC. It
shows all major components of the design, and an effort is
made to make each block open to future developments and
extensions. For a mixed-signal IC, the chip is divided into
analog and digital domains. The test strategy is elaborated
and the preliminary characterization and validation plan is
defined, while the means to debug each block independently
on the bench is identified. Test time reductions and methods
to eliminate multiple test insertions are given consideration.
Systems Architecture Specification (SAS)The SAS outlines the preliminary specifications covering
components, software and required evaluation boards. The
final SAS deliverable is a comprehensive description of the
environment in which the IC will operate, as well as how the
proposed solution meets market requirements.
Software Systems Architecture The development of software architecture is used to define the
necessary requirements to make the system operational. The
proposed environment in which the software will operate is
described with respect to the overall platform, operating system
or RTOS, volatile memory, permanent storage, and primary
input and output. The input and output of the software are
described, including layouts and formats where applicable.
Any significant impact that the software will have on the overall
environment also is identified.
Platform Hardware Systems ArchitectureThis is a description of the printed circuit boards and other
electrical circuits that require development in order to make the
system operational. Typically, these boards are designed to
meet system specifications for operating conditions and absolute
maximum ratings for parameter, supply voltage and supply
current, and any design constraints on the board are described
and documented. Relevant electrical specifications for the board
also are provided.
IC/Firmware Verification Plan This plan outlines the firmware/software requirement
specification which details the project’s required hardware
and software characteristics and functionality. Data types that
must be available to the customer are identified, either by the
use of application development tools, or by the use of forms,
displays, reports, and printouts. The actual application
development environment is created so that control structures
can be made available to the customer.
Qualification PlanThe “Qual Plan” is used for demonstrating field reliability. All
required stresses, number of lots, units per lot, and pre-
conditioning requirements are specified. All necessary process
and device qualification data (including reliability results) is
documented.
Initial Risk AssessmentThis assessment evaluates the technical, schedule and market
risks that could impact the project. Impact analysis and
mitigation plans are made.

11Cirrus Logic Quality Handbook

12 For more information, visit cirrus.com
PHASE 2
Development Implementation and Verification
During Phase 2, the design architecture of the product is
completed and its readiness for fab release is validated.
Hardware manufacturing also is supported in this phase, along
with identifying and resolving environmental compliance issues.
The key objectives of Phase 2:
IC Sub-System Specifications The IC sub-system specifications identify the initial top level
schematics and system verilog (SV) behavioral models. All
known block IOs are created and the expected block area for
the IC is determined. The layout team works to create a block
abstract view and the process is completed with an architectural
review and the closure of all action items. Analog blocks go
through five phases: (1) verify, (2) planning, (3) layout, (4) design,
and (5) architecture. This results in complete block specifications,
determination of how specifications will be tested and
enumeration of all required block interfaces. Digital blocks go
through three phases: (1) architect, (2) design, and (3) planning.
This results in the completions of the IP block design, including
block specifications, determination of how specifications will
be tested at block and chip level, and enumeration of all
required block interfaces.
IC VerificationThe verification review provides an audit of design results to
assure compliance to the design methodology standards
and is held prior to the layout review. The layout review
validates the physical design of the IC and addresses any
design issues, such as cross talk and digital noise
management. Manufacturing issues in need of validation
include metal migration, ESD and latch-up.
Hardware schematic and layout reviews for the engineering
evaluation board (EEB) and the customer demo board (CDB)
are then completed. A quality readiness review organizes
all the supporting documentation needed to proceed with
the qualification.
Quality Built InThe emphasis on quality
at this phase of product
development is critical.
13Cirrus Logic Quality Handbook
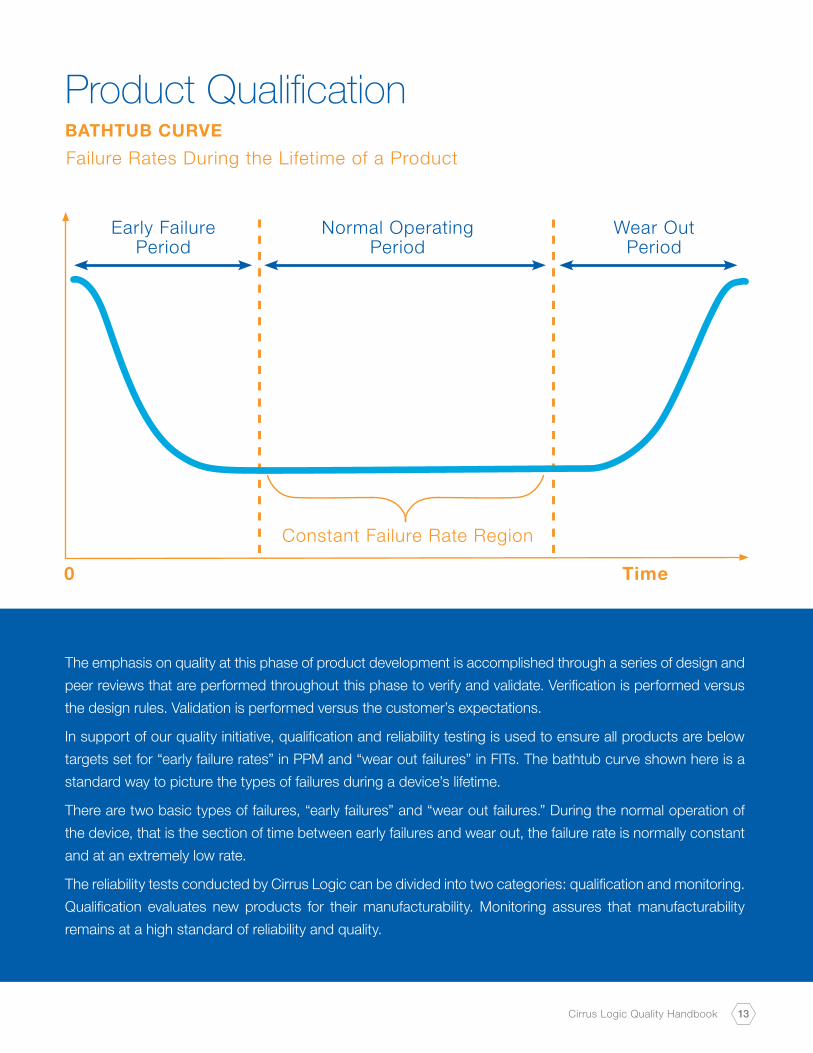
The emphasis on quality at this phase of product development is accomplished through a series of design and
peer reviews that are performed throughout this phase to verify and validate. Verification is performed versus
the design rules. Validation is performed versus the customer’s expectations.
In support of our quality initiative, qualification and reliability testing is used to ensure all products are below
targets set for “early failure rates” in PPM and “wear out failures” in FITs. The bathtub curve shown here is a
standard way to picture the types of failures during a device’s lifetime.
There are two basic types of failures, “early failures” and “wear out failures.” During the normal operation of
the device, that is the section of time between early failures and wear out, the failure rate is normally constant
and at an extremely low rate.
The reliability tests conducted by Cirrus Logic can be divided into two categories: qualification and monitoring.
Qualification evaluates new products for their manufacturability. Monitoring assures that manufacturability
remains at a high standard of reliability and quality.
Product QualificationBATHTUB CURVE
0 Time
Early Failure Period
Wear Out Period
Normal Operating Period
Constant Failure Rate Region
Failure Rates During the Lifetime of a Product

14 For more information, visit cirrus.com
PHASE 3
Silicon Bring-Up and Initial Customer SamplesPhase 3 sets the stage for a successful product launch. All
applicable hardware is finalized and has been tested for stable
performance. The product data sheet is released to production.
The key objectives of Phase 3:
The product launch plan is presented to the product
development and management teams.
The design phase lessons learned is completed based
on the knowledge gained in Phases 1 and 2, with key
actions taken.
The Qualified Parts List (QPL) level 2 checklist is completed.
Any issues are identified and resolved.
The preliminary validation and characterization reports are
completed. Any issues are identified and resolved.
First customer samples are delivered (up to 10K parts) and
the stage is set for a successful product launch.
At the Phase 3 Exit meeting, the decision whether to advance
to Phase 4 is made. But regardless of the “go or no go”
decision, an Engineering Postmortem is conducted as part
of the Cirrus Logic continuous improvement philosophy. This
postmortem is conducted by a cross-functional team that
evaluates the PDP process for each individual product and
assesses the project in terms of what went well and what
could be improved. Any identified improvements can then be
implemented and fanned out to subsequent projects.
PHASE 4
Validation and QualificationPhase 4 involves the limited release of product that has been
qualified and evaluated. All validation, qualification, and
characterization plans are completed in preparation for the
full ramp to high volume production. Customer parts can be
shipped according to corporate quality specifications.
The key objectives of Phase 4:
The Customer Reference Design (CRD) datasheet is
released to production.
The preliminary data sheet for the IC is frozen. New content
updates in this phase are limited to changes in specification
values to reflect new characterization data or production
test limits, as well as the addition of new information to the
applications section that addresses new issues or routine
customer questions. Other revisions also may involve
corrections to any inaccurate information from the previous
release of the data sheet and updates to the part ordering
information. Incorporation of any known errata that the
team decides will not be fixed at the time of sign-off can
be added at this time.
The final results of IC validation, characterization and matrix
lot reviews are examined. Detailed analyses of sightings
and resulting actions are performed, documented and
presented.
The final production test methodology, characterization
and hardware investigations are reviewed. The status of
the production test program is compared to the original
test plan. Test coverage and yield to date are reviewed for
all program releases.

15Cirrus Logic Quality Handbook
Product qualification is important for determining
field reliability

16 For more information, visit cirrus.com
Product qualification is performed in-house as part of the design validation process

17Cirrus Logic Quality Handbook
PHASE 5
Production Readiness and RampPhase 5 is full production readiness and ramp. All package
and silicon qualification, validation and characterization is
completed.
The key objectives of Phase 5:
The post-silicon phase lessons are completed based on
the knowledge gained during phases 3, 4 and 5, with key
actions taken.
Upon completion of all activities, a Phase 5 Exit meeting
is held and the decision is made whether to release to full
production.
A Business Postmortem is conducted as part of Cirrus Logic’s
continuous improvement philosophy. A postmortem allows
the team to evaluate the PDP process for each individual
product and assess the project in terms of what went well
and what could be improved. Any identified improvements
can then be implemented and fanned out to subsequent
projects.
The key business process issues to review are:
What went well?
What ideas/practices do we want to port to other projects
(keep doing)?
What ideas/practices did we do that we did not see
adding value (stop doing)?
What new ideas/practices should we add to improve the
next project (try doing)?
What needs improvement?
What mistakes occurred that impacted quality or schedule
that we could avoid on the next project?

18 For more information, visit cirrus.com
Software QualityDevelopment ProcessAs part of the PDP process, quality metrics are integrated into
the development of software and firmware associated with
specific Cirrus Logic IC products. This approach ensures the
technology involved is of the highest standards.
A number of defined processes and methodologies are included
in all firmware releases. Software for the company’s wide range
of “smart codecs” follows the multi-phase AGILE development
process that encompasses a group of methods in which
requirements and solutions evolve through collaboration
between self-organizing, cross-functional teams. This approach
uses adaptive planning, evolutionary development, early delivery
and continuous improvement to promote rapid and flexible
response to change.
The proprietary tools and drivers that support the software
modules follow a slightly different development flow. Each
phase of development has associated reviews, usually at the
end of each phase, to evaluate deliverables and determine
what actions are required to progress.
A phase may contain a number of stages with an associated
review meeting. In the early phases of the project, taking time
to review ensures that the scope of the project, the commitment
of resources, the budgetary considerations, and the scheduling
for the proposed deliverables are all thoroughly outlined in the
business case. An outline of the possible risks associated with
the project versus the level of confidence regarding successful
completion is also included. This activity leads to a viable
development plan and a final agreement on the deployment
schedule. Later in the project, having review stages within
each phase allows incremental implementation, testing and
release of the agreed upon feature set.
Audio testing labs are used throughout the
software development process

19Cirrus Logic Quality Handbook
Test IntegrationTesting is carried out at all phases of code development. A
number of levels of testing are utilized. Audio algorithms are
initially developed and tested within MATLAB®, an interactive
environment for algorithm development. Once the algorithm
has been completed it is coded and simulated for the DSP
embedded in the smart codec. Once hardware is available
the firmware containing the algorithm is downloaded and
tested on an evaluation board before being loaded into a form
factor demonstration platform, or a customer’s device for final
testing and tuning.
Tests may be derived from the initial test specification or may
be added as a result of a defect that’s been identified. Defects
are submitted by developers, testers and early-adoption
customers. All defects are subsequently tracked to resolution.
As part of the development process, software solutions may
be submitted to external agencies for independent testing and
verification to ensure industry compliance.
Customer devices are tested in application specific lab settings
to ensure delivery of a quality product
20 For more information, visit cirrus.com
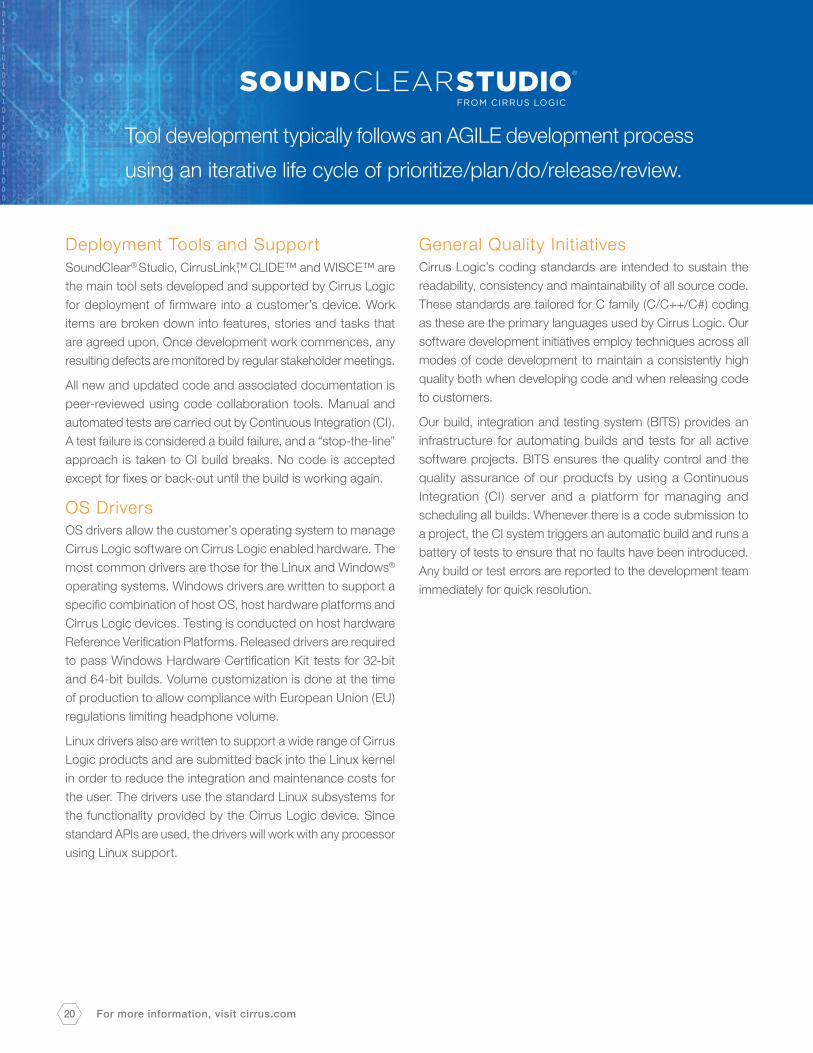
Deployment Tools and SupportSoundClear® Studio, CirrusLink™, CLIDE™ and WISCE™ are
the main tool sets developed and supported by Cirrus Logic
for deployment of firmware into a customer’s device. Work
items are broken down into features, stories and tasks that
are agreed upon. Once development work commences, any
resulting defects are monitored by regular stakeholder meetings.
All new and updated code and associated documentation is
peer-reviewed using code collaboration tools. Manual and
automated tests are carried out by Continuous Integration (CI).
A test failure is considered a build failure, and a “stop-the-line”
approach is taken to CI build breaks. No code is accepted
except for fixes or back-out until the build is working again.
OS DriversOS drivers allow the customer’s operating system to manage
Cirrus Logic software on Cirrus Logic enabled hardware. The
most common drivers are those for the Linux and Windows®
operating systems. Windows drivers are written to support a
specific combination of host OS, host hardware platforms and
Cirrus Logic devices. Testing is conducted on host hardware
Reference Verification Platforms. Released drivers are required
to pass Windows Hardware Certification Kit tests for 32-bit
and 64-bit builds. Volume customization is done at the time
of production to allow compliance with European Union (EU)
regulations limiting headphone volume.
Linux drivers also are written to support a wide range of Cirrus
Logic products and are submitted back into the Linux kernel
in order to reduce the integration and maintenance costs for
the user. The drivers use the standard Linux subsystems for
the functionality provided by the Cirrus Logic device. Since
standard APIs are used, the drivers will work with any processor
using Linux support.
General Quality InitiativesCirrus Logic’s coding standards are intended to sustain the
readability, consistency and maintainability of all source code.
These standards are tailored for C family (C/C++/C#) coding
as these are the primary languages used by Cirrus Logic. Our
software development initiatives employ techniques across all
modes of code development to maintain a consistently high
quality both when developing code and when releasing code
to customers.
Our build, integration and testing system (BITS) provides an
infrastructure for automating builds and tests for all active
software projects. BITS ensures the quality control and the
quality assurance of our products by using a Continuous
Integration (CI) server and a platform for managing and
scheduling all builds. Whenever there is a code submission to
a project, the CI system triggers an automatic build and runs a
battery of tests to ensure that no faults have been introduced.
Any build or test errors are reported to the development team
immediately for quick resolution.
Tool development typically follows an AGILE development process
using an iterative life cycle of prioritize/plan/do/release/review.

21Cirrus Logic Quality Handbook
Building Quality Through Supplier RelationshipsSupplier Quality ManagementA key component to the Cirrus Logic commitment to quality
is an underlying foundation of integrity in our supplier
relationships. To achieve this high standard, supplier
performance is rated according to quality, delivery, provision
of required certificates, and test reports.
Cirrus Logic follows a Supplier Code of Conduct for selecting
and managing our network of suppliers. Within our organization,
suppliers are managed in partnership with the supplier quality
and supply chain operations. Suppliers are selected based
on a number of criteria which include financial viability, ISO9001/
TS16949 certifications and a manufacturing capability
assessment audit. Various methods are then used to manage,
measure and drive continuous improvement within these
relationships, including quarterly reviews, scorecards, annual
audits, supplier development goals, process yields, and overall
quality performance.
Cirrus Logic conducts regular audits that are more rigorous
than ISO9001 requirements. These audits not only assess
system compliance but also effectiveness and continuous
improvement. Scorecards are reviewed with each supplier
quarterly. These include a quality component based on
effectiveness of corrective actions, frequency of customer
returns, inline deviations, and yield. If a supplier fails to meet
Cirrus Logic’s requirements, resolution may involve corrective
action or disqualification, depending on the nature and severity
of the problem.

22 For more information, visit cirrus.com
A Systematic ApproachBased on a commitment to continuously improve our supplier
base, Cirrus Logic provides engineering and statistical support
to each supplier to help them effectively utilize traditional
improvement tools such as statistical process control and
design of experiments. Additionally, innovative techniques like
ISTAB, smart sampling and statistical bin limits are created
and shared. Cirrus Logic utilizes this systematic approach to
achieve higher quality and better performance at each point
of the supply chain. This approach consists of three sub-
processes that are mutually supportive: audit, feedback and
development.
The audit process consists of self-audits in advance preparation
for on-site audits. Annual (or biennial) on-site audits provide
the supplier with Cirrus Logic’s perspective on the efficiency
and effectiveness of the supplier’s operations. These audits
cover the supplier’s quality management system, corrective
action follow–up and targeting of specific areas of the operation
to improve quality through best practices.
The feedback portion of this process is the quarterly business
reviews (QBR) which are held at each supplier’s site. In the
QBR, the quality and operational performance of the supplier
are examined and goals are set. Finally, the development
process consists of setting and tracking annual development
goals. Performance to goal is reviewed monthly with the
expectation of continued supplier improvement.
FEEDBACK
AUDIT
DEVELOPMENT
SUPPLIERCIRRUS LOGIC

23Cirrus Logic Quality Handbook
Manufacturing Continuous ImprovementThe Continuous Improvement Process (CIP) is an ongoing
effort applied to the products, processes, services, and
systems at Cirrus Logic’s supply chain partners. These efforts
drive improvement over time or breakthrough improvement
all at once. Among the most widely used tools for continuous
improvement: PDCA (plan-do-check-act) cycle, Six Sigma
and TQM (Total Quality Management). These tools emphasize
employee involvement and teamwork, measuring and
systematizing processes, and reducing variation, defects and
cycle times.
Supplier Code of ConductAs part of Cirrus Logic’s commitment
to the highest standards of product
quality, the company’s Supplier Code
of Conduct guides the business
integrity in all third party supplier
relationships. This code is comprised
of five sections covering labor, health
and safety, environment, business ethics and managing
conformity to the code. Based on this code, Cirrus Logic
commits to ensuring that working conditions across our
supply chain are safe; that workers are treated with respect
and dignity; and that manufacturing processes are
environmentally and socially responsible.
To ensure our relationships with suppliers meet and support
these expectations, the Cirrus Logic Supplier Code of Conduct
exceeds the RBA Code of Conduct. As a condition of doing
business with Cirrus Logic, suppliers are expected to conform
to these requirements and communicate the basics of the
code to their suppliers. Cirrus Logic representatives may visit
supplier facilities with or without notice to assess compliance
to these requirements and will consider a supplier’s
conformance when making sourcing and procurement
decisions. Failure to comply with the standards and provisions
set forth in the Cirrus Logic Supplier Code of Conduct may
result in a supplier’s disqualification.
The code also requires suppliers to commit to operate in full
compliance with the laws, rules and regulations of the countries
in which they operate. This encourages, and in some cases
requires, suppliers to go even further, drawing upon
internationally recognized standards in order to advance social
and environmental responsibility and business ethics.

24 For more information, visit cirrus.com
Our Commitment To QualityCustomer Quality Management, Keeping Customers FirstCirrus Logic’s commitment to quality extends beyond product
quality to the integrity across all of our business relationships.
Cirrus Logic’s Customer Quality Management Program focuses
on providing world-class support to our customers. Customer
Quality Engineering teams are located strategically around the
globe to ensure the delivery of immediate support to our
customers through a coordinated effort between our business
units and technical teams.
Customer Change ManagementWithin our Customer Quality Management Program, activities
involving product change notifications (PCNs) and product
discontinuations (End of Life, EOLs) represent one of the most
compelling drivers of customer communications. Cirrus Logic
acknowledges the importance and priority of helping our
customers navigate these changes. Cirrus Logic follows
generally accepted industry standards for notifying customers
of any changes that are classified as “Major” and provide a
90-day review period. Major changes are classified as any
change that affects product form, fit, function or reliability.
Customers are notified of product EOLs through our PCN
system. Customers have a minimum of 180 days from the
date of notification to place final orders and 360 days from the
date of notice to accept final shipments. In the rare situation
Cirrus Logic is not able to meet these notification timelines for
an EOL situation, every effort is made to provide customers
with as much advanced notice as possible.
Product Return ProcessReports of product non-compliance are treated seriously by
Cirrus Logic. Our global customer quality and field sales teams
can be contacted directly to begin determining the best path
for solving an issue. If it is determined that the best course of
action is to return the effected parts to Cirrus Logic, then the
company’s standard customer return process flow will be
followed. The customer return process flow is adapted as
needed in order to address the specific product issue and to
provide the most efficient resolution for our customer.
Throughout this process, customers receive ongoing
communications to keep them current on investigation efforts
and the resultant findings. This can include verification of the
specific problem, recommendations on containment, root
cause, and the final corrective and preventative actions that
are applicable.
Customer returns are tracked in a corporate-wide system
that gathers metrics regarding incidents, processing cycle
times and failure mechanisms. These metrics are reviewed
monthly and quarterly with our business and operations
teams to drive continuous improvement throughout the
product design, manufacturing fabrication, assembly, test,
and shipping processes.
Product TraceabilityThe customer return process flow is brought full circle through
the use of unique package markings which enables material
traceability for all Cirrus Logic products. This information is
retained within a central storage database and can be used
as a part of material containment in case of an issue.

25Cirrus Logic Quality Handbook
Customer Return Process Flow
25Cirrus Logic Quality Handbook
Submit final report to customer
Device product analysis
Generate the tracking number in the database
Initial review of the reported issue
Customer reports a quality issue
Generate initial or interim reports and send to customer
Failure verification
8D process
Generate no trouble found
final report
Additional tests/analysis
required?
Failure verified?
Sample required to evaluate/ analyze?
Sample incoming inspection and preparation
Generate final report
Yes
Yes
Yes
No
No
No
26 For more information, visit cirrus.com
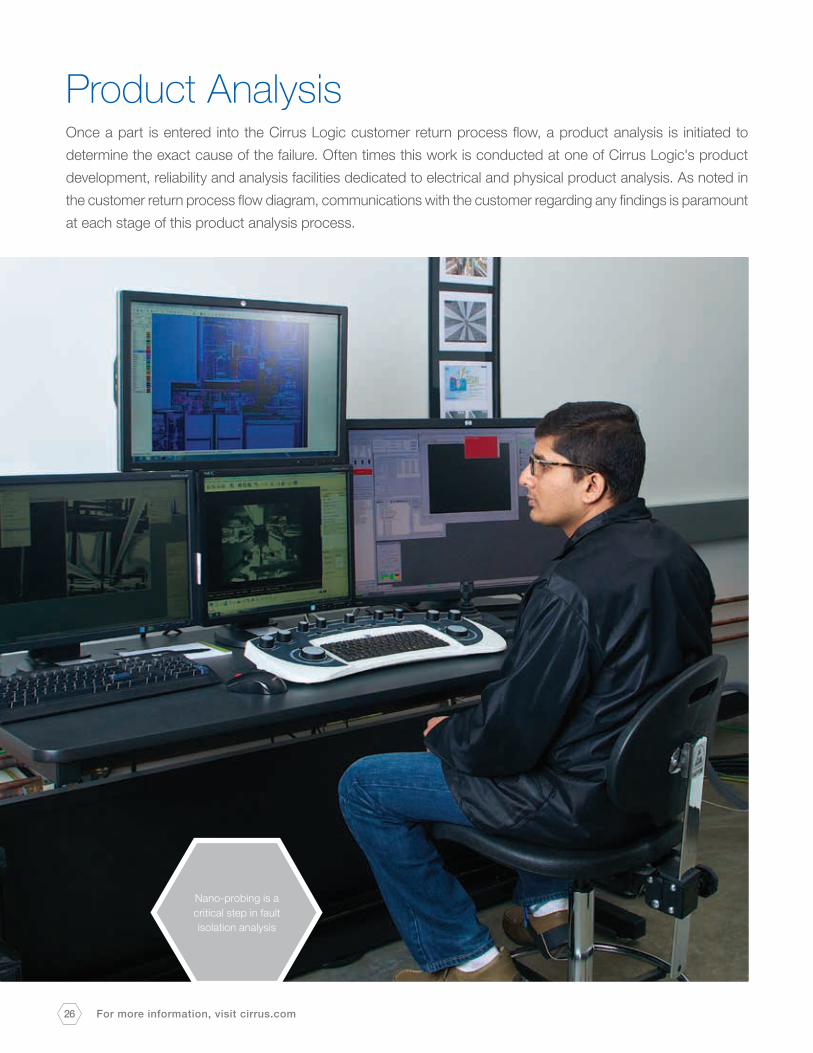
Product AnalysisOnce a part is entered into the Cirrus Logic customer return process flow, a product analysis is initiated to
determine the exact cause of the failure. Often times this work is conducted at one of Cirrus Logic's product
development, reliability and analysis facilities dedicated to electrical and physical product analysis. As noted in
the customer return process flow diagram, communications with the customer regarding any findings is paramount
at each stage of this product analysis process.
Nano-probing is a critical step in fault isolation analysis

27Cirrus Logic Quality Handbook
Replicating the FailureThe first step in the product analysis process is to reproduce
and verify the exact nature of the failure to determine if it matches
the reported symptom. The laboratory utilizes ATE testers for
verifying functional failures, engineering evaluation boards (EEB’s)
for verifying analog failures, and a switchboard matrix board for
verifying DC parametric failures.
Package Level Analysis Optical 2D and 3D microscopes with various imaging modes
are used for incoming inspections. Non-destructive board
level solder ball or lead joints and plastic package bond wire
integrity checks are performed on the X-ray tool. Acoustic
microscopy is also performed to inspect the package for
delamination and other package level failure mechanisms.
Package ConditioningFor WLCSP packages, Cirrus Logic uses defined processes
to remove the part from the customer board and to remove
the underfill and re-ball the device. For plastic packages, a
toolset consisting of hot and cold acid de-capsulators and
laser assisted de-capsulators are used to expose the die for
further analysis. A backside sample polishing tool is utilized
to expose or thin down samples for subsequent electrical
fault isolation analysis.
Electrical Fault Isolation Cirrus Logic’s in-house developed FA hardware designs
support a multitude of package types and pin counts ranging
from QFN and TSSOP, to WLCSP and BGA. The setups are
geared towards topside and backside electrical fault isolation
techniques. A locking thermography system for dynamic
infrared (IR) thermal emission analysis is utilized to accurately
and efficiently narrow down the location of the failure, often
emitting power levels as low as microwatts. A near IR
optimized light emissions analysis (LEM) tool coupled with
an IR laser overlay is used to detect and isolate IC defect
categories including junction leakage, gate defects, latch
up, ESD, and floating nodes. Laser-based techniques such
as TIVA, OBIRCH, OBIC, LIVA, and LADA are most frequently
used for through silicon point emission analysis. FIB assisted
partitioning, passive voltage contrast and access point
creation are used to further isolate the failing node.
A package x-ray is performed to verify the condition of the package integrity
Hotspot observed on the device

28 For more information, visit cirrus.com
Nanoprober Nanoprober
Atomic Force MicroscopyAtomic Force Microscopy (AFM) uses a scanning probe
microscope (SPM) to measure local properties of the element
under examination, such as height, friction, and magnetism.
To acquire an image, the SPM raster scans a probe over a
small area of the sample, measuring the local property
simultaneously. In the field of semiconductor physics, for
example, (a) an identification of atoms at a surface, (b) an
evaluation of an interaction between a specific atom and its
neighboring atoms, and (c) a change in physical properties
arisen from a change in an atomic arrangement through the
atomic manipulation have been studied.
Advanced Electrical AnalysisIsolating the failing node based on emission data, and
sometimes lack of abnormal emissions, requires exhaustive
and time intensive functional microprobing. This step requires
developing a CAD layout and schematic review; creating
probe points to die level metalization; and probing identified
nodes to pinpoint the failure. Scanning electron microscope
(SEM) based nanoprobing is utilized to handle small feature
process geometries in addition to fault isolation methods
such as EBAC. Atomic Force Microscopy (AFM) is used for
nano scale electrical characterization including conductive
and tunneling imaging to produce a map of P, N and resistive
characteristics of the sample area. Focused ion beam (FIB)
tools that support gas chemistries to selective etch or deposit
metals, polymers and insulators are used to perform circuit
edits for design debugs.
Incoming inspections
Prep for test
ATE/bench test
Probing and fault isolation
Physical deprocessing
Emission microscopy
Product analysis report
Typical Product Analysis Flow

29Cirrus Logic Quality Handbook
Physical AnalysisThe optical inspection toolset consists of various microscopes
that support 3D, dark field, confocal, and bright field imaging.
A combination of plasma dry etching and chemical assisted
wet etching is used to deprocess the sample, layer by layer.
Mechanical cross sections of packages, qualification vehicles
and layer removal in the area of interest are conducted on
industry standard polishing tools. Precision cross sectioning
and high resolution images of the defects is achieved on the
dual beam FIB tools. This toolset also supports SEM based
TEM imaging required for nanoscale defects. SEM/EDS X-ray
elemental analysis is used to identify the defects for subsequent
corrective actions at the foundry or assembly.
Use of Focus Ion Beam (FIB) Tools to Debug Circuit Designs
STEM Image
FIB Cross Section
Join Metal
Circuit Edit
Passive Voltage Contrast Image
Cut Metal

30 For more information, visit cirrus.com30 For more information, visit cirrus.com

31Cirrus Logic Quality Handbook 31Cirrus Logic Quality Handbook
Appendix A: Product Reliability Operations 32
Appendix B: ESD Latch-Up Testing 35
Appendix C: Moisture Sensitivity Levels 37
Appendix D: White Papers 38

32 For more information, visit cirrus.com
Appendix AProduct Reliability OperationsReliability test conditions follow Cirrus Logic Integrated Circuit
Qualification Specifications, applicable JEDEC standards, or
AEC Q100. When conflicts arise, JEDEC standards are followed
for commercial products and AEC standards are followed for
automotive products.
Devices which undergo stress tests are required to pass the
same electrical and functional tests from start to finish. Analysis
of non-conforming units is required; root causes are identified
and corrective actions are taken as necessary.
High Temperature Operating Life (HTOL)Applicable JEDEC standard: JESD22-A108
HTOL is an intense stress test performed to thermally and
electrically accelerate failure mechanisms through the
application of extreme temperature and dynamic biasing
conditions. Typically, it is performed at +125°C with bias levels
at the maximum data sheet specifications or greater. HTOL
performance is considered to be a measure of the intrinsic
reliability of the design and manufacturing process taken
together. HTOL results are quoted in failures per billion device
hours, aka “failures in time” (FIT).
Early Life Failure Rate (ELFR)ELFR is considered a reliability measure of the manufacturing
process used for the product. This is because the failure rate
can depend on age due to latent defects introduced by the
process. Early life testing is performed to estimate this failure
rate, usually quoted in defects per million opportunities (DPM)
in the first three months to one year of life. If unacceptable
early failure rates are encountered, they can be mitigated by
production burn-in or wafer level stress screens until the
manufacturing process is made more robust.
Device specific conditions of maximum VSSs (or greater), I/O
loading and clock rate are applied to exercise the maximum
amount of digital circuitry while full scale ranges are applied
to exercise the analog circuitry. The failure rate is calculated
for +125°C conditions and the failure rate is de-rated to use conditions. The need for production stress screening is
determined based on the predicted failure rate under use
conditions.
Low Temperature Operating Life (LTOL)Applicable JEDEC standard: JESD22-A108
LTOL is stress test performed to activate failure mechanisms
that are accelerated by lower temperature (e.g. Hot carrier
degradation). Typically, it is performed at ambient temperatures
of -40°C with bias levels at the maximum data sheet
specifications or greater. LTOL performance is considered to
be a measure of the intrinsic reliability of the design and
manufacturing process taken together. LTOL results are quoted
in failures per billion device hours, aka “failures in time” (FIT).
High Temperature Storage Life (HTSL)Applicable JEDEC standard: JESD22-A103
HTSL determines the effect of time and temperature under
controlled storage conditions for thermally activated failure
mechanisms. Devices are stressed in a chamber at extreme
levels of temperature for various periods of time.
Stress conditions are:
Temperature = +150°C
Time = 1000 hours
Low Temperature Storage Life (LTSL) Applicable JEDEC standard: JESD22-A119
LTSL, like HTSL determines the effect of time and temperature
under controlled storage conditions for thermally activated
failure mechanisms. Devices are stressed in a chamber at
extreme levels of temperature for various periods of time.
Stress conditions are:
Temperature = +40°C
Time = 1000 hours
Preconditioning (PC) Applicable JEDEC standard: JESD22-A113, J-STD-020
Pre-conditioning consists of a bake, soak and reflow, and is
used to simulate the PC board assembly process. This assures
that the units going into an accelerated test would have survived
the assembly process.
Temperature Humidity Bias (THB) Applicable JEDEC standard: JESD22-A101
THB assesses device and package resistance to prolonged
temperature, humidity and electrical stresses. Devices are
stressed under extreme temperature and humidity conditions.
The devices are subjected to maximum differential bias on
alternating pins while under stress conditions.
Stress conditions are:
Temperature = +85°C
Humidity = 85% RH
Time = 1000 hours with interim read
points at 100 and 500 hours
Voltage bias levels are product dependent.

33Cirrus Logic Quality Handbook
Biased Highly Accelerated Stress Test (HAST)Applicable JEDEC standard: JESD22-A110
Like THB, HAST simulates extreme operating conditions and
assesses the moisture resistance of the product’s external
protective layers (encapsulant or seal ring). Devices are
stressed in a chamber at an extreme level of temperature and
humidity for various periods of time. The devices are biased
while under stress.
Stress conditions are:
Temperature = +110°C
Humidity = 85% RH
Time = 264 hours
Voltage bias levels are product dependent.
Unbiased Highly Accelerated Stress Test (UHAST)Applicable JEDEC standard: JESD22-A118
Like HAST, UHAST simulates extreme operating conditions.
Devices are stressed in a chamber at an extreme level of
temperature and humidity for various periods of time. The
devices are not biased while under stress.
Stress conditions are:
Temperature = +110°C
Humidity = 85% RH
Time = 264 hours
Temperature Cycle (TC)Applicable JEDEC standard: JESD22-104
TMCL accelerates the effects of thermal expansion mismatch
among different components of the package and circuit. It is
used to determine package tolerance to temperature variation
extremes during transportation and use.
Devices are placed in a chamber and subjected to the specified
temperature cycling stress condition for the specified number
of minimum and maximum temperature cycles. Failed devices
are checked for stress cracks and delamination of the product
interfaces (passivation, dielectric layers and/or a "popcorn
effect" on epoxy packaged devices). There are other conditions
that are or can be used.
Stress conditions are:
Temperature = +125°C (top chamber) and
-40° C (bottom chamber)
Time = 10 minutes per chamber
for 1000 cycles between chambers
Solderability Applicable JEDEC standard: J-STD-002 Solderability is a characterization test that determines the solderability of terminals after transportation and storage. Two types of tests are performed: Solder bath dip/look and surface mount process simulation. For the dip/look test, devices are dipped in a solder bath for a pre-determined time. Units are pre-conditioned with steam or hot aging, or both.
Stress conditions are: Solder bath Temperature = +245°C/-5°C Dip Time = +5/-0.5 seconds
Solder composition: Pb:Sn = 4:6, used with rosin flux. Lead-free alloys are used with lead-free packages.
At least 95% of the immersed area must be coated with solder in order to pass the test. For the Surface Mount process simulation test, a stencil with appropriate pad geometry is used to simulate actual surface mount component performance in a reflow process. All terminations shall exhibit a continuous solder coating free from defects for a minimum of 95% of the critical surface area.
MEMS (Micro ElectroMechanical Systems) must meet the reliability requirements of ICs as described above and in addition the following stresses specific to MEMS microphone technology and package integrity.
Vibration (VIB)Applicable standards: JESD22-B103 / MIL 883, Method 2007VIB accelerates the effects of forces on the product through repetitive pulse amplitude and durations simulating shipping or field conditions.
Devices are mounted to boards and placed on a vibration table that can stress the parts with random vibration pulses or harmonic pulses for given force conditions. The force may be on different orientations of the parts (X/Y/Z). There are other conditions that are or can be used.
Stress conditions are: Sine vibration: 20g peak acceleration, 20-2000Hz Random vibration: 5G, low frequency levels
Tem
pe
ratu
re (
˚C)
150
100
50
0
-50
-100

34 For more information, visit cirrus.com
Mechanical Shock (Mech Shock)Applicable standards: JESD22-B104, JESD22-B110B / MIL 883, Method 2002 / IEC60068-2-27Mech Shock accelerates the effects of forces on the product through severe or suddenly applied mechanical impacts simulating shipping or field conditions.
Devices are mounted to boards and placed on a table that can stress the parts with controlled impact pulses for given force conditions. The force may be on different orientations of the parts (X/Y/Z). There are other conditions that are or can be used.
Stress conditions are: Force: 1500G peak, 0.5ms duration, half sine pulse wave
Tumble Test (Tumble)Applicable standards: IEC60068-2-31Tumble Test accelerates the effects of rough handling forces on the product through severe or suddenly applied mechanical impacts simulating handling, shipping or field conditions.
Devices are mounted to boards and placed in a chamber that can apply a drop to a steel base with the product striking the surface with a random orientation. There are other conditions that are or can be used.
Stress conditions are: Force: 1M drop Cycles: ~10 cycles / minute
Drop Test (Drop)This test is performed to customer specific requirements and is to evaluate the robustness of the microphone when dropped directly onto a hard surface from a specified height, typically 1 metre. The microphone is mounted on a weighted buck which simulates the weight and size of the end product. The expectation is that a microphone will survive multiple drops.
Qualification Stress Flow example
Product Manufacturing & Electrical Verification Test
BEGIN
ENDQualification Test Flow
Inspection
CSAMCSAM
ATE
ATE
ATE
CSAM
HTSL / LTSL
ESD / Latch-up
HTOL /LTOL ELFR
ATE
THB
ATE
Temp Cycle
HAST / uHAST
Bake Soak Reflow

35Cirrus Logic Quality Handbook
Appendix BElectro Static Discharge Latch-Up TestingElectrical Static Discharge (ESD) testing is used to determine
a semiconductor’s level of ESD sensitivity. Cirrus Logic’s ESD
laboratory performs in-house, JEDEC compliant ESD and
latch-up testing. This allows for rapid design feedback and
complete debug capability.
Human Body Model (HBM)Applicable JEDEC standards:
ANSI/ESDA/JEDEC JS-001 models the discharge of electricity
into a pin on a device through contact with a human body that
has been charged with static electricity. Equivalent capacitance
of the discharge circuit is 100pF and resistance is 1.5K ohm.
The typical flow for HBM testing is as follows (the device is
not powered up during ESD stress):
• Parametric and functional testing
• Pre-stress I/V
• HBM stress
• Post stress I/V
• Parametric and functional testing
Three devices per voltage step specified by JEDEC are used.
Intermediate voltage steps can be added.
Charged Device Model (CDM)Applicable JEDEC standard: ANSI/ESDA/JEDEC JS-002 models the discharge of electricity
that occurs when part of the device package or lead frame
becomes charged due to handling and a pin on the device
then contacts a metal apparatus or fixture. This model shows
good correlation to the typical breakdown mode of an automatic
assembly line.
The typical flow for CDM testing is as follows (the device is
not powered up during ESD stress:
• Parametric and functional testing
• CDM stress
• Parametric and functional testing
Three devices per voltage step specified by JEDEC are used.
Intermediate voltage steps can be added.
HBM tester
Tr
Example waveform, 1kV HBM through short
13.06
11.55
10.04
8.54
7.03
5.52
4.02
2.51
1.00
-.50
-2.01
-3.52
-5.05
Cur
rent
(A)
Time (nS)
.00 1.00 2.00 3.00 3.99 4.99 5.99 6.99 7.99 8.99 9.99
lp: 11.549 A @ 3.3 nS
FWHM (t2): 5.774 A @ 3.7 nSFWHM (t1): 5.774 A @ 3.1 nS
lp2: -3.516 A @ 4.3 nS
90% of l_peak (10.394 A) @ 3.2 nS
10% of l_peak (1.155 A) @ 3.0 nS

36 For more information, visit cirrus.com
Latch-UpApplicable JEDEC standard: JEDEC 78
Latch-up testing is performed to ascertain whether a device
can sustain SCR latch-up due to DC current injected into the
input, output and I/O pins. Cirrus Logic requires testing of
both current injection and power supply overvoltage conditions.
Stress conditions are:
Current injection = ±100 mA on all non-supply pins
Overvoltage = 1.5xVDDmax on all supply pins
Temperature = Maximum operating temperature
on data sheet or room temperature
ambient
The typical flow for latch-up testing is as follows (the device
is powered up during Latch-up stress):
• Parametric and functional testing
• Pre-stress I/V
• Positive I-Test Input pins high
• Positive I-Test Input pins low
• Negative I-Test Input pins high
• Negative I-Test Input pins low
• Overvoltage Test Input pins high
• Overvoltage Test Input pins low
• Parametric and functional testing
Three devices per voltage step are used. Separate devices can be used for I-Test and Overvoltage or room temp and
max temp.
CDM tester
Latch-up tester
Example waveform, 1kV HBM through short
.74
.67
.61
.54
.47
.40
.33
.27
.20
.13
.06
.00
.07
Cur
rent
(A)
Time (nS)
.00 24.95 49.90 74.85 99.80 124.75 149.70 174.65 199.60 224.55 249.50
10% of l_peak (.066 A) @ 45.7 nS
Td (t2): 245 A @ 222.3 nS
Ips: .664 A lps_max: .673 A
lr: .016 A
lps: .664 A @ 65.6 nSTd (t1): .664 A @ 65.6 nS
10% of l_peak (1.155 A) @ 3.0 nS

37Cirrus Logic Quality Handbook
Appendix CMoisture Sensitivity LevelsJEDEC levels are the industry standard for pre-conditioning
flows used to simulate a customer’s PCB attachment process.
Pre-conditioning flows are performed on all surface mount
devices before specific qualification testing. This establishes
the moisture sensitivity level (MSL) under which the device will
be released to production and determines whether dry pack
is required or not. This testing determines the level of moisture
absorption by the product for a set period of time. Defects
that can result are delamination of the product interfaces
(passivation, dielectric layers and/or a "popcorn effect" on
epoxy packaged devices) during the customer assembly
process. This popcorn effect on epoxy molded product was
noticed several years ago as the industry began migrating
from primarily pin-through-hole packages and dual-in-line
power packages, to surface mount devices. A popping sound
was heard on assembly lines as packages were mounted on
PCB boards. The cause of this phenomenon was isolated to
moisture ingress into the device package which in turn
generated a rapid expansion during reflow, causing packages
to crack. This cracking happened so rapidly that an audible
“pop” was observed and thus the nickname “popcorn” effect
was coined. Generally, WLCSP products are MSL 1, epoxy
package devices below 22-pins are qualified to MSL < 2 and
epoxy package devices of 24-pins and greater are usually
qualified to a less stringent level 3 and dry packed to prevent
a popcorn effect issue during PCB attachment (e.g. IR reflow).
Solder Reflow Profiles for Cirrus Logic ProductsCirrus Logic Quality and Assembly Engineering Departments
receive frequent customer inquiries asking for recommended
reflow soldering profiles for our IC devices. Providing such
recommendations pose quite a considerable challenge given
the wide variety of available reflow equipment models and the
unique factors related to each piece of equipment, such as
PCB board size and mass and the specific solder chemistry
used by the customer. Given all of these variables, customers
are best served to create custom, optimized reflow solder
profiles for each assembly scenario.
For non-hermetic plastic and wafer level chip scale packages
(WLCSP), Cirrus Logic devices are qualified and rated using
the joint industry specification J-STD-020. Using this
specification to both rate the susceptibility of ICs to moisture
and to guide customers towards proper reflow exposure
parameters helps ensure compatibility between the Cirrus
Logic device and the customer’s soldering application.
This specification also is useful in understanding the limits and
preferred practices for reflow soldering for both eutectic and
lead-free chemistries. The standard defines a target reflow
profile and explains the acceptable limits for time and
temperature during reflow soldering. Proper interpretation of
this document will assist customers in developing solder reflow
profiles for their manufacturing process which provide
repeatable high-quality solder joints in a reliable and efficient
manner.
Solder paste manufacturers should also be consulted for any
additional requirements to facilitate a successful application
of their products. The standard may be downloaded free of
charge by JEDEC registered individuals using this link: https://
www.jedec.org/standards-documents/docs/j-std-020e. There
is no cost or obligation associated with registering for access
to this information.
Moisture Sensitivity Levels per IPC / JEDEC J-STD-020
Soak Requirements
Standard
Accelerated Equivalent
Floor Life eV 0.40-0.48 eV 0.30-0.39
Level Time Condition Time (hours) Condition Time (hours) Time (hours) Condition
1 Unlimited ≤ 30°C/85% RH 168 + 5/-0 85°C/85% RH NA NA NA
2 1 year ≤ 30°C/60% RH 168 + 5/-0 85°C/60% RH NA NA NA
2a 4 weeks ≤ 30°C/60% RH 6962 + 5/-0 30°C/60% RH 120 + 1/-0 168 + 1/-0 60°C/60% RH
3 168 hours ≤ 30°C/60% RH 1922 + 5/-0 30°C/60% RH 40 + 1/-0 52 + 1/-0 60°C/60% RH
4 72 hours ≤ 30°C/60% RH 962 + 5/-0 30°C/60% RH 20 + 0.5/-0 24 + 0.5/-0 60°C/60% RH
5 48 hours ≤ 30°C/60% RH 722 + 5/-0 30°C/60% RH 15 + 0.5/-0 20 + 0.5/-0 60°C/60% RH
5a 24 hours ≤ 30°C/60% RH 482 + 5/-0 30°C/60% RH 10 + 0.5/-0 13 + 0.5/-0 60°C/60% RH
6 Time on Label (TOL) ≤ 30°C/60% RH TOL 30°C/60% RH NA NA NA

38Cirrus Logic Quality Handbook
Classification Profile per IPC / JEDEC J-STD-020 (not to scale)
Tem
pe
ratu
re (
˚C)
Time(s)
25
Time 25°C to Peak
t
t
TL
TP
T smin
T smax Preheat area
Supplier TP User TP
Supplier TP ≥ TC User TP ≤ TC
TTPPTC -5°C
Max. Ramp Up Rate = 3°C/sMax. Ramp Down Rate = 6°C/s
TC
TC -5°C

39 For more information, visit cirrus.com
Predictive MaintenanceAbstractAn overview of predictive maintenance (PdM) is presented and contrasted with preventive maintenance (PM).
Examples of PdM methods used in wafer fab are given.
I. IntroductionCirrus Logic quality management believes that predictive maintenance is a key factor in preventing quality
disasters. The essential difference between traditional preventive maintenance (PM) and predictive maintenance
(PdM) is that PM activity depends on the history of the tool and PdM activity depends on the current condition of
the tool. This is why PdM is sometimes called “condition-based” maintenance.
PdM not only prevents disasters, it also improves equipment uptime. Tools go down for maintenance when
warranted by their current condition, not because they are simply “due.” To the degree that maintenance events
are predictable they can be planned. Planned maintenance takes less time, has less variability and can be
performed when the tool is not in demand.
The central concept of PM is the bathtub curve. The bathtub curve is the failure rate as a function of age. We take
a tool down because we think that enough time since the last renewal of the tool has accumulated for the bathtub
curve to rise to an intolerable level. This strategy is consistent with the belief that failure mechanisms are
time-dependent.
The central concept of PdM is anomaly detection. An anomaly detector is an annunciator that is a function of
measured variables. We take a tool down because we think that the current condition of the tool inferred from
measured variables is anomalous. This strategy is consistent with the belief that failure mechanisms have
precursors that are observable.
PdM and PM are not antagonistic in any way. In fact, PM is a special case of PdM wherein cycles of time are an
observable precursor to wear-out failure mechanisms.
II. ExamplesPreventive maintenance: Change oil every 3,000 miles. Oil is changed every 3,000 miles, no matter what–
summer or winter, hard miles or easy miles, dirt roads or asphalt, etc.
Predictive maintenance: Change oil because the current spectrographic analysis says that the oil is degraded to
the point that its lubrication properties are barely sufficient. Better still, use a sequence of recent spectrographic
data to predict when lubrication properties will become insufficient, if ever.
In this example, the spectrometer plays the role of sensor suite and processor. The user specifies a detection
threshold in terms of spectrometer output that when breached, triggers an annunciation that maintenance
is required.
III. Infrastructure RequirementsPreventive maintenance requires little more than a clock. Various ways of reckoning time may be relevant
depending on the nature of the wearout mechanism to be intercepted. The PM clock may account for calendar
© 2019 Cirrus Logic, Inc. All rights reserved. Cirrus Logic, Cirrus Logic and the Cirrus Logic logo designs are trademarks of Cirrus Logic, Inc.
cirrus.com

40Cirrus Logic Quality Handbook
time, operational time, duty cycles, number of units of production, or raw material use. In any case, PM activity is
triggered by the accumulation of cycles of time.
Predictive maintenance requires more elaborate infrastructure. An anomaly detector must be devised and
implemented. The detector consists of a sensor suite, processor, detection threshold and annunciator.
The sensor suite is the means by which relevant characteristics of the tool are measured and transmitted to the
processor. In wafer fab applications the term SVID (system variable identification) is used to refer to a generic
sensor and FDC (Fault Detection and Classification) is used to refer to the suite. In other contexts, the term
SCADA (Supervisory Control and Data Acquisition) is used to refer to monitoring as well as control infrastructure.
The term condition monitor (CM) is sufficiently general to refer to a sensor suite that is compatible with PdM.
Considered individually, the output of each sensor is a univariate random variable. Taken together, the output of a
sensor suite is a multivariate random variable. Early-stage PdM implementations treat each sensor in isolation,
much like traditional SPC. This mode is called univariate analysis (UVA). More mature PdM implementations
consider the joint behaviour of the sensors in the suite as a vector. This mode is called multivariate analysis (MVA).
MVA of the sensor suite will always out-perform UVA because MVA exploits the correlation structure between
sensors. This makes it possible to achieve a higher degree of sensitivity to anomalies than is possible by
responding to sensors individually through UVA.
For a depiction of the UVA for two
variables, X1 and X2, see Figure 1.
The process is deemed to be “in control”
as long as both variables remain inside
their respective limits. When we treat X1
and X2 as elements of a 2 x 1 vector, the
correlation structure becomes apparent:
see Figure 2.
The MVA limit reclaims a substantial
portion of the factor space simply by virtue
of its shape thereby improving the
sensitivity of the detector. The more
correlated the variables are, the larger the
reclaimed region and the more sensitive
the detector will be relative to the
corresponding UVA.
The processor is the means by which raw
sensor output is transformed so that it is
compatible with a detection threshold. For
example, CM data may be output as a
multi-channel, time-varying signal that is on from
the start to finish of a production run. In wafer
fab applications this is called trace data.
Depending on how the detection threshold is defined, various operations may need to be performed on the trace
data. These may be simple, like limit checking or computation of summary statistics. More complex operations like
Figure 1
Figure 2
X1
-4 24 21-1 0LCL UCL
X2
-4 24 21-1 0LCL UCL
-4-4
LCL
UCL
-2
-1
0
2
1 2 40-1-2LCL UCL
X1
X2
UVA Limit
MVA Limit
reclaimed region

41 For more information, visit cirrus.com
feature extraction or discrete Fourier transforms may be required from the processor. In any case, processor
output must be directly comparable to the detection threshold.
The detection threshold is the decision rule that governs the annunciator. If the threshold is exceeded, the
annunciator is turned on, indicating the detection of an anomaly. Various procedures for setting the detection
threshold may be used depending on the specifics of the particular PdM implementation.
The annunciator is the means by which the detector communicates the inferred presence or absence of an
anomaly to the outside world. A flashing red light, automated text message and tool logging event are examples
of common annunciators.
IV. Optimal Detector DesignOptimal detector design strongly depends on the context of the PdM implementation. There are two generic
paradigms to consider: supervised and unsupervised.
In supervised design, we have the benefit of knowing which CM data is associated with “good” and “bad” tools.
A good tool is defined to be one which we would like to use because we trust it to make quality product. A bad tool
is one that we would like to put down for maintenance and restore to good status.
CM data is noisy in the sense that it sometimes misclassifies tools as good or bad. Optimal supervised design
adjusts the detection threshold to achieve the best trade off between putting a good tool down and letting a
bad tool run.
In unsupervised design, we do not know which CM data is associated with good and bad tools. All we have to go
on is the possibility that the CM data organizes itself into “clouds.” A statistical procedure for discerning the
presence of data clouds is called cluster analysis. There are many algorithms for cluster analysis and the most
common in PdM applications is called “k-means clustering.” In this concept, clusters are defined such that there is
more variation between clusters than within.
Optimal unsupervised design adjusts the cluster definitions to achieve the sharpest distinction between clusters.
In this paradigm, the threshold function is the distance from a new CM vector to the center of each cluster. The
new CM vector is assigned to the closest cluster. Instead of declaring the presence or absence of an anomaly,
the annunciator communicates the cluster membership of the new CM vector.
For a depiction of a 2-means cluster analysis of three variables, Prin1, Prin2 and Prin3, see Figure 3.
Unsupervised detectors are sometimes called tool health metrics. The good cluster is often taken to be the one
with the most members; especially when all others have much smaller membership. CM vectors are like multiple
heart rate and pulse measurements from the same patient. Measurements that are not assigned to the large
cluster of typical values are taken to be anomalous.
Supervised design is always preferred to unsupervised whenever it is possible. This is because the annunciator
has an unambiguous interpretation: act or do not act. Unsupervised design requires the additional effort of
discerning the nature of each cluster. Often there is very little to go on to make this determination.
If it is possible to relabel clusters from their generic labels {C1, C2…Ck} to actionable labels {Bad1, Good2…
Badk} (say), then we can advance our PdM application to the next level of maturity.
In supervised design we are given both the true condition of the tool and the CM vector that is associated with
that condition. In unsupervised design we are only given CM vectors and must discern the nature of the CM data.
In all cases, we seek the PdM solution that has the most unambiguous and accurate annunciator.
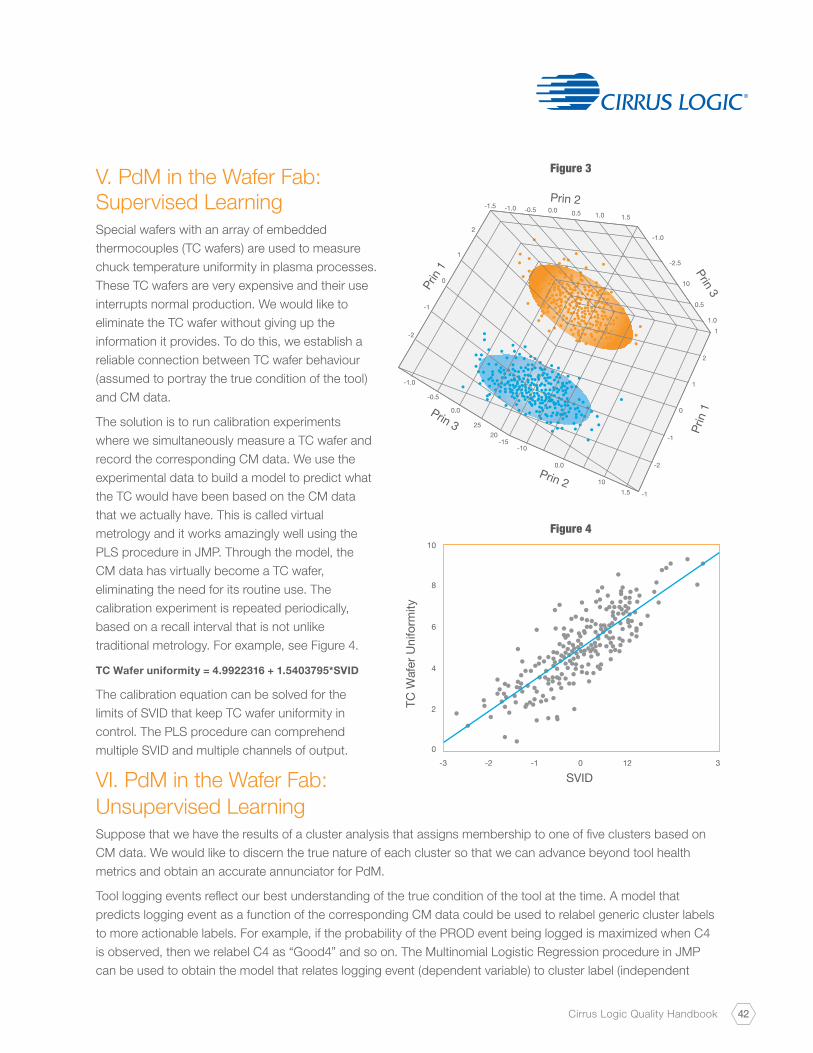
42Cirrus Logic Quality Handbook
V. PdM in the Wafer Fab: Supervised LearningSpecial wafers with an array of embedded
thermocouples (TC wafers) are used to measure
chuck temperature uniformity in plasma processes.
These TC wafers are very expensive and their use
interrupts normal production. We would like to
eliminate the TC wafer without giving up the
information it provides. To do this, we establish a
reliable connection between TC wafer behaviour
(assumed to portray the true condition of the tool)
and CM data.
The solution is to run calibration experiments
where we simultaneously measure a TC wafer and
record the corresponding CM data. We use the
experimental data to build a model to predict what
the TC would have been based on the CM data
that we actually have. This is called virtual
metrology and it works amazingly well using the
PLS procedure in JMP. Through the model, the
CM data has virtually become a TC wafer,
eliminating the need for its routine use. The
calibration experiment is repeated periodically,
based on a recall interval that is not unlike
traditional metrology. For example, see Figure 4.
TC Wafer uniformity = 4.9922316 + 1.5403795*SVID
The calibration equation can be solved for the
limits of SVID that keep TC wafer uniformity in
control. The PLS procedure can comprehend
multiple SVID and multiple channels of output.
VI. PdM in the Wafer Fab: Unsupervised LearningSuppose that we have the results of a cluster analysis that assigns membership to one of five clusters based on
CM data. We would like to discern the true nature of each cluster so that we can advance beyond tool health
metrics and obtain an accurate annunciator for PdM.
Tool logging events reflect our best understanding of the true condition of the tool at the time. A model that
predicts logging event as a function of the corresponding CM data could be used to relabel generic cluster labels
to more actionable labels. For example, if the probability of the PROD event being logged is maximized when C4
is observed, then we relabel C4 as “Good4” and so on. The Multinomial Logistic Regression procedure in JMP
can be used to obtain the model that relates logging event (dependent variable) to cluster label (independent
Figure 3
Figure 4
Prin
1
Prin
1
Prin 2
Prin 3
Prin 2
Prin 3
0.0 0.5-0.5-1.0-1.5
2
1
0
-1
-1.0
-0.5
0.0
-15-10
0.0
101.5 -1
-2
-1
0
1
11.0
0.5
10
-2.5
-1.0
2
2520
-2
1.0 1.5
-2 -1 12
2
0
4
6
8
10
30-3
SVID
TC W
afer
Uni
form
ity

43 For more information, visit cirrus.com
variable). We can account for the imperfect nature of logging events by processing them with a Hidden Markov
Model (HMM). In this concept, the true state of the tool {Fit, Broken, Degraded} is hidden and logging events
provide noisy information about the true state. For example, see Figure 5.
The HMM model yields a prediction of the true state of the tool at each point in time as a function of the logging
events leading up to that time. The Multinomial Logistic Regression is used as previously to obtain a model that
relates predicted true state (dependent variable) to cluster label (independent variable).
The HMM model provides additional insights as well. Objective evaluation of the consistency of event logging is
obtained through analysis of the emission matrix. A new way to evaluate tool matching is available by comparing
the steady-state distributions of tools running the same processes. The existence of an undocumented degraded
state for which there is no logging event is evidenced by the transition matrix.
VII. Conclusions
Predictive Maintenance is a generalization of traditional Preventive Maintenance. Observable precursors to failure
mechanisms may be measured by a sensor suite deployed for a tool. These condition monitors can be used to
predict the present and future states of the tool. Depending on the context of the PdM implementation, we may or
may not know the true condition of a tool. In either case, a detector can be devised to make an inference about
the true state of the tool. The maturity of a PdM implementation depends on how accurately the annunciator
communicates the true state of the tool.
Figure 5
Fit
DegradedBroken
Contributing Authors:Chris Alanis, Supplier Quality Engineer, Cirrus Logic, Inc.Max Hsieh, Supplier Quality Engineer, Cirrus Logic, Inc.Yi-Rong Meng, Supplier Quality Engineer, Cirrus Logic, Inc.Rodel Reyes, Supplier Quality Engineering Manager, Cirrus Logic, Inc.Hung-Chi Su, Supplier Quality Engineer, Cirrus Logic, Inc.Jeff Weintraub, Corporate Statistician, Cirrus Logic, Inc.

44Cirrus Logic Quality Handbook
Where RL is the observed average run length until an OOC event, not counting the OOC event itself.
A New Metric for SPC PerformanceAbstractAn index of process instability (ISTAB) is presented that compares the observed average run length to the
expected run length (ARL) of a statistical process control (SPC) scheme. Excessively long run lengths relative to
expectation are associated with one kind of defect in a particular implementation of a scheme and inordinately
short run lengths are associated with another kind of defect. The probability distribution of run length is given as
the basis for establishing ARL. A sampling distribution is introduced as a way to quantify excessively long and
inordinately short observed run lengths. An SPC management system based on ISTAB is presented as an
alternative to more conventional approaches.
I. IntroductionStatistical process control (SPC) has attained nearly universal acceptance as a tool to achieve stability and
control. It is not unusual for a microelectronics factory to employ tens of thousands of SPC charts (30,000 is not
an unusually high number). These charts encompass the entire spectrum of criticality. Some are for customer-
critical product characteristics. Others are simply for data collection in anticipation of a future need. Still others
are for supplier-critical process characteristics.
We define an SPC scheme to be the set of charts, statistics and rules that are used to achieve stability and
control. An instance is a particular implementation of a scheme. Multiple instances of the same scheme may or
may not have the same numerical values of control limits.
From the point of view of the producer, run length is a basic measure of performance. It is natural to think in terms
of run length in various manufacturing contexts. For example, it may be the number of product units moved from
one operation to the next in the course of a shift. It may be the number of repetitions of an operation between
maintenance events. In the context of an SPC instance, it is the number of points plotted (subgroups) until an
out-of-control (OOC) condition is indicated. In each of these examples, the interpretation of observed run length
is the same.
It is meaningful to speak of observed average run length (RL) as a measure of typical performance. The reciprocal
of observed average run length is the observed percentage of trials in which a particular event occurred.
McTurk (2001) proposed a Stability Index1 (Index of STABility) as a way to manage SPC in an extensive (many
process) and intensive (many variable) control environment.
McTurk defines the ISTAB index for an SPC instance as:
ISTAB =(count of X limit violations in reporting period)
(count of subgroups in reporting period= 1 RL
© 2019 Cirrus Logic, Inc. All rights reserved. Cirrus Logic, Cirrus Logic and the Cirrus Logic logo designs are trademarks of Cirrus Logic, Inc.
cirrus.com
=1
RL + 1

45 For more information, visit cirrus.com
In our concept, ISTAB = RL - ARL. This modification is made in order to make use of the considerable body of
knowledge concerning the random nature of run length.
ISTAB has three generic behaviours that are indicative of defects in an SPC instance.
Case 1: The observed average run length is excessively long relative to expectation. ISTAB > 0 is indicating the
possibility that the limits are too wide due to errors in estimating the in-control values of the process parameters.
An appropriate action is to re-estimate the process parameters and compare them to the estimates in use.
Case 2: The observed average run length is consistent with expectation. ISTAB near zero is indicating that the
process is stable. The SPC rules are violated at the expected rate and no defects in the instance are evident.
Case 3: The observed average run length is inordinately short relative to expectation. ISTAB < 0 is indicating that
the limits are too tight or the process is unstable or both. An appropriate action is to investigate the nature of the
apparent instability and re-examine the assumptions of the scheme.
In our experience, fundamental process instability is by far the most plausible explanation for short run lengths
rather than any defect in the instance. However, we have found examples where new sources of stable process
variation have been introduced subsequent to the initialization of an instance. For example, early in the product
lifecycle, low production volumes are processed on a few machines. As volumes increase, more machines are
brought on line. Depending on the characteristics of the expanded fleet of machines, this change in the nature of
previous processing is manifested as increased variation at a given step. In other cases, short runs are caused by
gross errors in estimating the in-control values of the process parameters.
We now turn to the problems of determining the distribution of an individual run length and the sampling
distribution of observed run lengths for an SPC scheme. The first is needed to compute the ISTAB statistic, the
second for establishing decision rules for distinguishing between the three cases.
II. Probability Distribution of Run LengthIf the probability that an individual subgroup triggers a false OOC is a, subgroups are independent and have
the same value of a, then the random number of subgroups (X) until the first false alarm is a geometric
random variable:
X = run length
fx (x|a) = (1-a) xa
x = 0,1,…
0 < a ≤ 1
For example, if an SPC scheme consists of an X & S chart with an OOC indicated by a breach of limits by X or S
or both, the false alarm probability for the scheme is:
a = P(LCL > X or UCL < X or UCLs < S | stable process)
= P(LCL > X) + P(UCL < X) + P(UCLs < S)
– P(LCL > X)P(UCLs < S)
– P(UCL < X )P(UCLs < S)
by the independence of (X, S) when sampling from a Gaussian distribution.

46Cirrus Logic Quality Handbook
Figure 2 Negative binomial sampling distribution of (RL) for n = 10 OOC events
If p = P(LCL > X) = P(UCL < X) = P(UCLs < S)
= 0.00135 by design, then a= 0.004 and the expected
run length of the scheme when the process is stable is
ARL = (1-a)/a = 249 subgroups (not counting the one
that triggers the OOC).
The ISTAB index for this scheme is equal to RL–249.
(See Figure 1.)
If a randomly selected stable run length is a geometric
random variable with parameter a, then the random
sum of run lengths (T) until the nth false alarm is a
negative binomial random variable with
parameters (a,n)2.
T = sum of n run lengths
T = n ∙ (RL)
gT(t |a,n) = (n+t-1) an (1-a a) t
t = 0,1,…
0 < a ≤ 1
n > 0
P(T ≤ t) = (n+i-1) an (1-a) i
= P(n ∙ RL ≤ t) = P(RL ≤ t ⁄n)
We interpret this negative binomial distribution as the
sampling distribution of the statistic T. It can be used
to define a rule for deciding if an observed value of
(RL) is consistent with Case 1, 2 or 3.
For example, consider a hypothetical history of an instance of the X & S scheme presented earlier in which n = 10
OOC events were observed. The inherent randomness in run length under Case 2 (stability) would cause ~95%
of such hypothetical histories to have observed average run lengths between 119 and 426. If we were to actually
observe a value of (RL) = 445 with n = 10, we would be inclined to believe that the instance was defective
because the observed average run length is excessively long relative to expectation.
III. ISTAB as an Approach to SPC ManagementThe foundation of ISTAB is the control plan (CP). The minimum elements of a CP are specified by ISO/
TS16949:2009E3. Control plans drive ISTAB reporting by establishing the level of criticality that merits review.
To the CP foundation we join the actual performance of the controls. These elements make the ISTAB report a
quick and easy way to see how critical controls are implemented (like a control plan) and how they are performing
(out-of-specification conditions, out-of-control conditions and individual rule violations).
Figure 1 Run length distribution for the Xbar and S scheme
2Proof is given in the annex.
t
i
t
i=0
ARL = 249
01 00 200 300 400 500 600 700 800 900
0.0005
0.00010.00150.002
0.0025
0.00350.003
0.004
Geometric distribution of stable run length a = 0.004, ARL = 249 subgroups
Stable run length
Stable observed average run length
Negative binomial cumulative distribution of stable observed average run length
a = 0.004, n = 10 OOC events
Lower action limit = 119 Upper action limit = 426
00
0.2
0.4
0.6
0.8
1
10050 150 350 450400200 300

47 For more information, visit cirrus.com
To create an ISTAB report for an SPC instance, use the CP to get:
• Process Name (STI, FG, Wire bonding, Molding, etc.)
• Characteristic (Tox, CD, ball shear, wire pull, etc.)
• Variable (Pre-polish Tox, strength, etc.)
• Recipe name
• Control statistics (Xbar, R, S, Uniformity, etc.)
• Specification limits (LSL, USL) for the variable
• Sample size (wafers per lot, bonds per tool, etc.)
• Sample frequency (every lot, every shift, etc.)
• Control limits (LCL, UCL) for statistics in the instance
• Control targets (CT) for statistics in the instance
• ARL derived from the stable run length distribution
Join the CP to the performance of the instances in the reporting period:
• Count of subgroups plotted
• Count of out-of-specification measurements
• Count of SPC rule #1 violations
• Count of SPC rule #2 violations
• Count of SPC rule #n violations
• Count of subgroups with one or more rule violations
Create a column for observed average run length:
RL =S-gg
Where S is the count of subgroups in reporting period for a given instance and g is the count of subgroups with
one or more rule violations.
Create a column for ISTAB= RL - ARL.
Where ARL is obtained from the run length distribution of the SPC scheme. The following considerations enhance
the accuracy and usefulness of the ISTAB report.
Each instance of a requirement from the CP is a line item in the ISTAB report. This feature makes ISTAB a guide
to SPC as implemented in the factory.
For example, there may be multiple instances of a process – variable combination because multiple machines are
in use. In that case there will be multiple line items for the same scheme, one for each instance. This is sometimes
necessary due to the heterogeneity of machines, the reason for separate instances in the first place. Conversely,
if a process – variable combination is run on many machines and tracked in one instance (all data to one chart
set) then there will be one line item on the ISTAB report to reflect that implementation.
If a rule is not used in a particular instance, the violation count for that rule is empty, not zero.
The ISTAB workbook contains a section that gives the definition of each supplemental SPC rule as implemented
in the factory.
The ISTAB index for an instance of a scheme is re-initialized when the control limits, runs rules or reporting
window are changed.

48Cirrus Logic Quality Handbook
IV. ConclusionsThe ISTAB index is presented as a way to maintain an efficient and effective window on the manufacturing
process. The characteristic behavior of ISTAB points to specific defects in an SPC instance. The sampling
distribution of the observed run length facilitates a way to decide the health status of an SPC instance. ISTAB is a
new way to efficiently and effectively manage large scale SPC implementations.
V. References1. L. McTurk, L. (2001) “Use of Control Rules and Stability Index to maintain an effective SPC system in a
high volume fab” in Process and Equipment Control in Microelectronic Manufacturing II, Martin Fallon,
Editor, Proceedings of SPIE Vol. 4405
2. A. M. Mood, F. W. Graybill, D. C. Boes (1974) Introduction to the Theory of Statistics,
New York: McGraw-Hill
3. The International Organization for Standardization (ISO) (2000) Quality management systems —
Requirements ISO/TS16949:2009E, Geneva: ISO
VI. AnnexThe moment generating function of the sum of n independently distributed random variables is equal to the
product of the individual moment generating functions of the variables in the sum:
ms(t) = n mxi(t)
The moment generating function of the geometric random variable is:
mxi(t) = p
The moment generating function of the negative binomial random variable is:
ms(t) = ( p )n
This is exactly equal to the product of n identical geometric moment generating functions. Thus, we have proven
that the sum of n independent and identically distributed geometric random variables with parameter p is a
negative binomial random variable with parameters (p, n).
i = 1
1- (1-p)et
1- (1-p)et
Contributing Authors:Jeff Weintraub, Corporate Statistician, Cirrus Logic, Inc.Scott Warrick, Director, Quality and Control Management, Cirrus Logic, Inc.

49 For more information, visit cirrus.com
Test Escape Consequences of Low YieldAbstractAlthough it is intuitive that variation in yield is linked to variation in test escapes, the assertion has not been
rigorously proven. We use basic axioms to express the probability of test escape as a function of the operating
characteristics of the test process, the incoming quality level and in turn, yield. Examples that demonstrate the
practical application of the method are given. These feature sensitivity analyses that inform defect reduction
efforts, improvements to the test process, and statistical control schemes.
I. IntroductionIt is widely believed that when test yield is decreasing, test escapes are increasing. Logically, low yield is indicative
of the reduced quality of the input to the test process. Because the test process is not perfect, some of the
reduced quality material survives the process. These units are called test escapes. What is not obvious is size
of the effect.
Define the following random variables and their possible outcomes:
True State of a unit of product: S = {good, bad}
Test Result for a unit of product: R = {pass, fail}
The quality of the (untested) material input to the process is:
P(S = bad) = p
P(S = good) = 1 – p
The test result for a unit is not perfectly consistent with the true state of that unit for most test processes that we
will encounter. The imperfect relationship between the test result (R) and the true state (S) of a tested unit gives
rise to the operating characteristics of the process:
P(R = fail | S = good) = a, also called “false positive”
P(R = pass | S = bad) = , also called “false negative”
Sentences like these are read “the probability of A given B is p”. Taken together, (p,a,) are the fundamental
quantities of the test process. As we will see in the next section, these fundamental quantities are used to
derive the quality characteristics of the tested product:
P(S = good | R = fail) = overkill probability
P(S = bad | R = pass) = escape probability
Note that, in general,
P(S = good | R = fail) P(R = fail | S = good)
© 2019 Cirrus Logic, Inc. All rights reserved. Cirrus Logic, Cirrus Logic and the Cirrus Logic logo designs are trademarks of Cirrus Logic, Inc.
cirrus.com
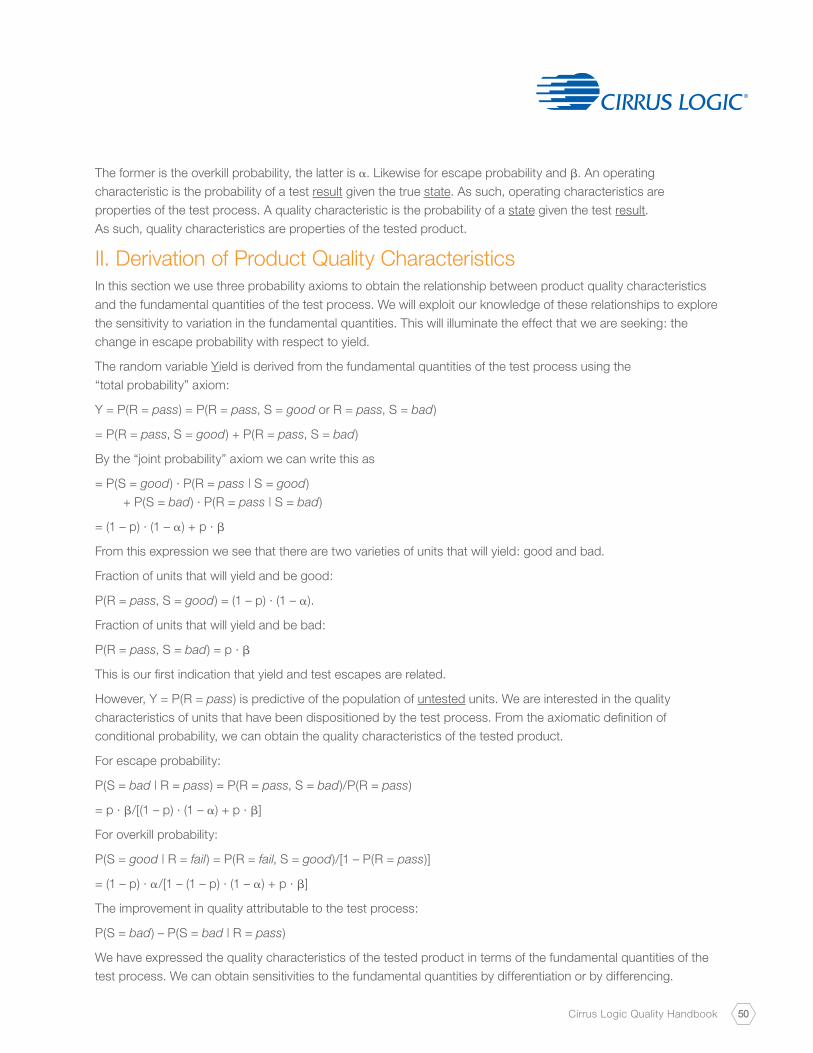
50Cirrus Logic Quality Handbook
The former is the overkill probability, the latter is a. Likewise for escape probability and . An operating
characteristic is the probability of a test result given the true state. As such, operating characteristics are
properties of the test process. A quality characteristic is the probability of a state given the test result.
As such, quality characteristics are properties of the tested product.
II. Derivation of Product Quality CharacteristicsIn this section we use three probability axioms to obtain the relationship between product quality characteristics
and the fundamental quantities of the test process. We will exploit our knowledge of these relationships to explore
the sensitivity to variation in the fundamental quantities. This will illuminate the effect that we are seeking: the
change in escape probability with respect to yield.
The random variable Yield is derived from the fundamental quantities of the test process using the
“total probability” axiom:
Y = P(R = pass) = P(R = pass, S = good or R = pass, S = bad)
= P(R = pass, S = good) + P(R = pass, S = bad)
By the “joint probability” axiom we can write this as
= P(S = good) · P(R = pass | S = good)
+ P(S = bad) · P(R = pass | S = bad)
= (1 – p) · (1 – a) + p ·
From this expression we see that there are two varieties of units that will yield: good and bad.
Fraction of units that will yield and be good:
P(R = pass, S = good) = (1 – p) · (1 – a).
Fraction of units that will yield and be bad:
P(R = pass, S = bad) = p ·
This is our first indication that yield and test escapes are related.
However, Y = P(R = pass) is predictive of the population of untested units. We are interested in the quality
characteristics of units that have been dispositioned by the test process. From the axiomatic definition of
conditional probability, we can obtain the quality characteristics of the tested product.
For escape probability:
P(S = bad | R = pass) = P(R = pass, S = bad)/P(R = pass)
= p · /[(1 – p) · (1 – a) + p · ]
For overkill probability:
P(S = good | R = fail) = P(R = fail, S = good)/[1 – P(R = pass)]
= (1 – p) · a/[1 – (1 – p) · (1 – a) + p · ]
The improvement in quality attributable to the test process:
P(S = bad) – P(S = bad | R = pass)
We have expressed the quality characteristics of the tested product in terms of the fundamental quantities of the
test process. We can obtain sensitivities to the fundamental quantities by differentiation or by differencing.
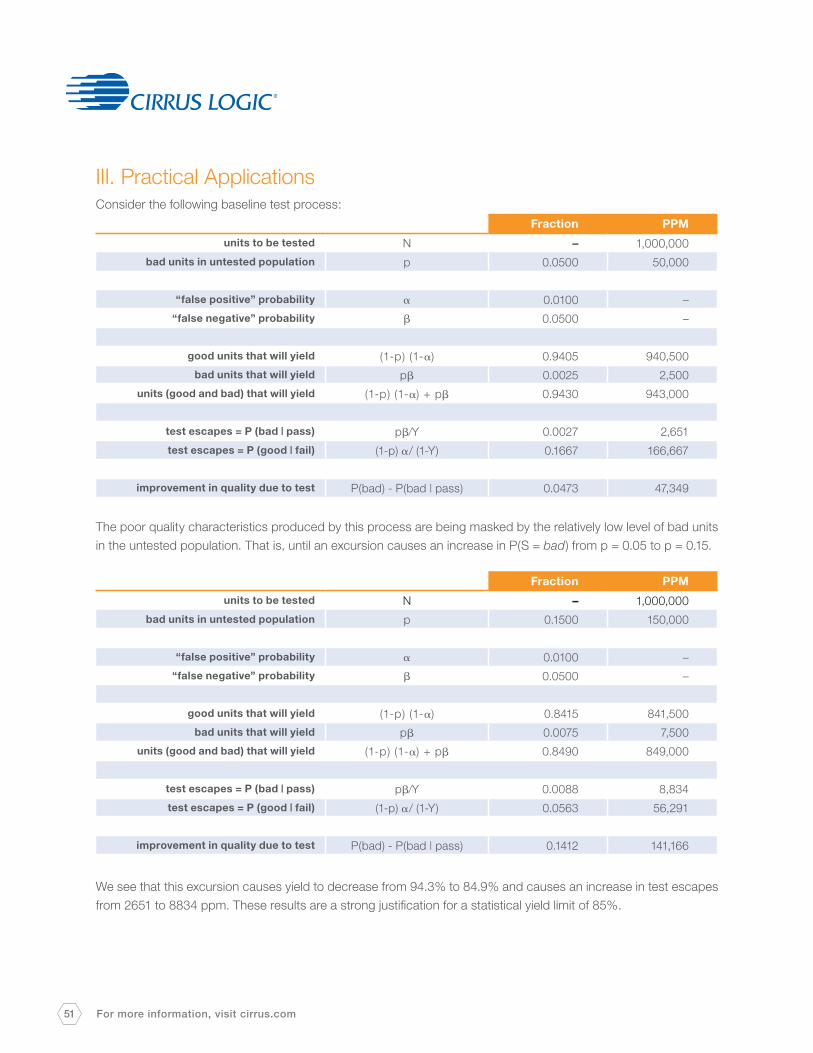
51 For more information, visit cirrus.com
III. Practical ApplicationsConsider the following baseline test process:
The poor quality characteristics produced by this process are being masked by the relatively low level of bad units
in the untested population. That is, until an excursion causes an increase in P(S = bad) from p = 0.05 to p = 0.15.
We see that this excursion causes yield to decrease from 94.3% to 84.9% and causes an increase in test escapes
from 2651 to 8834 ppm. These results are a strong justification for a statistical yield limit of 85%.
Fraction PPM
units to be tested N – 1,000,000
bad units in untested population p 0.0500 50,000
“false positive” probability a 0.0100 –
“false negative” probability 0.0500 –
good units that will yield (1-p) (1-a) 0.9405 940,500
bad units that will yield p 0.0025 2,500
units (good and bad) that will yield (1-p) (1-a) + p 0.9430 943,000
test escapes = P (bad | pass) p/Y 0.0027 2,651
test escapes = P (good | fail) (1-p) a/ (1-Y) 0.1667 166,667
improvement in quality due to test P(bad) - P(bad | pass) 0.0473 47,349
Fraction PPM
units to be tested N – 1,000,000
bad units in untested population p 0.1500 150,000
“false positive” probability a 0.0100 –
“false negative” probability 0.0500 –
good units that will yield (1-p) (1-a) 0.8415 841,500
bad units that will yield p 0.0075 7,500
units (good and bad) that will yield (1-p) (1-a) + p 0.8490 849,000
test escapes = P (bad | pass) p/Y 0.0088 8,834
test escapes = P (good | fail) (1-p) a/ (1-Y) 0.0563 56,291
improvement in quality due to test P(bad) - P(bad | pass) 0.1412 141,166

52Cirrus Logic Quality Handbook
Suppose that test program improvements reduce the a –risk to 0.005 and the –risk to 0.025:
We see that these improvements cause yield to increase from 94.3% to 94.7%, test escapes to decrease from
2651 to 1250 ppm and overkill to decrease from 166667 to 88785 ppm.
IV. Conclusions and Call to ActionWe have derived the dependence of product quality characteristics on the fundamental quantities that
characterize the test process (p, a, ).
We can eliminate the need for hard data on p = P(S = bad) if we treat it as a scenario parameter, varying p
systematically so that we may evaluate the test process independently of the manufacturing process. This leaves
us with the problem of determining the operating characteristics (a, ) of the test process. The most direct way to
obtain estimates of (a, ) is to bench test samples of passed and failed units:
a’ = failed units bench tested as good/number of failed units
’ = passed units bench tested as bad/number of passed units
Some would advocate the use of FACR/RMA data to establish the value of . RMA data is vulnerable to bias due
to the fact that not all returned units are bad in the application. FACR data is vulnerable to bias due to the fact that
not all application failures are returned on an FACR.
The guard-band yield loss may be a good indicator of the value of a where guard bands are implemented. This
may be biased when false fails are caused by factors like settling time that are not directly related to the accuracy
or precision of the measurement.
Lastly, there are factors in the test process that drive (a, ) in addition to measurement itself. For example,
discrepancies between the data log file and wafer map can cause pick errors.
These results are a strong justification for including the measurement and improvement of (a, ) in the
development, deployment and control of test processes.
Fraction PPM
units to be tested N – 1,000,000
bad units in untested population p 0.0500 50,000
“false positive” probability a 0.0050 –
“false negative” probability 0.0250 –
good units that will yield (1-p) (1-a) 0.9453 945,250
bad units that will yield p 0.0013 1,250
units (good and bad) that will yield (1-p) (1-a) + p 0.9465 946,500
test escapes = P (bad | pass) p/Y 0.0013 1,321
test escapes = P (good | fail) (1-p) a/ (1-Y) 0.0888 88,785
improvement in quality due to test P(bad) - P(bad | pass) 0.0487 48,679

53 For more information, visit cirrus.com
V. References1. A. M. Mood, F. W. Graybill, D. C. Boes (1974) Introduction to the Theory of Statistics,
New York: McGraw-Hill
VI. Mathematical DetailsA and B are discrete random variables that happen together
A = {A1, A2, ... An}
B = {B1, B2,Bm}
Generic outcomes of A and B are (Ai, Bj)
The “total” probability of the outcome Ai is obtained by summing over all possible values of B:
P(Ai) = P(Ai, B1) + P(Ai, B2) + ... + P(Ai, Bm)
Likewise for the probability of outcome Bj:
P(Bj) = P(A1, Bj) + P(A2, Bj) + ... + P(An, Bj)
The “joint” probability of (Ai, Bj) is the probability of a randomly selected unit manifesting outcomes Ai and Bj:
P(Ai, Bj) = P(Ai) · P(Bj | Ai)
This sentence is read “probability of A and B.”
Alternatively,
P(Ai, Bj) = P(Bj) · P(Ai | Bj)
The choice between these depends on the information available in a given context.
The “conditional” probability of outcome Bj given that outcome Ai has already been observed is:
P(Bj | Ai) = P(Ai, Bj)
P(Ai)
P(Ai, Bj)= P(Ai, B1) + P(Ai, B2) + ... + P(Ai, Bm)
When this is equivalently written as
P(Bj) · P(Ai, Bj)= P(Ai, B1) + P(Ai, B2) + ... + P(Ai, Bm)
The result is known as “Bayes’ Theorem”.
Contributing Author:Jeff Weintraub, Corporate Statistician, Cirrus Logic, Inc.

54Cirrus Logic Quality Handbook

55 For more information, visit cirrus.com
Copyright © 2021 Cirrus Logic, Inc. All rights reserved. Printed in the USA.
The information contained in this document is provided for informational purposes only and represents the current view of Cirrus Logic, Inc. on quality, as of the date of publication. In specific circumstances, or with specific customers, procedures may differ from those outlined herein. Cirrus Logic makes no commitment to update the information contained in this document, and Cirrus Logic reserves the right to make changes at any time, without notice.
This document is provided “as is.” Cirrus Logic does not warrant that this document is free from errors, or that any products or other technology developed in conformance with this document will perform in the intended manner, or will be free from infringement of third party proprietary rights, and Cirrus Logic disclaims all liability therefor.
Limited License Grant: Cirrus Logic hereby grants you a limited copyright license to copy this document for your use and internal distribution only. You may not distribute this document externally, in whole or in part, to any other person or entity.
Limited Liability: in no event shall Cirrus Logic have any liability to you or to any other third party, for any lost profits, lost data, loss of use or costs of procurement of substitute goods or services, or for any direct, indirect, special or consequential damages arising out of your use of this document or reliance upon the information contained herein, under any cause of action or theory of liability, and irrespective of whether Cirrus Logic, or any contributor has advance notice of the possibility of such damages. These limitations shall apply notwithstanding the failure of the essential purpose of any limited remedy.
Cirrus Logic, Cirrus, CLIDE (Cirrus Logic Integrated Development Environment), SoundClear, CirrusLink, WISCE, and the Cirrus Logic logo designs are among the trademarks of Cirrus Logic, Inc. and/or its subsidiaries. Other brand and product names in this document may be trademarks or service marks of their respective owners.

CORPORATE HEADQUARTERS
800 West Sixth Street Austin, Texas 78701 United States
T +1 512-851-4000 Toll Free +1 800-888-5016 cirrus.com
MARCH 2021