quality-driven logistics876782/fulltext01.pdf · supply chain supply chain management encompasses...
TRANSCRIPT

Thesis for the Degree of Licentiate of Engineering
Report 68
Quality-driven logistics
Roy Andersson
Division of Logistics and Transportation Department of Technology Management and Economics
Chalmers University of Technology Göteborg, Sweden 2007
School of Engineering
University College of Borås Borås, Sweden 2007
Quality-driven logistics © Roy Andersson, 2007 ISSN 1652-8026 Report/Department of Logistics and Transportation, Chalmers University of Technology: 68 Division of Logistics and Transportation Department of Technology Management and Economics Chalmers University of Technology SE-412 96 Göteborg, Sweden ISSN 0280-381X Skrifter från Högskolan i Borås: 3 School of Engineering University College of Borås SE-501 90 Borås, Sweden

ii
ACKNOWLEDGEMENTS The research for this thesis has been conducted at the Division of Quality and Logistics Man-agement, School of Engineering, University College of Borås. During the completion of this thesis, I have received generous support from a large number of people. First of all, I would like to thank my supervisor, Prof. Håkan Torstensson, who has supported and encouraged me throughout this work. Your help has been invaluable. Moreover, I would like to thank my supervisor Prof. Kenth Lumsden and Prof. Dag Ericsson. Special thanks are also due to my previous and present colleagues at the Division of Quality and Logistics Man-agement, who have been helpful and given me invaluable support during the completion of the thesis. Without your support I would not have been able to write this thesis. In addition, I want to thank the co-authors of my papers and reports, Dr. Henrik Eriksson, Anders Näslid, and Peter Manfredsson, for a productive collaboration. I would also like to thank Dr. Maria Fredriksson, who has given me valuable information about how to write a thesis. Further-more, I would like to thank Catharina Sundholm-Miller and Jonas Stray who have helped me improve the English of the papers. The work behind this thesis would never have been accomplished without the cooperation and support from the studied organisations. Thanks for your contribution. I especially want to thank Peter Häyhänen at Ericsson Microwave System, Borås. On a personal note, I would like to thank my parents, Erik and Mirdza Andersson, and my sister, Marita Andersson, for believing in me. Thanks are also due to my children Ida, Rasmus and Moa for their patience. Last, but definitely not least, I want to thank Erika for her positive spirit and moral support. Roy Andersson Borås, 30 January 2007

iii
ABSTRACT The overall objective of this thesis is to describe and explain how different quality manage-ment philosophies can be combined in the supply/demand chain, in order to contribute to its resilience. The analysis is both quantitative and qualitative, based on theory and literature related to TQM, Lean, Agile and Six Sigma, one literature study and three case studies that were performed in companies. The studies are related to four research questions and are pre-sented in four papers. The first research question focuses on similarities and differences between the quality man-agement concepts TQM, Lean and Six Sigma. The findings were that TQM, Six Sigma and Lean have many similarities, but they differ in some areas. For examples Lean addresses process flow and waste, whereas Six Sigma addresses variation and design. The conclusion is that there is a lot to gain if organisations are able to combine these three concepts, as they are complementary. Two case studies and a literature survey supported the findings. The second research question focuses on outcomes in a logistics process if using quality man-agement. The findings were that the quality management approach leads to risks being miti-gated, managed and monitored and ensures a more effective, robust and flexible process, very much in line with the Agility philosophy. Solutions for quicker response to customers have also been introduced. The findings were supported by two case studies in seven companies. The third research question focuses on how prepared the transport- and logistics-oriented companies are for the application of quality concepts and quality management philosophy. The findings were that they can be described as being TQM-oriented. The companies do not consider Lean and Six Sigma to be future trends. Focus is on the customer, while they do not focus on variations or removing waste. The findings were supported by a case study in 24 companies. The fourth research question focuses on how quality concepts can contribute to risk control and resilience in an organisation. A combined Lean/Six Sigma approach by using Six Sigma framework and the last phase, Perfection, in the Lean concept, implies that the companies’ resilience, due to their strengthened ability to handle variability, risk management and agility, was improved. The findings were supported by two case studies in seven companies. Keywords: TQM, Lean, Agile, Six Sigma, Supply Chain, Demand Chain, Risk Management, Quality Management

iv
LIST OF APPENDED PAPERS This thesis includes the following four papers, appended in full. Paper I Andersson Roy, Henrik Eriksson and Håkan Torstensson (2006), Similarities and differences between TQM, Six Sigma and Lean, The TQM Magazine; Vol. 18, Issue 3, pp 282-296. This paper was also presented at the 7th International QMOD Conference, Monterrey, Mexico 2004: Andersson Roy, Henrik Eriksson and Håkan Torstensson (2004), Similarities and differences between TQM, Six Sigma and Lean, Conference proceeding, 7th International QMOD Con-ference, Monterrey, Mexico, pp 143-158. Paper II Andersson, Roy, Peter Manfredsson and Anders Näslid (2005), Application of Six Sigma to Control Variability in Production Logistics: A Case Study, PLAN Conference Quality and efficiency in the entire supply chain, University College of Borås, pp 21-37. Paper III Andersson, R., M. Fredriksson and H. Torstensson (2005), Reducing logistic variations by quality techniques, Conference proceedings, Vol 1, 8th International QMOD Conference, Palermo, pp 457-464. Paper IV Andersson, R. and H. Torstensson (2006), A combined quality approach to controlling supply chain risk. Conference proceedings, Vol 1, 9th International QMOD Conference, Liverpool. CONTRIBUTIONS IN THE APPENDED PAPER Paper I Main author. Shared planning, writing, analysis and interviewing procedure. Paper II Main author. Shared planning procedure and analysis procedure. Writing procedure. Inter-viewing procedure. Paper III Main author. Analysis procedure. Interviewing and planning procedure. Shared writing. Paper IV Main author. Analysis procedure. Interviewing, observation, writing.and planning procedure.
v
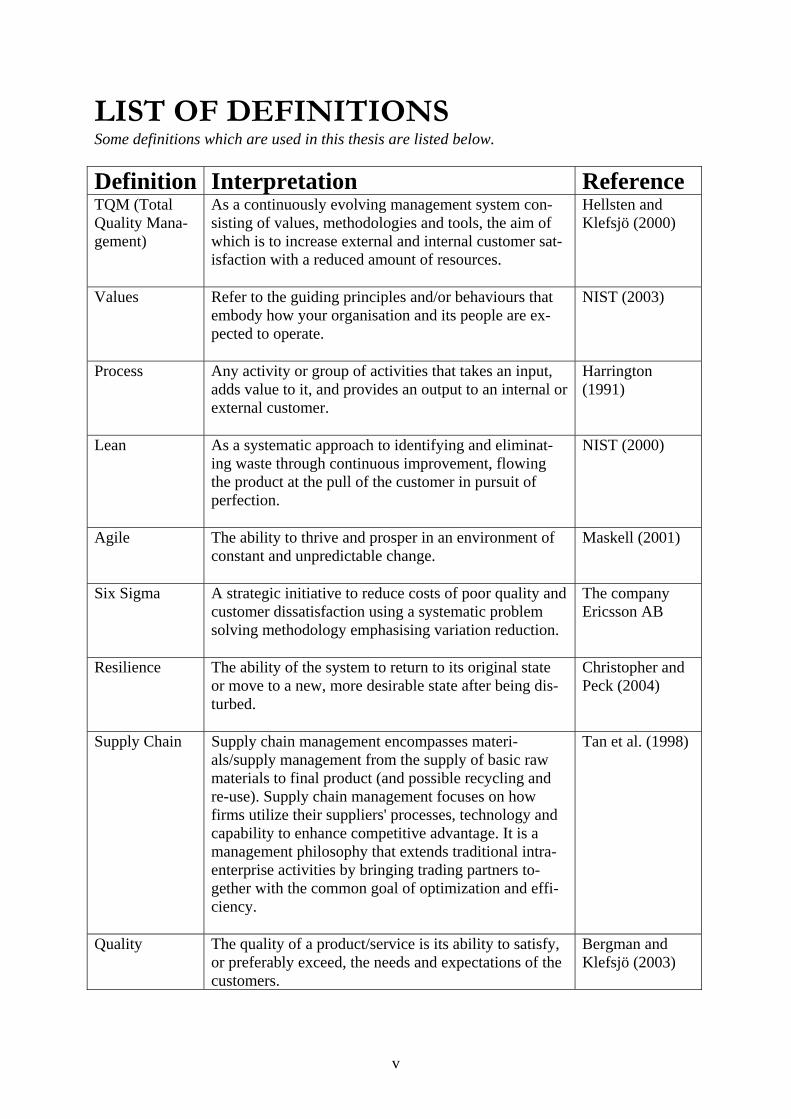
LIST OF DEFINITIONS Some definitions which are used in this thesis are listed below.
Definition Interpretation Reference TQM (Total Quality Mana-gement)
As a continuously evolving management system con-sisting of values, methodologies and tools, the aim of which is to increase external and internal customer sat-isfaction with a reduced amount of resources.
Hellsten and Klefsjö (2000)
Values Refer to the guiding principles and/or behaviours that embody how your organisation and its people are ex-pected to operate.
NIST (2003)
Process Any activity or group of activities that takes an input, adds value to it, and provides an output to an internal or external customer.
Harrington (1991)
Lean As a systematic approach to identifying and eliminat-ing waste through continuous improvement, flowing the product at the pull of the customer in pursuit of perfection.
NIST (2000)
Agile The ability to thrive and prosper in an environment of constant and unpredictable change.
Maskell (2001)
Six Sigma A strategic initiative to reduce costs of poor quality and customer dissatisfaction using a systematic problem solving methodology emphasising variation reduction.
The company Ericsson AB
Resilience The ability of the system to return to its original state or move to a new, more desirable state after being dis-turbed.
Christopher and Peck (2004)
Supply Chain Supply chain management encompasses materi-als/supply management from the supply of basic raw materials to final product (and possible recycling and re-use). Supply chain management focuses on how firms utilize their suppliers' processes, technology and capability to enhance competitive advantage. It is a management philosophy that extends traditional intra-enterprise activities by bringing trading partners to-gether with the common goal of optimization and effi-ciency.
Tan et al. (1998)
Quality
The quality of a product/service is its ability to satisfy, or preferably exceed, the needs and expectations of the customers.
Bergman and Klefsjö (2003)

TABLE OF CONTENTS 1 Introduction ........................................................................................................................ 2
1.1 Background ................................................................................................................ 2 1.2 Problem Area.............................................................................................................. 5 1.3 Purpose of the Thesis ................................................................................................. 5 1.4 Problem Discussion and Research Questions ............................................................ 5 1.5 Delimitations .............................................................................................................. 9 1.6 Thesis Structure.......................................................................................................... 9
2 Theoretical Frame of Reference....................................................................................... 11 2.1 Quality Management ................................................................................................ 11 2.2 TQM......................................................................................................................... 12 2.3 Lean.......................................................................................................................... 16 2.4 Agility....................................................................................................................... 19 2.5 Six Sigma ................................................................................................................. 20 2.6 Supply/Demand Chain Management ....................................................................... 24 2.7 Risk Management..................................................................................................... 26
3 Methodology .................................................................................................................... 28 3.1 Research Approach .................................................................................................. 28 3.2 Research Strategy..................................................................................................... 30 3.3 Research Process ...................................................................................................... 31 3.4 Research Strategies of the Studies ........................................................................... 33
4 Results and Conclusions of the Studies............................................................................ 37 4.1 Study 1...................................................................................................................... 37 4.2 Study 2...................................................................................................................... 40 4.3 Study 3...................................................................................................................... 43 4.4 Study 4...................................................................................................................... 46
5 Discussions and Conclusions ........................................................................................... 50 5.1 Research Question 1-4 ............................................................................................. 50 5.2 Findings Concerning Research Question 1 .............................................................. 50 5.3 Findings Concerning Research Question 2 .............................................................. 51 5.4 Findings Concerning Research Question 3 .............................................................. 51 5.5 Findings Concerning Research Question 4 .............................................................. 52 5.6 Conclusion of the Thesis .......................................................................................... 53 5.7 Further Research ...................................................................................................... 54
References ................................................................................................................................ 56 APPENDED PAPERS Paper I “Similarities and differences between TQM, Six Sigma and Lean” Paper II “Application of Six Sigma to control variability in production logistics. A case study” Paper III “Reducing logistic variations by quality techniques” Paper IV “A combined quality approach to controlling supply chain risk” APPENDICES Appendix 1: Questions for study 1 Appendix 2: Questions for study 3 and the participating companies. Appendix 3: Questions for study 4 and the participating companies.

2
1 Introduction This chapter consists of the background to the research area. In addition, the problem area, the purpose, the research questions, the delimitations, and the structure of the thesis are pre-sented.
1.1 Background 1.1.1 Supply Chain Today’s business environment is characterized by extremely tight competition between com-panies, countries and even entire continents. Companies are forced to constantly reduce costs and outperform. Efficiency and cost-based competition have been highlighted and production is increasingly being transferred to countries with low labour cost. At the same time, custom-ers are becoming increasingly demanding. Competing only with price is risky. Globalisation brings increased complexity to virtually every aspect of the business world, and supply chains are the latest to be affected. Many company failures can be traced back to an inability to adapt rapidly to changing market expectations, see Hoole (2005), Christopher and Peck (2004) and Eriksson (2003). To retain customer loyalty companies should serve every customer as an individual, offering customised products and services at a reasonable price. Companies are expected to pursue both efficiency and effectiveness at the same time. Combining these two aspects is difficult at best and requires reasonable trade-off between cost control and produc-tion of customer value. Mass customisation, as ability to use of flexible processes and organ-izational structures to produce varied and often individually customised products and services at the price of standardized, mass-produced alternatives, see Hart (1996), Ericsson (2003) and Pine (1993). Nowadays organizations can no longer efficiently and effectively compete in isolation of their suppliers, customers or other interest, supply chains, not organizations, compete against each other, those who will survive are those who can provide management to the fully integrated supply chain, entire supply chain must be viewed as one system. It implies that organisations across the supply chain must take interest in each other and work together to make the entire supply chain competitive. The goal is to integrate and coordinate all activities and processes across the supply chain through enhanced collaboration and information exchange (Lummus and Vokurka, 1999). To be successful in the future the supply chain should be market-driven or demand-driven, where the key model is oriented toward virtual networks, information bases and perceived customer value. One important issue is to manage risk; today many organizations are at risk because their response times to demand changes are too long or their supply is disrupted. To-morrow competition will be between supply chains rather than between companies (Ericsson, 2003). According to Antonovsky (1987) organisations need to be flexible and resilient because of the supply chain being unpredictable. There are four principles that characterize supply chain resilience: risk management culture, agility, design and innovation-led (Re-engineering from cost optimizing and bringing design into the core of the supply chain) and collaboration (Christopher and Peck, 2004).
3
1.1.2 Quality Management There are many different theories and approaches in the field of Organisational Development that argue for different, and sometimes similar activities in order to enhance organisational performance, in order to keep a competitive advantage on the market. Today’s companies have for many years striving to be focused on customers and to be quality leaders. Focus on customer led in the companies to quality management, see, for example Carson et al. (1999) and van der Wiele et al. (2000). During the last decades, quality management has been put forward by a number of its promoters as a new management theory, but, the description of what quality management is differs, see, for example, Foley (2004). Despite the high aims of promoters of quality management, the failures of organisations trying to implement a success-ful quality management programme have been well documented, see Brown et al. (1994), Eskildson (1994), Harari (1997), Cao et al. (2000) or Nwabueze (2001). However, the description and definition of these different management concepts differ. Con-cepts that have been presented and promoted are, for instance, Total Quality Management (TQM) , Six Sigma, Lean Manufacturing, Business Process Re-engineering (BRE), Just-in-Time (JIT), Kaizen, Business Excellence, Total Preventive Maintenance (TPM), etc. The most used and the most written articles on quality management philosophies are about TQM, Lean and Six Sigma.
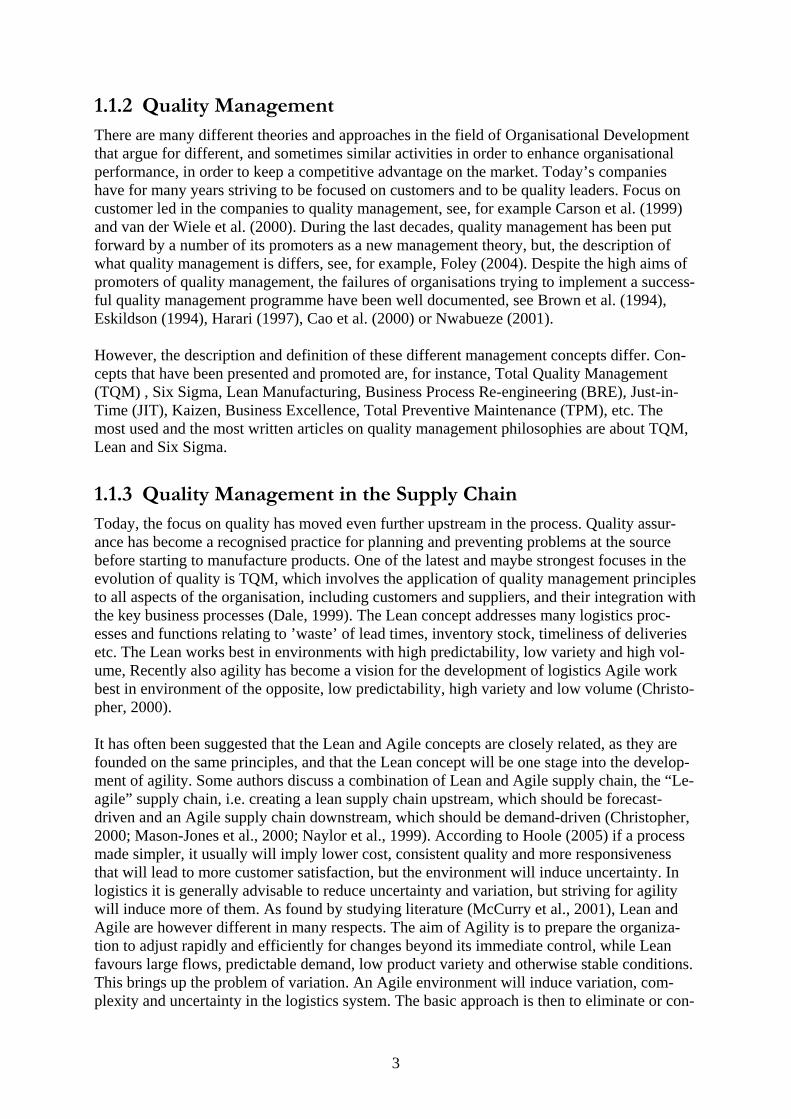
1.1.3 Quality Management in the Supply Chain Today, the focus on quality has moved even further upstream in the process. Quality assur-ance has become a recognised practice for planning and preventing problems at the source before starting to manufacture products. One of the latest and maybe strongest focuses in the evolution of quality is TQM, which involves the application of quality management principles to all aspects of the organisation, including customers and suppliers, and their integration with the key business processes (Dale, 1999). The Lean concept addresses many logistics proc-esses and functions relating to ’waste’ of lead times, inventory stock, timeliness of deliveries etc. The Lean works best in environments with high predictability, low variety and high vol-ume, Recently also agility has become a vision for the development of logistics Agile work best in environment of the opposite, low predictability, high variety and low volume (Christo-pher, 2000). It has often been suggested that the Lean and Agile concepts are closely related, as they are founded on the same principles, and that the Lean concept will be one stage into the develop-ment of agility. Some authors discuss a combination of Lean and Agile supply chain, the “Le-agile” supply chain, i.e. creating a lean supply chain upstream, which should be forecast-driven and an Agile supply chain downstream, which should be demand-driven (Christopher, 2000; Mason-Jones et al., 2000; Naylor et al., 1999). According to Hoole (2005) if a process made simpler, it usually will imply lower cost, consistent quality and more responsiveness that will lead to more customer satisfaction, but the environment will induce uncertainty. In logistics it is generally advisable to reduce uncertainty and variation, but striving for agility will induce more of them. As found by studying literature (McCurry et al., 2001), Lean and Agile are however different in many respects. The aim of Agility is to prepare the organiza-tion to adjust rapidly and efficiently for changes beyond its immediate control, while Lean favours large flows, predictable demand, low product variety and otherwise stable conditions. This brings up the problem of variation. An Agile environment will induce variation, com-plexity and uncertainty in the logistics system. The basic approach is then to eliminate or con-

4
trol complexity. Customers will not pay for complexity they will pay for and minimize its cost. Six Sigma is characterized as a method to identify customer requirements and fulfil them without unnecessary variation, (George et al., 2004). However, to achieve logistics efficiency it is advisable to consider a combination of Lean, Agile and Six Sigma concepts, as visualized in figure 1.1.
Variation
Logistics processes Decreased Increased Controlled
Lean Agile Six Sigma
Again, the logistics processes will benefit considerably from a quality-driven approach, utiliz-ing a sometimes situation-adapted combination of available concepts. In some contexts Lean and Agility principles are applied, or Lean and Six Sigma. Supply chain management incorporates three different strategies: move the manufacturing to low-cost countries and create a Lean supply chain, keep the manufacturing in high-cost coun-tries and instead create an Agile supply chain through manufacturing networks, combine Lean and Agile strategies and create a “Leagile” supply chain (Christopher, 2000). Today, logistics has become a major factor for enterprises to become more competitive, and at the same time the logistics development has adopted several of the quality concepts. How-ever, many companies suffer from shortfalls in their logistics. Efficient logistics management requires that unpredictable variations and uncertainties are minimized. Simple quality con-cepts and tools, such as the seven basic tools, are used rather frequently in this context. There is however a great and to a large extent unexploited potential in applying advanced quality management, in particular the Six Sigma concept, to the problem of logistics variation and complexity. Recently, the term Lean Six Sigma has been put forward by, for example, George et al. (2004). Specifically, they claim that “Lean Six Sigma helps companies flourish in a new world where customers expect no defects and fast delivery at the minimal cost”. Magnusson et al. (2003) also state that many companies have merged Six Sigma and Lean manufacturing practices. However, to achieve logistic efficiency in Supply Chain it may be advisable to con-sider a combination of the four concepts TQM, Lean, Agile and Six Sigma, in order to be re-silient. Although much important works have been documented and applied, during the last decades, by many different organisations, regarding different quality management concepts, including TQM, Lean, Agile and Six Sigma, a number of questions remain concerning the applicability of these concepts in the supply/demand chain.
Figure 1.1. Contextual view of the relationship between logistics processes and quality concepts and the resulting influence on variation. Lean principles will assist in reducing variation and waste, while agile logistics helps fulfilling rapidly changing demands and the desired customer orientation at the price of increasing complexity and variations. Six Sigma tools are crucial in the aim for controlling that complexity and minimizing the as-sociated uncertainty.

5
1.2 Problem Area According to Christopher (1998) the ultimate purpose of any logistics system is to satisfy cus-tomers. Magnusson et al. (2000) claim that customer focus is a concept that has increased the last two decades. According to Griffiths et al. (2000) characteristics of successful companies in the 1900s were a high customer focus and concentration on customer needs, especially the need availability, but also short lead time, many variants and new products. However con-vincing arguments that are brought forward regarding the importance of logistics excellence for competitiveness and bottom-line results, it is often found that enterprises do not take ad-vantage of this: ‘Although the tools are very powerful from both Lean and Six Sigma, we do, however, need to remember that for Lean and Six Sigma to work in logistics, a fundamental mind shift must occur’ (Martichenko, 2004).The most difficult operations issue for logistics has been to improve the quality to the customer and at the same time reduce costs. Today we must ask how we reduce cost while increasing customer value. Demand chain management is the next major frontier for effective competition, see Ericsson (2003). Demand driven supply chains that highlight customer demand as the starting point for all activities. This thesis focuses mainly on theories and approaches to achieve logistic resilience by com-bining quality management concepts, such as TQM, Lean, Agility and Six Sigma, in the sup-ply/demand chain.
1.3 Purpose of the Thesis As a result of their increasing complexity, rapidly changing customer needs, unpredictable and changing world, today many organizations are at risk. Companies must be resilient to all kinds of changing conditions. The problems in risk management, customers’ changing needs and control of variation, are often similar to those that are well known in quality management, where strategies and tools have been developed for handling this kind of problem. The purpose of the thesis is to de-scribe and explain how different quality management philosophies can be combined in the supply/demand chain, in order to handle variability, allowing organizations to become more reliable, flexible and robust in the processes, to control and mitigate risk and be more cus-tomer-oriented. This will assist the companies to be in line with the Agile or ‘Leagile’ con-cepts.
1.4 Problem Discussion and Research Questions 1.4.1 Research Question 1 While management is considered as relatively immature compared to other social sciences, the field has been bombarded with “fads”, see for example Carson et al. (1999). In summary, the different management theories presented over the years, of which some could be argued to be management fads. During the last decades, quality management has been put forward by a number of its promot-ers as a new management theory, see for example Foley (2004). However, the description of what quality management is differs. Despite the high aims of promoters of quality manage-

6
ment, the failures of organisations trying to implement a successful quality management pro-gramme have been well documented, see Brown et al. (1994), Eskildson (1994), Harari (1997), Cao et al. (2000) and Nwabueze (2001). These failures have led some authors to ques-tion whether some concepts in the area of quality management are fads, see for example, van der Wiele et al. (2000).Concepts that have been presented and promoted are, for instance, TQM, Six Sigma and Lean. The failures of TQM, Lean and Six Sigma implementation have been well documented. Eskildson (1994) and Harari (1997) claim that TQM programmes are ineffective. Further-more, Bergquist and Ramsing (1999) and Przasnyski and Tai (1999) argue that it is difficult to establish a relationship between TQM and improved performance in companies, see for ex-ample, Brown et al. (1994), Eskildson (1994), Harari (1997), Cao et al. (2000), Nwabueze (2001) and Foley (2004). In more detail Harari (1997) states that, after studying all the inde-pendent research conducted by consulting firms, the conclusion is that only about one-fifth, or at best one-third, of the TQM programmes in the United States and Europe have achieved significant or even tangible improvements in quality, productivity, competitiveness or finan-cial results. Criticism against Six Sigma according to Klefsjö et al. (2001) emphasizes that Six Sigma has the same common features as TQM and that Six Sigma does not, in principle, con-tain anything new. In more detail, they state that Six Sigma is a highly disciplined, data-oriented and top-down approach. Examples of shortcomings for Lean, which can be found in the literature on the subject, are that a Lean organisation may become very susceptible to the impact of changes. The leanness in itself leads to reduced flexibility and less ability to react to new conditions and circumstances (Dove, 1999). JIT deliveries cause congestion in the supply chain, leading to delays, pollution, shortage of workers etc. (Cusumano, 1994). On the other hand there are several success stories associated with TQM , Lean and Six Sigma. Results have been published which show that TQM investments do result in improved performance in companies, see for example, Lemak and Reed (1997), Hendricks and Singhal (1997) and Handsfield et al. (1998). In recent years, research has also shown that one of the goals of TQM, customer satisfaction, has a significant positive impact on market value as well as accounting returns, see for example, Andersson and Fornell (1994) and Eklöf et al. (1999). There are several success stories about Lean, for example according to NIST (2003), for 40 companies that had adopted Lean, typical improvements are visible in three areas. These im-provement areas include: Operational Improvements (reduction of lead time, increase in pro-ductivity, reduction in work-in-process inventory, etc.), Administrative Improvements (reduc-tion in order processing errors, streamlining of customer service functions so that customers are no longer placed on hold, etc.) and Strategic Improvements (reduced costs, etc.). Much of the increased interest in Six Sigma programmes is due to the positive financial impact some companies claim that the programmes have. For example, Volvo Cars in Sweden claim that the Six Sigma programme has contributed with over 55 million euro to the bottom line during 2000 and 2002, see Magnusson et al. (2003). Another company that has been successful with their Six Sigma programme is the Business unit of Transmission & Transportation Networks at Ericsson, located in Borås, Sweden. However, the description and definition of these different quality management concepts dif-fer. While the definitions of TQM, Six Sigma and Lean differ, the aim of the different con-cepts seems to be similar; through improvements minimising waste and resources, while im-proving customer satisfaction and financial results. These concepts also have the same origin; see Dahlgaard and Dahlgaard (2001). However, the parts or the visions about the whole dif-fer, according to the definitions of TQM, Six Sigma and Lean. Furthermore, the way to
7
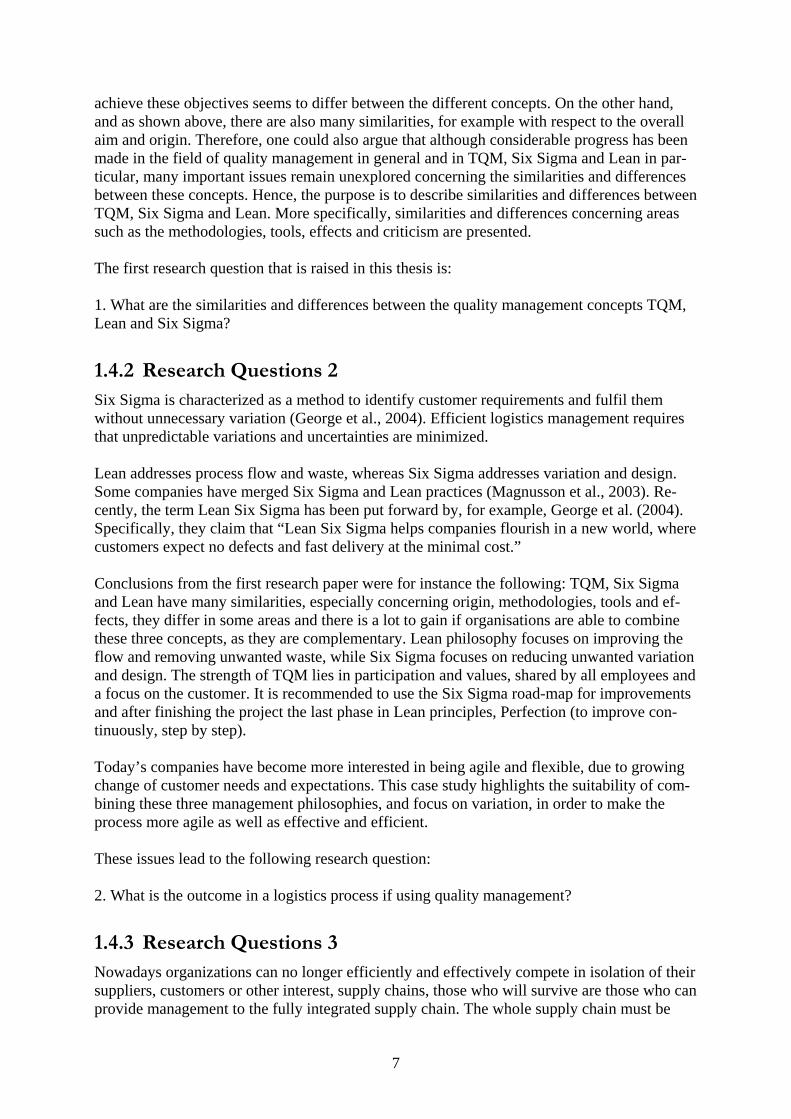
achieve these objectives seems to differ between the different concepts. On the other hand, and as shown above, there are also many similarities, for example with respect to the overall aim and origin. Therefore, one could also argue that although considerable progress has been made in the field of quality management in general and in TQM, Six Sigma and Lean in par-ticular, many important issues remain unexplored concerning the similarities and differences between these concepts. Hence, the purpose is to describe similarities and differences between TQM, Six Sigma and Lean. More specifically, similarities and differences concerning areas such as the methodologies, tools, effects and criticism are presented. The first research question that is raised in this thesis is: 1. What are the similarities and differences between the quality management concepts TQM, Lean and Six Sigma?
1.4.2 Research Questions 2 Six Sigma is characterized as a method to identify customer requirements and fulfil them without unnecessary variation (George et al., 2004). Efficient logistics management requires that unpredictable variations and uncertainties are minimized. Lean addresses process flow and waste, whereas Six Sigma addresses variation and design. Some companies have merged Six Sigma and Lean practices (Magnusson et al., 2003). Re-cently, the term Lean Six Sigma has been put forward by, for example, George et al. (2004). Specifically, they claim that “Lean Six Sigma helps companies flourish in a new world, where customers expect no defects and fast delivery at the minimal cost.” Conclusions from the first research paper were for instance the following: TQM, Six Sigma and Lean have many similarities, especially concerning origin, methodologies, tools and ef-fects, they differ in some areas and there is a lot to gain if organisations are able to combine these three concepts, as they are complementary. Lean philosophy focuses on improving the flow and removing unwanted waste, while Six Sigma focuses on reducing unwanted variation and design. The strength of TQM lies in participation and values, shared by all employees and a focus on the customer. It is recommended to use the Six Sigma road-map for improvements and after finishing the project the last phase in Lean principles, Perfection (to improve con-tinuously, step by step). Today’s companies have become more interested in being agile and flexible, due to growing change of customer needs and expectations. This case study highlights the suitability of com-bining these three management philosophies, and focus on variation, in order to make the process more agile as well as effective and efficient. These issues lead to the following research question: 2. What is the outcome in a logistics process if using quality management?
1.4.3 Research Questions 3 Nowadays organizations can no longer efficiently and effectively compete in isolation of their suppliers, customers or other interest, supply chains, those who will survive are those who can provide management to the fully integrated supply chain. The whole supply chain must be

8
viewed as one system, see Lummus and Vokurka, (1999). It implies that organizations across the supply chain must take interest in each other and work together to make the entire supply chain competitive. The goal is to integrate and coordinate all activities and processes across the supply chain through enhanced collaboration. Today’s companies focuses on customers and to be quality leaders. Focus on customer led in the companies to quality management, see, for example Carson et al. (1999). Today, the focus on quality has moved even further upstream and downstream of the focal company. Quality assurance has become a recognised practice for planning and preventing problems at the source before starting an activity in supply chain (Dale, 1999). A number of transport- and logistics-oriented companies are usually involved in the supply chain, some of the companies more than others, in the same value chain. Efficient logistics management requires that unpredictable variations and uncertainties are minimized. No chain is stronger than the weakest link. This leads to the following research question: 3. How prepared are the transport- and logistics-oriented companies for the application of quality concepts and quality management philosophy?
1.4.4 Research Questions 4 The prevailing trend among supply chains is to organise in a leaner and more customer-oriented way, as a result of their increasing complexity due to outsourcing and rapidly chang-ing customer needs. They act in an unpredictable and changing world, where natural disasters, terrorism, strikes etc. occur frequently. One important issue is to manage risk, today many organizations are at risk because their response times to demand changes are too long or their supply is disrupted (Ericsson, 2003 and Christopher and Peck, 2004). One important issue is to manage resilience (Antonovsky 1987). There are four principles that characterize supply chain resilience, see Christopher and Peck (2004):
• Risk management culture • Agility • Design and innovation-led (Re-engineering from cost optimizing and bringing design
into the core of the supply chain) • Collaboration
The problems in risk management are often similar to those that are well known in quality management, for example the concern with sources of variation. Experience indicates that assignable causes of variation can usually be found by statistical tools without undue diffi-culty, leading to a process with less variation. Arguments for using quality management con-cepts in risk management have been suggested by Williams et al. (2006). They state the chal-lenge of being successful in business today lies in managing, controlling and mitigating the risks through creating a more resilient supply chain. One of the conclusions from paper 1 and 2 was that it is advantageous to combine Lean and Six Sigma, an observation that is supported by practice. This applies very clearly to logistics systems, where Lean tools, achieving pull systems, setup reduction, inventory control etc., are given added value by Six Sigma tools for variation and risk control.
9
The logistics processes and supply chain risk management will thus benefit considerably from a quality-driven approach. Lean Six Sigma has been put forward by, for example George et al. (2004). Specifically, they claim that “Lean Six Sigma helps companies flourish in a new world where customers expect no defects and fast delivery at the minimal cost.” There is a great and to a large extent unexploited potential in applying advanced quality man-agement, in particular the Six Sigma toolbox, to the problem of variation and complexity. Design, collaboration and agility are key factors, particularly characterized by variation and complexity, in the enterprises’ efforts to control and minimize risks throughout the supply chain. It is shown how they can benefit from a combined Lean/Six Sigma approach. It has also been demonstrated in paper 2 that Six Sigma projects can support agility in the process, which may be very important in order to manage and control risk. This leads to the following research questions: 4. How can quality concepts contribute to risk control and resilience in an organisation?
1.5 Delimitations The empirical studies are limited to Swedish organisations, primarily in order to be influenced by cultural differences between organisations. However, almost all the companies are interna-tional.
1.6 Thesis Structure The chapters of the thesis are presented below. Chapter 1: Introduction. This chapter consists of the background to the research area. In addition, the problem area, the purpose, the research questions and the structure of the thesis are presented. Chapter 2: Theoretical Frame of Reference. In this chapter, the theoretical frame of refer-ence is discussed. Areas such as Quality Management, TQM, Lean, Agile, Six Sigma, Sup-ply/Demand Chain and Risk management are addressed here. Chapter 3: Methodology. In this chapter the chosen methodology is presented. The chapter includes a description and discussion of aspects related to the chosen research approach and strategy. The research process is also presented. Furthermore, other relevant choices that in-fluence the studies, and the validity and reliability of the thesis are discussed. Chapter 4: Summary of Studies. In this chapter, the background, the purpose and the meth-ods of the studies are given a short presentation. Furthermore, the main results of the studies are presented. Finally, the main conclusions of each study are presented. Chapter 5: Conclusions, Discussions and Further Research. In this chapter, the findings with respect to the different research questions are discussed, see figure 1.2. Some general conclusions are also presented. Furthermore, this chapter also consists of ideas for further research which have evolved during the research process.

10
Research Question 1 What are the e similarities and differ-ences between the quality management concepts TQM, Lean and Six Sigma?
Research Question 2 What is the outcome in a logistics proc-ess if using quality management?
Research Question 4 How can quality concepts contribute to risk control and resilience in an organi-sation?
Research Question 3 How prepared are the transport- and logistics-oriented companies for the ap-plication of quality concepts and quality management philosophy?
Paper IV A combined quality approach to control-ling supply chain risk.
Paper III Reducing logistics variations by quality techniques.
Paper II Application of Six Sigma to Control Variability in Production Logistics: A Case Study
Paper I Similarities and differences between TQM, Six Sigma and Lean, Conference proceeding.
Besides these chapters, the thesis also consists of four appended papers, as well as three ques-tion forms for the interviews.
Figure 1.2. The connection between the research questions and the papers. The thickness of the arrow indicates the significance of the connection.
11
2 Theoretical Frame of Reference In this chapter, the theoretical frame of reference is discussed. Aspects, such as Quality Man-agement, TQM, Lean, Six Sigma, Agile, Supply/Demand Chain and Risk Management, are presented.
2.1 Quality Management Management is the process of planning, organizing, leading and controlling the resources and the work of the members of the organization in order to reach the common goal, see, Stoner et al. (1995). Today’s companies have for many years been strived to focuses on customers and to be quality leaders. The decisive factor is the company’s ability to execute the key business processes and fulfil the customers’ expectations. Focuses on customer led in the companies to quality management. During the last decades, quality management has been put forward by a number of its promoters as a new management theory, see Foley (2004). In order to keep a competitive advantage on the market, organisations have focused on the quality of their products and services. Different initiatives to increase the quality of products and services have evolved over the years. The early focus, at the beginning of the twentieth century, was on inspection, which included checking that the manufactured products met the specifications. During the past few decades the focus in organisations has shifted from inspec-tion to quality control of products. Kroslid (1999) identifies two different schools of quality management, “the deterministic school of thought” existence of one best way it could be characterized by compliance with standards and specifications through procedures, for exam-ple the ISO 9000 standards The other school is “the continuous improvement school of thought”, the world on a reality full of variation, it could be characterized by the use of self-assessment and quality awards in order to drive improvements. According to Reeves and Bednar (1994) there is lack of agreement concerning the definition of quality, but it is impossible to define quality globally, because different definitions are ap-propriate under different circumstances. In this thesis the definition from Bergman and Klef-sjö (2003) is used “The quality of a product/service is its ability to satisfy, or preferably ex-ceed, the needs and expectations of the customers.” Today many people associate quality with ISO 9000. ISO 9000:2000 quality system standards serve as a subset of TQM overall requirements, see Kartha (2004). ISO 9000 requires of an organisation to define and document the way it does business, and compliance can provide the basic quality system structure that can be improved further. ISO 9000 is a starting point on a journey to a world-class quality system and certification to these standards can be an excellent starting point for TQM implementation. Criticism about ISO 9000 is well documented, some of it concerns that ISO 9000 is reported to create unnecessary paper-work and that the stan-dard is highly documentation-driven, which can lead to a costly and time-consuming under-taking (Douglas et al., 2003 and Poksinska et al., 2002). According to Lilja and Wiklund (2006) modern quality management has been continuously evolving in response to the changing demands of business. A deeper understanding of what creates customer satisfaction and customer value is hence essential to quality management. Quality dimensions can be separated into three groups (Bergman and Klefsjö, 2003).

12
• Must-be quality represents needs that are so obvious that usually the customer would
not mention these needs if asked. We can not get a satisfied customer by fulfilling only the basic needs.
• Expected quality represents needs that are mentioned if asked. The customer is fully
aware of these needs.
• Attractive quality represents needs that are not mentioned if asked; they are not aware of them. If an organisation can identify such needs and then satisfy them, large value has been added to the product or service. By finding such quality dimensions a com-pany can win loyal customers and can gain a competitive edge over its competitors.
The focus on quality has today moved even further upstream and downstream of the focal company. Quality has become planning and preventing problems in the value stream within the demand chain (Dale, 1999).
2.2 TQM There are several ways of describing the evolution of TQM and there is no general agreement on where and when TQM was first used. One can identify four levels in the evolution of TQM, according to Dale’s model (1999), see figure 2.1. Dale calls them Inspection (I), Qual-ity Control (QC), Quality Assurance (QA) and Total Quality Management (TQM). Garvin (1988) also describes the evolution of TQM in a similar way.
Figure 2.1. The four evolution levels of the TQM , starting with Inspection (I), followed by Quality Control (QC), Quality Assurance (QA) and Total Quality Management (TQM). From Dale (1999). Different definitions of TQM have been presented over the years. Boaden (1997) claims that “attempting to define TQM is like shooting at a moving target”. This fact was one of the rea-sons for the definition of TQM “as a continuously evolving management system”, provided by Hellsten and Klefsjö (2000). Dahlgaard et al. (1998) argue that TQM as a corporate culture characterized by increased customer satisfaction through continuous improvement, in which all employees in the companies participate actively. On the other hand Dale (1999) claims that TQM is both a philosophy and a set of guiding principles for managing an organization. Further, TQM has been described as a set of improvement tools useful in an organization and as a management philosophy; see Hackman and Wageman (1995), Shiba et al. (1993), Boaden (1997) and Dale (1999).
TQM
QA
QC I

13
Hellsten and Klefsjö (2000) define TQM “as a continuously evolving management system consisting of values, methodologies and tools, the aim of which is to increase external and internal customer satisfaction with a reduced amount of resources”. This definition is ac-knowledged and used in this thesis. The definition is used because of its structured descrip-tion. According to them, TQM is a management system for continuous improvements. It con-tains core values, methodologies and tools, see figure 2.2.
Values
Improve Continuously
Focus on Customers
Base Decisions on Fact
Let Everybody be Committed
Focus onProcesses
Top ManagementCommitment
Methodologies
Bench- marking
Quality FunctionDeployment
EmployeeDevelopment
Quality Circles
ProcessManagement
SupplierPartnership
Design ofExperimentSelf-
assessment PolicyDeployment
Aim: Increase external and internal customer satisfactionwith a reduced amount of resources
Total Quality Management
ToolsControl Charts
IshikawaDiagram
Tree Diagram
RelationDiagram
ProcessMaps
Criteria of MBNQA
FactorialDesign
ISO9000
Figure 2.2. TQM seen as a management system consisting of values, methodologies and tools, the aim of which is to increase external and internal customer satisfaction with a re-duced amount of resources. It is important to note that the methodologies and tools in the figure are just examples and not a complete list. The values may differ somewhat between different organizations and over time. From Hellsten and Klefsjö (2000). According to Hellsten and Klefsjö (2000), one of the components of TQM is the core values. These are the basis for the culture of the organization. Core values are, for example, to let everybody be committed and the focus on customers. Another one is methodologies, i.e., ways to work within the organization to establish the culture and reach the objectives and val-ues. Examples of methodologies are process management, Kaizen, brainstorming and the PDCA cycle. The last component is the tools. There are tools for structuring and analysing both verbal information and numerical data, some of the tools have a statistical basis. The tools that can be used are the seven quality tools and the seven management tools. The meth-odologies will not work efficiently without the use of specific and suitably chosen tools, see Klefsjö et al. (1999). It is important to note that TQM should be looked upon as a system. The values are supported by methodologies and tools to form a whole. Methodologies and tools should be used to sup-port the values, see Hellsten and Klefsjö (2000). According to Bergman and Klefsjö (2003) core values are vital elements in a successful qual-ity strategy, see figure 2.3.

14
Sätt kundernai centrum
Improvecontinuously
Let everybody becommitted
Focus onprocesses
Base decision On facts
Focus on customers
Top management commitment
Figure 2.3. Core values in TQM, which are important elements in a successful quality strat-egy. From Bergman and Klefsjö (2000. Core values Values in TQM support and guide the decision making of every employee, as well as help the organisation to accomplish its mission and attain its vision in an appropriate manner, see NIST (2003). According to Hellsten and Klefsjö (2000), core values are the foundation of TQM and should be clearly stated and expressed as the principles upon which the mission will be achieved. Regarding the importance of the values Lagrosen (2003) has stated in sum-mary, after conducting a survey covering 500 quality professionals, that there is a strong cor-relation between the adoption of the core values of TQM and successful quality management. In this thesis the definition from Hellsten and Klefsjö (2000) is used. The values are the ones that an organization decides upon. Values are best expressed in terms of behaviour, i.e., how people in an organization act professionally internally and externally. Values are guiding symbols that will help the participants to work toward the organization’s vision, picturing the desirable future (Deming, 1994 and Hellsten and Klefsjö, 2000). The core values are the basis of an organisation’s culture and the values can vary a little between different organisations and over time, see Hellsten and Klefsjö (2000). Focusing on customers is stressed by most authors of TQM literature to be the most important value of TQM, see Evans and Lindsay (1996). According to Bergman and Klefsjö (2003) quality has to be put in relation to the customer’s needs and expectations. Base decisions on fact means to make decisions, which are based on facts and not allow ran-dom factors to be of importance. There are tools for creating, structuring and analysing nu-merical information and verbal information, to supporting decisions on fact, see Bergman and Klefsjö (2003). Often the seven quality control tools and the seven management tools are used, see Shewhart (1980) and Ishikawa (1985). Focus on processes is to understand and divid organisation activities into processes, and then measure, control, and continuously improve these processes, in order to ensure that the proc-
15
esses provide maximum benefits to the company, see Harrington (1991). According to Bergman and Klefsjö (2003) and Dahlgaard et al. (1994) nearly all the activities in the com-pany can be looked upon as a process, the aim of which is to deliver products and services, which satisfy the customers. Improving processes continuously is necessary to increase customer satisfaction, enhance quality and productivity, and thus constantly decrease costs, according to Dahlgaard et al. (1994). All the activities can be improved if there is a systematic model and a methodology for the improvement, cf. Shiba et al. (1993). The model for improvement that is used in TQM is the Deming cycle, or PDSA cycle, also called the Shewhart cycle. The improvement cycle is composed of four phases Plan, Do, Study and Act, see Deming (1994). Shiba et al. (1993) argue that all personnel in the company should improve the way in which they perform their jobs and satisfy customers. Let everybody be committed is to facilitate the opportunities for all employees to be commit-ted and participate actively in the decision-making. All employees at all levels, everywhere in the organization, should be involved in the improvement work, see Dahlgaard et al. (1994) and Shiba et al. (1993). To be successful, it is vital to create conditions to enable the employees to participate in the work, in particular communicating, delegating and training, Bergman and Klefsjö (2003). Klefsjö et al. (2001) argue that involving everyone is very strongly emphasized in TQM. Top management commitment must be present from the start, with initiating participation and planning in the work, including evaluation of both processes and results, see Hellsten (1997). For success in business efficiency and effectiveness quality work must be started at the top management, see Oakland (1993) and Juran (1989). Ctiticism The failures of TQM implementation have been well documented, see for example Brown et al. (1994), Harari (1997), Cao et al. (2000), and Foley (2004). However, Shin et al. (1998) argue that the TQM framework and key principles should not be blamed for the failure of TQM. Rather, they state that it is the lack of understanding of what TQM means for each unique organisation and how to implement it successfully that has created scepticism about the effectiveness of TQM. According to Brown et al. (1994) TQM can fail due to a lack of management commitment, wasted education and training, a lack of short-term and bottom line results, divergent strate-gies and inappropriate measures. Harari (1997) claims that after studying independent re-search conducted by consulting firms, only about one-fifth, or at best one-third, of the TQM programmes in the United States and Europe have achieved significant improvements in qual-ity, productivity, competitiveness or financial results. He concludes that TQM programmes are ineffective and gives ten reasons why TQM does not work. According to Harari (1997) and Cao et al. (2000) reasons can be that only parts of TQM may have been addressed, rather than the whole management system of TQM, thus companies did not involve enough culture change. Sila and Ebrahimpour (2002) performed a literature analysis, published between 1989 and 2000, of 347 research articles about TQM. For a discussion concerning how TQM is re-lated to other management theories, including the observation that TQM is not unique, more-over it has incorporated many insights from other management theories, see Spencer (1994), Dean and Bowen (1994) and Boaden (1996). According to Reeves and Bednar (1994) there is

16
a lack of agreement concerning the definition of quality and it is impossible to define quality globally because different definitions are appropriate under different circumstances. There are different approaches to evaluating the possible benefits of TQM. One is to estimate the costs of poor quality, see for example, Juran (1989) and Sörqvist (1998). Another way is to show that customer satisfaction has a significant positive impact on market value as well as accounting returns, see for example, Eklöf et al. (1999). Brah et al. (2002) have done a survey of 185 companies. The findings were supported that TQM implementation correlates positive with quality performance. Both hard and soft indicators, and both management and employee perspectives, were measured and contribute to the successful implementation of TQM. The survey also shows that larger companies achieve better quality performance than smaller companies. Service and manufacturing companies do not affect the rigour of the quality man-agement implementation and the resulting level of quality performance. Shin et al. (1998) support the idea that TQM can be implemented in many different types of organisations, but the specific circumstances in each organisation must be considered. In summary, there is a lot of criticism against concepts from TQM, where just a fractional part has been mentioned here. It should be noted that many critical authors discuss the concepts with one label but with several definitions, which affects the theoretical discussions and prac-tical applications.
2.3 Lean The interest in Lean has steadily increased in the last decade, which can partly be attributed to the Toyota Production System (TPS). This system focuses among other things on reducing and eliminating waste, however Toyota is not a Lean company according to Ohno (1988). The origins of Lean can be traced back to Taylor in 1915 (Towill et al. 2000). Lean is about controlling the resources in accordance with what customers really want, and elimination and preven-tion of unnecessary waste. On the other side it is at least as important to rethink the value side in order to add value for the customer, see Bicheno (2004). There are many definitions of the Lean con-cept, it is generally understood to repre-sent a systematic approach to identifying and eliminating elements not adding value to the process, as well as striving for perfection and a customer-driven pull of the process. In this thesis the defini-tion from NIST is used: “A systematic approach to identifying and eliminating waste through continuous improvement, flowing the product at the pull of the customer in pursuit of perfection” (NIST, 2000).
Figure 2.4. The figure shows the Lean princi-ples, first of all there must be a stable ground. From Blucher and Öjmertz (2004).

17
Lean principles and methods are fundamentally customer value driven and continuously im-prove the process, in small steps, which makes them appropriate for many manufacturing and distribution situations. According to McCurry et al. (2001), Bicheno (2004) and Pascal (2002) five phases of Lean are generally acknowledged:
1. Understanding Customer Value: Only what the customers perceive as value is impor-tant. The customers could be the next process, the next company, the customer´s cus-tomer or the end customer. Today’s customers have a broader expectation, for exam-ples safety, environment and morale. Thus some Lean companies have added more dimensions in their definitions on quality.
2. Value Stream Analysis: Having understood the value for the customers, the next step
is to analyse the business processes to determine which ones actually add value. The value stream should be mapped and improved regularly. If an action does not add value, it should be modified or eliminated from the process. This map is a temporary or a snip snap picture of the process; it helps to grasp the current conditions.
3. Flow: Focus on organising a continuous flow through the production. If possible use
one-piece flow, rather than moving commodities in large batches and keep it moving. Avoid queues, or at least continuously reduced them and the obstacles in the way.
4. Pull: Pull means short-term response to the customer´s rate of demand, without over-
producing. No work is carried out unless the result of it is required downstream. De-mand chain management prevents from producing commodities to stock, i.e. customer demand pulls finished products through the system. A pull system has two levels. Level one is that most organisations will have to push the products to a certain point and after that respond to the final customer’s signal, the idea is to push this point fur-ther and further upstream. Level two is responding to a pull signal from an internal customer, within the value chain, for this often a Kanban system is used. Pull needs to take the whole demand flow network in consideration, not only within in the com-pany.
5. Perfection: The elimination of non-value-adding elements (waste) is a process of con-
tinuous improvement. According to McCurry et al. (2001), “There is no end to reduc-ing time, cost, space, mistakes, and effort”. Often a systematic approach is used to continuous improvement. The key here is to facilitate the opportunities for all employ-ees to be committed and participate. After having worked for a while through the pre-vious phases, suddenly perfection seems more possible to reach.
These five phases are not a sequential, one-off procedure, but rather a journey of continuous improvement, see Bicheno (2004). The main elements of the elimination of non-value-added activities are the following, see Blucher and Öjmertz (2004) and figure 2.5: Excess production, excess processing, delays, transport, inventory, defects and movement. Some companies also include untapped human potential, see Pascal (2002) and Blucher and Öjmertz (2005). Most of the wastes above are seen from the organisation’s perspective. Bicheno (2004) also listed seven wastes for ser-vices: delays of customers waiting for service, duplication, unnecessary movement, unclear communication, incorrect inventory, opportunity lost to retain or win customers and errors in the service transactions.

18
Figure 2.5. The figure shows the eight wastes, including unused employee creativity, adopted from Blucher and Öjmertz (2004). A variety of approaches are available for reducing or eliminating waste. These approaches include value stream analysis, total productive maintenance, Kaizen, 5S, cost analysis, change management, poka-yoke, seven management tools and so on. Tools used include Kanban cards for pull through the supply chain and the closely related Just-in-Time system (JIT) for inventory reduction. There are also many analytical tools for reducing work-in-process, in-creasing inventory turns, increasing capacity, cycle-time reducing and improving customer satisfaction. Advanced statistical tools are not so common used in Lean, see McCurry et al. (2001), Bicheno (2004) and Pascal (2002). Lean principles have become well established in logistics, providing elements like the following: integrated flow in small batches, just-in-time delivery, which leads to low inventory, a pull rather than a push function throughout the sup-ply chain thereby creating a ‘demand flow’, close integration from material supplier to cus-tomer through partnerships, simplified information flow and processing, rapid changeover of tools and procedures etc. Criticism Criticism about Lean has been well documented. Despite the several success stories associ-ated with the Lean concept, it has some shortcomings. Examples of shortcomings which can be found in the literature are for example that a Lean organisation may become very suscepti-ble to the impact of changes (Dove, 1999). The leanness in itself leads to reduced flexibility and less ability to react to new conditions and circumstances. Cusumano (1994) mentions that JIT deliveries cause congestion in the supply chain, leading to delays, pollution, shortage of workers etc. An uncritical application of Lean principles will increase risk, due to subcritical safety stock, quality failures etc. Lean principles do not always apply, however, when cus-tomer demand is unstable and unpredictable. There is also a discussion going on whether Lean, which was developed for manufacturing and distribution situations, is applicable in all industries, there must be a movement in the organisation. To summarise, Lean requires a stable platform and standardisation of the work, where scale efficiency can be maximised. Highly dynamic conditions can not be dealt with, as there is no
19
room for flexibility due to the focus on perfection, which is always a function of particular market conditions at a certain period of time, see Dove (1999) and Cusumano (1994). By simplifying the supply chain process overall performance will usually be enhanced, leading to more consistent quality, lower operation costs, and inherently greater responsiveness, see Hoole (2005).
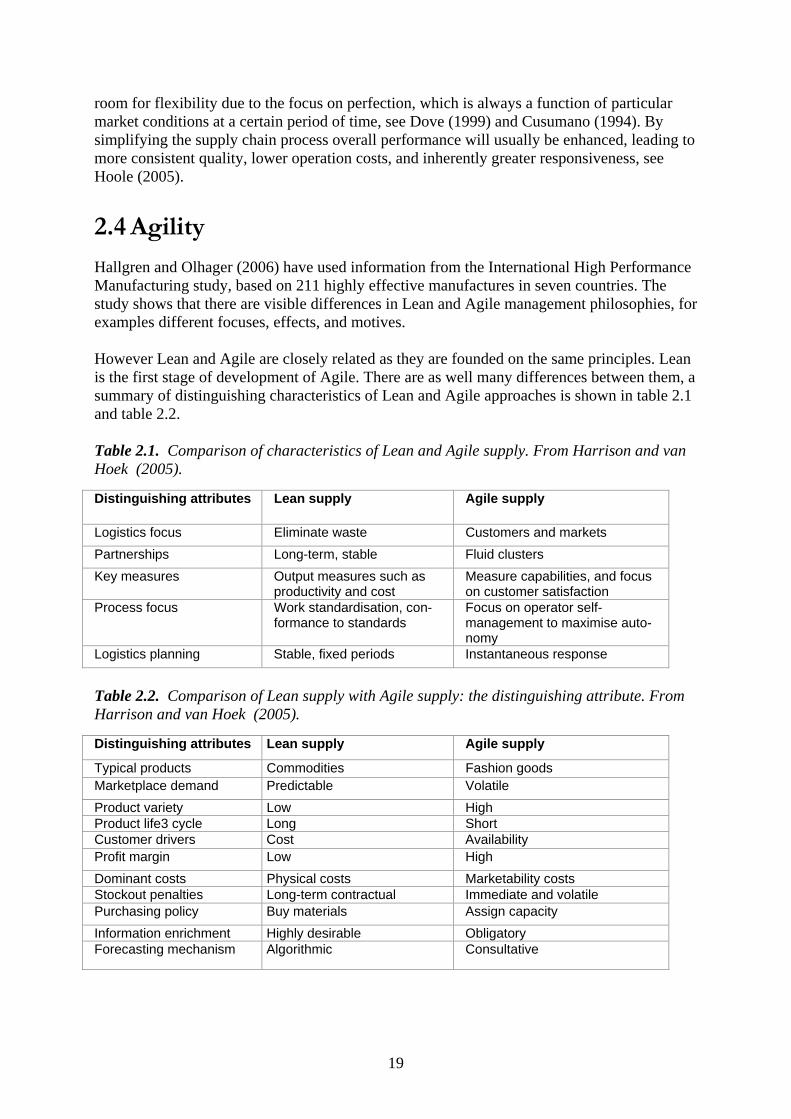
2.4 Agility Hallgren and Olhager (2006) have used information from the International High Performance Manufacturing study, based on 211 highly effective manufactures in seven countries. The study shows that there are visible differences in Lean and Agile management philosophies, for examples different focuses, effects, and motives. However Lean and Agile are closely related as they are founded on the same principles. Lean is the first stage of development of Agile. There are as well many differences between them, a summary of distinguishing characteristics of Lean and Agile approaches is shown in table 2.1 and table 2.2. Table 2.1. Comparison of characteristics of Lean and Agile supply. From Harrison and van Hoek (2005). Distinguishing attributes Lean supply Agile supply
Logistics focus Eliminate waste Customers and markets Partnerships Long-term, stable Fluid clusters Key measures Output measures such as
productivity and cost Measure capabilities, and focus on customer satisfaction
Process focus Work standardisation, con-formance to standards
Focus on operator self-management to maximise auto-nomy
Logistics planning Stable, fixed periods Instantaneous response
Table 2.2. Comparison of Lean supply with Agile supply: the distinguishing attribute. From Harrison and van Hoek (2005). Distinguishing attributes Lean supply Agile supply
Typical products Commodities Fashion goods Marketplace demand Predictable Volatile Product variety Low High Product life3 cycle Long Short Customer drivers Cost Availability Profit margin Low High Dominant costs Physical costs Marketability costs Stockout penalties Long-term contractual Immediate and volatile Purchasing policy Buy materials Assign capacity Information enrichment Highly desirable Obligatory Forecasting mechanism Algorithmic Consultative
20
Agility is focused on rapid changeovers in product mix and volume. The objective is to create responsiveness in the supply chain, so that it responds quickly to unpredictable demand. Cus-tomer demand is the starting point for all activities. The concept of agility includes all activi-ties in the demand chain; see Christopher and Towill (2001), Naylor et al., (1999) and De Treville (2004). Agility has become a vision for the development of logistics. The concept of agility is more frequently applied to manufacturing, but is also relevant to supply chains (Christopher and Towill, 2000). Agility has been defined as “the ability to thrive and prosper in an environment of constant and unpredictable change” (Maskell, 2001), as “all about customers responsive-ness and mastering turbulence” (van Hoek et al., 2005), and as “a business-wide capability that embraces organisational structures, information systems, logistics processes and, in par-ticular, mindsets” (Christopher and Towill, 2001). Supply chain agility can be defined as “the ability to respond rapidly to unpredictable changes in demand or supply”. Two key ingredi-ents of agility are visibility and velocity (Christopher and Peck, 2004). Visibility is the ability to see from one end of the supply chain to the other, have a clear view of upstream and downstream inventories from the focal company and of the demand and sup-ply conditions, and to have clear agreements and lines of communication. This would require the creation of a multi-disciplinary, cross-functional process team. Velocity refers to the time it takes to move product and materials from one end of the supply chain to the other. The measure is how rapidly the supply chain can react to changes in demand. The challenge here according to Christopher and Towill (2000) are the following:
• Streamline processes (processes should be modified, reduced or adapted to circum-stances, such as customer needs, legislation, demand, assets etc.)
• Reduce in-bound lead time • Reduce non-value added time
Crucial elements according to Sheridan (1996) are the following: receptivity to changes in the business environment, rapid formation of alliances, high customization of products and ser-vices. A rapid formation of alliances may be effectuated by the so-called virtual supply chain, in which inventory is replaced by information, at least partly.
2.5 Six Sigma Motorola was the first company to launch a Six Sigma programme in the mid 1980s (Rancour and McCracken, 2000). Today, a number of global organisations have developed Six Sigma programmes of their own and Six Sigma is now established in almost every industry. Six Sigma is defined “as a business process that allows companies to drastically improve their bottom line by designing and monitoring everyday business activities in ways that minimise waste and resources while increasing customer satisfaction” by some of its proponents, see Magnusson et al. (2003). The company Ericsson AB defines Six Sigma as “A strategic initia-tive to reduce costs of poor quality and customer dissatisfaction using a systematic problem solving methodology emphasising variation reduction“. Important features of Six Sigma at Ericsson AB are focus on cost reduction, results variation reduction, customer satisfaction (or rather reduced customer dissatisfaction), systematic training in problem Solving, common problem solving language, improvement agents (Black Belts, Green Belts, etc), strategic edge/top management involvement, project by project, see figure 2.6. The measurement sys-tem in Six Sigma is used for identifying new improvement projects and for having an overall

21
view on the organisation, over time. Often a measure of defects per million opportunities (dpmo) for critical-to-quality (CTQ) performance of a company’s key products and processes are measured. CTQs are often critical to process, customer and compliance, see Magnusson et al. (2003).
The Six Sigma Framework
Project by Project
RESULTS
Top Management Commitment
Stakeholder Involvement
Training Scheme
Measurement System
MEASURE ANALYSE IMPROVEDEFINE CONTROL
Figure 2.6. The framework of Six Sigma, with the four main elements and DMAIC´s im-provement phase (Magnusson et al, 2003). According to Eckes (2001) successful organisations use a model for improvement, rather than working “ad-hoc”. Six Sigma could also be described as an improvement programme for re-ducing variation, which focuses on continuous and breakthrough improvements. Improvement projects are driven in a wide range of areas and at different levels of complexity, in order to reduce variation. According to Bergman and Klefsjö (2003) the objectives of Six Sigma is to reduce unwanted variability that results in cost reductions and increased customers satisfac-tion. The reduced variability may also lead to improved delivery precisions and increased yield. Henderson and Evans (2000) and Eckes (2001) claim that the major components of a successful Six Sigma implementation are management involvement, organisation, infrastruc-ture, training and statistical tools. Panda (2000) means that the organisation also must clarify the different roles required and their different areas of responsibility in order to be successful with a Six Sigma programme. According to Magnusson et al. (2003) and Sanders and Hild (2000) the hierarchy of responsibilities and the roles are: Champions and Sponsors, Master Black Belts, Black Belt, Green Belt and White Belt. Six Sigma organisations have standard-ised training courses, ranging from comprehensive courses for Black Belts to basic courses for White Belts, see figure 2.7.

22
Operators, front-line staffTeam members
Middle managementProject manager and team members
Full time improvement expertProject manager
Position:Responsibilities:
Show results under training!
White Belt
Green Belt
Black Belt
Roles:
Master Black Belt
Champion
Full-time breakthrough expertTrainer and coach
Member of senior management teamDriver and advocate
Six Sigma Education System
Figure 2.7. The Six Sigma hierarchy of roles, responsibilities and from what position in the organisation the employees are typically selected for different roles. From Magnusson et al, (2003). There are two major improvement methodologies in Six Sigma, one for already existing proc-esses and one for new processes. The first methodology used to improve an existing process can be divided into five phases, see Pyzdek (2003) and Bajaria, (2001). According to the companies Ericsson AB and SKF, and authors Magnusson et al. (2003) these five phases con-tains the following:
1. Define: Define which process or product that needs improvement. Define the most suitable team members to work with the improvement. Define the customers of the process, their needs and requirements, and create a map of the process that should be improved and select SMART goals. Set up a communication strategy. Design a time and resource plan, and a risk analysis for the project. Finally construct a project chart.
2. Measure: Identify the key factors and the root causes that have the most influence on
the process, and decide upon how to measure them. Process performance is identified and measured using data quality checks, repeatability and reproducibility (R&R) stud-ies, and addressing process stability. The results are displayed on appropriate charts or graphs. Identify suitable benchmarking partners.
3. Analyse: Analyse the root causes and the factors that need to be improved. Find areas
that need to be addressed. Often statistical analyses chart and diagram are used in this phase.
4. Improve: Design and implement the most effective solution. Perform a cost/savings
and risk analysis of solutions and construct a plan for resource allocation and imple-mentation. Make the process robust.
5. Control: Establish whether solution was successful and permanent. Validate the result
against the goal statement and investigate whether the solution is robust. Conduct a risk analysis in order to permanent the solution over time. Transfer responsibility, share learning and best practice.

23
The second methodology is often used when the existing processes do not satisfy the custom-ers or are not able to achieve strategic business objectives, see Eckes (2001). There are many different DFSS (Design For Six Sigma) roadmaps, the most frequently used is DMADV. This methodology can also be divided into five phases; Define, Measure, Analyze, Design, Verify, DFSS can also be used to design new products. In summary, the two different methodologies have obvious similarities according to Magnusson et al. (2003) there are usually many differ-ent improvement tools used in a Six Sigma programme. Magnusson et al. (2003) document that the Six Sigma toolbox contains the seven design tools, the seven statistical tools, the seven project tools, the seven Lean tools, the seven customer tools, the seven quality control tools and the seven management tools, see figure 2.8. The tools are often easy to use in both ongoing and breakthrough improvement projects, but there are also some more advanced sta-tistical tools in the toolbox than in other programmes.
Six Sigma toolbox
7 x 7 Tool boxes
7 Management Tools
7 QC Tools
7 Customer Tools
7 Lean Tools
7 Project Tools
7 Statistical Tools
7 Design Tools
Affinity Diagram Tree DiagramProblem DecisionDiagramRelations DiagramMatrix DiagramData Matrix DiagramArrow Diagram
Figure 2.8 Six Sigma has several tools which can be utilised in different areas in order to for example base decisions on facts. From Magnusson et al, (2003). According to Klefsjö et al. (2001) Six Sigma is a highly disciplined, data-oriented, top-down approach. The new feature is the explicit linking of the tactical and the strategic, for example, statistical techniques are used in a systematic way to reduce variation and improve processes, and there is a stronger focus on results. Criticism There has not been published much criticism against Six Sigma, for example Klefsjö et al. (2001) and Truscott (2003) claim that Six Sigma has the same common features as other im-provement programs and does not, in principle, contain anything new. Six Sigma is a method utilizing existing tools and techniques from other fields, thus there is very little difference between Six Sigma and Juran’s eight steps, Deming’s PDCA cycle and Crosby’s 14-step quality improvement process. Klefsjö et al. (2001) see Six Sigma rather as a methodology within the larger framework of TQM. Cooper and Noonan (2003) states Six Sigma does not identify the employees involved, it is impossible to implement a Six Sigma project without consideration of the human factor. According to Klefsjö et al. (2001) Six Sigma programmes

24
fail to create conditions in order to involve everyone. According to Magnusson et al. (2003) there is a difficulty in Six Sigma programmes to exceed the customer’s needs. To avoid this problem some companies use Voice of the Customer (VOC) tools in their define phase. Furthermore, in Six Sigma training programmes one can only start a project which gives a certain amount of savings. This project is often executed in the department of the project members. The project normally leads to an improvement in that department, but due to the performed change another department can experience deterioration. As a result, Six Sigma is sometimes accused for not having a system view. On the other hand, it can be argued that Six Sigma can be applied in a wide range of areas, including both manufacturing and service in-dustries, see Magnusson et al. (2003).
2.6 Supply/Demand Chain Management There are a variety of definitions of supply chain management, see for examples, Christopher (1998), Lummus and Vokurka (1999), Hover et al. (2001) and Harrison and van Hoek (2005). Two of the definition are mentions in this thesis, the first one from Tan et al. (1998), which is a comprehensive definition, as supply chain is, “Supply chain management encompasses ma-terials/supply management from the supply of basic raw materials to final product (and possi-ble recycling and re-use). Supply chain management focuses on how firms utilize their sup-pliers' processes, technology and capability to enhance competitive advantage. It is a man-agement philosophy that extends traditional intra-enterprise activities by bringing trading partners together with the common goal of optimization and efficiency” and Harrison and van
Information flow
PurchasingProduction
Logistics Marketing
R & DFinance
PurchasingProduction
Logistics Marketing
R & DFinance
CUSTOMER RELATIONSHIP MANAGEMENT
CUSTOMER SERVICE MANAGEMENT
DEMAND MANAGEMENT
ORDER FULFILLMENT
MANUFACTURING FLOW MANAGEMENT
SUPPLIER RELATIONSHIP MANAGEMENT
PRODUCT DEVELOPMENT AND COMMERCIALIZATION
RETURNS MANAGEMENT
Tier 2Supplier
Tier 1Supplier
Customer Consumer/End-user
Supply Chain Management:
Integrating and Managing Processes Across the Supply Chain
Product flow
Manufacturer
Figure 2.9. Integrating and managing processes across the supply chain. From Cooper et al. (1997).
25
Hoek (2005) who have a short definition “The alignment of upstream and downstream capa-bilities of supply chain partners to deliver superior value to the end customer at less cost to the supply chain as a whole”. According to Cooper et al. (1997), supply chain management is about integrating and managing processes across the supply chain, see figure 2.9. One reason why supply chain management has several definitions is that the concept has de-veloped over time; another explanation is the transition from supplier-driven mass production to market-driven mass customization. Some authors argue that supply chain management should be termed demand chain manage-ment, as the chain should be driven by the market, not by suppliers, see Christopher (1998) and De Treville et al. (2004). According to Ericsson (2003) the concept is new, but it can be traced back to the 1960s and in fact it is an extension of logistics management. The supply chain can be separated into three distinct flows, materials, information and mone-tary flow. The concept encompasses all the activities associated with these flows. It involves integration across organizations, throughout the entire supply chain. Internal integration as well as external integration is vital, this is about coordination and collaboration between de-partments within an organization as well as between organizations in the supply chain. Chris-topher (1998) suggested that the term supply chain should be replaced by supply network since there are multiple suppliers and customers included in the total system. In a supply chain three key business processes can be identified, time to market (TTM), time to cash (TTC) and customer creation and retention (CCR). TTM is the process for develop-ment and improvement of the products and services, TTC is the total materials, information and financial flow and CCR is the process for creation and retention of customers all the way from the first contact, via after-sales, follow-up and continuous improvement, see figure 2.10. Supply chain management is an integrative philosophy to integrate and manage these key business processes across the supply chain. It is about for example planning, developing, co-ordinating, organising, integrating, and controlling within the supply chain, see Ericsson (2001). Today the question is how to reduce cost while increasing customer value, this can be done by lower transaction cost, reduced transportations, minimizing storage and inventory, focused manufacturing and economies of scale though partnering. The next step for the com-panies is to involve the entire supply chain and take the value chain into consideration, in or-der to reduce cost by increasing customer value (Ericsson, 2003). Demand driven supply chains that highlight customer demand as the starting point for all activities, replace forecast-ing with early, real-time information directly from the demand. Demand chain management is the next major frontier for effective competition. Companies in the value chain must recog-nize the need for approaching a demand chain strategy and develop a portfolio of customers and suppliers, see Ericsson, (2003) and Ericsson, (1996).
According to Antonovsky (1987), organisations need to be flexible and resilient because of the supply chain being unpredictable. There are four principles that characterize supply chain resilience (Christopher and Peck, 2004):
• Risk management culture • Agility • Design and innovation-led (Re-engineering from cost optimizing and bringing design
into the core of the supply chain) • Collaboration
In this context definition of resilience is described as “the ability of the system to return to its original state or move to a new, more desirable state after being disturbed”.
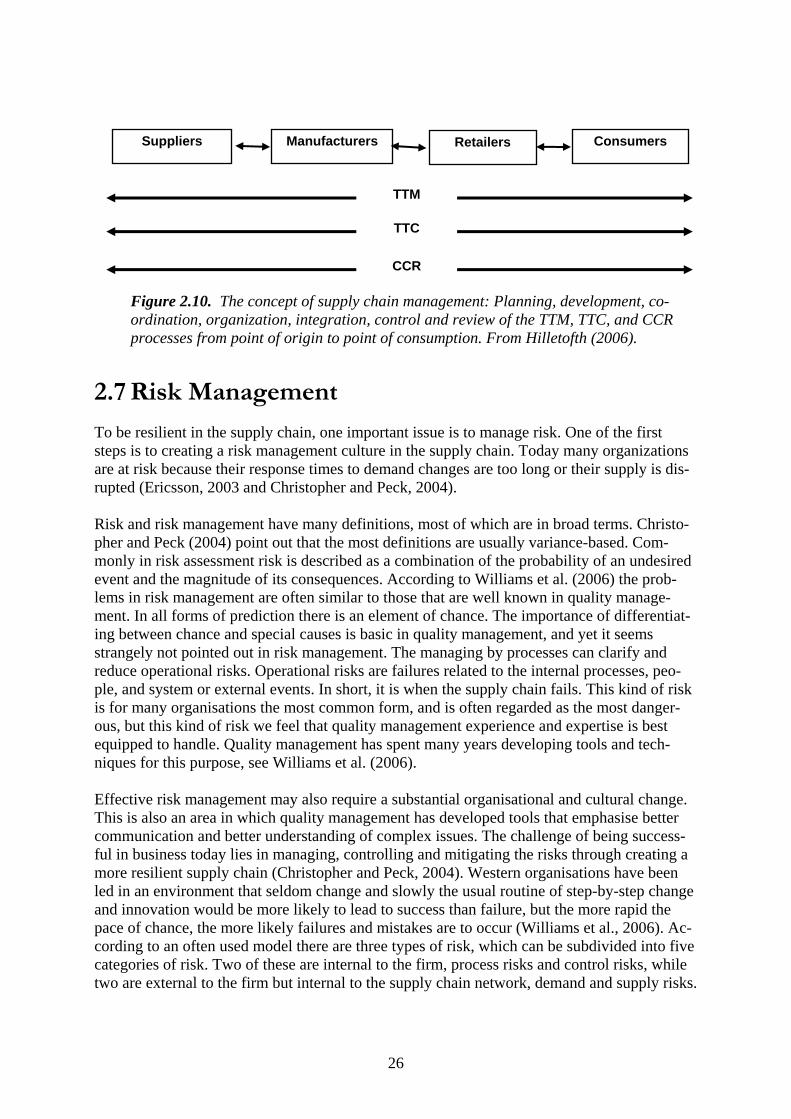
26
2.7 Risk Management To be resilient in the supply chain, one important issue is to manage risk. One of the first steps is to creating a risk management culture in the supply chain. Today many organizations are at risk because their response times to demand changes are too long or their supply is dis-rupted (Ericsson, 2003 and Christopher and Peck, 2004). Risk and risk management have many definitions, most of which are in broad terms. Christo-pher and Peck (2004) point out that the most definitions are usually variance-based. Com-monly in risk assessment risk is described as a combination of the probability of an undesired event and the magnitude of its consequences. According to Williams et al. (2006) the prob-lems in risk management are often similar to those that are well known in quality manage-ment. In all forms of prediction there is an element of chance. The importance of differentiat-ing between chance and special causes is basic in quality management, and yet it seems strangely not pointed out in risk management. The managing by processes can clarify and reduce operational risks. Operational risks are failures related to the internal processes, peo-ple, and system or external events. In short, it is when the supply chain fails. This kind of risk is for many organisations the most common form, and is often regarded as the most danger-ous, but this kind of risk we feel that quality management experience and expertise is best equipped to handle. Quality management has spent many years developing tools and tech-niques for this purpose, see Williams et al. (2006). Effective risk management may also require a substantial organisational and cultural change. This is also an area in which quality management has developed tools that emphasise better communication and better understanding of complex issues. The challenge of being success-ful in business today lies in managing, controlling and mitigating the risks through creating a more resilient supply chain (Christopher and Peck, 2004). Western organisations have been led in an environment that seldom change and slowly the usual routine of step-by-step change and innovation would be more likely to lead to success than failure, but the more rapid the pace of chance, the more likely failures and mistakes are to occur (Williams et al., 2006). Ac-cording to an often used model there are three types of risk, which can be subdivided into five categories of risk. Two of these are internal to the firm, process risks and control risks, while two are external to the firm but internal to the supply chain network, demand and supply risks.
Figure 2.10. The concept of supply chain management: Planning, development, co-ordination, organization, integration, control and review of the TTM, TTC, and CCR processes from point of origin to point of consumption. From Hilletofth (2006).
TTC
TTM
CCR
Consumers Retailers ManufacturersSuppliers

27
The last one, environmental risk, is external to the network, see figure 2.11 and Mason-Jones and Towill (1998).
Figure 2.11. Supply chain risk sources and risk categories. From Hilletofth (2006). The importance of differentiating between chance and special causes is basic in quality man-agement, and yet it seems, strangely enough, not being pointed out much in risk management. Experience indicates that assignable causes of variation can usually be found by statistical tools without undue difficulty, leading to a process with less variation. The causes of variation in new circumstances lie more in people than in processes, or at least as much. Therefore dif-ferent kinds of tools are needed, and quality management provides those (Williams et al., 2006).
Environmental risks
Customers Focal company Suppliers
Supply risks Demand risks Process risks
Control risks

28
3 Methodology In this chapter the chosen methodology is presented. The chapter includes a description and discussion of aspects related to the research approach and strategy, and the validity and reli-ability of the thesis are discussed.
3.1 Research Approach The researcher is influenced by how he looks at the world and acts in it. All research is con-ducted on the basis of a determined pre-understanding of paradigms and theoretical concep-tions, whether it is conscious or unconscious, concerning what is important, interesting and relevant, according to Bjereld et al. (1999). Certainly, the pre-understanding of the author of this thesis influenced the studies conducted. The author of this thesis has been working at a university with teaching and promoting Six Sigma during the completion of his licentiate study. This may also have affected the way in which the author has conducted the studies. On the other hand, the author has taught both TQM and Lean before starting the licentiate study and also worked in a TQM company. For example, it is possible that someone from the “out-side” would have had another view of TQM, Lean, Agile or Six Sigma, than the author of this thesis. However, it has been the author’s intention to describe objectively the phenomenon concerned.
3.1.1 Description, Explanation and Exploration There are three major purposes of research description, explanation and exploration. Descrip-tive Research might be the main purpose when investigating a new interesting phenomenon. According to Dane (1990), it involves examining a phenomenon to define it more fully or to differentiate it from other phenomena. When the purpose is explanatory, it seeks to explain the pattern related to the phenomenon and to identify likely relationships with other phenom-ena, see Yin (1994).
3.1.2 Induction and Deduction When conducting research, one normally distinguishes between induction, deduction and ab-duction. The most common explanation models are induction and deduction. Induction means generalization from conclusions derived from a specific case. In deduction, on the other hand, the researcher starts from a general rule and explains a specific case, see Alvesson and Sköld-berg (1994). Abduction is a combination of induction and deduction. During the research the empirical application is developed and the theory is adjusted. According to Alvesson and Sköldberg (1994), abduction is the most common methodology for case studies. Often a sin-gle case is interpreted with a kind of overarching hypothetical pattern. The interpretation is corroborated with new observations. In this way abduction is a combination of induction and deduction. During the process the empirical application is developed, and the theory is ad-justed. The analysis of the empirical work can very well be combined with literature studies of earlier theories in order to achieve a deeper understanding. Wiedersheim-Paul and Eriksson (1992) explain induction as follows: “from separate phenom-ena in reality we derive general statements”. On the other hand, they state that, when we per-
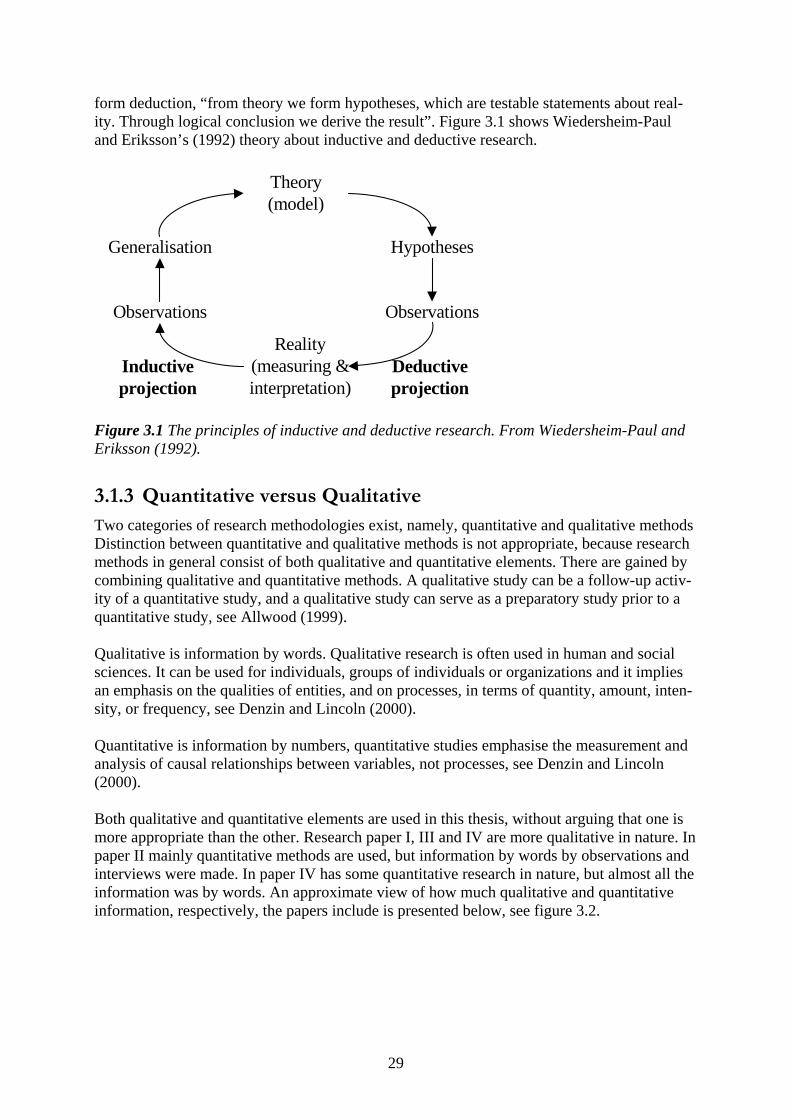
29
form deduction, “from theory we form hypotheses, which are testable statements about real-ity. Through logical conclusion we derive the result”. Figure 3.1 shows Wiedersheim-Paul and Eriksson’s (1992) theory about inductive and deductive research.
Theory(model)
Hypotheses
Observations
Generalisation
Reality(measuring &interpretation)
Observations
Deductiveprojection
Inductiveprojection
Figure 3.1 The principles of inductive and deductive research. From Wiedersheim-Paul and Eriksson (1992).
3.1.3 Quantitative versus Qualitative Two categories of research methodologies exist, namely, quantitative and qualitative methods Distinction between quantitative and qualitative methods is not appropriate, because research methods in general consist of both qualitative and quantitative elements. There are gained by combining qualitative and quantitative methods. A qualitative study can be a follow-up activ-ity of a quantitative study, and a qualitative study can serve as a preparatory study prior to a quantitative study, see Allwood (1999). Qualitative is information by words. Qualitative research is often used in human and social sciences. It can be used for individuals, groups of individuals or organizations and it implies an emphasis on the qualities of entities, and on processes, in terms of quantity, amount, inten-sity, or frequency, see Denzin and Lincoln (2000). Quantitative is information by numbers, quantitative studies emphasise the measurement and analysis of causal relationships between variables, not processes, see Denzin and Lincoln (2000). Both qualitative and quantitative elements are used in this thesis, without arguing that one is more appropriate than the other. Research paper I, III and IV are more qualitative in nature. In paper II mainly quantitative methods are used, but information by words by observations and interviews were made. In paper IV has some quantitative research in nature, but almost all the information was by words. An approximate view of how much qualitative and quantitative information, respectively, the papers include is presented below, see figure 3.2.

30
Figure 3.2. The studies are quantitative and qualitative in nature, respectively. The figure shows an approximate diagram of the distribution of quantitative versus qualitative studies for the appended papers.
3.2 Research Strategy The choice of a research strategy depends on which research question is being posed, as well as on whether one is striving for control of the events or focusing on temporary events, see Yin (1994) and Holme and Solvang (1991). Case studies represent an appropriate research strategy for the purpose of this thesis. Case studies are most appropriate when one wishes to answer questions, according to Table 3.1. Research question 4 attempts to answer “How can quality concepts contribute to risk control and resilience in an organisation?”, while research questions 1 and 2 in the thesis are “what” questions. Table 3.1. Relevant research strategies for different situations. From Yin (1994).
Strategy Form of research question
Requires control over behavioural events?
Focuses on con-temporary events?
Experiment how, why yes yes Survey who, what, where,
how many, how much
no yes
Archival analysis who, what, where, how many, how much
no yes/no
History how, why no no Case study how, why no yes
Qualitative Quantitative
Paper I
Paper II
Paper III
Paper IV

31
The author of the thesis chose to perform a literature study and interviews in order to illumi-nate research question 1. A case study was selected as the most appropriate strategy in order to treat research question 3 and 4. Table 3.2 shows the number and type of the research ques-tions and the strategies chosen to illuminate each research question. Table 3.2. The strategies used to illuminate the research questions.
Study 1 Study 2 Study 3 Study 4
Type of research question What What How How
Strategy Literature study Case study Case study Case study
3.3 Research Process In Figure 3.3 the research process is presented. The studies that are presented in this thesis were initiated in February 2004 with the study of different quality management philosophies. Study 2 and study 3 ran in parallel, starting in February 2005. Study 4 was started in January 2006. All the studies were finished in June 2006.
January2004 2005 2006 2007
Study 1 Study 4Study 2
Study 3
Completion of Licentiate thesis
Figure 3.3. The figure shows the research process.
3.3.1 Data Collecting Methods A qualitative case study differs from a quantitative one. Decisions must be made about what kind of information is needed to enlighten the problem, and how to get the information and data. There are two types of data. Primary data is gathered by the researcher, while secondary data already exists. Books, PhD theses and scientific papers are examples of secondary data, Most of the data from study 1 and 2 already exist. It is common to start by studying data that already exists, such as literature studies, see Lofland and Lofland (1995). Both primary data and secondary data have been used in the thesis.

32
There are different ways of collecting data, for examples, interviews, questionnaires, literature study and observations. Interviews and literature study were made in all the four papers. Ob-servations were made in studies 2 and 4. Interviews are one of the most important sources of information in a case study. One type of interview is “face-to-face”, which means that the interviewer talks to a respon-dent in person. A similar interview is for instance a telephone interview. A group interview is when the researcher interviews one group of respondents at a time. In order to find relevant information and it is vital to prepare interviews and to choose the right respondents, in order to find the right final result. It is appropriate to let the respondents read the transcribed text afterwards, in order to avoid misunderstandings, see Creswell (1994). Interviews were used as data collection method in all studies. In all the studies interviews were performed. In studies 1 and 4 also group interviews were performed, but in study 3 only telephone interviews were performed. There are two types of observations; direct (where participants only observe) and participant (where the researcher is not only a passive observer). Observations are based on visits to the “field” of the case study, see Yin (1994). Both types of observations were made in studies 2 and 4. Literature studies include several categories of literature documentation, papers, audio-visual materials and books, see Creswell (1994). Questionnaires are a quantitative method for data collection. There is a risk of a serious loss of responses, which may influence the reliability of the study. The questionnaire cannot be too extensive or complicated, especially as the respondent has no one to ask if a question is diffi-cult to understand. Questionnaires have not been used in research reported in the thesis, be-cause it is easy to misunderstand questions about different management theories.
3.3.2 Analysis There are several different methods for analysing data in quantitative and qualitative studies. According to Lofland and Lofland (1995), there is no “right way”. Discuss instructions for performing case studies, it start with gathering data, focusing and analysing. In this thesis a qualitative research strategy and case studies are chosen and the empirical material consists mainly of information from literature studies and interviews. According to Yin (1994), there are four major techniques for analyses: Pattern-matching, ex-planation building, time-series analysis and programme-logic models. In the thesis the mate-rial has been analysed through theories, methodologies and tools from the discipline of Qual-ity Management and Logistics.
3.3.3 Validity and reliability According to Wiedersheim-Paul and Eriksson (1991) validity means an instrument’s ability to measure what is meant to be measured. Reliability involves the accuracy of the chosen re-search methods and techniques. Reliability of an investigation is satisfactory if another re-searcher can conduct the same research and draw the same conclusions or if the data collec-tion procedures can be repeated with the same result. Researchers should provide the same result at different times if the conditions are identical. In order to mitigate of random errors the number of respondents or questions could be increased, see Yin (1994). The data collec-tion in this thesis has been well documented, different data collect methods have been used
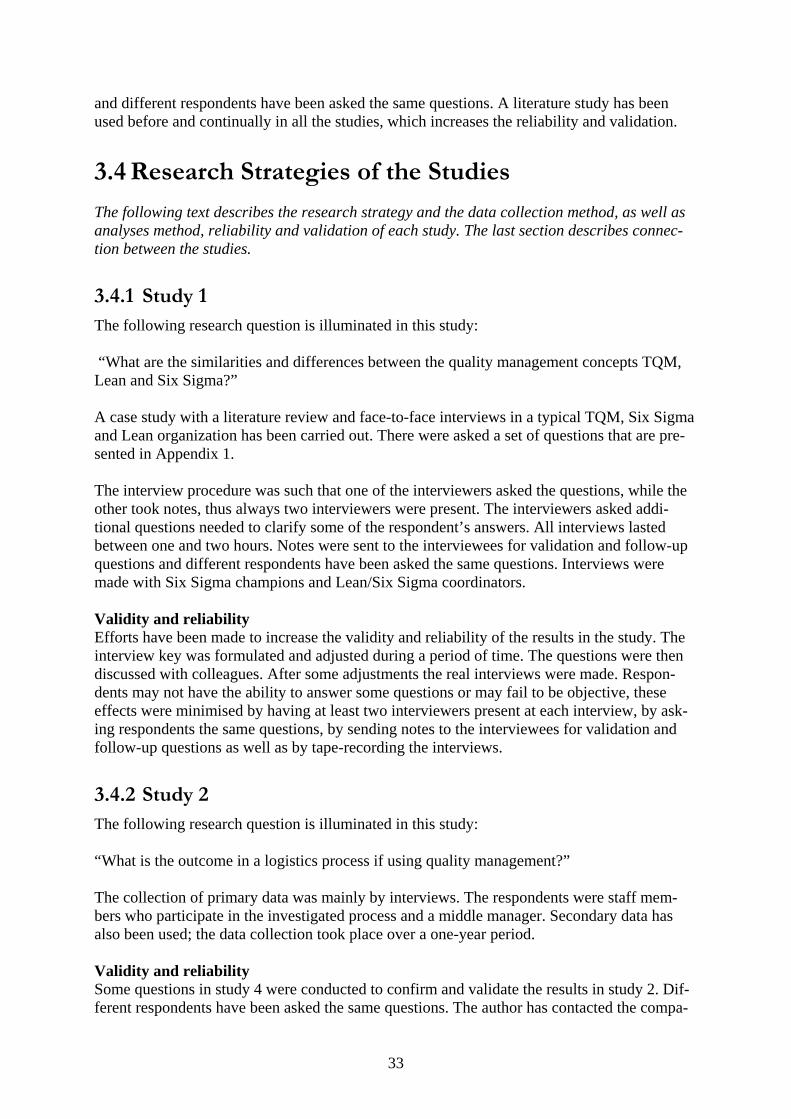
33
and different respondents have been asked the same questions. A literature study has been used before and continually in all the studies, which increases the reliability and validation.
3.4 Research Strategies of the Studies The following text describes the research strategy and the data collection method, as well as analyses method, reliability and validation of each study. The last section describes connec-tion between the studies.
3.4.1 Study 1 The following research question is illuminated in this study: “What are the similarities and differences between the quality management concepts TQM, Lean and Six Sigma?” A case study with a literature review and face-to-face interviews in a typical TQM, Six Sigma and Lean organization has been carried out. There were asked a set of questions that are pre-sented in Appendix 1. The interview procedure was such that one of the interviewers asked the questions, while the other took notes, thus always two interviewers were present. The interviewers asked addi-tional questions needed to clarify some of the respondent’s answers. All interviews lasted between one and two hours. Notes were sent to the interviewees for validation and follow-up questions and different respondents have been asked the same questions. Interviews were made with Six Sigma champions and Lean/Six Sigma coordinators. Validity and reliability Efforts have been made to increase the validity and reliability of the results in the study. The interview key was formulated and adjusted during a period of time. The questions were then discussed with colleagues. After some adjustments the real interviews were made. Respon-dents may not have the ability to answer some questions or may fail to be objective, these effects were minimised by having at least two interviewers present at each interview, by ask-ing respondents the same questions, by sending notes to the interviewees for validation and follow-up questions as well as by tape-recording the interviews.
3.4.2 Study 2 The following research question is illuminated in this study: “What is the outcome in a logistics process if using quality management?” The collection of primary data was mainly by interviews. The respondents were staff mem-bers who participate in the investigated process and a middle manager. Secondary data has also been used; the data collection took place over a one-year period. Validity and reliability Some questions in study 4 were conducted to confirm and validate the results in study 2. Dif-ferent respondents have been asked the same questions. The author has contacted the compa-

34
nies, asking if the result has changed, however, it was stated that the results are even better today (20 December 2006).
3.4.3 Study 3 The following research question is illuminated in this study: “How prepared are the transport- and logistics-oriented companies for the application of quality concepts and quality management philosophy?” A qualitative study was designed to correspond with the qualitative assumptions, because the research questions and the studied object are in the domain of social phenomena. A case-study strategy was chosen. 24 telephone interviews were performed. The time for each interview was from 40 minutes up to 90 minutes. Selection of companies was made from the organisation PLAN, located in Sweden, and from the search engine: http://gulasidorna.eniro.se. Search words were “Trans-portion” and “Logistics”. The participating companies are listed in appendix 2. The rate of response to the interviews was 92%. Most of the respondents are quality managers and logis-tics managers. Twelve representatives were from small companies and twelve from larger companies. Here small companies mean 50-100 employees and large companies above 100 employees. There were asked a set of questions, see appendix 2. The general analytic approach was decided before data collection. A single-case study was used. Primary data has been gathered by the researcher in this study and telephone interviews have been performed. This data collection method has been used, because the respondents could not be directly observed by the researchers. It also allowed better control of the ques-tioning. The telephone interviews were semi-structured and the questions were sent to the respondents before the interview. The interviews were not recorded, but notes were written down during the interviews. The material has been analyzed through theories, methodologies and tools from the disci-plines of TQM, Lean, and Six Sigma. The empirical material consists mainly of texts from the interviews. Validity and reliability Efforts have been made to increase the validity and reliability of the results in the thesis. The interview key was formulated and adjusted during a period of time. The questions were then discussed with colleagues. After some adjustments the real interviews were made. All the interviews were performed over a short period of two weeks.
3.4.4 Study 4 The following research question is illuminated in this study: “How can quality concepts contribute to risk control and resilience in an organisation?” The selection of companies was made with the following criteria: the companies must have used Six Sigma for at least two years, have run more than ten Six Sigma projects, and have

35
applied Lean and TQM philosophies. All the companies (except Dell) were selected from a Six Sigma association. The participating companies are listed in appendix 3. Seven large companies have been investigated, large here meaning over 500 employees. All companies were using a typical Six Sigma approach, and six of them had before a typical Lean approach. Today all of the companies combine Lean and Six Sigma. The findings are supported empirically by on-site interviews and by observations in the companies. On-site interviews and observations were chosen to identify also whether the companies have the same definition as the academy of TQM, Lean, Agile and Six Sigma. All the companies ac-cepted to participate in the study; the rate of response to the interview was 100%. There were asked a set of questions, which are presented in Appendix 3. The interviews and the observa-tions took four hours in two of the companies and eight hours in five of the companies. Dif-ferent respondents have been asked the same questions, notes were written down and the in-terviews were tape-recorded. In four of the companies the interviews started with a group in-terview. Interviews were performed with industrial engineers, middle managers, operators, Six Sigma Champions and Black-Belts and Lean coordinators. The material has been analyzed through theories, methodologies and tools from the disci-plines of TQM, Lean, Agility, Six Sigma, Supply/Demand Chain Management and Risk Management. Validity and reliability Efforts have been made to increase the validity and reliability of the results in the study. The interview key was formulated and adjusted during a period of time. The questions were dis-cussed with colleagues and persons from companies. The questions were first tested on one respondent and then adjusted. Three pre-interviews were made in companies that only use Lean and TQM philosophy. After some adjustments the real interviews were made. All the interviews were recorded and written down. The respondents were contacted by phone and agreements on interviews and on-site observations were made. In five of the companies more than three persons were interviewed. The interviews were written down and sent to the re-spondents and afterwards the companies had the opportunity to confirm or adjust the answers. The attempt was also to select different respondents, who support TQM, Lean and Six Sigma in the same company.
3.4.5 Connection between the Studies. The first study is about similarities and differences between the quality management concepts TQM, Lean and Six Sigma. This resulted in two other questions: First, about the outcome in a logistics process if using quality management, as addressed in study 2. Second, because the whole supply chain must be viewed as one system, how prepared the transport- and logistics-oriented companies are for the application of quality concepts and quality management phi-losophy, as addressed in study 3. Today important issues are to manage risk and be resilient, as many organizations in a supply chain are at risk. Arguments in study 2 for using quality management concepts, in order to manage risk and become agile, led forward to study 4, which treats how quality concepts can contribute to risk control and resilience in an organisation. Also findings in study 1 were an incitement for study 4.
36
Figure 3.4. The connection between the studies.
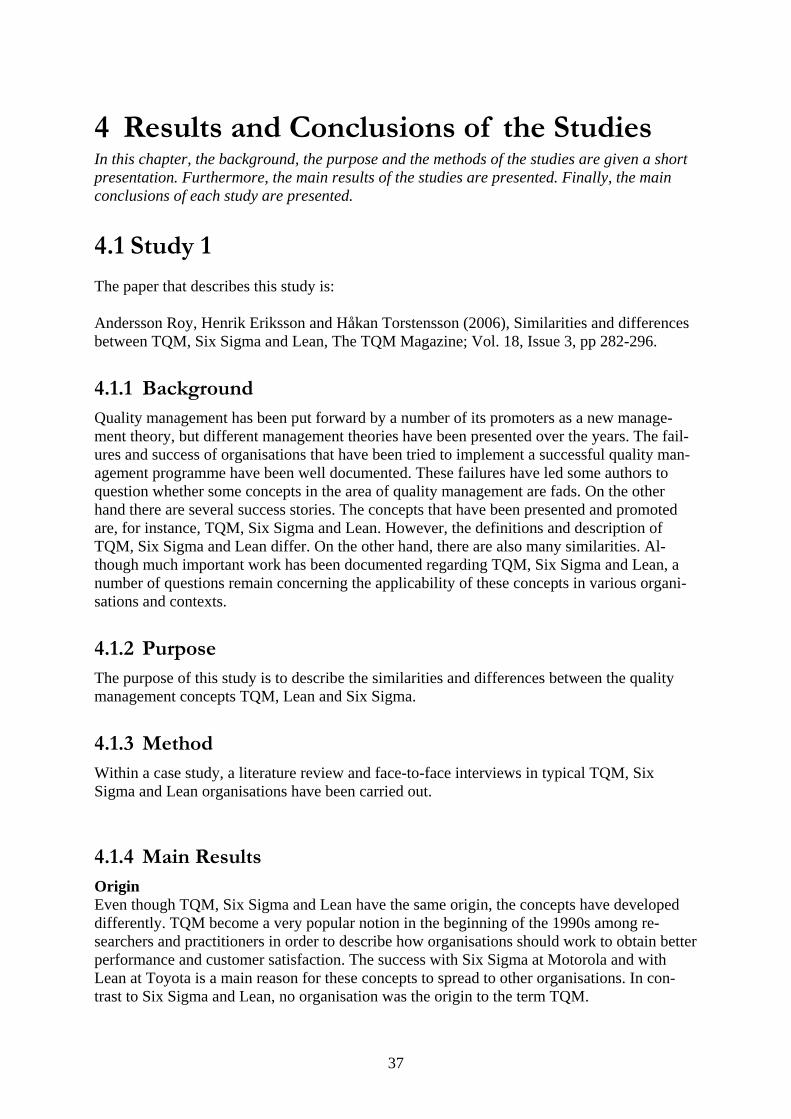
37
4 Results and Conclusions of the Studies In this chapter, the background, the purpose and the methods of the studies are given a short presentation. Furthermore, the main results of the studies are presented. Finally, the main conclusions of each study are presented.
4.1 Study 1 The paper that describes this study is: Andersson Roy, Henrik Eriksson and Håkan Torstensson (2006), Similarities and differences between TQM, Six Sigma and Lean, The TQM Magazine; Vol. 18, Issue 3, pp 282-296.
4.1.1 Background Quality management has been put forward by a number of its promoters as a new manage-ment theory, but different management theories have been presented over the years. The fail-ures and success of organisations that have been tried to implement a successful quality man-agement programme have been well documented. These failures have led some authors to question whether some concepts in the area of quality management are fads. On the other hand there are several success stories. The concepts that have been presented and promoted are, for instance, TQM, Six Sigma and Lean. However, the definitions and description of TQM, Six Sigma and Lean differ. On the other hand, there are also many similarities. Al-though much important work has been documented regarding TQM, Six Sigma and Lean, a number of questions remain concerning the applicability of these concepts in various organi-sations and contexts.
4.1.2 Purpose The purpose of this study is to describe the similarities and differences between the quality management concepts TQM, Lean and Six Sigma.
4.1.3 Method Within a case study, a literature review and face-to-face interviews in typical TQM, Six Sigma and Lean organisations have been carried out.
4.1.4 Main Results Origin Even though TQM, Six Sigma and Lean have the same origin, the concepts have developed differently. TQM become a very popular notion in the beginning of the 1990s among re-searchers and practitioners in order to describe how organisations should work to obtain better performance and customer satisfaction. The success with Six Sigma at Motorola and with Lean at Toyota is a main reason for these concepts to spread to other organisations. In con-trast to Six Sigma and Lean, no organisation was the origin to the term TQM.

38
Theory Six Sigma focuses more on accomplishing no defects. Lean is a better choice when desired to improve process flow and eliminate waste. TQM also has elements of accomplishing no de-fects and eliminate waste, but with the main objectives is to increase external and internal customer satisfaction with a reduced amount of resources. Process View and Approach All the three management philosophies have strong focused on processes. Six Sigma pro-gramme receives necessary support from the top managers at the company, as the managers recognise the economical impact of it. This could be one explanation for the documented suc-cesses of Six Sigma compared with TQM, i.e. Six Sigma programmes speak the top manag-ers’ language. Lean, on the other hand, is a discipline that focuses on process speed and effi-ciency, or the flow, in order to increase the customer value. In Lean, project groups or em-ployees from the improving department are usually assigned to perform the necessary im-provements. Six Sigma focuses on performing improvements mainly through projects, TQM has sometimes a different approach. TQM emphasises the commitment and involvement of all employees. Methodologies TQM contains a number of methodologies. However, the improvement cycle is one of the most widespread methodologies in TQM. The improvement cycle is composed of four stages (PDCA). In Six Sigma there are two major improvement methodologies, one for already ex-isting processes and one for new processes or products. There are many similarities between the improvement cycles in TQM and Six Sigma. The methodology in Six Sigma is a further development of the improvement cycle PDCA. The Lean principles are different: Understand-ing Customer Value, Value Stream Analysis, Flow, Pull and Perfection. In the last phase, Per-fection, there can be discerned a light version of the PDCA. Perfection is about continuously improving, step by step. Tools In Six Sigma, Lean and TQM, there are many different tools. TQM normally consists of tools that have either a statistical or an analytical base. Among others, the seven quality control tools and the seven management tools are frequently applied in TQM. Six Sigma programmes have been successful at integrating advanced improvement tools with the methodologies. The tools range from design tools to management tools and from very simple tools to more ad-vanced statistical tools. In Six Sigma, one learns how to choose the most appropriate tool and how it should be applied. In addition, one must verify the selection in order to assure that the appropriate tool is chosen. In general, Six Sigma programmes have successfully emphasised the statistical part in quality management. In Lean, a variety of tools are available for reducing or eliminating waste. Lean tools are more analytical in nature, compared to the more statisti-cal tools used in TQM and even more advanced statistical tools in Six Sigma. Effects Six Sigma projects are selected in such a way that they are closely tied to the business goals or objectives. The company’s business goals are normally set in such a way that customers’ needs will be satisfied. Before starting a Six Sigma project, one must prove that the improve-ment will result in economical savings for the company. This will result in the fact that all improvements in a Six Sigma programme are economically justified. The objective in a Lean project is to reduce the lead time of a process, by removing wastes. Hence, increased produc-tivity, lead time and inventory reduction are common effects of successful Lean projects. The
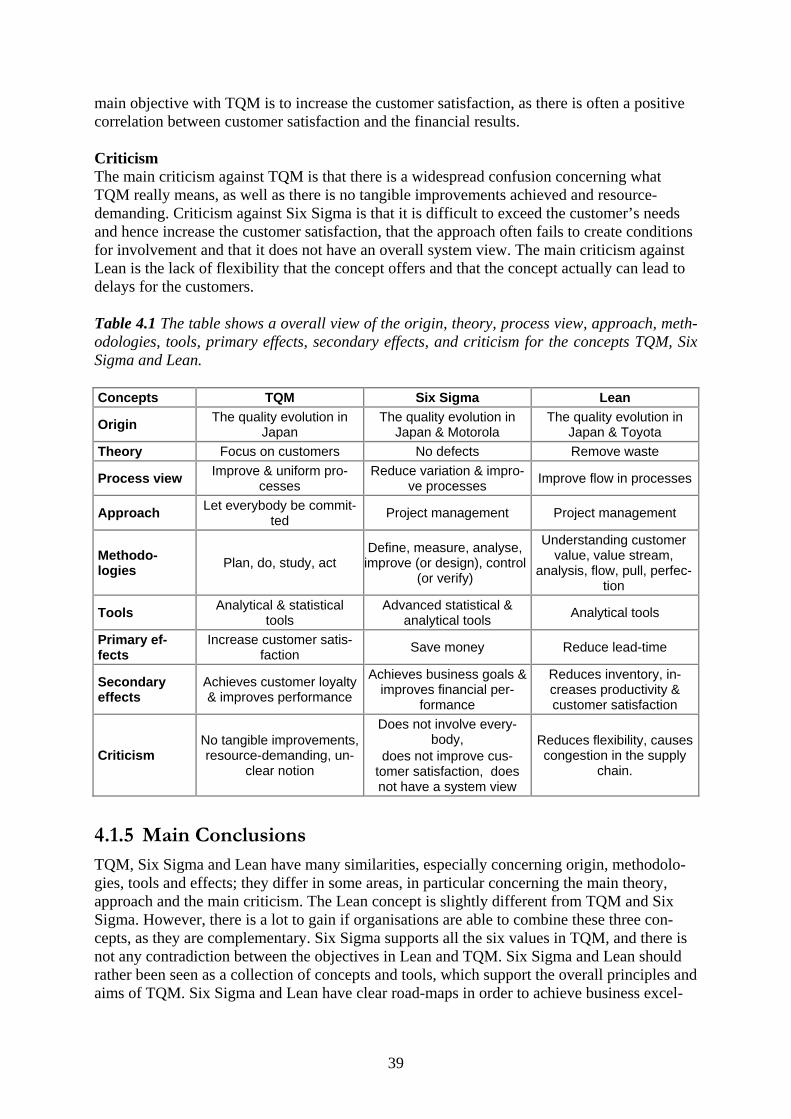
39
main objective with TQM is to increase the customer satisfaction, as there is often a positive correlation between customer satisfaction and the financial results. Criticism The main criticism against TQM is that there is a widespread confusion concerning what TQM really means, as well as there is no tangible improvements achieved and resource-demanding. Criticism against Six Sigma is that it is difficult to exceed the customer’s needs and hence increase the customer satisfaction, that the approach often fails to create conditions for involvement and that it does not have an overall system view. The main criticism against Lean is the lack of flexibility that the concept offers and that the concept actually can lead to delays for the customers. Table 4.1 The table shows a overall view of the origin, theory, process view, approach, meth-odologies, tools, primary effects, secondary effects, and criticism for the concepts TQM, Six Sigma and Lean. Concepts TQM Six Sigma Lean
Origin The quality evolution in Japan
The quality evolution in Japan & Motorola
The quality evolution in Japan & Toyota
Theory Focus on customers No defects Remove waste
Process view Improve & uniform pro-cesses
Reduce variation & impro-ve processes Improve flow in processes
Approach Let everybody be commit-ted Project management Project management
Methodo-logies Plan, do, study, act
Define, measure, analyse, improve (or design), control
(or verify)
Understanding customer value, value stream,
analysis, flow, pull, perfec-tion
Tools Analytical & statistical tools
Advanced statistical & analytical tools Analytical tools
Primary ef-fects
Increase customer satis-faction Save money Reduce lead-time
Secondary effects
Achieves customer loyalty & improves performance
Achieves business goals & improves financial per-
formance
Reduces inventory, in-creases productivity & customer satisfaction
Criticism No tangible improvements, resource-demanding, un-
clear notion
Does not involve every-body,
does not improve cus-tomer satisfaction, does not have a system view
Reduces flexibility, causes congestion in the supply
chain.
4.1.5 Main Conclusions TQM, Six Sigma and Lean have many similarities, especially concerning origin, methodolo-gies, tools and effects; they differ in some areas, in particular concerning the main theory, approach and the main criticism. The Lean concept is slightly different from TQM and Six Sigma. However, there is a lot to gain if organisations are able to combine these three con-cepts, as they are complementary. Six Sigma supports all the six values in TQM, and there is not any contradiction between the objectives in Lean and TQM. Six Sigma and Lean should rather been seen as a collection of concepts and tools, which support the overall principles and aims of TQM. Six Sigma and Lean have clear road-maps in order to achieve business excel-

40
lence, but it is important in order to be successful to stress the corporate culture and human factor in these concepts. Six Sigma’s package of tools, the attention to financial result, the sustaining of the gains, the focus of the problem solving methods of projects and an education system, are new ap-proaches in quality management. Six Sigma has excellent road-maps for improving processes, as well as for designing new processes and products, which could be used, together with the values in TQM, and with the last phase in Lean principles that is Perfection (continuously improving, step by step). TQM is often accused for being blur and unclear, and it is therefore the authors’ opinion that Six Sigma and Lean can be appropriate approaches for organisations in order to make important progress in the field of quality management. Recently, the term Lean Six Sigma has been put forward. Lean addresses process flow and waste, whereas Six Sigma addresses variation and design. Some companies have merged Six Sigma and Lean practices.
4.2 Study 2 The paper that describes this study is: Andersson, Roy, Peter Manfredsson and Anders Näslid (2005), Application of Six Sigma to Control Variability in Production Logistics: A Case Study, PLAN Conference on Quality and Efficiency in the Entire Supply Chain, University College of Borås, pp 21-37
4.2.1 Background Due to growing change of customer needs and expectations, today’s companies have become more interested in being agile and flexible, and are thus looking for ways of improving their performance. Conclusions from the first research paper were that TQM, Six Sigma and Lean have many similarities and that it should be profitable to combine Lean, Six Sigma and TQM. This can be achieved thanks to the Lean philosophy, which focuses on improving the flow and removing unwanted waste, while Six Sigma focuses on reducing unwanted variability and design. The strength of TQM lies in participation and values shared by all employees and hav-ing the customer in focus.
4.2.2 Purpose This case study highlights the advantages of combining TQM, Lean and Six Sigma, in order to make the process more agile.
4.2.3 Method A case study and face-to-face interviews in a typical TQM, Six Sigma and Lean organisation have been carried out.
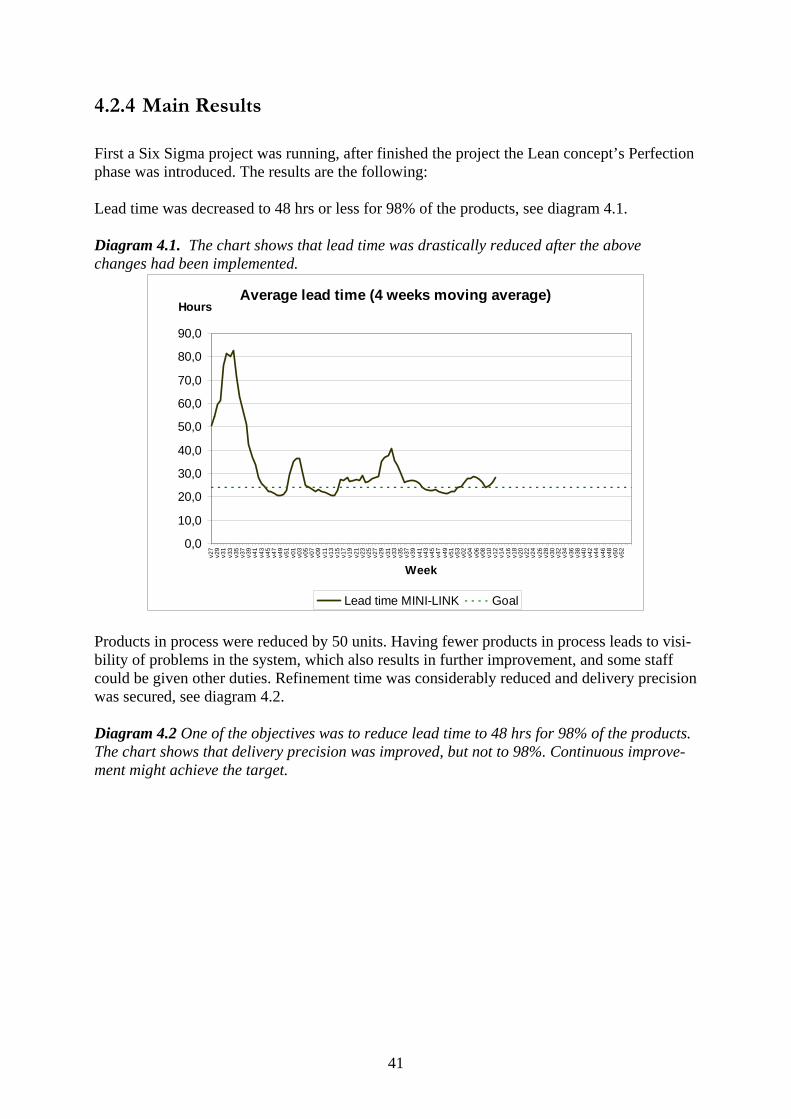
41
4.2.4 Main Results First a Six Sigma project was running, after finished the project the Lean concept’s Perfection phase was introduced. The results are the following: Lead time was decreased to 48 hrs or less for 98% of the products, see diagram 4.1. Diagram 4.1. The chart shows that lead time was drastically reduced after the above changes had been implemented.
Average lead time (4 weeks moving average)
0,0
10,0
20,0
30,0
40,0
50,0
60,0
70,0
80,0
90,0
v27
v29
v31
v33
v35
v37
v39
v41
v43
v45
v47
v49
v51
v01
v03
v05
v07
v09
v11
v13
v15
v17
v19
v21
v23
v25
v27
v29
v31
v33
v35
v37
v39
v41
v43
v45
v47
v49
v51
v53
v02
v04
v06
v08
v10
v12
v14
v16
v18
v20
v22
v24
v26
v28
v30
v32
v34
v36
v38
v40
v42
v44
v46
v48
v50
v52
Week
Hours
Lead time MINI-LINK Goal Products in process were reduced by 50 units. Having fewer products in process leads to visi-bility of problems in the system, which also results in further improvement, and some staff could be given other duties. Refinement time was considerably reduced and delivery precision was secured, see diagram 4.2. Diagram 4.2 One of the objectives was to reduce lead time to 48 hrs for 98% of the products. The chart shows that delivery precision was improved, but not to 98%. Continuous improve-ment might achieve the target.

42
Units within 48hours of lead time(4 weeks moving average)
50%
55%
60%
65%
70%
75%
80%
85%
90%
95%
100%
v27
v29
v31
v33
v35
v37
v39
v41
v43
v45
v47
v49
v51
v01
v03
v05
v07
v09
v11
v13
v15
v17
v19
v21
v23
v25
v27
v29
v31
v33
v35
v37
v39
v41
v43
v45
v47
v49
v51
v53
v02
v04
v06
v08
v10
v12
v14
v16
v18
v20
v22
v24
v26
v28
v30
v32
v34
v36
v38
v40
v42
v44
v46
v48
v50
v52
Week
Perc
ent
Lead time MINI-LINK Goal Walking time for employees was cut and internal transportation distance of the product was decreased. Proximity between employees made for better communication, creating a more pleasant atmosphere and a quicker response to any problems cropping up. Fewer products in work reduced also stress among staff. The flexibility and robustness within the system have increased. All employees could perform each other’s routines. In case of a new incoming product-family order, or a changed starting order of a MINI-LINK index, the performance of the system did not deteriorate. After inter-views with the staff, the environment had been much improved. There was considerably less stress, the atmosphere was more cheerful, the staff was more proud of and satisfied with their work, and the number of accidents was reduced. Thanks to the removal of the trucks the staff was very positive to the new work-place. Total savings per annum exceeded 1 million euros.
4.2.5 Main Conclusions This study has demonstrated that combining Lean and Six Sigma ensures a more effective, robust and flexible process, very much in line with the Agility philosophy. Since many products had to be coordinated, variability and hence lead-time increased. Using Six Sigma, both decreased. The Six Sigma project made the process more robust, flexible and agile. A simulated trial demonstrated that a new product family could be introduced into the system without an increase in lead-time. At increased production volumes, introducing an extra shift is not a problem, since the workers are familiar with each other’s routines. This also applies to increased customer demand and/or requests for other products pairs. The proc-ess has become more flexible, moving closer to Agile methods. The process has also become more reliable, thanks to the TPM philosophy. The use of visualization, continuous improve-ment and self-governing teams has also achieved this effect.

43
Using Six Sigma tools and fact-based decisions it is possible to establish whether changed/changing conditions have an impact on a particular process and how much change this process can take. It has been possible to assess how lean the system can be without caus-ing delays for customers.
4.3 Study 3 The paper that describes this study is: Andersson, R., M. Fredriksson and H. Torstensson (2005), Reducing logistic variations by quality techniques, Conference proceedings, Vol 1, 8th International QMOD Conference, Palermo, pp 457-464.
4.3.1 Background Nowadays organizations can no longer efficiently and effectively compete in isolation of their suppliers, customers or other interest, supply chains, those who will survive are those who can provide management to the fully integrated supply chain. The whole supply chain must be viewed as one system and involve organizations across the supply chain and take interest in each other and work together to make the entire supply chain competitive. The goal is to inte-grate and coordinate all activities and processes across the supply chain through enhanced collaboration. No chain is stronger then the weakest link. Today’s companies focuses on cus-tomers and to be quality leaders. Focuses on customer and requires that unpredictable varia-tions and uncertainties are minimized, led in the companies to quality management. Today the focus on quality has moved even further upstream and downstream of the focal company. A number of transport- and logistics-oriented companies are usually involved in the supply chain, some of the companies more then ones, in the same value chain. 24 transport- and logistics-oriented companies are investigated, Twelve representatives from small companies and twelve from larger companies.
4.3.2 Purpose The research purpose of this study is to explore and describe how representatives logistic and transportation enterprises work with quality concepts, and if they are prepared for quality-driven logistics.
4.3.3 Method Telephone interviews have been performed. The telephone interviews were semi-structured and the questions were sent to the respondents in advance before the interview.
4.3.4 Main Results Tools and techniques The large companies used more quality management tools and techniques than the small ones. Benchmarking is used regularly by the majority of the companies. The specific advanced sta-tistical tools in Six Sigma and the analytical tools in Six Sigma and Lean are not used. A few of the companies use simulation tools.

44
Management system Today logistics and transportation companies are TQM-oriented. In the investigation only two out of 24 respondents mention that. But 22 of the companies use ISO 9000 and 18 out of these 22 also use ISO 14000. It has been demonstrated that the requirements in the ISO 9000 qual-ity system standards serve as a subset of TQM overall requirements. Almost every ISO 9000 company has started its journey a couple of years ago, therefore those companies have brought themselves nearer to TQM. Transportation and logistics companies can be described as being TQM-oriented in their core values, methodologies and tools. The study shows another interesting observation:
17 out of 24 companies put the customer in focus, 19 are process-oriented, All the companies work with continuous improvements, 18 out of 24 companies let everyone be committed. Only four companies seem to have a structured approach to prioritising improvement
projects before starting them These are the five cornerstones in TQM. The experienced strengths of using the quality systems were the holistic view, and the focus on order fulfilment and customers. 17 companies mentioned the advantages of using a quality system: there will be structure and routine. The most difficult part was changing the company culture, according to half of the companies. More than half of the companies mention that the system will often be bureaucratic. One conclusion made here is that almost all the companies approach TQM but not Lean or Six Sigma. Improvements One question concerned who in the company can suggest an improvement. 18 respondents said that all personnel can suggest improvements, only one company answered that the im-provement starts in order to fulfil the company objectives. Three respondents answered that improvements are continuously dealt with during department meetings. When improvement projects are performed the focus is on the customer, just three respondent focused on mini-mizing variations in processes, and only one focused on removing waste. Base decision on facts As illustrated in table 1, companies do not base decision on facts, because far from all quality dimensions are measured in the companies and there is even a lack of measurements in their processes. Customer focus All the respondents in both large and small companies perform customer surveys. Several of the companies also have customer meetings. One conclusion here is that the companies gen-erally have the customer in focus, especially in improvement projects, but not take in to ac-count how important it is to know different needs and which of the quality dimensions are basic needs (must be quality), expected needs (expected quality) and excitements needs (at-tractive quality). Quality dimensions Dimensions included in the companies’ definition of quality in logistics and the extent to which these dimensions are measured are illustrated in table 4.2. However, far from all di-

45
mensions are measured in the companies. There were not very large differences between small and large companies, although the larger companies have more dimensions in their quality definition. Table 4.2. Summary of replies to the questions “What dimensions are included in your defini-tion of quality in logistics?” and “Which of these dimensions do you measure?”
Dimension Is included in our definition
Is measured in our com-pany
Delivery just in time 24 17 Information about delays 23 11 Delivery to the correct place 22 11 Delivery with the correct condition 22 13 Correct delivery quantity 21 13 Delivery to correct consignee 20 10 Nicely treated 19 12 Delivery to the right price 18 10 Flexibility 18 3 Traceability 18 4 Defined procedures and work instructions 17 6 Delivery of the right product 16 7 Return logistics 16 4 Simple routines for ordering 16 5 Correct transaction 15 9 Support in case of unforeseeable events 15 3 Access to special transportation 15 3 Delivery with correct label and information 14 5 Right transportation 14 4 Correct lead time 14 6 Access to customer service dialogue 13 5 Proper packing 12 4 Inbound logistics 10 4 Green transportation 10 6 Delivery with high frequency 8 2 Store availability 8 3
Logistics in the future About the most vital future concepts, seven companies out of 24 answered better IT-support or better information technology is the most important logistics trend to adopt, six of them representing large companies. Six respondents out of 24 answered that time and quality are the crucial factors, three of them representing large companies. Ten out of 24 answered that increased internal and external integration is the most important. Agility, which is a vision for the development of logistics, was considered important by ten respondents. Four representa-tives thought that increased precision in controlling flows is the most important to use. Meas-urement of processes is most important according to six respondents. Interestingly, none of the 24 respondents estimated that cross-docking are important trends and only two estimated the Lean concept as important to use in the future. Only one of the companies mentioned Six Sigma.

46
4.3.5 Main Conclusions The transportation and logistics companies can be described as being TQM-oriented in their core values, methodologies and tools. The results do not clarify whether this is generated by a thorough understanding of the potential of total quality management and its enhancement of the logistics processes and functions, or it merely is about getting a ready-made package be-cause customers demand an ISO certificate, although they can be interpreted as incorporating elements of both. The importance of being customer-oriented is at any case well recognized. One conclusion made here is that almost all the companies approach TQM but not Lean or Six Sigma. Companies do not base decision on facts, because far from all quality dimensions are meas-ured and quality management and statistics tools are seldom used. Companies generally have the customer in focus, especially in improvement projects, but do not take into account how important it is to recognize different needs. The benefits of apply-ing Lean-Agile-Six Sigma principles are to large extent unexploited by the enterprises, how-ever. The reasons for this remain to be analyzed – one reason may be ignorance – but there may also be concerns about the adaptability of them and the cost-effectiveness of implemen-tation.
4.4 Study 4 The paper that describes this study is: Andersson, R. and H. Torstensson (2006), A combined quality approach to controlling supply chain risk. Conference proceedings, Vol 1, 9th International QMOD Conference, Liverpool.
4.4.1 Background One important issue is to manage risk, today many organizations are at risk because their re-sponse times to demand changes are too long or their supply is disrupted. One important issue is to manage resilience. Design, collaboration and agility are key factors, particularly charac-terized by variation and complexity, in the enterprises’ efforts to control and minimize risks throughout the supply chain. It has been shown how a company can benefit from a combined Lean/Six Sigma approach. It has also been demonstrated in previous articles by the author that Six Sigma projects can support agility in the supply chain, which may be very important in order to manage and control risks. A comparison made between TQM, Lean and Six Sigma approaches concludes that it is advantageous to combine Lean and Six Sigma, an observation that is supported by practice. Seven Lean/Six Sigma companies have been investigated. All the companies in the study started out as typically TQM oriented, after which they introduced Lean, and finally Six Sigma, with the exception of one, which started with a Six Sigma approach without using Lean first.
47
4.4.2 Purpose The purpose is to investigate if typical Lean Six Sigma companies are resilient. That means being design and innovation-led, having adopted Agile thinking, having a risk management culture and being collaboration-led. Does the experience of Lean Six Sigma companies confirm the effectiveness of a Lean/Six Sigma approach related to logistics agility and risk readiness and mitigation?
4.4.3 Method The findings are supported empirically by on-site interviews and by observations in the com-panies. On-site interviews and observations were chosen to identify also whether the compa-nies have the same definition as the academy of Six Sigma and Lean.
4.4.4 Main Results All the companies agree that all problems cannot be solved with the Lean concept. According to the companies the advantages to use Six Sigma compared to only using Lean are the fol-lowing:
• The improvement cycle is more structured, especially the first two steps • The root cause will be found and the problem often disappears • Suppliers and customers are more often involved since the root cause is more often
found outside the focal company • A deeper and wider understanding of the solution to the problems is gained • Decisions are based more on fact, less on blur • More complex situations can be handled • Visualise the prioritization of projects • Benefits from the added focus on variability • Focus is shifted from the results of the processes to the things that affect the results • Actions are no longer based on a “snap-shot” of the situation • Six Sigma is advanced enough to provide solutions to problems that no one knew how
to begin solving • Increased certainty in achieving result goals • Clearer roles and responsibilities • Reliable measurement system
Design and innovation-led DFSS introduced a new and more structured methodology for design improvements as well as the design of new processes. Two of the companies frequently use DFSS, although they do not take the entire supply chain into consideration. Experiences from the companies are more than ten successful DFSS projects where risks were mitigated, managed and monitored, and where the process got robust and agile. Four of the companies have previously started to use DFSS. Being in world-class requires focus on the design and innovation phase. All the companies was agree about after closing a Six Sigma project it is appropriate to work with small steps of continuous improvement and expects participation from all employees. Six Sigma and Lean always run in parallel. Six Sigma is the problem solving method and

48
Lean assists in governing the everyday work to obtain perfection, that involves all employees. Six Sigma and its tools help solve the problems that are too advanced for the method of Lean and its tools. There are a range of tools available to identify risk sources of variation. Collaboration In approximately one third of the Six Sigma projects the root cause of variation was found outside the focal companies. To solve these causes the companies today often invite members from these companies to take part in some meetings, but people are seldom enrolled in the entire project. It is easier to focus on improvement work within the focal company because of the established legitimacy of improvement work. Three of the companies have regular pro-jects running with suppliers, two of the companies even have invited suppliers enrolling in Six Sigma training courses. Risk management culture In six of the companies risk awareness has increased and risk management has been im-proved. The improvement depends on Six Sigma training programmes and philosophy, where the focus is on sources of variation, which influence the result, and in improvement pro-grammes there are a few risk assessments in the phases. According to Parker, Lean production leaves no room for risk prevention or mitigation. It is necessary to use Six Sigma in order to know how Lean you can be. Lean projects do not usu-ally identify the root cause, which means that risks appear after a while. In working with Lean the solution appears immediately, but the same or another problem usually arises after a while. For a Six Sigma project the time to solve the problem would have been longer, but the problem had been controlled and no risk appeared. Six Sigma takes a broader and deeper view of a problem. All the companies were in agreement. Agile All the companies stated that Lean cannot solve all the problems, and if Lean and Six Sigma are combined the speed of products will be increased and the responsiveness and flexibility will be improved. This, in turn, leads to quicker response to changes; all of the studied com-panies also agree that, to reduce in-bound lead time, it is necessary to collaborate and have cross-functional process teams. It is also important to have explicit agreements and clear communication. Other solutions to quicker response to customers have been introduced through Six Sigma projects:
• More manual processes • Small batches • Parallel processes that have more flexibility than big automation cells • More flexibility in rules and routines for the workers • Have an alternative supplier, but always have a main supplier • Store the frequently used product that gives buffer time to handle customers’ changing
demands • Work order monitored more often • Collaborate and have more frequent discussions with partners about order quantities,
etc. As mentioned in the introductory chapter, agility implies increased variation, where a Six Sigma approach is useful to control such variations. This is confirmed by the present investi-gation. According to Ericsson Six Sigma must be used to achieve a “Leagile” system.

49
4.4.5 Main Conclusions It has been demonstrated that a combined Lean/Six Sigma approach improves the companies’ resilience, through to their strengthened ability to handle variability, risk management and agility. Six Sigma has a clear roadmap for designing new products and processes, some of the companies use this roadmap with great success. The next step for the companies is to involve the entire supply chain and take the value chain into consideration. If the companies intend to become more resilient they must involve suppliers and customers more in their own processes and design products and processes together. Moreover, representatives from different parts of the supply chain should co-operate with each other in the Six Sigma approach to training. It has also been demonstrated that quality management tools can be very effective in the com-panies’ efforts to control supply chain risk, in some cases with documented substantial sav-ings as a result. In particular Six Sigma projects have been successful in several of the inves-tigated companies for identifying, controlling and mitigating risk in their supply chain. In figure 4.1 is a picture about, how the companies’ opinions of different concepts effecting variation and risk, in the processes.
Quality-driven logistics
Logistics processes
Lean
Variation and risk
Decreased variation, increased risk
Increased variation and risk
Six Sigma
Agile
Decreased and con-trolled variationand risk
Figure 4.1. Contextual view of the relationship between logistic processes and quality concepts and the resulting influence on variations and risk

50
5 Discussions and Conclusions In this chapter findings and conclusions concerning the four research questions are pre-sented. Furthermore, conclusions from the whole thesis are drawn, and suggestions are given for further research.
5.1 Research Question 1-4 This thesis focuses mainly on theories and approaches to achieve logistics resilience by com-bining quality management concepts, such as TQM, Lean, Agile and Six Sigma, in a sup-ply/demand chain context. The purpose of the thesis is to describe and explain how different quality management philosophies can be combined in the supply/demand chain. The follow-ing research questions were formulated.
1. What are the similarities and differences between the quality management concepts TQM, Lean and Six Sigma?
2. What is the outcome in a logistics process if using quality management? 3. How prepared is the transport- and logistics-oriented companies, to the application of
quality concepts and quality management philosophy? 4. How can quality concepts contribute to risk control and resilience in an organisation?
5.2 Findings Concerning Research Question 1 The first research question is: What are the similarities and differences between the quality management concepts TQM, Lean and Six Sigma? The main answers of this question can be found in study 1, but also in studies 2 and 4. In study 2 and 4 some conclusions from study 1 are confirmed. TQM has its strongest emphasis on the commitment and involvement of all employees, fol-lowed by Lean. Lean is a discipline that focuses on process speed and removing waste, in order to increase the customer value. Six Sigma benefits from the added focus on variability, as Six Sigma address variation and design. Six Sigma focuses on performing improvements mainly through projects. The methodology in Six Sigma is a further development of the improvement cycle PDCA, which is used in TQM, as well as in the last phase in the Lean approach, Perfection. The Lean principles are different but the last phase, Perfection, is about continuously improving, step by step. The improve-ment cycle is more structured in Six Sigma, decisions are based more on fact, less on blur, which is common in TQM. Six Sigma has road-maps for improving processes, as well as for designing new processes and products. In Lean, a variety of tools are available for reducing or eliminating waste. Lean tools are more analytical in nature compared to the more statistical tools used in TQM and even more ad-vanced statistical tools in Six Sigma. Six Sigma programmes have been successful at integrat-ing advanced improvement tools with the methodologies. The tools range from design tools to
51
management tools and from very simple tools to more advanced statistical tools. In Six Sigma training programmes the focus is on sources of variation. There are a range of tools available to identify risk sources of variation in Six Sigma toolbox. In Six Sigma training courses one learns how to choose the most appropriate tool. In addition, one must verify the selection in order to assure that the appropriate tool is chosen, Six Sigma takes a broader and deeper view of a problem. All improvements in a Six Sigma project are economically justified, thanks to that they receive necessary support from the top managers at the company, as they recognise the economical impact of it.
5.3 Findings Concerning Research Question 2 The second research question is: What is the outcome in a logistics process if using quality management? The main answers of this question can be found in studies 2 and 4, but also in study 1. In study 2 was demonstrated that combining quality concepts ensures a more effective, robust and flexible process, very much in line with the Agility philosophy. Since many products had to be coordinated, using quality management variability and lead-time decreased. The tools and methodology in the project made the process more robust, flexible and agile. The process has also become more reliable, thanks to the TPM philosophy and the last phase in Lean, Per-fection. The use of visualization, continuous improvement and self-governing teams has achieved this effect. Using quality tools and road-maps helped to assess how lean the system can be without causing delays for customers. In study 4 was shown that experiences from the companies, using the quality tools and the road-map, proved that risks were mitigated, managed and monitored, where the process got robust and agile. In Six Sigma projects, the root cause of variation often was found outside the focal companies, which lead to more collaboration in the supply chain. The companies risk awareness has increased and risk management has been improved. The improvement depends on Six Sigma training programmes and philosophy, where the focus is on sources of variation. By using quality management the speed of production has been increased and the responsive-ness and flexibility have been improved, which has lead to quicker response to changes. In particular, all projects have been successful in several of the investigated companies for iden-tifying, controlling and mitigating risk in their supply chain by using tools and techniques from quality management. The quality management approach improves the companies’ resil-ience, through to their strengthened ability to handle variability, risk management and agility.
5.4 Findings Concerning Research Question 3 The third research question is: How representatives and prepared are the transport- and lo-gistics-oriented companies, to the application of quality concepts and quality management philosophy? The answers of this question can be found in study 3. Transportation and logistics companies can be described as being TQM-oriented in their core values, methodologies and tools. But the companies do not base decision on facts; because of

52
a lack of measurements in their processes, far from all quality dimensions are measured, and they have no structured approach to prioritising improvement projects before starting them. The companies generally have the customer in focus; they perform customer surveys and have customer meetings. But they do not take into account how important it is to know differ-ent needs and which of the quality dimensions that represent basic needs (must-be quality), expected needs (expected quality) and excitements needs (attractive quality). When improve-ment projects are performed the focus is on the customer, but not on variations or removing waste. Advanced statistical tools in Six Sigma and the analytical tools in Six Sigma and Lean are not used. The companies do not think Lean and Six Sigma are important trends to use in the future.
5.5 Findings Concerning Research Question 4 The fourth research question is: How can quality concepts contribute to risk control and resil-ience in an organisation? The main answers to this question can be found in study 4, but also in study 2. In study 4 there was demonstrated that a combined Lean/Six Sigma approach improves the companies’ resilience, through to their strengthened ability to handle variability, risk man-agement and agility. Six Sigma has a clear roadmap for designing new products and proc-esses; some of the companies use this roadmap with great success. Often the results from pro-jects were that risks were mitigated, managed and monitored, where the process got robust and agile. All the companies agreed that after closing a Six Sigma project it is appropriate to work with small steps of continuous improvement and expect participation from all employees. Six Sigma and Lean should always run in parallel. Six Sigma is the problem-solving method and Lean assists in governing the everyday work to obtain perfection. Six Sigma and its tools help solve the problems that are too advanced for the method of Lean and its tools. There are a range of tools available to identify risk and sources of variation in the Six Sigma toolbox. In six of the companies risk awareness has increased and risk management has been im-proved. Solutions to quicker response to customers have been introduced through Six Sigma projects and Lean’s Perfection, for example, more manual processes, small batches, parallel processes that have more flexibility, more flexibility in rules and routines for the workers, as well as work order monitored more often, which also leads to collaboration and more frequent discussions with partners about order quantities, etc. In study 2 was demonstrated that combining quality management concepts contribute to risk control and resilience in an organisation. First a Six Sigma project was run, and after finishing the project the Lean concept’s Perfection phase was introduced. The results were that lead-time was decreased, delivery precision was secured, as well as that fewer products in work also reduced stress among the staff and brought visualisation of new problems. A combined quality management approach ensures a more effectively risk controlled, robust and flexible process. The process has also become more reliable, thanks to the Perfection phase. Again the companies will be more risk aware and mitigate risk in their supply chain, collabo-rate more in the supply chain, and the process will also be more flexible and robust, if they combine Lean and Six Sigma.

53
5.6 Conclusion of the Thesis TQM, Six Sigma and Lean have many similarities and they differ in some areas. The Lean concept is slightly different from TQM and Six Sigma. However, there is a lot to gain if or-ganizations are able to combine these three concepts, as they are complementary. Six Sigma has excellent road-maps for improving processes, as well as for designing new processes and products, which could be used, together with the last phase, Perfection (continuously improv-ing, step by step), in the Lean principles. But it is important in order to be successful to stress the corporate culture and the human factor in these concepts, TQM emphasizes these values. Six Sigma’s package of tools, the attention to financial result, the sustaining of the gains, the focus on the problem-solving methods of projects and an education system, are new ap-proaches in quality management. Lean addresses process flow and waste, whereas Six Sigma addresses variation and design. All problems cannot be solved with the Lean concept. It is necessary to use Six Sigma in or-der to know how lean you can be. Lean projects do not usually identify the root cause, which means that risks appear after a while, or the same or another problem usually arises after a while. Six Sigma projects and Lean should run in parallel. Six Sigma is the problem-solving method and Lean assists in governing the everyday work that involves all employees. Six Sigma and its tools help to solve the problems that are too advanced for the method of Lean and its tools. Some companies have merged Six Sigma and Lean practices with great progress. A case study in a logistics process shows a combined Lean/Six Sigma approach ensures a more effec-tive, robust and flexible process, very much in line with the Agility philosophy. The process has also become more reliable, thanks to the last phase in Lean, Perfection. Using Six Sigma tools, road-map and fact-based on decisions it is possible to establish whether changed/changing conditions have an impact on a particular process and how much change this process can take. A Lean/Six Sigma approach will help companies to know how lean they should be. If the companies aim for a ‘Leagile’ concept, they may use a Lean/Six Sigma ap-proach. It has also been demonstrated that quality management tools can be very effective in the com-panies’ efforts to control supply chain risk and to identify risk sources of variation, even out-side the focal company but within the supply chain. The root cause of variation often is found outside the focal companies, which requires more collaboration in the supply chain. The com-panies’ risk awareness has increased and their risk management has been improved. The im-provement depends on Six Sigma training programmes and philosophy, where the focus is on sources of variation. Using quality management the speed of production has increased, and the responsiveness and flexibility have been improved, which has implied quicker response to changes. In figure 5.1 the opinions of Lean/Six Sigma companies are shown, regarding differ-ent concepts affecting variation and risk in the processes. The figure is similar to figure 4.1, however with an unexplored area added, representing Six Sigma in the demand chain. A combined Lean/Six Sigma approach improves the companies’ resilience, through to their strengthened ability to handle variability, risk management and agility. The next step for the companies is to involve the entire supply chain and take the value chain into consideration. If

54
the companies intend to become more resilient they must involve suppliers and customers more in their own processes and design products and processes together. Logistics and transportation companies can be described as being TQM-oriented. These com-panies are often involved in supply chains. Advanced statistical tools in Six Sigma and the analytical tools in Six Sigma and Lean are however not used by the companies. The compa-nies do not think Lean and Six Sigma are important trends to use in the future. That could lead to a problem to involve the entire supply chain and take the value chain into considera-tion.
ISO 9000 Six SigmaTQM Lean Agile
Variation and risk
Quality-driven logisticsDecreased variation, increased risk
Decreased and controlledvariation and risk
Increased variation and risk
Demand Chain
Six SigmaISO 9000 Six SigmaTQM Lean Agile
Variation and risk
Quality-driven logisticsDecreased variation, increased risk
Decreased and controlledvariation and risk
Increased variation and risk
Demand Chain
Six Sigma Figure 5.1 Contextual view of the relationship between logistic processes and quality con-cepts and the resulting influence on variations and risk. The last step, “Demand Chain Six Sigma”, is an unexplored area. Logistics companies are often TQM-oriented.
5.7 Further Research More focus is needed on the outcome of practical application of Lean/Six Sigma initiatives, and on achieving a better understanding of what concept to apply in a specific situation. Also, further applied research is needed to establish which concepts, structures and tools that are appropriate for large, medium-sized and small logistics companies, respectively. Further research is needed to study the order fulfilment process, which is essential in logistics work. It can be described by sub-processes, such as distribution, production, transportation management, pick/pack/ship, reverse logistics, customer relationship management, call centre management, inventory management and postponement strategies. Six Sigma can be used to develop performance targets related to Critical Quality Characteristics of these sub-processes. Often the focus is on lead-time. To reduce lead-time, we thus have two options, to increase the completion rate, or to reduce the number of products in process. But this research identi-fies a third option: by using Lean/Six Sigma the lead-time and variability will be controlled. Further research in this area is needed to confirm that. Tomorrow competition will be between supply chains rather than between companies. To be effective and efficient organizations must collaborate in the supply chain. Success and to work together to make the entire supply chain competitive are important. Transport and logis-tics companies are today TQM-oriented. What is the best way for communication and col-laboration between companies which are TQM-oriented, Lean- or Six Sigma-oriented, or mixed, should be studied further. Six Sigma training programmes can have representatives from different parts of the demand chain. They should co-operate with each other in the Six Sigma projects, in order to add value in the demand chain to the customers. Further research is planned to address these items.
55
The next step for the companies that have a Six Sigma/Lean management philosophy is to collaborate in the demand chain, involving the entire supply chain and taking the value chain into consideration, in order to reduce cost by increasing customer value. Matching supply chains to value package segments is the way to make attractive quality. All the processes and activities leading to the consumer need to be integrated, coordinated and synchronized, which requires end-to-end integration for both key processes and information and communication systems. Six Sigma training programmes could have representatives from different parts of the demand chain. They should co-operate with each other in the Six Sigma projects, in order to add value in the demand chain to the customers. Further research is planned to address these items. Further research should address how to adapt the Six Sigma training programme to the de-mand chain approach. Research is also needed to find methods to construct roadmaps for pro-ject managers, where these concepts together with a supply chain risk perspective constitute the basis: understanding the need of the customers, retailers and suppliers; defining the prod-ucts and services; identifying the interface and how to share data and collaborate. The challenges in the future will also be to design high value-added products and services in the supply/demand chain and bring them quickly and effectively to market. Demand chain management deals not only with how to fulfil consumer needs, it also deals with how to iden-tify, exceed and create consumer needs and wants. This signifies that demand chain manage-ment includes both marketing and supply chain management, and that a demand chain is more than a demand-driven supply chain. Marketing refers to the identification of value packages and the segmentation of value packages into market segments. In Six Sigma there is a clear roadmap for design, but not for the entire value chain. Future research should address integra-tion of the entire supply/demand chain in this context.

56
References Allwood, C. M. (1999), Distinktionen mellan kvalitativ och kvantitativ ansats. In, Kvalitativa metoder i arbetslivsforskningen. Lindén, J., Westlander, G. and Karlsson, G., Stockholm, Rå-det för arbetslivsforskning
Alvesson, M. and Sköldberg, K. (1994), Interpretation and reflection. Lund, Studentlitteratur (In Swedish)
Andersson, E. W. and Fornell, C. (1994), Customer satisfaction, market share, and profitabil-ity. Findings from Sweden, Journal of Marketing, Vol. 58 No. 3, pp. 53-66
Antonovsky, A. (1987), Unravelling the Mystery of Health, How People Manage Stress and Stay Well, Jossey-Bass, San Francisco, CA
Bajaria, H.J. (2001), Six Sigma Quality, Popular Notion Versus Strategic Notion, Proceedings of the 4th International QMOD Conference, LinkÖpings University, Sweden, pp. 136-143
Bergman, B. and Klefsjö, B. (2003), Quality from Customer Needs to Customer Satisfaction, Studentlitteratur, Lund
Bergquist, T. and Ramsing, K. (1999), Measuring performance after meeting award criteria, Quality Progress, Vol. 32, No. 9, pp. 66-72
Bicheno, J. (2004), The new lean toolbox, towards fast, flexible flow. Buckingham, PICSIE Books.
Bjereld, U., Demker, M. and Hinnfors, J. (1999), Why science? Lund, Studentlitteratur (In Swedish)
Blücher, D. and Öjmertz, B. (2004), Utmana dina processer! Resurseffektiva tankesätt och principer, en introduktion till Lean produktion. Mölndal, IVF Industriforskning
Blücher, D. and Öjmertz, B. (2005), Utmana dina processer! Resurseffektiva tankesätt och principer. Mölndal, IVF Industriforskning
Boaden, R. J. (1996), Is Total Quality Management really unique? Total Quality Manage-ment, Vol. 7 No. 5, pp. 553-570
Boaden, R. J. (1997), What is Total Quality Management. And does it matter? Total Quality Management, Vol. 8 No. 4, pp. 153-171
Brah, S. A., Tee, S. S. L. and Madhu Rao, B. (2002), Relationship between TQM and per-formance of Singapore companies, International Journal of Quality and Reliability Manage-ment, Vol. 19 No. 4, pp. 356-379
Brown, M. G., Hitchcock, D. E. and Willard, M. L. (1994), Why TQM fails. And what to do about it. New York, Irwin Professional Publishing
Cao, G., Clarke, S. and Lehaney, B. (2000), A systematic view of organisational change and TQM, The TQM Magazine, Vol. 12 No. 3, pp. 186-193
Carson, P. P., Lanier, P. A., Carson, K. D. and Birkenmeier, B. J. (1999), “A historical per-spective on fad adoption and abandonment, Journal of Management History, Vol. 5 No. 6, pp. 320-333
Christopher, M. (1998), Logistics & Supply Chain Management, Strategies for reducing Cost and Improving Service. London, Pitman Publishing

57
Christopher, M. (2000), The agile supply chain – competing in volatile markets, Industrial Marketing Management, Vol. 29, No. 1, pp. 37–44
Christopher, M. and Towill, D.R. (2000), Supply chain migration from lean and functional to agile and customised, Supply Chain Management, An International Journal, Vol. 5, No. 4, pp. 206-213
Christopher, M. and Towill, D.R. (2001), An integrated model for the design of agile supply chains, International Journal of Physical Distribution & Logistics Management, Vol. 30, No. 4, pp. 235-246.
Christopher, M., and Peck, H. (2004), Building the Resilient Supply Chain, International Journal of Logistics Management, Vol. 15, No. 2, pp. 1-13
Cooper, Martha C., Lambert, D.M. and Pagh J.D. (1997), Supply Chain Management, more than a new name for logistics, The International Journal of Logistics Management, Vol. 8, No. 1
Cooper, N.P. and Noonan, P. (2003) Do Teams And Six Sigma Go Together? Quality Pro-gress, June, pp. 25-28
Creswell, J.W. (1994), Research Design – Qualitative & Quantitative Approaches. Thousands Oaks, Sage Publications Inc., California
Cusumano, M.A. (1994), The limits of Lean. Sloan Management Review, Vol. 35, No. 4, pp. 27-32
Dahlgaard, J. J. and Dahlgaard, S. M. P. (2001), Lean Production, Six Sigma Quality, TQM and Company Culture. A critical review. International Quality Symposium, Shanghai, China.
Dahlgaard, J. J., Kristensen, K. and Kanji, G. K. (1998), Fundamentals of Total Quality Man-agement. London, Chapman & Hall
Dahlgaard, J.J., Kristensen, K. and Kanji, G.K. (1994), The Quality Journey – a journey with-out an end. Abingdon, Carfax Publishing Company
Dale, B.G. (1999), Managing Quality. Third Edition. Oxford, Blackwell Publishers Ltd.
Dane, F. C. (1990), Research methods. Pacific Grove, California, Brooks/Cole Publishing Company
De Treville, S., Shapiro, R.D. and Hameri, A.P. (2004), From supply chain to demand chain, the role of leadtime reduction in improving demand chain performance. Journal of Operations Management, Vol. 21, No. 6, 613-627
Dean, J. W. and Bowen, D. E. (1994), Management theory and total quality. Improving re-search and practice through theory development, Academy of Management Review, Vol. 19, No. 3, pp. 392-418
Deming, W.E. (1994), The New Economics for Industry, Government, Education. Second Edition. Massachusetts Institute of Technology, Centre for Advanced Engineering Study, Cambridge
Denzin, N. K. and Lincoln, Y. S. (2000), Introduction. The discipline and practice of qualita-tive research. In, Handbook of qualitative research. Denzin, N. K. and Lincoln, Y. S., Thou-sand Oaks, California, Sage Publications
Douglas, A., Coleman, S. and Oddy, R. (2003), The case for ISO 9000, The TQM Magazine, Vol. 15, No. 5, 316-324

58
Dove, R. (1999), Knowledge management. Response ability and the agile enterprise, Journal of Knowledge Management, Vol. 3, No. 1, pp 18-35
Eckes, G. (2001), The Six Sigma revolution, John Wiley & Sons, New York, USA
Eklöf, J. A., Hackl, P. and Westlund, A. (1999), On measuring interaction between customer satisfaction and financial results, Total Quality Management, Vol. 10 No. 4-5, pp. 514-522
Ericsson, D. (2001), Demand Chain Management, Key to Success in the Digital Economy, Proceedings of Conference on Supply Chain Management, Cranfield University, England
Ericsson, D. (2003), Supply/demand chain management, the next frontier for competitiveness, in Walters, D. (ed.), Global Logistics and Distribution Planning, pp. 117-135, Kogan Page, London
Eskildson, L. (1994), Improving the odds of TQM’s success, Quality Progress, Vol. 27 No. 4, pp. 61-63
Evans, J. R. and Lindsay, W. M. (1996), The management and control of quality. St. Paul, MN, West Publishing Company
Foley, K. (2004), Five essays on quality management. Consensus Books, Sydney, NSW
Garvin, D.A. (1988), Managing Quality. New York, The Free Press –Macmillan Inc.
George, M.L. and Wilson, S.A. (2004), Conquering Complexity in Your Business, McGraw-Hill
Griffiths, J., James, R. and Kempson, J. (2000), Focusing customer demand though manufac-turing supply chain by the use of customer focused cells, An appraisal, International Journal of Economics, Vol. 65, No. 1, pp. 111-120
Hackman, J. R. and Wageman, R. (1995), Total Quality Management. Empirical, conceptual, and practical issues, Administrative Science Quarterly, Vol. 40, No. 2, pp. 309-342
Hallgren, M. and Olhager, J. (2006), Resurssnål och flexibel produktion, drivkrafter och ef-fekter. PLANs Forskning- och tillämpningskonferens, Trollhättan 23-24 aug., pp. 174-189
Handsfield, R., Ghosh, S. and Fawcett, S. (1998), Quality-driven change and its effects on financial performance, Quality Management Journal, Vol. 5, No. 3, pp. 13-30
Harari, O. (1997), Ten reasons why TQM doesn't work, Management Review, Vol. 86 No. 1, pp. 38-44
Harrington, H. J. (1991), Business process improvement. The breakthrough strategy for total quality, productivity and competitiveness. New York, McGraw-Hill
Harrison, A. and van Hoek, R. (2002), Logistics Management and Strategy. London, Prentice Hall
Harrison, A. and van Hoek, R. (2005), Logistics Management and Strategy. London, Prentice Hall
Hart, C.W. (1996), Made to Order. Marketing Management summer 1996, Vol. 5, No. 2, pp. 10-23
Hellsten, U. (1997), The Springboard, A TQM-Based Tool for Self-Assessment. Licentiate Thesis 1997:47. Luleå University of Technology, Division of Quality Technology & Statis-tics, Luleå
Hellsten, U. and Klefsjö, B. (2000), TQM as a management system consisting of values, tech-niques and tools, TQM Magazine, Vol. 12, No. 4, pp. 238-244

59
Henderson, K. and Evans, J. (2000) Successful implementation of Six Sigma. Benchmarking General Electric Company. Benchmarking and International Journal, Vol. 7, No. 4, pp. 260-81
Hendricks, K. B. and Singhal, V. R. (1997), Does implementing an effective TQM program actually improve operating performance? Empirical evidence from firms that have won qual-ity awards, Management Science, Vol. 43, No. 9, pp. 1258-1274
Hilletofth, P. (2006), Demand Chain Management - Alignment of Demand Creation and Ful-filment Processes across Functional, Organizational and Inter-organizational Boundaries, Re-search report, University of Skövde, Sweden
Holme, I.M. and Solvang, B.K. (1991), Research Methodology – about qualitative and quanti-tative methods. Lund, Studentlitteratur (In Swedish)
Hoole, R. (2005), Five ways to simplify your supply chain. Supply Chain Management, An International Journal. Vol. 10, No. 1, pp. 3-6
Hover, W.E, Eloranta, E., Holmström, J., and Huttunen, K. (2001), Managing the demand-supply chain – value innovations for customer satisfaction. New York, John Wiley & Sons Inc.
Ishikawa, K. (1985), What is total quality control? The Japanese way. Englewood Cliffs, N.J., Prentice-Hall
Juran, J. M. (1989), Juran on leadership for quality. An executive handbook. New York, The Free Press
Kartha, C.P. (2004), A comparison of ISO 9000:2000 quality system standards, QS9000, ISO/TS 16949 and Baldrige criteria, The TQM Magazine, Vol. 16, No. 5, pp. 331-340
Klefsjö, B., Eliasson, H., Kennerfalk, L., Lundbäck, A. and Sandström, M. (1999), The seven management tools. Lund, Studentlitteratur (In Swedish)
Klefsjö, B., Wiklund, H and Edgeman, R.L. (2001) Six Sigma Seen as a methodology for Total Quality Management, Measuring Business Excellence, Vol. 5 No. 1, pp. 31-35
Kroslid, D. (1999), In search of quality management. Rethinking and reinterpreting. Doctoral thesis. Linköping, Division of Quality Technology and Management, Linköping University
Lagrosen, Y. (2003), Values and practices of Quality Management. Organisational differences and effects on health. Licentiate thesis. Gothenburg, Department of Quality Sciences. Chalmers University of Technology
Lemak, D. and Reed, R. (1997), Commitment to Total Quality Management. Is there a rela-tionship with firm performance?, Journal of Quality Management, Vol. 2, No. 1, pp. 67-86
Lilja, J. and Wiklund, H. (2006), Obstacles to the creation of attractive quality, The TQM Magazine, Vol. 18, No. 1, pp. 55-66
Lofland, J. and Lofland, L.H. (1995), Analyzing Social Settings – A Guide to Qualitative Ob-servation and Analysis. Third edition. Belmont, Wadsworth Publishing Company, USA
Lummus, R.R. and Vokurka, R.J. (1999), Defining supply chain management, a historical perspective and practial guidlines. Industrial Management & Data Systems Vol. 99, No. 1, pp. 11-17
Magnusson, K., Kroslid, D. and Bergman, B. (2003), Six Sigma. The Pragmatic Approach, Studentlitteratur, Lund
60
Martichenko, R. (2004), Lean Six Sigma Logistics, Logistics Quarterly, Vol. 10, No. 1
Maskell, B. 2001, The age of agile manufacturing, Supply Chain Management, An Interna-tional Journal, Vol. 6, No. 1, pp. 5-11
Mason-Jones, R. and Towill, D. (1998), ‘Shrinking the Supply Chain Uncertainty Cycle’, Control, Sept. 1998, pp. 17-22
Mason-Jones, R., Naylor, B. and Towill, D.R. (2000), Engineering the leagile supply chain. International Journal of Agile manufacturing system, Vol. 2, No. 1, pp. 54-61
McCurry L. and McIvor, R.T. (2001), Agile manufacturing, 21st century strategy for manu-facturing on the periphery? Irish Academy of Management Conference, Univ. of Ulster
Naylor, J.B., Naim, M.M. and Berry, D. (1999), Leagility, Integrating the lean and agile manufacturing paradigms in the total supply chain. International Journal of Production Eco-nomics, Vol. 62, No. 1-2, pp. 107-118
NIST (2000), Principles of lean manufacturing with live simulation. Gaithersburg, Manufac-turing Extension Partnership, National Institute of Standards and Technology
NIST (2003), Criteria for Performance Excellence. Gaithersburg, MD, National Institute of Standards and Technology
Nwabueze, U. (2001), An industry betrayed. The case of Total Quality Management in manu-facturing, The TQM Magazine, Vol. 13 No. 6, pp. 400-408
Oakland, J. S. (1993), Total Quality Management. The route to improving performance. Sec-ond edition. Oxford, Butterworth-Heinemann
Ohno, T. (1988), The Toyota Productive System, Beyond large Scale Production, Productiv-ity. Press, Portland, OR
Panda, S., Neuman, R.P. and Cavangh R.R. (2000), The Six Sigma Way. How GE, Motorola and other top companies are honing their performance. New York, McGraw-Hill
Pascal, D., (2002), Lean Production Simplified, Productivity Press, New York, USA
Pine II, B.J. (1993), Mass Customisation, The New Frontier in Business Competition. Har-vard Business School Press, Boston, Massachusetts
Poksinska, B., Dahlgaard, J.J. and Antoni, M. (2002), The state of ISO 9000 certification, a study of Swedish organizations, The TQM Magazine, Vol. 14, No. 5, pp. 297-306
Przasnyski, Z. and Tai, L. (1999), Stock market reaction to Malcolm Baldrige National Qual-ity Award announcements. Does quality pay? Total Quality Management, Vol. 10, No. 3, pp. 391-200
Pyzdek,T. (2003), The Six Sigma Handbook, McGraw-Hill, New York, USA
Rancour, T. and McCracken, M. (2000), “Applying Six Sigma methods for breakthrough safety performance“. American Society of Safety Engineers, October, pp. 31-34
Reeves, C. A. and Bednar, D. A. (1994), Defining quality. Alternatives and implications, Academy of Management Review, Vol. 19, No. 3, pp. 419-445
Sanders, D and Hild, C. (2000), A discussion of strategies for Six Sigma implementation, Quality Engineering, Vol. 12, No. 3, pp. 303-309
Sheridan, J.H. (1996), Where is the agility game plan? (Agile manufacturing at General Mo-tors), Industry Week, Vol. 245, No. 14, pp 50-51
61
Shewhart, W. A. (1980), Economic control of quality of manufactured product. Milwaukee, ASQC Quality Press
Shiba, S., Graham, A. and Walden, D. (1993), A New American TQM – Four Practical Revo-lutions in Management. Portland, Productivity Press, The Centre for Quality Management
Shin, D., Kalinowski, J. G. & El-Enein, G. A. (1998), Critical implementation issues in Total Quality Management, SAM Advanced Management Journal, Vol. 63, No. 1, pp. 10-14
Sila, I. and Ebrahimpour, M. (2002), An investigation of the total quality management survey based research published between 1989 and 2002, International Journal of Quality and Reli-ability Management, Vol. 19, No. 7, pp. 902-970
Spencer, B. A. (1994), Models of organization and Total Quality Management. A comparison and critical evaluation, Academy of Management Review, Vol. 19, No. 3, pp. 446-471
Stoner, J.A.F., Freeman, R.E. and Gilbert Jr, D.R. (1995), Management, 6th ed., Prentice-Hall, London
Sörqvist, L. (1998), Poor quality costing. Doctoral thesis. Stockholm, Royal Institute of Tech-nology
Tan, K.C., Kannan, V.R., and Handfield, R.B. (1998), Supply chain management, supplier performance and firm performance. International Journal of Purchasing and Material Man-agement, Vol. 34, No. 3, pp. 2-9
Towill, D.R., Childerhouse, P. and Disney, S.M. (2000), Speeding up the progress curve to-wards effective supply chain management. International Journal of Supply Chain Manage-ment, Vol. 5, No. 43, pp. 122-130
Truscott, B. (2003), Six Sigma, Love or Hate, Quality World, July 2003, pp. 14-17
van der Wiele, A., Williams, A. R. T. and Dale, B. G. (2000), Total Quality Management. Is it a fad, fashion, or fit? Quality Management Journal, Vol. 7, No. 2, pp. 65-79
Van Hoek, R.I., Harrison, A. and Christopher, M. (2001), ‘Measuring agile capabilities in the supply chain’, International Journal of Operations & Production Management, Vol. 21, No. 1/2, pp. 126-47
Wiedersheim-Paul, F. and Eriksson, L.T. (1991), To disentangle, research and report. Malmö, Almqvist & Wiksell. (In Swedish)
Williams, R., Boudewijn, B., Barrie, D., van der Wiela, T., van Iwaarden, J., Smith, M. and Visser R. (2006), Quality and risk management, what are the key issues?, The TQM Maga-zine, Vol. 18, No. 1, pp. 67-86
Yin, R.K. (1994), Case Study Research – Design and Methods. Second Edition. London, Sage Publications, Inc.


Paper I
Andersson Roy, Henrik Eriksson and Håkan Torstensson (2006), Similarities and differences between TQM, Six Sigma and Lean, The TQM Magazine; Vol. 18, Issue 3, pp 282-296. This paper was also presented at the 7th International QMOD Conference, Monterrey, Mexico 2004: Andersson Roy, Henrik Eriksson and Håkan Torstensson (2004), Similarities and differences between TQM, Six Sigma and Lean, Conference proceeding, 7th International QMOD Conference, Monterrey, Mexico, pp 143-158.


1
Similarities and Differences between TQM, Six Sigma and Lean Roy Andersson, Henrik Eriksson & Håkan Torstensson School of Engineering, University College of Borås, SE-501 90 Borås, Sweden. [email protected]; [email protected]; [email protected];
Research paper Purpose During the last decades, different quality management concepts, including Total Quality Management (TQM), Six Sigma and Lean, have been applied by many different organisations. Although much important work has been documented regarding TQM, Six Sigma and Lean, a number of questions remain concerning the applicability of these concepts in various organisations and contexts. Hence, the purpose of this paper is to describe the similarities and differences between the concepts, including an evaluation and criticism of each concept. Methodology Within a case study, a literature review and face-to-face interviews in typical TQM, Six Sigma and Lean organisations have been carried out. Findings While TQM, Six Sigma and Lean have many similarities, especially concerning origin, methodologies, tools and effects, they differ in some areas, in particular concerning the main theory, approach and the main criticism. The Lean concept is slightly different from TQM and Six Sigma. However, there is a lot to gain if organisations are able to combine these three concepts, as they are complementary. Six Sigma and Lean are excellent road-maps, which could be used one by one or combined, together with the values in TQM. Value The paper provides guidance to organisations regarding the applicability and properties of quality concepts. Organisations need to work continuously with customer-orientated activities in order to survive; irrespective of how these activities are labelled. The paper will also serve as a basis for further research in this area, focusing on practical experience of these concepts.
Keywords: Quality Management, Six Sigma, TQM, Lean Production, Improvement Programmes, Differences Introduction While management is considered as relatively immature compared to other social sciences, the field has been bombarded with “fads”, see, for example, Carson et al. (1999). In summary, the different management theories presented over the years, of which some could be argued to be management fads, have been criticised for having four major defects. These major defects of the management theory are the following: 1. It is constitutionally incapable of self-criticism. 2. Its terminology and industry-specific jargon rather confuse than inform. 3. It rarely rises above common sense. 4. It is replete with fads and plagued with contradictions that would be intolerable in other scientific disciplines
(Carson et al. 1999). During the last decades, quality management has been put forward by a number of its promoters as a new management theory, see, for example, Foley (2004). However, the description of what quality management is differs. Quality management can be described as a management revolution, a revolutionary philosophy of management, a new way of thinking about the management of organisations, a paradigm shift, a comprehensive way to improve total organisational performance, an alternative to management by control or as a framework for

2
competitive management (Foley, 2004). Despite the high aims of promoters of quality management, the failures of organisations trying to implement a successful quality management programme have been well documented, see Brown et al. (1994), Eskildson (1994), Harari (1997), Cao et al. (2000) or Nwabueze (2001). These failures have led some authors to question whether some concepts in the area of quality management are fads, see, for example, van der Wiele et al. (2000). John Godfrey Saxe’s famous fable “The Blind Men and the Elephant”, in which six blind men attempt, and ultimately fail, to describe an elephant could actually be a good description of quality management. In this well written story, each blind man touches only a part of the elephant. They go on to describe what the elephant feels like. For example: one blind man says “the elephant feels like a wall”, another blind man describes it as “the elephant feels like a snake”. In much the same way as each blind man forms a vision of the whole by examining a part, promoters of quality management have written books and articles and presented seminars about different concepts, which either are about the parts or are visions of the whole drawn from the knowledge of one or a few parts, see Foley (2004). Concepts that have been presented and promoted are, for instance, Total Quality Management (TQM), Six Sigma, Lean Manufacturing, Business Process Re-engineering (BPR), Just-in-Time (JIT), Kaizen and Business Excellence. However, the description and definition of these different quality management concepts differ. For example, TQM is sometimes defined “as a continuously evolving management system consisting of values, methodologies and tools, the aim of which is to increase external and internal customer satisfaction with a reduced amount of resources”, see Hellsten & Klefsjö (2000). Six Sigma, on the other hand, is defined “as a business process that allows companies to drastically improve their bottom line by designing and monitoring everyday business activities in ways that minimise waste and resources while increasing customer satisfaction” by some of its proponents, see Magnusson et al. (2003). NIST (2000) defines Lean “as a systematic approach to identifying and eliminating waste through continuous improvement, flowing the product at the pull of the customer in pursuit of perfection”. While the definitions of TQM, Six Sigma and Lean differ, the aim of the different concepts seems to be similar; through improvements minimising waste and resources while improving customer satisfaction and financial results. These concepts also have the same origin, the quality evolution in Japan after the Second World War, see Dahlgaard & Dahlgaard (2001). With parallels to the fable described above, one could argue that different promoters in the field of quality management (the six blind men), who each describes different quality management concepts (the wall, snake, etc.), are trying to describe a part or a vision about the whole; the area of quality management (the elephant). However, the parts or the visions about the whole differ, according to the definitions contributed of TQM, Six Sigma and Lean (which also was the case for the six blind men). Furthermore, the way to achieve these objectives seems to differ between the different concepts. On the other hand, and as shown above, there are also many similarities, for example with respect to the overall aim and origin. Therefore, one could also argue that the different promoters (the six blind men) in some areas are able to describe a similar vision of the whole (a similar picture of the elephant). Hence, and in summary, this paper sets out to describe if the vision of the different promoters of quality management concepts (TQM, Six Sigma and Lean) is the same or if it differs. Although considerable progress has been made in the field of quality management in general and in TQM, Six Sigma and Lean in particular, many important issues remain unexplored concerning the similarities and differences between these concepts. Hence, the purpose of this paper is to describe similarities and differences between TQM, Six Sigma and Lean. In specific, similarities and differences concerning areas such as the methodologies, tools, effects and criticism are illuminated in this paper. Furthermore, an overall description of each concept is contributed in this paper. Moreover, different management theories have been criticised for having four major defects, see above. Hence, the intention with this paper is also to present criticism of each concept (point 1) and inform, rather than confuse the reader about the similarities and differences of each concept (point 2), see Carson et al. (1999). Quality Management Concepts Total Quality Management (TQM) Quality has been an important issue for organisations for many years. The early focus on quality evolved from inspection to quality control and later to quality assurance, according to Dale (1999). During the 1990s, Total Quality Management (TQM) evolved as a common term among organisations. Different definitions of TQM have been presented over the years. Dahlgaard et al. (1998) view TQM as “a corporate culture characterised by increased customer satisfaction through continuous improvement, in which all employees in the firm actively participate”. Shiba et al. (1993), on the other hand, argue that TQM is an evolving system of practices, tools, and training methods for managing companies to provide customer satisfaction in a rapidly changing world”.

3
Hellsten & Klefsjö (2000) support the view that TQM is an evolving system. Hellsten & Klefsjö (2000) define TQM “as a continuously evolving management system consisting of values, methodologies and tools, the aim of which is to increase external and internal customer satisfaction with a reduced amount of resources”. Methodologies and Tools Hellsten & Klefsjö (2000) argue that methodologies are “ways to work within the organisation to reach the values”. A methodology, according to Hellsten & Klefsjö (2000), “consists of a number of activities performed in a certain way”. Hellsten & Klefsjö (2000) define tools as “rather concrete and well-defined tools, which sometimes have a statistical basis, to support decision-making or facilitate analysis of data”. Tools that are frequently mentioned in the TQM literature include the seven quality control tools, see Shewhart (1980) and Ishikawa (1985), and the seven management tools, see Mizuno (1988). The improvement cycle is also a common methodology in order to improve the business, according to Evans & Lindsay (1996). The improvement cycle is composed of four stages: Plan, Do, Study and Act (PDSA). Effects Vokurka et al. (2000) argue that, with customers demanding quality and competitors responding to such demands, business turned to TQM as the key to enhance overall performance. There are many different approaches to evaluating the possible benefits of TQM. Historically, one of the most common ways to quantify the benefits of quality has been to estimate the costs of poor quality, see, for example, Juran (1989) and Sörqvist (1998). In recent years, research has also shown that one of the goals of TQM, customer satisfaction, has a significant positive impact on market value as well as accounting returns, see, for example, Andersson & Fornell (1994) and Eklöf et al. (1999). The General Accounting Office (GAO) study was one of the first studies trying to establish a link between TQM practices and the performance of companies, see GAO (1991). In this study, Malcolm Baldrige recipients and companies that had received a site-visit (i.e. companies that in a sense were close to receiving an award) were evaluated. The main conclusion from the GAO study was that the companies investigated had improved their operating results. Moreover, better employee relations and improved operating procedures had been achieved, greater customer satisfaction had been accomplished, and an increased market share and profitability had been gained. Hendricks & Singhal (1997) and Eriksson & Hansson (2003) compare recipients of quality awards with different control companies. The main conclusions from their research are that companies that have received a quality award outperform the control companies concerning operating income-based measures and other indicators during a period that follows the announcement. For instance, the growth in operating income for recipients averaged 91% during a period that followed the award announcement, in contrast to a 43% average growth for the control groups, see Hendricks & Singhal (1997). Lemak & Reed (1997) also claim that TQM leads to an improved profit margin, after studying sixty companies that had demonstrated a commitment to TQM for a period of at least five years. Criticism The failures of TQM implementation have been well documented, see, for example, Brown et al. (1994), Eskildson (1994), Harari (1997), Cao et al. (2000), Nwabueze (2001) and Foley (2004). In more detail, Harari (1997) states that, after studying all the independent research conducted by consulting firms, the conclusion is that only about one-fifth, or at best one-third, of the TQM programmes in the United States and Europe have achieved significant or even tangible improvements in quality, productivity, competitiveness or financial results. As shown above, and described in Boaden (1997) and Hellsten & Klefsjö (2000), opinions differ about what TQM really is. Boaden (1997) claims in particular that “attempting to define TQM is like shooting at a moving target. As it is more widely practised, and other initiatives emerge, the emphasis on different aspects change.” The different opinions concerning what TQM is lead to different opinions about what TQM should result in. In particular, Eskildson (1994) states, on the basis of survey results, that many organisations do not succeed in their TQM efforts due to a vague definition of TQM. As a solution to this problem, Pyzdek (1999) states, after summarising some criticism against TQM, that TQM professionals constantly need to seek to improve the knowledge of quality and the methodologies for attaining it in order to manage the changing concept of TQM. Moreover, van der Wiele et al. (2000) discuss whether TQM is a fad, fashion, or fit. A fit of TQM into normal management practice means that the original fad will have affected the normal way of working within the whole organisation and not just a small part, such as would be the case in the adoption of a mere fashion. The fieldwork

4
from van der Wiele et al. (2000) shows that a change to a fit of TQM to other management theories will only occur when there is a strong internal motivation for and emotional involvement in the implementation of TQM. Six Sigma Motorola was the first company to launch a Six Sigma programme in the mid 1980s (Rancour & McCracken, 2000). In 1988, Motorola received the Malcolm Baldrige National Quality Award (MBNQA), which led to an increased interest of Six Sigma in other organisations, see Pyzdek (2001). Today, a number of global organisations have developed Six Sigma programmes of their own and Six Sigma is now established in almost every industry. Six Sigma is defined “as a business process that allows companies to drastically improve their bottom line by designing and monitoring everyday business activities in ways that minimise waste and resources while increasing customer satisfaction” by some of its proponents, see Magnusson et al. (2003). Six Sigma could also be described as an improvement programme for reducing variation, which focuses on continuous and breakthrough improvements. Improvement projects are driven in a wide range of areas and at different levels of complexity, in order to reduce variation. The main purpose of reducing variation on a product or a service is to satisfy customers. The goal of Six Sigma is that only 3.4 of a million customers should be unsatisfied, see Magnusson et al. (2003). Methodologies and tools Henderson & Evans (2000) claim that the major components for a successful Six Sigma implementation are management involvement, organisation, infrastructure, training and statistical tools. Eckes (2001) also points out the importance of having an infrastructure before starting an improvement programme, like Six Sigma, and further claims that “successful organisations use a model for improvement” rather than working “ad-hoc” without a model. One of the most important issues of the infrastructure is the involvement of the management, see Eckes (2001). Panda (2000) means that the organisation also must clarify the different roles required and their different areas of responsibility in order to be successful with a Six Sigma programme. According to Magnusson et.al. (2003), the hierarchy of responsibilities and the roles are: Champions and Sponsors, Master Black Belts, Black Belt, Green Belt, White Belt. Sanders & Hild (2000) claim that Six Sigma organisations often have standardised training courses, ranging from comprehensive courses for Black Belts to basic courses for White Belts. There are two major improvement methodologies in Six Sigma, one for already existing processes and one for new processes. The first methodology used to improve an existing process can be divided into five phases, see Pyzdek (2003) and Magnusson et al. (2003). These are: 1. Define: Define which process or product that needs improvement. Define the most suitable team members to
work with the improvement. Define the customers of the process, their needs and requirements, and create a map of the process that should be improved.
2. Measure: Identify the key factors that have the most influence on the process, and decide upon how to measure them.
3. Analyse: Analyse the factors that need improvements. 4. Improve: Design and implement the most effective solution. Cost-benefit analyses should be used to identify
the best solution. 5. Control: Verify if the implementation was successful and ensure that the improvement sustains over time. The second methodology is often used when the existing processes do not satisfy the customers or are not able to achieve strategic business objectives, see Eckes (2001). This methodology can also be divided into five phases; Define, Measure, Analyze, Design, Verify, according to Magnusson et al. (2003). In summary, the two different methodologies have obvious similarities. There are usually many different improvement tools used in a Six Sigma programme. Magnusson et al. (2003) document that the Six Sigma toolbox contains the seven design tools, the seven statistical tools, the seven project tools, the seven lean tools, the seven customer tools, the seven quality control tools and the seven management tools. The tools are often easy to use in both ongoing and breakthrough improvement projects, but there are also some more advanced statistical tools in the toolbox.

5
Effects Much of the increased interest in Six Sigma programmes is due to the positive financial impact some companies claim that the programmes have. For example, Volvo Cars in Sweden claims that the Six Sigma programme has contributed with over 55 million EURO to the bottom line during 2000 and 2002, see Magnusson et al. (2003). Another company that has been successful with their Six Sigma programme is the Business unit of Transmission & Transportation Networks at Ericsson located in Borås, Sweden. Ericsson in Borås have about 1,100 employees. According to Peter Häyhänen, a promoter and educator at Ericsson, they started their Six Sigma programme in 1997. At Ericsson, Six Sigma was first defined as a methodology for solving problems. Today, they rather see Six Sigma as a business excellence model for concrete areas and as a methodology in order to reach business goals. At Ericsson in Borås, approximately 50 Black Belt projects and 200 Yellow Belt projects have been executed between 1997 and 2004, with total savings of approximately 200 to 300 million EURO between 1997 and 2003. (The company admits it is very difficult to estimate the savings due to the fact that they do not measure the total savings anymore.) Criticism There has not been published much criticism against Six Sigma, according to the belief of the present authors. Klefsjö et al. (2001) claim, however, that Six Sigma has the same common features as TQM and that Six Sigma does not, in principle, contain anything new. In more detail, they state that Six Sigma is a highly disciplined, data-oriented, top-down approach, which typically includes four stages (measure, analyse, improve and control) and the use of statistical decision tools. The new thing concerning Six Sigma is the explicit linking of the tactical and the strategic, according to Klefsjö et al. (2001). For example, statistical techniques are used in a systematic way to reduce variation and improve processes, and there is a stronger focus on results, including customer needs. Klefsjö et al. (2001) see Six Sigma rather as a methodology within the larger framework of TQM. Lean Among the several quality management concepts that have been developed, the Lean concept, as in lean manufacturing, lean production etc. is one of the more wide-spread and successful attempts. Briefly, Lean is about controlling the resources in accordance with the customers’ needs and to reduce unnecessary waste (including the waste of time). The concept was introduced at a larger scale by Toyota in the 1950’s, but not labelled lean manufacturing until the now famous book about the automobile appeared in 1990 (Womack et al, 1990). While there are many formal definitions of the Lean concept, it is generally understood to represent a systematic approach to identifying and eliminating elements not adding value to the process. Consequences of this are striving for perfection and a customer-driven pull of the process. Thus the definition of NIST is relevant: “A systematic approach to identifying and eliminating waste through continuous improvement, flowing the product at the pull of the customer in pursuit of perfection” (NIST, 2000). Methodologies and tools Lean principles are fundamentally customer value driven, which makes them appropriate for many manufacturing and distribution situations. Five basic principles of lean manufacturing are generally acknowledged: 1. Understanding Customer Value: Only what the customers perceive as value is important. 2. Value Stream Analysis: Having understood the value for the customers, the next step is to analyse the
business processes to determine which ones actually add value. If an action does not add value, it should be modified or eliminated from the process.
3. Flow: Focus on organising a continuous flow through the production or supply chain rather than moving commodities in large batches.
4. Pull: Demand chain management prevents from producing commodities to stock, i.e. customer demand pulls finished products through the system. No work is carried out unless the result of it is required downstream.
5. Perfection: The elimination of non-value-adding elements (waste) is a process of continuous improvement. “There is no end to reducing time, cost, space, mistakes, and effort” (McCurry et al., 2001).
Lean principles do not always apply, however, when customer demand is unstable and unpredictable. The main elements contributing to the elimination of non-value-added activities are the following: Excess production, Excess processing, Delays, Transport, Inventory, Defects and Movement. A variety of approaches are available for reducing or eliminating waste. These approaches include value stream analysis, total productive maintenance, Kaizen costing and cost analysis, engineering and change management, and document management. Tools used

6
include Kanban cards for pull through the supply chain and the closely related Just-in-Time system (JIT) for inventory reduction. Effects There are many reasons to introduce lean techniques in an organisation, as it may contribute substantially to cutting costs and providing competitive advantages. Lean benefits include reduced work-in-process, increased inventory turns, increased capacity, cycle-time reduction and improved customer satisfaction. According to a recent survey, see NIST (2003), of 40 companies that had adopted lean manufacturing, typical improvements are visible in three areas. These improvement areas include: Operational Improvements (reduction of lead time, increase in productivity, reduction in work-in-process inventory, etc.), Administrative Improvements (reduction in order processing errors, streamlining of customer service functions so that customers are no longer placed on hold, etc.) and Strategic Improvements (reduced costs, etc.). Criticism Despite the several success stories associated with the Lean concept, it has some shortcomings. Examples of shortcomings which can be found in the literature on the subject are the following: • The lean organisation may become very susceptible to the impact of changes. The leanness in itself leads to
reduced flexibility and less ability to react to new conditions and circumstances (Dove, 1999) • JIT deliveries cause congestion in the supply chain, leading to delays, pollution, shortage of workers etc.
(Cusumano, 1994) To summarise, Lean requires a stable platform, where scale efficiency can be maximised. Highly dynamic conditions can not be dealt with, as there is no room for flexibility due to the focus on perfection, which is always a function of particular market conditions at a certain period of time. Similarities and Differences In this section, some similarities and differences between TQM, Six Sigma and Lean are presented. The overall similarities and differences between the concepts, regarding origin, theory, process view, approach, methodologies, tools, effects and criticism, are also presented in Table I. Origin and Theory Even though TQM, Six Sigma and Lean have the same origin (the quality evolution in Japan), the concepts have developed differently. TQM become a very popular notion in the beginning of the 1990s among researchers and practitioners in order to describe how organisations should work to obtain better performance and customer satisfaction. TQM is often associated with the prominent figures within the field of quality management, for example Deming and Juran, but they have in general not used the term TQM. In particular, Deming has stated that “the trouble with TQM, the failure of TQM, you can call it, is that there is no such thing. It is a buzzword. I have never used the term, as it carries no meaning”, see Romano (1994). The success with Six Sigma at Motorola and with Lean at Toyota is a main reason for these concepts to spread to other organisations. In contrast to Six Sigma and Lean, no organisation was the origin to the term TQM (there is ongoing discussion on who really labelled TQM). A notable difference between Six Sigma and Lean is that Motorola labelled Six Sigma, see Rancour & McCracken, (2000), while authors in the field, Womack et al (1990), labelled the lean concept. George et al. (2004) claim that the main difference between Six Sigma and Lean is that the previous focuses more on accomplishing no defects, while the latter is a better choice when one wants to improve process flow and eliminate waste. TQM also has elements of accomplishing no defects and eliminate waste, but with the main objectives to increase external and internal customer satisfaction with a reduced amount of resources, see Hellsten & Klefsjö (2000). Process View and Approach The improvement projects in a Six Sigma programme are conducted in a wide range of areas and at different levels of complexity in order to reduce variation, see Magnusson et al. (2003). When the project members have reduced the variation in a process, and hence achieved the business goals, increased the profit or lowered the cost, this improvement is visualised to the top managers at the company. Often some of the top managers are also involved in the performed improvement projects. As a result, the Six Sigma programme receives necessary support from the top managers at the company, as the managers recognise the economical impact of it. This could be one explanation for the documented successes of Six Sigma compared with TQM, i.e. Six Sigma programmes talk the top managers’ language (the economical gains of the improvement). Lean, on the other hand, is a discipline that focuses on process speed and efficiency, or the flow, in order to increase the customer
7
value; see George et al. (2004). In Lean manufacturing, project groups are usually the approach to perform the necessary improvements. While Six Sigma and Lean focus on performing improvements mainly through projects, TQM has sometimes a different approach. TQM emphasises the commitment and involvement of all employees, see, for example, Bergman & Klefsjö (2003). In TQM, there is also, like Six Sigma and Lean, a strong focus on processes. It is the authors’ opinion that the main objectives of the process work within TQM are to alternatively improve and uniform the processes. Methodologies Hellsten & Klefsjö (2000) argue that TQM contains a number of methodologies. However, the improvement cycle is one of the most widespread methodologies in TQM, according to Evans & Lindsay (1996). The improvement cycle is composed of four stages: Plan, Do, Study and Act (PDSA). In Six Sigma there are two major improvement methodologies, one for already existing processes and one for new processes, see above. The Lean principles could in this context be regarded as a methodology. The principles of Lean are: Understanding Customer Value, Value Stream, Analysis, Flow, Pull and Perfection. There are many similarities between the improvement cycle in TQM and the methodologies of Six Sigma; i.e. the methodologies are cyclical and consist of similar phases. One could argue that the methodologies in Six Sigma are a further development of the improvement cycle, which first was developed by Shewhart and Deming. The Lean principles are different compared to the methodologies in TQM and Six Sigma, as they are not cyclical in nature and are not focused on how to perform improvements. Tools Deming stated that about 96% of the problems are built into the system and that individual employees can only control about 4%. The purpose of most improvement efforts is to use data in a proper way in order to find out what is wrong with the system and hence improve the system. In Six Sigma, Lean and TQM, there are many different tools that could be used in order to find out what is wrong with the system. TQM normally consists of tools that have either a statistical or an analytical base. Among others, the seven quality control tools and the seven management tools are frequently applied in TQM. In general, Six Sigma programmes have been successful at integrating advanced improvement tools with the methodologies. The tools range from design tools to management tools and from very simple tools to more advanced statistical tools. During the training programmes in Six Sigma, one learns how to choose the most appropriate tool and how it should be applied. In addition, one must verify the selection in order to assure that the appropriate tool was chosen. In general, Six Sigma programmes have successfully emphasised the statistical part in quality management. In Lean, a variety of tools are available for reducing or eliminating waste, see above. In summary, the tools in the Lean concept are more analytical in nature compared to the more statistical tools used in TQM and Six Sigma. Effects The main objective with TQM is to increase the customer satisfaction, see Hellsten & Klefsjö (2000). Eklöf et al. (1999) have also shown that there is a positive correlation between customer satisfaction and the financial results of companies. Furthermore, there is strong correlation between customer satisfaction and customer loyalty, see Söderlund (2001). Moreover, it has been shown that organisations that have successfully implemented TQM outperform similar organisations regarding a number of financial indicators, see Hendricks & Singhal (1997) and Eriksson & Hansson (2003). On the other hand, Ingle & Roe (2001) argue that in a Six Sigma programme, the projects are selected in such a way that they are closely tied to the business goals or objectives. The company’s business goals are normally set in such a way that customers’ needs will be satisfied. Before starting a Six Sigma project, one must prove that the improvement will result in economical savings for the company. This results in the fact that all improvements in a Six Sigma programme are economically justified. However, it is the authors’ opinion that Six Sigma does not necessarily improve customer satisfaction to the same extent as a successful TQM programme. The reason is that a Six Sigma programme primarily emphasises the economical savings and secondly the customer satisfaction. This view was supported by Ericsson in Borås. When starting a Lean project with the objectives to reduce the lead time of a process, one first analyses the customer’s demands of the process. Hence, the objectives of the improvement, besides reducing the lead time, is also to increase customer satisfaction. In addition, increased productivity and an inventory reduction are common effects of successful lean projects. Criticism The main criticism against TQM is that there is a widespread confusion concerning what TQM really means, see Boaden (1997) and Hellsten & Klefsjö (2000). In addition, a number of failures of organisations trying to implement TQM have been documented. In more detail, a number of organisations have put a large amount of resources on implementing TQM, but with no tangible improvements achieved, see, among others, Harari (1997). According to Magnusson et al. (2003), there is a difficulty in Six Sigma programmes to exceed the

8
customer’s needs and hence increase the customer satisfaction. To avoid this problem some companies use Voice of the Customer (VOC) tools in their define phase. Klefsjö et al. (2001) claim that Six Sigma programmes fail to create conditions in order to involve everyone, which is more emphasised in the TQM literature. Furthermore, in Six Sigma training programmes one can only start a project which gives a certain amount of savings. This project is often executed in the department of the project members. The project normally leads to an improvement in the department of the project members, but due to the performed change another department can experience deterioration. As a result, Six Sigma is sometimes accused for not having a system view. The main criticism against Lean is the lack of flexibility the concept offers, see Dove (1999), and that the concept actually can lead to delays for the customers, see Cusumano (1994). There is also a discussion going on whether Lean, which was developed for manufacturing and distribution situations, is applicable in all industries. Mast (2004), on the other hand, argues that Six Sigma can be applied in a wide range of areas, including both manufacturing and service industries. Table I The table shows the authors’ view concerning the similarities and differences between TQM, Six Sigma and Lean.
Concepts TQM Six Sigma Lean Origin The Quality Evolution in
Japan The Quality Evolution in
Japan & Motorola The Quality Evolution in
Japan & Toyota Theory Focus on Customers No Defects Remove Waste
Process View Improve & Uniform Processes
Reduce Variation & Improve Processes Improve Flow in Processes
Approach Let Everybody be Committed Project Management Project Management
Methodologies Plan, Do, Study, Act Define, Measure, Analyse,
Improve (or Design), Control (or Verify)
Understanding Customer Value, Value stream, Analysis, Flow, Pull,
Perfection
Tools Analytical & Statistical Tools
Advanced Statistical & Analytical Tools Analytical Tools
Primary Effects Increase Customer Satisfaction Save Money Reduce Lead Time
Secondary Effects
Achieves Customer Loyalty & Improves Performance
Achieves Business Goals & Improves Financial
Performance
Reduces Inventory, Increases Productivity & Customer
Satisfaction
Criticism No tangible Improvements,
Resource-demanding, Unclear Notion
Does not Involve Everybody, Does not Improve Customer Satisfaction, Does not have a
System View
Reduces Flexibility, Causes Congestion in the Supply
Chain, Not Applicable in all Industries
Discussions The presented concepts show many similarities, especially Six Sigma and TQM. However, the package of quality tools, the attention to financial result, the sustaining of the gains, and the focus of the problem solving methods of projects are new approaches in Six Sigma compared to other concepts in quality management. Klefsjö et al. (2001) argue that Six Sigma should be regarded as a methodology within the larger framework of TQM. One reason for this is due to the fact that Six Sigma supports all the six values in TQM, see Klefsjö et al. (2001). Dahlgaard & Dahlgaard (2001) also state that there is not any contradiction between the objectives in Lean and TQM. They support the view presented by Klefsjö et al. (2001) above, and argue that Six Sigma and Lean should rather been seen as a collection of concepts and tools, which support the overall principles and aims of TQM. Dahlgaard & Dahlgaard (2001) mean that Six Sigma and Lean have clear road-maps in order to achieve Business excellence, but it is important in order to be successful to stress the corporate culture and human factor in these concepts. TQM is often accused for being blur and unclear, and it is therefore the authors’ opinion that Six Sigma and Lean can be appropriate approaches for organisations in order to make important progress in the field of quality management. Recently, the term Lean Six Sigma has been put forward by, for example, George et al. (2004) and Martichenko (2004). In specific, George et al. (2004) claim that “Lean Six Sigma helps companies flourish in a new world where customers expect no defects and fast delivery at the minimal cost.” Magnusson et al. (2003) also state that

9
many companies have merged Six Sigma and Lean manufacturing practices. The merger can be traced back to early developments at General Electrics where they realised that the two concepts complemented each other very well, i.e. lean manufacturing addresses process flow and waste whereas Six Sigma addresses variation and design. This paper has focused on a theoretical description and comparison of three quality management concepts. Further research in this area will need to focus on the practical experience of these concepts, and contribute to a better understanding concerning which concept is most appropriate in different situations. Furthermore, a more detailed description of how these concepts can be combined needs to be presented in order to facilitate for organisations to meet and exceed the demands of future customers and survive in an even more competitive environment. Conclusions The purpose of this paper is to describe similarities and differences between TQM, Six Sigma and Lean. With parallels to the fable described above, one could argue that the blind men’s visions about the whole are very similar; the three presented concepts have many similarities, especially concerning origin, methodologies, tools and effects. However, the blind men’s vision about the whole also differs slightly in some areas; especially concerning the main theory, approach and the main criticism. Comparing the different quality management concepts, TQM and Six Sigma show many similarities, while the Lean concept is slightly different compared to the previous two. However, it is the authors’ recommendation that there is a lot to gain if organisations are able to combine these three concepts. Indeed, the concepts are complementary; especially Six Sigma and Lean are excellent road-maps, which could be used one by one or combined, in order to strengthen the values of TQM within an organisation. Even if some of the presented concepts have been accused for being management fads, see above, it is the authors’ opinion that organisations continuously need to work with customer-orientated activities in order to survive; irrespective of how these activities are labelled today and in the future. Acknowledgement The authors would like to thank Peter Häyhänen, Peter Manfredsson and Anders Näslid at the Business unit of Transmission & Transportation Networks at Ericsson for their contribution of valuable information.

10
References Andersson, E. W. and Fornell, C. (1994). "Customer satisfaction, market share, and profitability. Findings from Sweden", Journal of Marketing, Vol 58 No 3, pp. 53-66. Bergman, B. and Klefsjö, B. (2003). Quality from customer needs to customer satisfaction. Second edition. Lund, Studentlitteratur. Boaden, R. J. (1997). "What is Total Quality Management... And does it matter?" Total Quality Management, Vol 8 No 4, pp. 153-171. Brown, M. G., Hitchcock, D. E. and Willard, M. L. (1994). Why TQM fails. And what to do about it. New York, Irwin Professional Publishing. Cao, G., Clarke, S. and Lehaney, B. (2000). "A systematic view of organisational change and TQM", The TQM Magazine, Vol 12 No 3, pp. 186-193. Carson, P. P., Lanier, P. A., Carson, K. D. and Birkenmeier, B. J. (1999). “A historical perspective on fad adoption and abandonment”, Journal of Management History, Vol 5 No 6, pp. 320-333. Cusumano, M. A. (1994). “The limits of Lean”, Sloan Management Review, Vol 35 No 4, pp. 27-32. Dahlgaard, J. J. & Dahlgaard, S. M. P. (2001). “Lean Production, Six Sigma Quality, TQM and Company Culture. A critical review”. Conference Proceedings from the International Shanghai Quality Symposium, November 2001. Dahlgaard, J. J., Kristensen, K. and Kanji, G. K. (1998). Fundamentals of Total Quality Management. London, Chapman & Hall. Dale, B. G. (1999). Managing quality. Oxford, Blackwell Publishers. Deming, W. E. (1994). “Report card on TQM”. Management Review, Dove, R, (1999). “Knowledge management. Response ability and the agile enterprise”, Journal of Knowledge Management, Vol 3 No 1, pp 18-35. Eckes, G. (2001). The Six Sigma revolution. John Wiley & Sons, New York. Eklöf, J. A., Hackl, P. and Westlund, A. (1999). "On measuring interaction between customer satisfaction and financial results", Total Quality Management, Vol 10 No 4&5, pp. 514-522. Eriksson, H. & Hansson, J. (2003). “The impact of TQM on financial performance”. Measuring Business Excellence, Vol 7 No 1, pp. 36-50. Eskildson, L. (1994). "Improving the odds of TQM’s success", Quality Progress, Vol 27 No 4, pp. 61-63. Evans, J. R. and Lindsay, W. M. (1996). The management and control of quality. St. Paul, MN, West Publishing Company. Foley, K. (2004). Five essays on quality management. To be published. GAO (1991). Management Practices. U. S. companies improve performance through quality efforts. Report no. GAO/NSIAD-91-190. Washington D.C., U. S. General Accounting Office (GAO). Hansson, J. (2003). Total Quality Management. Aspects of implementation and performance. Investigations with a focus on small organisations. Doctoral Thesis. Luleå, Division of Quality & Environmental Management. Luleå University of Technology. Harari, O. (1997). "Ten reasons why TQM doesn't work", Management Review, Vol 86 No 1, pp. 38-44.

11
Hellsten, U. and Klefsjö, B. (2000). "TQM as a management system consisting of values, techniques and tools", TQM Magazine, Vol 12 No 4, pp. 238-244. Henderson, K. and Evans, J. (2000), “Successful implementation of Six Sigma. Benchmarking General Electric Company”, Benchmarking and International Journal, Vol. 7 No 4, pp. 260-81 Hendricks, K. B. and Singhal, V. R. (1997). "Does implementing an effective TQM program actually improve operating performance? Empirical evidence from firms that have won quality awards", Management Science, Vol 43 No 9, pp. 1258-1274. Ingle, S. and Roe, W. (2001). “Six Sigma black implementation”, The TQM Magazine, Vol 13 No 4, pp 273-80. Ishikawa, K. (1985). What is total quality control? The Japanese way. Englewood Cliffs, N.J., Prentice-Hall. Juran, J. M. (1989). Juran on leadership for quality. An executive handbook. New York, The Free Press. Klefsjö, B., Wiklund, H and Edgeman, R.L. (2001) “Six Sigma Seen as a methodology for Total Quality Management”, Measuring Business Excellence, Vol 5 No 1, pp. 31-35 Lemak, D. and Reed, R. (1997). "Commitment to Total Quality Management. Is there a relationship with firm performance?", Journal of Quality Management, Vol 2 No 1, pp. 67-86. Magnusson, K., Kroslid, D. and Bergman, B. (2003). Six Sigma. The Pragmatic Approach. Studentlitteratur, Lund. Martichenko, R. (2004). “Lean Six Sigma Logistics”, Logistics Quarterly, Vol. 10 No. 1. Mast, J. (2004). “A methodological comparison of three strategies for quality improvement”, International Journal of Quality & Reliability Management, Vol 21 No 2, pp. 198-213. McCurry L. and McIvor, R. T. (2001). Agile manufacturing: 21st century strategy for manufacturing on the periphery?, Conference Proceedings, Irish Academy of Management Conference, University of Ulster, September 2001. Mizuno, S. (1988). Company-wide total quality control. Tokyo, Asian Productivity Organization. NIST (2000). Principles of lean manufacturing with live simulation. Gaithersburg, Manufacturing Extension Partnership, National Institute of Standards and Technology. NIST (2003). Utah Manufacturing Extension Partnership. Gaithersburg, Manufacturing Extension Partnership, National Institute of Standards and Technology. Nwabueze, U. (2001). "An industry betrayed. The case of Total Quality Management in manufacturing", The TQM Magazine, Vol 13 No 6, pp. 400-408. Panda, S., Neuman, R.P. and Cavangh R.R. (2000). The Six Sigma Way. How GE, Motorola and other top companies are honing their performance. New York, McGraw-Hill. Pyzdek, T. (1999). "A road map for quality beyond control", Quality Progress, Vol 32 No 12, pp. 33-38. Pyzdek, T. (2001).The Six Sigma Revolution [Online], Quality America, http//www.qualityamerica.com/knowledgecentre/articles/PyzdekSixSigRev.htm (2004-06-10). Pyzdek,T. (2003). The Six Sigma Handbook, New York, McGraw-Hill. Rancour, T. and McCracken, M. (2000). “Applying Six Sigma methods for breakthrough safety performance“. American Society of Safety Engineers, October, pp. 31-34. Romano, C. (1994). “Report card on TQM”, Management Review, Vol. 83 No. 1, pp. 22-25.
12
Sanders, D and Hild, C. (2000). A discussion of strategies for Six Sigma implementation, Quality Engineering, Vol 12 No 3, pp. 303-309. Shewhart, W. A. (1980). Economic control of quality of manufactured product. Milwaukee, ASQC Quality Press. Shiba, S., Graham, A. and Walden, D. (1993). A new American TQM. Four practical revolutions in management. Portland, Oregon, Center for Quality Management. Productivity Press. Söderlund, M. (2001). Den lojala kunden. Malmö, Sweden, Liber Ekonomi (In Swedish). Sörqvist, L. (1998). Poor quality costing. Doctoral thesis. Stockholm, Royal Institute of Technology. van der Wiele, A., Williams, A. R. T. and Dale, B. G. (2000). "Total Quality Management. Is it a fad, fashion, or fit?" Quality Management Journal, Vol 7 No 2, pp. 65-79. Vokurka, R. J., Stading, G. L. and Brazeal, J. (2000). "A comparative analysis of national and regional quality awards", Quality Progress, Vol 33 No 8, pp. 41-49. Womack, J. P., Jones, D. T. and Roos, D. (1990). The machine that changed the World, New York, Rawson Associates.
Paper II
Andersson, Roy, Peter Manfredsson and Anders Näslid (2005), Application of Six Sigma to Control Variability in Production Logistics: A Case Study, PLAN Conference Quality and efficiency in the entire supply chain, University College of Borås, pp 21-37.


1
Application of Six Sigma to Control Variability in Production Logistics:
A Case Study Roy Andersson (1), Peter Manfredsson (2) and Anders Näslid (2) (1) Högskolan i Borås Allégatan 1 501 90 Borås 033-4354000 [email protected] (2) Ericsson AB, Borås Sandlidsgatan 3, P.O. Box 22150, 504 12 Borås 033-179600 [email protected] [email protected]

2
Summary Today’s companies must be focused on customer demand and quality management, if they want to be on the cutting edge in their sector. Key factors are the effective and efficient performance of the processes and the simultaneous fulfillment of the customers’ demands. Many companies show shortcomings in their processes, especially in logistics. Effective and efficient logistics management requires undesired variability to be minimised within systems, processes and logistics structures, thus securing problem-free handling of information and products. Simple quality tools like the seven management tools and the seven improvement tools are very rarely used in logistics. This is an unexplored field, which has a large potential for enhancing logistics performance by the use of both advanced and simple quality tools, for example the Six Sigma tools for controlling variability. This article highlights the fields of application for quality tools within logistics. An improvement project has been carried out, using the methodology of the quality management programme Six Sigma. This project shows the benefits of focusing on variability, using quality tools, basing decisions on facts and working systematically. The project resulted in fewer products in process, decreased lead-times, considerably improved refining times, precision delivery, shorter walking time for employees, decreased external transportation distance for the product, as well as more flexibility and robustness in the process. Proximity between employees made for better communication and for creating a more pleasant atmosphere. Thanks to fewer products in work the employees experienced less stress. The case-study was performed at Ericsson AB in Sweden, Borås, in the production department of MINI-LINK, where the project was initiated because delivery precision and lead-time needed to be improved.

3
Background and Purpose Due to growing change of customer needs and expectations, today’s companies have become more interested in being agile and flexible, and are thus looking for ways of improving their performance. According to Andersson et al. (2004) and Andersson et al. (2005) a company stands a good chance of being competitive and profitable by combining Lean, Six Sigma and TQM. This can be achieved thanks to the Lean philosophy which focuses on improving the flow and removing unwanted waste, while Six Sigma focuses on reducing unwanted variability and design. The strength of TQM lies in participation and values shared by all employees and having the customer in focus. This case study highlights the advantages of combining these three management philosophies Six Sigma, Lean and TQM, in order to make the process more agile.
Theory and Model George and Wilson (2004) claim that today’s customers expect good quality and short lead-times at a low cost. A combination of TQM, Lean and Six Sigma provides a safe and comprehensive foundation for meeting company objectives and customer demand. These three management philosophies can be combined to constitute a whole, if the best ideas are applied from each system. The strengths of Lean are its focus on lead-time and removing waste, while Six Sigma focuses on controlling variability, fulfilling business objectives, and improving design. The strengths of TQM are its focus on the customer, the involvement of all employees and their commitment to shared values. A combination of these management philosophies will result in better control of lead-time, fewer defects and decreased costs, as well as better customer satisfaction (Andersson et al. 2004). The main components of Six Sigma are a clear infrastructure, fact-based decisions, effective and efficient methods and tools, systematic follow-up and feedback on results, comprehensive education programmes, and uniform procedures for improvement and design of products, processes and systems. A central aspect is committed leadership on all levels, see Sörqvist (2004) and Henderson and Evans (2000). According to Pyzdek (2003) and Magnusson et al. (2003) there are two improvement cycles in Six Sigma: one for existing processes (DMAIC) and one for new processes/products (DFSS). Improvement of existing processes can be divided into five phases. These are:
1. Define: Identify the process or product that needs improving. Find the most capable persons for involvement in the project. Define customers and stakeholders and find out about their needs and expectations. Design a process map, identify the current base line and select SMART goals. Set up a communication strategy. Design a time and resource plan and carry out a risk analysis for the project. Finally construct a project chart.

4
2. Measure: Identify potential root causes; establish what effect they have on the
process and how they are to be measured. Investigate the capability of the measurement system. Identify suitable benchmarking partners.
3. Analyse: Analyse the root causes and the factors that need improving. Find
areas that need to be addressed.
4. Improve: Design the most effective and efficient solution. Perform cost/savings and risk analyses of solutions and construct a plan for resource allocation and implementation. Make the process robust.
5. Control: Establish whether the chosen solution proved successful and
permanent. Validate the result against the goal statement and investigate whether the solution is robust. Transfer responsibility, share learning and best practice.
According to Andersson et al. (2004) the focus is on variability, saving money and achieving company objectives. This improvement cycle is a modification of the PDCA-cycle (Plan, Do, Check, Act), with complementary addition tools and methods for improvement work. The PDCA-cycle originates from Deming and Shewhart, besides being used in TQM. According to Pascal (2002) the main components in Lean are stable and standardized methods of working, making all employees involved and committed, keeping a focus on what the customer really wants, delivering the right quality at the right time, at a minimum of cost. The strengths of Lean are decreased lead-times, removal of waste and a focus on what the customer really wants. The last phase in the improvement cycle is perfection. According to McCurry and McIvor (2001) there is no end to improvement; this phase is about continuously working to decrease lead-time, cost, space, errors, etc. According to Bergman and Klefsjö (2003) the main components of TQM are focusing on the customer, making all employees involved and committed to shared values, working continuously with improvements, making decisions based on facts, working with processes, and expecting committed leadership. The advantage of TQM, compared to Six Sigma and Lean, is that TQM organisations are likely to succeed in making all employees involved and committed to shared values. According to Dahlgaard and Dahlgaard (2001) this is not so apparent in Six Sigma and Lean. According to Klefsjö et al. (2001) Six Sigma can be used as a method in TQM, since Six Sigma supports all the values in TQM. Recently the concept of ”Lean Six Sigma” has appeared, see George and Wilson (2004) and Martichenko (2004), who claim that “Lean Six Sigma” helps companies to flourish. ”Agility” is a relatively new strategy in logistics. According to Dove (1999) and Schrage (2004), being agile means being able to react fast when something unusual happens, or being successful in unpredictable, uncertain and changing conditions. The Six Sigma improvement cycle DMAIC was used as a model for the study.

5
Implementation of the Six Sigma Project and Perfection
Background The product MINI-LINK is used for transmitting information into the air. MINI-LINK is available at a frequency range between 6 and 38 GHz, its capacity is between 2 and 155 Mbit/s. The frequency band is divided into a large number of ”sub-bands” (small frequency ranges) and the product is therefore available for the customers in a great variety of variants. MINI-LINKs can thus be used effectively and efficiently within their allowed frequency. Since customisation must be done before delivery, the products cannot be stored. Hence lead-time and delivery precision are vital to meeting customer demands. Mini-link is used for transmission of information between two pylons, and is therefore supplied in pairs. All calculations and data were based on a period between 1 August 2002 and 30 September 2002. More than 5,000 observations were made from each process. Observations based on these two months were considered to be representative for the rest of the year. The production system used was a push system, i.e. the first process was to carry out assembly operations as fast as possible.
Define Phase After identifying a possible improvement project that would yield good returns, a decision was taken to improve the assembly process and the testing procedure of the Mini-Link. A problem statement was made, as well as an analysis of profitability. The lead-time was 80 hrs for 98% of the products; the median was 42 hrs, or 66% within 72 hrs and only 47% within 48 hrs. The measurements were based on a production volume of 900 units a week during four shifts. Diagram 1: The chart shows the present situation. The average lead-time was 80 hrs and only 55% of the products were delivered within 48 h.
Having set waiting time at a perceived reasonable level, using the SMART method (Specific, Measurable, Accepted, Reasonable and Time Set) of setting targets and
Present lead-time
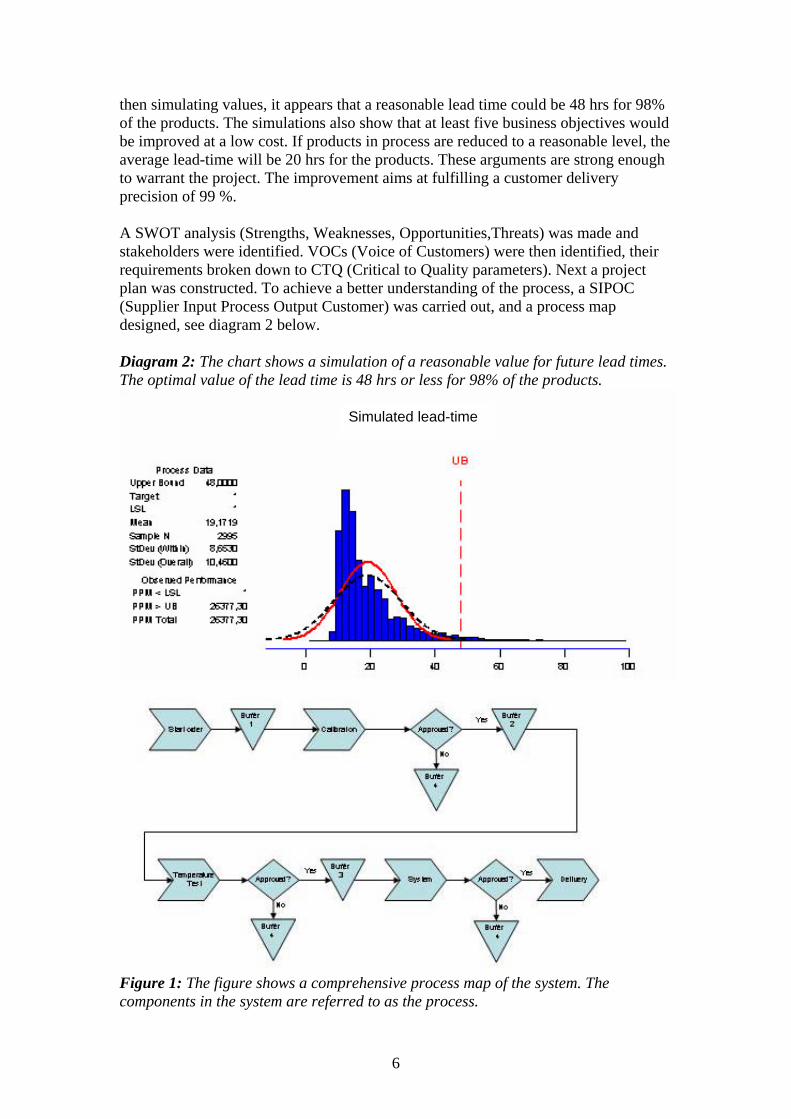
6
then simulating values, it appears that a reasonable lead time could be 48 hrs for 98% of the products. The simulations also show that at least five business objectives would be improved at a low cost. If products in process are reduced to a reasonable level, the average lead-time will be 20 hrs for the products. These arguments are strong enough to warrant the project. The improvement aims at fulfilling a customer delivery precision of 99 %. A SWOT analysis (Strengths, Weaknesses, Opportunities,Threats) was made and stakeholders were identified. VOCs (Voice of Customers) were then identified, their requirements broken down to CTQ (Critical to Quality parameters). Next a project plan was constructed. To achieve a better understanding of the process, a SIPOC (Supplier Input Process Output Customer) was carried out, and a process map designed, see diagram 2 below. Diagram 2: The chart shows a simulation of a reasonable value for future lead times. The optimal value of the lead time is 48 hrs or less for 98% of the products.
Figure 1: The figure shows a comprehensive process map of the system. The components in the system are referred to as the process.
Simulated lead-time

7
Figure 2: The figure shows the repairs process. “Swapping” means that a faulty product is exchanged for a new one.
Measure After brainstorming and discussions, the following measurements were found to be of interest:
• The order in which the products were assembled • Waiting time before the assembly and calibration processes, the temperature
and system tests. • The repairs and waiting times for the products arriving from the calibration
process, temperature test and system test. • Variability and inventory levels of the products before the calibration process,
temperature test and system test • The measurement system analysis of the data indicated that the reliability and
validity data were acceptable.
Analyse The analysis of the order in which the products were assembled showed only one accurate assembly out of five of the correct MINI-LINK An analysis of calibration consistency of index pairs in line was also carried out. When there are faulty components in the system, disorder in the system is created, resulting in decreased same-index reliability, see diagram 3. This leads to an increased inventory level before calibration. The disorder is further increased in subsequent processes.

8
Diagram 3: The diagram shows that out of the number of products assembled in a line according to the same index pair, the correct product was assembled 22% of the time.
The next step was to look into waiting times within the assembly process, as well as in the calibration process and the system test. Median values for waiting times were increased further into the system. Median waiting time before calibration test was 1.9 hrs, before temperature test 4.9 hrs and before system test 8.5 hrs, see diagram 4-6. Diagram 4: The bar chart shows waiting time before calibration test. The median time was 1.9 hrs.
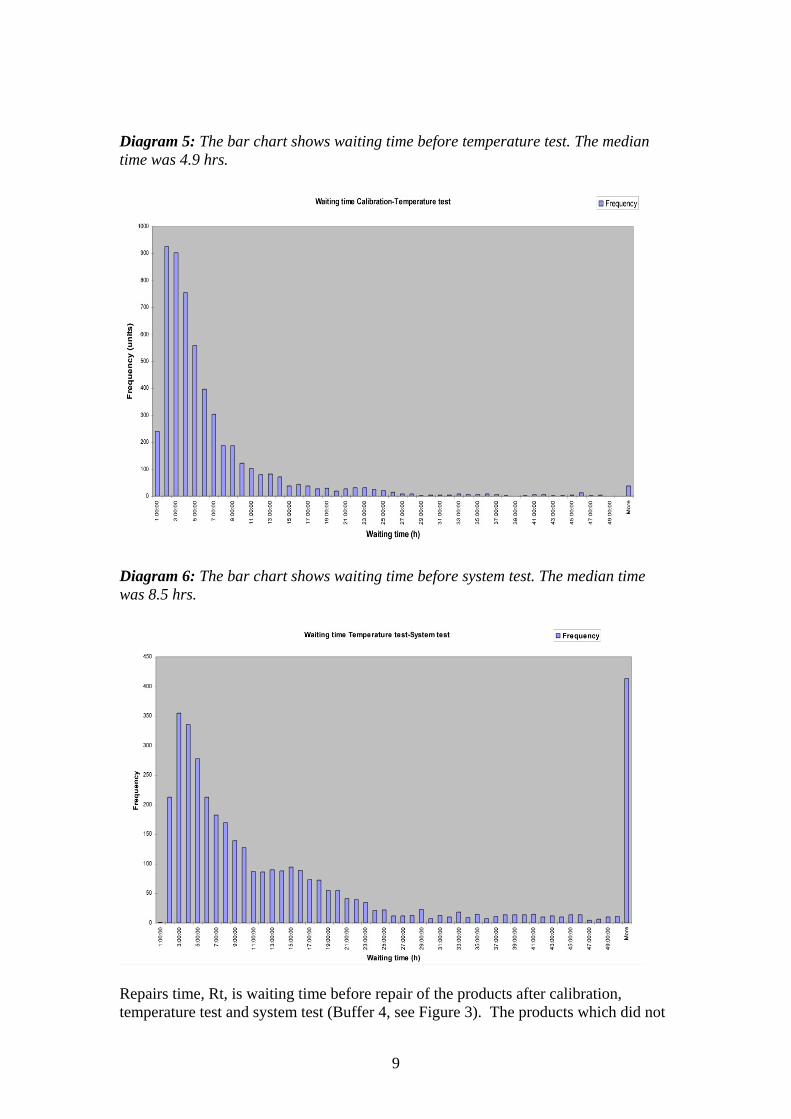
9
Diagram 5: The bar chart shows waiting time before temperature test. The median time was 4.9 hrs.
Diagram 6: The bar chart shows waiting time before system test. The median time was 8.5 hrs.
Repairs time, Rt, is waiting time before repair of the products after calibration, temperature test and system test (Buffer 4, see Figure 3). The products which did not

10
pass calibration had a median value of 24 hrs, i.e. waiting time before repair, time to repair and time to transport the product into the system. The values for the temperature test and system test were 60 hrs and 1.5 hrs, respectively. The long duration of the temperature test is due to the fact that the MINI-LINK cannot proceed to temperature test before the oven is filled up. Variability was large for getting the MINI-LINK repaired at calibration, see Diagram 7. Similar variability appeared at temperature and system test repair. Diagram 7: The chart shows repair time, R t, (waiting time before repair, repair time and time for the product to come back into the system): the median value was 24hrs. The big bar on the left is the result of a faultless MINI-LINK. It was transported to the system without being repaired. The big bar on the right shows repair times over 55hrs.
Store levels and variability before calibration, temperature test and system test were set. The median value of MINI-LINK storage was 18 units between assembly and calibration, 29 units between calibration and temperature test and 50 units between temperature test and system test. The rate of variability is increased further into the system, see diagram 8. Diagram 8: The pie chart shows the median value of store levels between the different processes. It appears that, here too, variability is increased further into the system.
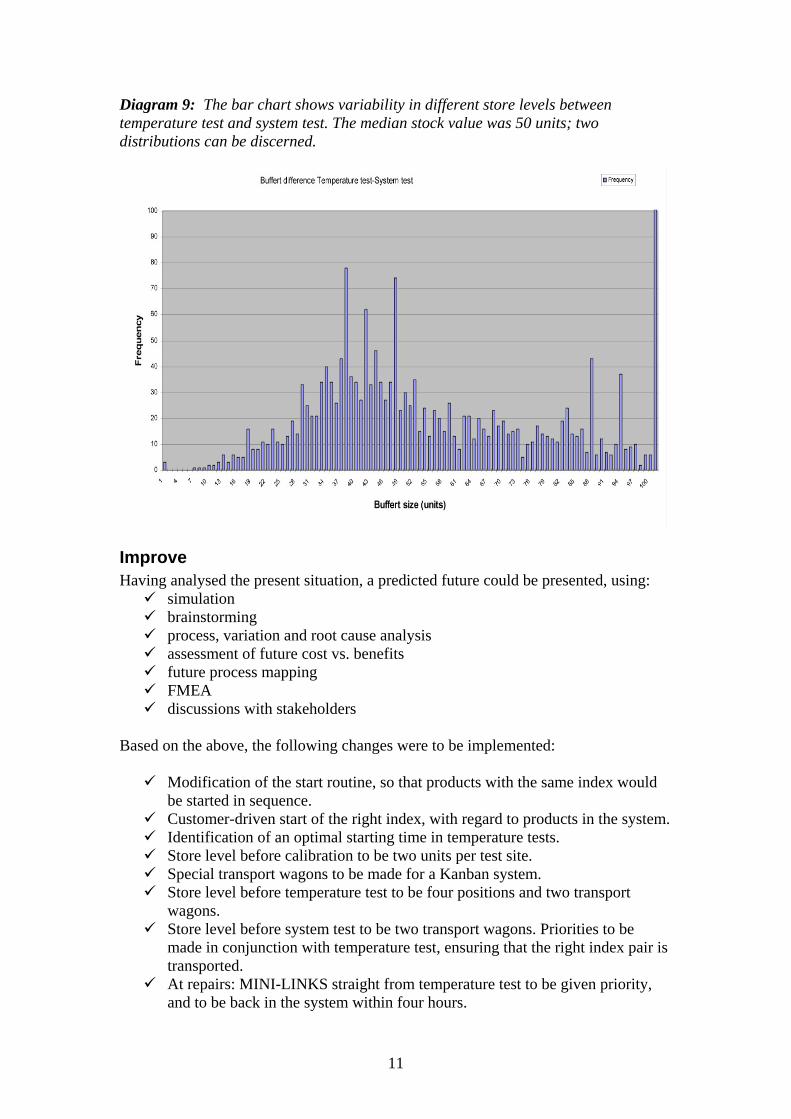
11
Diagram 9: The bar chart shows variability in different store levels between temperature test and system test. The median stock value was 50 units; two distributions can be discerned.
Improve Having analysed the present situation, a predicted future could be presented, using:
simulation brainstorming process, variation and root cause analysis assessment of future cost vs. benefits future process mapping FMEA discussions with stakeholders
Based on the above, the following changes were to be implemented:
Modification of the start routine, so that products with the same index would be started in sequence.
Customer-driven start of the right index, with regard to products in the system. Identification of an optimal starting time in temperature tests. Store level before calibration to be two units per test site. Special transport wagons to be made for a Kanban system. Store level before temperature test to be four positions and two transport
wagons. Store level before system test to be two transport wagons. Priorities to be
made in conjunction with temperature test, ensuring that the right index pair is transported.
At repairs: MINI-LINKS straight from temperature test to be given priority, and to be back in the system within four hours.

12
A staff rotation system to be introduced at test sites in order to improve flexibility.
Calibration staff to receive training in how to install and start units in temperature tests.
A new layout of the system to be made. Diagram10 : The chart shows that lead time was drastically reduced after the above changes had been implemented.
Average lead time (4 weeks moving average)
0,0
10,0
20,0
30,0
40,0
50,0
60,0
70,0
80,0
90,0
v27
v29
v31
v33
v35
v37
v39
v41
v43
v45
v47
v49
v51
v01
v03
v05
v07
v09
v11
v13
v15
v17
v19
v21
v23
v25
v27
v29
v31
v33
v35
v37
v39
v41
v43
v45
v47
v49
v51
v53
v02
v04
v06
v08
v10
v12
v14
v16
v18
v20
v22
v24
v26
v28
v30
v32
v34
v36
v38
v40
v42
v44
v46
v48
v50
v52
Week
Hours
Lead time MINI-LINK Goal Diagram 11: One of the objectives was to reduce lead time to 48 hrs for 98% of the products. The chart shows that delivery precision was improved, but not to 98%. Continuous improvement might achieve the target.
Units within 48hours of lead time(4 weeks moving average)
50%
55%
60%
65%
70%
75%
80%
85%
90%
95%
100%
v27
v29
v31
v33
v35
v37
v39
v41
v43
v45
v47
v49
v51
v01
v03
v05
v07
v09
v11
v13
v15
v17
v19
v21
v23
v25
v27
v29
v31
v33
v35
v37
v39
v41
v43
v45
v47
v49
v51
v53
v02
v04
v06
v08
v10
v12
v14
v16
v18
v20
v22
v24
v26
v28
v30
v32
v34
v36
v38
v40
v42
v44
v46
v48
v50
v52
Week
Perc
ent
Lead time MINI-LINK Goal

13
Implementation of the above resulted in the following:
• Lead time was decreased to 48 hrs or less for 98% of the products. • Products in process were reduced by 50 units. Reducing the number of
products in process leads to visibility of problems in the system, which also results in further improvement, e.g. putting a stop to picking when the buffer stock exceeds 12 units, and asking for help when the buffer stock is below 6 units,
• Having calculated tact time, some staff could be given other duties. • Refinement time was considerably reduced. • Delivery precision was secured. • Walking time for employees was cut. • Internal transportation distance of the MINI-LINK was decreased. • Proximity between employees made for better communication, creating a
more pleasant atmosphere and a quicker response to any problems cropping up.
• Fewer products in work reduced stress among staff. • The flexibility and robustness within the system have increased. All
employees could perform each other’s routines. • In case of a new incoming product-family order, or a changed starting order of
a MINI-LINK index, the performance of the system did not deteriorate. • After interviews with the staff, the main conclusions were that the
environment had been much improved. There was considerably less stress, the atmosphere was more cheerful, the staff was more proud of and satisfied with their work, and the number of accidents was reduced. Thanks to the removal of the trucks the staff was very positive to the new work-place.
Total savings per annum exceeded 1 million euros. Diagram 12: Before the above-mentioned changes were implemented, the repairs process was critical. After changing the routine and the flow, waiting time was decreased, i.e. the products were back in the system much sooner. The chart shows that the values were improved over time, due to the introduction of the last phase of the Lean concept, Perfection, i.e. continuous (step by step) improvement, visualizing management systems and adopting preventive maintenance routines.
M e d i a n v ä n t e t i d f ö r r e p a r a t i o n ( s w a p p n i n g )
0 :0 0 :0 01 :0 0 :0 02 :0 0 :0 03 :0 0 :0 04 :0 0 :0 05 :0 0 :0 06 :0 0 :0 07 :0 0 :0 08 :0 0 :0 09 :0 0 :0 0
1 0 :0 0 :0 01 1 :0 0 :0 01 2 :0 0 :0 01 3 :0 0 :0 01 4 :0 0 :0 0
2004
-32
2004
-33
2004
-34
2004
-35
2004
-36
2004
-37
2004
-38
2004
-39
2004
-40
2004
-41
2004
-42
2004
-43
2004
-44
2004
-45
2004
-46
2004
-47
2004
-48
2004
-49
2004
-50
2004
-51
2004
-52
V e c k a
Tim
mar
M L 2 3 M å l
Repairs process
Hou
rs
Weeks

14
Calibration was a bottleneck. In this process waiting time must be low for the right index pair. The optimal amount of warming sites was calculated using simulation of old data. Data from the three processes were explained as normal distribution for the assembly process, exponential distribution for the warming site and Weibull distribution for the calibration process. Using simulation, the optimal amount of units at warming sites was fixed at a minimum of eight, with a risk of less than 1% of there being a unit ready for calibration. Diagram13 : The bar chart shows there is a risk of less than 1% of there being no units in the calibration process, if the buffer size is more than, or equals, eight.
Simulated buffer size
0%
20%
40%
60%
80%
100%
Number of units needed in buffer
Prob
abili
ty
Accumulated probability 100% 92% 70% 44% 21% 8% 2% 0,4% 0,1% 0,0%
1 2 3 4 5 6 7 8 9 10
Control Team-building was introduced to promote shared values. Training sessions were to be held twice a year, and stand-up meetings introduced between each shift to further strengthen shared values and team spirit. To improve results over time, the following criteria of the Lean Concept were introduced: continuous (step by step) improvement, TPM (Total Preventive Maintenance), application of VMS (Visual Management System) three times a day, removal of additional waste, and visualization routines.

15
Outcome and Discussion This study has demonstrated that combining Lean and Six Sigma ensures a more effective, robust and flexible process, very much in line with the Agility philosophy. If the Lean concept had been applied on its own, using for example value stream mapping, it probably would have been difficult to achieve the same excellent results. According to McCurry, McIvor and Worldwide Education Ltd (1999), value stream mapping describes the present situation in a system, e.g. lead-time, set-up time, or inventory level. Process variability usually does not emerge from value stream mapping. Even if the last phase in Lean is about perfection, after a while the same excellent result could be reached without applying Six Sigma, albeit after a very long time. A similar tool in Six Sigma is process mapping. The difference is that in Six Sigma an estimation of variability is calculated, using historical data or present data from different periods. If the TQM philosophy had been used (the PDCA methodology), the same excellent results would probably not have been achieved. Six Sigma provides a better framework for project work, offering project members comprehensive training, a clearer structure for implementation, as well as middle-management involvement and a focus on results from senior management. According to the authors, the Six Sigma methodology is suitable for making processes more effective and agile, but when the project is finished the last phase of the Lean concept, Perfection, is more appropriate. This phase includes continuous removal of waste, TPM, visualization, step-by-step improvement, VMS, and self-governing teams. A case study shows improvement over time. Since many products had to be coordinated, variability and hence lead-time increased. Using Six Sigma, both decreased. The Six Sigma project made the process more robust, flexible and agile. A simulated trial demonstrated that a new MINI-LINK family could be introduced into the system without an increase in lead-time. At increased production volumes, introducing an extra shift is not a problem, since the workers are familiar with each other’s routines. This also applies to increased customer demand and/or requests for other MINI-LINK pairs. The process has become more flexible, moving closer to Agile methods. The process has also become more reliable, thanks to the TPM philosophy. The use of visualization, continuous improvement and self-governing teams has also achieved this effect. There has been some criticism, e.g. Dove (1999) and Cusumano (1994), against a dogmatic implementation of Lean, arguing that it will result in decreased flexibility or agility. Cusumano (1994) argues that Just in Time causes stoppages and delays for customers. Using Six Sigma tools and fact-based decisions it is possible to establish whether changed/changing conditions have an impact on a particular process, and how much change this process can take. It has been possible to assess how lean the system can be without causing delays for customers.
16
Further Research In general, transportation and logistics companies have adopted the TQM philosophy, see Andersson et al (2005). There is a huge competitive and profitability potential for companies prepared to adopt certain concepts and methods from Lean and Six Sigma. Further applied research is needed to establish which concepts, structures and tools that are appropriate for large, medium-sized and small logistics companies. Many transportation and logistics-oriented companies are involved in the supply chain, many of them in the same value chain more than one time. The aim is to maximize integration and coordination of all activities and processes across the same supply chain. Related organizations must seek cooperation to make the entire supply chain competitive. More focus is needed on the outcome of practical application of Lean/Six Sigma initiatives, and on achieving a better understanding of what concept to apply in a specific situation. Also, communication and collaboration between companies who are TQM-oriented, Lean or Sigma oriented, or mixed, should be further studied.

17
References Andersson, R., H. Eriksson and H. Torstensson (2004), Similarities and Differences between TQM, Six Sigma and Lean. Selected Papers from the 7th Int. QMOD Conf., Monterrey Andersson, R., M. Fredriksson and H. Torstensson (2005), Reducing Logistic Variations by Quality Management. Selected Papers from the 8th Int. QMOD Conf., Palermo Bergman, B. and B. Klefsjö, (2003), Quality from Customer Needs to Customer Satisfaction, Studentlitteratur, Lund Cusumano, M.A. (1994), The Limits of Lean, Sloan Management Review, vol. 35, no. 4, pp. 27-32. Dahlgaard, J. J. and S. M. P. Dahlgaard (2001), Lean Production, Six Sigma Quality, TQM and Company Culture. A critical review, International Quality Symposium, Shanghai Dove, R. (1999), Knowledge Management: Response Ability and the Agile Enterprise, Journal of Knowledge Management, vol. 3, no. 1 Eckes, G. (2001), The Six Sigma Revolution, John Wiley and Sons, New York George, M.L. and S.A. Wilson (2004), Conquering Complexity in Your Business, McGraw-Hill, New York Klefsjö, B., H. Wiklund, and R.L. Edgeman, (2001), Six Sigma Seen as a Methodology for Total Quality Management, Measuring Business Excellence, vol 5 no 1, pp. 31-35 Henderson, K. and J. Evans (2000), Successful Implementation of Six Sigma. Benchmarking General Electric Company, Benchmarking and International Journal, vol. 7 no 4, pp. 260-81 Martichenko, R. (2004), Lean Six Sigma Logistics, Logistics Quarterly, vol. 10 no. 1 McCurry L. and R.T. McIvor (2001), Agile Manufacturing, 21st Century Strategy for Manufacturing on the Periphery? Irish Academy of Management Conference, University of Ulster Magnusson, K., D. Kroslid and B. Bergman (2003), Six Sigma. The Pragmatic Approach, Studentlitteratur, Lund Pascal, D. (2002), Lean Production Simplified, Productivity Press, New York Pyzdek,T. (2003), The Six Sigma Handbook, McGraw-Hill, New York

18
Schrage, M. (2004), The Struggle to Define Agility, CIO Magazine, August 15, 2004. Sörqvist, L. (2004), Ständiga förbättringar, Studentlitteratur, Lund Worldwide Education Ltd. (1999), The Lean Toolbox, Quest Worldwide, UK.
Paper III
Andersson, R., M. Fredriksson and H. Torstensson (2005), Reducing logistic variations by quality techniques, Conference proceedings, Vol 1, 8th International QMOD Conference, Palermo, pp 457-464.


1
Reducing Logistic Variations by Quality Management
Roy Andersson, Maria Fredriksson and Håkan Torstensson
University College of Borås
[email protected]; [email protected]; [email protected]
ABSTRACT
Today’s companies strive to be focused on customers and to be quality leaders. The decisive factor is the company’s ability to execute the key business processes and fulfil the customers’ expectations. However, many companies suffer from shortfalls in their logistics. Efficient logistics management requires that unpredictable variations and uncertainties are minimized, that unnecessary complexity of logistic structures, systems and processes is avoided and that the information flow is managed in a constructive way. Simple quality concepts and tools, such as the seven basic tools, are used rather frequently in this context. There is however a great and to a large extent unexploited potential in applying advanced quality management, in particular the Six Sigma toolbox, to the problem of logistic variations and complexity.
The present paper is an introduction to the application of quality concepts and quality management philosophy in a logistic supply or demand chain framework. Results from a case study within a number of transport- and logistics-oriented companies, regarding the interfaces and interaction between quality management and logistics management are presented and conclusions drawn about the pros and cons of an integrated quality/logistics approach. Further research will include cost-effectiveness considerations and adaptability criteria for the application of quality concepts to managing logistic uncertainty and variation.
1 BACKGROUND
Management, according to Stoner et al. (1995) is the process of planning, organizing, leading and controlling the resources and the work of the members of the organization in order to reach the common goal. Huczynski (1995) is one of the authors discussing key management theories. Huczynski (1995) call the different examples of key management theories an “idea family”. He states that the central assertion in the idea family is that the only object of business is to compete with others for the “favours of the customer as King”. How can enterprises be more competitive then?
1.1 Leanness and agility in logistics Today, logistics has become a major factor for enterprises to become more competitive, and at the same time the logistics development has adopted several of the quality concepts. The lean manufacturing concept addresses many logistics processes and functions relating to ’waste’ of lead times, inventory stock, timeliness of deliveries etc. Recently also agility has become a vision for the development of logistics – agility here means the ability to respond to ever-changing conditions, or as it has been defined, the ‘ability to thrive in a time of uncertain, unpredictable and continuous change’ (Dove, 1999). Another quite attractive definition can be added (Schrage, 2004): ‘Agility means never having to say you’re sorry’.
Lean principles have become well established in logistics, providing elements like the following: − Integrated flow in small batches, − Just-in-time delivery, which leads to a low inventory − A pull rather than a push function throughout the supply chain (thereby creating a ‘demand
flow’)

2
− Close integration from material supplier to customer through partnership − Simplified information flow and processing
There has also been criticism that strict application of lean principles will induce a lack of flexibility (Dove, 1999) and that just in time deliveries actually cause congestion and thus delays for the customer (Cusumano, 1994).
Agility is in a way a vaguer concept, but crucial elements are the following (Sheridan, 1996): − Receptivity to changes in the business environment − Rapid formation of alliances − High customization of products and services
A rapid formation of alliances may be effectuated by the so-called virtual supply chain, in which inventory is replaced by information, at least partly.
It has often been suggested that the lean and agile concepts are closely related, as they are founded on the same principles, and that the lean concept will be one stage into the development of agility (the ‘Leagile’ concept). As found by studying literature and verified in sample companies (McCurry et al., 2001), they are however differing in many respects. Agility may be contingency-driven in companies and may be reached in other ways than through lean. Its aim is to prepare the organization to adjust rapidly and efficiently for changes beyond its immediate control, while lean favors large flows, predictable demand, low product variety and otherwise stable conditions. For example, eliminating inventory – one key feature of applying lean concepts – may be counterproductive to the need to respond quickly when sales unexpectedly surge.
1.2 Complexity and variations This brings up the problem of variations. An agile environment will induce variations, complexity and uncertainty in the logistics system, associated with physical and administrative lead times, throughput times, demand quantities, customizing of products, capacity, product quality, transport damage etc. In logistics it is generally advisable to reduce uncertainty and variations (where application of lean principles will contribute), but striving for agility will induce more of them.
Logistic complexity in this context is used as a conceptual term without assigning a precise meaning to it, but where certain aspects can be identified, as a large number of system states, a heterogeneous system, distributed decision-making and uncertainty (Lumsden et al., 1998). For the purposes of this paper complexity is understood as the logistics system being characterized by a degree of variations and uncertainty.
It has been stated (George et al., 2004) that product or service complexity in the number of different tasks is often the greatest creator of non-value added time, that non-value added time is the greatest driver of cost, and that complexity can increase non-value-added time and hence cost more than quality or lead time issues.
The basic approach is then to eliminate complexity customers will not pay for, exploit complexity they will pay for and minimize its cost (George et al., 2004)
Important measures and principles for the control of variations can now be found in modern quality methodologies, such as Six Sigma.
1.3 Six Sigma approach to control logistic complexity
Six Sigma is a management strategy which can be used to improve processes within an organization. Six Sigma is characterized as a method to identify customer requirements and fulfill them without unnecessary variation, using the DMAIC methodology (Define-Measure-Analyze-Improve-Control) and with focus on improving critical process inputs rather than just outputs (sales, profits, etc.). It is supported by a toolbox for quality and statistical analysis.
As an example we can study the order fulfilment process, which is essential in logistics work. It can be described by sub-processes, such as distribution, production, transportation management,
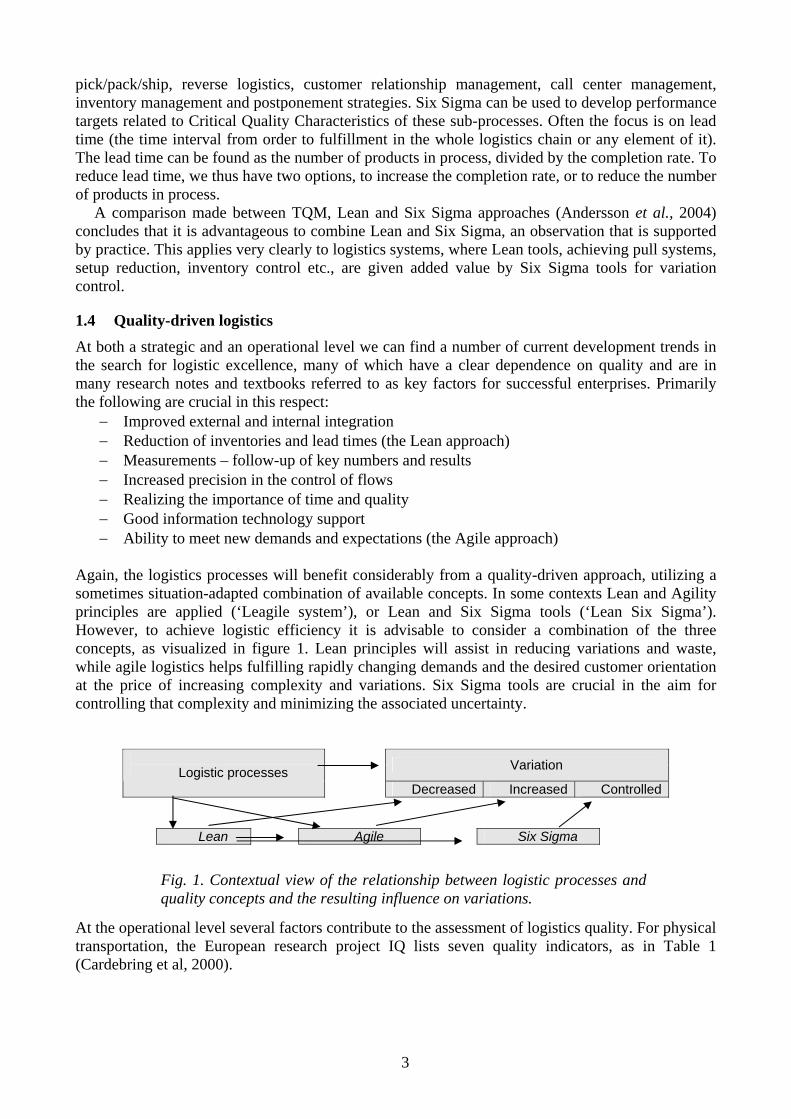
3
pick/pack/ship, reverse logistics, customer relationship management, call center management, inventory management and postponement strategies. Six Sigma can be used to develop performance targets related to Critical Quality Characteristics of these sub-processes. Often the focus is on lead time (the time interval from order to fulfillment in the whole logistics chain or any element of it). The lead time can be found as the number of products in process, divided by the completion rate. To reduce lead time, we thus have two options, to increase the completion rate, or to reduce the number of products in process.
A comparison made between TQM, Lean and Six Sigma approaches (Andersson et al., 2004) concludes that it is advantageous to combine Lean and Six Sigma, an observation that is supported by practice. This applies very clearly to logistics systems, where Lean tools, achieving pull systems, setup reduction, inventory control etc., are given added value by Six Sigma tools for variation control.
1.4 Quality-driven logistics At both a strategic and an operational level we can find a number of current development trends in the search for logistic excellence, many of which have a clear dependence on quality and are in many research notes and textbooks referred to as key factors for successful enterprises. Primarily the following are crucial in this respect:
− Improved external and internal integration − Reduction of inventories and lead times (the Lean approach) − Measurements – follow-up of key numbers and results − Increased precision in the control of flows − Realizing the importance of time and quality − Good information technology support − Ability to meet new demands and expectations (the Agile approach)
Again, the logistics processes will benefit considerably from a quality-driven approach, utilizing a sometimes situation-adapted combination of available concepts. In some contexts Lean and Agility principles are applied (‘Leagile system’), or Lean and Six Sigma tools (‘Lean Six Sigma’). However, to achieve logistic efficiency it is advisable to consider a combination of the three concepts, as visualized in figure 1. Lean principles will assist in reducing variations and waste, while agile logistics helps fulfilling rapidly changing demands and the desired customer orientation at the price of increasing complexity and variations. Six Sigma tools are crucial in the aim for controlling that complexity and minimizing the associated uncertainty.
Variation
Logistic processes Decreased Increased Controlled
Lean Agile Six Sigma
At the operational level several factors contribute to the assessment of logistics quality. For physical transportation, the European research project IQ lists seven quality indicators, as in Table 1 (Cardebring et al, 2000).
Fig. 1. Contextual view of the relationship between logistic processes and quality concepts and the resulting influence on variations.

4
Table 1. Quality indicators in transportation
Indicator Explanation Time focusing on door-to-door transit time Reliability focusing on delays Flexibility focusing on ability to short-term requirements Qualification focusing on staff Accessibility focusing on terminal access for road vehicles and obstacles for
booking and accounting Control focusing on information services on status and position of cargo Security focusing on cargo or transport unit loss or damage
For the purposes of this investigation a number of other factors were added to reflect the needs also of internal logistics, as shown in Table 2. Table 2. Quality factors in operational logistics.
Correct … Reliability Agility Environment time tracking and tracing flexibility mode of transport place stock access frequency packaging consignee absence of damage lead time ‘green’ logistics quantity safety backup resources product security reverse logistics price temperature control information SOPs availability compliance to spec. customer service
1.5 Purpose of the Study However convincing arguments that are brought forward regarding the importance of logistic excellence for competitiveness and bottom-line results, it is often found that enterprises do not take advantage of this: ‘Although the tools are very powerful from both Lean and Six Sigma, we do, however, need to remember that for Lean and Six Sigma to work in logistics, a fundamental mind shift must occur’ (Martichenko, 2004). That leads to the purpose of the study which is to analyze the preparedness of organizations for quality-driven logistics.
2 METHODOLOGY AND WORK PROCESS
The research purpose of this study is to explore and describe how representatives in regional logistic enterprises work with quality concepts, and if they are prepared for quality-driven logistics. A qualitative study is designed to correspond with the qualitative paradigm assumptions, because the research questions and the studied object are in the domain of social phenomena. In addition a case-study strategy is chosen, because, according to Yin (1994), case studies can be used in order to describe, explore, and explain a phenomenon.
Here the single-case study is about if, and how regional logistics enterprises work with quality concepts, which also is the unit of analysis. In the study attention is given to one subunit in particular, i.e. representatives for managers in the companies.
Primary data has been gathered by the researchers in this study and telephone interviews have been performed. This data collecting method has been used because the respondents could not be directly observed by the researchers. It also allowed better control of the questioning. The telephone interviews were semi-structured and the questions were sent to the respondents in advance before the interview.
In this thesis a qualitative research strategy, abduction and case studies are chosen, and the empirical material consists mainly of pieces of texts from interviews. The general analytic approach
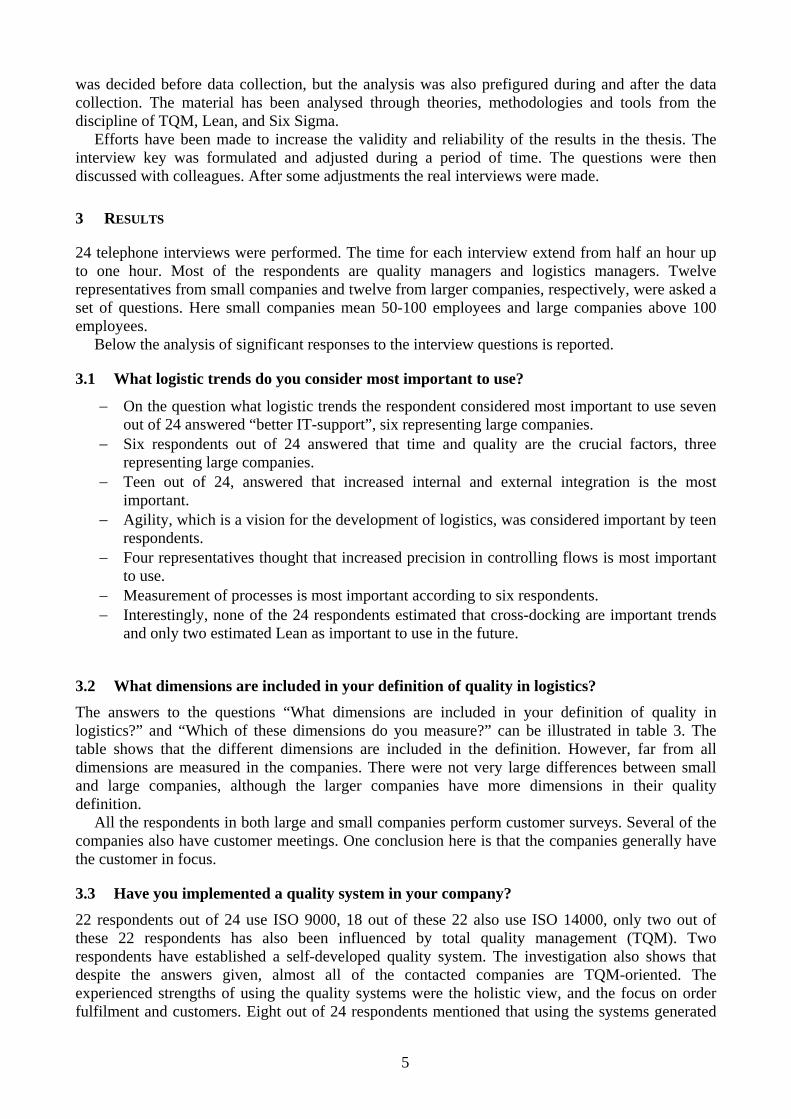
5
was decided before data collection, but the analysis was also prefigured during and after the data collection. The material has been analysed through theories, methodologies and tools from the discipline of TQM, Lean, and Six Sigma.
Efforts have been made to increase the validity and reliability of the results in the thesis. The interview key was formulated and adjusted during a period of time. The questions were then discussed with colleagues. After some adjustments the real interviews were made.
3 RESULTS
24 telephone interviews were performed. The time for each interview extend from half an hour up to one hour. Most of the respondents are quality managers and logistics managers. Twelve representatives from small companies and twelve from larger companies, respectively, were asked a set of questions. Here small companies mean 50-100 employees and large companies above 100 employees.
Below the analysis of significant responses to the interview questions is reported.
3.1 What logistic trends do you consider most important to use?
− On the question what logistic trends the respondent considered most important to use seven out of 24 answered “better IT-support”, six representing large companies.
− Six respondents out of 24 answered that time and quality are the crucial factors, three representing large companies.
− Teen out of 24, answered that increased internal and external integration is the most important.
− Agility, which is a vision for the development of logistics, was considered important by teen respondents.
− Four representatives thought that increased precision in controlling flows is most important to use.
− Measurement of processes is most important according to six respondents. − Interestingly, none of the 24 respondents estimated that cross-docking are important trends
and only two estimated Lean as important to use in the future.
3.2 What dimensions are included in your definition of quality in logistics?
The answers to the questions “What dimensions are included in your definition of quality in logistics?” and “Which of these dimensions do you measure?” can be illustrated in table 3. The table shows that the different dimensions are included in the definition. However, far from all dimensions are measured in the companies. There were not very large differences between small and large companies, although the larger companies have more dimensions in their quality definition.
All the respondents in both large and small companies perform customer surveys. Several of the companies also have customer meetings. One conclusion here is that the companies generally have the customer in focus.
3.3 Have you implemented a quality system in your company? 22 respondents out of 24 use ISO 9000, 18 out of these 22 also use ISO 14000, only two out of these 22 respondents has also been influenced by total quality management (TQM). Two respondents have established a self-developed quality system. The investigation also shows that despite the answers given, almost all of the contacted companies are TQM-oriented. The experienced strengths of using the quality systems were the holistic view, and the focus on order fulfilment and customers. Eight out of 24 respondents mentioned that using the systems generated

6
too much bureaucracy. 17 companies mentioned the advanced of using a quality system, it will be structure and regular works. Table 3. Summary of replies to the questions “What dimensions are included in your definition of quality in logistics?” and “Which of these dimensions do you measure?”
Dimension Is included in our definition
Is measured in our company
Delivery just in time 24 17 Delivery to the correct place 22 11 Nicely treated 19 12 Information about delays 23 11 Delivery to correct consignee 20 10 Correct delivery quantity 21 13 Delivery of the right product 16 7 Delivery with the correct condition 22 13 Delivery to the right price 18 10 Delivery with readable label and correct information
14 5
Inbound logistics 10 4 Right transportation 14 4 Proper packing 12 4 Correct transaction 15 9 Correct lead time 14 6 Delivery with high frequency 8 2 Store availability 8 3 Flexibility 18 3 Support in case of unforeseeable events 15 3 Traceability 18 4 Access to customer service dialogue 13 5 Green transportation 10 6 Access to special transportation 15 3 Return logistics 16 4 Defined procedures and work instructions 17 6 Simple routines for ordering 16 5
3.4 What is the most difficult part when implementing a quality system?
Some respondents refrained from answering this question, for those who gave an answer, eleven mentioned the most difficult part experienced was changing the company culture.
3.5 What do you focus on in your improvement programme? The study shows another interesting observation:
− 17 out of 24 companies put the customer in focus, − 19 are process-oriented, − 24 companies work with continuous improvements, − 18 out of ten companies let everyone be committed. − Only four companies base their decision on facts when deciding what improvement project
should start. These are the five cornerstones in TQM (Bergman and Klefsjö 2003). One question concerned who in the company who suggests improvement. 18 respondents said that all personnel can suggest improvements, only one company answered that the improvement starts in order to fulfil the company objectives. Three respondents answered that improvements are continuously dealt with during department meetings.
7
When improvement projects are performed the focus is on customer, just three respondent focused on minimizing variations in processes, and just one focused on removing waste. One conclusion made here is that almost all the companies approach TQM and not Lean or Six Sigma.
3.6 What quality management tools have you used the last 12 months? The large companies used more quality management tools than the small ones. Benchmarking is used regularly by the majority of the companies. The specific advanced statistical tools in Six Sigma and the analytical tools in Six Sigma and Lean are not used. A few of the companies use simulation tools.
Most of the transportation and logistics companies use the framework of the ISO systems. In the current version of the ISO 9000 system it has approached the TQM concept. Therefore most of the transportation and logistics companies can be described as being TQM-oriented in its core values, methodologies and tools.
4 CONCLUSIONS
To sum up the conclusions from the preceding chapters it has been demonstrated by theory and otherwise established practice that there is a great potential in using the process view in Six Sigma, i.e., reducing variations in processes, and the concept in Lean, i.e. improving flow in processes and also to use the more specific tools in these two quality concepts, see also Andersson et al. (2004). However, it is indicated by this investigation that the quote by Martichenko (2004) ‘…for Lean and Six Sigma to work in logistics, a fundamental mind shift must occur…’ is to a large extent correct and that in most enterprises this mind shift has not yet occurred.
Nevertheless there is at a certain level an awareness of the importance of quality management, which results in the adoption of the ISO 9000 system, and by which the transportation and logistics companies can be described as being TQM-oriented in its core values, methodologies and tools. The results do not clarify whether this is generated by a thorough understanding of the potential of total quality management and its enhancement of the logistics processes and functions, or it merely is about getting a ready-made package because customers demand an ISO certificate, although they can be interpreted as incorporating elements of both. The importance of being customer-oriented is at any case well recognized. The core of supply chain management, internal and external integration, is also acknowledged by a majority of the respondents.
The benefits of applying Lean-Agile-Six Sigma principles are to large extent unexploited by the enterprises, however. The reasons for this remain to be analyzed – one reason may be ignorance – but there may also be concerns about the adaptability of them and the cost-effectiveness of implementation. Further research is planned to address these items.
8
REFERENCES Andersson, R., H. Eriksson & H. Torstensson (2004), Similarities and Differences between TQM, Six Sigma and Lean, Selected Papers from the 7th Int. QMOD Conf., Monterrey, Mexico. Bergman, B. & B. Klefsjö, (2003), Quality from Customer Needs to Customer Satisfaction, Studentlitteratur, Lund. Cardebring P.W., R. Fiedler, Chr. Reynaud & P. Weaver (2000), Analysing Intermodal Quality; a key step toward enhancing intermodal performance and market share in Europe, TFK Transportforschung GmbH, Hamburg. Cusumano, M.A. (1994), “The limits of Lean”, Sloan Management Review, vol. 35, n. 4, pp. 27-32. Dove, R. (1999), “Knowledge management: Response ability and the agile enterprise”, Journal of Knowledge Management, vol. 3, no. 1. George, M.L. & S.A. Wilson (2004), Conquering Complexity in Your Business, McGraw-Hill. Huczynski, A.A. (1995), Management Gurus – What makes them and how to become one, Int. Thomson Business Press, London. Lumsden, K., L. Hultén & J. Waidringer (1998), Outline for a conceptual framework on complexity in logistic systems, 10th NOFOMA conference, Helsinki, June 1998. Martichenko, R. (2004), Lean Six Sigma Logistics, Logistics Quarterly, vol. 10, n. 1. McCurry L. & R.T. McIvor (2001), Agile manufacturing: 21st century strategy for manufacturing on the periphery?, Irish Academy of Management Conference, Univ. of Ulster, Sept. 2001. Sheridan, J.H. (1996), “Where is the agility game plan? (Agile manufacturing at General Motors)”, Industry Week, vol. 245, n. 14, pp 50-51. Schrage, M. (2004), The Struggle to Define Agility, CIO Magazine, Aug 15, 2004. Yin, R.K. (1994), Case Study Research – Design and Methods, Sage Publications, London. Stoner, J.A.F., R.E. Freeman & D.R. Gilbert Jr (1995), Management, 6th ed., Prentice-Hall, London.
Paper IV
Andersson, R. and H. Torstensson (2006), A combined quality approach to controlling supply chain risk. Conference proceedings, Vol 1, 9th International QMOD Confer-ence, Liverpool.


1
A combined quality approach to controlling supply chain risk
Roy Andersson & Håkan Torstensson
School of Engineering, University College of Borås, SE-501 90 Borås, Sweden
[email protected]; [email protected] Keywords: Supply chain, risk, lean, six sigma, agility, quality management Category: Research paper ABSTRACT During the last decades, different quality management concepts, including Total Qual-ity Management (TQM), Six Sigma and Lean, have been applied by many different organisations. These concepts can be combined in order to facilitate for organisations to meet and exceed customer expectations in a changing and more competitive world.
Today’s companies strive to be focused on customers and to be quality leaders. The decisive factor is the organization’s ability to execute the key business processes and fulfil the customers’ expectations. However, many companies suffer from short-falls in their logistics management, including the ability to manage risk.
Supply chain risk management has recently received increased interest in research as well as in business. The globalization of supply chains and the trends to outsourc-ing and offshore manufacturing are examples of causes generating new risks. In fact the greatest risks to business continuity can be assumed to derive from the widened supply chain, not least in quick response markets.
Efficient supply chain risk management requires that unpredictable variations and uncertainties are minimized, that unnecessary complexity of logistics structures, sys-tems and processes is avoided and that the risk managed in a constructive way. Simple quality concepts and tools, such as the seven basic tools, are used rather frequently in this context. However, it has been demonstrated in previous articles by the authors that there is a great and to a large extent unexploited potential in applying advanced quality management, in particular the Six Sigma toolbox, to the problem of variation and complexity. Design and agility are key factors, particularly characterized by varia-tion and complexity, in the enterprises’ efforts to control and minimize risk through-out the supply chain. It is shown how they can benefit from a combined Lean/Six Sigma approach, making them more resilient in terms of risk management, agility, collaboration and being led by design and innovation. The findings are supported em-pirically by a case study and on-site interviews.

2
INTRODUCTION AND FRAME OF REFERENCE
Supply Chain Management Today, logistics has become a major factor for enterprises to become more competi-tive, and at the same time several of the quality concepts have contributed to the de-velopment of logistics. Logistics issues are essential in managing the supply chain, including the need to control the risks involved, which has a substantial significance for most companies.
In a supply chain three key business processes can be identified, time to market (TTM), time to cash (TTC) and customer creation and retention (CCR), respectively. TTM is the process for development and improvement of the products and services, TTC is the total materials, information and financial flow and CCT is the process for creation and retention of customers all the way from the very first contact, via after sales, follow up and continuous improvement (Ericsson, 2001).
Supply chain management is an integrative philosophy to integrate and manage these key business processes across the supply chain, and can hence be defined as planning, development, coordination, organisation, integration, control and review of key business process across the supply chain.
Organisations can no longer effectively compete in isolation from their suppliers and customers. Those that will survive are those that can integrate the entire supply chain. It also implies that managers across the supply chain must take interest in each others’ success and work together to make the entire supply chain competitive (Ericsson, 2003).
The prevailing trend among supply chains is to organise in a leaner and more cus-tomer-oriented fashion, as a result of their increasing complexity due to outsourcing and rapidly changing customer needs. They act in an unpredictable and changing world, where natural disasters, terrorism, strikes etc. occur frequently. To be success-ful in the future the supply chain should be market-driven or demand-driven, where the key model is oriented toward virtual networks, information bases and perceived customer value. One important issue is to manage risk; today many organizations are at risk because their response times to demand changes are too long or their supply is disrupted (Ericsson, 2003; Christopher & Peck, 2004).
Recently, the term Lean Six Sigma has been put forward by, for example, George et al. (2004). Specifically, they claim that “Lean Six Sigma helps companies flourish in a new world where customers expect no defects and fast delivery at the minimal cost.” Magnusson et al. (2003) also state that many companies have merged Six Sigma and Lean manufacturing practices.
According to Antonovsky (1987) organisations need to be flexible and resilient because of the supply chain being unpredictable. There are four principles that charac-terize supply chain resilience (Christopher & Peck, 2004):
Figure 1 The concept of supply chain management: Planning, development, coordina-tion, organization, integration, control and review of the TTM,TTC, and CCR proc-
esses from point of origin to point of consumption. Figure from Hilledoft (2006).
TTC
TTM
CCR
Consumers Retailers ManufacturersSuppliers

3
– Risk management culture – Agility – Design and innovation-led (Re-engineering from cost optimizing and bringing
design into the core of the supply chain) – Collaboration
In this context resilience is described as “the ability of the system to return to its original state or move to a new, more desirable state after being disturbed”.
Risk Management Risk and risk management have many definitions, most of which are in broad terms. Christopher & Peck (2004) point out that the most widely cited are usually variance-based. Commonly in risk assessment risk is described as a combination of the prob-ability of an undesired event and the magnitude of its consequences, or, more specifi-cally, the expected value of a set of consequences.
The problems in risk management are often similar to those that are well known in quality management. For example the concern with sources of variation rather than with accurate prediction of any specific risk factor; in all forms of prediction there is an element of chance. Experience indicates that assignable causes of variation can usually be found by statistical tools without undue difficulty, leading to a process with less variation. Arguments for using quality management concepts in risk management have been discussed by Williams et al. (2006): – The importance of differentiating between chance and special causes is basic in
quality management, and yet it seems strangely not pointed out in much risk man-agement.
– The managing by processes can clarify and reduce operational risks. Operational risks are failures related to the internal processes, people, and system or external events. In short, it is when the supply chain fails. This kind of risk is for many or-ganisations the most common form, and is often regarded as the most dangerous, but this kind of risk we feel that quality management experience and expertise is best equipped to handle. Quality management has spent many years developing tools and techniques for this purpose.
– Effective risk management may also require a substantial organisational and cul-tural change. This is also an area in which quality management has developed tools that emphasise better communication and better understanding of complex issues. The causes of variation in new circumstances lie more in people than in processes, or at least as much. Therefore different kinds of tools are needed, and quality management provides those.
Supply Chain Risk Management The challenge of being successful in business today lies in managing, controlling and mitigating the risks through creating a more resilient supply chain. The modern supply chains are probably at greater risk than many of those who manage them recognize (Christopher & Peck, 2004). Organisations are fairly good at managing the risks they know that they are taking. The risks that organisations do not know that they are tak-ing are there because of change, and these risks are increasing in number and magni-tude rapidly. Western organisations have been led in an environment that seldom change and slowly the usual routine of step-by-step change and innovation would be more likely to lead to success than failure, but the more rapid the pace of chance, the more likely failures and mistakes are to occur (Williams et al., 2006). According to an often used model (Mason-Jones & Towill, 1998) there are three types of risk which
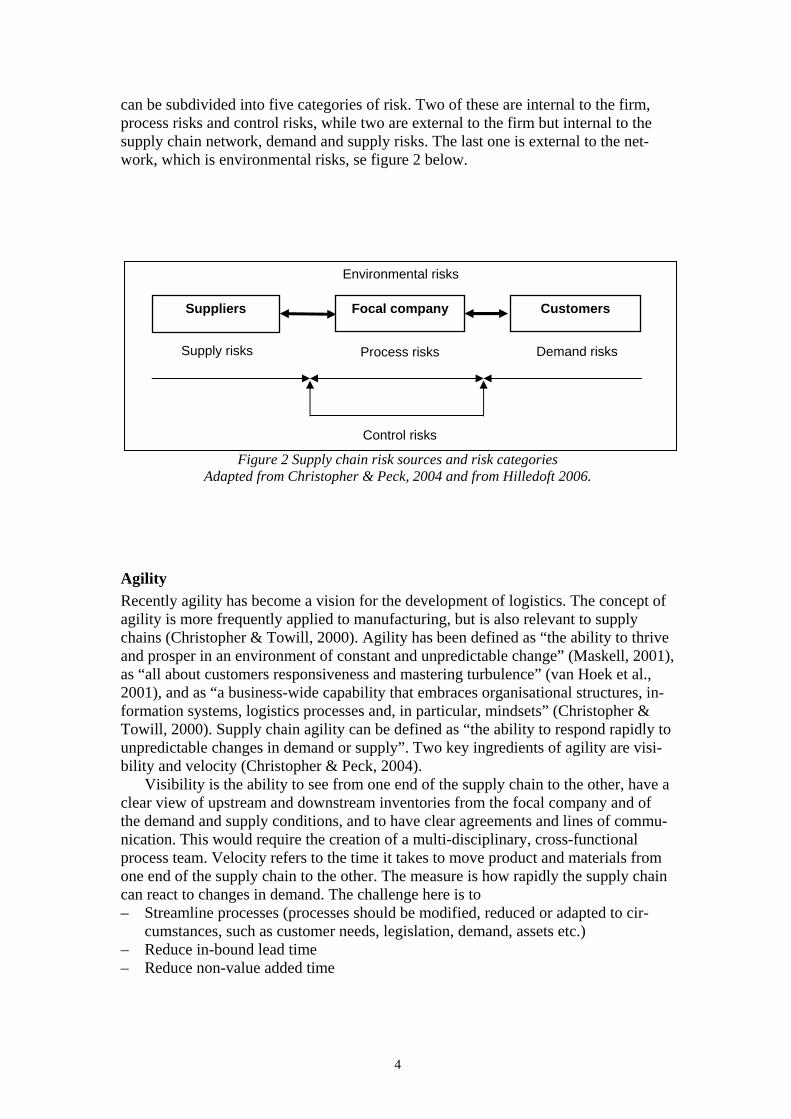
4
can be subdivided into five categories of risk. Two of these are internal to the firm, process risks and control risks, while two are external to the firm but internal to the supply chain network, demand and supply risks. The last one is external to the net-work, which is environmental risks, se figure 2 below.
Figure 2 Supply chain risk sources and risk categories Adapted from Christopher & Peck, 2004 and from Hilledoft 2006.
Agility Recently agility has become a vision for the development of logistics. The concept of agility is more frequently applied to manufacturing, but is also relevant to supply chains (Christopher & Towill, 2000). Agility has been defined as “the ability to thrive and prosper in an environment of constant and unpredictable change” (Maskell, 2001), as “all about customers responsiveness and mastering turbulence” (van Hoek et al., 2001), and as “a business-wide capability that embraces organisational structures, in-formation systems, logistics processes and, in particular, mindsets” (Christopher & Towill, 2000). Supply chain agility can be defined as “the ability to respond rapidly to unpredictable changes in demand or supply”. Two key ingredients of agility are visi-bility and velocity (Christopher & Peck, 2004).
Visibility is the ability to see from one end of the supply chain to the other, have a clear view of upstream and downstream inventories from the focal company and of the demand and supply conditions, and to have clear agreements and lines of commu-nication. This would require the creation of a multi-disciplinary, cross-functional process team. Velocity refers to the time it takes to move product and materials from one end of the supply chain to the other. The measure is how rapidly the supply chain can react to changes in demand. The challenge here is to – Streamline processes (processes should be modified, reduced or adapted to cir-
cumstances, such as customer needs, legislation, demand, assets etc.) – Reduce in-bound lead time – Reduce non-value added time
Environmental risks
Customers Focal company Suppliers
Supply risks Demand risks Process risks
Control risks

5
Lean Six Sigma approach for complexity control and resilience of supply chains The lean manufacturing concept addresses many logistics processes and functions relating to ’waste’ of lead times, inventory stock, timeliness of deliveries etc. Lean principles have become well established in logistics, providing elements like the fol-lowing: – Integrated flow in small batches, – Just-in-time delivery, which leads to low inventory – A pull rather than a push function throughout the supply chain (thereby creating a
‘demand flow’) – Close integration from material supplier to customer through partnerships – Simplified information flow and processing – Rapid changeover of tools and procedures
Strict application of Lean principles may however induce a lack of flexibility (Dove, 1999) and just in time deliveries may cause congestion and thus delays for the customer (Cusumano, 1994). An uncritical application of Lean principles will increase risk, due to subcritical safety stock, quality failures etc.
As discussed in a previous article (Andersson et al. 2005), Lean and Agility con-cepts are closely related and the Lean concept may be one stage into the development of agility (the ‘Leagile’ concept). At the same time they differ in many respects. Agil-ity may be contingency-driven in companies and may be reached in other ways than through Lean. Its aim is to prepare the organization to adjust rapidly and efficiently for changes beyond its immediate control, while Lean favours large flows, predictable demand, low product variety and otherwise stable conditions. For example, eliminat-ing inventory – one key feature of applying Lean concepts – may be counterproduc-tive to the need to respond quickly when sales unexpectedly surge.
An agile environment will induce variations, complexity, risk and uncertainty in the logistics system, associated with physical and administrative lead times, through-put times, demand quantities, customizing of products, capacity, product quality, transport damage etc. In logistics it is generally advisable to reduce uncertainty and variations (where application of Lean principles will contribute), but striving for agil-ity will induce more of them.
A comparison made between TQM, Lean and Six Sigma approaches (Andersson et al., 2004) concludes that it is advantageous to combine Lean and Six Sigma, an ob-servation that is supported by practice. This applies very clearly to logistics systems, where Lean tools, achieving pull systems, setup reduction, inventory control etc., are given added value by Six Sigma tools for variation and risk control.

6
The logistics processes and supply chain risk management will thus benefit con-siderably from a quality-driven approach, utilizing a sometimes situation-adapted combination of available concepts ‘Leagile’, ‘Lean Six Sigma’. However, to achieve logistics efficiency it is advisable to consider a combination of the three concepts, as visualized in figure 3. Lean principles will assist in reducing variations and waste, while agile logistics helps fulfilling rapidly changing demands and the desired cus-tomer orientation at the price of increasing complexity and variations.
Six Sigma tools are crucial in the aim for controlling that complexity and mini-mizing the associated uncertainty. These tools and concepts are thus essential in de-veloping supply chain risk management strategies as well as in daily risk control.
When the process has controlled variation, continuous work with the process in order to monitor and do step-by-step improvements must be done. The last stage in the Lean improvements cycle (perfection) is appropriate for this purpose. This step per-tains to the elimination of non-value-adding elements (waste) and is a process of con-tinuous improvement. “There is no end to reducing time, cost, space, mistakes, and effort” (McCurry et al., 2001). RESEARCH ON INDUSTRIAL CASES
Research questions It has been demonstrated in previous articles by the authors that there is a great and to a large extent unexploited potential in applying advanced quality management, in par-ticular the Six Sigma toolbox, to the problem of variation and complexity. Design, collaboration and agility are key factors, particularly characterized by variation and complexity, in the enterprises’ efforts to control and minimize risks throughout the supply chain. It is shown how they can benefit from a combined Lean/Six Sigma ap-proach. It has also been demonstrated in previous articles by the authors that Six Sigma projects can support agility in the supply chain, which may be very important in order to control business risk (Andersson et al., 2005). The earlier studies lead to the following questions:
Quality-driven logistics
Logistics processes
Lean
Variation and risk
Decreased variation, increased risk
Increased variation and risk
Six Sigma
Agile
Decreased and controlled variation and risk
Fig. 3. Contextual view of the relationship between logistic processes and quality concepts and the resulting influence on variations and risk

7
– Does the experience of other Lean Six Sigma companies confirm the effectiveness of a Lean/Six Sigma approach related to logistics agility and risk readiness and mitigation?
– Are the companies resilient? As noted above this includes being design and inno-vation-led, having adopted agile thinking, having a risk management culture and being collaboration-led. Seven large companies have been investigated, ‘large’ meaning over 500 employ-
ees. All companies use a typical Six Sigma approach, and six of them had started by having a typically Lean approach. Today all of the companies combine Lean and Six Sigma. The findings are supported empirically by on-site interviews and by observa-tions in the companies. On-site interviews and observations were chosen to identify also whether the companies have the same definition as the academy of Six Sigma and Lean. Other criteria were that they have used Six Sigma for at least two years and have run more than ten Six Sigma projects. All the companies accepted to participate in the study.
Reliability and Validity In order to increase the reliability and validity several steps were taken. The questions were first tested on one respondent and then adjusted. The respondents, also called the focal companies, were contacted by phone and agreements on interviews and on-site observations were made. The interviews were recorded and written down, and after-wards the companies had the opportunity to agree to or adjust the answers. RESULTS AND DISCUSSIONS This section is about the results and discussions from the interviews in place and by observations and in the companies.
Six Sigma and Lean in general All the companies in the study started out as typical TQM oriented, after which they introduced Lean, and finally Six Sigma, with the exception of one, which started with a Six Sigma approach without using Lean first. The finding was that the solutions to the problem ends in Lean tools and methodology, for example 5S, standardisation etc. All the companies agree that all problems cannot be solved with the Lean concept. According to the companies the advantages to use Six Sigma compared to only using Lean are the following: – The improvement cycle is more structured, especially the first two steps – The root cause will be found and the problem often disappears – Suppliers and customers are more often involved since the root cause is more of-
ten found outside the focal company – A deeper and wider understanding of the solution to the problems is gained – Decisions are based more on fact, less on blur – More complex situations can be handled – Visualise the prioritization of projects – Benefits from the added focus on variability – Focus is shifted from the results of the processes to the things that affect the re-
sults – Actions are no longer based on a “snap-shot” of the situation – Six Sigma is advanced enough to provide solutions to problems that no one knew
how to begin solving

8
– Increased certainty in achieving result goals – Clearer roles and responsibilities – Reliable measurement system
The last step of the Lean improvement cycle for processes is perfection. This step highlights small steps of continuous improvement and expects participation from all employees. After closing a Six Sigma project it is appropriate to work with this phase. The company Volvo in Skövde has even taken one step further and introduced a lighter Six Sigma improvement cycle in which daily improvements are included. In summary, the following conclusions can be drawn from the seven company inter-views: Six Sigma and Lean always run in parallel. Six Sigma is the problem solving method and Lean assists in governing the everyday work that involves all employees. Six Sigma and its tools help solve the problems that are too advanced for the method of Lean and its tools.
Design and innovation-led According to Andersson et al. (2004) the benefits of Six Sigma address variation and design. In Six Sigma there are two major improvement methodologies, one for already existing processes and one for new processes or products/services. The latter one has as a goal to Design for Six Sigma (DFSS). DFSS introduced a new and more struc-tured methodology for design improvements as well as the design of new processes. The focus is to make the product/service and process robust according to Magnusson et al. (2003). Two of the companies frequently use DFSS, although they do not take into consideration the entire supply chain, so only in some projects suppliers and cus-tomers were present. According to Ericsson AB and Dell, some of the tools that are frequently used are risk management and innovation tools. First you start to investi-gate what consumers really want, after that you investigate what is critical to or what are the risks to customers, processes and compliance. There are a range of tools avail-able to identify risk sources of variation. Ericsson has experiences from more than ten successful DFSS projects where risks were mitigated, managed and monitored, and where the process gets robust and agile. Dell does more than that; they even integrate suppliers and customers in the design phase. Volvo in Gothenburg has also started with DFSS training in 2006, because of the impacts of potential success. Volvo Cars located in Skövde have their own training programme in DFSS, because they realise that being in world-class requires focus on the design and innovation phase.
Collaboration Six Sigma and Lean have a strong focus on processes. The processes often go from the starting point to the end of the supply chain, across the network of companies. To be effective and efficient organizations must collaborate in the supply chain. Success and to work together to make the entire supply chain competitive are important. (Lummus & Vokurka, 1999).
Tomorrow competition will be between supply chains rather than between compa-nies (Ericsson, 2003). The improvement projects in a Six Sigma programme are con-ducted over a wide range of areas and at different levels of complexity. Six Sigma can be applied in several areas, including manufacturing and service industries (Magnus-son et al., 2003). Six Sigma organisations have standardised training courses, ranging from basic courses for White Belts to comprehensive courses for Black Belts. An im-provement project is mandatory here; the authors’ suggestion is to take a Six Sigma

9
approach and have people participate from the entire value chain, and run the project together.
In approximately one third of the Six Sigma projects the root cause of variation was found outside the focal companies. To solve these causes the companies today often invite members from these companies to take part in some meetings, but people are seldom enrolled in the entire project.
The company Parker Hannifin argues that today they have done a lot with Lean and Six Sigma inside the focal organisation. To be effective and efficient in improve-ment work, the next step will be to collaborate with suppliers and customers. Today the company’s suppliers create problems for the focal company. Therefore it is impor-tant to include them in future work.
Volvo Cars located in Skövde collaborates very seldom with suppliers. It is easier to focus on improvement work within the focal company because of the established legitimacy of improvement work.
Experiences from SKF show that there are big advantages to be taken by collabo-rating within the supply chain. For example, the company could not deliver the de-sired amount of the product, depending on its suppliers. The suppliers in turn got defi-cient raw material. SKF then started a Six Sigma project together with the suppliers’ sub-contractors in order to improve the raw material that they supplied. These sub-contractors also deliver to SKF’s competitors. You are not stronger than your weakest link.
Ericsson has collaborated with their customers in a few cases. The customers could decide how they wanted the delivery of the goods. However, they were not in-terested in fast delivery, which implied a more expensive way of transportation. How-ever, Ericsson often collaborates with the machinery suppliers in Six Sigma projects. When there is a fault after delivery it is hard to say where the problem is. For exam-ple, one project together with IBM resulted in a solution which gave a better piece of equipment and the savings were several hundred thousand Euros. Ericsson has now trained two Black Belts who work with suppliers.
Today collaboration in Alfa Laval does not include the entire supply chain. The first step is to include their suppliers. The company has developed a tool-kit for work-ing with suppliers in their Six Sigma project. The last project with a supplier gave a saving of 250 000 Euro.
Dell has control over the entire value chain except for the last delivery to private customers. Often there is a large transportation company responsible for this last step. In this last step there are problems and potential for improvements, according to the authors. Dell has employees at the suppliers’ companies and the suppliers are working in Dell’s factories. The collaboration also includes designing products and processes together with suppliers. Suppliers also participate in Dell’s training programme, which focuses on rapid flows and customer focus.
Risk management culture In six of the companies risk awareness has increased and risk management has been improved. The improvement depends on Six Sigma training programmes and philoso-phy, where the focus is on sources of variation, which influence the result. After these factors are improved, the process will be robust and monitored, and the risks will be minimised.
As a result of one Six Sigma project, Parker Hannifin decided to choose a local supplier after looking all over the world. The decisive factor was the consideration and assessment of risks involved.
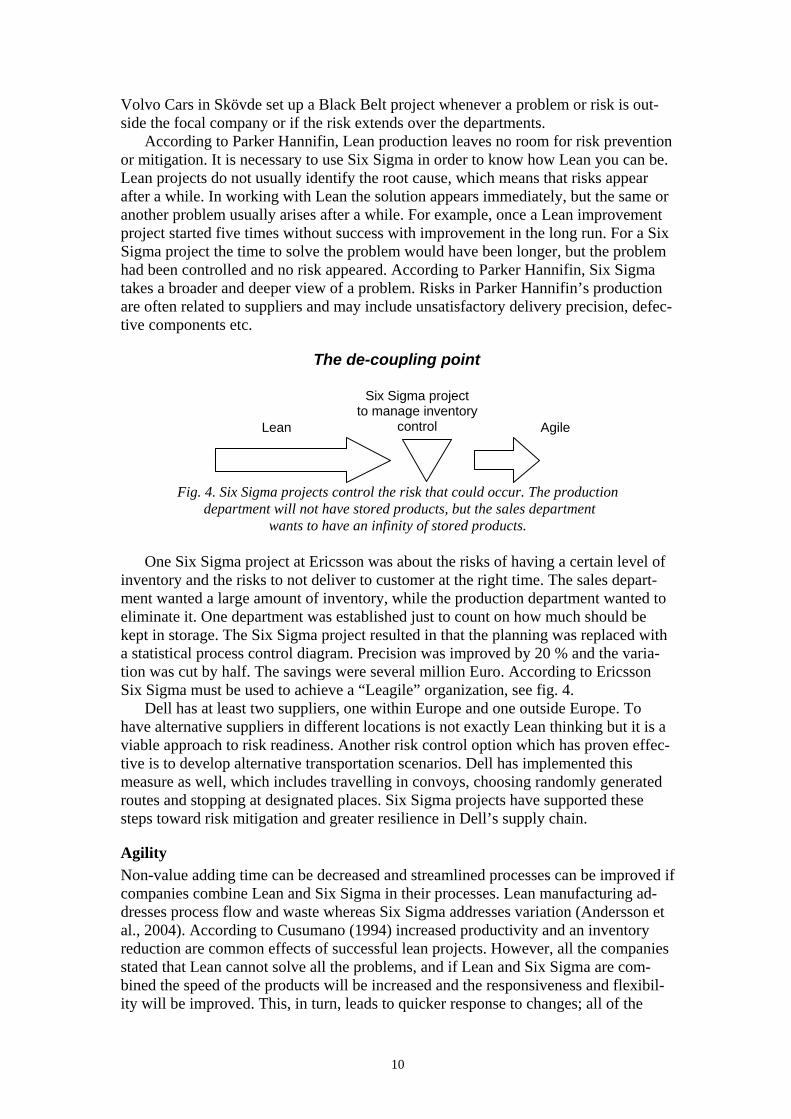
10
Volvo Cars in Skövde set up a Black Belt project whenever a problem or risk is out-side the focal company or if the risk extends over the departments.
According to Parker Hannifin, Lean production leaves no room for risk prevention or mitigation. It is necessary to use Six Sigma in order to know how Lean you can be. Lean projects do not usually identify the root cause, which means that risks appear after a while. In working with Lean the solution appears immediately, but the same or another problem usually arises after a while. For example, once a Lean improvement project started five times without success with improvement in the long run. For a Six Sigma project the time to solve the problem would have been longer, but the problem had been controlled and no risk appeared. According to Parker Hannifin, Six Sigma takes a broader and deeper view of a problem. Risks in Parker Hannifin’s production are often related to suppliers and may include unsatisfactory delivery precision, defec-tive components etc.
Fig. 4. Six Sigma projects control the risk that could occur. The production department will not have stored products, but the sales department
wants to have an infinity of stored products.
One Six Sigma project at Ericsson was about the risks of having a certain level of inventory and the risks to not deliver to customer at the right time. The sales depart-ment wanted a large amount of inventory, while the production department wanted to eliminate it. One department was established just to count on how much should be kept in storage. The Six Sigma project resulted in that the planning was replaced with a statistical process control diagram. Precision was improved by 20 % and the varia-tion was cut by half. The savings were several million Euro. According to Ericsson Six Sigma must be used to achieve a “Leagile” organization, see fig. 4.
Dell has at least two suppliers, one within Europe and one outside Europe. To have alternative suppliers in different locations is not exactly Lean thinking but it is a viable approach to risk readiness. Another risk control option which has proven effec-tive is to develop alternative transportation scenarios. Dell has implemented this measure as well, which includes travelling in convoys, choosing randomly generated routes and stopping at designated places. Six Sigma projects have supported these steps toward risk mitigation and greater resilience in Dell’s supply chain.
Agility Non-value adding time can be decreased and streamlined processes can be improved if companies combine Lean and Six Sigma in their processes. Lean manufacturing ad-dresses process flow and waste whereas Six Sigma addresses variation (Andersson et al., 2004). According to Cusumano (1994) increased productivity and an inventory reduction are common effects of successful lean projects. However, all the companies stated that Lean cannot solve all the problems, and if Lean and Six Sigma are com-bined the speed of the products will be increased and the responsiveness and flexibil-ity will be improved. This, in turn, leads to quicker response to changes; all of the
Lean Agile
The de-coupling point
Six Sigma project to manage inventory
control

11
studied companies also agree that, to reduce in-bound lead time, it is necessary to col-laborate and have cross-functional process teams. It is also important to have explicit agreements and clear communications. Other solutions to quicker response to custom-ers have been introduced through Six Sigma projects: – More manual processes – Small batches – Parallel processes that have more flexibility than big automation cells – More flexibility in rules and routines for the workers – Have an alternative supplier, but always have a main supplier – Store the frequently used product that gives buffer time to handle customers’
changing demands – Work order monitors more often – Collaborate and have more frequent discussions with partners about order quanti-
ties, etc. In a risk perspective, agility means a reduction of the risks for low sell-through and for lost customers, due to the inability to meet the customers’ expectations. The effect of lost customers can be difficult to measure but may be considerable. As mentioned in the introductory chapter, agility implies increased variation, where a Six Sigma ap-proach is useful to control such variations. This is confirmed by the present investiga-tion.

12
CONCLUSIONS It has been demonstrated that a combined Lean/Six Sigma approach improves the companies’ resilience, through to their strengthened ability to handle variability, risk management and agility. Six Sigma has a clear roadmap for designing new products and processes, some of the companies use this roadmap with great success. The next step for the companies is to involve the entire supply chain and take the value chain into consideration. If the companies intend to become more resilient they must involve suppliers and customers more in their own processes and design products and proc-esses together. Moreover, representatives from different parts of the supply chain should co-operate with each other in the Six Sigma approach to training.
It has also been demonstrated that quality management tools can be very effective in the companies’ efforts to control supply chain risk, in some cases with documented substantial savings as a result. In particular Six Sigma projects have been successful in several of the investigated companies for identifying, controlling and mitigating risk in their supply chain. FUTURE RESEARCH Six Sigma organisations often have standardised training courses, ranging from basic courses to comprehensive courses for White Belts to Black Belts. Further research should address how training for people from different organisations within the entire supply chain should be designed and how projects should be run across the compa-nies, but within the value chain.
Research is also needed to find methods to construct roadmaps for project manag-ers where these concepts together with a supply chain risk perspective constitute the basis: understanding the need of the customers, retailers and suppliers; defining the products and services; identifying the interface and how to share data and collaborate.
In the future, different supply chains will compete and not the companies. The challenges will be to design high value-added products/service in the supply/demand chain and bring them quickly and effectively to market. In DFSS, there is a clear roadmap for this purpose, but not for the entire value chain. Future research should address integration of the entire supply chain in this context. More focus is needed on the practical experience of combined Lean/Six Sigma initiatives, and a better under-standing concerning which concept is the most appropriate in different situations.
Moreover, most transport and logistics companies are today TQM-oriented (Andersson et al., 2005). What is the best way to communicate and collaborate when one company is TQM-oriented and the other uses Lean/Six Sigma?
ACKNOWLEDGEMENTS The authors gratefully acknowledge the information and analysis provided by the par-ticipating companies and their representatives, in particular Peter Häyhänen, Peter Manfredsson and Anders Näslid at Ericsson AB, Borås, Sweden, Ragib Sabic and Lasse Jensen at Volvo Cars, Skövde, Sweden; Josefin Johansson at Volvo Cars, Göte-borg, Sweden; Niklas Lövmark and Jonas Mårtensson at Alfa-Laval, Lund, Sweden; Thomas Rundin at Dell, Stockholm, Sweden; Tomas Jonasson and Gert Holgersson at Parker Hannifin, Trollhättan, Sweden, and Michael Jacobson at SKF, Göteborg, Swe-den.
13
REFERENCES Andersson, R., Eriksson, H. & Torstensson, H. 2004, ‘Similarities and Differences between TQM, Six Sigma and Lean’, Selected Papers from the 7th Int. QMOD Conf., Monterrey, Mexico. Andersson, R., Fredriksson, M. & Torstensson, H. 2005, ‘Reducing Logistic Varia-tions by Quality Management’. Selected Papers from the 8th Int. QMOD Conf., Pal-ermo, Italy. Antonovsky, A. 1987, Unravelling the Mystery of Health: How People Manage Stress and Stay Well, Jossey-Bass, San Francisco, CA. Christopher, M. & Towill, D.R. 2000, ‘Supply chain migration from lean and func-tional to agile and customised’, Supply Chain Management: An International Journal, vol. 5 no. 4, pp. 206-13. Christopher, M., & Peck, H. 2004, ‘Building the Resilient Supply Chain’, Interna-tional Journal of Logistics Management, vol. 15, no. 2 Cusumano, M.A. 1994, ‘The limits of Lean’, Sloan Management Review, vol. 35, no. 4, pp. 27-32 Dove, R. 1999, ‘Knowledge management: Response ability and the agile enterprise’, Journal of Knowledge Management, vol. 3, issue 1 Ericsson, D. 2001, ‘Demand Chain Management: Key to Success in the Digital Econ-omy’, Proceedings of Conference on Supply Chain Management, Cranfield Univer-sity, England. Ericsson, D. 2003, ‘Supply/demand chain management: the next frontier for competi-tiveness’, in Walters, D. (ed.), Global Logistics and Distribution Planning, pp. 117-135, Kogan Page, London. George, M.L. & Wilson, S.A. 2004, Conquering Complexity in Your Business, McGraw-Hill Hilletofth, P. (2006). Demand Chain Management - Alignment of Demand Creation and Fulfilment Processes across Functional, Organizational and Inter-organizational Boundaries, Research report, University of Skövde, Sweden. Lummus, R.R. & Vokurka, R.J. 1999, ‘Managing the demand chain through managing the information flow: Capturing moments of information’. Production & Inventory Management Journal, vol. 40, no. 1, pp. 16-20. Magnusson, K., Kroslid, D. & Bergman, B. (2003). Six Sigma. The Pragmatic Ap-proach. Studentlitteratur, Lund Maskell, B. 2001, ‘The age of agile manufacturing’, Supply Chain Management: An International Journal, vol. 6 no. 1, pp. 5-11. Mason-Jones, R. & Towill, D. 1998, ‘Shrinking the Supply Chain Uncertainty Cycle’, Control, Sept. 1998, pp. 17-22. McCurry, L. & McIvor, R.T. 2001, ‘Agile manufacturing: 21st century strategy for manufacturing on the periphery?’, Irish Academy of Management Conference, Univ. of Ulster Van Hoek, R.I., Harrison, A. and Christopher, M. (2001), ‘Measuring agile capabili-ties in the supply chain’, International Journal of Operations & Production Manage-ment, vol. 21 no. 1/2, pp. 126-47.

14
Williams, R., Boudewijn, B., Barrie, D., van der Wiela, T., van Iwaarden, J., Smith, M. & Visser R. 2006, ‘Quality and risk management: what are the key issues?’, The TQM Magazine, vol. 18 no. 1, pp. 67-86

APPENDICES Appendix 1: Questions for study 1 Appendix 2: Questions for study 3 and the participating companies. Appendix 3: Questions for study 4 and the participating companies.


1
Appendix 1: Questions for study 1 Participating Company Ericsson AB

2
Frågor till x (Six Sigma)
Inledning 1. Befattning? 2. Huvudsakliga arbetsuppgifter idag? 3. Hur länge har Du arbetat på Ericsson? I Borås? 4. Hur skulle Du vilja beskriva/definiera Six Sigma? 5. Varför valde Ni att satsa på Six Sigma och inte något annat arbetssätt (TQM, Lean) för
att bedriva ett förbättringsarbete? 6. Kan Du beskriva hur arbetet med Six Sigma startade hos Er, och hur det har fortlöpts
till och med idag? Hur arbetar Ni idag med Six Sigma? Hur ser framtiden ut? 7. Vilka har involverats i arbetet med Six Sigma? Hur många? Utbildning? 8. Vilka verktyg använder Ni i Ert arbete med Six Sigma?
Effekter/ Resultat 9. Vilka effekter och resultat har Ni uppnått med Ert arbete med Six Sigma? 10. Kan Ni ge exempel på några förbättringsprojekt som Ni har genomfört inom ramen för
Six Sigma? Hur mycket har Ni tjänat på förbättringsprojekten? 11. Ungefär hur många projekt har Ni genomfört inom ramen för Six Sigma? 12. Har Ni uppskattat hur mycket Ni har tjänat på att införa Six Sigma? Om Ja, hur mycket
har Ni i sådana fall tjänat? 13. Vilka fördelar har Ert arbete med Six Sigma medfört? 14. Vilka har varit framgångsfaktorerna hos Er för att lyckas med Six Sigma? Svårigheter 15. Vilka problem har Ni stött på när Ni har introducerat Six Sigma i Er organisation? 16. Har det funnits något motstånd inom organisationen när Ni har implementerat Six
Sigma? Hur har det yttrat sig? 17. Vilka nackdelar har Ert arbete med Six Sigma medfört? 18. Vilka typer av projekt har varit svåra att genomföra? 19. Vad skulle ni ha gjort annorlunda ifall Ni hade kunnat göra om Er Six Sigma satsning? 20. Har Ni uppskattat kostnaderna med att implementera och bedriva Six Sigma
programmet hos Er? Om Ja, hur stora är kostnaderna? Övrigt 21. Vilka anser Du skillnaderna är mellan Six Sigma, samt Lean och TQM? 22. Vilka anser Du likheterna är? 23. Anser Du att Six Sigma, Lean och TQM är kompatibla? Om Ja, hur skulle de kunna
komplettera varandra? 24. Övriga kommentarer?

3
Frågor till x (Lean)
Inledning 25. Befattning? 26. Huvudsakliga arbetsuppgifter idag? 27. Hur länge har Du arbetat på Ericsson? I Borås? Arbetssätt 28. Hur skulle Du vilja beskriva/definiera Lean? 29. Arbetar Ni idag med några av principerna som finns i Lean? Om Ja, hur yttrar sig det
arbetet? (Kan Du beskriva hur arbetet med Lean startade hos Er, och hur det har fortlöpts till och med idag? Hur ser framtiden ut gällande Lean hos Er? Vilka har involverats i arbetet med Lean? Hur många? Utbildning? Vilka verktyg använder Ni i Ert arbete med Lean?)
30. Har det funnits något motstånd inom organisationen när Ni har implementerat Six Sigma? Hur har det yttrat sig?
31. Vilka nackdelar har Ert arbete med Six Sigma medfört? Övrigt 32. Vilka anser Du skillnaderna är mellan Six Sigma, samt Lean och TQM? 33. Vilka anser Du likheterna är? 34. Anser Du att Six Sigma, Lean och TQM är kompatibla? Om Ja, hur skulle de kunna
komplettera varandra? 35. Övriga kommentarer?
Frågor till x (Six Sigma) Inledning
36. Befattning? 37. Huvudsakliga arbetsuppgifter idag? 38. Hur länge har Du arbetat på Ericsson? I Borås? Arbetssätt 39. Hur skulle Du vilja beskriva/definiera Six Sigma? 40. Varför valde Ni att satsa på Six Sigma och inte något annat arbetssätt (TQM, Lean) för
att bedriva ett förbättringsarbete? 41. Kan Du beskriva hur arbetet med Six Sigma startade hos Er, och hur det har fortlöpts
till och med idag? Hur arbetar Ni idag med Six Sigma? Hur ser framtiden ut? 42. Vilka har involverats i arbetet med Six Sigma? Hur många? Utbildning? 43. Vilka verktyg använder Ni i Ert arbete med Six Sigma? Effekter/ Resultat 44. Vilka effekter och resultat har Ni uppnått med Ert arbete med Six Sigma? 45. Kan Ni ge exempel på några förbättringsprojekt som Ni har genomfört inom ramen för
Six Sigma? Hur mycket har Ni tjänat på förbättringsprojekten? 46. Ungefär hur många projekt har Ni genomfört inom ramen för Six Sigma? 47. Har Ni uppskattat hur mycket Ni har tjänat på att införa Six Sigma? Om Ja, hur mycket
har Ni i sådana fall tjänat? 48. Vilka fördelar har Ert arbete med Six Sigma medfört? 49. Vilka har varit framgångsfaktorerna hos Er för att lyckas med Six Sigma?

4
Svårigheter 50. Vilka problem har Ni stött på när Ni har introducerat Six Sigma i Er organisation? 51. Har det funnits något motstånd inom organisationen när Ni har implementerat Six
Sigma? Hur har det yttrat sig? 52. Vilka nackdelar har Ert arbete med Six Sigma medfört? 53. Vilka typer av projekt har varit svåra att genomföra? 54. Vad skulle ni ha gjort annorlunda ifall Ni hade kunnat göra om Er Six Sigma satsning? 55. Har Ni uppskattat kostnaderna med att implementera och bedriva Six Sigma
programmet hos Er? Om Ja, hur stora är kostnaderna? Övrigt 56. Vilka anser Du skillnaderna är mellan Six Sigma, samt Lean och TQM? 57. Vilka anser Du likheterna är? 58. Anser Du att Six Sigma, Lean och TQM är kompatibla? Om Ja, hur skulle de kunna
komplettera varandra? 59. Övriga kommentarer?
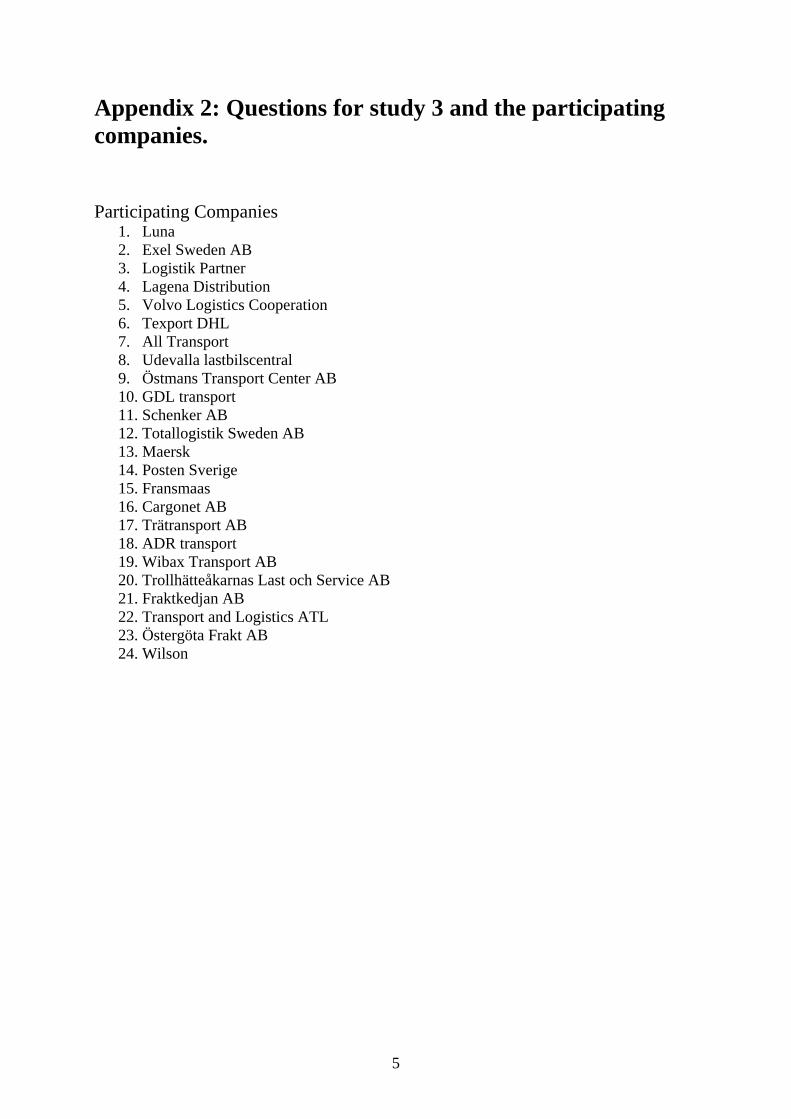
5
Appendix 2: Questions for study 3 and the participating companies. Participating Companies
1. Luna 2. Exel Sweden AB 3. Logistik Partner 4. Lagena Distribution 5. Volvo Logistics Cooperation 6. Texport DHL 7. All Transport 8. Udevalla lastbilscentral 9. Östmans Transport Center AB 10. GDL transport 11. Schenker AB 12. Totallogistik Sweden AB 13. Maersk 14. Posten Sverige 15. Fransmaas 16. Cargonet AB 17. Trätransport AB 18. ADR transport 19. Wibax Transport AB 20. Trollhätteåkarnas Last och Service AB 21. Fraktkedjan AB 22. Transport and Logistics ATL 23. Östergöta Frakt AB 24. Wilson
6
Vill du vara med och utveckla er och svenska företags logistik! Hej xxx! Mitt namn är Roy. Jag är forskarstuderande på Institutionen Ingenjörshögskolan vid Borås högskola. Jag skall kort berätta bakgrunden till mitt ärende. Det pågår ett forskningsprojekt som heter ”Minska variationer inom logistik med kvalitetsledningssystem” vid Ingenjörshögskolan. Arbetet genomförs av forskarstuderande Roy Andersson, inom ramen för hans forskarutbildning. Som en del av forskningsprojektet ingår en kartläggning av användandet av kvalitetsprogram i logistikföretag i Västra Götaland. För att kartlägga användandet, erfarenheter av och synpunkter på kvalitetsprogram delas forskningsarbetet upp i intervjuer av representanter för logistikföretag. Denna undersökning sker med hjälp av telefonintervjuer. Ditt deltagande i undersökningen är mycket viktigt eftersom Din roll som representant för näringslivet är av stor vikt i forskningen om användningen av kvalitetsprogram i logistikföretag. Jag vill fråga Dig får jag intervjua Dig? Får jag bestämma tid med dig för en telefonintervju inom snar framtid? Jag kommer kontakta dig inom 2 veckor! Intervjutiden kan ta 40 minuter och uppåt. Kan jag få adress och telefonnummer om detta skall skickas till någon annan person inom företaget. Eller så kan du förmedla detta brev vidare till lämplig person. [email protected] tel:0705-176911 Tack skall Du ha och på återhörande!

7
Del 1 Inledning Kvinna/man Vilket företag arbetar Du på? _____________________________________________________________________ Vilken position har Du på företaget? _____________________________________________________________________ Vilka logistiktrender ser ni som avgörande att tillämpa? (Sätt ett kryss på respektive påstående max två kryss) Bättre IT stöd Agility (förmåga att anpassa till förändrade krav och förväntningar) Ökad integration, internt och externt Mätning – internt och extern uppföljning av nyckeltal och resultat Lean- Just in time, minska lager och ledtid mm. Ökad precision i styrning av flöde Tid och kvalitet är de mest centrala faktorer ”Cross-dockning” för effektivare spedition (inga lagringspunkter) Övrigt

8
Hur definierar företagen kvalitet och vilka dimensioner ingår i denna definition. Vilka dimensioner ingår i Din definition av logistikkvalitet och vilka av dessa dimensioner mäter ni på ert företag idag? (Här kan Du kryssa i flera svars-alternativ.) Dimensioner Ingår i vår
definition Vi mäter detta idag
a) Leverans i rätt tid b) Leverans på rätt plats c) Trevligt bemötande d) Information om försening skulle inträffa e) Leverans med rätt mottagare f) Leverans med rätt kvantitet g) Leverans med rätt produkt h) Leverans med rätt skick i) Leverans med rätt pris j) Leverans med läsbar etikett och rätt information k) Inleveransförmågan (rätt lagernivå) l) Rätt transportsätt (ej långtradare i ett villaområde) m) Rätt emballage n) Rätt transaktion o) Rätt ledtid p) Högfrekvent leverans q) Lagertillgänglighet r) Flexibilitet (går att ändra fastställd order) (specialanpassningar mot vissa kunder)
s) Uppbacknings möjligheter vid oförutsatta inträffanden t) Spårbarhet (går att följa transporten) u) Tillgång till kundservicesamtal v) Grön transport x) Tillgång till specialtransport (expressorder, säkerhetstransport, temperaturtransport)
y) Retur logistik finns z) Definierade procedurer och arbetsinstruktioner finns å) Enkla orderläggningsrutiner Annat; vad? Annat; vad? Annat; vad? Tar ni reda på kundernas förväntningar? Ja Nej Om ja, Hur tar ni reda på kundernas förväntningar? __________________________________________________________________________________________________________________________________________ _____________________________________________________________________

9
Arbetar logistikföretagen med kvalitetsprogram, allmänna frågor Har ni infört något kvalitetsprogram i ert företag? (Till exempel TQM, Sex Sigma, Lean, ISO, TPM, BRE m fl)
Ja
Om ja, vilket kvalitetsprogram har ni infört?
________________________________________________________________________
________________________________________________________________________
______________________________________________________
Om ja, vad är fördelen med detta program?
________________________________________________________________________
________________________________________________________________________
______________________________________________________
Om ja, vad är nackdelen med detta program?
________________________________________________________________________
________________________________________________________________________
______________________________________________________

10
Om ja, Inom vilka områden har kvalitetsprogrammet införts? (Här kan Du kryssa i flera svarsalternativ.) a) Kundtjänst b) Inköp c) Transport d) Lager e) Produktion f) Produkt/tjänste utveckling g) Marknadsföring h) Övrigt, var __________________________________________________________________________________________________________________________________________
Nej
Om nej, varför har ni inte implementerat ett kvalitetsprogram? (Här kan Du kryssa i flera svarsalternativ.) Brist på mänskliga resurser Brist på ekonomiska resurser Inget incitament eller press att börja Brist på ledningens intresse och engagemang Brist på utbildning och träning Ej ekonomiskt försvarbart Övrigt ____________________________
Vad ser Du som den svåraste delen i ett kvalitetsprogram? (Kryssa i endast ETT svarsalternativ.) a) Ändra företagets kultur b) Etablera ett gemensamt ledningssystem c) Träna och utbilda medarbetare d) Få med ledningens engagemang e) Integrera kvalitetstänkandet i långsiktig planering f) Svårighet att arbeta med processer g) Övrigt, vad ___________________________________________________________________________
_______________________________________________________________

11
Arbetar logistikföretagen med kvalitetsprogram, detaljfrågor Vad fokuseras på i ert förbättringsprogram? (Kryssa i endast ETT svarsalternativ.) 1. Kunden i centrum 2. Inga defekter (minska variationen) 3. Ta bort allt överflöd (slöseri), minska ledtid 4. Övrigt, vad _____________________________________________________________________ Vem i företaget kommer med förbättringsförslag? (Kryssa i endast ETT svarsalternativ.) 1. Alla medarbetare 2. Projekt startas genom att företagets mål skall infrias 3. Ständigt pågående i gruppmötet eller avdelningsmöten 4. Annan, vem? Är ni processorienterade? Ja Nej Om ja, utveckla __________________________________________________________________________________________________________________________________________ Arbetar ni med projektledning? Ja Nej Om ja, utveckla __________________________________________________________________________________________________________________________________________ Hur vet ni att den förbättring ni implementerar är den rätta implementeringen? Baserat på fakta Hur vet ni att rätt projekt startar? Baserat på fakta Tar ni hänsyn till kunders krav i förbättringsprojekt? Ja Nej Om ja, utveckla __________________________________________________________________________________________________________________________________________ Hur fungerar ledningen och chefer inom förbättringsprojekten? (Kryssa i endast ETT svarsalternativ.) 1. Fungerar som en hjälpande hand 2. Är informerade under projektet 3. Är alltid med 4. Övrigt
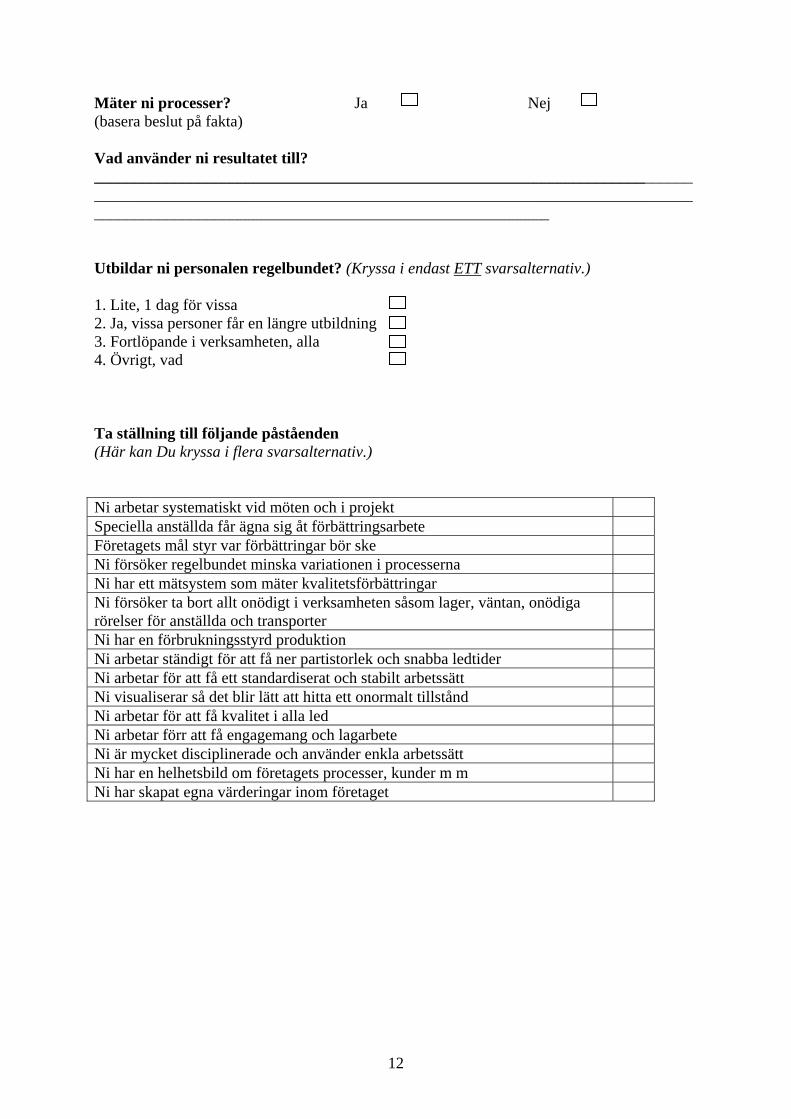
12
Mäter ni processer? Ja Nej (basera beslut på fakta) Vad använder ni resultatet till? _______________________________________________________________________________________________________________________________________________________________________________________________________________ Utbildar ni personalen regelbundet? (Kryssa i endast ETT svarsalternativ.) 1. Lite, 1 dag för vissa 2. Ja, vissa personer får en längre utbildning 3. Fortlöpande i verksamheten, alla 4. Övrigt, vad Ta ställning till följande påståenden (Här kan Du kryssa i flera svarsalternativ.) Ni arbetar systematiskt vid möten och i projekt Speciella anställda får ägna sig åt förbättringsarbete Företagets mål styr var förbättringar bör ske Ni försöker regelbundet minska variationen i processerna Ni har ett mätsystem som mäter kvalitetsförbättringar Ni försöker ta bort allt onödigt i verksamheten såsom lager, väntan, onödiga rörelser för anställda och transporter
Ni har en förbrukningsstyrd produktion Ni arbetar ständigt för att få ner partistorlek och snabba ledtider Ni arbetar för att få ett standardiserat och stabilt arbetssätt Ni visualiserar så det blir lätt att hitta ett onormalt tillstånd Ni arbetar för att få kvalitet i alla led Ni arbetar förr att få engagemang och lagarbete Ni är mycket disciplinerade och använder enkla arbetssätt Ni har en helhetsbild om företagets processer, kunder m m Ni har skapat egna värderingar inom företaget

13
Vilka kvalitetsverktyg använder logistikföretag. Vilka av följande verktyg har ni använt minst två gånger de senaste 12 månaderna för att identifiera och analysera orsaker för att förbättra processer? (Här kan Du kryssa i flera svarsalternativ.)
Flödesschema Boxplott Relationsdiagram Stambladdiagram Pildiagram Stapeldiagram Processbeslutsdiagram Cirkeldiagram Matrisdiagram Paretodiagram Träddiagram Histogram Släktskapsdiagram Sambandsdiagram Ganttdiagram Styrdiagram Spånskiva(Brainstorming) Matrisdataanalys Ishikawadiagram(verkan-orsak diagram,
fiskbensdiagram) Duglighetsstudier
Koncentrationsdiagram Korrelationsanalys Kraftfältsdiagram Regressionsanalys Benchmarking Hypotestester (t-test F-test mm) 5 Varför ANOVA DFMA MANOVA FMEA Sannolikhetsanalys FTA(fel träd analys) VMEA ETA Gage R&R analysis Flaskhallsanalys Robustkonstruktion 5S Conjoint Analys Värdeflödesanalys Faktorförsök Slöserianalys Statistisk försöksplanering SMED(ställtidsreduktion) Simulering Spagetti karta SIPOC Standardiserings formulär CTQ-analysis(Critical to Quality) Kanban Kost-nytta analys Poka Yoke Pugh concept selection TPM, TAK, OEE What if Signaltavlor Radardiagram(spindelnät) Kundundersökningar Kanomodell QFD TRIZ

14
Appendix 3: Questions for study 4 and the participating companies. Participating Companies The authors gratefully acknowledge the information and analysis provided by the participating companies and their representatives, in particular Peter Häyhänen, Peter Manfredsson and Anders Näslid at Ericsson AB, Borås, Sweden, Ragib Sabic and Lasse Jensen at Volvo Cars, Skövde, Sweden; Josefin Johansson at Volvo Cars, Göteborg, Sweden; Niklas Lövmark and Jonas Mårtensson at Alfa-Laval, Lund, Sweden; Thomas Rundin at Dell, Stockholm, Sweden; Tomas Jonasson and Gert Holgersson at Parker Hannifin, Trollhättan, Sweden, and Michael Jacobson at SKF, Göteborg, Sweden.

15
Lathund vid intervjuerna (för mig) Jag är forskarstuderande på Institutionen Ingenjörshögskolan vid Borås högskola……. Det pågår ett forskningsprojekt som heter ”Användning av kvalitetsverktyg för att minska risker inom ”supply/demand chain” genom att använda Sex Sigma och Lean Forskningsfrågan: Är Lean/Sex Sigma företag ”Resilienta” Har du något emot om jag…
• Bandar samtalet • Nämner företaget i rapporten • Jag skickar rapporten till dig innan jag publicerar den, så du kan granska…
Del 1 Inledning Kvinna/man e-post: Vilket företag _____________________________________________________________________ Vilken position har Du på företaget? _____________________________________________________________________ Hur länge har du och ert företag jobbat med…
• Lean • SexSigma • Annat….
_____________________________________________________________________ Vilken utbildning har du? _____________________________________________________________________

16
Del 2 Beskriv ert företag
Vilken ledningsfilosofi har ni och tycker du att ni har detta?
_____________________________________________________________________
Beskriv ert Lean-arbete
_____________________________________________________________________
Beskriv ert SexSigma-arbete
_____________________________________________________________________
Beskriv följande
1. Vem kommer med förbättringsförslag?
2. Antal förbättringsledare
3. Vem leder förbättringarna?
4. Hur många projekt har ni igång? Lean SS
5. Vilka besparingar genererar projekten i snitt?
6. Beskriv skillnaderna mellan de två filosofierna
7. Varför går det inte använda en filosofi
8. Klarar Lean av att nå det optimala tillståndet - har ni tillämpat Lean men det
räcker inte?
9. När är det mest lämpligt att organisera sig enligt Lean versus SexSigma?
10. Hur handskas ni med produktvariation och processvariation?
11. Har ni använt Lean och sett att det inte räcker i någon process?
12. Hur designar ni produkter /processer?
13. Vad händer med processen om ni får in en order som ni inte räknat med?
14. Utvecklar ni robusta processer

17
15. Har ni en viss buffert, för att gardera er när något oförutsätt inträffa
16. Hur går samarbetet till med underleverantörer?
17. Hur vet ni vad kunderna efterfrågar?
18. Lönsamhet bevis!!!! Har du några lyckade förbättringar inom Lean Sex Sigma?
19. Hur hanterar ni oväntade förändringar i kundkrav och efterfrågan?
Del 3
Vad gör ni för att kontrollera och minska riskerna som inträffar bakåt och framåt, inom ”focal company”.
Customers Focal companySuppliers
Supply risks Demand risks Process risks
Environmental risks
Control risks

18
Hur hanterar ni risker inom företaget?
Använder ni några kvalitetsverktyg för att handskas med risker?
1. Leveransmissar
2. Lagernivåer
3. Maskinstillestånd
4. Föråldrade produkter i lager eller inkurans
5. Terroristhot
6. Naturkatastrofer
7. Outsourcingrisker
8. Leverantörsrisker
9. Inleveransrisker
10. Utleveransrisker
11. Hur förberedda är ni att reagera på dessa risker?
12. Verktyg, beredskap mm
13. Hur handskas ni med ”environmental risks”?
14. Hur handskas ni med ”control risk”?
15. Vilken inverkan har design och konstruktion på riskbildning och riskhantering?
16. Vilket sätt använder ni för att fördela risker i värdekedjan?
17. Skulle det vara lämpligt att använde Lean SS inom hela värdekedjan?