quality criteria for the safety assessment of cars …...quality criteria for the safety assessment...
TRANSCRIPT
Quality Criteria for the Safety Assessment of CarsBased on Real-World Crashes
Study of the relationship betweeninjury outcomes in police reported
crash data and crash barrier testresults in Europe and Australia
Report of Sub-Task 2.1/2.2

CEA/EC SARAC II
QUALITY CRITERIA FOR THE SAFETY ASSESSME
OF CARS BASED ON REAL-WORLD CRASHES
Funded by the European Commission,
Directorate General TREN
SARAC II
Quality Criteria for the Safety Assessment of Cars based on Real-World Crashes
Project Number: SUB/B27020B-E3-S07.17321-2002
Report of Sub-Tasks 2.1 and 2.2
Study of the relationship between injury outcomes in police reported crash data and crash barrier test
results in Europe and Australia
Stuart Newstead, Amanda Delaney, Max Cameron and Linda Watson Monash University Accident Research Centre
March 2006


CEA/EC SARAC II
QUALITY CRITERIA FOR THE SAFETY ASSESSME
OF CARS BASED ON REAL-WORLD CRASHES
Funded by the European Commission,
Directorate General TREN
International Project Management Comité Européen des Assurances (CEA)
Prof. Dr. Klaus Langwieder SARAC Members
European Commission (EC)
DG TREN 28 Rue Demot
B-1040 Brussels
Comité Européen des Assurances (CEA) 26 Boulevard Haussmann
FR-75009 Paris
Monash University Accident Research Centre (MUARC)
Building 70, Clayton, 3800 Victoria, Australia
Helsinki University of Technology Laboratory of Transportation Engineering
P.O. Box 2100 FIN-02015 HUT, Finland
BMW Group Vehicle Safety D-80788 München
Bundesanstalt für Straßenwesen (BASt) Brüderstraße 53 D-51427 Bergisch Gladbach
Centro Zaragoza Instituto de Investigación Sobre Reparación de Vehiculos, S.A. Carretera Nacional 232, km 273 E-50690 Pedrola (Zaragoza)
DaimlerChrysler AG D-71059 Sindelfingen
Department for Transport Zone 1/29a Great Minister House 76 Marsham Street London, SW1P 4DR United Kingdom
FIA Foundation for the Automobile and Society 8 Place de la Concorde Paris 75008 France
Ministry of Transport and Communications of Finland P.O. Box 235 FIN 00131 Helsinki
Finnish Motor Insurers’ Centre (VALT) Bulevardi 28, FIN-00120 Helsinki
FOLKSAM Insurance Group Research/Traffic Safety S-106 60 Stockholm
Ford Motor Company Safety Data Analysis (SDA) Automotive Safety Office (ASO) Köln-Merkenich / Spessartstraße D-50725 Köln
German Insurance Association (GDV) German Insurance Institute for Traffic Engineering Friedrichstrasse 191, D-10117 Berlin
Honda Motor Europe Wijngaardveld 1 9300 Aalst Belgium
Insurance Institute for Highway Safety (IIHS) & Highway Loss Data Institute (HLDI) 1005 N. Glebe Road Arlington, VA 22201 USA
ITARDA Institute for Traffic Accident Research and Data Analysis Kojimachi Tokyu Bldg. 6-6 Kojimachi, Chiyoda-ku Tokyo 102-0083 Japan
IVT Heilbronn Institut für Verkehrs- und Tourismusforschung e. V. Kreuzäckerstr. 15 D-74081 Heilbronn
Japanese Automobile Research Institute (JARI) 2530 Karima, Tsukuba Ibaraki 305-0822, Japan
Laboratory of Accidentology, Biomechanics and Human Behaviour PSA Peugeot-Citroën/RENAULT (LAB) 132 Rue des Suisses 92000 Nanterre (France)
Loughborough University Vehicle Safety Research Centre Holywell Building Loughborough Leicestershire LE 11 3 UZ UK
National Organisation for Automotive Safety and Victims Aid (NASVA) 6-1-25, Kojimachi Chiyoda-Ku, Tokyo, 102-0083, Japan
Swedish Road Administration (SRA) Röda Vägen S-78187 Borlange
Technische Universität Braunschweig Institut für Mathematische Stochastik Pockelsstr. 14 D-38106 Braunschweig
Verband der Automobilindustie (VDA) Westendstr. 61 D-60325 Frankfurt/Main
Volkswagen AG
1777 Unfallforschung D-38436 Wolfsburg

CEA/EC SARAC II
QUALITY CRITERIA FOR THE SAFETY ASSESSME
OF CARS BASED ON REAL-WORLD CRASHES
Funded by the European Commission,
Directorate General TREN
Document Retrieval Information
Report No. Date Pages 248 March 2006 241
Title and Subtitle Study of the relationship between injury outcomes in police reported crash data and crash barrier test results in Europe and Australia
Author(s) Newstead S., Cameron M., Delaney A., Watson L.
Performing Organisation Accident Research Centre Building 70 Monash University, 3800, Victoria Australia Sub-Task Participants Pilot: Monash University Accident Research Centre
Sub-contractors: TU Braunschweig
IVT Heilbronn
Helsinki University of Technology
BASt
Advisors: LAB
UK Department for Transport
Ford
VALT
GDV
Observers: IIHS
NASVA
JARI
Abstract The sub-task uses police reported crash data from Great Britain, France and Germany to estimate injury risk and injury severity measures for European vehicles. The relationship between these measures and EuroNCAP test results is evaluated for vehicles tested under the EuroNCAP test program prior to the commencement of the study. In addition, the correlation between EuroNCAP protocol test results and injury outcome in real crash data from Australia and New Zealand was investigated. Sub-task 2.2 extends the analysis of subtask 2.1 by focusing on front impact and side impact police reported crashes. This sub-task aims to evaluate the relationship between EuroNCAP test results and injury outcome in police reported crashes for each of these crash types in Great Britain, France and Australia and New Zealand. Results from each country point to improving average vehicle crashworthiness with increasing EuroNCAP star rating.
Keywords
NEW CAR ASSESSMENT PROGRAM (NCAP), CRASH BARRIER, VEHICLE TESTS, REAL-WORLD DATA, CRASHWORTHINESS, VEHICLE OCCUPANTS, INJURIES, QUALITY SYSTEMS
The views expressed are those of the authors and do not necessarily represent those of CEA, or any of the participants of the SARAC committee.

CEA/EC SARAC II Table of Contents
Table of Contents
EXECUTIVE SUMMARY......................................................................................................................... 1
DATA SOURCES................................................................................................................................. 1
EuroNCAP Test Results .................................................................................................................. 1
Australian ANCAP Test Results ...................................................................................................... 1
British Real Crash Data ................................................................................................................... 2
French Real Crash Data .................................................................................................................. 3
German Real Crash Data ................................................................................................................ 3
Finnish Real Crash Data ................................................................................................................. 4
Australian and New Zealand Real Crash Data................................................................................ 4
Comparison of the European Data Sets.......................................................................................... 5
METHODS........................................................................................................................................... 6
RESULTS ............................................................................................................................................ 7
Real Crash Based Ratings for EuroNCAP Tested Vehicle Models................................................. 7
DISCUSSION .................................................................................................................................... 14
CONCLUSIONS ................................................................................................................................ 15
FUTURE RESEARCH DIECTIONS................................................................................................... 17 1 Introduction.................................................................................................................................. 19 2 Data Sources................................................................................................................................ 19
2.1 BACKGROUND.......................................................................................................................... 19
2.2 EURONCAP TESTED RESULTS................................................................................................. 20
2.2.1 Europe ............................................................................................................................... 20
2.2.2 Australian ANCAP Test Results ........................................................................................ 26
2.3 BRITISH REAL CRASH DATA ...................................................................................................... 28
2.3.1 Identification of Vehicle Models in the British Data ........................................................... 30
2.4 FRENCH REAL CRASH DATA ..................................................................................................... 30
2.4.1 Identification of Vehicle Models in the French Crash Data................................................ 32
2.5 GERMAN REAL CRASH DATA .................................................................................................... 33
2.5.1 Identification of Vehicle Models in the German Data ........................................................ 34
2.6 AUSTRALIAN AND NEW ZEALAND REAL CRASH DATA ................................................................. 34
2.6.1 Identification of Vehicle Models in the Australian and New Zealand Data ........................ 35
2.7 COMPARISON OF THE EUROPEAN DATA SETS............................................................................ 35 3 Methods ........................................................................................................................................ 39
3.1 REAL CRASH BASED VEHICLE SAFETY MEASURES .................................................................... 39
3.1.1 Factors Considered in the Logistic Models for Injury Risk and Injury Severity ................. 41
3.2 METHODS OF COMPARING CRASHWORTHINESS RATINGS WITH EURONCAP SCORES ................... 43
CEA/EC SARAC II
2
4 Results.......................................................................................................................................... 44
4.1 IDENTIFICATION OF EURONCAP TESTED VEHICLE MODELS ....................................................... 44
4.1.1 EuroNCAP Tested Vehicle Models Identified in the British Crash Data............................ 45
4.1.2 EuroNCAP Tested Vehicle Models Identified in the French Crash Data .......................... 48
4.1.3 EuroNCAP Tested Vehicle Models Identified in the German Crash Data......................... 49
4.1.4 EuroNCAP/ANCAP Tested Vehicle Models Identified in the Australian and New Zealand
Crash Data..................................................................................................................................... 52
4.2 VEHICLE SAFETY RATINGS ESTIMATED FROM POLICE REPORTED CRASH DATA.......................... 53
4.2.1 U.K. Data ........................................................................................................................... 53
4.2.2 French Data ....................................................................................................................... 58
4.2.3 German Data ..................................................................................................................... 61
4.2.4 Australian and New Zealand Data..................................................................................... 63
4.3 COMPARISON OF REAL CRASH SAFETY RATINGS AND OVERALL EURONCAP STAR RATINGS ...... 66
4.3.1 British Safety Ratings and Overall EuroNCAP Star Ratings ............................................. 67
4.3.2 French Safety Ratings and Overall EuroNCAP Star Ratings ............................................ 70
4.3.3 German Safety Ratings and Overall EuroNCAP Star Ratings .......................................... 73
4.3.4 Australian and New Zealand Safety Ratings and Overall EuroNCAP Star Ratings.......... 76
4.4 LOGISTIC REGRESSION COMPARISON OF REAL CRASH RATINGS AND OVERALL EURONCAP STAR
RATINGS.............................................................................................................................................. 78
4.4.1 The Influence of Vehicle Mass .......................................................................................... 80
British Relationship between Mass and Vehicle Safety Ratings ................................................... 81
French Relationship between Mass and Vehicle Safety Ratings.................................................. 84
German Relationship between Mass and Vehicle Safety Ratings ................................................ 87
Australian and New Zealand Relationship between Mass and Vehicle Safety Ratings................ 90
4.4.2 Logistic Regression Results- All Crash Types................................................................... 92
British Results................................................................................................................................ 92
French Results............................................................................................................................... 94
German Results............................................................................................................................. 96
Australian and New Zealand Results ............................................................................................ 98 5 Discussion.................................................................................................................................. 105
5.1 SELECTION OF THE MOST RELEVANT AND REPRESENTATIVE ANALYSIS RESULTS...................... 106
5.1.1 Results by Country .......................................................................................................... 106
5.1.2 Different Rating Methods for Police Data ........................................................................ 108
5.1.3 The Role of Vehicle Mass................................................................................................ 110
5.1.4 Summary of Results for Interpretation............................................................................. 110
5.2 SUMMARY OF KEY ANALYSIS OUTCOMES: CONSISTENCIES, DISCREPANCIES AND ROBUSTNESS 111
5.2.1 Overall EuroNCAP and Real Crash Ratings from All Crash Types................................. 111
5.2.2 EuroNCAP results by Test Configuration and Real Crash Ratings by Crash Configuration
113
CEA/EC SARAC II Table of Contents
5.3 COMPARISON WITH SARAC I RESULTS AND OTHER STUDIES .................................................. 114
5.4 CONSEQUENCES OF THE RESULTS.......................................................................................... 115
5.5 FUTURE RESEARCH DIRECTIONS ............................................................................................ 117
5.6 ASSUMPTIONS AND LIMITATIONS ............................................................................................. 118
5.6.1 Assumptions .................................................................................................................... 118
5.6.2 Limitations........................................................................................................................ 119 6 Conclusions ............................................................................................................................... 119 7 Acknowledgments..................................................................................................................... 121 8 References ................................................................................................................................. 121 APPENDIX A....................................................................................................................................... 125 APPENDIX B....................................................................................................................................... 151 APPENDIX C....................................................................................................................................... 165 APPENDIX D....................................................................................................................................... 175 APPENDIX E ....................................................................................................................................... 181 APPENDIX F ....................................................................................................................................... 185 APPENDIX G....................................................................................................................................... 195 APPENDIX H....................................................................................................................................... 205 APPENDIX I ........................................................................................................................................ 213 APPENDIX J ....................................................................................................................................... 229 1 Finnish Real Crash Data ........................................................................................................... 230
1.1 DATA DESCRIPTION................................................................................................................ 230
1.2 IDENTIFICATION OF VEHICLE MODELS IN THE FINNISH DATA ..................................................... 230
1.3 METHOD................................................................................................................................ 232
1.4 RESULTS ............................................................................................................................... 233
1.5 FINNISH INJURY RISK RATINGS AND OVERALL EURONCAP STAR RATINGS............................... 234
8.1 LOGISTIC REGRESSION COMPARISON OF REAL CRASH RATINGS AND OVERALL EURONCAP STAR
RATINGS ............................................................................................................................................ 236

CEA/EC SARAC II EXECUTIVE SUMMARY
1
EXECUTIVE SUMMARY The broad aim of sub-task 2.1 of the SARAC II project was to update a pilot study of the relationship between EuroNCAP test results and injury outcome in police reported crashes in Great Britain and France carried out in SARAC I (Newstead et al, 2001). The sub-task uses updated police reported crash data from Great Britain and France and newly obtained police reported crash data from Germany to estimate injury risk and injury severity measures for European vehicles. The relationship between these measures and EuroNCAP test results was then evaluated for vehicles tested under the EuroNCAP test program prior to the commencement of the study. In addition, the correlation between EuroNCAP protocol test results and injury outcome in real crash data from Australia and New Zealand was investigated.
SARAC II sub-task 2.2 extends the analysis of subtask 2.1 by focusing on front impact and side impact police reported crashes. This sub-task aims to evaluate the relationship between EuroNCAP test results and injury outcome in police reported crashes for each of these crash types in Great Britain, France and Australia and New Zealand. Crash configuration information was unavailable in sufficient detail to enable similar analysis of the German data.
DATA SOURCES
EuroNCAP Test Results
The EuroNCAP Executive supplied EuroNCAP data for use in this study covering all tests completed up to mid 2003. Results supplied from the EuroNCAP program covered the three main test procedures comprising the program. These were the 64km/h 40% offset barrier test, the 50km/h side impact test using 950kg mobile barrier and the pedestrian impact test incorporating leg form to bumper test and head form to bonnet test. Where conducted, the results of the side impact pole test were also supplied. For details of the pole test, see EuroNCAP(2003). Full details of the other EuroNCAP test procedures and protocols are described in Williams (1997). Test results were available for a total of 138 different vehicle models. This is an increase of 73 vehicle models from the time of the pilot study (SARAC I).
Australian ANCAP Test Results
Since 1999, the ANCAP program has adopted a vehicle test and scoring procedure fully harmonised with the EuroNCAP program. The ANCAP data for use in this study using the EuroNCAP protocol was supplied by Michael Paine of Vehicle Design and Research Australia with permission of the Australian NCAP Program Steering Committee. As for EuroNCAP, the ANCAP program uses three main test procedures for vehicle occupant and
CEA/EC SARAC II EXECUTIVE SUMMARY
2
pedestrian protection assessment; the 64km/h 40% offset barrier test, the 50km/h side impact test using 950kg mobile barrier and the pedestrian impact test incorporating leg form to bumper test and head form to bonnet test. Where a suitable head protection device is incorporated in the vehicle and at the request of the manufacture, a side impact pole test is also carried out. Reflecting the harmonisation of the programs, scoring of the test outcomes in ANCAP is also identical to EuroNCAP.
British Real Crash Data
The STATS19 database covering all crashes in Great Britain reported to Police over the period 1993 to 1998 was supplied by the UK Department for Transport (DfT – formerly the Department of Environment, Transport, and the Regions) for use in the pilot study conducted in SARAC I. Full details of that data are provided in Newstead et al, 2001. Additional data, for use in the current project, sub-tasks 2.1 and 2.2, covering police reported crashes in Great Britain for the period 1999 to 2001 was provided by the UK Department for Transport (DfT) in the same format as the earlier data.
Generally, only crashes involving injury are reported to police in Great Britain. Considering the combined data set from 1993 to 2001, and after selecting passenger cars only, complete information for the required variables (driver age, driver sex, junction type, point of impact and speed limit of the crash site) was available for 1,635,296 crashes. Estimation of injury risk using the DfT and Newstead methods considered 973,613 and 546,984 two-car crashes respectively. A total of 775,972 injured drivers were available for analysis of which 159,306 were involved in single vehicle crashes and 616,666 were involved in two-car crashes.
Crashed vehicles with primary impact to specific areas of the vehicle could be identified in the British data using the “1st Point of Impact” variable in the vehicle section of the database. Selecting from the final data set described above, 551,841 and 383,033 crashes were available for use in the estimation of driver injury risk for front impact crashes using the DfT and Newstead methods respectively. Estimation of the injury severity measure for front impact crashes involved the analysis of 411,691 cases. For side impact crashes 129,639 and 66,198 crashes were available for use in the estimation of driver injury risk using the DfT and Newstead methods respectively. Injury severity was estimated from 137,433 injured drivers.
Vehicle models for comparison with EuroNCAP test results were identified in the British crash data through use of the detailed make and model codes appearing in the British data.
CEA/EC SARAC II EXECUTIVE SUMMARY
3
French Real Crash Data
In France, every road accident in which at least one road user received medical treatment is investigated by the police and included in a national database managed by the Ministry of Transportation. The Laboratory of Accidentology and Biomechanics PSA (LAB) in France supplied an extract of the data for use in this project. The data covered accidents occurring from 1993 to 2001 not involving a two-wheeler or pedestrian and including drivers or right front passengers of private cars whose injury outcome is known. Considering the final data set for crashes occurring between 1993 and 2001, 610,118 two-car and single vehicle crashes were identified that contained complete information concerning the variables required for analysis. Estimation of injury risk using the DfT and Newstead methods considered 424,753 and 280,603 two-car crashes respectively. Estimation of injury severity using the MUARC severity measure considered a total of 379,557 injured drivers of which 98,249 were involved in single vehicle crashes and 281,308 were involved in two-car crashes.
Crashed vehicles with primary impact to specific areas of the vehicle could be identified in the French data using the “Point of Initial Impact” variable in the database. Selecting from the final data set described above, 312,945 and 224,732 crashes were available for use in the estimation of driver injury risk for front impact crashes using the DfT and Newstead methods respectively. Estimation of the injury severity measure for front impact crashes involved the analysis of 272,965 cases. For side impact crashes 35,297 and 17,792 crashes were available for use in the estimation of driver injury risk using the DfT and Newstead methods respectively. Injury severity was estimated from 33,253 cases in which driver injury was sustained.
Vehicle models for comparison with EuroNCAP test results were identified in the French crash data through use of the available make and model codes appearing in the data. The data supplied for SARAC I (1993-1998) contained only broad vehicle model classifications. However, the more recent data contains sufficient detail to enable the identification of equivalent EuroNCAP tested models in the French data with a precision much closer to that available when using the British data.
German Real Crash Data
In Germany, every road accident attended by the police must be reported and is recorded in a database held at the German Federal Statistical Office. There are no strict injury criteria for inclusion in the database and accidents involving material damage or slight personal injuries are included where the accident was reported to the police. A copy of this database for the period 1998 to 2002 was supplied to MUARC for use in this study.
CEA/EC SARAC II EXECUTIVE SUMMARY
4
Considering the complete data set for crashes occurring between 1998 and 2002, 804,589 two-car and single vehicle crashes were identified and contained complete information concerning the variables required for analysis. Estimation of injury risk using the DfT and Newstead methods considered 364,939 and 221,132 two-car crashes respectively. Estimation of injury severity considered a total of 273,421 injured drivers involved in either single vehicle or two-car crashes. Information on the primary point of impact on the vehicles was not sufficient to identify front and side impact crashes with certainty. Therefore, analysis of these crash types could not be conducted using the German data.
Vehicle models for comparison with EuroNCAP test results were identified in the German crash data using a method developed by the BAST on the basis of the “HSN” and “TSN” variables describing vehicle make and model that were available in the data.
Finnish Real Crash Data
Finnish insurance data was supplied for use in this study by Helsinki University of Technology. However, there was insufficient data to enable the estimation of vehicle safety ratings with sufficient accuracy for meaningful analysis.
Australian and New Zealand Real Crash Data
Data from four states of Australia and the whole of New Zealand were combined to produce the Australia and New Zealand make and model specific crashworthiness ratings of Newstead et al (2004). The ratings covered drivers of cars, station wagons, four-wheel drive vehicles, passenger vans, and light commercial vehicles manufactured during 1982-2002 and crashing in the Australian states of Victoria and New South Wales during 1987-2002 or the Australian states Queensland and Western Australia during 1991-2002 and in New Zealand during 1991-2002.
Estimation of injury risk using the MUARC method considered 1,070,369 crashes that had complete information for the required variables. Estimation of injury severity using the MUARC severity measure considered 251,269 drivers injured in a crash during 1987-2002. Selecting from the final data set described above, 140,184 crashes were available for use in the estimation of driver injury risk for front impact crashes using the MUARC method. Estimation of the injury severity measure for front impact crashes involved the analysis of 75,478 cases. Injury risk in side impact crashes was estimated using 15,605 cases whilst injury severity in these crashes was estimated from 11,459 injured drivers.
CEA/EC SARAC II EXECUTIVE SUMMARY
5
Vehicle model details in the Australian and New Zealand data were identified using a process of VIN decoding.
Comparison of the European Data Sets
There were a number of fundamental differences between the French, British and German data sources, the most important of which is the segregation of injury levels coded in the reported data. The British data divides injured occupants into those severely injured (hospital admissions and other serious outcomes) and those with minor injuries. In the French data, injured occupants are classified into two groups defined as those staying less than 7 days in hospital and those staying 7 or more days in hospital. Clearly, these injury definitions are incomparable between the two data systems. Detailed criteria for the classification of injuries in the German data have not been provided.
Another apparent difference between the British, French and German databases is the comparative number of vehicle occupants involved in injury crashes that fall into each injury severity level (Table 1).
Table 1. Comparison of British and French Data Injury Level Codes (All Crash Types).
British Injury Level
% of Injured
Drivers at Level
French Injury Level
% of Injured
Drivers at Level
German Injury Level
% of Injured Drivers at Level
Fatal (death < 30 days after crash)
0.4 Killed (death <7 days after crash)
3.0 Killed 0.3
Severely Injured (including any hospital admission and other serious outcomes)
4.7 Severely Injured (>6 Days in hospital)
11.6 Severely Injured
5.3
Slight Injury (injured but not severely)
42.4 Slightly Injured (<7 days in hospital)
47.6 Slightly Injured 28.4
Total Injured 47.5 Total Injured 62.2 Total Injured 34
No Injury 52.5 Uninjured 37.8 Uninjured 66
As a result of the inconsistencies in defining injury severity levels, crash reporting and the differing level of specificity relating to vehicle model identification in the British, French and German databases, parallel rather than combined analysis of the three data sources has been conducted. This approach was also adopted in SARAC 1. Similar outcomes from analysis of the three data sources would serve to confirm the results obtained whilst
CEA/EC SARAC II EXECUTIVE SUMMARY
6
differences in analysis outcomes could be investigated in the context of the differences noted above.
METHODS
Vehicle Safety Measures Based on Real Crashes
The real crash measure estimated is the risk of serious injury (including death) to a vehicle driver given involvement in a crash where at least one person was injured. It is computed as a product of two components, the first being the risk of driver injury given involvement in an injury crash, the second being a risk of serious injury given that some level of injury to the driver was sustained. Separate sets of real crash measures were estimated based on all crash types, frontal impact crashes and crashes to the near (driver's) side of the vehicle. This approach to representing real crash outcomes has been used successfully in previous studies correlating real crashes with NCAP-style barrier crash test results from Australia and the USA.
Two methods of estimating real crash injury risk are used in this study. The first injury risk measure is a modified version of that used by the DfT to estimate vehicle passive safety ratings in the UK and is based on the analysis of crashes between two light passenger vehicles. The second measure of injury risk, denoted the Newstead method, has also been estimated for the three crash groupings considered (all crash types, front impact and side impact crashes) and is described in detail in the SARAC I sub-task 1.6 and 3.4 project reports. It stems from considering the same 2-car crash outcomes on which the DfT injury risk measure is estimated. The injury severity measure is similar to that used by the Monash University Accident Research Centre in producing vehicle safety ratings in Australia and is based on the analysis of both multi vehicle and single vehicle crash outcomes. Both components were estimated using logistic regression analysis, adjusting for the influence of driver sex and age, point of impact on the vehicle, road junction type, and speed limit or level of urbanisation, along with first and higher order interactions between these factors. In addition, estimates of injury severity were adjusted for the number of vehicles involved in the crash. When the two components were multiplied, they represented the risk of serious injury to drivers, a measure commonly used internationally for rating cars in terms of their crashworthiness.
Methods of Comparing Real Crash Injury Measures with EuroNCAP Scores
Preliminary analysis has focused on examining the average crashworthiness ratings derived from the police reported data of vehicles within each overall star-rating category assigned by the EuroNCAP test program. Lie and Tingvall (2000) have used this approach to make basic comparisons of real crash outcomes in Sweden with EuroNCAP test results. Comparison
CEA/EC SARAC II EXECUTIVE SUMMARY
7
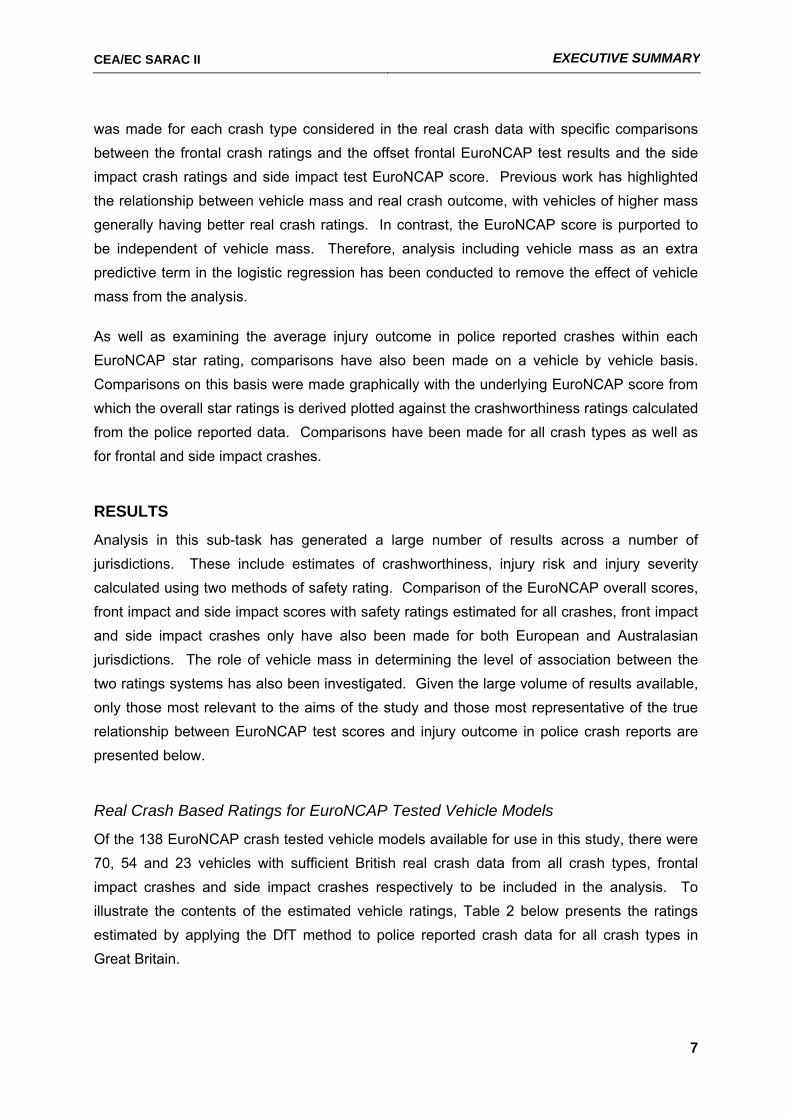
was made for each crash type considered in the real crash data with specific comparisons between the frontal crash ratings and the offset frontal EuroNCAP test results and the side impact crash ratings and side impact test EuroNCAP score. Previous work has highlighted the relationship between vehicle mass and real crash outcome, with vehicles of higher mass generally having better real crash ratings. In contrast, the EuroNCAP score is purported to be independent of vehicle mass. Therefore, analysis including vehicle mass as an extra predictive term in the logistic regression has been conducted to remove the effect of vehicle mass from the analysis.
As well as examining the average injury outcome in police reported crashes within each EuroNCAP star rating, comparisons have also been made on a vehicle by vehicle basis. Comparisons on this basis were made graphically with the underlying EuroNCAP score from which the overall star ratings is derived plotted against the crashworthiness ratings calculated from the police reported data. Comparisons have been made for all crash types as well as for frontal and side impact crashes.
RESULTS
Analysis in this sub-task has generated a large number of results across a number of jurisdictions. These include estimates of crashworthiness, injury risk and injury severity calculated using two methods of safety rating. Comparison of the EuroNCAP overall scores, front impact and side impact scores with safety ratings estimated for all crashes, front impact and side impact crashes only have also been made for both European and Australasian jurisdictions. The role of vehicle mass in determining the level of association between the two ratings systems has also been investigated. Given the large volume of results available, only those most relevant to the aims of the study and those most representative of the true relationship between EuroNCAP test scores and injury outcome in police crash reports are presented below.
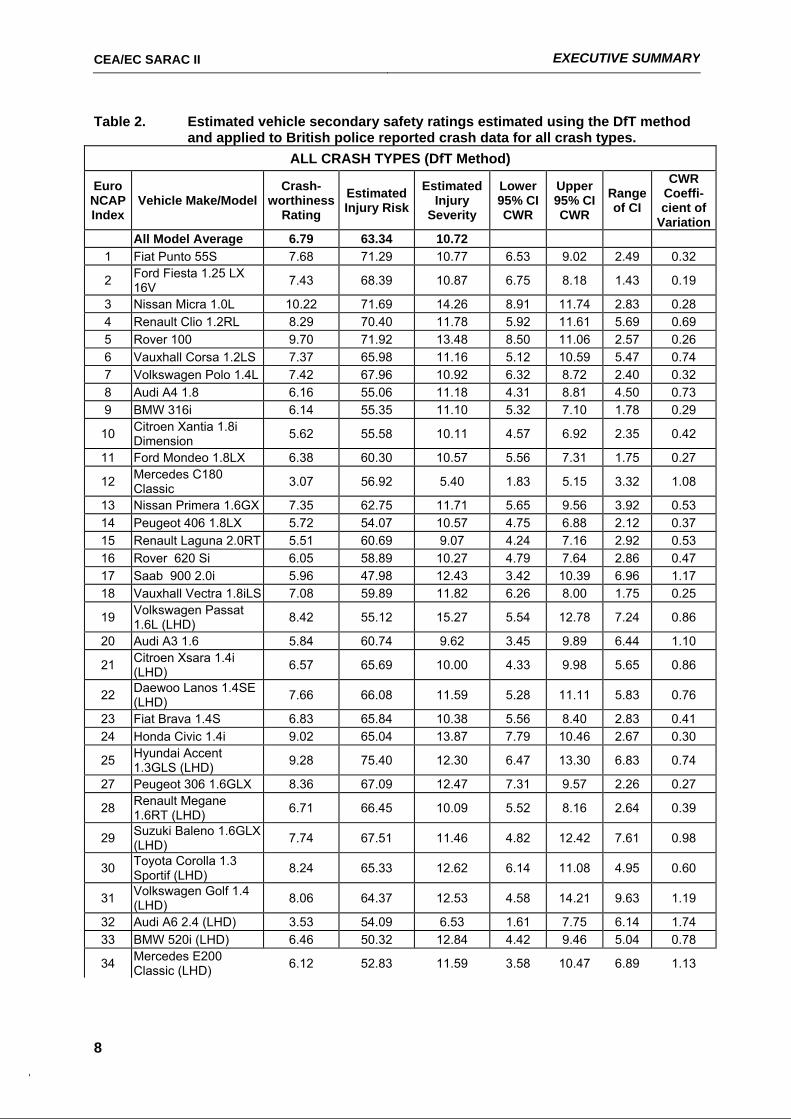
Real Crash Based Ratings for EuroNCAP Tested Vehicle Models
Of the 138 EuroNCAP crash tested vehicle models available for use in this study, there were 70, 54 and 23 vehicles with sufficient British real crash data from all crash types, frontal impact crashes and side impact crashes respectively to be included in the analysis. To illustrate the contents of the estimated vehicle ratings, Table 2 below presents the ratings estimated by applying the DfT method to police reported crash data for all crash types in Great Britain.
CEA/EC SARAC II EXECUTIVE SUMMARY
8
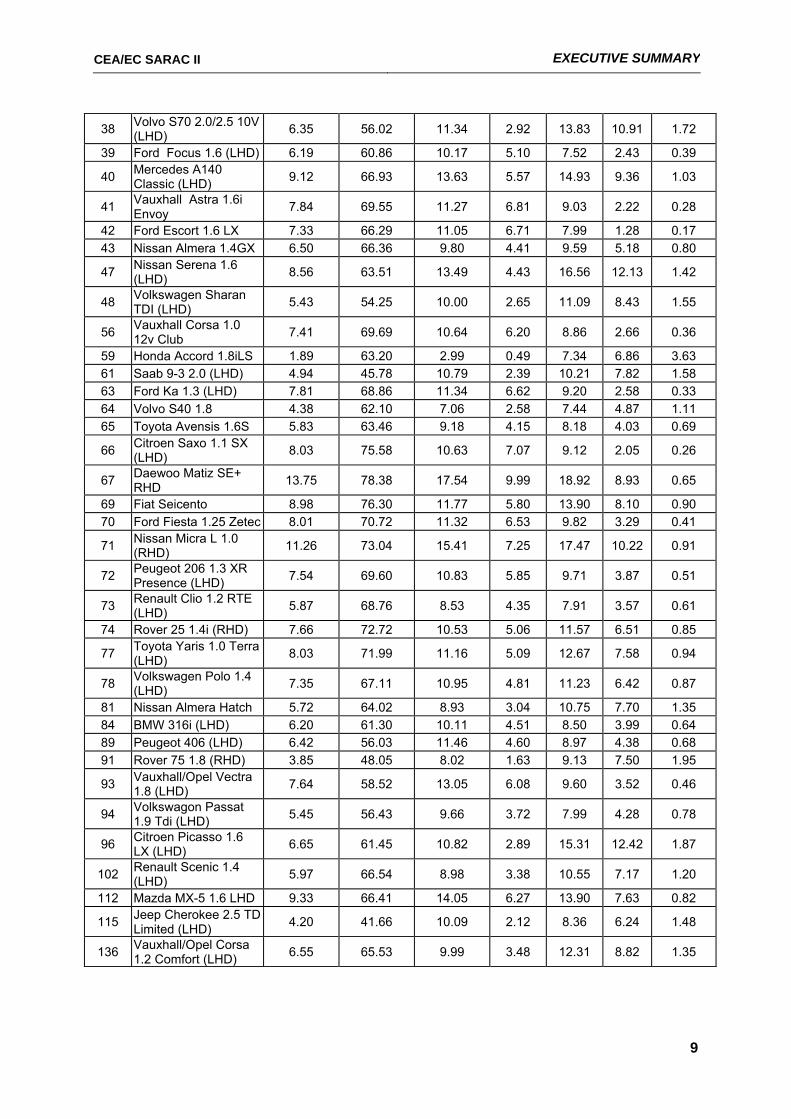
Table 2. Estimated vehicle secondary safety ratings estimated using the DfT method and applied to British police reported crash data for all crash types.
ALL CRASH TYPES (DfT Method)
Euro NCAP Index
Vehicle Make/Model Crash-
worthiness Rating
Estimated Injury Risk
Estimated Injury
Severity
Lower 95% CI CWR
Upper 95% CI CWR
Range of CI
CWR Coeffi-cient of
Variation All Model Average 6.79 63.34 10.72
1 Fiat Punto 55S 7.68 71.29 10.77 6.53 9.02 2.49 0.32
2 Ford Fiesta 1.25 LX 16V 7.43 68.39 10.87 6.75 8.18 1.43 0.19
3 Nissan Micra 1.0L 10.22 71.69 14.26 8.91 11.74 2.83 0.28 4 Renault Clio 1.2RL 8.29 70.40 11.78 5.92 11.61 5.69 0.69 5 Rover 100 9.70 71.92 13.48 8.50 11.06 2.57 0.26 6 Vauxhall Corsa 1.2LS 7.37 65.98 11.16 5.12 10.59 5.47 0.74 7 Volkswagen Polo 1.4L 7.42 67.96 10.92 6.32 8.72 2.40 0.32 8 Audi A4 1.8 6.16 55.06 11.18 4.31 8.81 4.50 0.73 9 BMW 316i 6.14 55.35 11.10 5.32 7.10 1.78 0.29
10 Citroen Xantia 1.8i Dimension 5.62 55.58 10.11 4.57 6.92 2.35 0.42
11 Ford Mondeo 1.8LX 6.38 60.30 10.57 5.56 7.31 1.75 0.27
12 Mercedes C180 Classic 3.07 56.92 5.40 1.83 5.15 3.32 1.08
13 Nissan Primera 1.6GX 7.35 62.75 11.71 5.65 9.56 3.92 0.53 14 Peugeot 406 1.8LX 5.72 54.07 10.57 4.75 6.88 2.12 0.37 15 Renault Laguna 2.0RT 5.51 60.69 9.07 4.24 7.16 2.92 0.53 16 Rover 620 Si 6.05 58.89 10.27 4.79 7.64 2.86 0.47 17 Saab 900 2.0i 5.96 47.98 12.43 3.42 10.39 6.96 1.17 18 Vauxhall Vectra 1.8iLS 7.08 59.89 11.82 6.26 8.00 1.75 0.25
19 Volkswagen Passat 1.6L (LHD) 8.42 55.12 15.27 5.54 12.78 7.24 0.86
20 Audi A3 1.6 5.84 60.74 9.62 3.45 9.89 6.44 1.10
21 Citroen Xsara 1.4i (LHD) 6.57 65.69 10.00 4.33 9.98 5.65 0.86
22 Daewoo Lanos 1.4SE (LHD) 7.66 66.08 11.59 5.28 11.11 5.83 0.76
23 Fiat Brava 1.4S 6.83 65.84 10.38 5.56 8.40 2.83 0.41 24 Honda Civic 1.4i 9.02 65.04 13.87 7.79 10.46 2.67 0.30
25 Hyundai Accent 1.3GLS (LHD) 9.28 75.40 12.30 6.47 13.30 6.83 0.74
27 Peugeot 306 1.6GLX 8.36 67.09 12.47 7.31 9.57 2.26 0.27
28 Renault Megane 1.6RT (LHD) 6.71 66.45 10.09 5.52 8.16 2.64 0.39
29 Suzuki Baleno 1.6GLX (LHD) 7.74 67.51 11.46 4.82 12.42 7.61 0.98
30 Toyota Corolla 1.3 Sportif (LHD) 8.24 65.33 12.62 6.14 11.08 4.95 0.60
31 Volkswagen Golf 1.4 (LHD) 8.06 64.37 12.53 4.58 14.21 9.63 1.19
32 Audi A6 2.4 (LHD) 3.53 54.09 6.53 1.61 7.75 6.14 1.74 33 BMW 520i (LHD) 6.46 50.32 12.84 4.42 9.46 5.04 0.78
34 Mercedes E200 Classic (LHD) 6.12 52.83 11.59 3.58 10.47 6.89 1.13
CEA/EC SARAC II EXECUTIVE SUMMARY
9
38 Volvo S70 2.0/2.5 10V (LHD) 6.35 56.02 11.34 2.92 13.83 10.91 1.72
39 Ford Focus 1.6 (LHD) 6.19 60.86 10.17 5.10 7.52 2.43 0.39
40 Mercedes A140 Classic (LHD) 9.12 66.93 13.63 5.57 14.93 9.36 1.03
41 Vauxhall Astra 1.6i Envoy 7.84 69.55 11.27 6.81 9.03 2.22 0.28
42 Ford Escort 1.6 LX 7.33 66.29 11.05 6.71 7.99 1.28 0.17 43 Nissan Almera 1.4GX 6.50 66.36 9.80 4.41 9.59 5.18 0.80
47 Nissan Serena 1.6 (LHD) 8.56 63.51 13.49 4.43 16.56 12.13 1.42
48 Volkswagen Sharan TDI (LHD) 5.43 54.25 10.00 2.65 11.09 8.43 1.55
56 Vauxhall Corsa 1.0 12v Club 7.41 69.69 10.64 6.20 8.86 2.66 0.36
59 Honda Accord 1.8iLS 1.89 63.20 2.99 0.49 7.34 6.86 3.63 61 Saab 9-3 2.0 (LHD) 4.94 45.78 10.79 2.39 10.21 7.82 1.58 63 Ford Ka 1.3 (LHD) 7.81 68.86 11.34 6.62 9.20 2.58 0.33 64 Volvo S40 1.8 4.38 62.10 7.06 2.58 7.44 4.87 1.11 65 Toyota Avensis 1.6S 5.83 63.46 9.18 4.15 8.18 4.03 0.69
66 Citroen Saxo 1.1 SX (LHD) 8.03 75.58 10.63 7.07 9.12 2.05 0.26
67 Daewoo Matiz SE+ RHD 13.75 78.38 17.54 9.99 18.92 8.93 0.65
69 Fiat Seicento 8.98 76.30 11.77 5.80 13.90 8.10 0.90 70 Ford Fiesta 1.25 Zetec 8.01 70.72 11.32 6.53 9.82 3.29 0.41
71 Nissan Micra L 1.0 (RHD) 11.26 73.04 15.41 7.25 17.47 10.22 0.91
72 Peugeot 206 1.3 XR Presence (LHD) 7.54 69.60 10.83 5.85 9.71 3.87 0.51
73 Renault Clio 1.2 RTE (LHD) 5.87 68.76 8.53 4.35 7.91 3.57 0.61
74 Rover 25 1.4i (RHD) 7.66 72.72 10.53 5.06 11.57 6.51 0.85
77 Toyota Yaris 1.0 Terra (LHD) 8.03 71.99 11.16 5.09 12.67 7.58 0.94
78 Volkswagen Polo 1.4 (LHD) 7.35 67.11 10.95 4.81 11.23 6.42 0.87
81 Nissan Almera Hatch 5.72 64.02 8.93 3.04 10.75 7.70 1.35 84 BMW 316i (LHD) 6.20 61.30 10.11 4.51 8.50 3.99 0.64 89 Peugeot 406 (LHD) 6.42 56.03 11.46 4.60 8.97 4.38 0.68 91 Rover 75 1.8 (RHD) 3.85 48.05 8.02 1.63 9.13 7.50 1.95
93 Vauxhall/Opel Vectra 1.8 (LHD) 7.64 58.52 13.05 6.08 9.60 3.52 0.46
94 Volkswagon Passat 1.9 Tdi (LHD) 5.45 56.43 9.66 3.72 7.99 4.28 0.78
96 Citroen Picasso 1.6 LX (LHD) 6.65 61.45 10.82 2.89 15.31 12.42 1.87
102 Renault Scenic 1.4 (LHD) 5.97 66.54 8.98 3.38 10.55 7.17 1.20
112 Mazda MX-5 1.6 LHD 9.33 66.41 14.05 6.27 13.90 7.63 0.82
115 Jeep Cherokee 2.5 TD Limited (LHD) 4.20 41.66 10.09 2.12 8.36 6.24 1.48
136 Vauxhall/Opel Corsa 1.2 Comfort (LHD) 6.55 65.53 9.99 3.48 12.31 8.82 1.35
CEA/EC SARAC II EXECUTIVE SUMMARY
10
Considering the French real crash data, there were 36, 31 and 5 vehicle models with sufficient real crash data from all crash types, frontal impact crashes and side impact crashes respectively to be included in the analysis. The German crash data supplied provided sufficient data to estimate ratings for the performance of 53 vehicles across all crash types. There was insufficient point of impact information in the German data to enable estimation of ratings for front or side impact crashes only. Finally, there was sufficient Australian and New Zealand real crash data from all crash types, frontal impact crashes and side impact crashes to estimate ratings for 35, 17 and 6 vehicles respectively.
Comparison of Average Real Crash Safety Ratings and Overall EuroNCAP Star Ratings
Logistic Regression Analysis
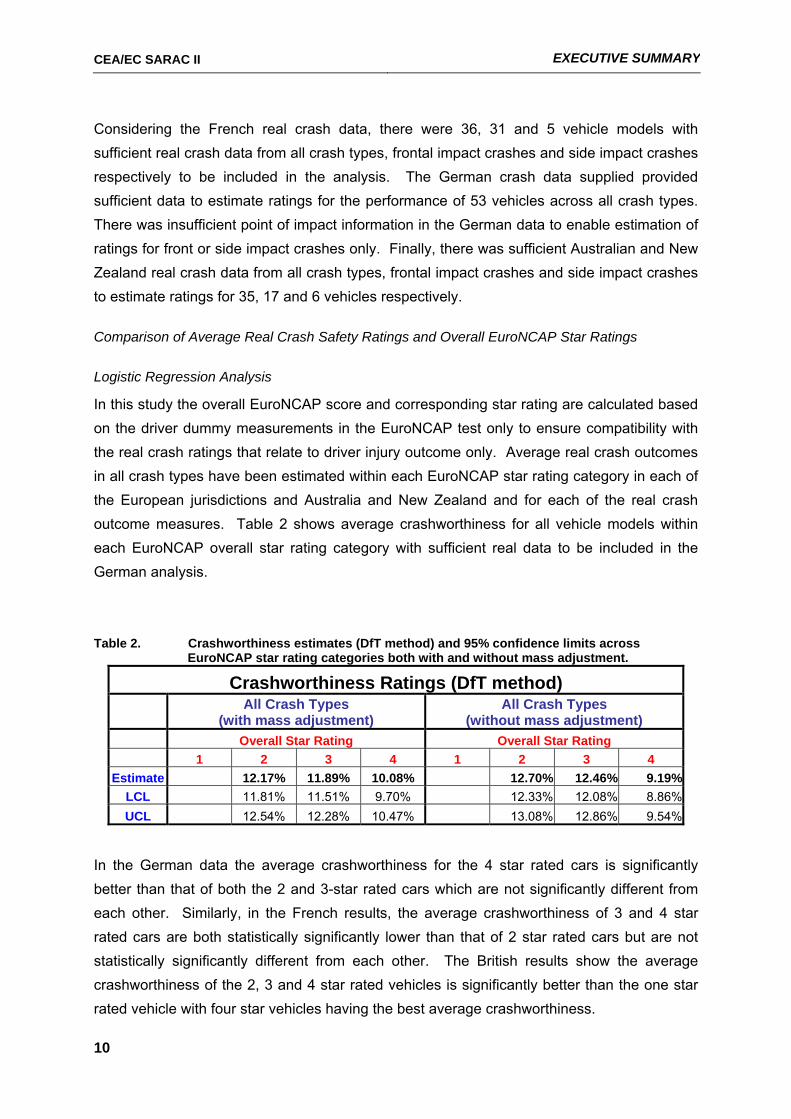
In this study the overall EuroNCAP score and corresponding star rating are calculated based on the driver dummy measurements in the EuroNCAP test only to ensure compatibility with the real crash ratings that relate to driver injury outcome only. Average real crash outcomes in all crash types have been estimated within each EuroNCAP star rating category in each of the European jurisdictions and Australia and New Zealand and for each of the real crash outcome measures. Table 2 shows average crashworthiness for all vehicle models within each EuroNCAP overall star rating category with sufficient real data to be included in the German analysis.
Table 2. Crashworthiness estimates (DfT method) and 95% confidence limits across EuroNCAP star rating categories both with and without mass adjustment.
Crashworthiness Ratings (DfT method)
All Crash Types
(with mass adjustment) All Crash Types
(without mass adjustment) Overall Star Rating Overall Star Rating 1 2 3 4 1 2 3 4
Estimate 12.17% 11.89% 10.08% 12.70% 12.46% 9.19%LCL 11.81% 11.51% 9.70% 12.33% 12.08% 8.86%UCL 12.54% 12.28% 10.47% 13.08% 12.86% 9.54%
In the German data the average crashworthiness for the 4 star rated cars is significantly better than that of both the 2 and 3-star rated cars which are not significantly different from each other. Similarly, in the French results, the average crashworthiness of 3 and 4 star rated cars are both statistically significantly lower than that of 2 star rated cars but are not statistically significantly different from each other. The British results show the average crashworthiness of the 2, 3 and 4 star rated vehicles is significantly better than the one star rated vehicle with four star vehicles having the best average crashworthiness.
CEA/EC SARAC II EXECUTIVE SUMMARY
11
Trends in average crashworthiness and its component measures by EuroNCAP overall star rating derived from the Australian and New Zealand crash data were very different from those measured using the European data sources. No association between average crashworthiness, injury risk or injury severity and EuroNCAP overall star ratings was observed in the Australian and New Zealand data comparisons. There are a number of possible causes for the different outcomes in the Australian and New Zealand analysis, however the exact reasons for the differences are difficult to isolate.
Graphical Analysis
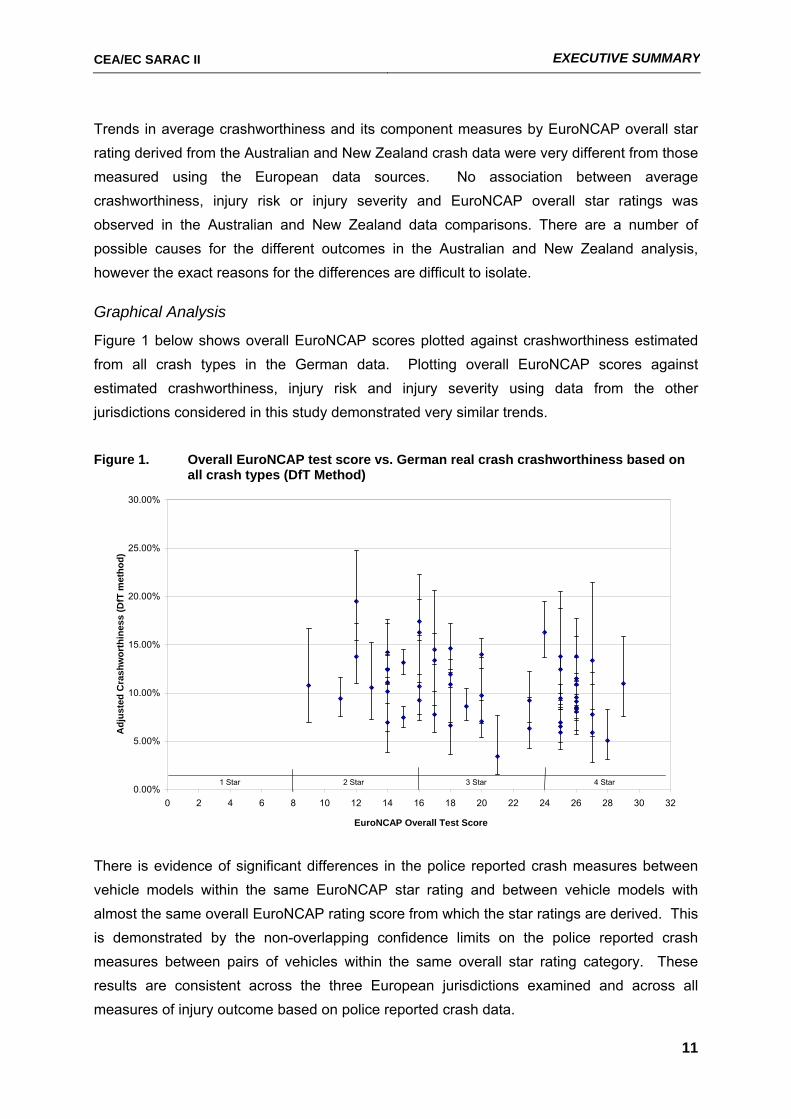
Figure 1 below shows overall EuroNCAP scores plotted against crashworthiness estimated from all crash types in the German data. Plotting overall EuroNCAP scores against estimated crashworthiness, injury risk and injury severity using data from the other jurisdictions considered in this study demonstrated very similar trends.
Figure 1. Overall EuroNCAP test score vs. German real crash crashworthiness based on
all crash types (DfT Method)
0.00%
5.00%
10.00%
15.00%
20.00%
25.00%
30.00%
0 2 4 6 8 10 12 14 16 18 20 22 24 26 28 30 32
EuroNCAP Overall Test Score
Adj
uste
d C
rash
wor
thin
ess
(DfT
met
hod)
1 Star 2 Star 3 Star 4 Star
There is evidence of significant differences in the police reported crash measures between vehicle models within the same EuroNCAP star rating and between vehicle models with almost the same overall EuroNCAP rating score from which the star ratings are derived. This is demonstrated by the non-overlapping confidence limits on the police reported crash measures between pairs of vehicles within the same overall star rating category. These results are consistent across the three European jurisdictions examined and across all measures of injury outcome based on police reported crash data.
CEA/EC SARAC II EXECUTIVE SUMMARY
12
This result suggests there are other factors, apart from those summarised in the overall EuroNCAP score that are determining injury outcomes as reported by police. These other factors are also different from those that have already been compensated for in the estimation of the police reported crash based ratings, such as driver age and sex and speed limit at the crash location.
Whilst differences exist in the results by jurisdiction and according to the real crash measure being considered, analysis of the European data sources tends to support some common conclusions when examining average real crash outcome by EuroNCAP star rating. Results from each country point to improving average vehicle crashworthiness with increasing EuroNCAP star rating. Analysis of the component measures of the crashworthiness metric shows this result stems from an association between average injury severity and overall EuroNCAP star rating and not the injury risk component of the crashworthiness measure. However, there remains significant variation in the measures of injury outcome in real crashes for specific vehicles within each EuroNCAP score category. Therefore, a vehicle with a low crashworthiness or injury severity estimate does not always perform well in EuroNCAP testing and vice versa. This observation is consistent across the results for all countries considered in the study.
Results by Crash Configuration
Due to a lack of information on the point of vehicle impact in the German data, no ratings for specific impact types could be calculated from this data. Subsequently, comparisons by specific crash configurations are focused on the frontal impact results for the French and British data and the side impact results for the British data only.
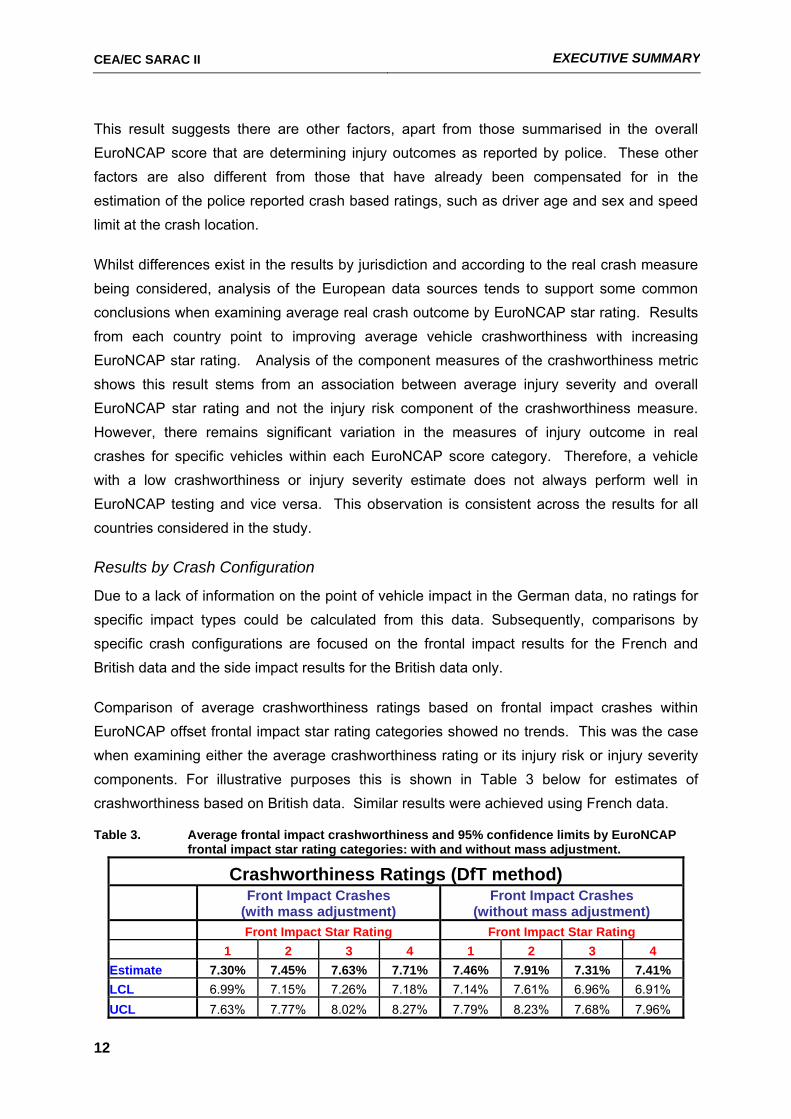
Comparison of average crashworthiness ratings based on frontal impact crashes within EuroNCAP offset frontal impact star rating categories showed no trends. This was the case when examining either the average crashworthiness rating or its injury risk or injury severity components. For illustrative purposes this is shown in Table 3 below for estimates of crashworthiness based on British data. Similar results were achieved using French data.
Table 3. Average frontal impact crashworthiness and 95% confidence limits by EuroNCAP frontal impact star rating categories: with and without mass adjustment.
Crashworthiness Ratings (DfT method)
Front Impact Crashes
(with mass adjustment) Front Impact Crashes
(without mass adjustment) Front Impact Star Rating Front Impact Star Rating 1 2 3 4 1 2 3 4 Estimate 7.30% 7.45% 7.63% 7.71% 7.46% 7.91% 7.31% 7.41% LCL 6.99% 7.15% 7.26% 7.18% 7.14% 7.61% 6.96% 6.91% UCL 7.63% 7.77% 8.02% 8.27% 7.79% 8.23% 7.68% 7.96%
CEA/EC SARAC II EXECUTIVE SUMMARY
13
Overall, these results suggest there is little if any association between the results of the EuroNCAP offset frontal impact test and injury outcomes to drivers in frontal crashes reported to police as measured by crashworthiness estimated using the DfT and Newstead methods.
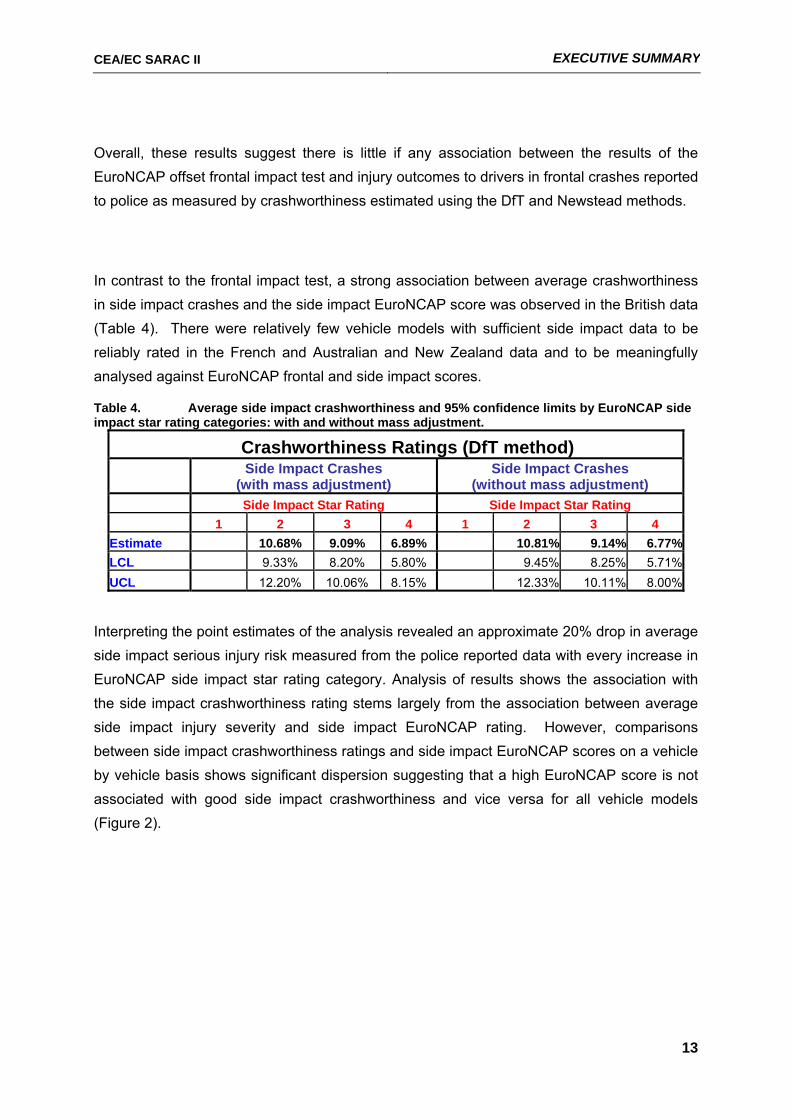
In contrast to the frontal impact test, a strong association between average crashworthiness in side impact crashes and the side impact EuroNCAP score was observed in the British data (Table 4). There were relatively few vehicle models with sufficient side impact data to be reliably rated in the French and Australian and New Zealand data and to be meaningfully analysed against EuroNCAP frontal and side impact scores.
Table 4. Average side impact crashworthiness and 95% confidence limits by EuroNCAP side impact star rating categories: with and without mass adjustment.
Crashworthiness Ratings (DfT method)
Side Impact Crashes
(with mass adjustment) Side Impact Crashes
(without mass adjustment) Side Impact Star Rating Side Impact Star Rating 1 2 3 4 1 2 3 4 Estimate 10.68% 9.09% 6.89% 10.81% 9.14% 6.77%LCL 9.33% 8.20% 5.80% 9.45% 8.25% 5.71%UCL 0.00% 12.20% 10.06% 8.15% 0.00% 12.33% 10.11% 8.00%
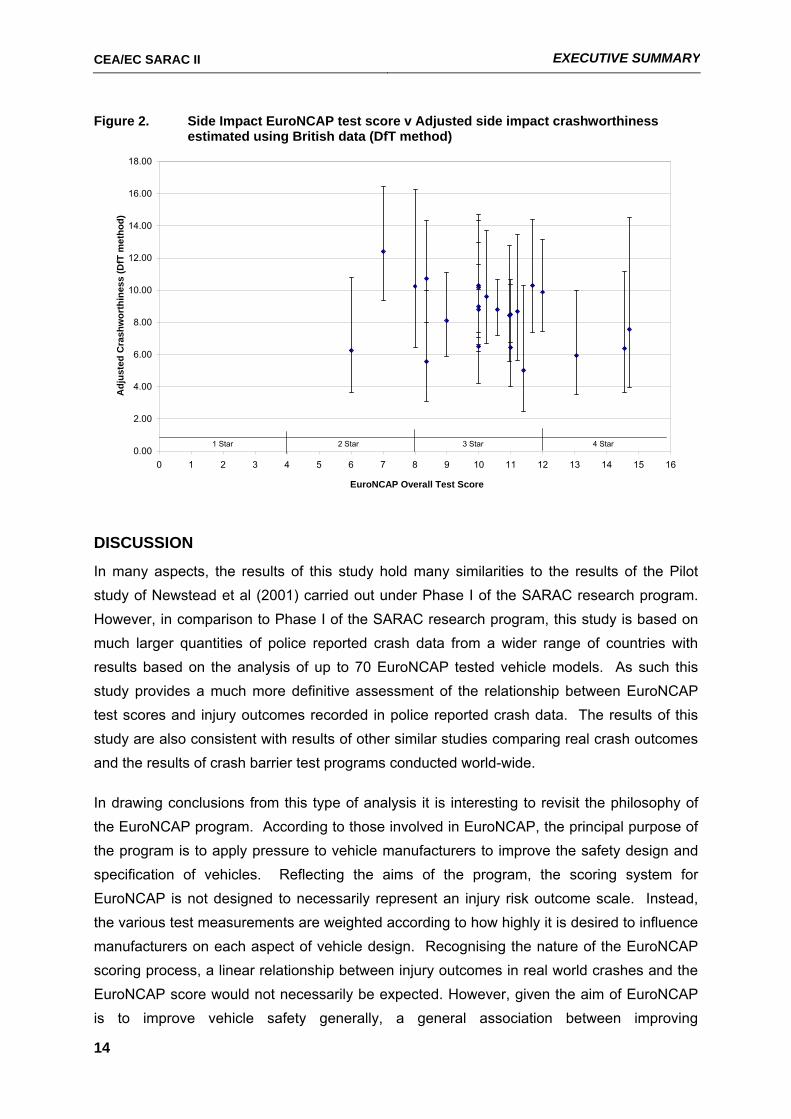
Interpreting the point estimates of the analysis revealed an approximate 20% drop in average side impact serious injury risk measured from the police reported data with every increase in EuroNCAP side impact star rating category. Analysis of results shows the association with the side impact crashworthiness rating stems largely from the association between average side impact injury severity and side impact EuroNCAP rating. However, comparisons between side impact crashworthiness ratings and side impact EuroNCAP scores on a vehicle by vehicle basis shows significant dispersion suggesting that a high EuroNCAP score is not associated with good side impact crashworthiness and vice versa for all vehicle models (Figure 2).
CEA/EC SARAC II EXECUTIVE SUMMARY
14
Figure 2. Side Impact EuroNCAP test score v Adjusted side impact crashworthiness estimated using British data (DfT method)
0.00
2.00
4.00
6.00
8.00
10.00
12.00
14.00
16.00
18.00
0 1 2 3 4 5 6 7 8 9 10 11 12 13 14 15 16
EuroNCAP Overall Test Score
Adj
uste
d C
rash
wor
thin
ess
(DfT
met
hod)
1 Star 2 Star 3 Star 4 Star
DISCUSSION
In many aspects, the results of this study hold many similarities to the results of the Pilot study of Newstead et al (2001) carried out under Phase I of the SARAC research program. However, in comparison to Phase I of the SARAC research program, this study is based on much larger quantities of police reported crash data from a wider range of countries with results based on the analysis of up to 70 EuroNCAP tested vehicle models. As such this study provides a much more definitive assessment of the relationship between EuroNCAP test scores and injury outcomes recorded in police reported crash data. The results of this study are also consistent with results of other similar studies comparing real crash outcomes and the results of crash barrier test programs conducted world-wide.
In drawing conclusions from this type of analysis it is interesting to revisit the philosophy of the EuroNCAP program. According to those involved in EuroNCAP, the principal purpose of the program is to apply pressure to vehicle manufacturers to improve the safety design and specification of vehicles. Reflecting the aims of the program, the scoring system for EuroNCAP is not designed to necessarily represent an injury risk outcome scale. Instead, the various test measurements are weighted according to how highly it is desired to influence manufacturers on each aspect of vehicle design. Recognising the nature of the EuroNCAP scoring process, a linear relationship between injury outcomes in real world crashes and the EuroNCAP score would not necessarily be expected. However, given the aim of EuroNCAP is to improve vehicle safety generally, a general association between improving
CEA/EC SARAC II EXECUTIVE SUMMARY
15
crashworthiness and higher EuroNCAP scores would be expected. Considering the analysis of real crash outcomes as the most suitable way of assessing the effectiveness of the EuroNCAP program in meeting its aims, results of this study confirm this general association with average real crash outcomes being better in vehicles with higher EuroNCAP scores than in ones with low scores. Results also confirm that this association is non-linear as expected.
Interpreted in this way, results of analysis in this study confirm that the design priorities for vehicle safety encouraged by the EuroNCAP scoring process are leading to improved real world crash performance on average. Importantly, comparison of the French and British analysis results in particular, suggest that improvement is greatest in the higher severity real world crashes. However, the results of comparison on a vehicle by vehicle basis also show that achieving these design priorities does not always lead to a safer vehicle. This result suggests that EuroNCAP is not necessarily encapsulating all the factors required to ensure good safety performance in a vehicle. Alternately, it is allowing vehicles to score well on a combination of factors that have relatively low effectiveness in improving real world safety. Whether the EuroNCAP test process can or should be modified to overcome this to some degree remains to be determined.
A lack of absolute consistency between EuroNCAP ratings and crashes based on real world data on a vehicle by vehicle basis is only problematic if ratings from the two systems are presented side by side for consumer information. Fortunately this is rarely possible because of the nature of the ratings. Ratings based on real world data typically lag those published by EuroNCAP by many years as real world crash experience accumulates by which time the EuroNCAP test protocol has often been modified and is not directly comparable.
As noted, EuroNCAP is seen as a tool for driving safety change in vehicle design and providing information to consumers on relative safety at the time of vehicle release. In contrast, vehicle safety ratings based on real world data are seen as a tool to evaluate the long term safety of vehicles in the full range of real world circumstances. As shown by this study, real world ratings also provide a means to assess whether EuroNCAP testing is achieving its stated aims in improving vehicle safety and to help fine tune the program in future. Viewed as such, both ratings systems have a defined and non-conflicting role in advancing vehicle safety.
CONCLUSIONS
This study has been able to quantify the relationship between injury outcomes in real world crashes reported to police and estimates of relative vehicle safety derived from the EuroNCAP vehicle crash barrier test program. The measure of real world injury outcome
CEA/EC SARAC II EXECUTIVE SUMMARY
16
used has been the risk of death or serious injury given crash involvement calculated as a product of the risk of injury given crash involvement and the risk of death or serious injury given an injury was sustained. The crashworthiness measure, as well as its component risk measures based on all crash configurations, has been compared with the overall EuroNCAP score. Real world crash outcomes for frontal and driver side impacts have also been compared with the EuroNCAP offset and side impact test component scores. Police reported crash data from Great Britain, France, Germany, Finland, Australia and New Zealand was analysed. Due to the much larger quantities of real world data available for analysis, up to 70 EuroNCAP tested vehicle models have been considered in the comparisons meaning results from this study are more definitive than those obtained in the preceding SARAC 1 pilot study.
Results of analysis of the European data sources support some common conclusions when examining average real crash outcome by EuroNCAP star rating. Results from each country point to improving average vehicle crashworthiness with increasing EuroNCAP star rating. Analysis of the component measures of the crashworthiness metric shows this result stems from an association between average injury severity and overall EuroNCAP star rating and not the injury risk component of the crashworthiness measure. Measured associations between EuroNCAP score and real world injury severity were strongest and most consistent in both the French and German data. The French data in particular uses a much higher severity definition for serious injury compared to the British data, requiring drivers to be hospitalised for more than 6 days. The strong association between the French definition and EuroNCAP results suggests EuroNCAP may be reflecting the likelihood of these more serious injury outcomes.
No association between average crashworthiness, injury risk or injury severity and EuroNCAP overall star ratings was observed in the Australian and New Zealand data comparisons. This may have been a result of fewer vehicles being available for analysis, the range of vehicle models analysed being vastly different to those represented in the European data sources, differences in the injury outcome coding in the Australasian data or a combination of all these factors
Examination of the relationship between overall EuroNCAP test score and injury outcome on an individual vehicle basis adds a further dimension to the interpretation of the relationship. They show that whilst there is and association between average vehicle crashworthiness and EuroNCAP score outcome, there is significant variation in the measures of injury outcome in real crashes for specific vehicles within each EuroNCAP score category. It shows that a vehicle with good average real world crash outcomes does not always perform well in EuroNCAP testing and vice versa. This observation is consistent across the results for all countries considered in the study.
CEA/EC SARAC II EXECUTIVE SUMMARY
17
Comparison of average crashworthiness ratings based on frontal impact crashes within EuroNCAP offset frontal impact star rating categories showed no trends. The results suggest there is little if any association between the results of the EuroNCAP offset frontal impact test and real world injury outcomes to drivers in frontal crashes. In contrast, a strong association between average crashworthiness in side impact crashes and the side impact EuroNCAP score was observed. Interpreting the point estimates of the analysis revealed an approximate 20% drop in average side impact serious injury risk measured from the police reported data with every increase in EuroNCAP side impact star rating category. Like the comparisons based on all crash types, comparisons between side impact crashworthiness ratings and side impact EuroNCAP scores on a vehicle by vehicle basis showed ratings were not always consistent on a vehicle by vehicle basis. The results of this study are consistent with the results of the Pilot study carried out under Phase I of the SARAC research program and other similar studies comparing real crash outcomes and the results of crash barrier test programs conducted world-wide.
EuroNCAP’s principal aim is to apply pressure to vehicle manufacturers to improve the safety design and specification of vehicles. Leverage to achieve this end is gained by publishing the results for broad consumer scrutiny. Reflecting the aims of the program, the scoring system for EuroNCAP is not designed to necessarily represent an injury risk outcome scale. Results of this study confirm this general association with average real crash outcomes being better in vehicles with higher EuroNCAP scores than in ones with low scores. Results also confirm that this association is non-linear as expected. As such the study confirms that the design priorities for vehicle safety encouraged by the EuroNCAP scoring process are leading to improved real world crash performance on average. However, the results of comparison on a vehicle by vehicle basis also show that achieving these design priorities does not always lead to a safer vehicle.
Finally, this study shows that comparison with real world ratings provide a means to assess whether EuroNCAP testing is achieving its stated aims in improving vehicle safety and to help fine tune the program in the future. Noting their respective strengths, both EuroNCAP and real world ratings systems have defined and non-conflicting roles in advancing vehicle safety.
FUTURE RESEARCH DIRECTIONS
The work completed in this sub-task of the SARAC 2 project and detailed in this report has pointed to a number of areas of future research that should be considered. They are as follows.
CEA/EC SARAC II EXECUTIVE SUMMARY
18
• The EuroNCAP test program is constantly evolving to encourage manufacturers to meet more rigorous standards of vehicle safety performance and to include the latest safety technology. These evolutionary changes to EuroNCAP need to be evaluated specifically to ensure they are effective in improving average vehicle safety in real world crashes. Periodic evaluation of EuroNCAP using the general approach taken in this study is recommended and considered vital to ensure this high profile program continues to meet its target of improving vehicle safety performance.
• One of the limitations of the research presented in this report was the inability to combine the data from each of the jurisdictions for combined analysis. It is recommended that research be undertaken to investigate establishing a standardised European crash data recording protocol. Part of the research should investigate the most suitable measure of severe injury outcome (for example hospital admission) that can be accurately and consistently coded by police.
• More in-depth comparisons of the relationship between real world crash outcomes and EuroNCAP test scores would have been possible if a greater range of injury severity measures were available than just those recorded in the police data. It is recommended that research be conducted in Europe on investigating the availability of other injury outcome data such as insurance claims data and hospital records and the potential for linking these records with police crash data reports on a wide scale. The resulting combined data would also be a powerful resource for a broad range of detailed vehicle safety research in Europe.
CEA/EC SARAC II Introduction
19
1 Introduction This report describes the analysis undertaken for sub-tasks 2.1 and 2.2 of the second
phase of the project Quality Criteria for the Safety Assessment of Cars based on Real-
World Crashes carried out by the Safety Rating Advisory Committee (SARAC) for the
European Commission. The broad aim of sub-task 2.1 of the SARAC II project was to
update a pilot study of the relationship between EuroNCAP test results and injury
outcome in police reported crashes in Great Britain and France carried out in SARAC I
(Newstead et al, 2001). The sub-task uses updated police reported crash data from Great
Britain and France and newly obtained police reported crash data from Germany to
estimate injury risk and injury severity measures for European vehicles. The relationship
between these measures and EuroNCAP test results are then evaluated for vehicles
tested under the EuroNCAP test program prior to the commencement of the study. The
analysis of the police reported crash data and EuroNCAP results follows the general
approach developed in the SARAC I, sub-task 2.2, pilot study. In addition, the correlation
between EuroNCAP protocol test results and injury outcome in real crash data from
Australia and New Zealand (Newstead et al, 2004) was investigated.
SARAC II sub-task 2.2 extends the analysis of subtask 2.1 by focusing on front impact
and side impact police reported crashes. This sub-task aims to evaluate the relationship
between EuroNCAP test results and injury outcome in police reported crashes for each of
these crash types in Great Britain, France and combined Australia and New Zealand.
Crash configuration information was unavailable in sufficient detail to enable similar
analysis of the German data. The sub-task updates and adds to earlier analysis of this
type conducted in SARAC I (Newstead et al, 2001) and follows the framework established
in sub-task 2.1.
2 Data Sources
2.1 Background
The data selected for use in sub-tasks 2.1 and 2.2 are based on considerations set out in
detail in Newstead et al (2001) and Cameron, Newstead and Oppe (2000). A brief
summary of these considerations and the data follows.
In Europe, the largest databases on crashes reported to police available for analysis are
those from France, Great Britain and Germany. However, at the time of SARAC I, data in
the required form including information on the point of impact of crash involved vehicles
was available for France and Great Britain only. Data from Germany has now become
CEA/EC SARAC II Data Sources
20
available and as such the analysis undertaken in this study has been extended to include
analysis of extended data form France and Great Britain as well as data from Germany.
As in SARAC I, sufficient information on vehicle make and model was available within
each databases to enable analysis. However, the level of identification of vehicle make
and model was greater in the British and German databases than in the French database.
Additional crash data files covering the years 1999 to 2001 required to update the
analysis conducted in SARAC I sub-task 2.2 were provided by the LAB in France and the
United Kingdom Department for Transport respectively with appropriate common file
structure and contents for compatibility with data provided for SARAC I. The German
police reported crash data was provided by the German Federal Statistical Office for the
years 1998 to 2002.
The Australian and New Zealand real crash data covering the years 1987 to 2002 as used
in Newstead et al (2004) was the source of data used in this study. Vehicle make and
model information was available and while not all data from jurisdictions comprising the
database had a variable coded for point of impact there was sufficient data to enable
analysis.
In addition to these data sources, Finnish insurance data was available for analysis.
However, there was insufficient data to conduct a full analysis. A full description of the
Finnish data source and the limited analysis conducted is provided in Appendix J.
2.2 EuroNCAP Tested Results
2.2.1 Europe
The EuroNCAP Executive supplied EuroNCAP data for use in this study covering all test
results published under the EuroNCAP program up until the time of the study. Data from
EuroNCAP tests phases 1 to 7+ were supplied for SARAC 1 and again used here. For this
update, data from EuroNCAP test phases 8 to 11 were also obtained and integrated with
the previous data. The combined data covered EuroNCAP tests completed up to mid
2003, the commencement date for this study.
Results supplied from the EuroNCAP program covered the three main test procedures
comprising the program. These were the 64km/h 40% offset barrier test, the 50km/h side
impact test using 950kg mobile barrier and the pedestrian impact test incorporating leg
form to bumper test and head form to bonnet test. Where conducted, the results of the
side impact pole test were also supplied. For details of the pole test, see
CEA/EC SARAC II Data Sources
21
EuroNCAP(2003). Full details of the other EuroNCAP test procedures and protocols are
described in Williams (1997).
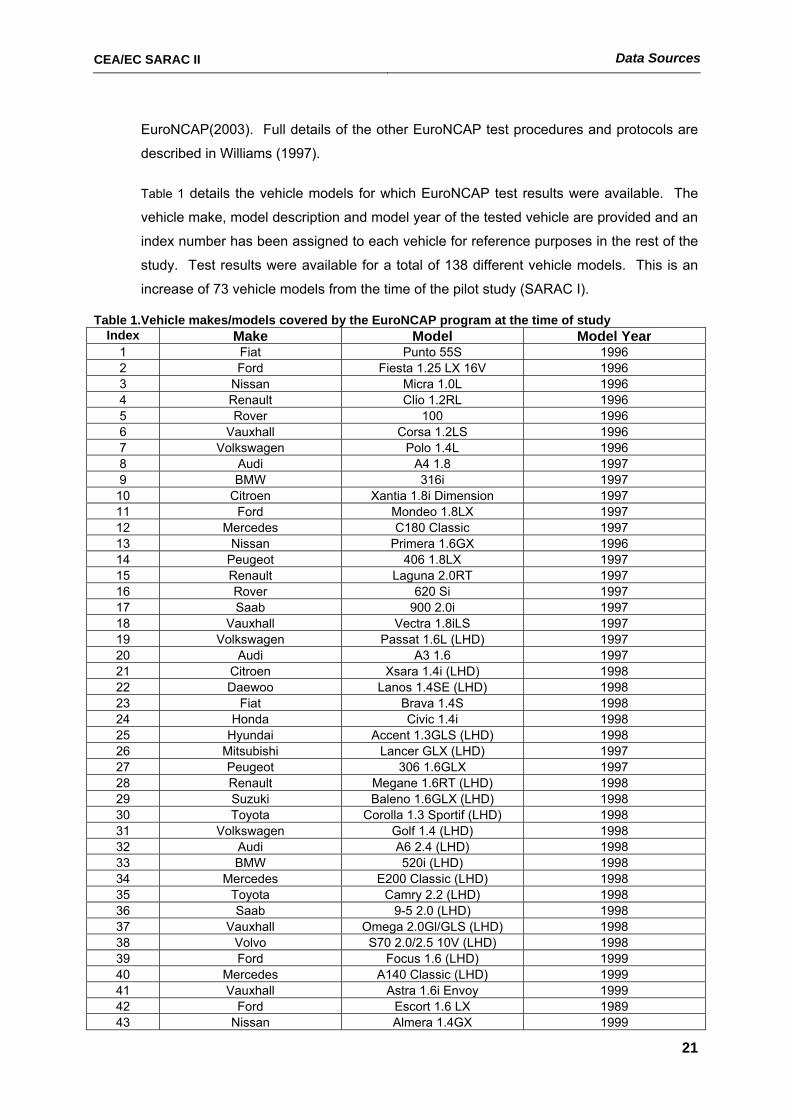
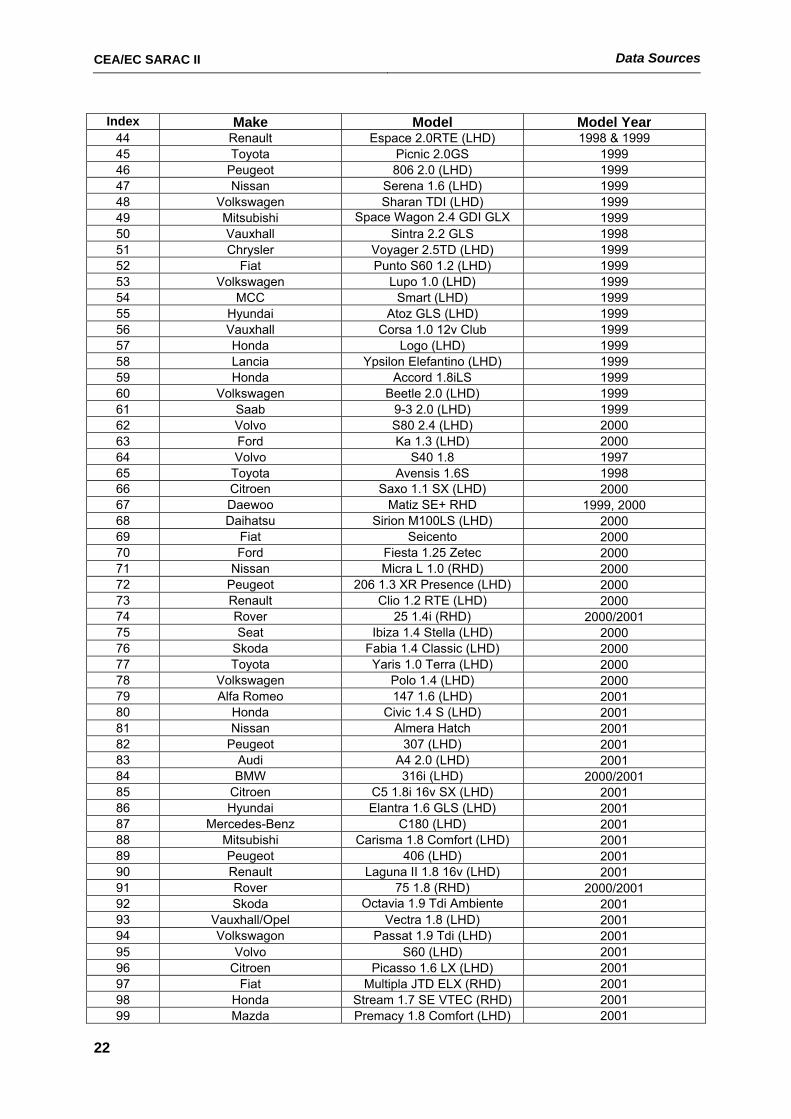
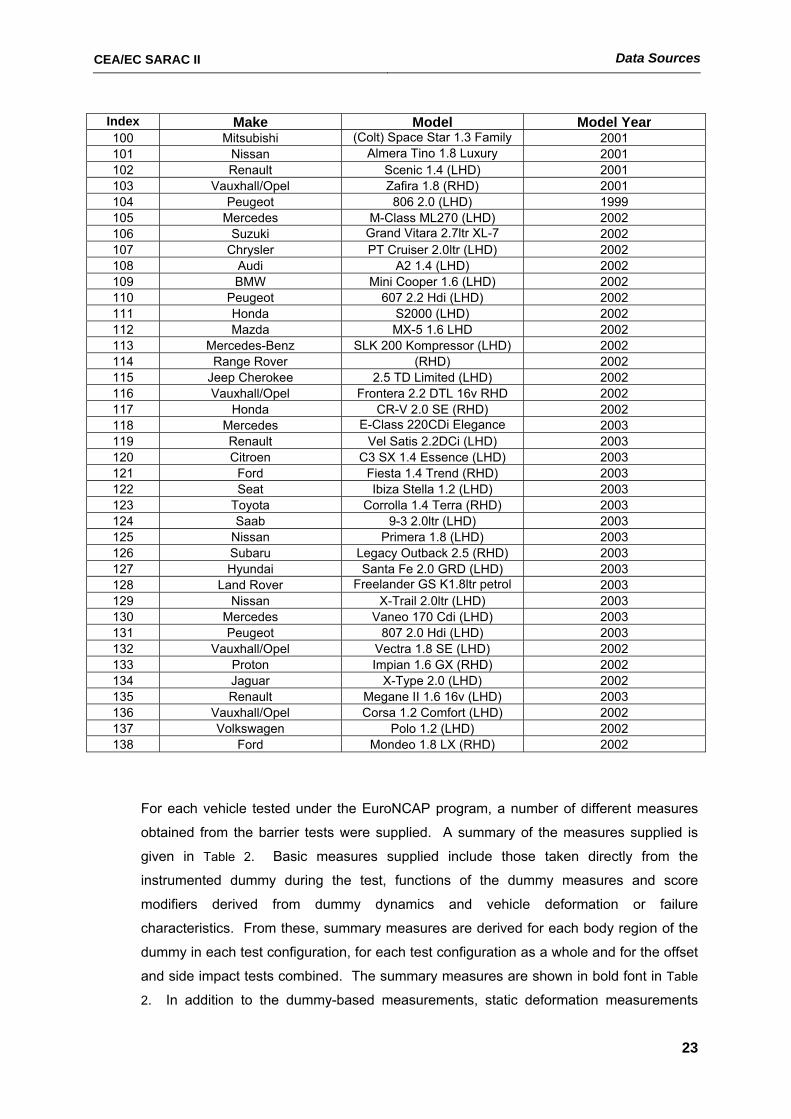
Table 1 details the vehicle models for which EuroNCAP test results were available. The
vehicle make, model description and model year of the tested vehicle are provided and an
index number has been assigned to each vehicle for reference purposes in the rest of the
study. Test results were available for a total of 138 different vehicle models. This is an
increase of 73 vehicle models from the time of the pilot study (SARAC I).
Table 1.Vehicle makes/models covered by the EuroNCAP program at the time of study Index Make Model Model Year
1 Fiat Punto 55S 1996 2 Ford Fiesta 1.25 LX 16V 1996 3 Nissan Micra 1.0L 1996 4 Renault Clio 1.2RL 1996 5 Rover 100 1996 6 Vauxhall Corsa 1.2LS 1996 7 Volkswagen Polo 1.4L 1996 8 Audi A4 1.8 1997 9 BMW 316i 1997
10 Citroen Xantia 1.8i Dimension 1997 11 Ford Mondeo 1.8LX 1997 12 Mercedes C180 Classic 1997 13 Nissan Primera 1.6GX 1996 14 Peugeot 406 1.8LX 1997 15 Renault Laguna 2.0RT 1997 16 Rover 620 Si 1997 17 Saab 900 2.0i 1997 18 Vauxhall Vectra 1.8iLS 1997 19 Volkswagen Passat 1.6L (LHD) 1997 20 Audi A3 1.6 1997 21 Citroen Xsara 1.4i (LHD) 1998 22 Daewoo Lanos 1.4SE (LHD) 1998 23 Fiat Brava 1.4S 1998 24 Honda Civic 1.4i 1998 25 Hyundai Accent 1.3GLS (LHD) 1998 26 Mitsubishi Lancer GLX (LHD) 1997 27 Peugeot 306 1.6GLX 1997 28 Renault Megane 1.6RT (LHD) 1998 29 Suzuki Baleno 1.6GLX (LHD) 1998 30 Toyota Corolla 1.3 Sportif (LHD) 1998 31 Volkswagen Golf 1.4 (LHD) 1998 32 Audi A6 2.4 (LHD) 1998 33 BMW 520i (LHD) 1998 34 Mercedes E200 Classic (LHD) 1998 35 Toyota Camry 2.2 (LHD) 1998 36 Saab 9-5 2.0 (LHD) 1998 37 Vauxhall Omega 2.0Gl/GLS (LHD) 1998 38 Volvo S70 2.0/2.5 10V (LHD) 1998 39 Ford Focus 1.6 (LHD) 1999 40 Mercedes A140 Classic (LHD) 1999 41 Vauxhall Astra 1.6i Envoy 1999 42 Ford Escort 1.6 LX 1989 43 Nissan Almera 1.4GX 1999
CEA/EC SARAC II Data Sources
22
Index Make Model Model Year 44 Renault Espace 2.0RTE (LHD) 1998 & 1999 45 Toyota Picnic 2.0GS 1999 46 Peugeot 806 2.0 (LHD) 1999 47 Nissan Serena 1.6 (LHD) 1999 48 Volkswagen Sharan TDI (LHD) 1999 49 Mitsubishi Space Wagon 2.4 GDI GLX 1999 50 Vauxhall Sintra 2.2 GLS 1998 51 Chrysler Voyager 2.5TD (LHD) 1999 52 Fiat Punto S60 1.2 (LHD) 1999 53 Volkswagen Lupo 1.0 (LHD) 1999 54 MCC Smart (LHD) 1999 55 Hyundai Atoz GLS (LHD) 1999 56 Vauxhall Corsa 1.0 12v Club 1999 57 Honda Logo (LHD) 1999 58 Lancia Ypsilon Elefantino (LHD) 1999 59 Honda Accord 1.8iLS 1999 60 Volkswagen Beetle 2.0 (LHD) 1999 61 Saab 9-3 2.0 (LHD) 1999 62 Volvo S80 2.4 (LHD) 2000 63 Ford Ka 1.3 (LHD) 2000 64 Volvo S40 1.8 1997 65 Toyota Avensis 1.6S 1998 66 Citroen Saxo 1.1 SX (LHD) 2000 67 Daewoo Matiz SE+ RHD 1999, 2000 68 Daihatsu Sirion M100LS (LHD) 2000 69 Fiat Seicento 2000 70 Ford Fiesta 1.25 Zetec 2000 71 Nissan Micra L 1.0 (RHD) 2000 72 Peugeot 206 1.3 XR Presence (LHD) 2000 73 Renault Clio 1.2 RTE (LHD) 2000 74 Rover 25 1.4i (RHD) 2000/2001 75 Seat Ibiza 1.4 Stella (LHD) 2000 76 Skoda Fabia 1.4 Classic (LHD) 2000 77 Toyota Yaris 1.0 Terra (LHD) 2000 78 Volkswagen Polo 1.4 (LHD) 2000 79 Alfa Romeo 147 1.6 (LHD) 2001 80 Honda Civic 1.4 S (LHD) 2001 81 Nissan Almera Hatch 2001 82 Peugeot 307 (LHD) 2001 83 Audi A4 2.0 (LHD) 2001 84 BMW 316i (LHD) 2000/2001 85 Citroen C5 1.8i 16v SX (LHD) 2001 86 Hyundai Elantra 1.6 GLS (LHD) 2001 87 Mercedes-Benz C180 (LHD) 2001 88 Mitsubishi Carisma 1.8 Comfort (LHD) 2001 89 Peugeot 406 (LHD) 2001 90 Renault Laguna II 1.8 16v (LHD) 2001 91 Rover 75 1.8 (RHD) 2000/2001 92 Skoda Octavia 1.9 Tdi Ambiente 2001 93 Vauxhall/Opel Vectra 1.8 (LHD) 2001 94 Volkswagon Passat 1.9 Tdi (LHD) 2001 95 Volvo S60 (LHD) 2001 96 Citroen Picasso 1.6 LX (LHD) 2001 97 Fiat Multipla JTD ELX (RHD) 2001 98 Honda Stream 1.7 SE VTEC (RHD) 2001 99 Mazda Premacy 1.8 Comfort (LHD) 2001
CEA/EC SARAC II Data Sources
23
Index Make Model Model Year 100 Mitsubishi (Colt) Space Star 1.3 Family 2001 101 Nissan Almera Tino 1.8 Luxury 2001 102 Renault Scenic 1.4 (LHD) 2001 103 Vauxhall/Opel Zafira 1.8 (RHD) 2001 104 Peugeot 806 2.0 (LHD) 1999 105 Mercedes M-Class ML270 (LHD) 2002 106 Suzuki Grand Vitara 2.7ltr XL-7 2002 107 Chrysler PT Cruiser 2.0ltr (LHD) 2002 108 Audi A2 1.4 (LHD) 2002 109 BMW Mini Cooper 1.6 (LHD) 2002 110 Peugeot 607 2.2 Hdi (LHD) 2002 111 Honda S2000 (LHD) 2002 112 Mazda MX-5 1.6 LHD 2002 113 Mercedes-Benz SLK 200 Kompressor (LHD) 2002 114 Range Rover (RHD) 2002 115 Jeep Cherokee 2.5 TD Limited (LHD) 2002 116 Vauxhall/Opel Frontera 2.2 DTL 16v RHD 2002 117 Honda CR-V 2.0 SE (RHD) 2002 118 Mercedes E-Class 220CDi Elegance 2003 119 Renault Vel Satis 2.2DCi (LHD) 2003 120 Citroen C3 SX 1.4 Essence (LHD) 2003 121 Ford Fiesta 1.4 Trend (RHD) 2003 122 Seat Ibiza Stella 1.2 (LHD) 2003 123 Toyota Corrolla 1.4 Terra (RHD) 2003 124 Saab 9-3 2.0ltr (LHD) 2003 125 Nissan Primera 1.8 (LHD) 2003 126 Subaru Legacy Outback 2.5 (RHD) 2003 127 Hyundai Santa Fe 2.0 GRD (LHD) 2003 128 Land Rover Freelander GS K1.8ltr petrol 2003 129 Nissan X-Trail 2.0ltr (LHD) 2003 130 Mercedes Vaneo 170 Cdi (LHD) 2003 131 Peugeot 807 2.0 Hdi (LHD) 2003 132 Vauxhall/Opel Vectra 1.8 SE (LHD) 2002 133 Proton Impian 1.6 GX (RHD) 2002 134 Jaguar X-Type 2.0 (LHD) 2002 135 Renault Megane II 1.6 16v (LHD) 2003 136 Vauxhall/Opel Corsa 1.2 Comfort (LHD) 2002 137 Volkswagen Polo 1.2 (LHD) 2002 138 Ford Mondeo 1.8 LX (RHD) 2002
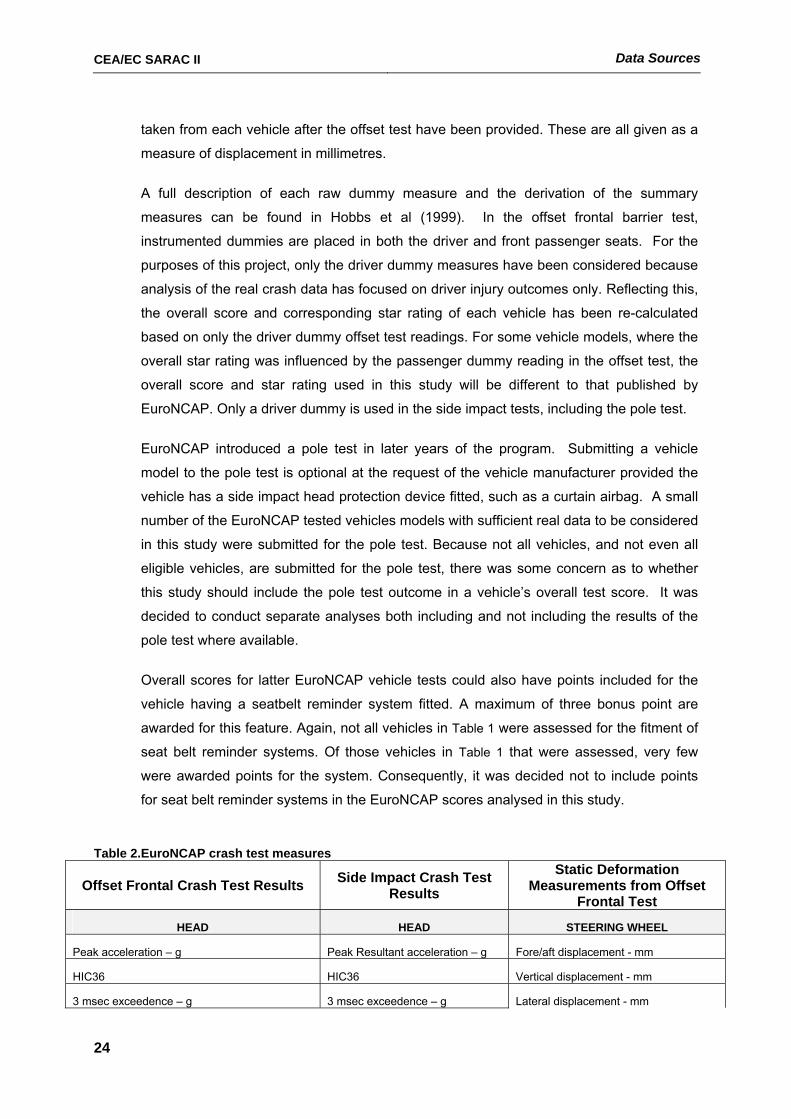
For each vehicle tested under the EuroNCAP program, a number of different measures
obtained from the barrier tests were supplied. A summary of the measures supplied is
given in Table 2. Basic measures supplied include those taken directly from the
instrumented dummy during the test, functions of the dummy measures and score
modifiers derived from dummy dynamics and vehicle deformation or failure
characteristics. From these, summary measures are derived for each body region of the
dummy in each test configuration, for each test configuration as a whole and for the offset
and side impact tests combined. The summary measures are shown in bold font in Table
2. In addition to the dummy-based measurements, static deformation measurements
CEA/EC SARAC II Data Sources
24
taken from each vehicle after the offset test have been provided. These are all given as a
measure of displacement in millimetres.
A full description of each raw dummy measure and the derivation of the summary
measures can be found in Hobbs et al (1999). In the offset frontal barrier test,
instrumented dummies are placed in both the driver and front passenger seats. For the
purposes of this project, only the driver dummy measures have been considered because
analysis of the real crash data has focused on driver injury outcomes only. Reflecting this,
the overall score and corresponding star rating of each vehicle has been re-calculated
based on only the driver dummy offset test readings. For some vehicle models, where the
overall star rating was influenced by the passenger dummy reading in the offset test, the
overall score and star rating used in this study will be different to that published by
EuroNCAP. Only a driver dummy is used in the side impact tests, including the pole test.
EuroNCAP introduced a pole test in later years of the program. Submitting a vehicle
model to the pole test is optional at the request of the vehicle manufacturer provided the
vehicle has a side impact head protection device fitted, such as a curtain airbag. A small
number of the EuroNCAP tested vehicles models with sufficient real data to be considered
in this study were submitted for the pole test. Because not all vehicles, and not even all
eligible vehicles, are submitted for the pole test, there was some concern as to whether
this study should include the pole test outcome in a vehicle’s overall test score. It was
decided to conduct separate analyses both including and not including the results of the
pole test where available.
Overall scores for latter EuroNCAP vehicle tests could also have points included for the
vehicle having a seatbelt reminder system fitted. A maximum of three bonus point are
awarded for this feature. Again, not all vehicles in Table 1 were assessed for the fitment of
seat belt reminder systems. Of those vehicles in Table 1 that were assessed, very few
were awarded points for the system. Consequently, it was decided not to include points
for seat belt reminder systems in the EuroNCAP scores analysed in this study.
Table 2.EuroNCAP crash test measures
Offset Frontal Crash Test Results Side Impact Crash Test Results
Static Deformation Measurements from Offset
Frontal Test
HEAD HEAD STEERING WHEEL
Peak acceleration – g Peak Resultant acceleration – g Fore/aft displacement - mm
HIC36 HIC36 Vertical displacement - mm
3 msec exceedence – g 3 msec exceedence – g Lateral displacement - mm
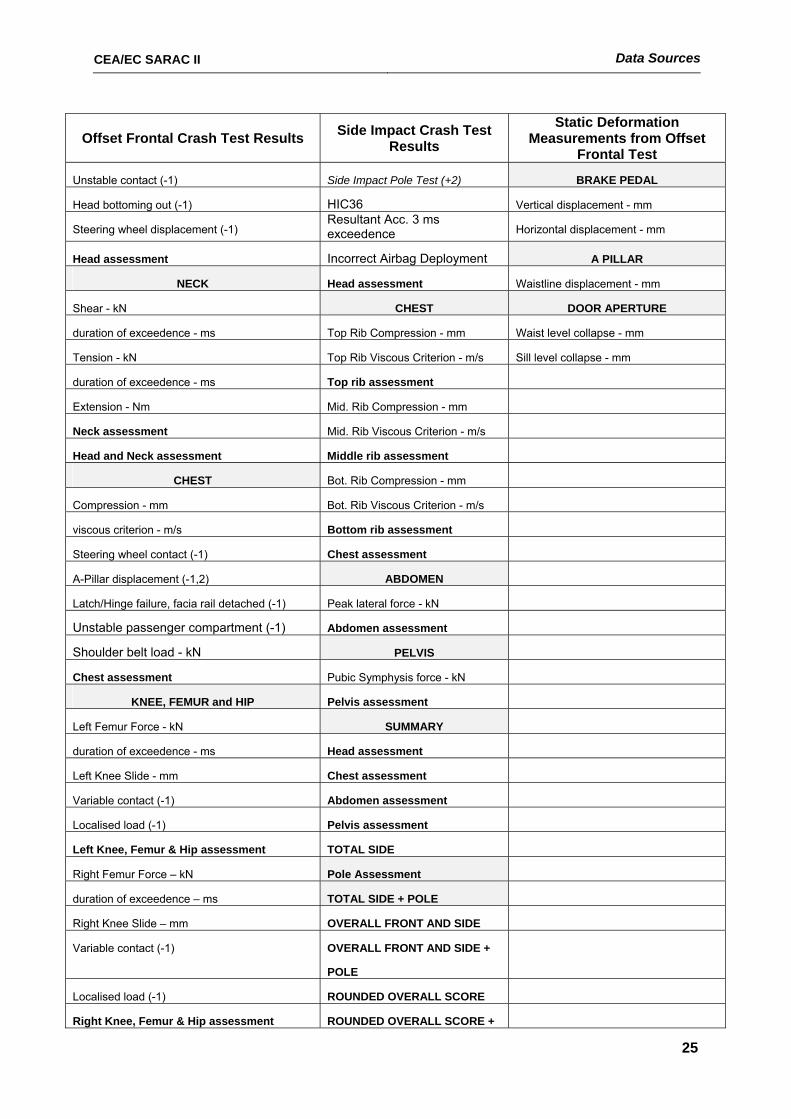
CEA/EC SARAC II Data Sources
25
Offset Frontal Crash Test Results Side Impact Crash Test Results
Static Deformation Measurements from Offset
Frontal Test
Unstable contact (-1) Side Impact Pole Test (+2) BRAKE PEDAL
Head bottoming out (-1) HIC36 Vertical displacement - mm
Steering wheel displacement (-1) Resultant Acc. 3 ms exceedence Horizontal displacement - mm
Head assessment Incorrect Airbag Deployment A PILLAR
NECK Head assessment Waistline displacement - mm
Shear - kN CHEST DOOR APERTURE
duration of exceedence - ms Top Rib Compression - mm Waist level collapse - mm
Tension - kN Top Rib Viscous Criterion - m/s Sill level collapse - mm
duration of exceedence - ms Top rib assessment
Extension - Nm Mid. Rib Compression - mm
Neck assessment Mid. Rib Viscous Criterion - m/s
Head and Neck assessment Middle rib assessment
CHEST Bot. Rib Compression - mm
Compression - mm Bot. Rib Viscous Criterion - m/s
viscous criterion - m/s Bottom rib assessment
Steering wheel contact (-1) Chest assessment
A-Pillar displacement (-1,2) ABDOMEN
Latch/Hinge failure, facia rail detached (-1) Peak lateral force - kN
Unstable passenger compartment (-1) Abdomen assessment
Shoulder belt load - kN PELVIS
Chest assessment Pubic Symphysis force - kN
KNEE, FEMUR and HIP Pelvis assessment
Left Femur Force - kN SUMMARY
duration of exceedence - ms Head assessment
Left Knee Slide - mm Chest assessment
Variable contact (-1) Abdomen assessment
Localised load (-1) Pelvis assessment
Left Knee, Femur & Hip assessment TOTAL SIDE
Right Femur Force – kN Pole Assessment
duration of exceedence – ms TOTAL SIDE + POLE
Right Knee Slide – mm OVERALL FRONT AND SIDE
Variable contact (-1) OVERALL FRONT AND SIDE +
POLE
Localised load (-1) ROUNDED OVERALL SCORE
Right Knee, Femur & Hip assessment ROUNDED OVERALL SCORE +

CEA/EC SARAC II Data Sources
26
Offset Frontal Crash Test Results Side Impact Crash Test Results
Static Deformation Measurements from Offset
Frontal Test
POLE
Knee, Femur and Hip assessment
LOWER LEG
Left axial force – kN
Left Upper Tibia Index
Left Lower Tibia Index
Brake pedal vertical (-1)
Left Lower Leg assessment
Right axial force – kN
Right Upper Tibia Index
Right Lower Tibia Index
Brake pedal vertical (-1)
Right Lower Leg assessment
FOOT and ANKLE
Brake pedal horizontal displacement - mm
Footwell displacement
Footwell rupture (-1)
Foot and ankle assessment
Leg and Foot assessment
SUMMARY
Head and Neck assessment
Chest assessment
Knee, Femur and Hip assessment
Leg and Foot assessment
TOTAL DRIVER FRONTAL
2.2.2 Australian ANCAP Test Results
Since 1999, the ANCAP program has adopted a vehicle test and scoring procedure fully
harmonised with the EuroNCAP program. In fact, for vehicles tested under the EuroNCAP
program that are also available for sale in similar specification in Australia, the EuroNCAP test
results are published by ANCAP. The ANCAP data for use in this study using the EuroNCAP
protocol was supplied by Michael Paine of Vehicle Design and Research Australia with
permission of the Australian NCAP Program Steering Committee.
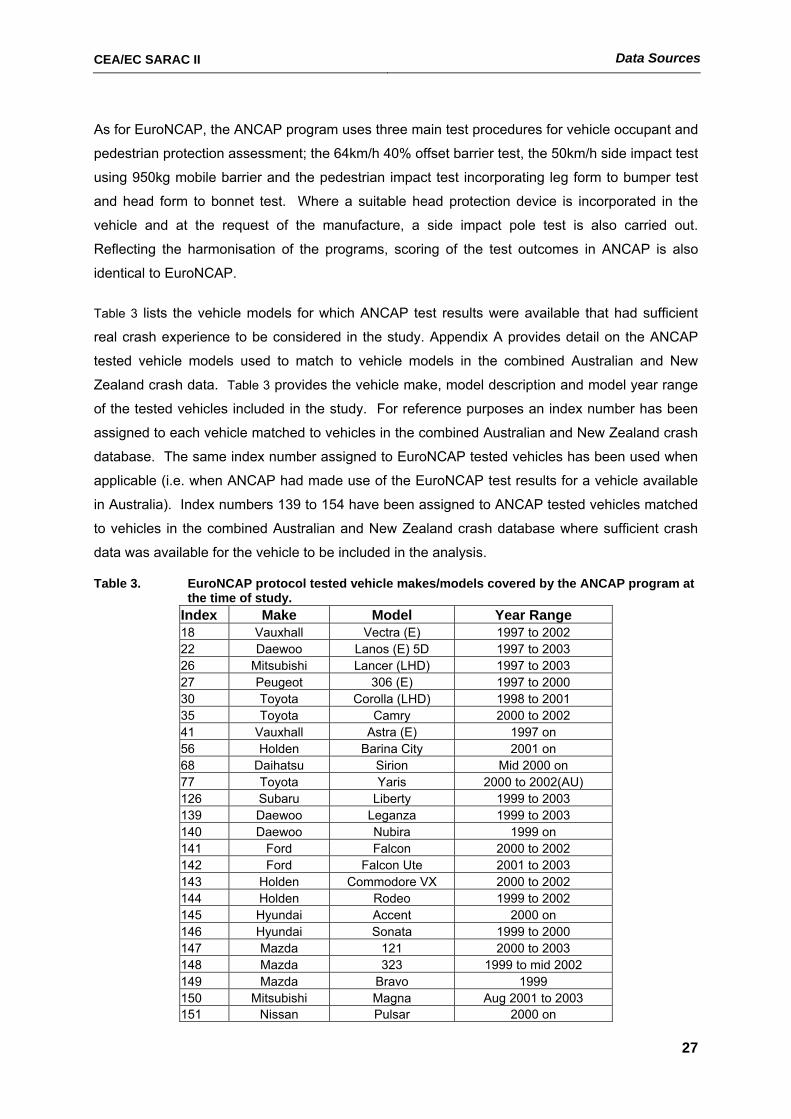
CEA/EC SARAC II Data Sources
27
As for EuroNCAP, the ANCAP program uses three main test procedures for vehicle occupant and
pedestrian protection assessment; the 64km/h 40% offset barrier test, the 50km/h side impact test
using 950kg mobile barrier and the pedestrian impact test incorporating leg form to bumper test
and head form to bonnet test. Where a suitable head protection device is incorporated in the
vehicle and at the request of the manufacture, a side impact pole test is also carried out.
Reflecting the harmonisation of the programs, scoring of the test outcomes in ANCAP is also
identical to EuroNCAP.
Table 3 lists the vehicle models for which ANCAP test results were available that had sufficient
real crash experience to be considered in the study. Appendix A provides detail on the ANCAP
tested vehicle models used to match to vehicle models in the combined Australian and New
Zealand crash data. Table 3 provides the vehicle make, model description and model year range
of the tested vehicles included in the study. For reference purposes an index number has been
assigned to each vehicle matched to vehicles in the combined Australian and New Zealand crash
database. The same index number assigned to EuroNCAP tested vehicles has been used when
applicable (i.e. when ANCAP had made use of the EuroNCAP test results for a vehicle available
in Australia). Index numbers 139 to 154 have been assigned to ANCAP tested vehicles matched
to vehicles in the combined Australian and New Zealand crash database where sufficient crash
data was available for the vehicle to be included in the analysis.
Table 3. EuroNCAP protocol tested vehicle makes/models covered by the ANCAP program at the time of study.
Index Make Model Year Range 18 Vauxhall Vectra (E) 1997 to 2002 22 Daewoo Lanos (E) 5D 1997 to 2003 26 Mitsubishi Lancer (LHD) 1997 to 2003 27 Peugeot 306 (E) 1997 to 2000 30 Toyota Corolla (LHD) 1998 to 2001 35 Toyota Camry 2000 to 2002 41 Vauxhall Astra (E) 1997 on 56 Holden Barina City 2001 on 68 Daihatsu Sirion Mid 2000 on 77 Toyota Yaris 2000 to 2002(AU) 126 Subaru Liberty 1999 to 2003 139 Daewoo Leganza 1999 to 2003 140 Daewoo Nubira 1999 on 141 Ford Falcon 2000 to 2002 142 Ford Falcon Ute 2001 to 2003 143 Holden Commodore VX 2000 to 2002 144 Holden Rodeo 1999 to 2002 145 Hyundai Accent 2000 on 146 Hyundai Sonata 1999 to 2000 147 Mazda 121 2000 to 2003 148 Mazda 323 1999 to mid 2002 149 Mazda Bravo 1999 150 Mitsubishi Magna Aug 2001 to 2003 151 Nissan Pulsar 2000 on
CEA/EC SARAC II Data Sources
28
Index Make Model Year Range 152 Toyota Avalon 2001 on 153 Toyota Hilux_2wd Sep 2001 to 2003 154 Volkswagon Polo(E) 1996 to 1999
As the Australian NCAP program is fully harmonised with EuroNCAP, the measures obtained
from the barrier tests under each program are the same and are given in Table 2.
2.3 British Real Crash data
The STATS19 database covering all crashes in Great Britain reported to Police over the period
1993 to 1998 was supplied by the UK Department for Transport (DfT – formerly the Department
of Environment, Transport, and the Regions) for use in the pilot study conducted in SARAC I. Full
details of that data are provided in Newstead et al, 2001. Additional data, for use in the current
project, sub-tasks 2.1 and 2.2, covering police reported crashes in Great Britain for the period
1999 to 2001 was provided by the UK Department for Transport (DfT) in the same format as the
earlier data.
Some key features of the British database are worth noting. All road accidents involving human
death or personal injury occurring on the highway (‘road’ in Scotland) and in which one or more
vehicles are involved are required to be reported to the police within 30 days of occurrence. All
fatal or injury accidents on public roads involving at least one mechanically propelled vehicle
should be reported by the public to police unless insurance documents, name and address, and
evidence of vehicle ownership and registration are exchanged between drivers. Crashes falling
outside the base reporting definition, including those not involving human injury, do not appear in
the data. In addition, it is possible that all injury accidents are not reported to police.
Driver injury level is coded in the British data using a three level scale found in the “Severity of
Casualty” variable in the casualty section of the database. These levels are:
• (1) Fatal: includes cases where death occurs in less than 30 days as a result of the
accident
• (2) Serious: includes fractures, internal injury, severe cuts, crushing, burns,
concussion, severe shock requiring hospital treatment, detention in hospital as an in-
patient immediately or at a later date, injuries from the crash resulting in death 30 days
or more after the crash
• (3) Slight: including sprains or whiplash not necessarily requiring medical treatment,
bruises, slight cuts, slight shock requiring roadside attention.
CEA/EC SARAC II Data Sources
29
Drivers with no coded casualty information were assumed to be uninjured. Full details of the
database (STATS19 ) can be found in DETR (2000).
Considering the combined data set from 1993 to 2001, and after selecting passenger cars only,
complete information for the required variables (driver age, driver sex, junction type, point of
impact and speed limit of the crash site) was available for 1,635,296 crashes. Crashes involving
one light passenger vehicle colliding with another were identified in these data and used in the
estimation of injury risk. Estimation of injury risk using the DfT and Newstead methods, detailed
below, considered 973,613 and 546,984 two-car crashes respectively. Estimation of injury
severity using the MUARC severity measure considered injured drivers involved in either single
vehicle or two-car crashes. A total of 775,972 injured drivers were available for analysis of which
159,306 were involved in single vehicle crashes and 616,666 were involved two-car crashes.
The selection criteria applied to the initial analyses of crashes of all types (in SARAC I, sub-task
2.2) were also utilised in this analysis. EuroNCAP tested vehicles were selected where at least
80 drivers were involved in two-car crashes and at least 20 drivers were injured in single and two-
car crashes combined.
Crashed vehicles with primary impact to specific areas of the vehicle could be identified in the
British data using the “1st Point of Impact” variable in the vehicle section of the database. Two
specific primary impact points were relevant to the study for comparison with the EuroNCAP
offset frontal and side impact test results. These were impacts to the front of the vehicle and
impacts to the driver’s side of the vehicle, selected by the “1 Front” and “3 Offside” codes
respectively in the “1st Point of Impact” variable.
Selecting from the final data set described above, 551,841 and 383,033 crashes were available
for use in the estimation of driver injury risk for front impact crashes using the DfT and Newstead
methods respectively. Estimation of the injury severity measure for front impact crashes involved
the analysis of 411,691 cases.
Driver side impact crashes were identified as those crashes coded as offside within the point of
impact variable. Cases for analysis of driver side impact crashes were selected on the basis that
there were more than 80 involved drivers and more than 20 injured drivers involved in off side
impact crashes. The injury risk using the DfT method was estimated using 129,639 cases, while
66,198 cases were contained in the file used to estimate injury risk via the Newstead method.
Injury severity was estimated from 137,433 injured drivers.
CEA/EC SARAC II Data Sources
30
2.3.1 Identification of Vehicle Models in the British Data
Vehicle model details are coded in two numerical fields in the British crash database, one
representing the make of the vehicle and the other the specific vehicle model details. A codebook
identifying the vehicle makes and models represented by each code level was supplied by the
DfT. Vehicle model codes recorded in the British database were typically very specific, often
giving detail about trim level, engine option and often transmission type. For example
• Vauxhall/Opel Astra Club 16V Auto
• Peugeot 106 XN Zest 3
No information on the vehicle identification number (VIN) was available so selection of vehicle
models from the crash data for comparison with EuroNCAP test result had to be carried out on
the basis of the available make and model coding and descriptions. In addition to the make and
model codes in the British data, the year and month of first registration of the vehicle were used to
identify the relevant vehicle for comparison. Month of first registration was considered the best
proxy for the month of vehicle manufacture (which was not available in the crash data) although it
is acknowledged that some vehicles will sit in holding yards after manufacture for some time
before sale. In this case, the month of first registration will be some time after the month of
manufacture and there will be some chance of misclassification of the vehicle in terms of its
model identification. Because the year of manufacture is also used along with reasonably specific
details on model information, it is estimated that the proportion of misclassified vehicles will be
relatively small in the total volume of data.
Information on general vehicle model specifications was obtained from a number of sources. The
UK publication “WhatCar? Used Car Price Guide” (WhatCar? 2000) was used to identify dates of
model introduction in Great Britain along with the specification of safety equipment fitted to each
model variant and changes in those specifications over the model life. This information was
augmented through online information from the Parker’s Guide web site (www.parkers.co.uk). In
addition, information and comment on vehicle specification was obtained directly from the DfT
staff and from participating vehicle manufacturers in SARAC.
2.4 French Real Crash Data
In France, every road accident in which at least one road user received medical treatment is
investigated by the police and included in a national database managed by the Ministry of
Transportation. The LAB in France has a copy of this database and supplied an extract of the
data for use in the pilot study conducted in phase one of the SARAC project. Full details of that
data are provided in Newstead et al, 2001. Additional data, for use here in sub-tasks 2.1 and 2.2,
covering police reported crashes in France for the period 1999 to 2001 was provided by the LAB
CEA/EC SARAC II Data Sources
31
in the same format as the earlier data. Consistent with the earlier data supplied only those cases
meeting the following criteria were provided:
• No two wheelers involved;
• Only drivers or right front passengers of private cars whose injury severity is
known;
• All types of collisions and obstacles.
Driver injury level is coded in a variable in the French data using a four level scale. These levels
are:
• (1) Uninjured: no medical treatment
• (2) Killed: death within seven days of the crash
• (3)Severely Injured: more than 6 days in hospital
• (4) Slight Injury:
CEA/EC SARAC II Data Sources
32
multiple impacts, 0 – unknown. Impacts to the front of the vehicle were selected as codes 1, 2
and 3 whilst impacts to the driver’s side of the vehicle were selected by code 8.
Information on 312,945 two-car crashes was available for use in the estimation of injury risk for
front impact crashes using the DfT method. Estimation of injury risk using the Newstead method
considered 224,732 crashes. Injury severity was estimated using the MUARC severity measure
on the basis of 272,965 injured drivers involved in either single vehicle or two-car crashes. These
records were used for the estimation of injury severity in real front impact crashes, as detailed in
Section 3.1 below.
After selection of driver side impact crashes, 35,297 cases were available for the estimation of
injury risk using the DfT method and 17,792 cases were used in the estimation of injury risk using
the Newstead method. The injury severity file contained 33,253 cases in which a driver injury
was sustained. These records were used for the estimation of injury severity in real side impact
crashes, as detailed in Section 3.1 below.
2.4.1 Identification of Vehicle Models in the French Crash Data
Like the British database, VIN was not available for model identification in the French crash data.
Selection of vehicle models from the crash data for comparison with EuroNCAP test result was
carried out on the basis of make and model coding and descriptions provided in the crash data.
Further, the year of manufacture of the vehicle was used to identify the relevant vehicle for
comparison.
A review of the actual descriptions of vehicle model types in the French data supplied for SARAC
I revealed a resolution on the description much less than found in the British data. Generally,
only the broad model classification was given in the data with no detail on the trim level, engine
option or transmission type. For example, a typical make model code was given as “Peugeot
106” with no more detail available. This problem has been rectified somewhat in the 1999-2001
French data with more detailed vehicle model information being available. This has allowed
identification of equivalent EuroNCAP tested models in the French data, particularly in the latter
data, with a precision much closer to that available when using the British data.
In addition to the problems with vehicle model identification described above, there is apparently
no readily available French publication equivalent to the British “WhatCar?” publication that gives
details of vehicle model release dates and equipment specifications. Whilst some information
was available directly for the EuroNCAP publications and through SARAC participants, it
generally had to be assumed that model release dates and specifications in France were similar
to those in Great Britain.
CEA/EC SARAC II Data Sources
33
2.5 German Real Crash Data
In Germany, every road accident attended by the police must be reported and is recorded in a
database held at the German Federal Statistical Office. There are no strict injury criteria for
inclusion in the database and accidents involving material damage or slight personal injuries are
included where the accident was reported to the police. A copy of this database for the period
1998 to 2002 was supplied to MUARC for use in this study.
Driver injury level is coded in a variable in the German data using a four level scale. These levels
are:
• (1) Killed
• (2) Severely Injured
• (3) Slightly Injured
• (4) Not injured
Considering the complete data set for crashes occurring between 1998 and 2002, 1,122,685 two-
car and single vehicle crashes were identified. Of these, 804,589 contained complete information
concerning the variables required for analysis (driver age, driver sex, intersection, location, cost,
year of crash). Using this data the vehicle models were selected for inclusion in the analysis on
the basis of the number of injured drivers and crash involvements for each of the EuroNCAP
tested vehicles. EuroNCAP tested vehicles were selected where at least 100 drivers were
involved in two-car crashes and at least 20 drivers were injured in single and two-car crashes
combined.
Crashes involving one light passenger vehicle colliding with another were identified in the
combined data set and used in the estimation of injury risk. Estimation of injury risk using the DfT
and Newstead methods considered 364,939 and 221,132 two-car crashes respectively.
Estimation of injury severity using the MUARC severity measure considered injured drivers
involved in either single vehicle or two-car crashes. A total of 273,421 injured drivers were
available for analysis.
Information on the primary point of impact on the vehicles was not sufficient to identify front and
side impact crashes with certainty. Therefore, analysis of these crash types could not be
conducted using the German data. A complete description of the German data is available in
Hautzinger and Mayer (2004).
CEA/EC SARAC II Data Sources
34
2.5.1 Identification of Vehicle Models in the German Data
Like the British and French databases, VIN was not available for model identification in the
German crash data. Selection of vehicle models from the crash data for comparison with
EuroNCAP test result was carried out on the basis of the “HSN” and “TSN” variables describing
vehicle make and model that were available in the data. Using a method developed by the BAST,
crash involved vehicles with “HSN” and “TSN” codes corresponding to those EuroNCAP tested
vehicles detailed in Appendix A were identified as the relevant vehicles for comparison.
2.6 Australian and New Zealand Real Crash Data
Data from four states of Australia and the whole of New Zealand were combined to produce the
Australia and New Zealand make and model specific crashworthiness ratings of Newstead et al
(2004). The ratings covered drivers of cars, station wagons, four-wheel drive vehicles, passenger
vans, and light commercial vehicles manufactured during 1982-2002 and crashing in the
Australian states of Victoria and New South Wales during 1987-2002 or the Australian states
Queensland and Western Australia during 1991-2002 and in New Zealand during 1991-2002.
The data on the injured drivers analysed to produce the make and model specific vehicle safety
ratings covered 383,842 drivers of 1982-2002 model vehicles who were injured in crashes in
Victoria or New South Wales during 1987-2002 or in Western Australia, Queensland or New
Zealand during 1991-2002. Of these 342,850 had a valid injury severity code, with 40,992 drivers
injured in crashes in New South Wales during 1999-2002 excluded because of missing
information on injury severity level. Information on the 342,850 injured drivers was used to
assess the injury severity of injured drivers of the different makes and models when computing
crashworthiness ratings. The information on the 1,504,399 drivers involved in tow-away crashes
in New South Wales during 1987-2002 or Western Australia and Queensland during 1991-2002
was used to assess the injury rate of drivers of the different makes and models for computing
crashworthiness ratings.
Driver injury level is coded in the combined Australian and New Zealand data using a four level
scale. These levels are:
• (1) Fatal: includes cases where death occurs in less than 30 days as a result of the
accident
• (2) Serious Injury: Admitted to hospital
• (3) Injury: Injured but not admitted to hospital
• (4) Not injured: Uninjured
CEA/EC SARAC II Data Sources
35
In the jurisdictions where it was relevant, drivers with no coded casualty information were
assumed to be uninjured.
Estimation of injury risk using the MUARC method, detailed below, considered 1,070,369 crashes
which had complete information for the required variables (driver age, driver sex, number of
vehicles involved, jurisdiction, speed zone of the crash site and year of crash). Estimation of
injury severity using the MUARC severity measure considered 251,269 drivers injured in a crash
during 1987-2002.
For all analyses, EuroNCAP protocol tested vehicles were selected where at least 100 drivers
were involved and at least 20 drivers were injured. This is slightly different to the selection criteria
applied in SARAC I, sub-task 2.2 and to the British and French data analysis in this report where
80 involved drivers was the minimum requirement.
Crashed vehicles with primary impact to specific areas of the vehicle could be identified in some
jurisdictions in the combined Australian and New Zealand data using either “1st Point of Impact”,
“1st Impact Type” or “Vehicle Damage Location” variable in the vehicle section of the database.
Two specific primary impact points were relevant to the study for comparison with the EuroNCAP
protocol offset frontal and side impact test results. These were impacts to the front of the vehicle
and impacts to the driver’s side of the vehicle.
Selecting from the final data set described above, 140,184 crashes were available for use in the
estimation of driver injury risk for front impact crashes using the MUARC method. Estimation of
the injury severity measure for front impact crashes involved the analysis of 75,478 cases.
Cases for analysis of driver side impact crashes were selected on the basis that there were more
than 100 involved drivers and more than 20 injured drivers involved in off side impact crashes.
The injury risk using the MUARC method was estimated using 15,605 cases. Injury severity was
estimated from 11,459 injured drivers.
2.6.1 Identification of Vehicle Models in the Australian and New Zealand Data
In some jurisdictions a Vehicle Identification Number (VIN) was decoded to determine the models
of light passenger vehicles and in others make and model codes were of sufficient detail to be
used, along with year of manufacture to assign vehicle model groupings. Details of the model
decoding procedure can be found in Newstead et al (2004).
2.7 Comparison of the European Data Sets
As evident from the description of the French, British and German data sources, there were a
number of fundamental differences in the three data systems. The most important fundamental
CEA/EC SARAC II Data Sources
36
difference is in the segregation of injury levels coded in the reported data. Specifically, the
difference lies in the segregation of degree of injury for injured occupants who are not killed. The
British data divides injured occupants into those severely injured (hospital admissions and other
serious outcomes) and those with minor injuries. In the French data, injured occupants are
classified into two groups defined as those staying less than 7 days in hospital and those staying
7 or more days in hospital. Clearly, these injury definitions are incomparable between the two
data systems. The LAB advised that there are no variables in the GNPN database that identify
hospital admission or other serious injury outcomes to make the French injury classification
comparable to that used in Britain. Similarly, in the British data there is no variable indicating
admission to, or length of stay in hospital to make the British injury definition comparable with the
French definition. Detailed criteria for the classification of injuries in the German data have not
been provided.
Another apparent difference in the British, French and German databases is the comparative
number of vehicle occupants involved in injury crashes that fall into each injury severity level (

CEA/EC SARAC II Data Sources
37
Table 4).
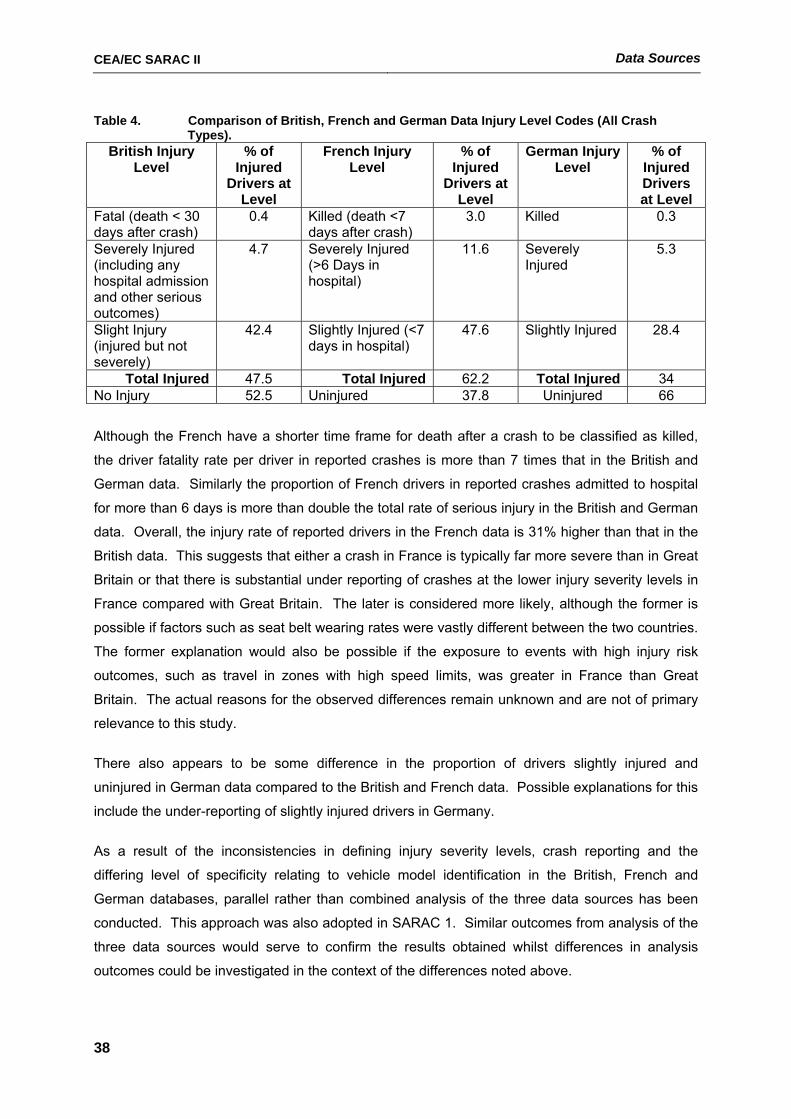
CEA/EC SARAC II Data Sources
38
Table 4. Comparison of British, French and German Data Injury Level Codes (All Crash Types).
British Injury Level
% of Injured
Drivers at Level
French Injury Level
% of Injured
Drivers at Level
German Injury Level
% of Injured Drivers at Level
Fatal (death < 30 days after crash)
0.4 Killed (death <7 days after crash)
3.0 Killed 0.3
Severely Injured (including any hospital admission and other serious outcomes)
4.7 Severely Injured (>6 Days in hospital)
11.6 Severely Injured
5.3
Slight Injury (injured but not severely)
42.4 Slightly Injured (<7 days in hospital)
47.6 Slightly Injured 28.4
Total Injured 47.5 Total Injured 62.2 Total Injured 34 No Injury 52.5 Uninjured 37.8 Uninjured 66
Although the French have a shorter time frame for death after a crash to be classified as killed,
the driver fatality rate per driver in reported crashes is more than 7 times that in the British and
German data. Similarly the proportion of French drivers in reported crashes admitted to hospital
for more than 6 days is more than double the total rate of serious injury in the British and German
data. Overall, the injury rate of reported drivers in the French data is 31% higher than that in the
British data. This suggests that either a crash in France is typically far more severe than in Great
Britain or that there is substantial under reporting of crashes at the lower injury severity levels in
France compared with Great Britain. The later is considered more likely, although the former is
possible if factors such as seat belt wearing rates were vastly different between the two countries.
The former explanation would also be possible if the exposure to events with high injury risk
outcomes, such as travel in zones with high speed limits, was greater in France than Great
Britain. The actual reasons for the observed differences remain unknown and are not of primary
relevance to this study.
There also appears to be some difference in the proportion of drivers slightly injured and
uninjured in German data compared to the British and French data. Possible explanations for this
include the under-reporting of slightly injured drivers in Germany.
As a result of the inconsistencies in defining injury severity levels, crash reporting and the
differing level of specificity relating to vehicle model identification in the British, French and
German databases, parallel rather than combined analysis of the three data sources has been
conducted. This approach was also adopted in SARAC 1. Similar outcomes from analysis of the
three data sources would serve to confirm the results obtained whilst differences in analysis
outcomes could be investigated in the context of the differences noted above.

CEA/EC SARAC II Data Sources
39
CEA/EC SARAC II Methods
40
3 Methods
3.1 Real Crash Based Vehicle Safety Measures
Previous studies of the relationship between real crash outcomes in the US and Australia and
vehicle crash barrier test outcomes have measured real crash outcomes by the crashworthiness
measure developed by MUARC and described in Newstead et al (1999). The MUARC
crashworthiness rating (C) is a measure of the risk of serious injury to a driver of vehicle
make/model when it is involved in a crash. It is defined to be the product of two probabilities
(Cameron et al. 1992a):
i) the probability that a driver involved in a crash is injured (injury risk), denoted by R;
and
ii) the probability that an injured driver is hospitalised or killed (injury severity), denoted by S.
Hence,
C = R x S.
For the estimation of crashworthiness ratings (Newstead et, al, 1999), each of the two
components of the crashworthiness rating was obtained by logistic regression modelling
techniques. Such techniques are able to simultaneously adjust for the effect of a number of non-
vehicle related factors (such as driver age, driver sex, number of vehicles involved, etc.) on
probabilities of injury risk and injury severity. Details of the technique are given in Newstead et al
(1999) including methods for calculating confidence limits on both of the individual injury risk and
severity component estimates as well as crashworthiness ratings. Technical details of the logistic
regression procedure can be found in, amongst others, Hosmer & Lemeshow (1989).
Using the British, French, German and Australian and New Zealand data sets described above,
the MUARC injury severity measure can be estimated. For Australian and New Zealand data set
the MUARC injury risk measure can be estimated. However, calculation of the MUARC risk
measure requires complete non-injury crash data which is not available in either the British or
French data. The use of alternative injury risk measures was examined in SARAC I sub-task 1.6,
and comparisons of the relative outcomes of each method were made. The analysis
demonstrated that of the available established methods designed for use on injury only crash
databases, the DfT method gave estimates of injury risk closest to those produced by the
MUARC method. In addition, real crash based injury risk ratings computed from US data in
CEA/EC SARAC II Methods
41
SARAC I sub-task 1.6 using the DfT and MUARC methods each had a similar level of correlation
with the US crash barrier test results. Therefore in this study, for the British and French data, the
DfT method was used to estimate the injury risk component of the crashworthiness ratings for
comparison with the EuroNCAP test results. This approach was also adopted for the German
data to maintain consistency in the methods applied to European data.
Estimation of the injury risk component of the crashworthiness rating using the DfT method
involves identifying crashes between two passenger vehicles in the data. Single vehicle crashes
cannot be used in the analysis, as injury in the focus vehicle is a prerequisite to inclusion in an
injury crash database. The DfT injury risk measure calculates a conditional probability of driver
injury given involvement in a two-car crash where at least one driver was injured. This risk
measure is easily computed using logistic regression analysis where the dependent variable is
the injury outcome of the driver dichotomised into the categories injured and not injured. Using
logistic regression analysis allows the effects of confounding influences on injury outcome
external to vehicle design, such as driver and crash characteristics, to be easily controlled. The
logistic regression analysis was performed in the statistical computer package SAS using the
logistic procedure. It is noted that the estimates of crashworthiness, injury risk and injury severity
were calculated by the authors of this report using a modification of the method developed by the
DfT. The results of the estimation process should in no way be interpreted as endorsed by the
DfT.
A second measure of injury risk, denoted the Newstead method, has also been estimated for the
three crash groupings considered (all crash types, front impact and side impact crashes) for the
British, French and German data. The Newstead method is described in detail in the SARAC I
sub-task 1.6 and 3.4 project reports. It stems from considering the same 2-car crash outcomes on
which the DfT injury risk measure is estimated. Essentially, the Newstead injury risk measure is
interpreted as a conditional probability of driver injury in the focus vehicle given the driver of the
vehicle colliding with the focus vehicle is injured. As for the DfT injury risk measure, the Newstead
injury risk measure is easily computed using logistic regression analysis where the dependent
variable is the injury outcome of the driver, conditional on the driver of the other vehicle being
injured, dichotomised into the categories injured and not injured. The logistic regression analysis
was performed in the statistical computer package SAS using the logistic procedure
Procedures for estimation of the severity component of the crashworthiness rating using the
MUARC method are well documented in Newstead et al (1999). Estimation of the severity
component is unaffected by the lack of non-injury crashes in the database. Following the
MUARC method, all crash types, both single and multi-vehicle, are used for estimation of the
severity component with adjustment made for the number of vehicles involved in the crash via the
logistic regression procedure. Use of single vehicle crashes in the severity analysis was
CEA/EC SARAC II Methods
42
considered justified as this crash type is fully reported in an injury only database with respect to
measuring the risk of serious driver injury given any driver injury. It also provides large quantities
of data in addition to that available from two vehicle crashes leading to increased accuracy of
estimation of the severity index. Experience in producing the Australian crashworthiness ratings
(Newstead et al 1999) has shown single vehicle crashes tend to result in more severe injury
outcomes than multi vehicle crashes. However, any propensity for greater or lesser involvement
in single vehicle crashes than average of a particular vehicle model that might bias the estimated
severity index can be controlled using the logistic regression analysis technique.
Following the methods used the SARAC I, sub-task 2.2, study comparing real crash outcomes
against vehicle crash barrier test measures, crashworthiness ratings were computed for all crash
types as well as for crash types comparable to the barrier test crash configurations. Specific crash
types considered were crashes involving a front impact to the focus vehicle and crashes involving
a side impact to the driver’s side of the focus vehicle. Variables used to select the specific crash
types of interest from the real crash databases are described in the Data section above.
3.1.1 Factors Considered in the Logistic Models for Injury Risk and Injury Severity
A number of factors thought to influence the risk of severity of injury to drivers involved in crashes
were included in the logistic models in order to obtain estimates of vehicle safety unbiased by
these factors. The factors considered in the analysis for injury risk and severity for each of the
types of British crashworthiness rating calculated, were:
• drv_sex: sex of driver (male, female)
• drv_age: age of driver (≤25 years; 26-59 years; ≥60years)
• spd_lim: speed limit at the crash location (<40mph; 41-59mph; ≥60mph)
• junction junction detail (intersection; non-intersection)
• poi first point of impact (did not impact; front; back; offside; nearside)
• yea year of crash
In addition, the variable num_veh (number of vehicles involved: one vehicle, ≥1 vehicle) was
used in the injury severity analysis. Base effects as well as all possible interactions of these
variables were included in the logistic regression analyses.
The factors considered in the analysis for both injury risk and injury severity for each of the types
of French crashworthiness rating calculated, were:
CEA/EC SARAC II Methods
43
• sex: driver sex (male, female)
• age: driver age (≤25 years; 26-59 years; ≥60years)
• int: intersection (intersection; non-intersection; other)
• urb: urbanisation of location (rural; urban)
• yea year of crash
In addition, nbv: (number of vehicles involved; one vehicle, ≥1 vehicle) was included in the injury
severity analysis. Again, base effects as well as all possible interactions of these variables were
included in the logistic regression analyses. Speed limit at the crash site was not available in the
French crash data so urbanisation of location was included in the analysis as a proxy for speed
limit.
The factors considered in the analysis for both injury risk and injury severity for each of the types
of German crashworthiness rating calculated, were:
• sex: driver sex (male, female)
• age: driver age (<25 years; 25-64 years; ≥65years)
• int: intersection (intersection; non-intersection)
• loc: location of crash (within built-in areas; outside built-in areas)
• cost: cost of vehicle damage in ‘000 € (<2; 2-2.9; 3-3.9; 4-4.9;5-9.9; 10-14.9;
15-24.9; ≥25)
• year year of crash (1998, 1999, …, 2000)
In addition, nbv: (number of vehicles involved; one vehicle, ≥1 vehicle) was included in the injury
severity analysis. Again, base effects as well as all possible interactions of these variables were
included in the logistic regression analyses. Speed limit at the crash site was not available in the
German crash data; crash location was included in the analysis as a proxy for speed limit.
The factors considered in the analysis for both injury risk and injury severity for the Australian and
New Zealand crashworthiness ratings calculated, were:
• sex: driver sex (male, female)
• age: driver age (≤25 years; 26-59 years; ≥60 years)
CEA/EC SARAC II Methods
44
• speedzone: speed limit at the crash location (≤75 km/h; ≥80 km/h)
• nveh: the number of vehicles involved (one vehicle; >1 vehicle)
• state: jurisdiction of crash (Victoria, NSW, QLD, WA, NZ)
• year: year of crash (1987, 1988, … ,2002)
These variables were chosen for consideration because they were part of the Victorian,
Queensland, New South Wales, Western Australia and New Zealand databases. Other variables
were only available from one source and their inclusion would have drastically reduced the
number of cases that could have been included in the analysis.
Jurisdiction of crash was a necessary inclusion in the logistic model because each jurisdiction has
its own level of general road safety performance that affects injury outcome. Including the
jurisdiction factor in the covariate model is necessary to adjust for rating bias towards those
vehicle models that are sold and driven more in one jurisdiction than another. There is also some
indication of reporting bias by crash severity in some jurisdictions that is also controlled by
including the jurisdiction variable in the regression models. Inclusion of a year of crash indicator in
the model is necessary to adjust for the different trends in crash severity noted between each of
the jurisdictions.
3.2 Methods of comparing crashworthiness ratings with EuroNCAP scores
Preliminary analysis has focused on examining the average crashworthiness ratings derived from
the police reported data of vehicles within each overall star-rating category assigned by the
EuroNCAP test program. Lie and Tingvall (2000) have used this approach to make basic
comparisons of real crash outcomes in Sweden with EuroNCAP test results. Comparison was
made for each crash type considered in the real crash data with specific comparisons between
the frontal crash ratings and the offset frontal EuroNCAP test results and the side impact crash
ratings and side impact test EuroNCAP score.
As well as examining the average injury outcome in police reported crashes within each
EuroNCAP star rating, comparisons have also been made on a vehicle by vehicle basis.
Comparisons on this basis were made graphically with the underlying EuroNCAP score from
which the overall star ratings is derived plotted against the crashworthiness ratings calculated
from the police reported data. Comparisons have been made for all crash types as well as frontal
and side impact crashes.
CEA/EC SARAC II Results
45
4 Results Before presenting the results of analysis completed for this project, it is worth noting that a
number of qualifications on the results presented are relevant. These qualifications are made in
detail in the Discussion section below, but the relevant points can be summarised briefly here.
They are:
• Real crash data used in this report covers the period up to 2002 at the latest whilst the first
EuroNCAP test results were not published until early 1997. This means that sample sizes for
some makes/models used in this analysis are small. However, the relative accuracy of the
real crash outcomes is reflected in the statistical confidence bounds on the estimates.
• There are fundamental differences in the measures of vehicle safety represented by
EuroNCAP and derived from analysis of the real crash data. In addition, there are also clear
differences in the range of crash situations and configurations that the two measures being
compared represent, beyond those factors that have been made comparable by the study
design.
• Classification of injury severity in the real crash data is made on a fairly coarse scale and
hence analysis of such data may not be able to differentiate safety performance between
vehicles on a level less than the resolution of the scale.
• There could be differences in the characteristics of vehicles examined by EuroNCAP and
those dominant in the field data at this stage of data analysis because manufacturers
sometimes adapt existing models with running changes before the NCAP test. Every attempt
has been made to avoid this limitation by selecting vehicle appearing in the police crash data
that best match the specifications of the EuroNCAP tested vehicle based on the information
available.
4.1 Identification of EuroNCAP Tested Vehicle Models
As described above, information was supplied in the EuroNCAP publications on tested vehicle
make and model whilst information on specifications of vehicles in the British vehicle model fleet
was obtained from the “WhatCar?” publications and other sources. Using this information, a
vehicle comparison table matching EuroNCAP tested vehicles with comparable models in the
British fleet was designed. The vehicle comparison table was circulated amongst the SARAC
participants for comment. Replies were received from DfT, Renault-Peugeot-Citroen via LAB,
Daimler Chrysler and Ford Europe. Modification of the vehicle matching table was then made
incorporating the feedback from the SARAC members. The resulting final matching table is
shown in Appendix A. Description of all the fields in the table can also be found in Appendix A.
CEA/EC SARAC II Results
46
Whilst the vehicle model matching table in Appendix A has been derived primarily from British
data sources, it has also been used to identify EuroNCAP tested vehicle models appearing in the
French and German crash data. In some instances, variations in the specification of standard
safety equipment in the European vehicle models are noted in Appendix A, however the dates of
introduction of the each vehicle model have been presumed to be the same in France and Great
Britain. No information to discredit this presumption has been available to date.
4.1.1 EuroNCAP Tested Vehicle Models Identified in the British Crash Data
Using the model comparison table in Appendix A, EuroNCAP tested vehicle model codes were
identified in the British model codes supplied by the DfT. The selected model codes were then
merged onto the British crash data to identify EuroNCAP tested comparable vehicle models
appearing in the crash database.
CEA/EC SARAC II Results
47
Table 5 gives the number of involved and injured drivers of EuroNCAP tested vehicles that had
sufficient real crash data to be included in the analysis. Past experience in estimating vehicle
safety ratings based on real crash data has shown there needs to be a minimum of 80 vehicles of
the focus type involved in 2 car injury crashes to ensure successful estimation of the injury risk
measures. Similarly, there needs to be at least 20 drivers injured in all crash types involving the
focus vehicle (excluding crashes with fixed objects and light goods vehicles) to successfully
estimate the injury severity index for that vehicle model. These selection criteria have been
applied in this study for identification of vehicle models with sufficient data to be included in the
study. The number of cases for all crash types, frontal impact crashes and side impact crashes
are shown separately. Vehicle models with empty cells in

CEA/EC SARAC II Results
48
Table 5 had insufficient data to be included in the analysis.
Of the 138 EuroNCAP crash tested vehicle models listed in Table 1 there were 70, 54 and 23
vehicles with sufficient real crash data from all crash types, frontal impact crashes and side
impact crashes, respectively, to be included in the analysis. The crash data was used to assess
the injury risk and severity of the drivers of the different makes and models of EuroNCAP tested
vehicles for each crash type.
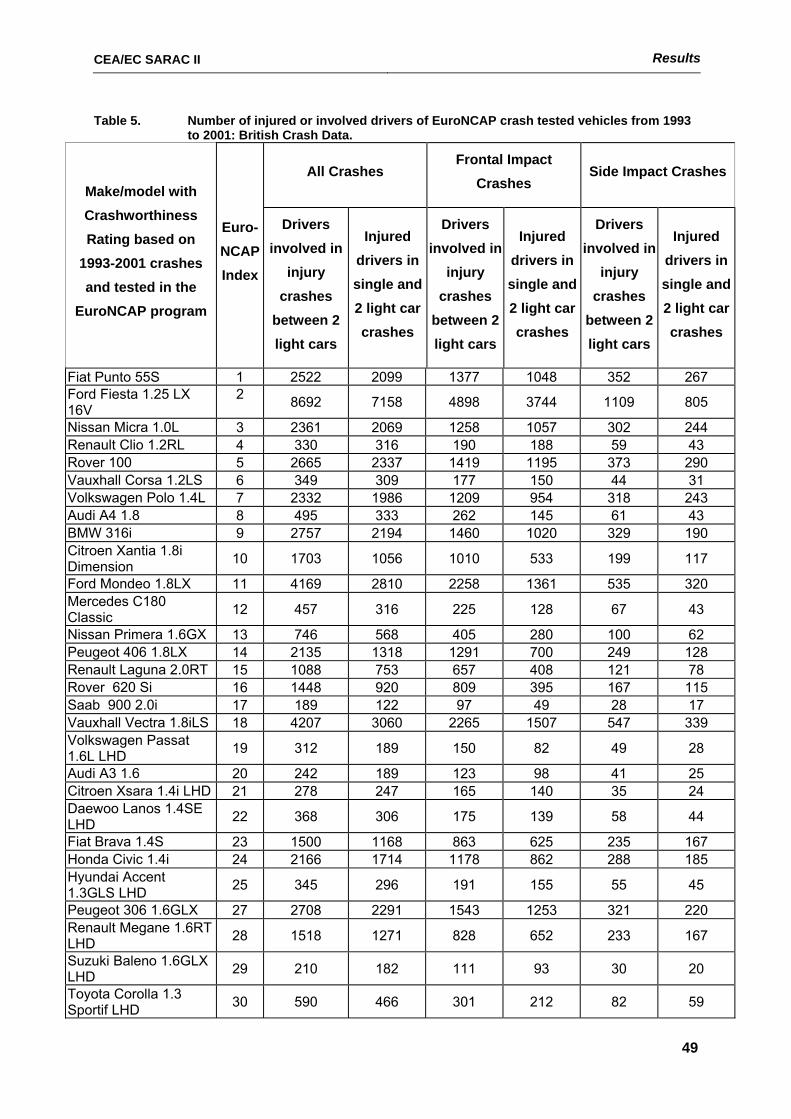
CEA/EC SARAC II Results
49
Table 5. Number of injured or involved drivers of EuroNCAP crash tested vehicles from 1993 to 2001: British Crash Data.
All Crashes Frontal Impact
Crashes Side Impact Crashes
Make/model with Crashworthiness Rating based on
1993-2001 crashes and tested in the
EuroNCAP program
Euro-NCAP Index
Drivers involved in
injury crashes
between 2 light cars
Injured drivers in single and 2 light car crashes
Drivers involved in
injury crashes
between 2 light cars
Injured drivers in single and 2 light car crashes
Drivers involved in
injury crashes
between 2 light cars
Injured drivers in single and 2 light car crashes
Fiat Punto 55S 1 2522 2099 1377 1048 352 267 Ford Fiesta 1.25 LX 16V
2 8692 7158 4898 3744 1109 805
Nissan Micra 1.0L 3 2361 2069 1258 1057 302 244 Renault Clio 1.2RL 4 330 316 190 188 59 43 Rover 100 5 2665 2337 1419 1195 373 290 Vauxhall Corsa 1.2LS 6 349 309 177 150 44 31 Volkswagen Polo 1.4L 7 2332 1986 1209 954 318 243 Audi A4 1.8 8 495 333 262 145 61 43 BMW 316i 9 2757 2194 1460 1020 329 190 Citroen Xantia 1.8i Dimension 10 1703 1056 1010 533 199 117
Ford Mondeo 1.8LX 11 4169 2810 2258 1361 535 320 Mercedes C180 Classic 12 457 316 225 128 67 43
Nissan Primera 1.6GX 13 746 568 405 280 100 62 Peugeot 406 1.8LX 14 2135 1318 1291 700 249 128 Renault Laguna 2.0RT 15 1088 753 657 408 121 78 Rover 620 Si 16 1448 920 809 395 167 115 Saab 900 2.0i 17 189 122 97 49 28 17 Vauxhall Vectra 1.8iLS 18 4207 3060 2265 1507 547 339 Volkswagen Passat 1.6L LHD 19 312 189 150 82 49 28
Audi A3 1.6 20 242 189 123 98 41 25 Citroen Xsara 1.4i LHD 21 278 247 165 140 35 24 Daewoo Lanos 1.4SE LHD 22 368 306 175 139 58 44
Fiat Brava 1.4S 23 1500 1168 863 625 235 167 Honda Civic 1.4i 24 2166 1714 1178 862 288 185 Hyundai Accent 1.3GLS LHD 25 345 296 191 155 55 45
Peugeot 306 1.6GLX 27 2708 2291 1543 1253 321 220 Renault Megane 1.6RT LHD 28 1518 1271 828 652 233 167
Suzuki Baleno 1.6GLX LHD 29 210 182 111 93 30 20
Toyota Corolla 1.3 Sportif LHD 30 590 466 301 212 82 59
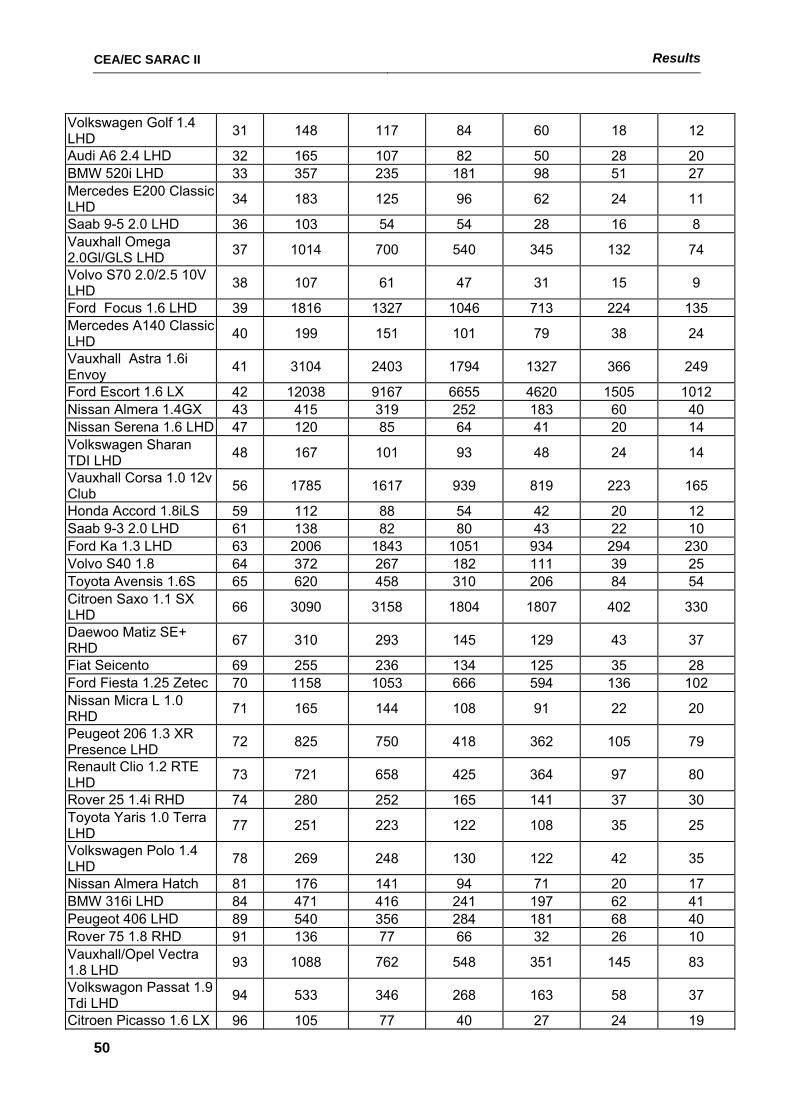
CEA/EC SARAC II Results
50
Volkswagen Golf 1.4 LHD 31 148 117 84 60 18 12
Audi A6 2.4 LHD 32 165 107 82 50 28 20 BMW 520i LHD 33 357 235 181 98 51 27 Mercedes E200 Classic LHD 34 183 125 96 62 24 11
Saab 9-5 2.0 LHD 36 103 54 54 28 16 8 Vauxhall Omega 2.0Gl/GLS LHD 37 1014 700 540 345 132 74
Volvo S70 2.0/2.5 10V LHD 38 107 61 47 31 15 9
Ford Focus 1.6 LHD 39 1816 1327 1046 713 224 135 Mercedes A140 Classic LHD 40 199 151 101 79 38 24
Vauxhall Astra 1.6i Envoy 41 3104 2403 1794 1327 366 249
Ford Escort 1.6 LX 42 12038 9167 6655 4620 1505 1012 Nissan Almera 1.4GX 43 415 319 252 183 60 40 Nissan Serena 1.6 LHD 47 120 85 64 41 20 14 Volkswagen Sharan TDI LHD 48 167 101 93 48 24 14
Vauxhall Corsa 1.0 12v Club 56 1785 1617 939 819 223 165
Honda Accord 1.8iLS 59 112 88 54 42 20 12 Saab 9-3 2.0 LHD 61 138 82 80 43 22 10 Ford Ka 1.3 LHD 63 2006 1843 1051 934 294 230 Volvo S40 1.8 64 372 267 182 111 39 25 Toyota Avensis 1.6S 65 620 458 310 206 84 54 Citroen Saxo 1.1 SX LHD 66 3090 3158 1804 1807 402 330
Daewoo Matiz SE+ RHD 67 310 293 145 129 43 37
Fiat Seicento 69 255 236 134 125 35 28 Ford Fiesta 1.25 Zetec 70 1158 1053 666 594 136 102 Nissan Micra L 1.0 RHD 71 165 144 108 91 22 20
Peugeot 206 1.3 XR Presence LHD 72 825 750 418 362 105 79
Renault Clio 1.2 RTE LHD 73 721 658 425 364 97 80
Rover 25 1.4i RHD 74 280 252 165 141 37 30 Toyota Yaris 1.0 Terra LHD 77 251 223 122 108 35 25
Volkswagen Polo 1.4 LHD 78 269 248 130 122 42 35
Nissan Almera Hatch 81 176 141 94 71 20 17 BMW 316i LHD 84 471 416 241 197 62 41 Peugeot 406 LHD 89 540 356 284 181 68 40 Rover 75 1.8 RHD 91 136 77 66 32 26 10 Vauxhall/Opel Vectra 1.8 LHD 93 1088 762 548 351 145 83
Volkswagon Passat 1.9 Tdi LHD 94 533 346 268 163 58 37
Citroen Picasso 1.6 LX 96 105 77 40 27 24 19
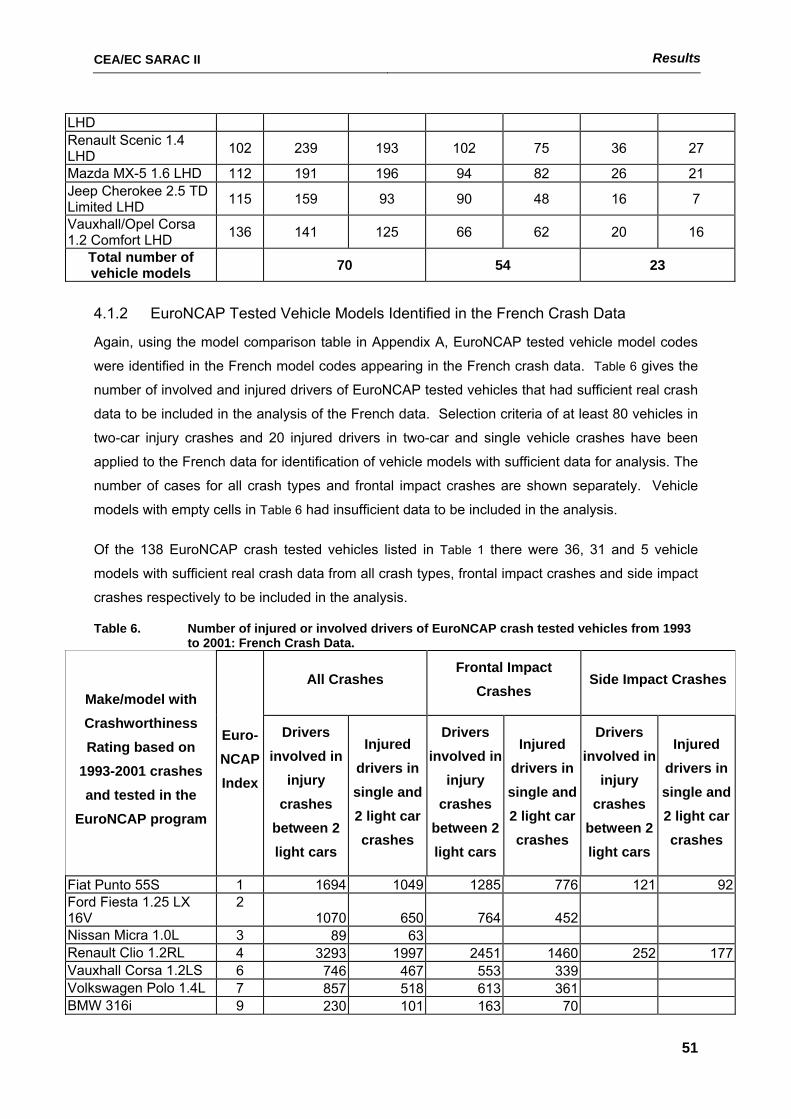
CEA/EC SARAC II Results
51
LHD Renault Scenic 1.4 LHD 102 239 193 102 75 36 27
Mazda MX-5 1.6 LHD 112 191 196 94 82 26 21 Jeep Cherokee 2.5 TD Limited LHD 115 159 93 90 48 16 7
Vauxhall/Opel Corsa 1.2 Comfort LHD 136 141 125 66 62 20 16
Total number of vehicle models 70 54 23
4.1.2 EuroNCAP Tested Vehicle Models Identified in the French Crash Data
Again, using the model comparison table in Appendix A, EuroNCAP tested vehicle model codes
were identified in the French model codes appearing in the French crash data. Table 6 gives the
number of involved and injured drivers of EuroNCAP tested vehicles that had sufficient real crash
data to be included in the analysis of the French data. Selection criteria of at least 80 vehicles in
two-car injury crashes and 20 injured drivers in two-car and single vehicle crashes have been
applied to the French data for identification of vehicle models with sufficient data for analysis. The
number of cases for all crash types and frontal impact crashes are shown separately. Vehicle
models with empty cells in Table 6 had insufficient data to be included in the analysis.
Of the 138 EuroNCAP crash tested vehicles listed in Table 1 there were 36, 31 and 5 vehicle
models with sufficient real crash data from all crash types, frontal impact crashes and side impact
crashes respectively to be included in the analysis.
Table 6. Number of injured or involved drivers of EuroNCAP crash tested vehicles from 1993 to 2001: French Crash Data.
All Crashes Frontal Impact
Crashes Side Impact Crashes
Make/model with Crashworthiness Rating based on
1993-2001 crashes and tested in the
EuroNCAP program
Euro-NCAP Index
Drivers involved in
injury crashes
between 2 light cars
Injured drivers in single and 2 light car crashes
Drivers involved in
injury crashes
between 2 light cars
Injured drivers in single and 2 light car crashes
Drivers involved in
injury crashes
between 2 light cars
Injured drivers in single and 2 light car crashes
Fiat Punto 55S 1 1694 1049 1285 776 121 92Ford Fiesta 1.25 LX 16V
2 1070 650 764 452
Nissan Micra 1.0L 3 89 63 Renault Clio 1.2RL 4 3293 1997 2451 1460 252 177Vauxhall Corsa 1.2LS 6 746 467 553 339 Volkswagen Polo 1.4L 7 857 518 613 361 BMW 316i 9 230 101 163 70
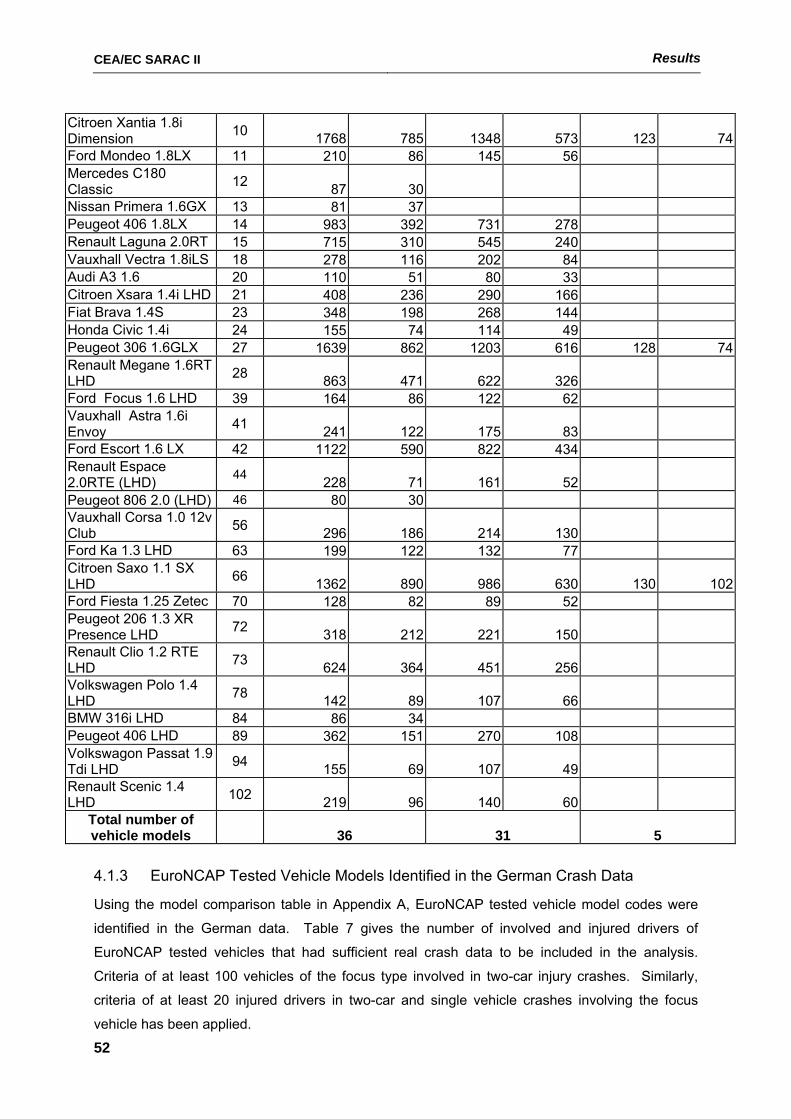
CEA/EC SARAC II Results
52
Citroen Xantia 1.8i Dimension 10 1768 785 1348 573 123 74Ford Mondeo 1.8LX 11 210 86 145 56 Mercedes C180 Classic 12 87 30 Nissan Primera 1.6GX 13 81 37 Peugeot 406 1.8LX 14 983 392 731 278 Renault Laguna 2.0RT 15 715 310 545 240 Vauxhall Vectra 1.8iLS 18 278 116 202 84 Audi A3 1.6 20 110 51 80 33 Citroen Xsara 1.4i LHD 21 408 236 290 166 Fiat Brava 1.4S 23 348 198 268 144 Honda Civic 1.4i 24 155 74 114 49 Peugeot 306 1.6GLX 27 1639 862 1203 616 128 74Renault Megane 1.6RT LHD 28 863 471 622 326 Ford Focus 1.6 LHD 39 164 86 122 62 Vauxhall Astra 1.6i Envoy 41 241 122 175 83 Ford Escort 1.6 LX 42 1122 590 822 434 Renault Espace 2.0RTE (LHD) 44 228 71 161 52 Peugeot 806 2.0 (LHD) 46 80 30 Vauxhall Corsa 1.0 12v Club 56 296 186 214 130 Ford Ka 1.3 LHD 63 199 122 132 77 Citroen Saxo 1.1 SX LHD 66 1362 890 986 630 130 102Ford Fiesta 1.25 Zetec 70 128 82 89 52 Peugeot 206 1.3 XR Presence LHD 72 318 212 221 150 Renault Clio 1.2 RTE LHD 73 624 364 451 256 Volkswagen Polo 1.4 LHD 78 142 89 107 66 BMW 316i LHD 84 86 34 Peugeot 406 LHD 89 362 151 270 108 Volkswagon Passat 1.9 Tdi LHD 94 155 69 107 49 Renault Scenic 1.4 LHD 102 219 96 140 60
Total number of vehicle models 36 31 5
4.1.3 EuroNCAP Tested Vehicle Models Identified in the German Crash Data
Using the model comparison table in Appendix A, EuroNCAP tested vehicle model codes were
identified in the German data. Table 7 gives the number of involved and injured drivers of
EuroNCAP tested vehicles that had sufficient real crash data to be included in the analysis.
Criteria of at least 100 vehicles of the focus type involved in two-car injury crashes. Similarly,
criteria of at least 20 injured drivers in two-car and single vehicle crashes involving the focus
vehicle has been applied.
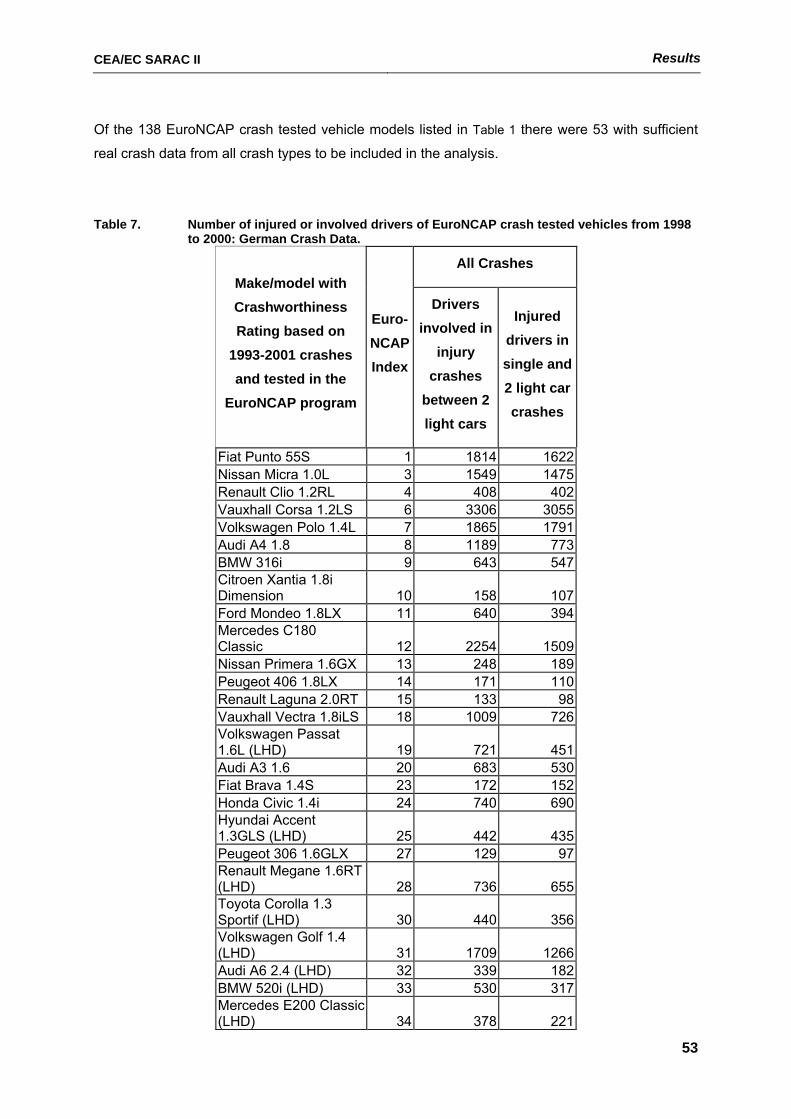
CEA/EC SARAC II Results
53
Of the 138 EuroNCAP crash tested vehicle models listed in Table 1 there were 53 with sufficient
real crash data from all crash types to be included in the analysis.
Table 7. Number of injured or involved drivers of EuroNCAP crash tested vehicles from 1998 to 2000: German Crash Data.
All Crashes Make/model with Crashworthiness Rating based on
1993-2001 crashes and tested in the
EuroNCAP program
Euro-NCAP Index
Drivers involved in
injury crashes
between 2 light cars
Injured drivers in single and 2 light car crashes
Fiat Punto 55S 1 1814 1622 Nissan Micra 1.0L 3 1549 1475 Renault Clio 1.2RL 4 408 402 Vauxhall Corsa 1.2LS 6 3306 3055 Volkswagen Polo 1.4L 7 1865 1791 Audi A4 1.8 8 1189 773 BMW 316i 9 643 547 Citroen Xantia 1.8i Dimension 10 158 107 Ford Mondeo 1.8LX 11 640 394 Mercedes C180 Classic 12 2254 1509 Nissan Primera 1.6GX 13 248 189 Peugeot 406 1.8LX 14 171 110 Renault Laguna 2.0RT 15 133 98 Vauxhall Vectra 1.8iLS 18 1009 726 Volkswagen Passat 1.6L (LHD) 19 721 451 Audi A3 1.6 20 683 530 Fiat Brava 1.4S 23 172 152 Honda Civic 1.4i 24 740 690 Hyundai Accent 1.3GLS (LHD) 25 442 435 Peugeot 306 1.6GLX 27 129 97 Renault Megane 1.6RT (LHD) 28 736 655 Toyota Corolla 1.3 Sportif (LHD) 30 440 356 Volkswagen Golf 1.4 (LHD) 31 1709 1266 Audi A6 2.4 (LHD) 32 339 182 BMW 520i (LHD) 33 530 317 Mercedes E200 Classic (LHD) 34 378 221
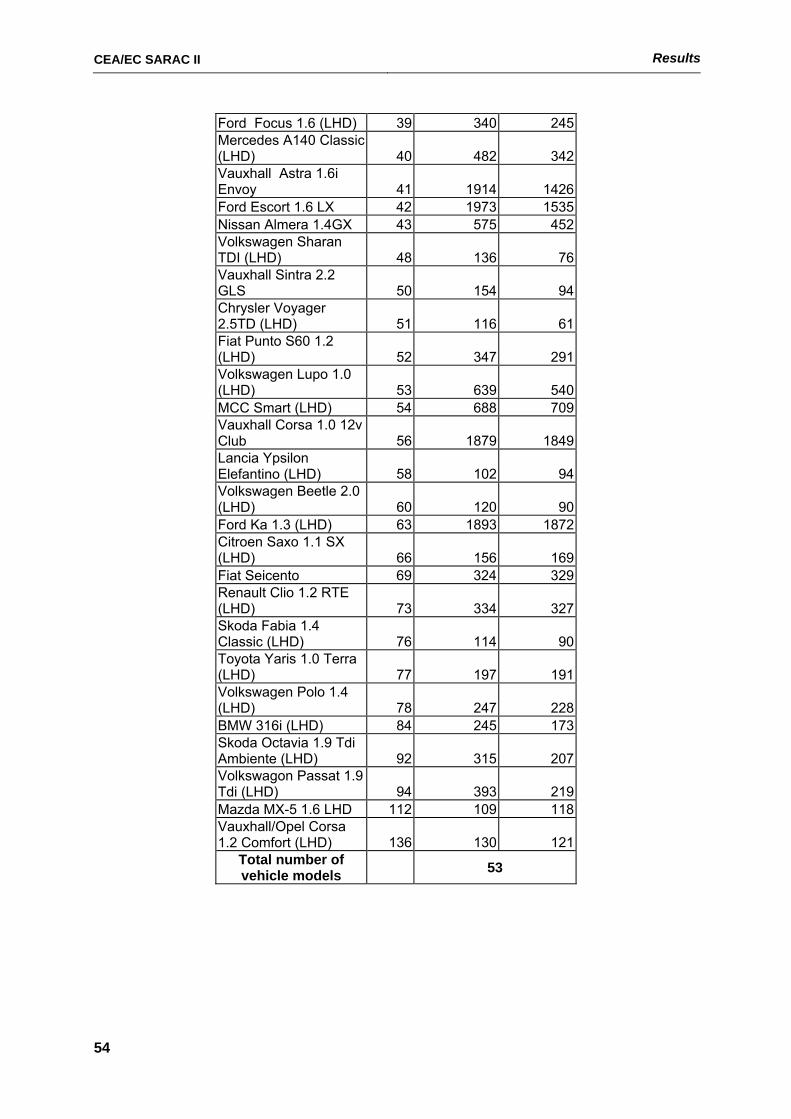
CEA/EC SARAC II Results
54
Ford Focus 1.6 (LHD) 39 340 245 Mercedes A140 Classic (LHD) 40 482 342 Vauxhall Astra 1.6i Envoy 41 1914 1426 Ford Escort 1.6 LX 42 1973 1535 Nissan Almera 1.4GX 43 575 452 Volkswagen Sharan TDI (LHD) 48 136 76 Vauxhall Sintra 2.2 GLS 50 154 94 Chrysler Voyager 2.5TD (LHD) 51 116 61 Fiat Punto S60 1.2 (LHD) 52 347 291 Volkswagen Lupo 1.0 (LHD) 53 639 540 MCC Smart (LHD) 54 688 709 Vauxhall Corsa 1.0 12v Club 56 1879 1849 Lancia Ypsilon Elefantino (LHD) 58 102 94 Volkswagen Beetle 2.0 (LHD) 60 120 90 Ford Ka 1.3 (LHD) 63 1893 1872 Citroen Saxo 1.1 SX (LHD) 66 156 169 Fiat Seicento 69 324 329 Renault Clio 1.2 RTE (LHD) 73 334 327 Skoda Fabia 1.4 Classic (LHD) 76 114 90 Toyota Yaris 1.0 Terra (LHD) 77 197 191 Volkswagen Polo 1.4 (LHD) 78 247 228 BMW 316i (LHD) 84 245 173 Skoda Octavia 1.9 Tdi Ambiente (LHD) 92 315 207 Volkswagon Passat 1.9 Tdi (LHD) 94 393 219 Mazda MX-5 1.6 LHD 112 109 118 Vauxhall/Opel Corsa 1.2 Comfort (LHD) 136 130 121
Total number of vehicle models 53
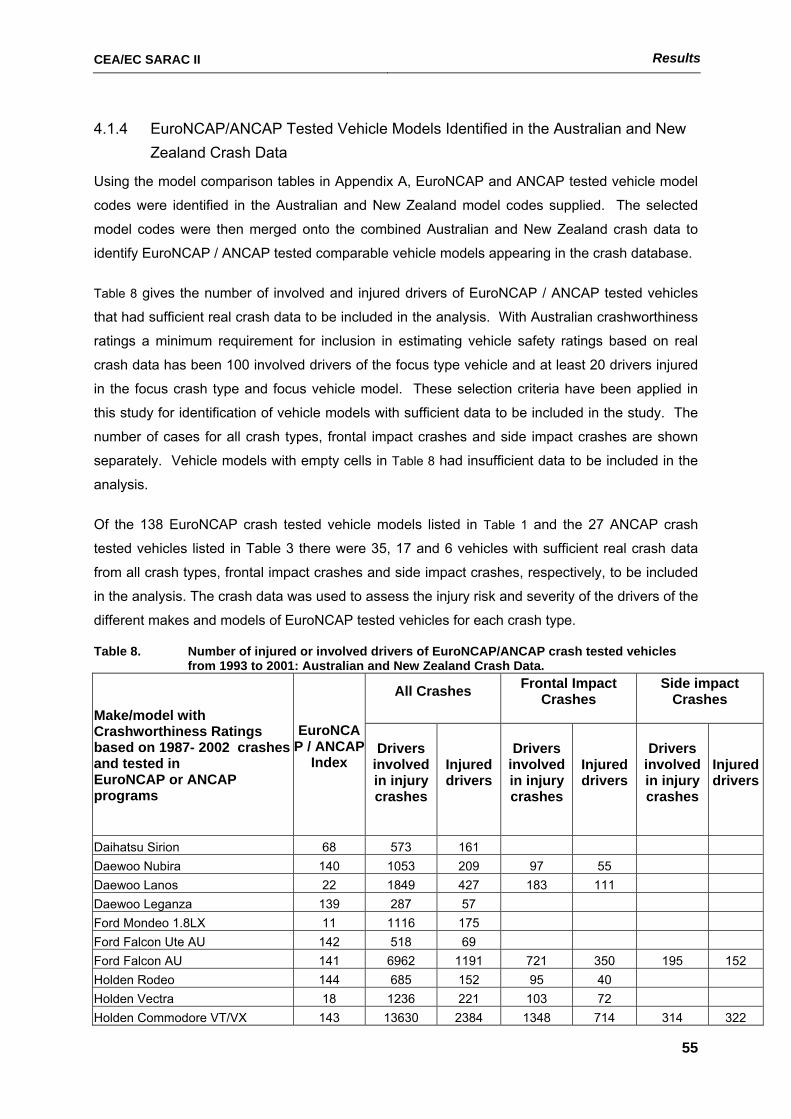
CEA/EC SARAC II Results
55
4.1.4 EuroNCAP/ANCAP Tested Vehicle Models Identified in the Australian and New Zealand Crash Data
Using the model comparison tables in Appendix A, EuroNCAP and ANCAP tested vehicle model
codes were identified in the Australian and New Zealand model codes supplied. The selected
model codes were then merged onto the combined Australian and New Zealand crash data to
identify EuroNCAP / ANCAP tested comparable vehicle models appearing in the crash database.
Table 8 gives the number of involved and injured drivers of EuroNCAP / ANCAP tested vehicles
that had sufficient real crash data to be included in the analysis. With Australian crashworthiness
ratings a minimum requirement for inclusion in estimating vehicle safety ratings based on real
crash data has been 100 involved drivers of the focus type vehicle and at least 20 drivers injured
in the focus crash type and focus vehicle model. These selection criteria have been applied in
this study for identification of vehicle models with sufficient data to be included in the study. The
number of cases for all crash types, frontal impact crashes and side impact crashes are shown
separately. Vehicle models with empty cells in Table 8 had insufficient data to be included in the
analysis.
Of the 138 EuroNCAP crash tested vehicle models listed in Table 1 and the 27 ANCAP crash
tested vehicles listed in Table 3 there were 35, 17 and 6 vehicles with sufficient real crash data
from all crash types, frontal impact crashes and side impact crashes, respectively, to be included
in the analysis. The crash data was used to assess the injury risk and severity of the drivers of the
different makes and models of EuroNCAP tested vehicles for each crash type.
Table 8. Number of injured or involved drivers of EuroNCAP/ANCAP crash tested vehicles from 1993 to 2001: Australian and New Zealand Crash Data.
All Crashes Frontal Impact Crashes
Side impact Crashes
Make/model with Crashworthiness Ratings based on 1987- 2002 crashes and tested in EuroNCAP or ANCAP programs
EuroNCAP / ANCAP
Index Drivers
involved in injury crashes
Injured drivers
Drivers involved in injury crashes
Injured drivers
Drivers involved in injury crashes
Injured drivers
Daihatsu Sirion 68 573 161 Daewoo Nubira 140 1053 209 97 55 Daewoo Lanos 22 1849 427 183 111 Daewoo Leganza 139 287 57 Ford Mondeo 1.8LX 11 1116 175 Ford Falcon Ute AU 142 518 69 Ford Falcon AU 141 6962 1191 721 350 195 152 Holden Rodeo 144 685 152 95 40 Holden Vectra 18 1236 221 103 72 Holden Commodore VT/VX 143 13630 2384 1348 714 314 322
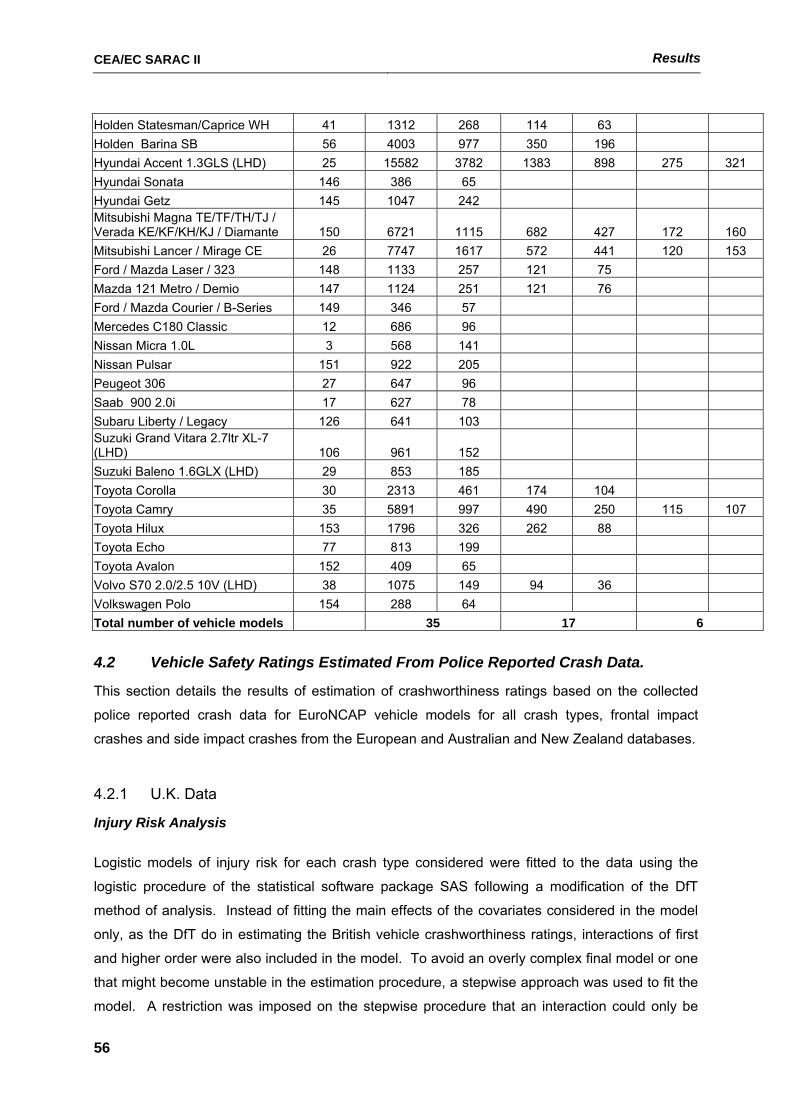
CEA/EC SARAC II Results
56
Holden Statesman/Caprice WH 41 1312 268 114 63 Holden Barina SB 56 4003 977 350 196 Hyundai Accent 1.3GLS (LHD) 25 15582 3782 1383 898 275 321 Hyundai Sonata 146 386 65 Hyundai Getz 145 1047 242 Mitsubishi Magna TE/TF/TH/TJ / Verada KE/KF/KH/KJ / Diamante 150 6721 1115 682 427 172 160 Mitsubishi Lancer / Mirage CE 26 7747 1617 572 441 120 153 Ford / Mazda Laser / 323 148 1133 257 121 75 Mazda 121 Metro / Demio 147 1124 251 121 76 Ford / Mazda Courier / B-Series 149 346 57 Mercedes C180 Classic 12 686 96 Nissan Micra 1.0L 3 568 141 Nissan Pulsar 151 922 205 Peugeot 306 27 647 96 Saab 900 2.0i 17 627 78 Subaru Liberty / Legacy 126 641 103 Suzuki Grand Vitara 2.7ltr XL-7 (LHD) 106 961 152 Suzuki Baleno 1.6GLX (LHD) 29 853 185 Toyota Corolla 30 2313 461 174 104 Toyota Camry 35 5891 997 490 250 115 107 Toyota Hilux 153 1796 326 262 88 Toyota Echo 77 813 199 Toyota Avalon 152 409 65 Volvo S70 2.0/2.5 10V (LHD) 38 1075 149 94 36 Volkswagen Polo 154 288 64 Total number of vehicle models 35 17 6
4.2 Vehicle Safety Ratings Estimated From Police Reported Crash Data.
This section details the results of estimation of crashworthiness ratings based on the collected
police reported crash data for EuroNCAP vehicle models for all crash types, frontal impact
crashes and side impact crashes from the European and Australian and New Zealand databases.
4.2.1 U.K. Data
Injury Risk Analysis
Logistic models of injury risk for each crash type considered were fitted to the data using the
logistic procedure of the statistical software package SAS following a modification of the DfT
method of analysis. Instead of fitting the main effects of the covariates considered in the model
only, as the DfT do in estimating the British vehicle crashworthiness ratings, interactions of first
and higher order were also included in the model. To avoid an overly complex final model or one
that might become unstable in the estimation procedure, a stepwise approach was used to fit the
model. A restriction was imposed on the stepwise procedure that an interaction could only be
CEA/EC SARAC II Results
57
considered in the model if the main effect terms of the interaction were significant predictors of
injury risk. This approach to fitting model interactions has been used successfully by MUARC in
estimating the Australian crashworthiness ratings. The approach also gives a greater chance that
the fit of the final model to the data will be acceptable.
Table 9 and Table 10 detail the main effects and interactions that were judged to be significant
predictors of injury risk through the stepwise logistic modelling approach for each crash type
considered. A variable indicating vehicle model was included as a main effect in each of the
models and was a significant predictor of injury risk in each case. The “vehicle model” variable
had distinct levels representing each of the EuroNCAP tested vehicle models given in
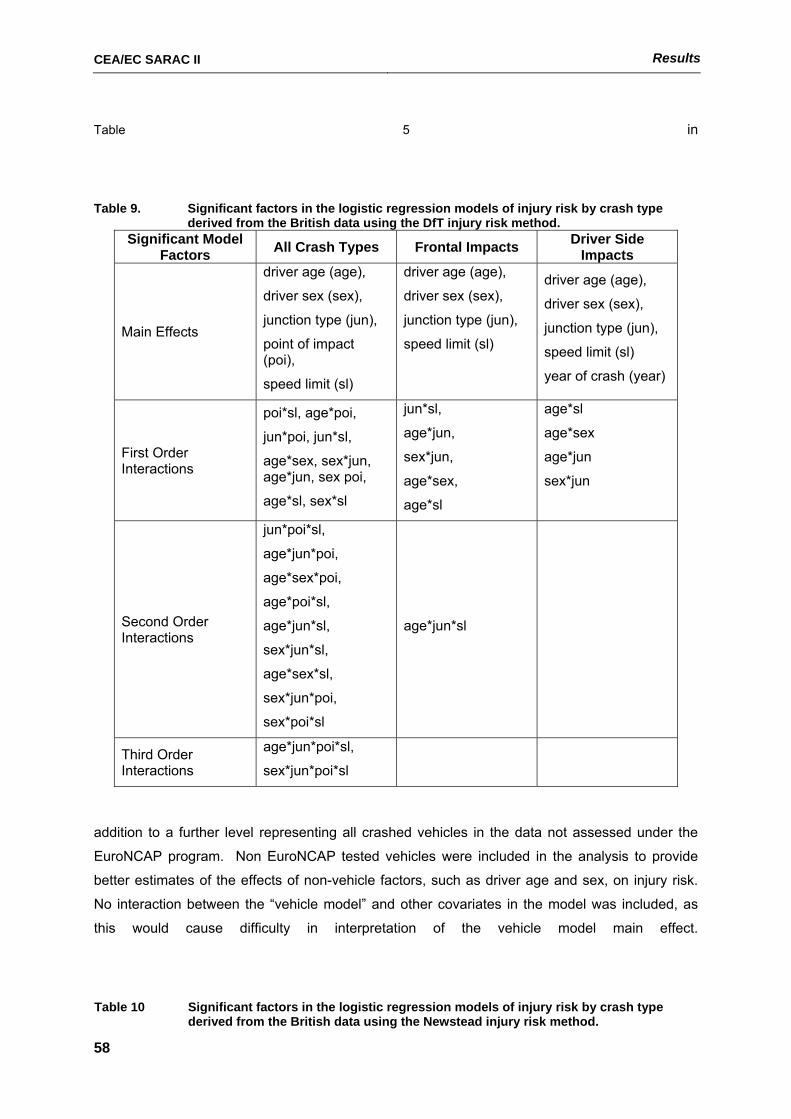
CEA/EC SARAC II Results
58
Table 5 in
Table 9. Significant factors in the logistic regression models of injury risk by crash type derived from the British data using the DfT injury risk method.
Significant Model Factors All Crash Types Frontal Impacts Driver Side
Impacts
Main Effects
driver age (age),
driver sex (sex),
junction type (jun),
point of impact (poi),
speed limit (sl)
driver age (age),
driver sex (sex),
junction type (jun),
speed limit (sl)
driver age (age),
driver sex (sex),
junction type (jun),
speed limit (sl)
year of crash (year)
First Order Interactions
poi*sl, age*poi,
jun*poi, jun*sl,
age*sex, sex*jun, age*jun, sex poi,
age*sl, sex*sl
jun*sl,
age*jun,
sex*jun,
age*sex,
age*sl
age*sl
age*sex
age*jun
sex*jun
Second Order Interactions
jun*poi*sl,
age*jun*poi,
age*sex*poi,
age*poi*sl,
age*jun*sl,
sex*jun*sl,
age*sex*sl,
sex*jun*poi,
sex*poi*sl
age*jun*sl
Third Order Interactions
age*jun*poi*sl,
sex*jun*poi*sl
addition to a further level representing all crashed vehicles in the data not assessed under the
EuroNCAP program. Non EuroNCAP tested vehicles were included in the analysis to provide
better estimates of the effects of non-vehicle factors, such as driver age and sex, on injury risk.
No interaction between the “vehicle model” and other covariates in the model was included, as
this would cause difficulty in interpretation of the vehicle model main effect.
Table 10 Significant factors in the logistic regression models of injury risk by crash type derived from the British data using the Newstead injury risk method.
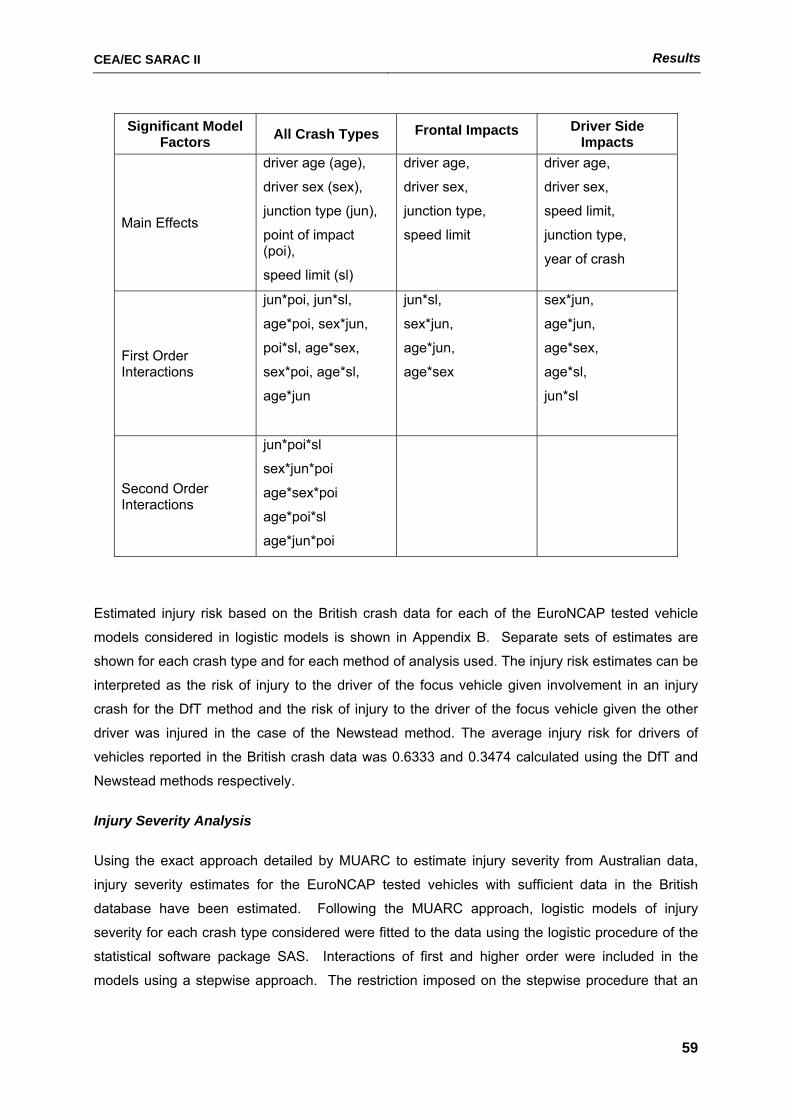
CEA/EC SARAC II Results
59
Significant Model Factors All Crash Types Frontal Impacts Driver Side
Impacts
Main Effects
driver age (age),
driver sex (sex),
junction type (jun),
point of impact (poi),
speed limit (sl)
driver age,
driver sex,
junction type,
speed limit
driver age,
driver sex,
speed limit,
junction type,
year of crash
First Order Interactions
jun*poi, jun*sl,
age*poi, sex*jun,
poi*sl, age*sex,
sex*poi, age*sl,
age*jun
jun*sl,
sex*jun,
age*jun,
age*sex
sex*jun,
age*jun,
age*sex,
age*sl,
jun*sl
Second Order Interactions
jun*poi*sl
sex*jun*poi
age*sex*poi
age*poi*sl
age*jun*poi
Estimated injury risk based on the British crash data for each of the EuroNCAP tested vehicle
models considered in logistic models is shown in Appendix B. Separate sets of estimates are
shown for each crash type and for each method of analysis used. The injury risk estimates can be
interpreted as the risk of injury to the driver of the focus vehicle given involvement in an injury
crash for the DfT method and the risk of injury to the driver of the focus vehicle given the other
driver was injured in the case of the Newstead method. The average injury risk for drivers of
vehicles reported in the British crash data was 0.6333 and 0.3474 calculated using the DfT and
Newstead methods respectively.
Injury Severity Analysis
Using the exact approach detailed by MUARC to estimate injury severity from Australian data,
injury severity estimates for the EuroNCAP tested vehicles with sufficient data in the British
database have been estimated. Following the MUARC approach, logistic models of injury
severity for each crash type considered were fitted to the data using the logistic procedure of the
statistical software package SAS. Interactions of first and higher order were included in the
models using a stepwise approach. The restriction imposed on the stepwise procedure that an

CEA/EC SARAC II Results
60
interaction could only be considered in the model if the main effect terms of the interaction were
significant predictors of injury risk was again used.

CEA/EC SARAC II Results
61
Table 11 details the main effects and interactions that were judged to be significant predictors of
injury severity through the stepwise logistic modelling approach for each crash type considered.
As for injury risk, a variable indicating vehicle model was included as a main effect in each of the
models and was a significant predictor of injury risk in each case. The “vehicle model” variable
was defined as for the injury risk analysis and treated in the same manner in the model.
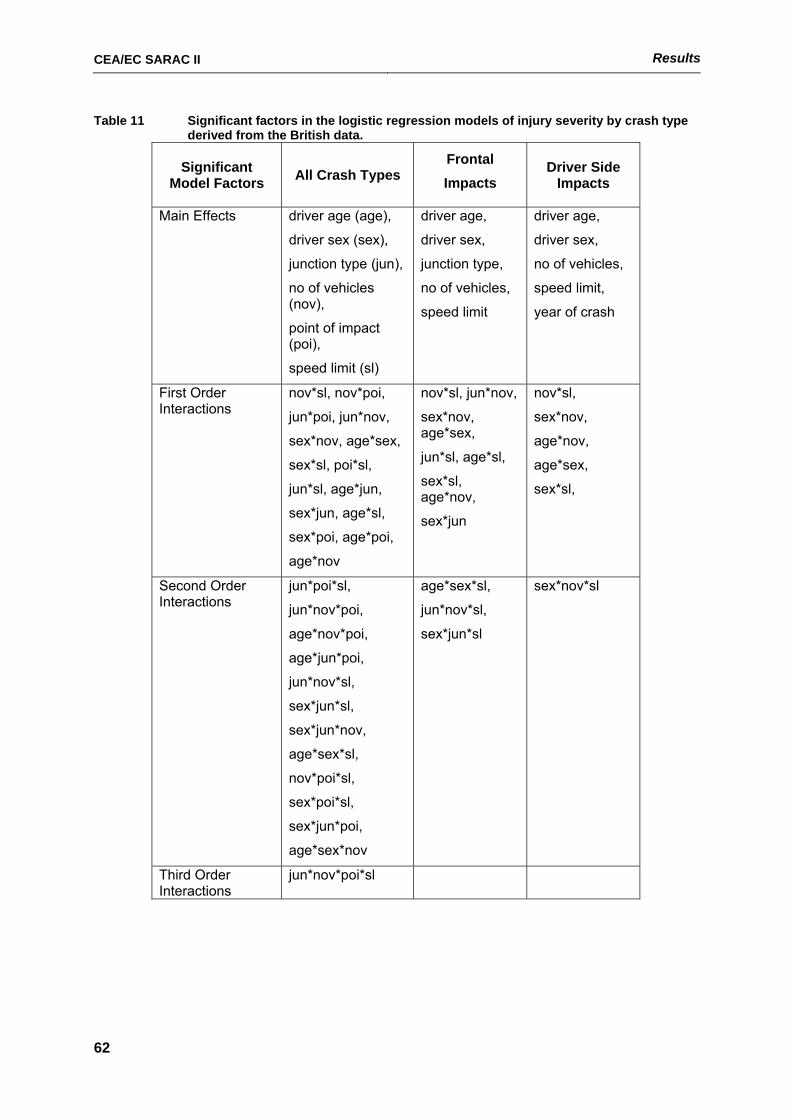
CEA/EC SARAC II Results
62
Table 11 Significant factors in the logistic regression models of injury severity by crash type derived from the British data.
Significant Model Factors All Crash Types
Frontal Impacts
Driver Side Impacts
Main Effects driver age (age),
driver sex (sex),
junction type (jun),
no of vehicles (nov),
point of impact (poi),
speed limit (sl)
driver age,
driver sex,
junction type,
no of vehicles,
speed limit
driver age,
driver sex,
no of vehicles,
speed limit,
year of crash
First Order Interactions
nov*sl, nov*poi,
jun*poi, jun*nov,
sex*nov, age*sex,
sex*sl, poi*sl,
jun*sl, age*jun,
sex*jun, age*sl,
sex*poi, age*poi,
age*nov
nov*sl, jun*nov,
sex*nov, age*sex,
jun*sl, age*sl,
sex*sl, age*nov,
sex*jun
nov*sl,
sex*nov,
age*nov,
age*sex,
sex*sl,
Second Order Interactions
jun*poi*sl,
jun*nov*poi,
age*nov*poi,
age*jun*poi,
jun*nov*sl,
sex*jun*sl,
sex*jun*nov,
age*sex*sl,
nov*poi*sl,
sex*poi*sl,
sex*jun*poi,
age*sex*nov
age*sex*sl,
jun*nov*sl,
sex*jun*sl
sex*nov*sl
Third Order Interactions
jun*nov*poi*sl
CEA/EC SARAC II Results
63
Estimated injury severity based on British crash data for each of the EuroNCAP tested vehicle
models considered in logistic models is shown in Appendix B. Separate sets of estimates are
shown for each crash type. The injury severity estimates can be interpreted as the risk of severe
injury or death to the driver of the focus vehicle given injury in a crash. The average injury risk for
drivers of vehicles reported in the British crash data was 0.1072, a similar magnitude to that
observed in analysis of Australian and US data.
Crashworthiness Ratings
Crashworthiness ratings for each EuroNCAP tested vehicle with sufficient British crash data for
inclusion in the analysis were calculated by taking the product of the estimate injury risk and
severity components. Appendix B shows the British crashworthiness rating resulting from
multiplication of these two quantities for all crashes, frontal impact crashes, and side impact
crashes for both the DfT and Newstead methods of estimating injury risk. Upper and lower
confidence limits and confidence limit width for each estimated crashworthiness rating are also
given in Appendix B, along with the all model average crashworthiness rating. Confidence limits
on the estimated crashworthiness rating were estimated using the method detailed in the MUARC
crashworthiness computation by Newstead et al (1999). Appendix B also shows the estimated
coefficient of variation of the crashworthiness ratings. Co-efficient of variation is the ratio of the
width of the confidence limit to the magnitude of the point estimate and is useful as a scaled
measure of rating accuracy.
4.2.2 French Data
Injury Risk Analysis
Estimates of injury risk for the EuroNCAP tested vehicles, with sufficient crash data to be included
in the analysis, detailed in Table 6, were obtained using the same methods as for the British data.
Analyses were conducted on all crash types, front impact crashes and side impact crashes.
Table 12 and Table 13 show the factors that were identified as significant predictors of injury risk
in the French data through the stepwise logistic regression procedure used.
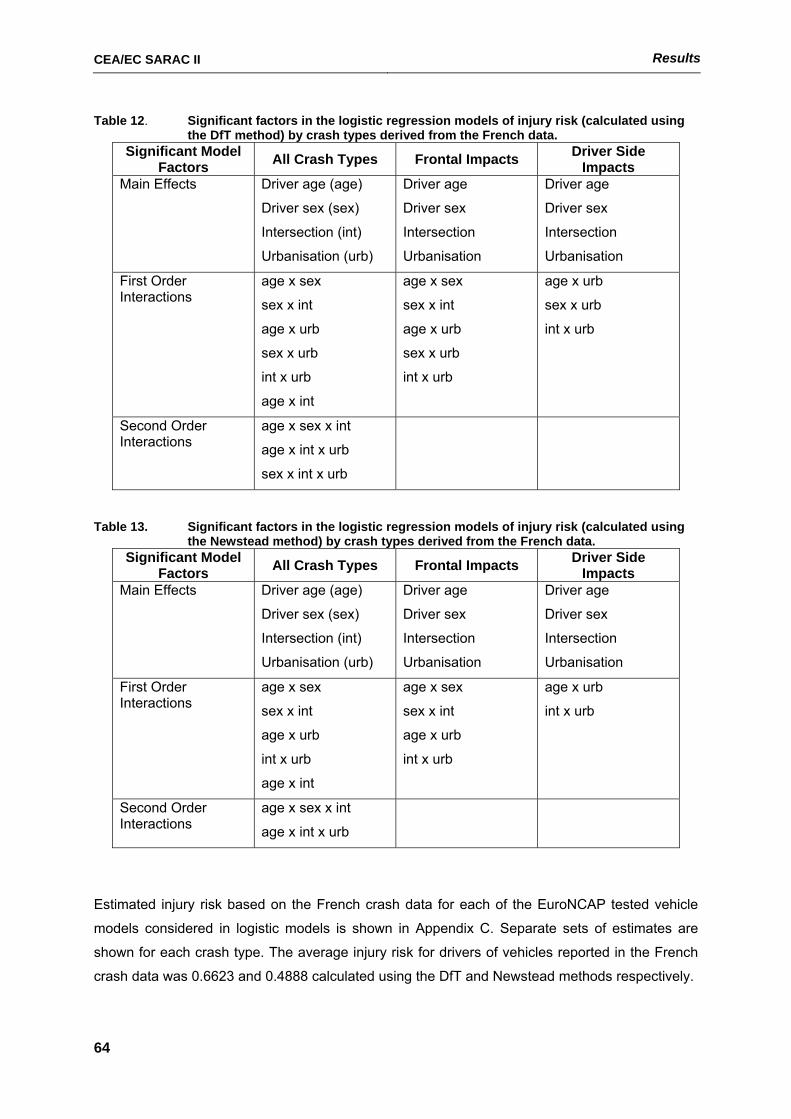
CEA/EC SARAC II Results
64
Table 12. Significant factors in the logistic regression models of injury risk (calculated using the DfT method) by crash types derived from the French data.
Significant Model Factors All Crash Types Frontal Impacts Driver Side
Impacts Main Effects Driver age (age)
Driver sex (sex)
Intersection (int)
Urbanisation (urb)
Driver age
Driver sex
Intersection
Urbanisation
Driver age
Driver sex
Intersection
Urbanisation
First Order Interactions
age x sex
sex x int
age x urb
sex x urb
int x urb
age x int
age x sex
sex x int
age x urb
sex x urb
int x urb
age x urb
sex x urb
int x urb
Second Order Interactions
age x sex x int
age x int x urb
sex x int x urb
Table 13. Significant factors in the logistic regression models of injury risk (calculated using
the Newstead method) by crash types derived from the French data. Significant Model
Factors All Crash Types Frontal Impacts Driver Side Impacts
Main Effects Driver age (age)
Driver sex (sex)
Intersection (int)
Urbanisation (urb)
Driver age
Driver sex
Intersection
Urbanisation
Driver age
Driver sex
Intersection
Urbanisation
First Order Interactions
age x sex
sex x int
age x urb
int x urb
age x int
age x sex
sex x int
age x urb
int x urb
age x urb
int x urb
Second Order Interactions
age x sex x int
age x int x urb
Estimated injury risk based on the French crash data for each of the EuroNCAP tested vehicle
models considered in logistic models is shown in Appendix C. Separate sets of estimates are
shown for each crash type. The average injury risk for drivers of vehicles reported in the French
crash data was 0.6623 and 0.4888 calculated using the DfT and Newstead methods respectively.
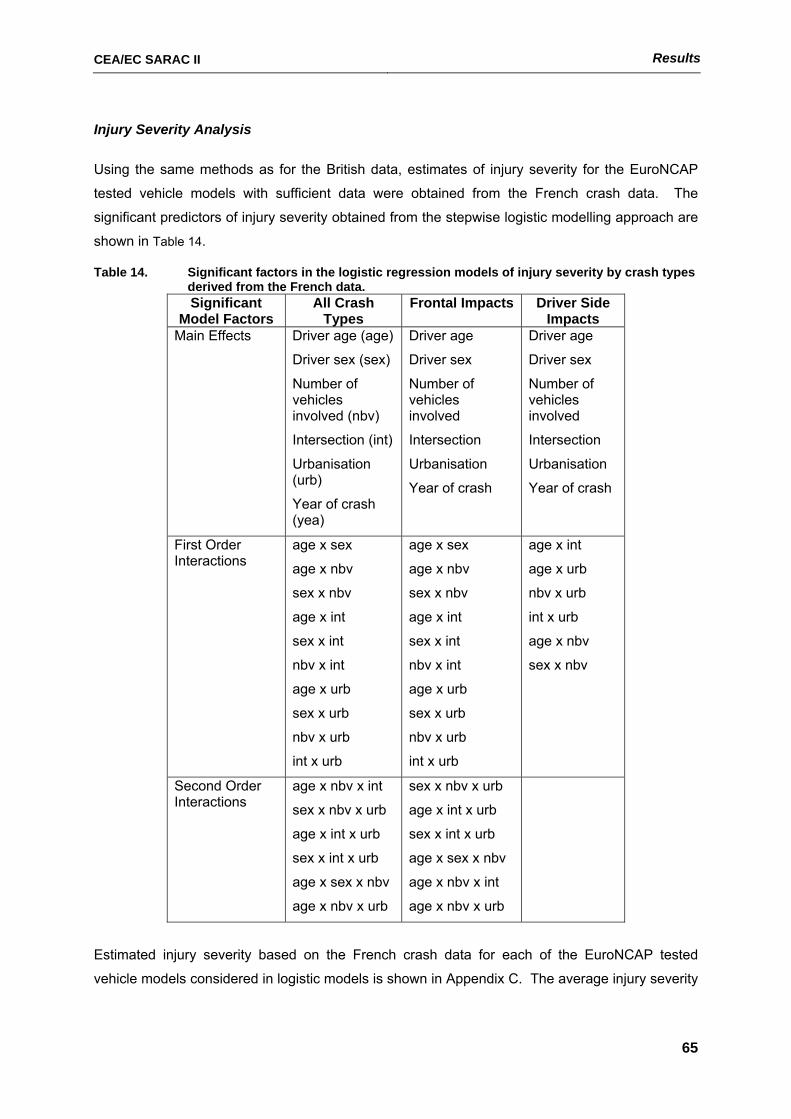
CEA/EC SARAC II Results
65
Injury Severity Analysis
Using the same methods as for the British data, estimates of injury severity for the EuroNCAP
tested vehicle models with sufficient data were obtained from the French crash data. The
significant predictors of injury severity obtained from the stepwise logistic modelling approach are
shown in Table 14.
Table 14. Significant factors in the logistic regression models of injury severity by crash types derived from the French data. Significant
Model Factors All Crash
Types Frontal Impacts Driver Side
Impacts Main Effects Driver age (age)
Driver sex (sex)
Number of vehicles involved (nbv)
Intersection (int)
Urbanisation (urb)
Year of crash (yea)
Driver age
Driver sex
Number of vehicles involved
Intersection
Urbanisation
Year of crash
Driver age
Driver sex
Number of vehicles involved
Intersection
Urbanisation
Year of crash
First Order Interactions
age x sex
age x nbv
sex x nbv
age x int
sex x int
nbv x int
age x urb
sex x urb
nbv x urb
int x urb
age x sex
age x nbv
sex x nbv
age x int
sex x int
nbv x int
age x urb
sex x urb
nbv x urb
int x urb
age x int
age x urb
nbv x urb
int x urb
age x nbv
sex x nbv
Second Order Interactions
age x nbv x int
sex x nbv x urb
age x int x urb
sex x int x urb
age x sex x nbv
age x nbv x urb
sex x nbv x urb
age x int x urb
sex x int x urb
age x sex x nbv
age x nbv x int
age x nbv x urb
Estimated injury severity based on the French crash data for each of the EuroNCAP tested
vehicle models considered in logistic models is shown in Appendix C. The average injury severity
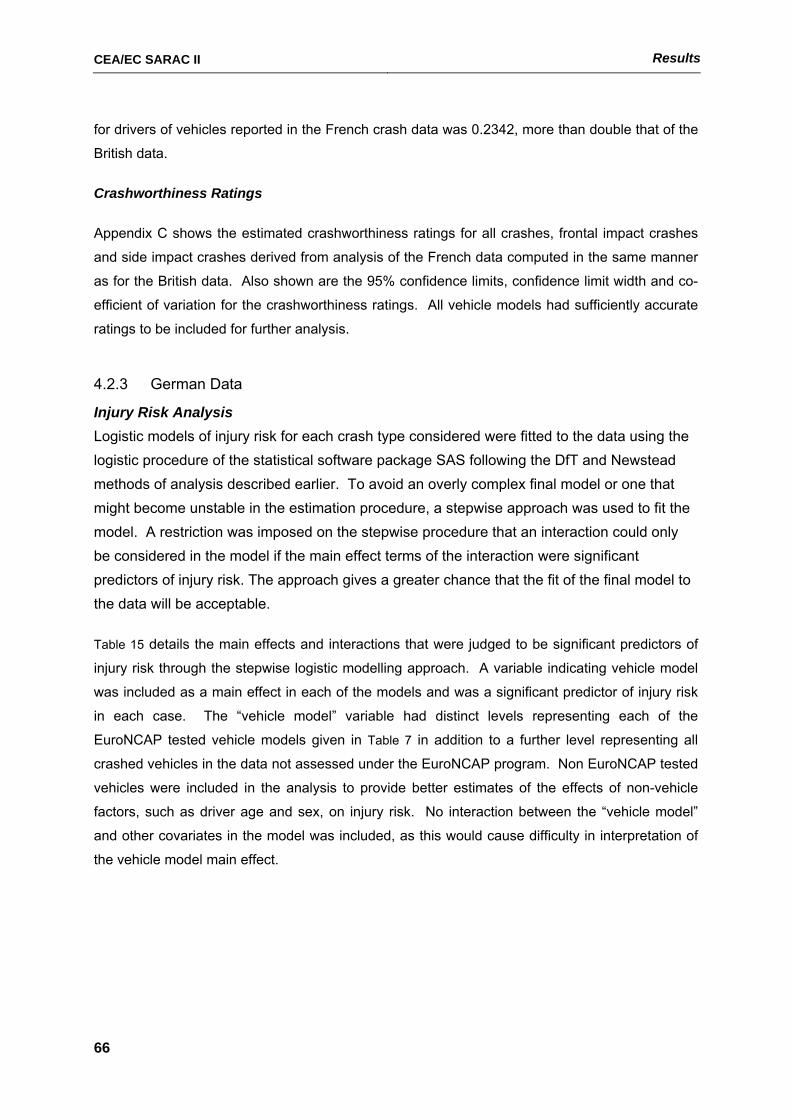
CEA/EC SARAC II Results
66
for drivers of vehicles reported in the French crash data was 0.2342, more than double that of the
British data.
Crashworthiness Ratings
Appendix C shows the estimated crashworthiness ratings for all crashes, frontal impact crashes
and side impact crashes derived from analysis of the French data computed in the same manner
as for the British data. Also shown are the 95% confidence limits, confidence limit width and co-
efficient of variation for the crashworthiness ratings. All vehicle models had sufficiently accurate
ratings to be included for further analysis.
4.2.3 German Data
Injury Risk Analysis Logistic models of injury risk for each crash type considered were fitted to the data using the logistic procedure of the statistical software package SAS following the DfT and Newstead methods of analysis described earlier. To avoid an overly complex final model or one that might become unstable in the estimation procedure, a stepwise approach was used to fit the model. A restriction was imposed on the stepwise procedure that an interaction could only be considered in the model if the main effect terms of the interaction were significant predictors of injury risk. The approach gives a greater chance that the fit of the final model to the data will be acceptable.
Table 15 details the main effects and interactions that were judged to be significant predictors of
injury risk through the stepwise logistic modelling approach. A variable indicating vehicle model
was included as a main effect in each of the models and was a significant predictor of injury risk
in each case. The “vehicle model” variable had distinct levels representing each of the
EuroNCAP tested vehicle models given in Table 7 in addition to a further level representing all
crashed vehicles in the data not assessed under the EuroNCAP program. Non EuroNCAP tested
vehicles were included in the analysis to provide better estimates of the effects of non-vehicle
factors, such as driver age and sex, on injury risk. No interaction between the “vehicle model”
and other covariates in the model was included, as this would cause difficulty in interpretation of
the vehicle model main effect.
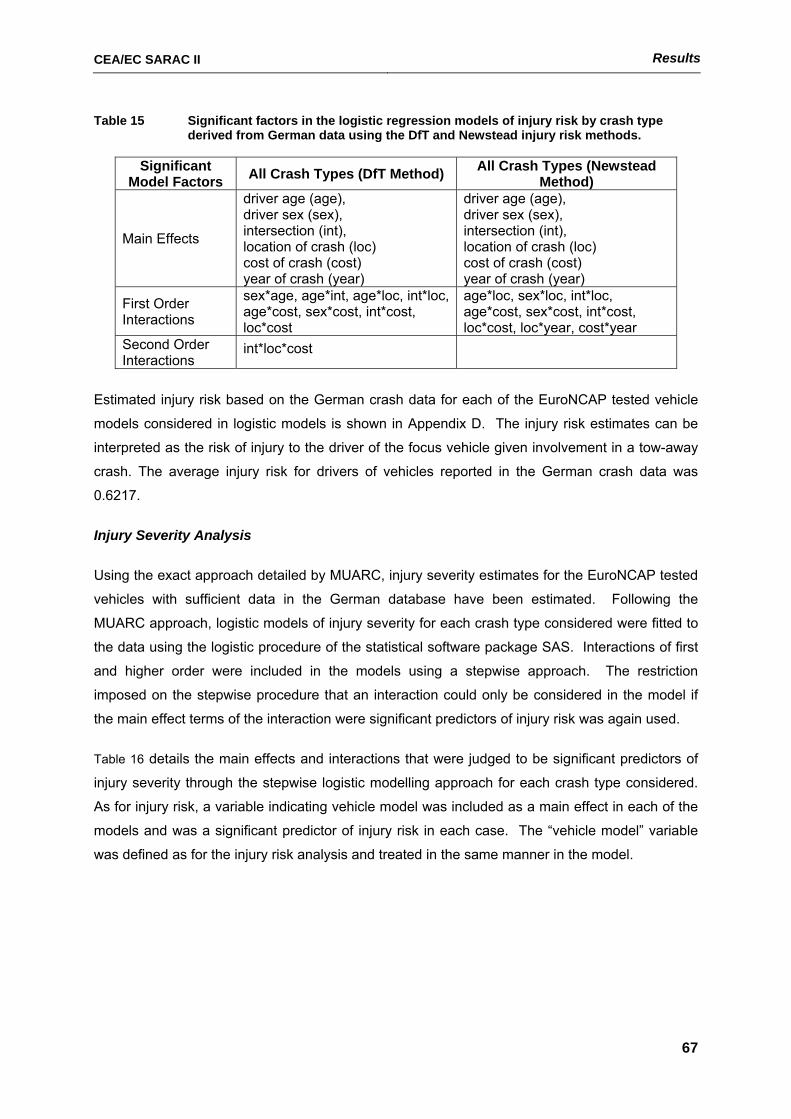
CEA/EC SARAC II Results
67
Table 15 Significant factors in the logistic regression models of injury risk by crash type derived from German data using the DfT and Newstead injury risk methods.
Significant Model Factors All Crash Types (DfT Method) All Crash Types (Newstead
Method)
Main Effects
driver age (age), driver sex (sex), intersection (int), location of crash (loc) cost of crash (cost) year of crash (year)
driver age (age), driver sex (sex), intersection (int), location of crash (loc) cost of crash (cost) year of crash (year)
First Order Interactions
sex*age, age*int, age*loc, int*loc, age*cost, sex*cost, int*cost, loc*cost
age*loc, sex*loc, int*loc, age*cost, sex*cost, int*cost, loc*cost, loc*year, cost*year
Second Order Interactions
int*loc*cost
Estimated injury risk based on the German crash data for each of the EuroNCAP tested vehicle
models considered in logistic models is shown in Appendix D. The injury risk estimates can be
interpreted as the risk of injury to the driver of the focus vehicle given involvement in a tow-away
crash. The average injury risk for drivers of vehicles reported in the German crash data was
0.6217.
Injury Severity Analysis
Using the exact approach detailed by MUARC, injury severity estimates for the EuroNCAP tested
vehicles with sufficient data in the German database have been estimated. Following the
MUARC approach, logistic models of injury severity for each crash type considered were fitted to
the data using the logistic procedure of the statistical software package SAS. Interactions of first
and higher order were included in the models using a stepwise approach. The restriction
imposed on the stepwise procedure that an interaction could only be considered in the model if
the main effect terms of the interaction were significant predictors of injury risk was again used.
Table 16 details the main effects and interactions that were judged to be significant predictors of
injury severity through the stepwise logistic modelling approach for each crash type considered.
As for injury risk, a variable indicating vehicle model was included as a main effect in each of the
models and was a significant predictor of injury risk in each case. The “vehicle model” variable
was defined as for the injury risk analysis and treated in the same manner in the model.
CEA/EC SARAC II Results
68
Table 16 Significant factors in the logistic regression models of injury severity by crash type derived from the German data.
Significant Model Factors All Crash Types
Main Effects
driver age (age), driver sex (sex), number of vehicles (nbv), location of crash (loc), cost of crash (cost) year of crash (year)
First Order Interactions
age*sex, age*nbv, sex*nbv, age*int, sex*int, veh*int, veh*loc, int*loc, age*cost, sex*cost, nbv*cost, int*cost, loc*cost, int*year, loc*year, cost*year
Second Order Interactions
age*sex*nbv, nbv*int*loc, age*int*cost, nbv*int*cost, nbv*loc*cost, int*loc*cost, int*cost*year
Estimated injury severity based on the German crash data for each of the EuroNCAP tested
vehicle models considered in logistic models is shown in Appendix D. Separate sets of estimates
are shown for each crash type. The injury severity estimates can be interpreted as the risk of
severe injury or death to the driver of the focus vehicle given injury in a tow-away crash. The
average injury severity for drivers of vehicles reported in the German crash data was 0.1647.
Crashworthiness Ratings
Crashworthiness ratings for each EuroNCAP tested vehicle with sufficient German crash data for
inclusion in the analysis were calculated by taking the product of the estimated injury risk and
severity components. Appendix D shows the resulting German crashworthiness rating resulting
from multiplication of these two quantities for all crashes for both the DfT and Newstead methods
of estimating injury risk. Upper and lower confidence limits and confidence limit width for each
estimated crashworthiness rating are also given in Appendix D, along with the all model average
crashworthiness rating. Confidence limits on the estimated crashworthiness rating were
estimated using the method detailed in the MUARC crashworthiness computation by Newstead et
al (1999). Appendix D also shows the estimated coefficient of variation of the crashworthiness
ratings. The co-efficient of variation is the ratio of the width of the confidence limit to the
magnitude of the point estimate and is useful as a scaled measure of rating accuracy.
4.2.4 Australian and New Zealand Data
Injury Risk Analysis
Logistic models of injury risk for each crash type considered were fitted to the data using the
logistic procedure of the statistical software package SAS following the MUARC method of
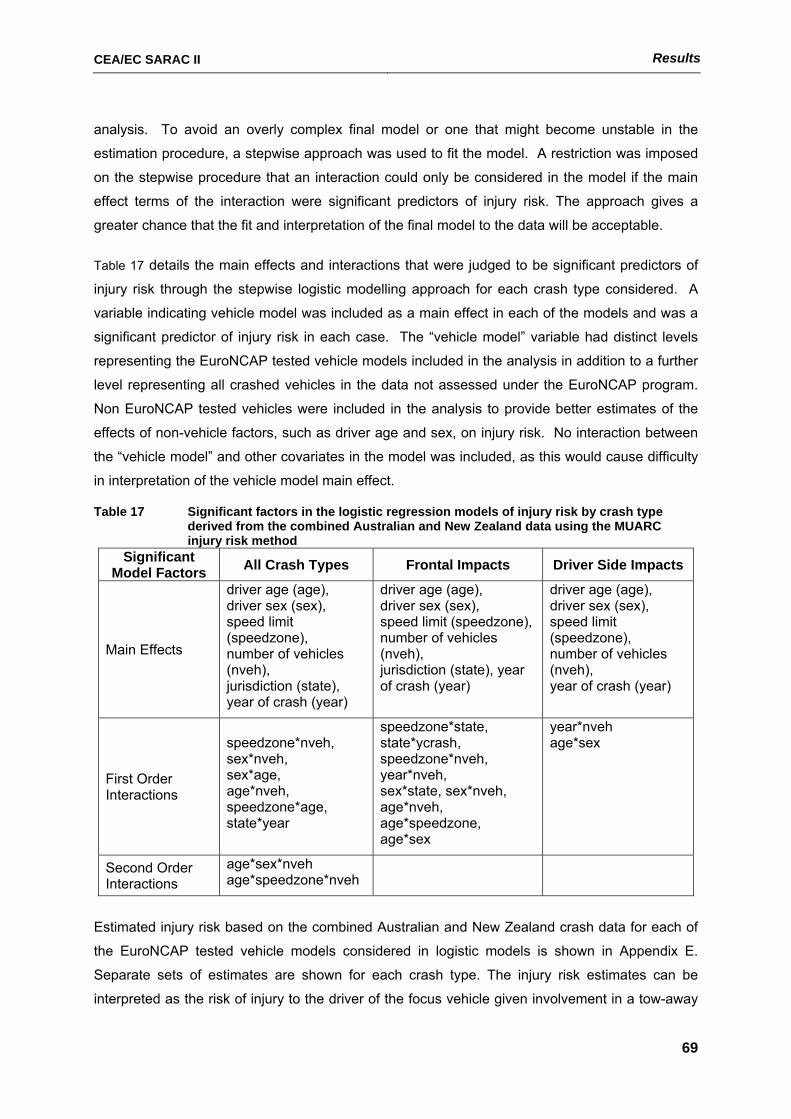
CEA/EC SARAC II Results
69
analysis. To avoid an overly complex final model or one that might become unstable in the
estimation procedure, a stepwise approach was used to fit the model. A restriction was imposed
on the stepwise procedure that an interaction could only be considered in the model if the main
effect terms of the interaction were significant predictors of injury risk. The approach gives a
greater chance that the fit and interpretation of the final model to the data will be acceptable.
Table 17 details the main effects and interactions that were judged to be significant predictors of
injury risk through the stepwise logistic modelling approach for each crash type considered. A
variable indicating vehicle model was included as a main effect in each of the models and was a
significant predictor of injury risk in each case. The “vehicle model” variable had distinct levels
representing the EuroNCAP tested vehicle models included in the analysis in addition to a further
level representing all crashed vehicles in the data not assessed under the EuroNCAP program.
Non EuroNCAP tested vehicles were included in the analysis to provide better estimates of the
effects of non-vehicle factors, such as driver age and sex, on injury risk. No interaction between
the “vehicle model” and other covariates in the model was included, as this would cause difficulty
in interpretation of the vehicle model main effect.
Table 17 Significant factors in the logistic regression models of injury risk by crash type derived from the combined Australian and New Zealand data using the MUARC injury risk method
Significant Model Factors All Crash Types Frontal Impacts Driver Side Impacts
Main Effects
driver age (age), driver sex (sex), speed limit (speedzone), number of vehicles (nveh), jurisdiction (state), year of crash (year)
driver age (age), driver sex (sex), speed limit (speedzone),number of vehicles (nveh), jurisdiction (state), year of crash (year)
driver age (age), driver sex (sex), speed limit (speedzone), number of vehicles (nveh), year of crash (year)
First Order Interactions
speedzone*nveh, sex*nveh, sex*age, age*nveh, speedzone*age, state*year
speedzone*state, state*ycrash, speedzone*nveh, year*nveh, sex*state, sex*nveh, age*nveh, age*speedzone, age*sex
year*nveh age*sex
Second Order Interactions
age*sex*nveh age*speedzone*nveh
Estimated injury risk based on the combined Australian and New Zealand crash data for each of
the EuroNCAP tested vehicle models considered in logistic models is shown in Appendix E.
Separate sets of estimates are shown for each crash type. The injury risk estimates can be
interpreted as the risk of injury to the driver of the focus vehicle given involvement in a tow-away
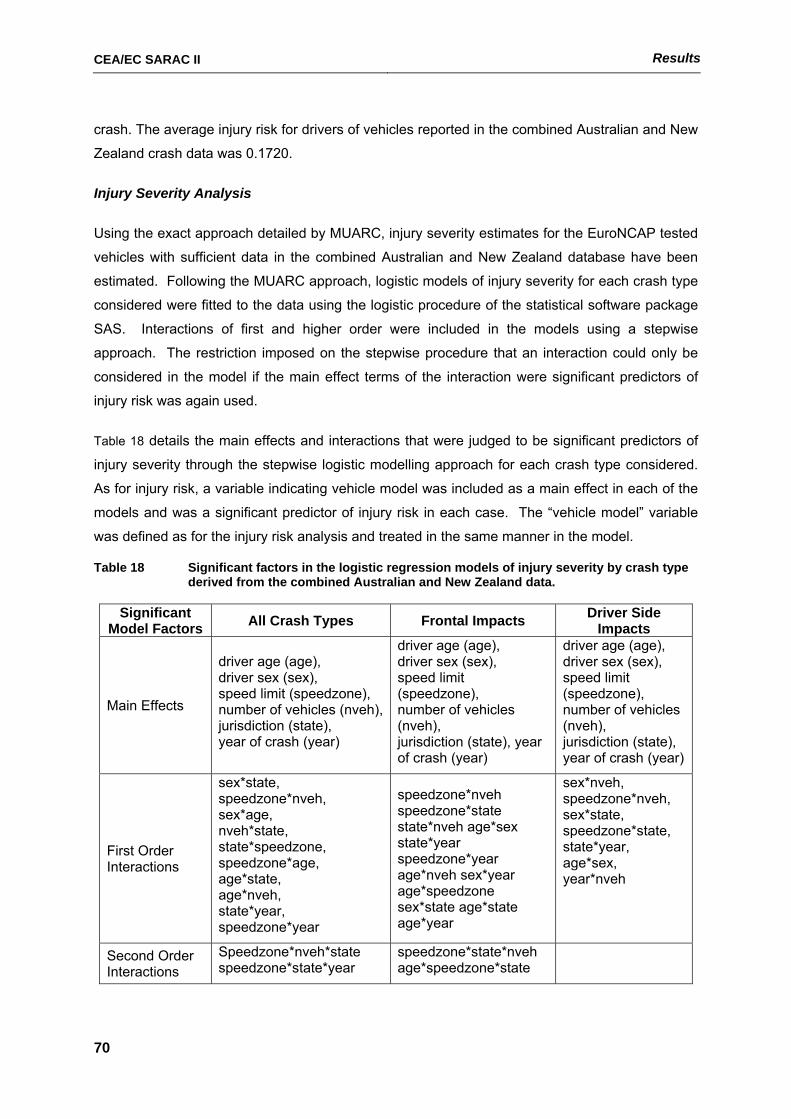
CEA/EC SARAC II Results
70
crash. The average injury risk for drivers of vehicles reported in the combined Australian and New
Zealand crash data was 0.1720.
Injury Severity Analysis
Using the exact approach detailed by MUARC, injury severity estimates for the EuroNCAP tested
vehicles with sufficient data in the combined Australian and New Zealand database have been
estimated. Following the MUARC approach, logistic models of injury severity for each crash type
considered were fitted to the data using the logistic procedure of the statistical software package
SAS. Interactions of first and higher order were included in the models using a stepwise
approach. The restriction imposed on the stepwise procedure that an interaction could only be
considered in the model if the main effect terms of the interaction were significant predictors of
injury risk was again used.
Table 18 details the main effects and interactions that were judged to be significant predictors of
injury severity through the stepwise logistic modelling approach for each crash type considered.
As for injury risk, a variable indicating vehicle model was included as a main effect in each of the
models and was a significant predictor of injury risk in each case. The “vehicle model” variable
was defined as for the injury risk analysis and treated in the same manner in the model.
Table 18 Significant factors in the logistic regression models of injury severity by crash type derived from the combined Australian and New Zealand data.
Significant Model Factors All Crash Types Frontal Impacts Driver Side
Impacts
Main Effects
driver age (age), driver sex (sex), speed limit (speedzone), number of vehicles (nveh),jurisdiction (state), year of crash (year)
driver age (age), driver sex (sex), speed limit (speedzone), number of vehicles (nveh), jurisdiction (state), year of crash (year)
driver age (age), driver sex (sex), speed limit (speedzone), number of vehicles (nveh), jurisdiction (state), year of crash (year)
First Order Interactions
sex*state, speedzone*nveh, sex*age, nveh*state, state*speedzone, speedzone*age, age*state, age*nveh, state*year, speedzone*year
speedzone*nveh speedzone*state state*nveh age*sex state*year speedzone*year age*nveh sex*year age*speedzone sex*state age*state age*year
sex*nveh, speedzone*nveh, sex*state, speedzone*state, state*year, age*sex, year*nveh
Second Order Interactions
Speedzone*nveh*state speedzone*state*year
speedzone*state*nveh age*speedzone*state
CEA/EC SARAC II Results
71
Estimated injury severity based on the combined Australian and New Zealand crash data for each
of the EuroNCAP tested vehicle models considered in logistic models is shown in Appendix E.
Separate sets of estimates are shown for each crash type. The injury severity estimates can be
interpreted as the risk of severe injury or death to the driver of the focus vehicle given injury in a
tow-away crash. The average injury severity for drivers of vehicles reported in the combined
Australian and New Zealand crash data was 0.2101.
Crashworthiness Ratings
Crashworthiness ratings for each EuroNCAP tested vehicle with sufficient combined Australian
and New Zealand crash data for inclusion in the analysis were calculated by taking the product of
the estimated injury risk and severity components. Appendix E shows the resulting combined
Australian and New Zealand crashworthiness rating resulting from multiplication of these two
quantities for all crashes, frontal impact crashes and side impact crashes for the MUARC method
of estimating injury risk. Upper and lower confidence limits and confidence limit width for each
estimated crashworthiness rating are also given in Appendix E, along with the all model average
crashworthiness rating. Confidence limits on the estimated crashworthiness rating were
estimated using the method detailed in the MUARC crashworthiness computation by Newstead et
al (1999). Appendix E also shows the estimated coefficient of variation of the crashworthiness
ratings. The co-efficient of variation is the ratio of the width of the confidence limit to the
magnitude of the point estimate and is useful as a scaled measure of rating accuracy.
4.3 Comparison of Real Crash Safety Ratings and Overall EuroNCAP Star Ratings
In comparing EuroNCAP crash test results with real crash outcomes in Sweden, Lie and Tingvall
(2000) computed the average real crash injury rates for vehicles grouped within each overall star
rating. It was hypothesised that occupants of EuroNCAP tested vehicles with a five star rating
should have a lower average risk of serious injury in a real crash than those with only three or two
stars. If so, the overall barrier crash performance star rating given to each vehicle from
EuroNCAP testing would be broadly representative of relative real crash outcomes. Based on the
Swedish data analysed, Lie and Tingvall (2000) indeed found that EuroNCAP tested vehicles
rated four stars had a lower average risk serious injury risk in real crashes than those rated three
stars. The three star vehicles had a correspondingly lower average risk than vehicles rated two
stars. The analysis that follows also considers the relationship between real crash safety ratings
and overall EuroNCAP star ratings.
An overall EuroNCAP star rating scale of five categories is used to classify vehicle safety
performance based on crash test results. The five star categories are derived from an equal mix
CEA/EC SARAC II Results
72
of the results of both the offset frontal and side impact EuroNCAP test components plus the pole
test and seat belt reminder assessment. In this study the overall EuroNCAP score and
corresponding star rating are calculated based on the driver dummy measurements in the
EuroNCAP test only to ensure compatibility with the real crash rating that relate to driver injury
outcome only. In contrast, the official scores published by EuroNCAP consider both the driver
and front passenger dummy scores in the offset frontal barrier test. It is also noted that the
EuroNCAP overall scores used here do not include the pole test result or the seat belt reminder
points for reasons given previously. However, analysis conducted using EuroNCAP overall scores
including the pole test produced similar results.
In the following material, driver injury outcome ratings derived from police reported crashes are
often referred to as real crash ratings for the purpose of differentiating these ratings from the
EuroNCAP test scores. This is in no way meant to imply that the EuroNCAP test does not involve
physically crashing a vehicle. It refers to the difference between the real world setting of the police
reported crash versus the controlled laboratory setting of the EuroNCAP test.
4.3.1 British Safety Ratings and Overall EuroNCAP Star Ratings
The following series of figures show overall EuroNCAP scores plotted against, respectively, injury
risk, injury severity and crashworthiness estimated from all crash types in the British data.
Individual EuroNCAP scores are grouped according to the corresponding star rating and 95 per
cent confidence limits are placed on the estimates of real crash measures. Similar plots are
provided in Appendix F for front and side impact crashes.
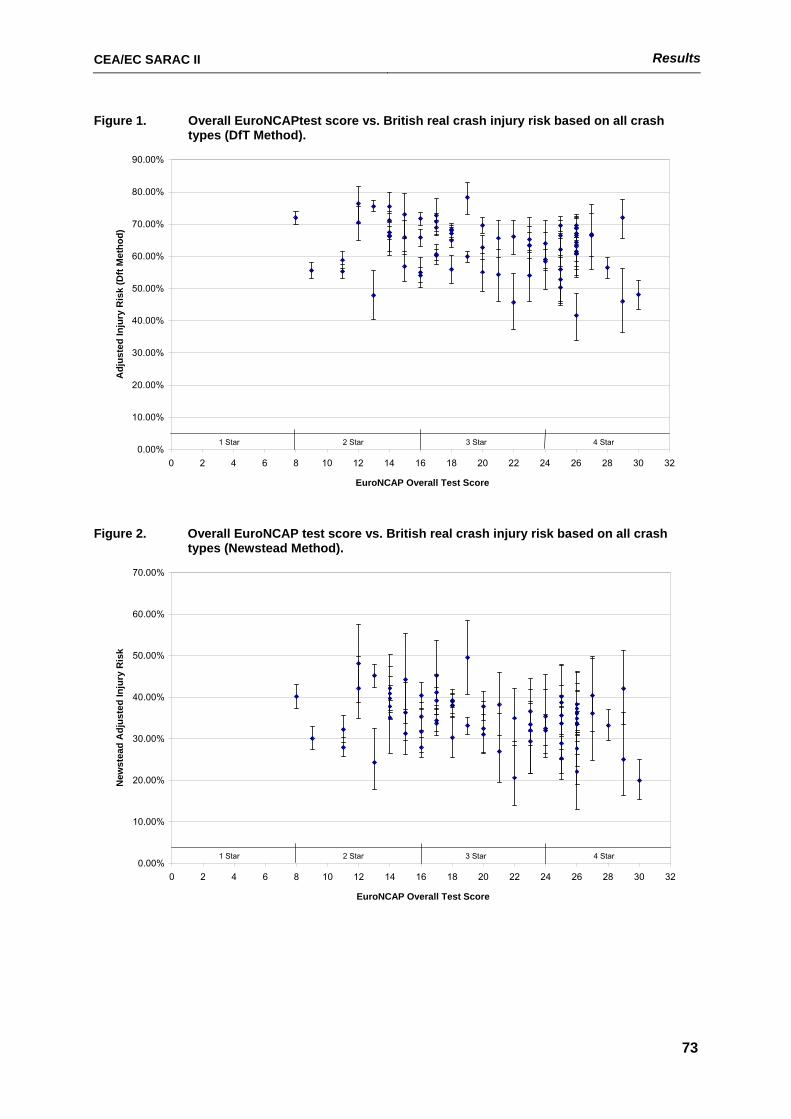
CEA/EC SARAC II Results
73
Figure 1. Overall EuroNCAPtest score vs. British real crash injury risk based on all crash types (DfT Method).
0.00%
10.00%
20.00%
30.00%
40.00%
50.00%
60.00%
70.00%
80.00%
90.00%
0 2 4 6 8 10 12 14 16 18 20 22 24 26 28 30 32
EuroNCAP Overall Test Score
Adj
uste
d In
jury
Ris
k (D
ft M
etho
d)
1 Star 2 Star 3 Star 4 Star
Figure 2. Overall EuroNCAP test score vs. British real crash injury risk based on all crash
types (Newstead Method).
0.00%
10.00%
20.00%
30.00%
40.00%
50.00%
60.00%
70.00%
0 2 4 6 8 10 12 14 16 18 20 22 24 26 28 30 32
EuroNCAP Overall Test Score
New
stea
d A
djus
ted
Inju
ry R
isk
1 Star 2 Star 3 Star 4 Star
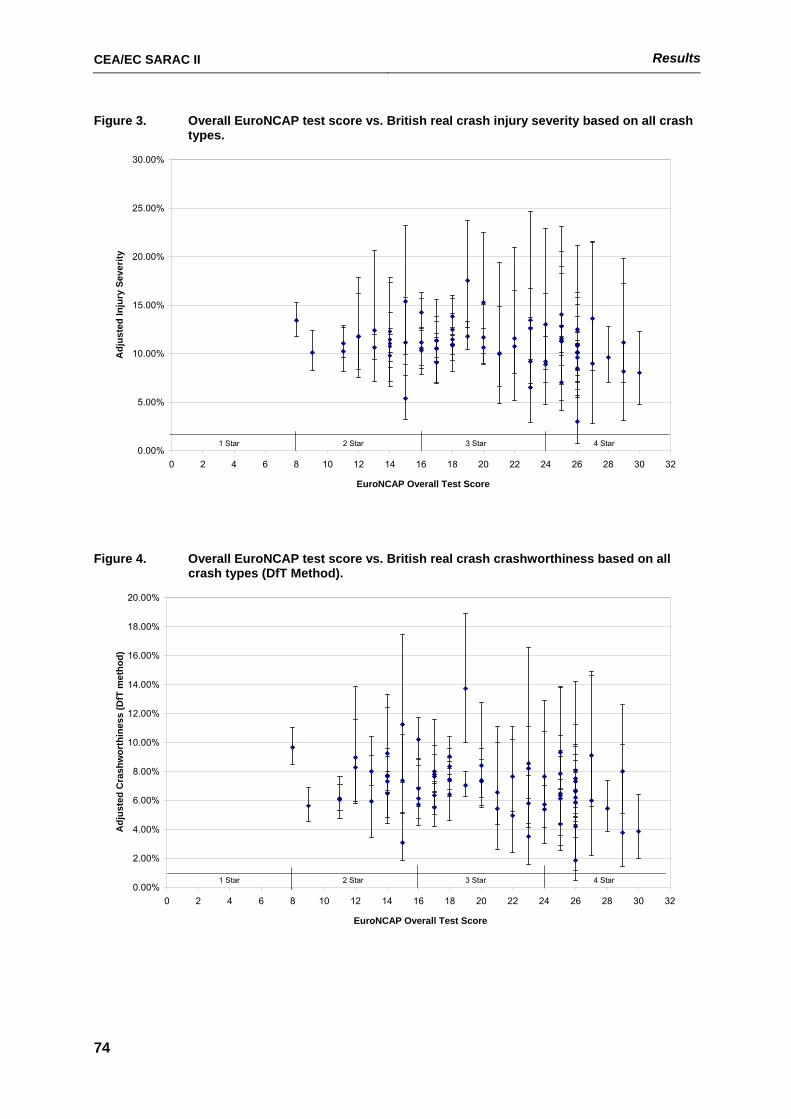
CEA/EC SARAC II Results
74
Figure 3. Overall EuroNCAP test score vs. British real crash injury severity based on all crash types.
0.00%
5.00%
10.00%
15.00%
20.00%
25.00%
30.00%
0 2 4 6 8 10 12 14 16 18 20 22 24 26 28 30 32
EuroNCAP Overall Test Score
Adj
uste
d In
jury
Sev
erity
1 Star 2 Star 3 Star 4 Star
Figure 4. Overall EuroNCAP test score vs. British real crash crashworthiness based on all crash types (DfT Method).
0.00%
2.00%
4.00%
6.00%
8.00%
10.00%
12.00%
14.00%
16.00%
18.00%
20.00%
0 2 4 6 8 10 12 14 16 18 20 22 24 26 28 30 32
EuroNCAP Overall Test Score
Adj
uste
d C
rash
wor
thin
ess
(DfT
met
hod)
1 Star 2 Star 3 Star 4 Star
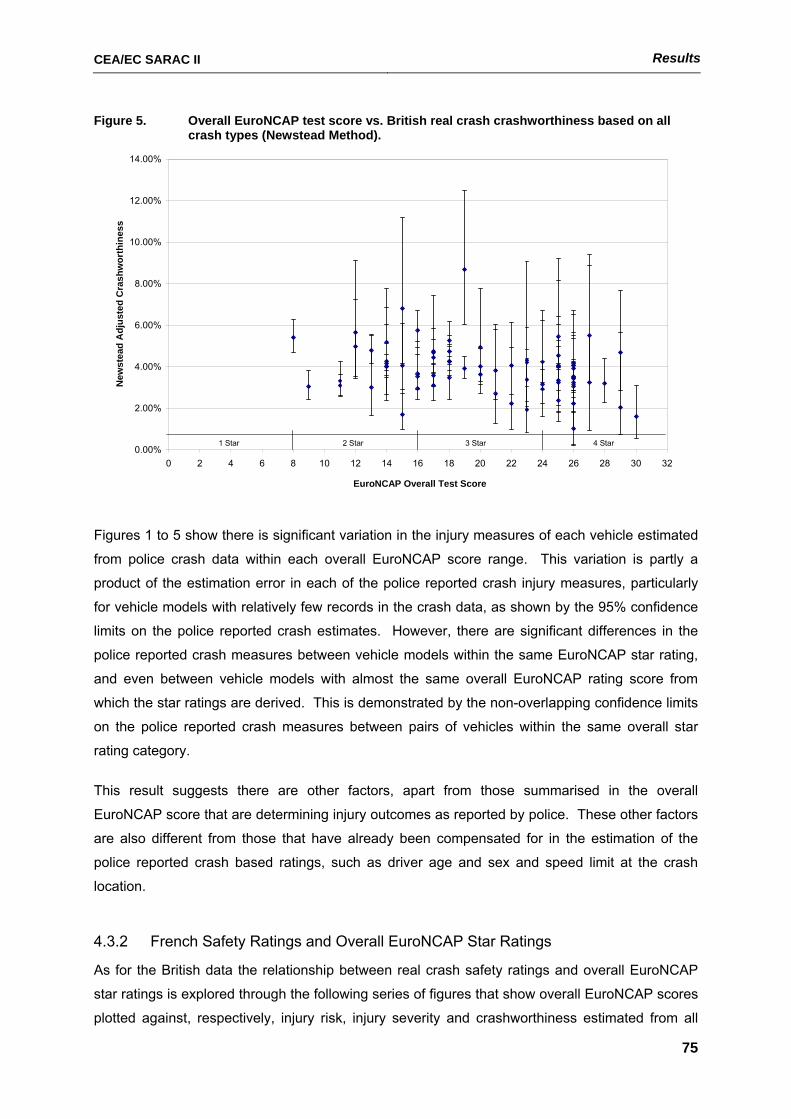
CEA/EC SARAC II Results
75
Figure 5. Overall EuroNCAP test score vs. British real crash crashworthiness based on all crash types (Newstead Method).
0.00%
2.00%
4.00%
6.00%
8.00%
10.00%
12.00%
14.00%
0 2 4 6 8 10 12 14 16 18 20 22 24 26 28 30 32
EuroNCAP Overall Test Score
New
stea
d A
djus
ted
Cra
shw
orth
ines
s
1 Star 2 Star 3 Star 4 Star
Figures 1 to 5 show there is significant variation in the injury measures of each vehicle estimated
from police crash data within each overall EuroNCAP score range. This variation is partly a
product of the estimation error in each of the police reported crash injury measures, particularly
for vehicle models with relatively few records in the crash data, as shown by the 95% confidence
limits on the police reported crash estimates. However, there are significant differences in the
police reported crash measures between vehicle models within the same EuroNCAP star rating,
and even between vehicle models with almost the same overall EuroNCAP rating score from
which the star ratings are derived. This is demonstrated by the non-overlapping confidence limits
on the police reported crash measures between pairs of vehicles within the same overall star
rating category.
This result suggests there are other factors, apart from those summarised in the overall
EuroNCAP score that are determining injury outcomes as reported by police. These other factors
are also different from those that have already been compensated for in the estimation of the
police reported crash based ratings, such as driver age and sex and speed limit at the crash
location.
4.3.2 French Safety Ratings and Overall EuroNCAP Star Ratings
As for the British data the relationship between real crash safety ratings and overall EuroNCAP
star ratings is explored through the following series of figures that show overall EuroNCAP scores
plotted against, respectively, injury risk, injury severity and crashworthiness estimated from all
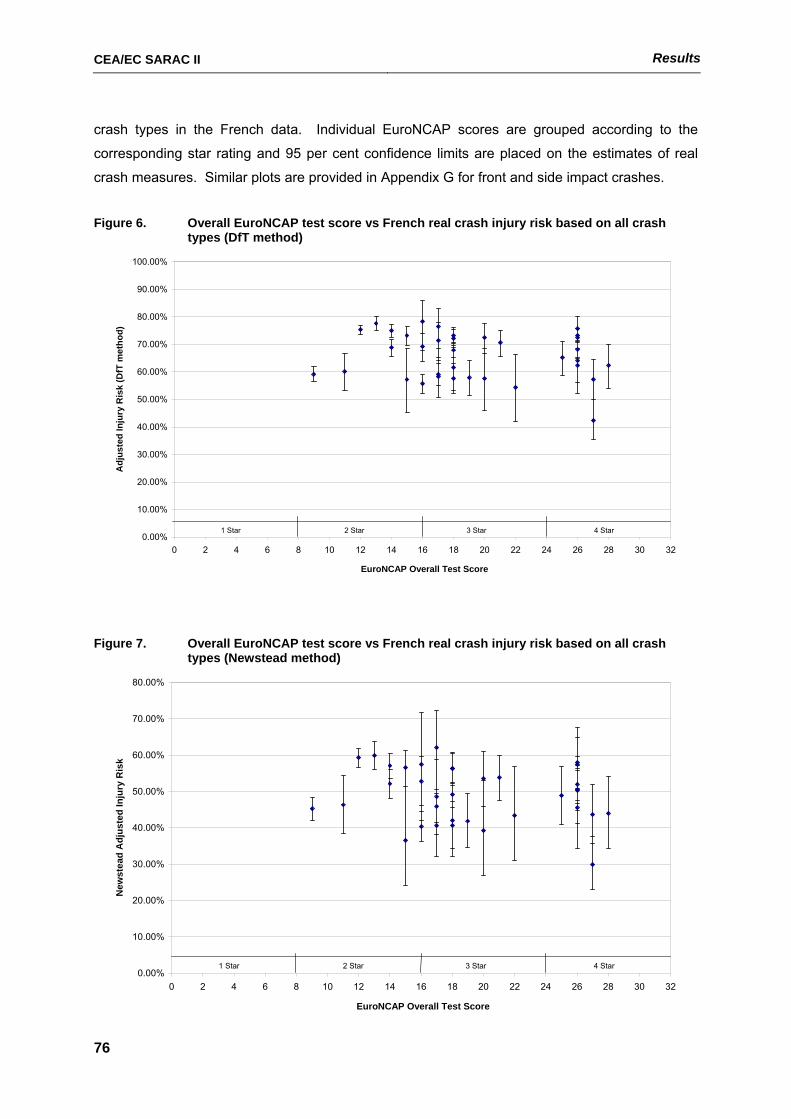
CEA/EC SARAC II Results
76
crash types in the French data. Individual EuroNCAP scores are grouped according to the
corresponding star rating and 95 per cent confidence limits are placed on the estimates of real
crash measures. Similar plots are provided in Appendix G for front and side impact crashes.
Figure 6. Overall EuroNCAP test score vs French real crash injury risk based on all crash
types (DfT method)
0.00%
10.00%
20.00%
30.00%
40.00%
50.00%
60.00%
70.00%
80.00%
90.00%
100.00%
0 2 4 6 8 10 12 14 16 18 20 22 24 26 28 30 32
EuroNCAP Overall Test Score
Adj
uste
d In
jury
Ris
k (D
fT m
etho
d)
1 Star 2 Star 3 Star 4 Star
Figure 7. Overall EuroNCAP test score vs French real crash injury risk based on all crash types (Newstead method)
0.00%
10.00%
20.00%
30.00%
40.00%
50.00%
60.00%
70.00%
80.00%
0 2 4 6 8 10 12 14 16 18 20 22 24 26 28 30 32
EuroNCAP Overall Test Score
New
stea
d A
djus
ted
Inju
ry R
isk
1 Star 2 Star 3 Star 4 Star
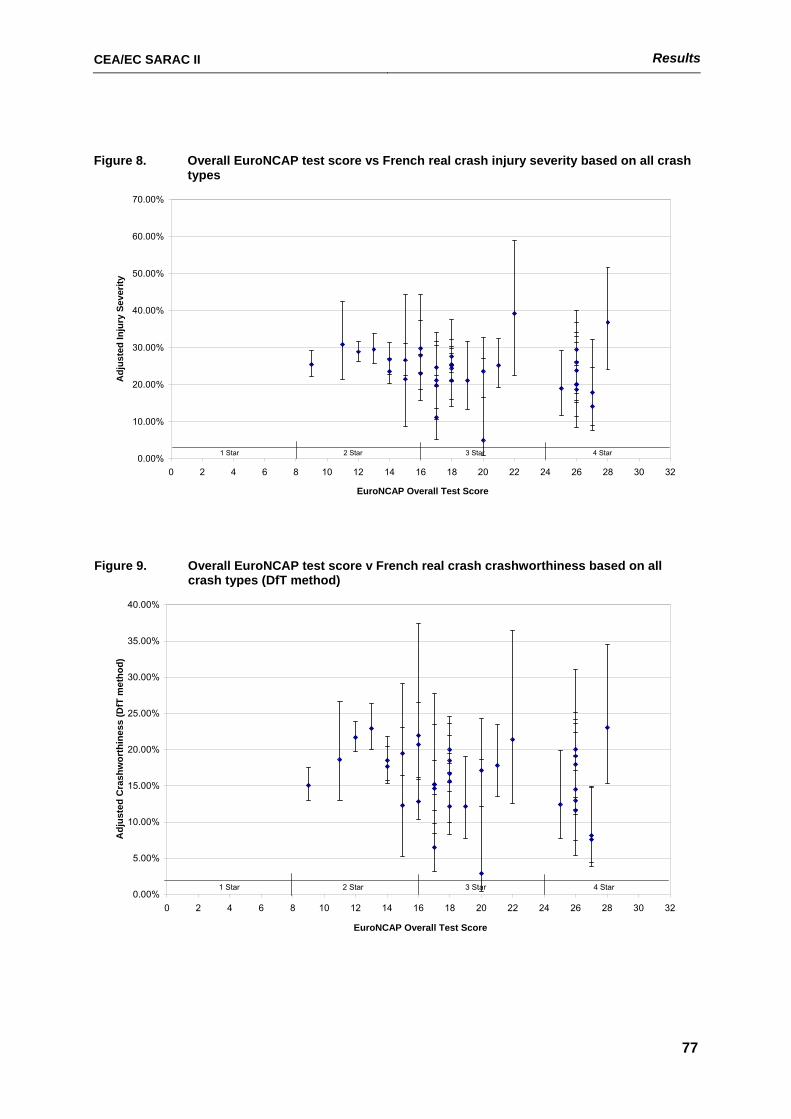
CEA/EC SARAC II Results
77
Figure 8. Overall EuroNCAP test score vs French real crash injury severity based on all crash types
0.00%
10.00%
20.00%
30.00%
40.00%
50.00%
60.00%
70.00%
0 2 4 6 8 10 12 14 16 18 20 22 24 26 28 30 32
EuroNCAP Overall Test Score
Adj
uste
d In
jury
Sev
erity
1 Star 2 Star 3 Star 4 Star
Figure 9. Overall EuroNCAP test score v French real crash crashworthiness based on all crash types (DfT method)
0.00%
5.00%
10.00%
15.00%
20.00%
25.00%
30.00%
35.00%
40.00%
0 2 4 6 8 10 12 14 16 18 20 22 24 26 28 30 32
EuroNCAP Overall Test Score
Adj
uste
d C
rash
wor
thin
ess
(DfT
met
hod)
1 Star 2 Star 3 Star 4 Star
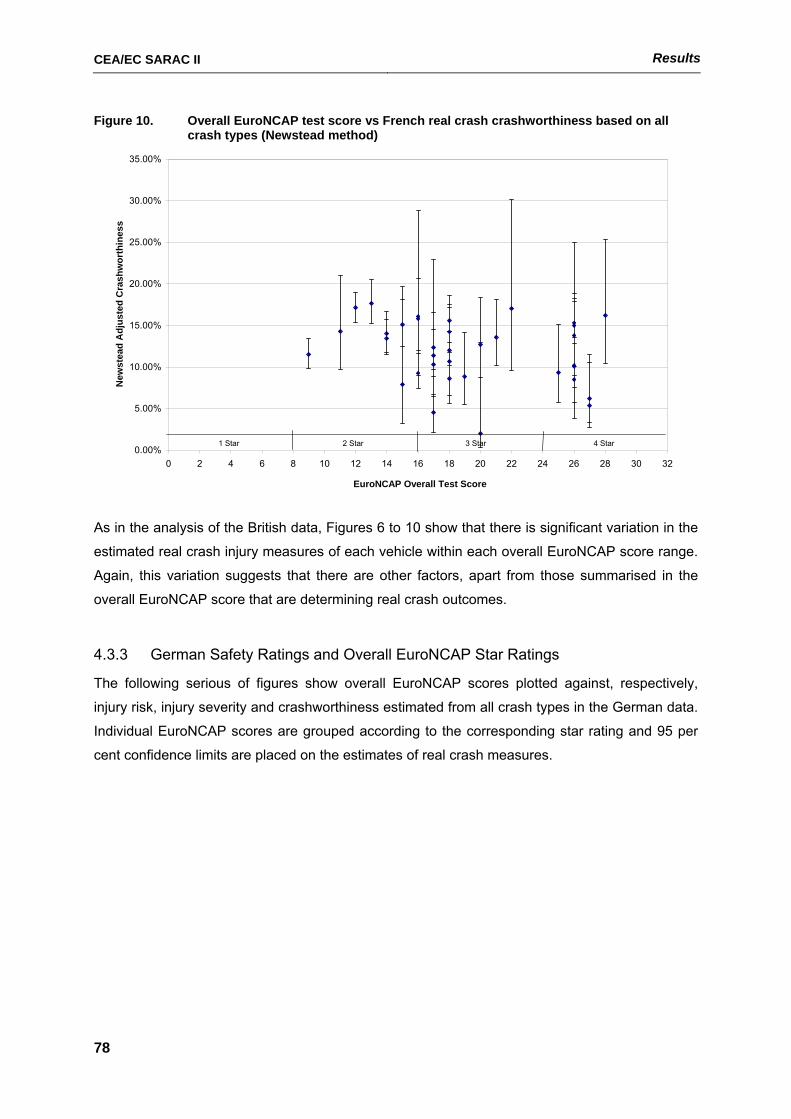
CEA/EC SARAC II Results
78
Figure 10. Overall EuroNCAP test score vs French real crash crashworthiness based on all crash types (Newstead method)
0.00%
5.00%
10.00%
15.00%
20.00%
25.00%
30.00%
35.00%
0 2 4 6 8 10 12 14 16 18 20 22 24 26 28 30 32
EuroNCAP Overall Test Score
New
stea
d A
djus
ted
Cra
shw
orth
ines
s
1 Star 2 Star 3 Star 4 Star
As in the analysis of the British data, Figures 6 to 10 show that there is significant variation in the
estimated real crash injury measures of each vehicle within each overall EuroNCAP score range.
Again, this variation suggests that there are other factors, apart from those summarised in the
overall EuroNCAP score that are determining real crash outcomes.
4.3.3 German Safety Ratings and Overall EuroNCAP Star Ratings
The following serious of figures show overall EuroNCAP scores plotted against, respectively,
injury risk, injury severity and crashworthiness estimated from all crash types in the German data.
Individual EuroNCAP scores are grouped according to the corresponding star rating and 95 per
cent confidence limits are placed on the estimates of real crash measures.
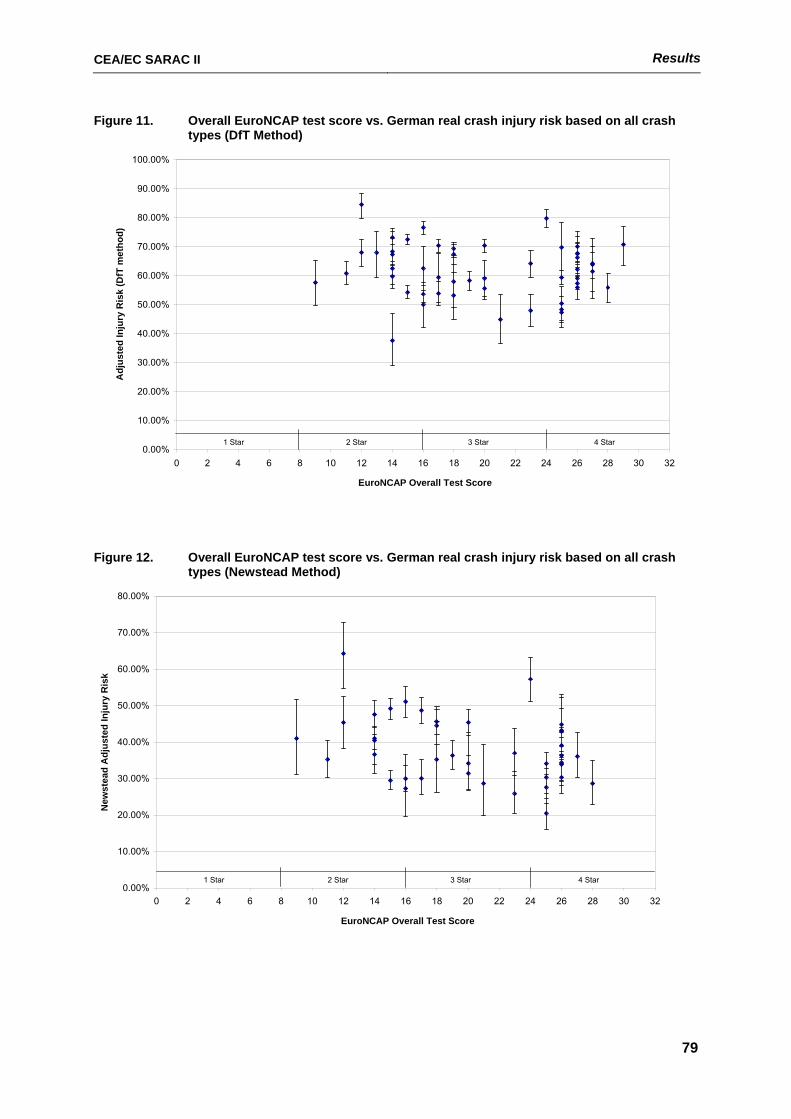
CEA/EC SARAC II Results
79
Figure 11. Overall EuroNCAP test score vs. German real crash injury risk based on all crash types (DfT Method)
0.00%
10.00%
20.00%
30.00%
40.00%
50.00%
60.00%
70.00%
80.00%
90.00%
100.00%
0 2 4 6 8 10 12 14 16 18 20 22 24 26 28 30 32
EuroNCAP Overall Test Score
Adj
uste
d In
jury
Ris
k (D
fT m
etho
d)
1 Star 2 Star 3 Star 4 Star
Figure 12. Overall EuroNCAP test score vs. German real crash injury risk based on all crash types (Newstead Method)
0.00%
10.00%
20.00%
30.00%
40.00%
50.00%
60.00%
70.00%
80.00%
0 2 4 6 8 10 12 14 16 18 20 22 24 26 28 30 32
EuroNCAP Overall Test Score
New
stea
d A
djus
ted
Inju
ry R
isk
1 Star 2 Star 3 Star 4 Star
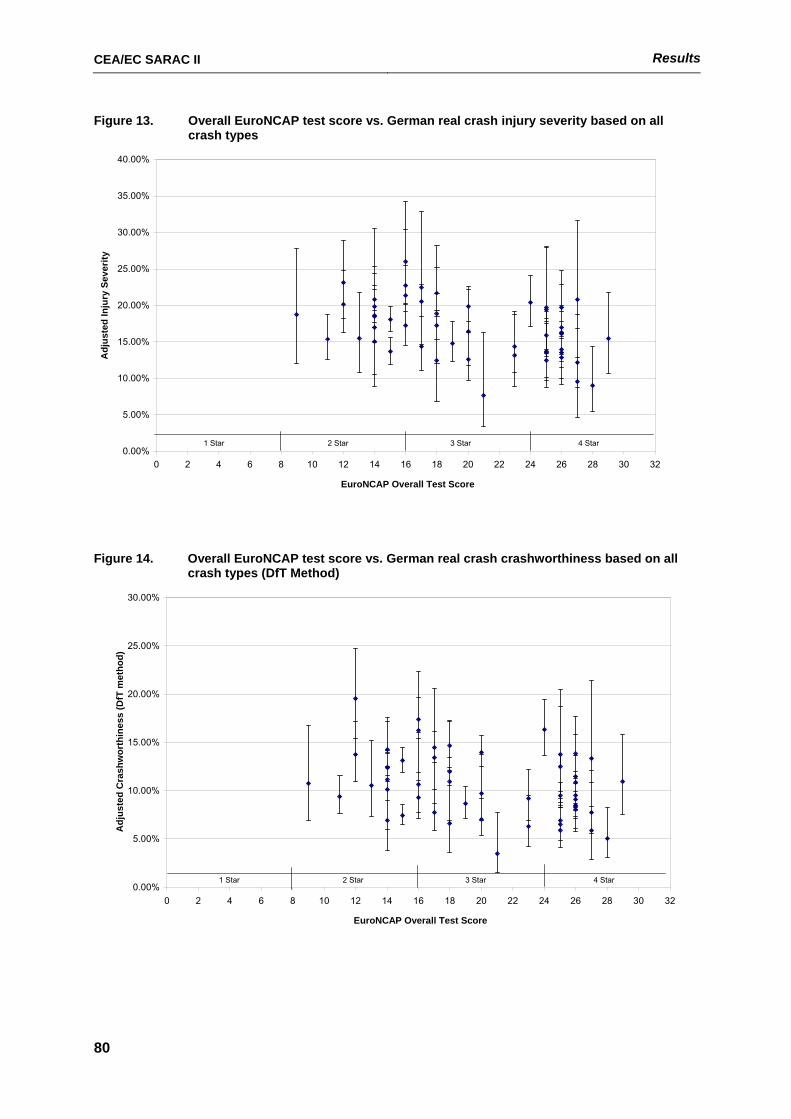
CEA/EC SARAC II Results
80
Figure 13. Overall EuroNCAP test score vs. German real crash injury severity based on all crash types
0.00%
5.00%
10.00%
15.00%
20.00%
25.00%
30.00%
35.00%
40.00%
0 2 4 6 8 10 12 14 16 18 20 22 24 26 28 30 32
EuroNCAP Overall Test Score
Adj
uste
d In
jury
Sev
erity
1 Star 2 Star 3 Star 4 Star
Figure 14. Overall EuroNCAP test score vs. German real crash crashworthiness based on all crash types (DfT Method)
0.00%
5.00%
10.00%
15.00%
20.00%
25.00%
30.00%
0 2 4 6 8 10 12 14 16 18 20 22 24 26 28 30 32
EuroNCAP Overall Test Score
Adj
uste
d C
rash
wor
thin
ess
(DfT
met
hod)
1 Star 2 Star 3 Star 4 Star
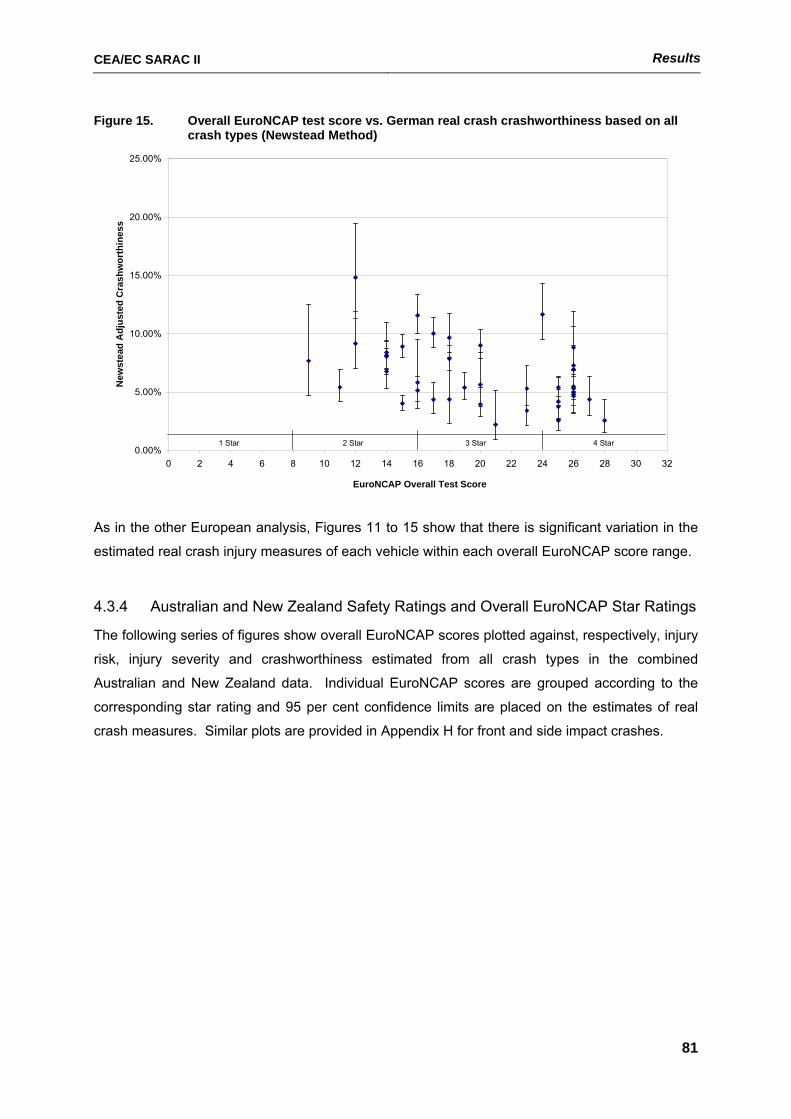
CEA/EC SARAC II Results
81
Figure 15. Overall EuroNCAP test score vs. German real crash crashworthiness based on all crash types (Newstead Method)
0.00%
5.00%
10.00%
15.00%
20.00%
25.00%
0 2 4 6 8 10 12 14 16 18 20 22 24 26 28 30 32
EuroNCAP Overall Test Score
New
stea
d A
djus
ted
Cra
shw
orth
ines
s
1 Star 2 Star 3 Star 4 Star
As in the other European analysis, Figures 11 to 15 show that there is significant variation in the
estimated real crash injury measures of each vehicle within each overall EuroNCAP score range.
4.3.4 Australian and New Zealand Safety Ratings and Overall EuroNCAP Star Ratings
The following series of figures show overall EuroNCAP scores plotted against, respectively, injury
risk, injury severity and crashworthiness estimated from all crash types in the combined
Australian and New Zealand data. Individual EuroNCAP scores are grouped according to the
corresponding star rating and 95 per cent confidence limits are placed on the estimates of real
crash measures. Similar plots are provided in Appendix H for front and side impact crashes.
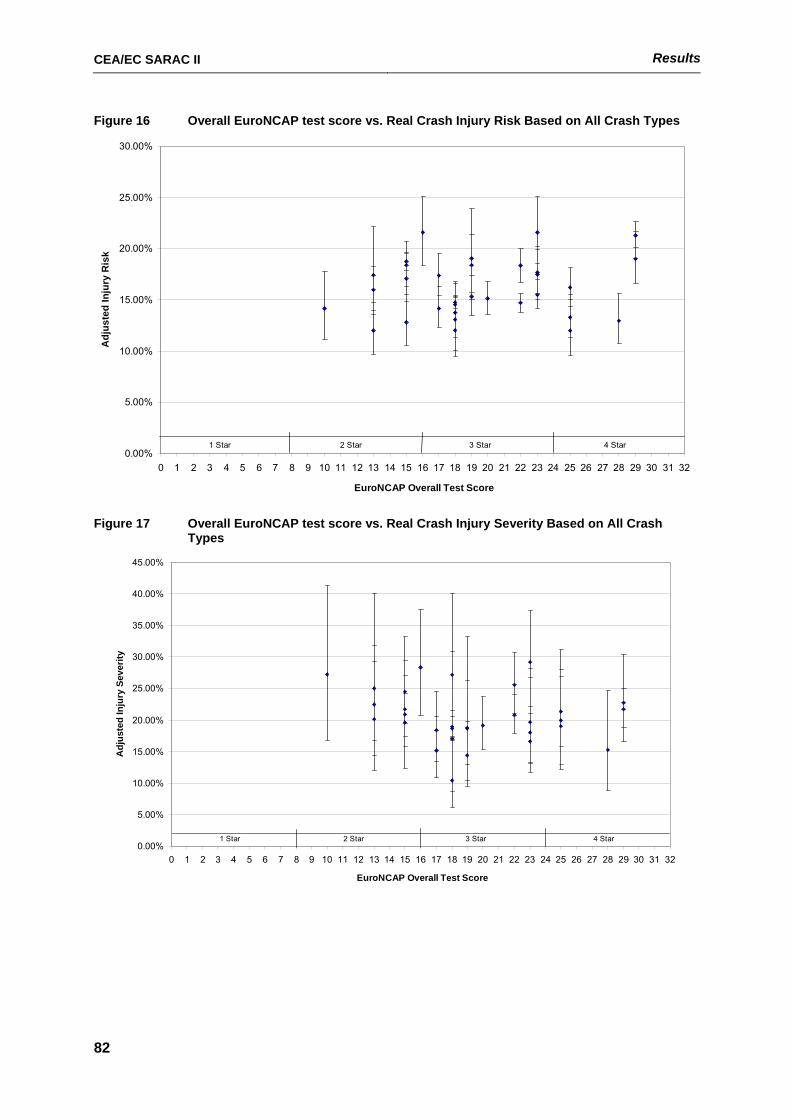
CEA/EC SARAC II Results
82
Figure 16 Overall EuroNCAP test score vs. Real Crash Injury Risk Based on All Crash Types
0.00%
5.00%
10.00%
15.00%
20.00%
25.00%
30.00%
0 1 2 3 4 5 6 7 8 9 10 11 12 13 14 15 16 17 18 19 20 21 22 23 24 25 26 27 28 29 30 31 32
EuroNCAP Overall Test Score
Adj
uste
d In
jury
Ris
k
1 Star 2 Star 3 Star 4 Star
Figure 17 Overall EuroNCAP test score vs. Real Crash Injury Severity Based on All Crash Types
0.00%
5.00%
10.00%
15.00%
20.00%
25.00%
30.00%
35.00%
40.00%
45.00%
0 1 2 3 4 5 6 7 8 9 10 11 12 13 14 15 16 17 18 19 20 21 22 23 24 25 26 27 28 29 30 31 32
EuroNCAP Overall Test Score
Adj
uste
d In
jury
Sev
erity
1 Star 2 Star 3 Star 4 Star
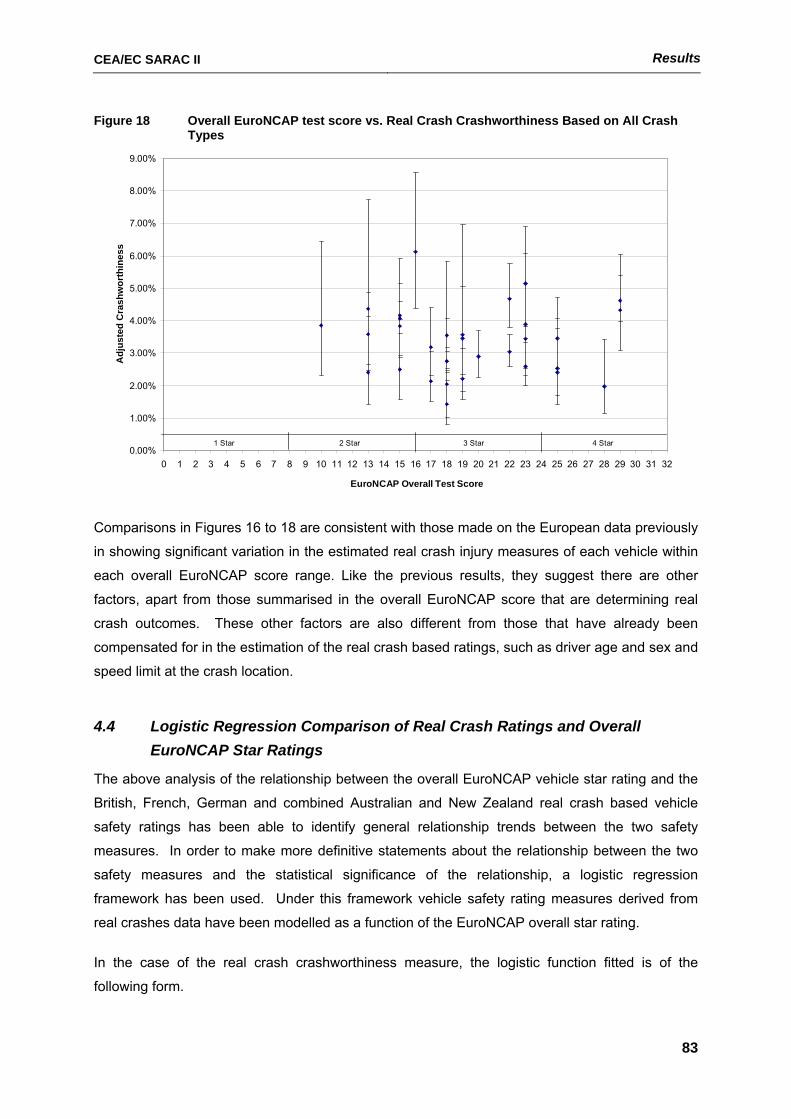
CEA/EC SARAC II Results
83
Figure 18 Overall EuroNCAP test score vs. Real Crash Crashworthiness Based on All Crash Types
0.00%
1.00%
2.00%
3.00%
4.00%
5.00%
6.00%
7.00%
8.00%
9.00%
0 1 2 3 4 5 6 7 8 9 10 11 12 13 14 15 16 17 18 19 20 21 22 23 24 25 26 27 28 29 30 31 32
EuroNCAP Overall Test Score
Adj
uste
d C
rash
wor
thin
ess
1 Star 2 Star 3 Star 4 Star
Comparisons in Figures 16 to 18 are consistent with those made on the European data previously
in showing significant variation in the estimated real crash injury measures of each vehicle within
each overall EuroNCAP score range. Like the previous results, they suggest there are other
factors, apart from those summarised in the overall EuroNCAP score that are determining real
crash outcomes. These other factors are also different from those that have already been
compensated for in the estimation of the real crash based ratings, such as driver age and sex and
speed limit at the crash location.
4.4 Logistic Regression Comparison of Real Crash Ratings and Overall EuroNCAP Star Ratings
The above analysis of the relationship between the overall EuroNCAP vehicle star rating and the
British, French, German and combined Australian and New Zealand real crash based vehicle
safety ratings has been able to identify general relationship trends between the two safety
measures. In order to make more definitive statements about the relationship between the two
safety measures and the statistical significance of the relationship, a logistic regression
framework has been used. Under this framework vehicle safety rating measures derived from
real crashes data have been modelled as a function of the EuroNCAP overall star rating.
In the case of the real crash crashworthiness measure, the logistic function fitted is of the
following form.
CEA/EC SARAC II Results
84
)()(itlog ii ratingsstaroverallNCAPEuroCWR βα += …(Equation 1)
where i is the vehicle model index and α and β are parameters of the logistic model. Similar
equations can be used to model the injury risk and injury severity components of crashworthiness
as a function of EuroNCAP overall star rating. No restriction has been placed on the form of the
relationship between the star rating categories and the dependent injury outcome variable. It may
be expected that a higher star rating would be associated with lower injury risk, severity or
crashworthiness in real crashes, or that there will be some monotonic relationship between the
barrier test and real crash measures. However, no such restiction has been place upon the
analysis in order to maintain objectivity.
The statistical significance of the EuroNCAP star rating as a whole in predicting real crash
outcome can be measured by the contribution of the EuroNCAP star rating term in improving the
fit of the logistic model. Improvement in the fit of a logistic model by inclusion of an extra
predictive term is measured by the change in scaled deviance of the model. The scaled deviance
is a statistic based on the likelihood ratio and has a chi-squared distribution with degrees of
freedom equal to the number of levels in the categorical factor fitted, minus one. In terms of the
EuroNCAP overall star rating being considered here, if the EuroNCAP star rating makes a
statistically significant contribution to the fit of the logistic model, this implies that there is a
statistically significant difference between average crashworthiness (or injury risk or severity) of at
least two of the star rating classes, but not necessarily more than two star rating classes. To
assess which pairs of the star rating classes have significantly different average crashworthiness
(or injury risk or severity), the confidence limits on the parameter point estimates generated from
the logistic modelling procedure must be compared to see if they overlap.
Categorical variables in a logistic model can be parameterised in a number of ways. One way
convenient to the interpretation of the effects being studied here is a parameterisation that
compares each level of the categorical variable to a comon reference level, often termed a simple
parameterisation. The reference level is the aliased level for which no parameter estimate can be
made. If the dependent variable being modelled is a probability of injury, as is the case here, the
exponent of the parameter estimates associated with each level of a categorical predictor variable
can be interpreted as the crashworthiness (injury risk or injury severity) in each category relative
to the reference category.
A better method of parameterising the EuroNCAP overall star rating for use in this study is often
referred to as the deviance method of parameterisation. Under the deviance method of
parameterisation, the average risk in each level of the categorical variable in not compared to that
in the aliased category, but is compared to the average injury risk across all observations in the
data set being analysed. This method of parameterisation has the advantage that the parameter
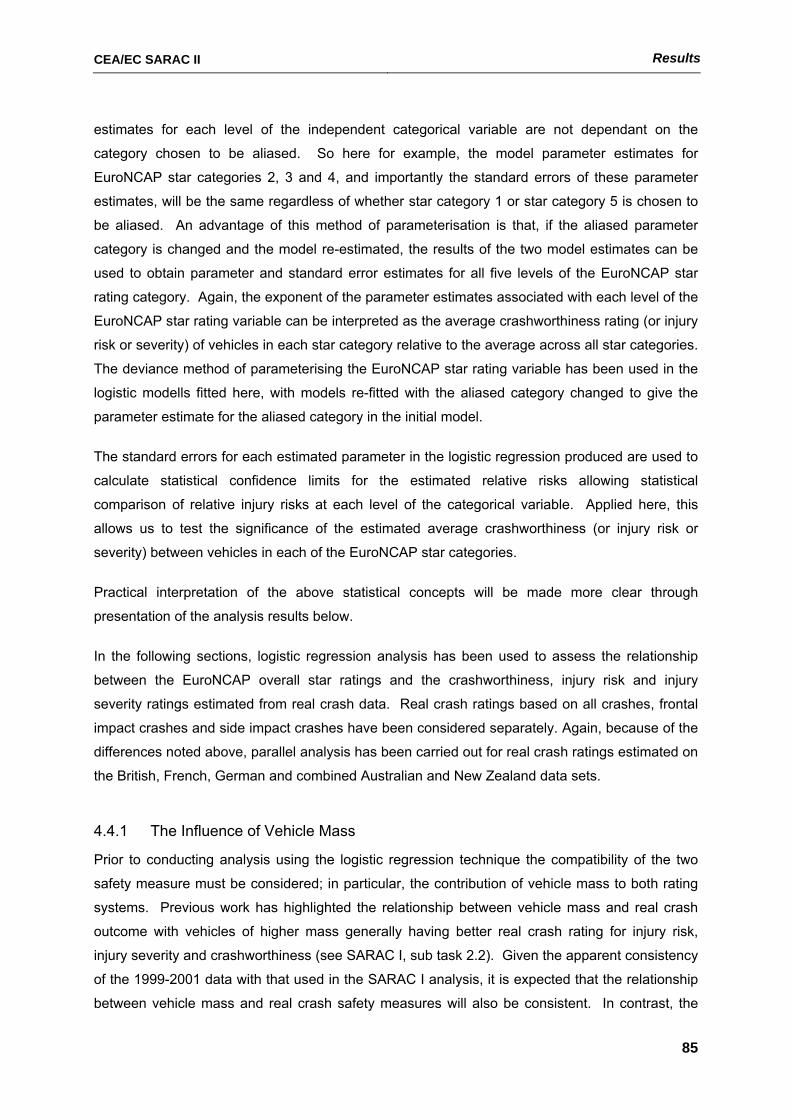
CEA/EC SARAC II Results
85
estimates for each level of the independent categorical variable are not dependant on the
category chosen to be aliased. So here for example, the model parameter estimates for
EuroNCAP star categories 2, 3 and 4, and importantly the standard errors of these parameter
estimates, will be the same regardless of whether star category 1 or star category 5 is chosen to
be aliased. An advantage of this method of parameterisation is that, if the aliased parameter
category is changed and the model re-estimated, the results of the two model estimates can be
used to obtain parameter and standard error estimates for all five levels of the EuroNCAP star
rating category. Again, the exponent of the parameter estimates associated with each level of the
EuroNCAP star rating variable can be interpreted as the average crashworthiness rating (or injury
risk or severity) of vehicles in each star category relative to the average across all star categories.
The deviance method of parameterising the EuroNCAP star rating variable has been used in the
logistic modells fitted here, with models re-fitted with the aliased category changed to give the
parameter estimate for the aliased category in the initial model.
The standard errors for each estimated parameter in the logistic regression produced are used to
calculate statistical confidence limits for the estimated relative risks allowing statistical
comparison of relative injury risks at each level of the categorical variable. Applied here, this
allows us to test the significance of the estimated average crashworthiness (or injury risk or
severity) between vehicles in each of the EuroNCAP star categories.
Practical interpretation of the above statistical concepts will be made more clear through
presentation of the analysis results below.
In the following sections, logistic regression analysis has been used to assess the relationship
between the EuroNCAP overall star ratings and the crashworthiness, injury risk and injury
severity ratings estimated from real crash data. Real crash ratings based on all crashes, frontal
impact crashes and side impact crashes have been considered separately. Again, because of the
differences noted above, parallel analysis has been carried out for real crash ratings estimated on
the British, French, German and combined Australian and New Zealand data sets.
4.4.1 The Influence of Vehicle Mass
Prior to conducting analysis using the logistic regression technique the compatibility of the two
safety measure must be considered; in particular, the contribution of vehicle mass to both rating
systems. Previous work has highlighted the relationship between vehicle mass and real crash
outcome with vehicles of higher mass generally having better real crash rating for injury risk,
injury severity and crashworthiness (see SARAC I, sub task 2.2). Given the apparent consistency
of the 1999-2001 data with that used in the SARAC I analysis, it is expected that the relationship
between vehicle mass and real crash safety measures will also be consistent. In contrast, the
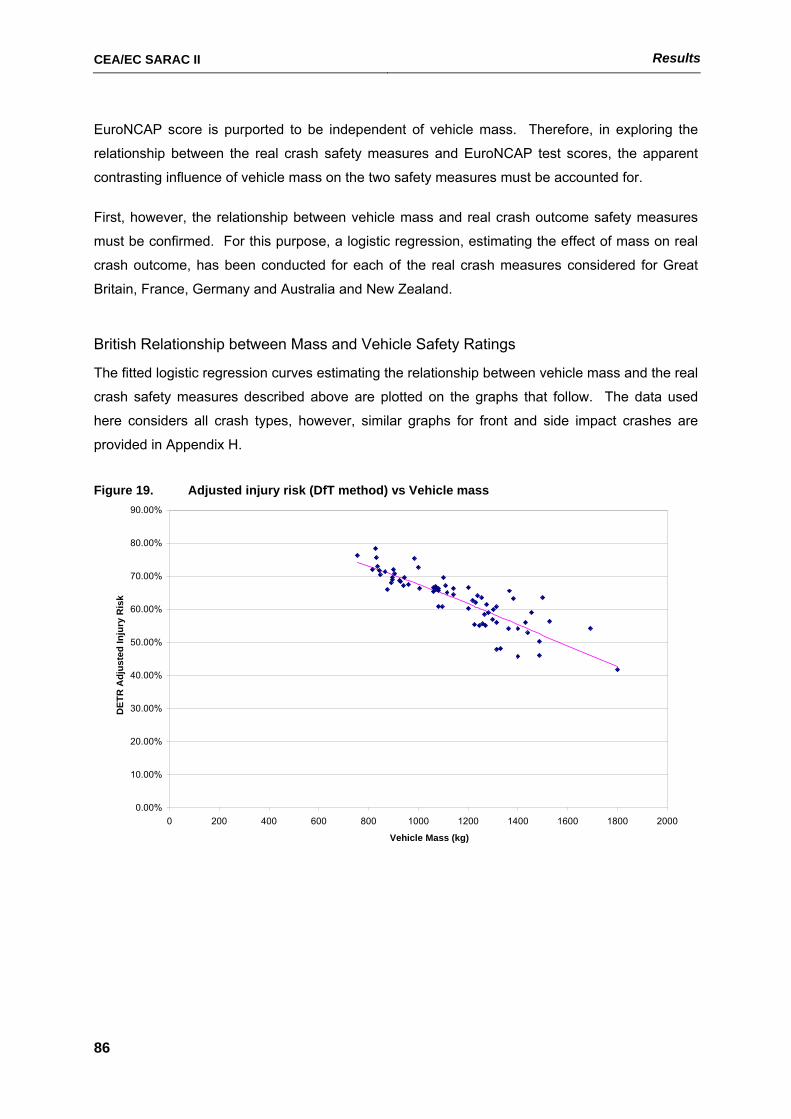
CEA/EC SARAC II Results
86
EuroNCAP score is purported to be independent of vehicle mass. Therefore, in exploring the
relationship between the real crash safety measures and EuroNCAP test scores, the apparent
contrasting influence of vehicle mass on the two safety measures must be accounted for.
First, however, the relationship between vehicle mass and real crash outcome safety measures
must be confirmed. For this purpose, a logistic regression, estimating the effect of mass on real
crash outcome, has been conducted for each of the real crash measures considered for Great
Britain, France, Germany and Australia and New Zealand.
British Relationship between Mass and Vehicle Safety Ratings
The fitted logistic regression curves estimating the relationship between vehicle mass and the real
crash safety measures described above are plotted on the graphs that follow. The data used
here considers all crash types, however, similar graphs for front and side impact crashes are
provided in Appendix H.
Figure 19. Adjusted injury risk (DfT method) vs Vehicle mass
0.00%
10.00%
20.00%
30.00%
40.00%
50.00%
60.00%
70.00%
80.00%
90.00%
0 200 400 600 800 1000 1200 1400 1600 1800 2000
Vehicle Mass (kg)
DET
R A
djus
ted
Inju
ry R
isk
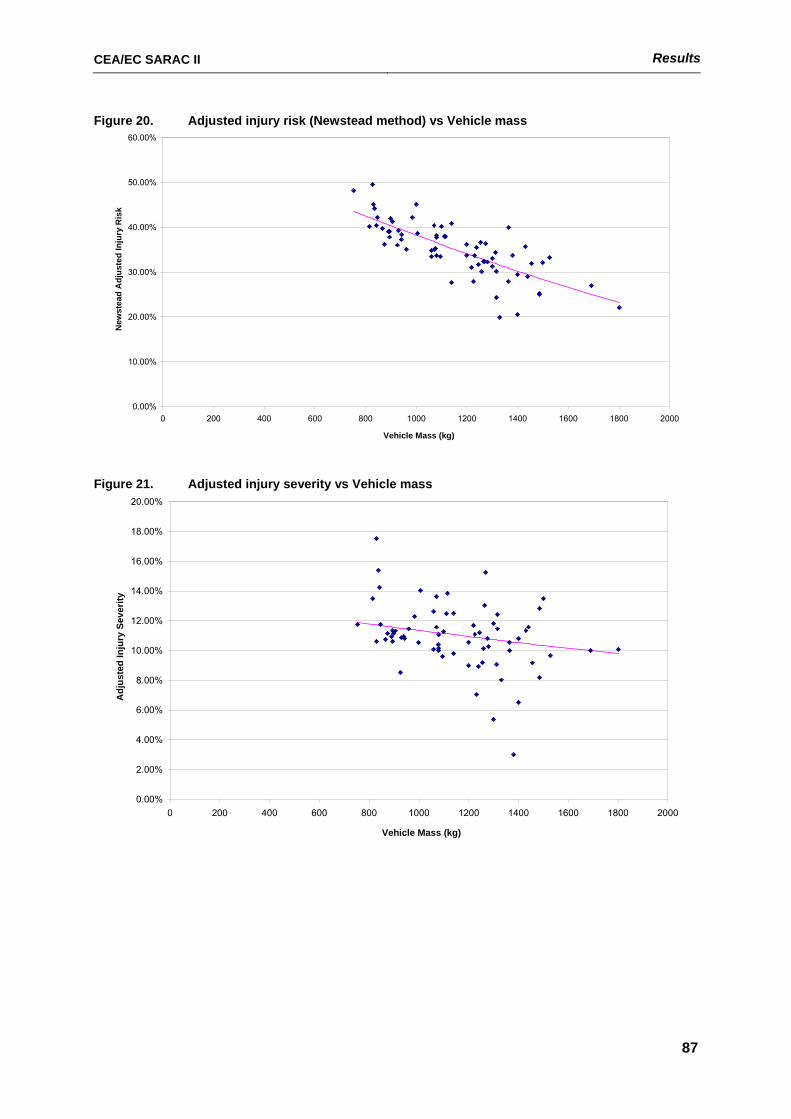
CEA/EC SARAC II Results
87
Figure 20. Adjusted injury risk (Newstead method) vs Vehicle mass
0.00%
10.00%
20.00%
30.00%
40.00%
50.00%
60.00%
0 200 400 600 800 1000 1200 1400 1600 1800 2000
Vehicle Mass (kg)
New
stea
d A
djus
ted
Inju
ry R
isk
Figure 21. Adjusted injury severity vs Vehicle mass
0.00%
2.00%
4.00%
6.00%
8.00%
10.00%
12.00%
14.00%
16.00%
18.00%
20.00%
0 200 400 600 800 1000 1200 1400 1600 1800 2000
Vehicle Mass (kg)
Adj
uste
d In
jury
Sev
erity
CEA/EC SARAC II Results
88
Figure 22. Adjusted crashworthiness (DfT method) vs Vehicle mass
0.00%
2.00%
4.00%
6.00%
8.00%
10.00%
12.00%
14.00%
16.00%
0 200 400 600 800 1000 1200 1400 1600 1800 2000
Vehicle Mass (kg)
DET
R C
rash
wor
thin
ess
Figure 23. Adjusted crashworthiness (Newstead method) vs Vehicle mass
0.00%
1.00%
2.00%
3.00%
4.00%
5.00%
6.00%
7.00%
8.00%
9.00%
10.00%
0 200 400 600 800 1000 1200 1400 1600 1800 2000
Vehicle Mass (kg)
New
stea
d A
djus
ted
Cra
shw
orth
ines
s
Figures 19-23 demonstrate a strong relationship between each of the estimated real crash safety
measures and vehicle mass, with vehicles of higher mass generally associated with improved
safety performance in the real crash safety measures. Further, although not reported here, the
coefficient of vehicle mass in each of the regressions calculated was both negative and
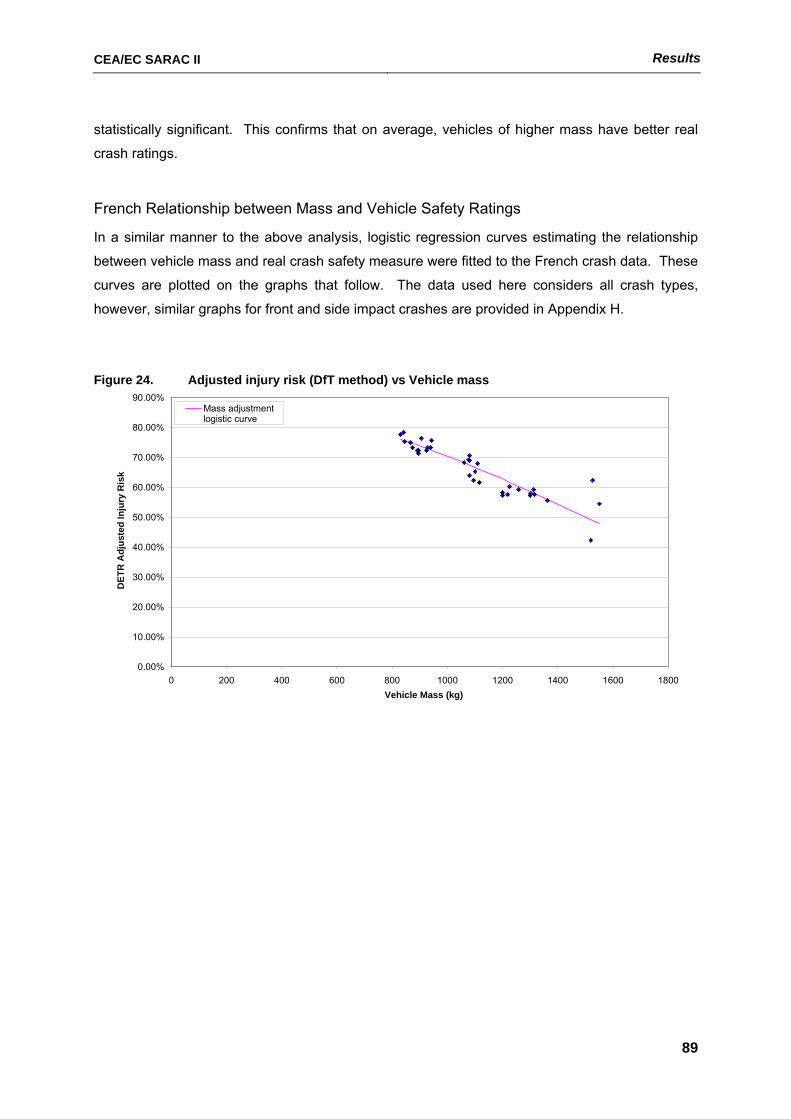
CEA/EC SARAC II Results
89
statistically significant. This confirms that on average, vehicles of higher mass have better real
crash ratings.
French Relationship between Mass and Vehicle Safety Ratings
In a similar manner to the above analysis, logistic regression curves estimating the relationship
between vehicle mass and real crash safety measure were fitted to the French crash data. These
curves are plotted on the graphs that follow. The data used here considers all crash types,
however, similar graphs for front and side impact crashes are provided in Appendix H.
Figure 24. Adjusted injury risk (DfT method) vs Vehicle mass
0.00%
10.00%
20.00%
30.00%
40.00%
50.00%
60.00%
70.00%
80.00%
90.00%
0 200 400 600 800 1000 1200 1400 1600 1800Vehicle Mass (kg)
DET
R A
djus
ted
Inju
ry R
isk
Mass adjustmentlogistic curve
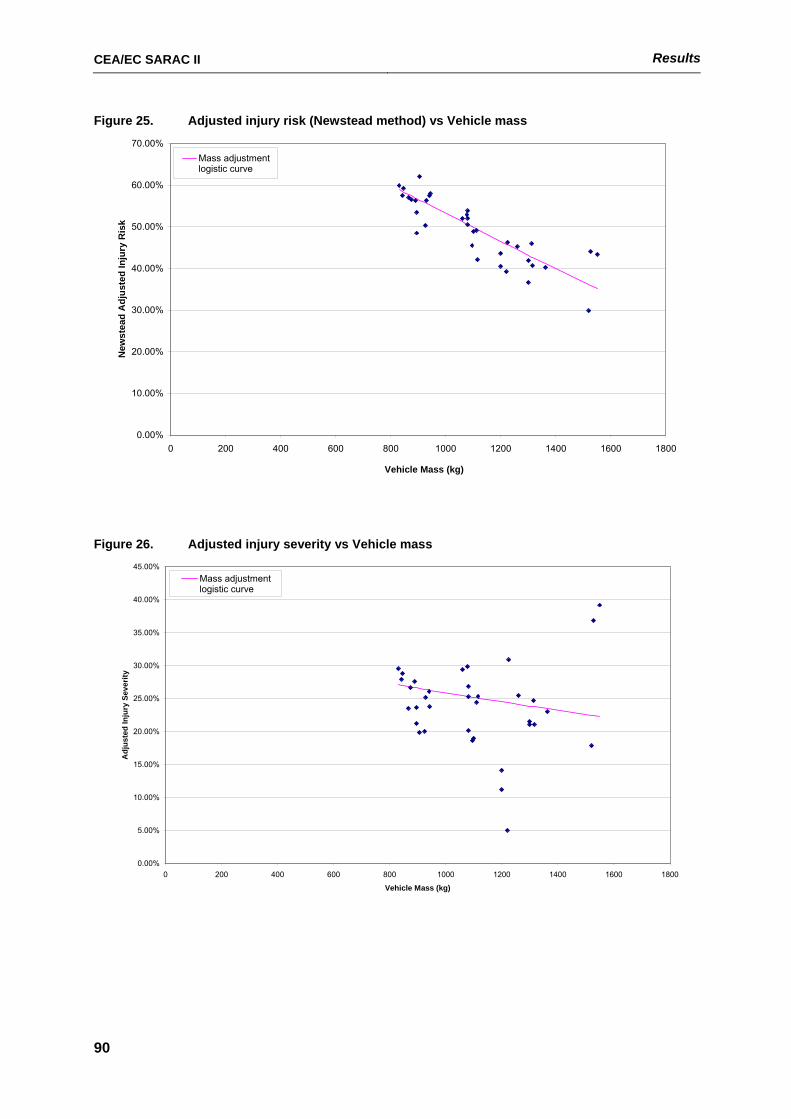
CEA/EC SARAC II Results
90
Figure 25. Adjusted injury risk (Newstead method) vs Vehicle mass
0.00%
10.00%
20.00%
30.00%
40.00%
50.00%
60.00%
70.00%
0 200 400 600 800 1000 1200 1400 1600 1800
Vehicle Mass (kg)
New
stea
d A
djus
ted
Inju
ry R
isk
Mass adjustmentlogistic curve
Figure 26. Adjusted injury severity vs Vehicle mass
0.00%
5.00%
10.00%
15.00%
20.00%
25.00%
30.00%
35.00%
40.00%
45.00%
0 200 400 600 800 1000 1200 1400 1600 1800
Vehicle Mass (kg)
Adj
uste
d In
jury
Sev
erity
Mass adjustmentlogistic curve
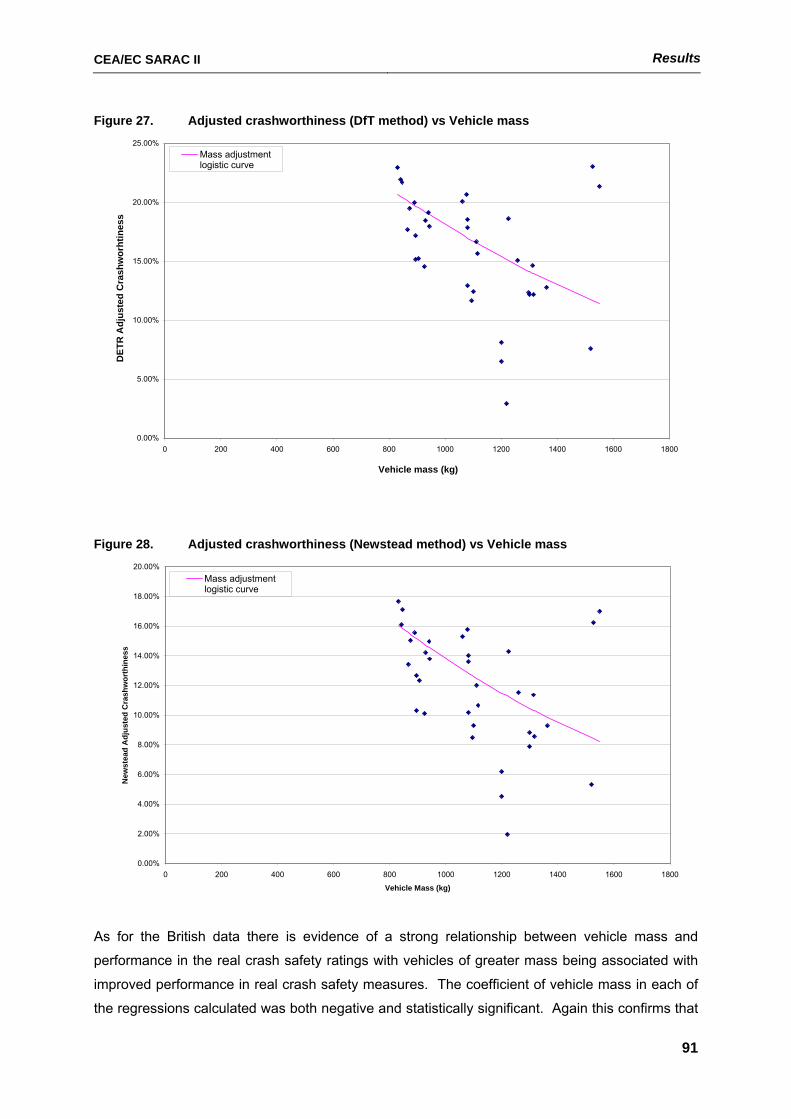
CEA/EC SARAC II Results
91
Figure 27. Adjusted crashworthiness (DfT method) vs Vehicle mass
0.00%
5.00%
10.00%
15.00%
20.00%
25.00%
0 200 400 600 800 1000 1200 1400 1600 1800
Vehicle mass (kg)
DET
R A
djus
ted
Cra
shw
orht
ines
s
Mass adjustmentlogistic curve
Figure 28. Adjusted crashworthiness (Newstead method) vs Vehicle mass
0.00%
2.00%
4.00%
6.00%
8.00%
10.00%
12.00%
14.00%
16.00%
18.00%
20.00%
0 200 400 600 800 1000 1200 1400 1600 1800
Vehicle Mass (kg)
New
stea
d A
djus
ted
Cra
shw
orth
ines
s
Mass adjustmentlogistic curve
As for the British data there is evidence of a strong relationship between vehicle mass and
performance in the real crash safety ratings with vehicles of greater mass being associated with
improved performance in real crash safety measures. The coefficient of vehicle mass in each of
the regressions calculated was both negative and statistically significant. Again this confirms that
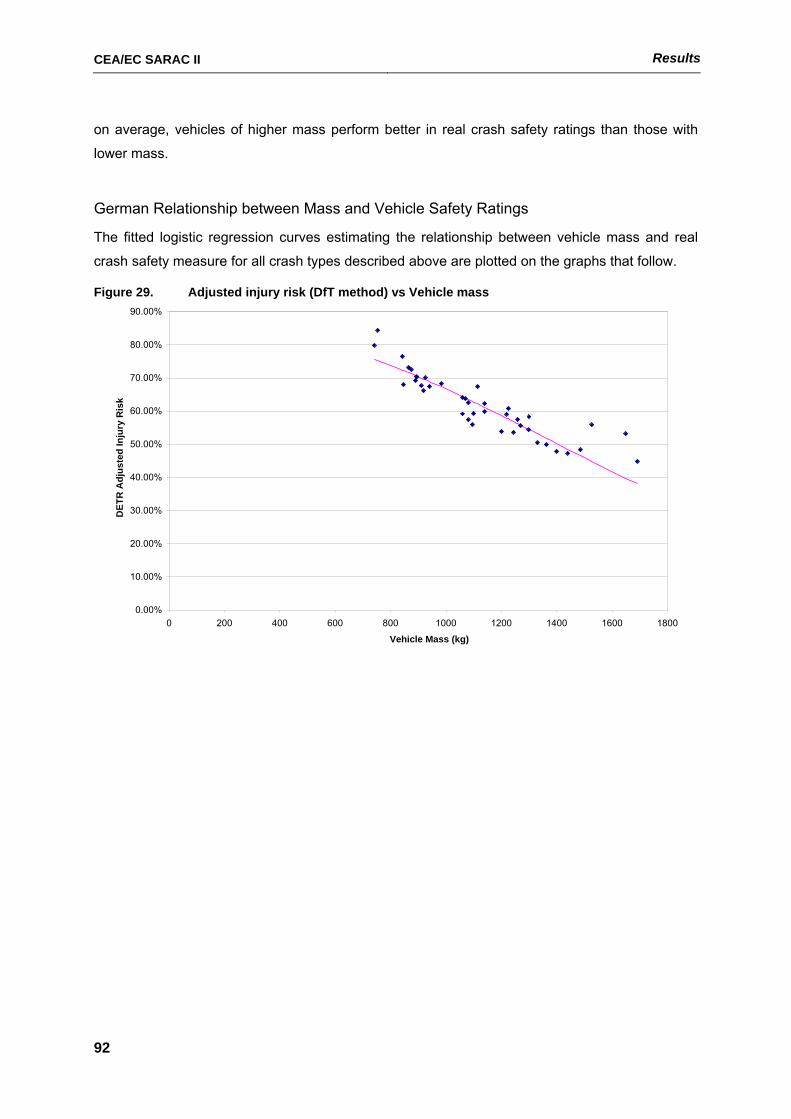
CEA/EC SARAC II Results
92
on average, vehicles of higher mass perform better in real crash safety ratings than those with
lower mass.
German Relationship between Mass and Vehicle Safety Ratings
The fitted logistic regression curves estimating the relationship between vehicle mass and real
crash safety measure for all crash types described above are plotted on the graphs that follow.
Figure 29. Adjusted injury risk (DfT method) vs Vehicle mass
0.00%
10.00%
20.00%
30.00%
40.00%
50.00%
60.00%
70.00%
80.00%
90.00%
0 200 400 600 800 1000 1200 1400 1600 1800
Vehicle Mass (kg)
DET
R A
djus
ted
Inju
ry R
isk
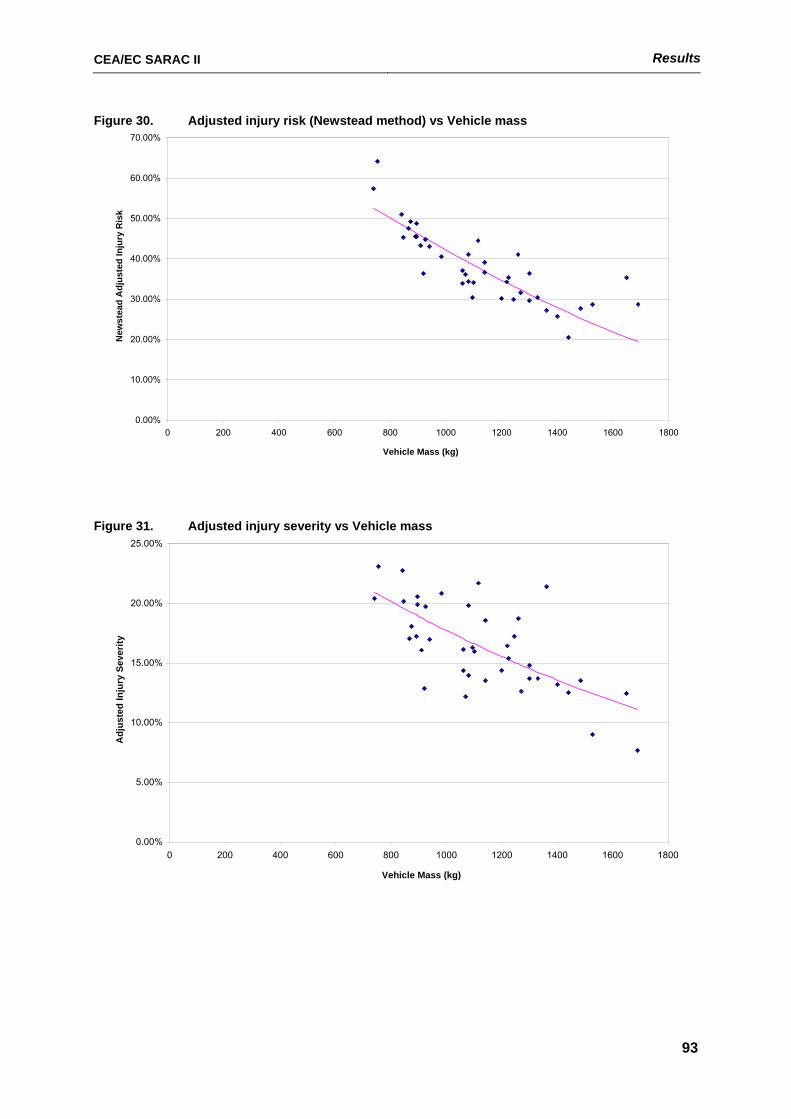
CEA/EC SARAC II Results
93
Figure 30. Adjusted injury risk (Newstead method) vs Vehicle mass
0.00%
10.00%
20.00%
30.00%
40.00%
50.00%
60.00%
70.00%
0 200 400 600 800 1000 1200 1400 1600 1800
Vehicle Mass (kg)
New
stea
d A
djus
ted
Inju
ry R
isk
Figure 31. Adjusted injury severity vs Vehicle mass
0.00%
5.00%
10.00%
15.00%
20.00%
25.00%
0 200 400 600 800 1000 1200 1400 1600 1800
Vehicle Mass (kg)
Adj
uste
d In
jury
Sev
erity
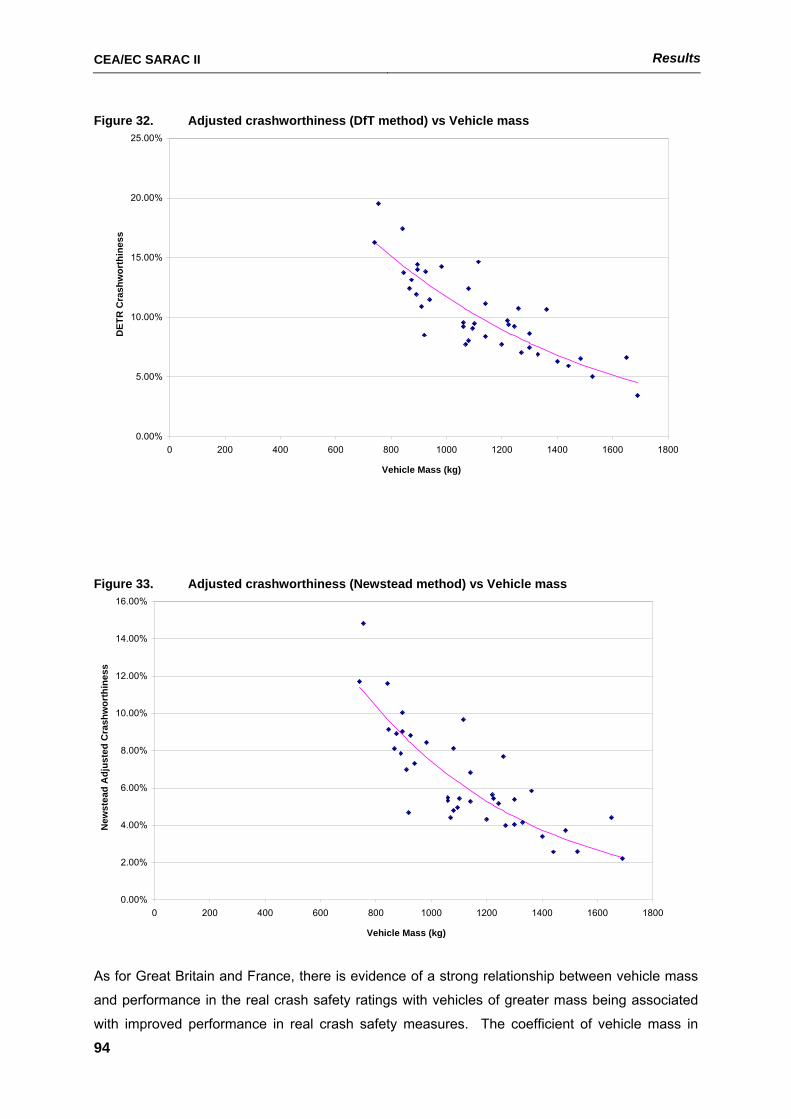
CEA/EC SARAC II Results
94
Figure 32. Adjusted crashworthiness (DfT method) vs Vehicle mass
0.00%
5.00%
10.00%
15.00%
20.00%
25.00%
0 200 400 600 800 1000 1200 1400 1600 1800
Vehicle Mass (kg)
DET
R C
rash
wor
thin
ess
Figure 33. Adjusted crashworthiness (Newstead method) vs Vehicle mass
0.00%
2.00%
4.00%
6.00%
8.00%
10.00%
12.00%
14.00%
16.00%
0 200 400 600 800 1000 1200 1400 1600 1800
Vehicle Mass (kg)
New
stea
d A
djus
ted
Cra
shw
orth
ines
s
As for Great Britain and France, there is evidence of a strong relationship between vehicle mass
and performance in the real crash safety ratings with vehicles of greater mass being associated
with improved performance in real crash safety measures. The coefficient of vehicle mass in
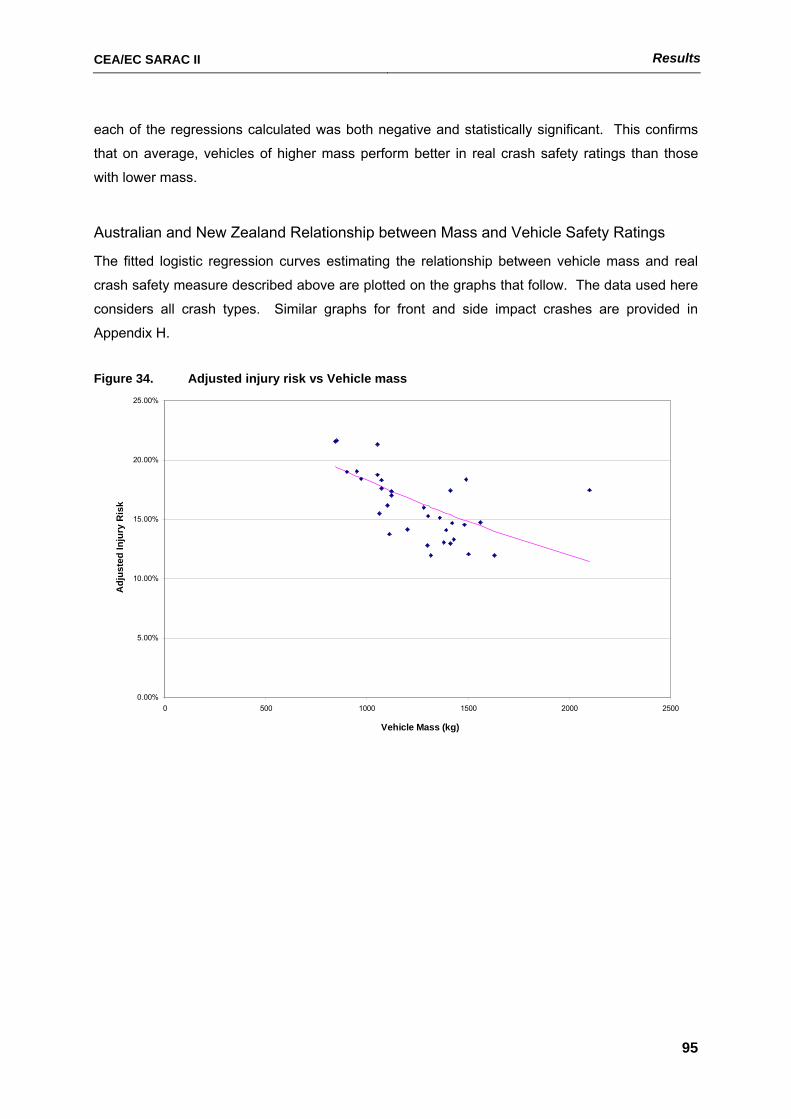
CEA/EC SARAC II Results
95
each of the regressions calculated was both negative and statistically significant. This confirms
that on average, vehicles of higher mass perform better in real crash safety ratings than those
with lower mass.
Australian and New Zealand Relationship between Mass and Vehicle Safety Ratings
The fitted logistic regression curves estimating the relationship between vehicle mass and real
crash safety measure described above are plotted on the graphs that follow. The data used here
considers all crash types. Similar graphs for front and side impact crashes are provided in
Appendix H.
Figure 34. Adjusted injury risk vs Vehicle mass
0.00%
5.00%
10.00%
15.00%
20.00%
25.00%
0 500 1000 1500 2000 2500
Vehicle Mass (kg)
Adj
uste
d In
jury
Ris
k
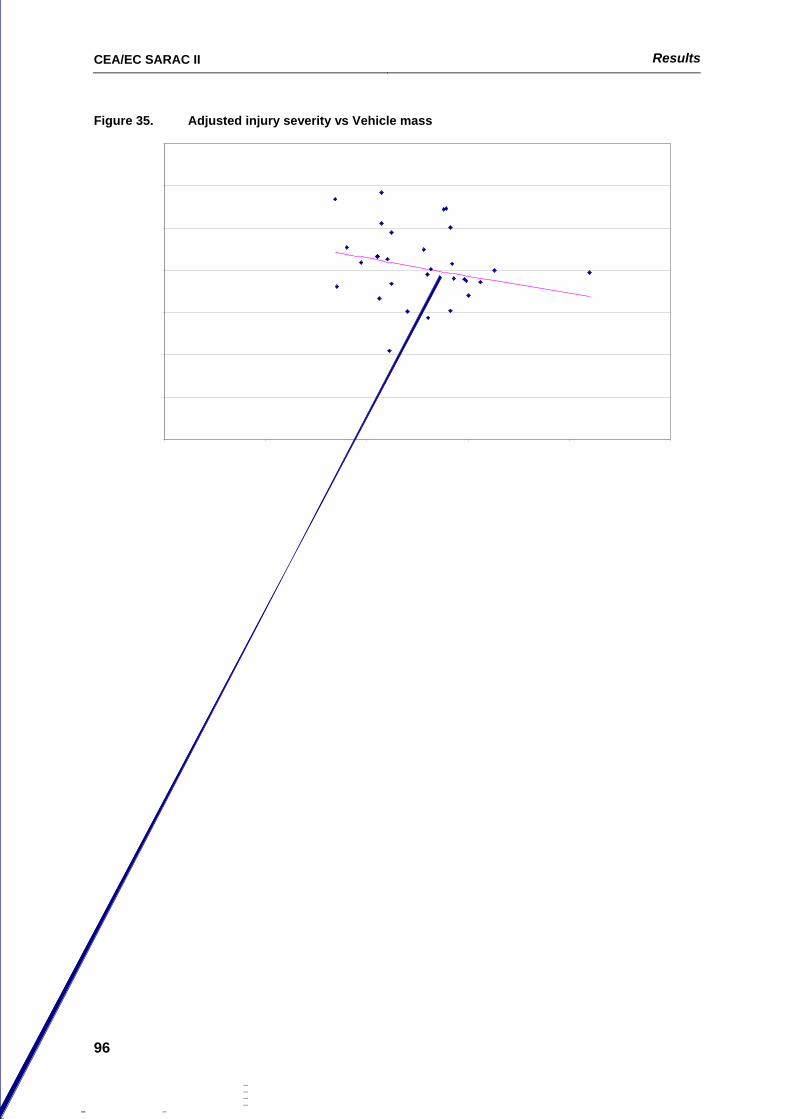
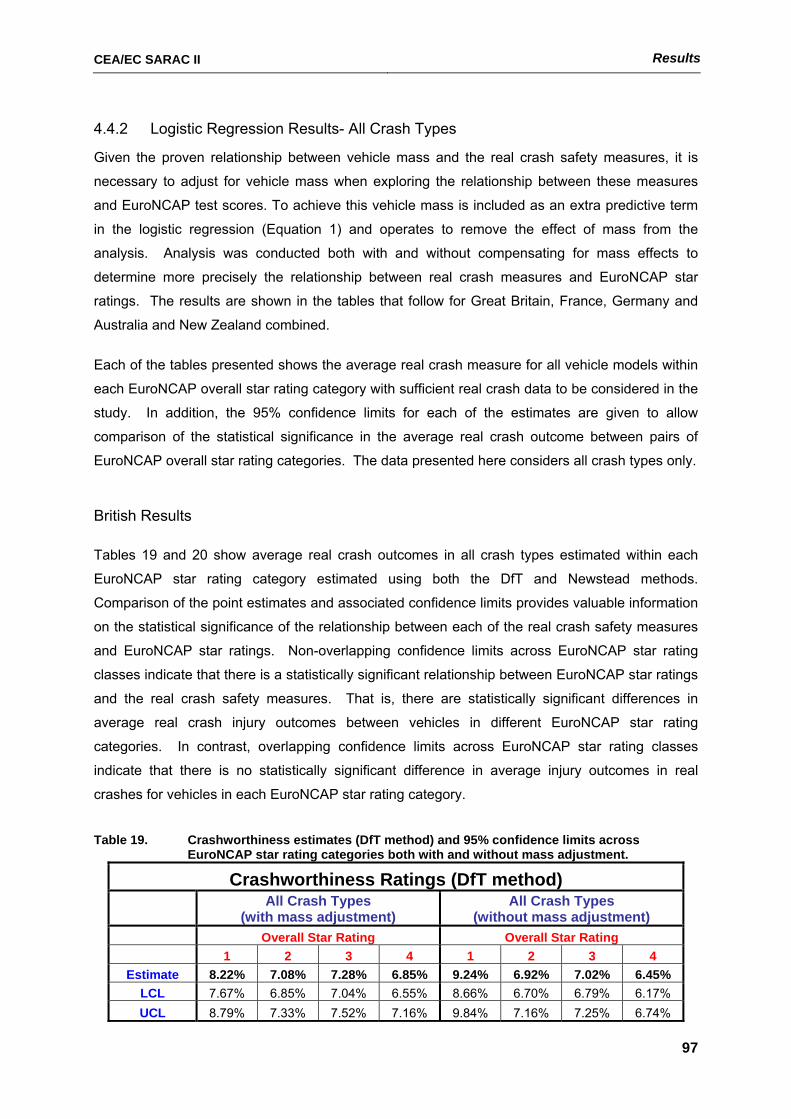
CEA/EC SARAC II Results
97
4.4.2 Logistic Regression Results- All Crash Types
Given the proven relationship between vehicle mass and the real crash safety measures, it is
necessary to adjust for vehicle mass when exploring the relationship between these measures
and EuroNCAP test scores. To achieve this vehicle mass is included as an extra predictive term
in the logistic regression (Equation 1) and operates to remove the effect of mass from the
analysis. Analysis was conducted both with and without compensating for mass effects to
determine more precisely the relationship between real crash measures and EuroNCAP star
ratings. The results are shown in the tables that follow for Great Britain, France, Germany and
Australia and New Zealand combined.
Each of the tables presented shows the average real crash measure for all vehicle models within
each EuroNCAP overall star rating category with sufficient real crash data to be considered in the
study. In addition, the 95% confidence limits for each of the estimates are given to allow
comparison of the statistical significance in the average real crash outcome between pairs of
EuroNCAP overall star rating categories. The data presented here considers all crash types only.
British Results
Tables 19 and 20 show average real crash outcomes in all crash types estimated within each
EuroNCAP star rating category estimated using both the DfT and Newstead methods.
Comparison of the point estimates and associated confidence limits provides valuable information
on the statistical significance of the relationship between each of the real crash safety measures
and EuroNCAP star ratings. Non-overlapping confidence limits across EuroNCAP star rating
classes indicate that there is a statistically significant relationship between EuroNCAP star ratings
and the real crash safety measures. That is, there are statistically significant differences in
average real crash injury outcomes between vehicles in different EuroNCAP star rating
categories. In contrast, overlapping confidence limits across EuroNCAP star rating classes
indicate that there is no statistically significant difference in average injury outcomes in real
crashes for vehicles in each EuroNCAP star rating category.
Table 19. Crashworthiness estimates (DfT method) and 95% confidence limits across
EuroNCAP star rating categories both with and without mass adjustment.
Crashworthiness Ratings (DfT method)
All Crash Types
(with mass adjustment) All Crash Types
(without mass adjustment) Overall Star Rating Overall Star Rating 1 2 3 4 1 2 3 4
Estimate 8.22% 7.08% 7.28% 6.85% 9.24% 6.92% 7.02% 6.45% LCL 7.67% 6.85% 7.04% 6.55% 8.66% 6.70% 6.79% 6.17% UCL 8.79% 7.33% 7.52% 7.16% 9.84% 7.16% 7.25% 6.74%
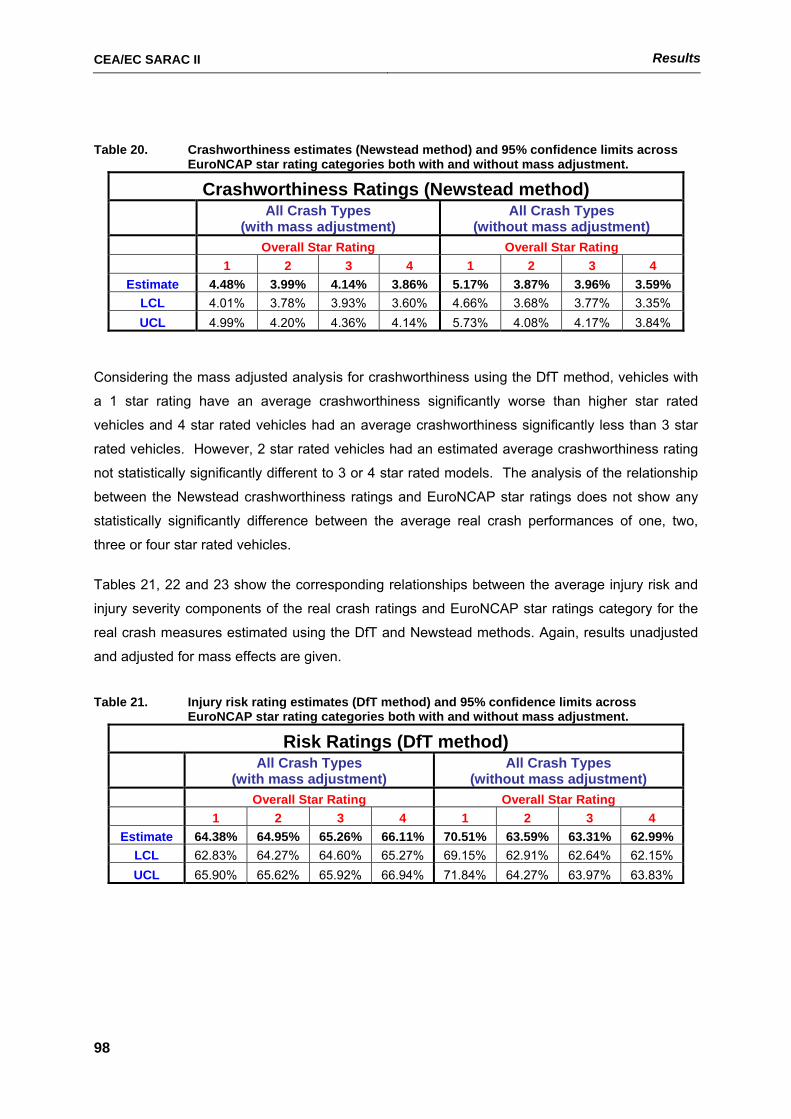
CEA/EC SARAC II Results
98
Table 20. Crashworthiness estimates (Newstead method) and 95% confidence limits across
EuroNCAP star rating categories both with and without mass adjustment.
Crashworthiness Ratings (Newstead method)
All Crash Types
(with mass adjustment) All Crash Types
(without mass adjustment) Overall Star Rating Overall Star Rating 1 2 3 4 1 2 3 4
Estimate 4.48% 3.99% 4.14% 3.86% 5.17% 3.87% 3.96% 3.59% LCL 4.01% 3.78% 3.93% 3.60% 4.66% 3.68% 3.77% 3.35% UCL 4.99% 4.20% 4.36% 4.14% 5.73% 4.08% 4.17% 3.84%
Considering the mass adjusted analysis for crashworthiness using the DfT method, vehicles with
a 1 star rating have an average crashworthiness significantly worse than higher star rated
vehicles and 4 star rated vehicles had an average crashworthiness significantly less than 3 star
rated vehicles. However, 2 star rated vehicles had an estimated average crashworthiness rating
not statistically significantly different to 3 or 4 star rated models. The analysis of the relationship
between the Newstead crashworthiness ratings and EuroNCAP star ratings does not show any
statistically significantly difference between the average real crash performances of one, two,
three or four star rated vehicles.
Tables 21, 22 and 23 show the corresponding relationships between the average injury risk and
injury severity components of the real crash ratings and EuroNCAP star ratings category for the
real crash measures estimated using the DfT and Newstead methods. Again, results unadjusted
and adjusted for mass effects are given.
Table 21. Injury risk rating estimates (DfT method) and 95% confidence limits across
EuroNCAP star rating categories both with and without mass adjustment.
Risk Ratings (DfT method)
All Crash Types
(with mass adjustment) All Crash Types
(without mass adjustment) Overall Star Rating Overall Star Rating 1 2 3 4 1 2 3 4
Estimate 64.38% 64.95% 65.26% 66.11% 70.51% 63.59% 63.31% 62.99% LCL 62.83% 64.27% 64.60% 65.27% 69.15% 62.91% 62.64% 62.15% UCL 65.90% 65.62% 65.92% 66.94% 71.84% 64.27% 63.97% 63.83%
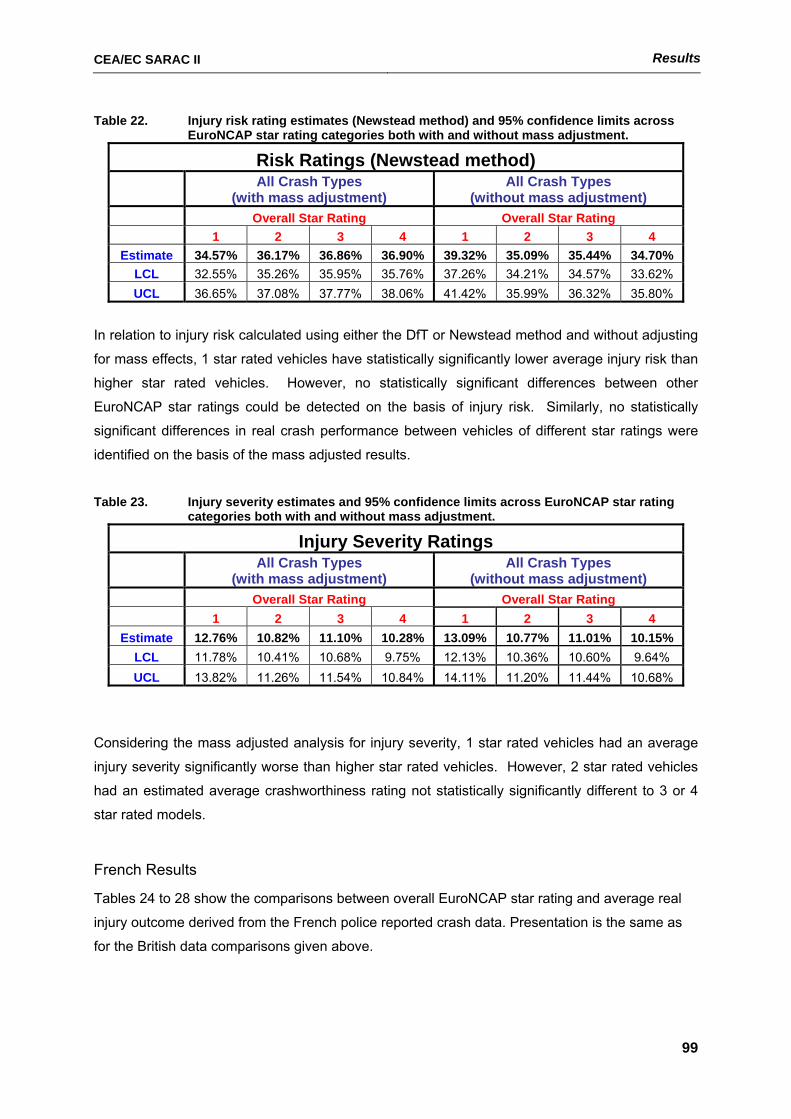
CEA/EC SARAC II Results
99
Table 22. Injury risk rating estimates (Newstead method) and 95% confidence limits across EuroNCAP star rating categories both with and without mass adjustment.
Risk Ratings (Newstead method)
All Crash Types
(with mass adjustment) All Crash Types
(without mass adjustment) Overall Star Rating Overall Star Rating 1 2 3 4 1 2 3 4
Estimate 34.57% 36.17% 36.86% 36.90% 39.32% 35.09% 35.44% 34.70% LCL 32.55% 35.26% 35.95% 35.76% 37.26% 34.21% 34.57% 33.62% UCL 36.65% 37.08% 37.77% 38.06% 41.42% 35.99% 36.32% 35.80%
In relation to injury risk calculated using either the DfT or Newstead method and without adjusting
for mass effects, 1 star rated vehicles have statistically significantly lower average injury risk than
higher star rated vehicles. However, no statistically significant differences between other
EuroNCAP star ratings could be detected on the basis of injury risk. Similarly, no statistically
significant differences in real crash performance between vehicles of different star ratings were
identified on the basis of the mass adjusted results.
Table 23. Injury severity estimates and 95% confidence limits across EuroNCAP star rating
categories both with and without mass adjustment.
Injury Severity Ratings
All Crash Types
(with mass adjustment) All Crash Types
(without mass adjustment) Overall Star Rating Overall Star Rating 1 2 3 4 1 2 3 4
Estimate 12.76% 10.82% 11.10% 10.28% 13.09% 10.77% 11.01% 10.15% LCL 11.78% 10.41% 10.68% 9.75% 12.13% 10.36% 10.60% 9.64% UCL 13.82% 11.26% 11.54% 10.84% 14.11% 11.20% 11.44% 10.68%
Considering the mass adjusted analysis for injury severity, 1 star rated vehicles had an average
injury severity significantly worse than higher star rated vehicles. However, 2 star rated vehicles
had an estimated average crashworthiness rating not statistically significantly different to 3 or 4
star rated models.
French Results
Tables 24 to 28 show the comparisons between overall EuroNCAP star rating and average real
injury outcome derived from the French police reported crash data. Presentation is the same as
for the British data comparisons given above.
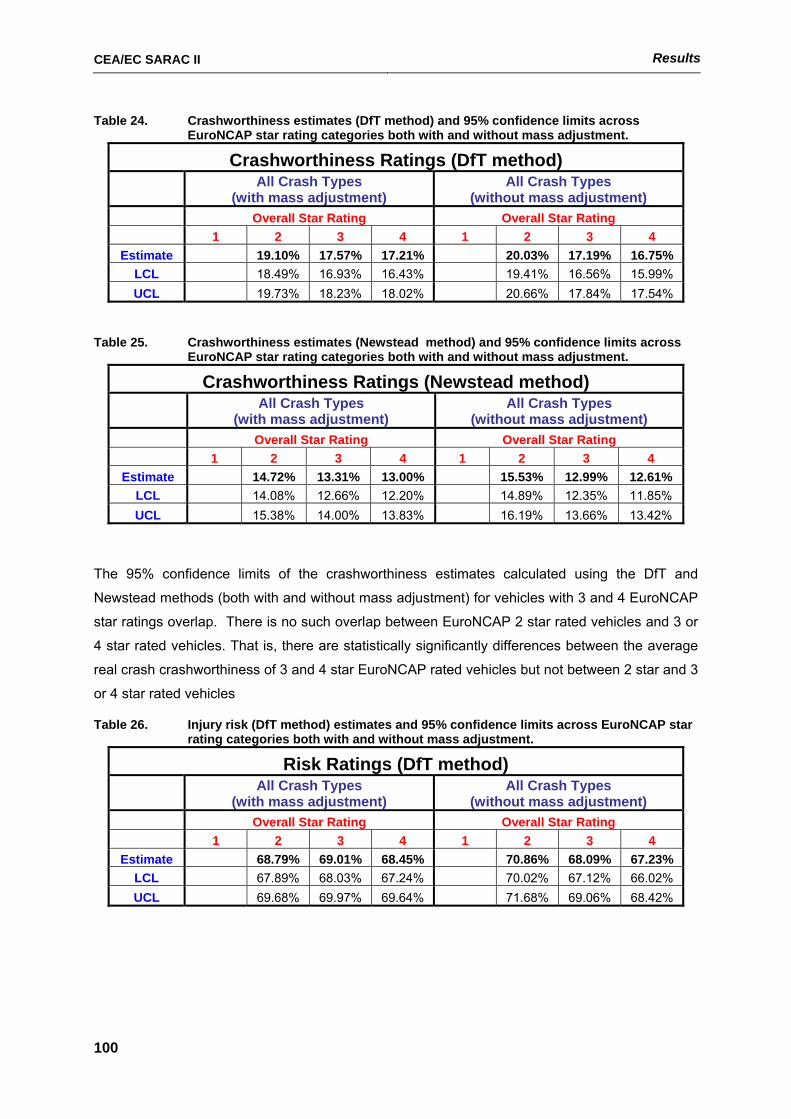
CEA/EC SARAC II Results
100
Table 24. Crashworthiness estimates (DfT method) and 95% confidence limits across EuroNCAP star rating categories both with and without mass adjustment.
Crashworthiness Ratings (DfT method)
All Crash Types
(with mass adjustment) All Crash Types
(without mass adjustment) Overall Star Rating Overall Star Rating 1 2 3 4 1 2 3 4
Estimate 19.10% 17.57% 17.21% 20.03% 17.19% 16.75% LCL 18.49% 16.93% 16.43% 19.41% 16.56% 15.99% UCL 00.00% 19.73% 18.23% 18.02% 00.00% 20.66% 17.84% 17.54%
Table 25. Crashworthiness estimates (Newstead method) and 95% confidence limits across EuroNCAP star rating categories both with and without mass adjustment.
Crashworthiness Ratings (Newstead method)
All Crash Types
(with mass adjustment) All Crash Types
(without mass adjustment) Overall Star Rating Overall Star Rating 1 2 3 4 1 2 3 4
Estimate 14.72% 13.31% 13.00% 15.53% 12.99% 12.61% LCL 14.08% 12.66% 12.20% 14.89% 12.35% 11.85% UCL 0.00% 15.38% 14.00% 13.83% 0.00% 16.19% 13.66% 13.42%
The 95% confidence limits of the crashworthiness estimates calculated using the DfT and
Newstead methods (both with and without mass adjustment) for vehicles with 3 and 4 EuroNCAP
star ratings overlap. There is no such overlap between EuroNCAP 2 star rated vehicles and 3 or
4 star rated vehicles. That is, there are statistically significantly differences between the average
real crash crashworthiness of 3 and 4 star EuroNCAP rated vehicles but not between 2 star and 3
or 4 star rated vehicles
Table 26. Injury risk (DfT method) estimates and 95% confidence limits across EuroNCAP star rating categories both with and without mass adjustment.
Risk Ratings (DfT method)
All Crash Types
(with mass adjustment) All Crash Types
(without mass adjustment) Overall Star Rating Overall Star Rating 1 2 3 4 1 2 3 4
Estimate 68.79% 69.01% 68.45% 70.86% 68.09% 67.23% LCL 67.89% 68.03% 67.24% 70.02% 67.12% 66.02% UCL 00.00% 69.68% 69.97% 69.64% 00.00% 71.68% 69.06% 68.42%
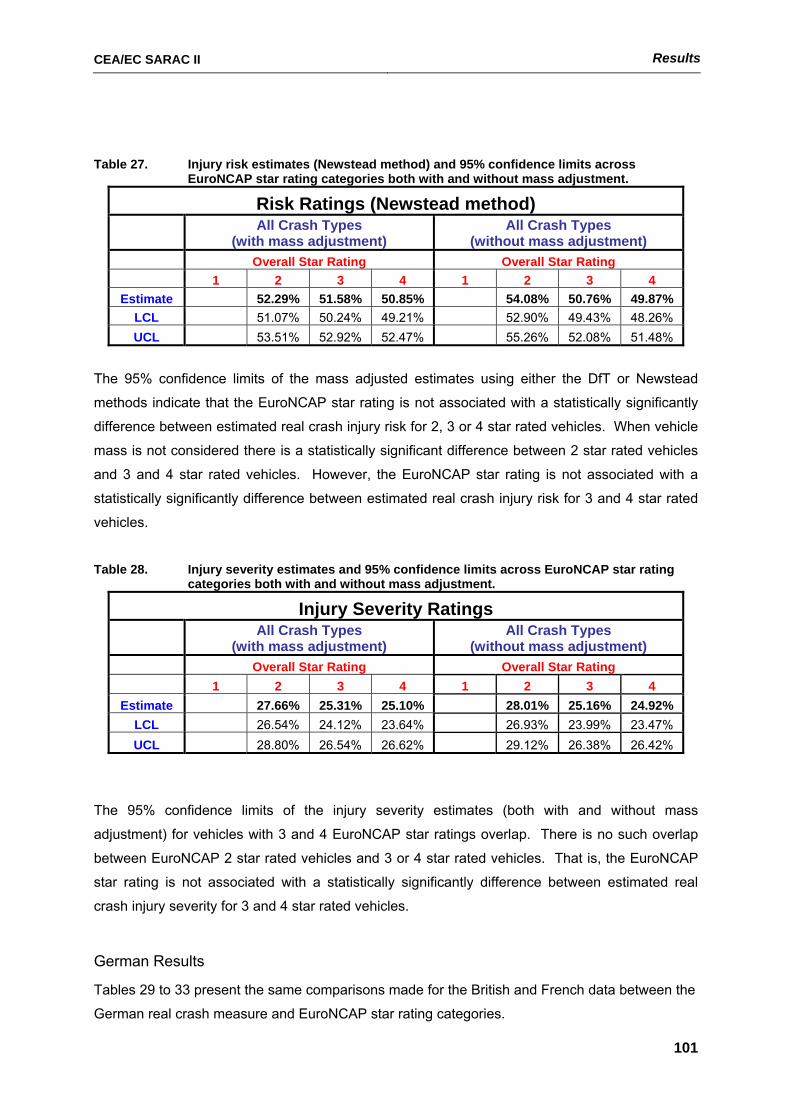
CEA/EC SARAC II Results
101
Table 27. Injury risk estimates (Newstead method) and 95% confidence limits across
EuroNCAP star rating categories both with and without mass adjustment. Risk Ratings (Newstead method)
All Crash Types
(with mass adjustment) All Crash Types
(without mass adjustment) Overall Star Rating Overall Star Rating 1 2 3 4 1 2 3 4
Estimate 52.29% 51.58% 50.85% 54.08% 50.76% 49.87% LCL 51.07% 50.24% 49.21% 52.90% 49.43% 48.26% UCL 00.00% 53.51% 52.92% 52.47% 00.00% 55.26% 52.08% 51.48%
The 95% confidence limits of the mass adjusted estimates using either the DfT or Newstead
methods indicate that the EuroNCAP star rating is not associated with a statistically significantly
difference between estimated real crash injury risk for 2, 3 or 4 star rated vehicles. When vehicle
mass is not considered there is a statistically significant difference between 2 star rated vehicles
and 3 and 4 star rated vehicles. However, the EuroNCAP star rating is not associated with a
statistically significantly difference between estimated real crash injury risk for 3 and 4 star rated
vehicles.
Table 28. Injury severity estimates and 95% confidence limits across EuroNCAP star rating
categories both with and without mass adjustment.
Injury Severity Ratings
All Crash Types
(with mass adjustment) All Crash Types
(without mass adjustment) Overall Star Rating Overall Star Rating 1 2 3 4 1 2 3 4
Estimate 27.66% 25.31% 25.10% 28.01% 25.16% 24.92% LCL 26.54% 24.12% 23.64% 26.93% 23.99% 23.47% UCL 00.00% 28.80% 26.54% 26.62% 00.00% 29.12% 26.38% 26.42%
The 95% confidence limits of the injury severity estimates (both with and without mass
adjustment) for vehicles with 3 and 4 EuroNCAP star ratings overlap. There is no such overlap
between EuroNCAP 2 star rated vehicles and 3 or 4 star rated vehicles. That is, the EuroNCAP
star rating is not associated with a statistically significantly difference between estimated real
crash injury severity for 3 and 4 star rated vehicles.
German Results
Tables 29 to 33 present the same comparisons made for the British and French data between the
German real crash measure and EuroNCAP star rating categories.
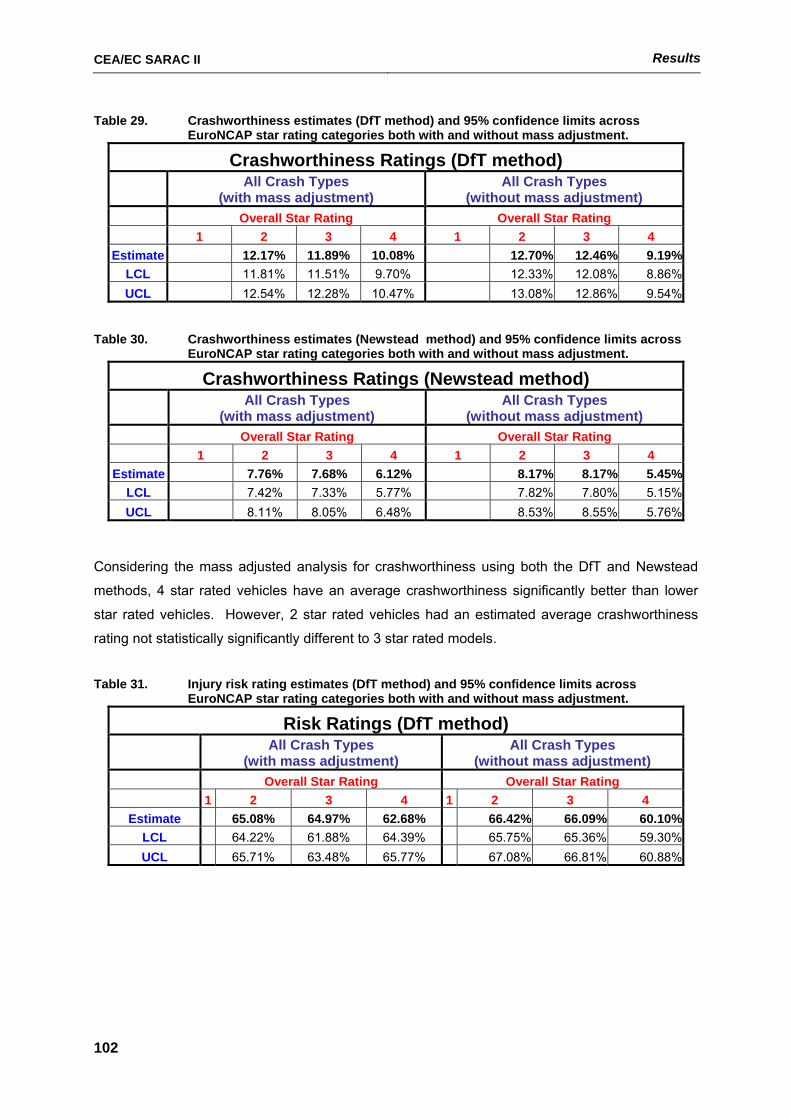
CEA/EC SARAC II Results
102
Table 29. Crashworthiness estimates (DfT method) and 95% confidence limits across EuroNCAP star rating categories both with and without mass adjustment.
Crashworthiness Ratings (DfT method)
All Crash Types
(with mass adjustment) All Crash Types
(without mass adjustment) Overall Star Rating Overall Star Rating 1 2 3 4 1 2 3 4
Estimate 12.17% 11.89% 10.08% 12.70% 12.46% 9.19%LCL 11.81% 11.51% 9.70% 12.33% 12.08% 8.86%UCL 12.54% 12.28% 10.47% 13.08% 12.86% 9.54%
Table 30. Crashworthiness estimates (Newstead method) and 95% confidence limits across
EuroNCAP star rating categories both with and without mass adjustment.
Crashworthiness Ratings (Newstead method)
All Crash Types
(with mass adjustment) All Crash Types
(without mass adjustment) Overall Star Rating Overall Star Rating 1 2 3 4 1 2 3 4
Estimate 7.76% 7.68% 6.12% 8.17% 8.17% 5.45%LCL 7.42% 7.33% 5.77% 7.82% 7.80% 5.15%UCL 8.11% 8.05% 6.48% 8.53% 8.55% 5.76%
Considering the mass adjusted analysis for crashworthiness using both the DfT and Newstead
methods, 4 star rated vehicles have an average crashworthiness significantly better than lower
star rated vehicles. However, 2 star rated vehicles had an estimated average crashworthiness
rating not statistically significantly different to 3 star rated models.
Table 31. Injury risk rating estimates (DfT method) and 95% confidence limits across
EuroNCAP star rating categories both with and without mass adjustment.
Risk Ratings (DfT method)
All Crash Types
(with mass adjustment) All Crash Types
(without mass adjustment) Overall Star Rating Overall Star Rating 1 2 3 4 1 2 3 4
Estimate 65.08% 64.97% 62.68% 66.42% 66.09% 60.10%LCL 64.22% 61.88% 64.39% 65.75% 65.36% 59.30%UCL 65.71% 63.48% 65.77% 67.08% 66.81% 60.88%
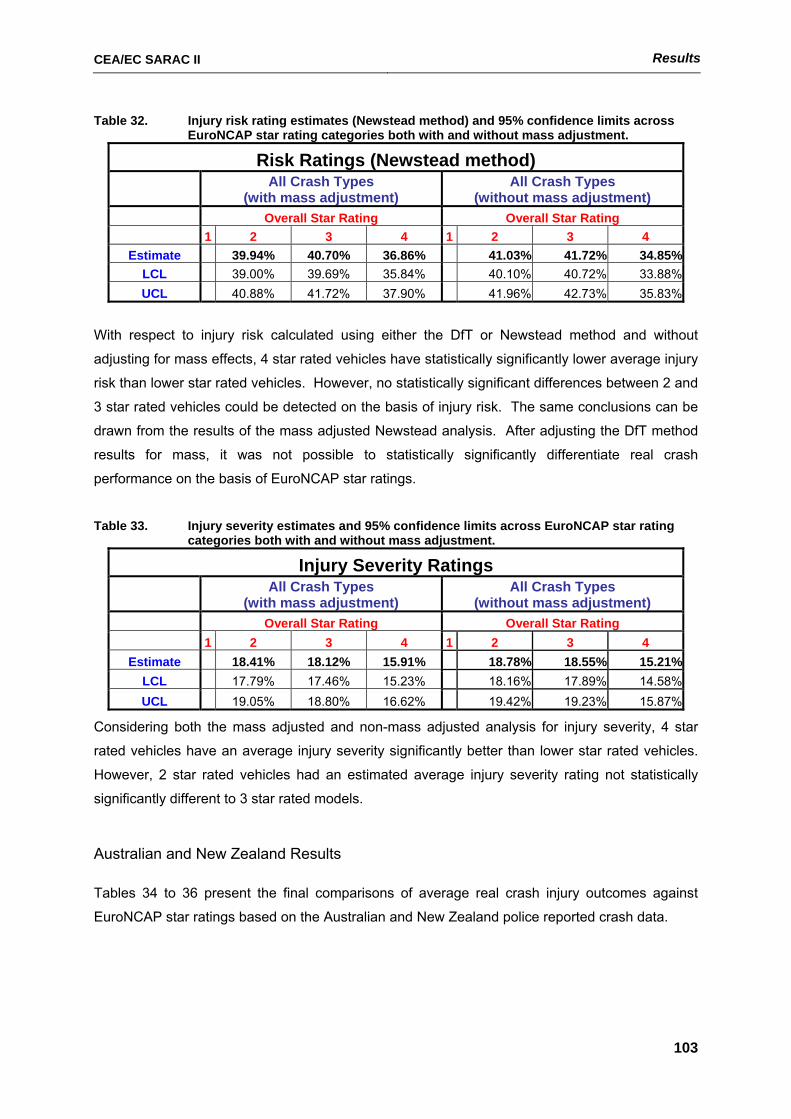
CEA/EC SARAC II Results
103
Table 32. Injury risk rating estimates (Newstead method) and 95% confidence limits across EuroNCAP star rating categories both with and without mass adjustment.
Risk Ratings (Newstead method)
All Crash Types
(with mass adjustment) All Crash Types
(without mass adjustment) Overall Star Rating Overall Star Rating 1 2 3 4 1 2 3 4
Estimate 39.94% 40.70% 36.86% 41.03% 41.72% 34.85%LCL 39.00% 39.69% 35.84% 40.10% 40.72% 33.88%UCL 40.88% 41.72% 37.90% 41.96% 42.73% 35.83%
With respect to injury risk calculated using either the DfT or Newstead method and without
adjusting for mass effects, 4 star rated vehicles have statistically significantly lower average injury
risk than lower star rated vehicles. However, no statistically significant differences between 2 and
3 star rated vehicles could be detected on the basis of injury risk. The same conclusions can be
drawn from the results of the mass adjusted Newstead analysis. After adjusting the DfT method
results for mass, it was not possible to statistically significantly differentiate real crash
performance on the basis of EuroNCAP star ratings.
Table 33. Injury severity estimates and 95% confidence limits across EuroNCAP star rating
categories both with and without mass adjustment.
Injury Severity Ratings
All Crash Types
(with mass adjustment) All Crash Types
(without mass adjustment) Overall Star Rating Overall Star Rating 1 2 3 4 1 2 3 4
Estimate 18.41% 18.12% 15.91% 18.78% 18.55% 15.21%LCL 17.79% 17.46% 15.23% 18.16% 17.89% 14.58%UCL 19.05% 18.80% 16.62% 19.42% 19.23% 15.87%
Considering both the mass adjusted and non-mass adjusted analysis for injury severity, 4 star
rated vehicles have an average injury severity significantly better than lower star rated vehicles.
However, 2 star rated vehicles had an estimated average injury severity rating not statistically
significantly different to 3 star rated models.
Australian and New Zealand Results
Tables 34 to 36 present the final comparisons of average real crash injury outcomes against
EuroNCAP star ratings based on the Australian and New Zealand police reported crash data.
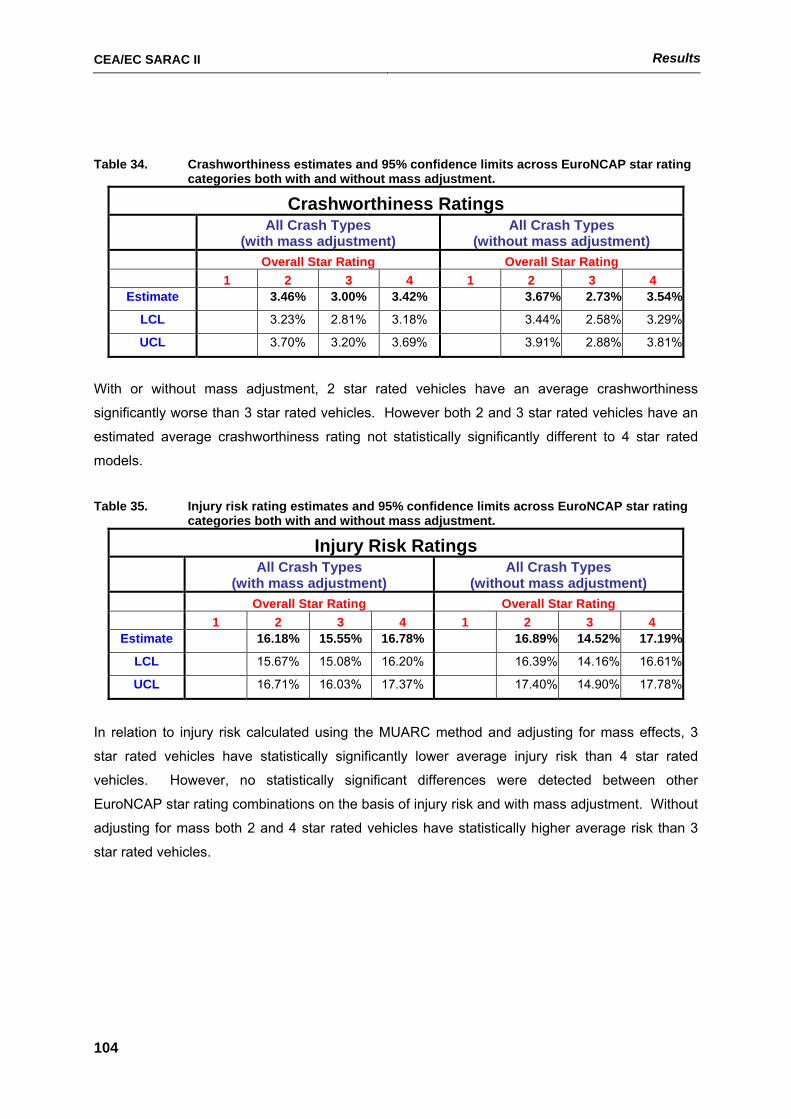
CEA/EC SARAC II Results
104
Table 34. Crashworthiness estimates and 95% confidence limits across EuroNCAP star rating
categories both with and without mass adjustment.
Crashworthiness Ratings
All Crash Types
(with mass adjustment) All Crash Types
(without mass adjustment) Overall Star Rating Overall Star Rating 1 2 3 4 1 2 3 4
Estimate 3.46% 3.00% 3.42% 3.67% 2.73% 3.54%
LCL 3.23% 2.81% 3.18% 3.44% 2.58% 3.29%
UCL 0.00% 3.70% 3.20% 3.69% 0.00% 3.91% 2.88% 3.81%
With or without mass adjustment, 2 star rated vehicles have an average crashworthiness
significantly worse than 3 star rated vehicles. However both 2 and 3 star rated vehicles have an
estimated average crashworthiness rating not statistically significantly different to 4 star rated
models.
Table 35. Injury risk rating estimates and 95% confidence limits across EuroNCAP star rating
categories both with and without mass adjustment.
Injury Risk Ratings
All Crash Types
(with mass adjustment) All Crash Types
(without mass adjustment) Overall Star Rating Overall Star Rating 1 2 3 4 1 2 3 4
Estimate 16.18% 15.55% 16.78% 16.89% 14.52% 17.19%
LCL 15.67% 15.08% 16.20% 16.39% 14.16% 16.61%
UCL 00.00% 16.71% 16.03% 17.37% 00.00% 17.40% 14.90% 17.78%
In relation to injury risk calculated using the MUARC method and adjusting for mass effects, 3
star rated vehicles have statistically significantly lower average injury risk than 4 star rated
vehicles. However, no statistically significant differences were detected between other
EuroNCAP star rating combinations on the basis of injury risk and with mass adjustment. Without
adjusting for mass both 2 and 4 star rated vehicles have statistically higher average risk than 3
star rated vehicles.
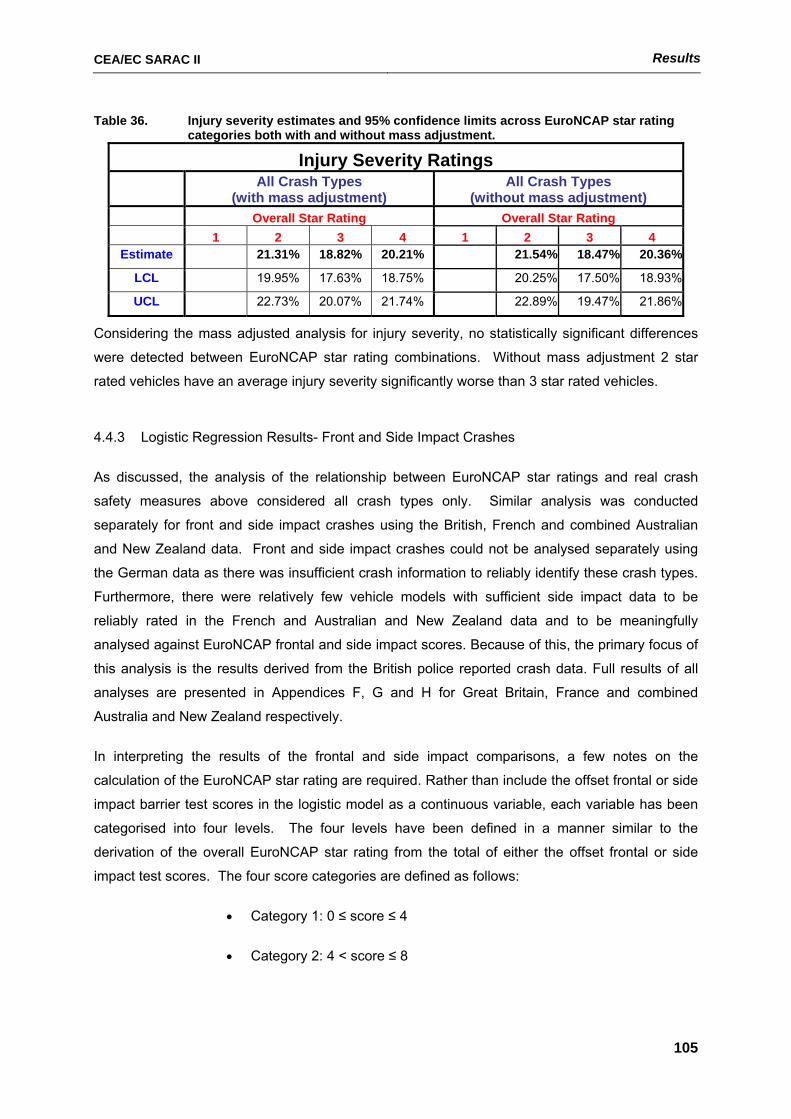
CEA/EC SARAC II Results
105
Table 36. Injury severity estimates and 95% confidence limits across EuroNCAP star rating categories both with and without mass adjustment.
Injury Severity Ratings
All Crash Types
(with mass adjustment) All Crash Types
(without mass adjustment) Overall Star Rating Overall Star Rating 1 2 3 4 1 2 3 4
Estimate 21.31% 18.82% 20.21% 21.54% 18.47% 20.36%
LCL 19.95% 17.63% 18.75% 20.25% 17.50% 18.93%
UCL 00.00% 22.73% 20.07% 21.74% 00.00% 22.89% 19.47% 21.86%
Considering the mass adjusted analysis for injury severity, no statistically significant differences
were detected between EuroNCAP star rating combinations. Without mass adjustment 2 star
rated vehicles have an average injury severity significantly worse than 3 star rated vehicles.
4.4.3 Logistic Regression Results- Front and Side Impact Crashes
As discussed, the analysis of the relationship between EuroNCAP star ratings and real crash
safety measures above considered all crash types only. Similar analysis was conducted
separately for front and side impact crashes using the British, French and combined Australian
and New Zealand data. Front and side impact crashes could not be analysed separately using
the German data as there was insufficient crash information to reliably identify these crash types.
Furthermore, there were relatively few vehicle models with sufficient side impact data to be
reliably rated in the French and Australian and New Zealand data and to be meaningfully
analysed against EuroNCAP frontal and side impact scores. Because of this, the primary focus of
this analysis is the results derived from the British police reported crash data. Full results of all
analyses are presented in Appendices F, G and H for Great Britain, France and combined
Australia and New Zealand respectively.
In interpreting the results of the frontal and side impact comparisons, a few notes on the
calculation of the EuroNCAP star rating are required. Rather than include the offset frontal or side
impact barrier test scores in the logistic model as a continuous variable, each variable has been
categorised into four levels. The four levels have been defined in a manner similar to the
derivation of the overall EuroNCAP star rating from the total of either the offset frontal or side
impact test scores. The four score categories are defined as follows:
• Category 1: 0 ≤ score ≤ 4
• Category 2: 4 < score ≤ 8
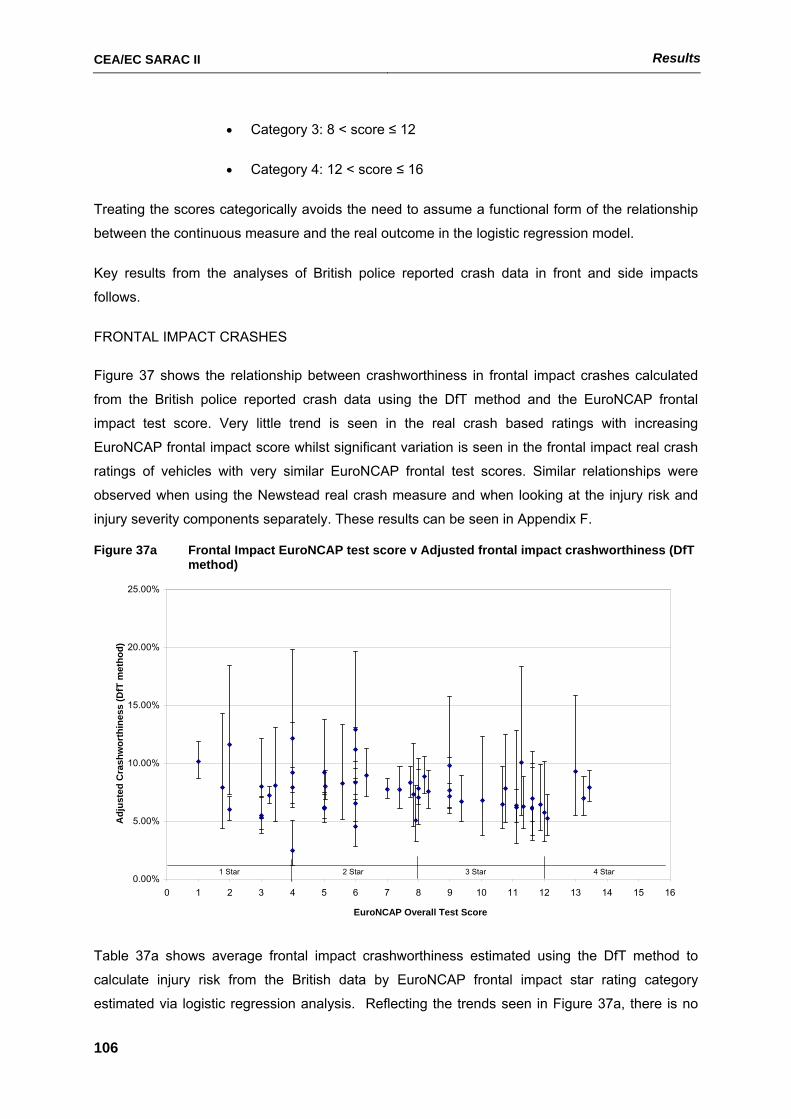
CEA/EC SARAC II Results
106
• Category 3: 8 < score ≤ 12
• Category 4: 12 < score ≤ 16
Treating the scores categorically avoids the need to assume a functional form of the relationship
between the continuous measure and the real outcome in the logistic regression model.
Key results from the analyses of British police reported crash data in front and side impacts
follows.
FRONTAL IMPACT CRASHES
Figure 37 shows the relationship between crashworthiness in frontal impact crashes calculated
from the British police reported crash data using the DfT method and the EuroNCAP frontal
impact test score. Very little trend is seen in the real crash based ratings with increasing
EuroNCAP frontal impact score whilst significant variation is seen in the frontal impact real crash
ratings of vehicles with very similar EuroNCAP frontal test scores. Similar relationships were
observed when using the Newstead real crash measure and when looking at the injury risk and
injury severity components separately. These results can be seen in Appendix F.
Figure 37a Frontal Impact EuroNCAP test score v Adjusted frontal impact crashworthiness (DfT method)
0.00%
5.00%
10.00%
15.00%
20.00%
25.00%
0 1 2 3 4 5 6 7 8 9 10 11 12 13 14 15 16
EuroNCAP Overall Test Score
Adj
uste
d C
rash
wor
thin
ess
(DfT
met
hod)
1 Star 2 Star 3 Star 4 Star
Table 37a shows average frontal impact crashworthiness estimated using the DfT method to
calculate injury risk from the British data by EuroNCAP frontal impact star rating category
estimated via logistic regression analysis. Reflecting the trends seen in Figure 37a, there is no
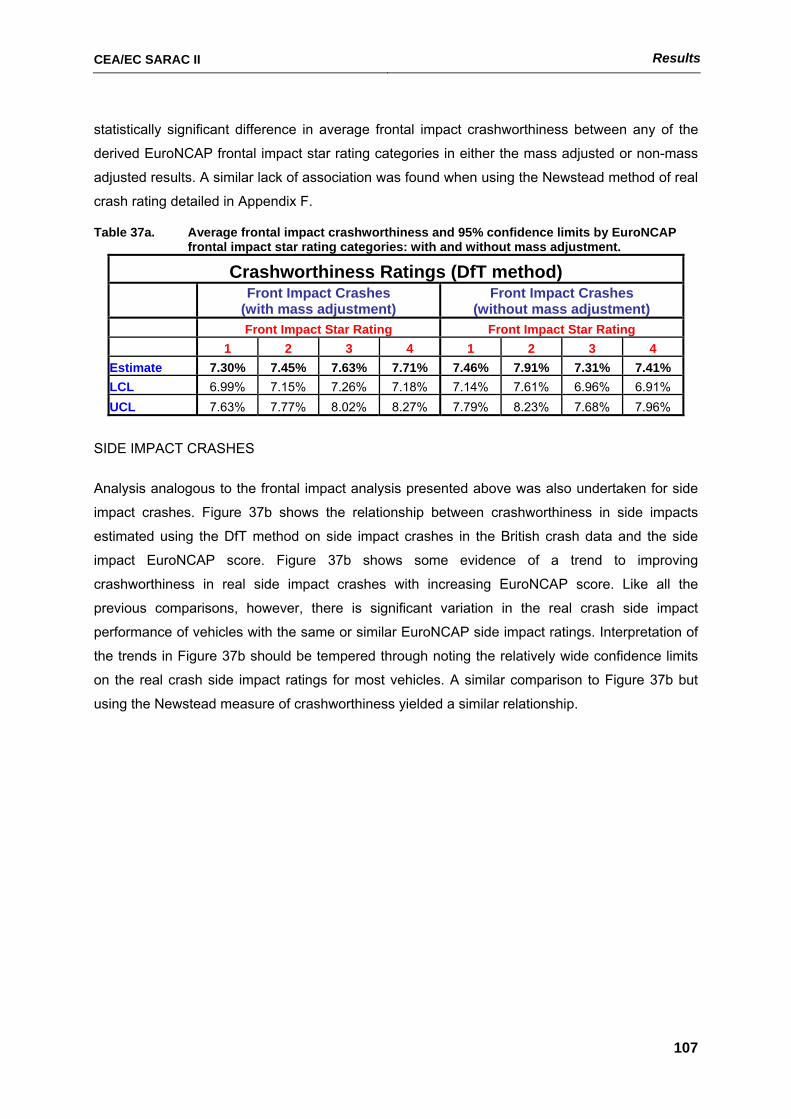
CEA/EC SARAC II Results
107
statistically significant difference in average frontal impact crashworthiness between any of the
derived EuroNCAP frontal impact star rating categories in either the mass adjusted or non-mass
adjusted results. A similar lack of association was found when using the Newstead method of real
crash rating detailed in Appendix F.
Table 37a. Average frontal impact crashworthiness and 95% confidence limits by EuroNCAP frontal impact star rating categories: with and without mass adjustment.
Crashworthiness Ratings (DfT method)
Front Impact Crashes
(with mass adjustment) Front Impact Crashes
(without mass adjustment) Front Impact Star Rating Front Impact Star Rating 1 2 3 4 1 2 3 4 Estimate 7.30% 7.45% 7.63% 7.71% 7.46% 7.91% 7.31% 7.41% LCL 6.99% 7.15% 7.26% 7.18% 7.14% 7.61% 6.96% 6.91% UCL 7.63% 7.77% 8.02% 8.27% 7.79% 8.23% 7.68% 7.96%
SIDE IMPACT CRASHES
Analysis analogous to the frontal impact analysis presented above was also undertaken for side
impact crashes. Figure 37b shows the relationship between crashworthiness in side impacts
estimated using the DfT method on side impact crashes in the British crash data and the side
impact EuroNCAP score. Figure 37b shows some evidence of a trend to improving
crashworthiness in real side impact crashes with increasing EuroNCAP score. Like all the
previous comparisons, however, there is significant variation in the real crash side impact
performance of vehicles with the same or similar EuroNCAP side impact ratings. Interpretation of
the trends in Figure 37b should be tempered through noting the relatively wide confidence limits
on the real crash side impact ratings for most vehicles. A similar comparison to Figure 37b but
using the Newstead measure of crashworthiness yielded a similar relationship.
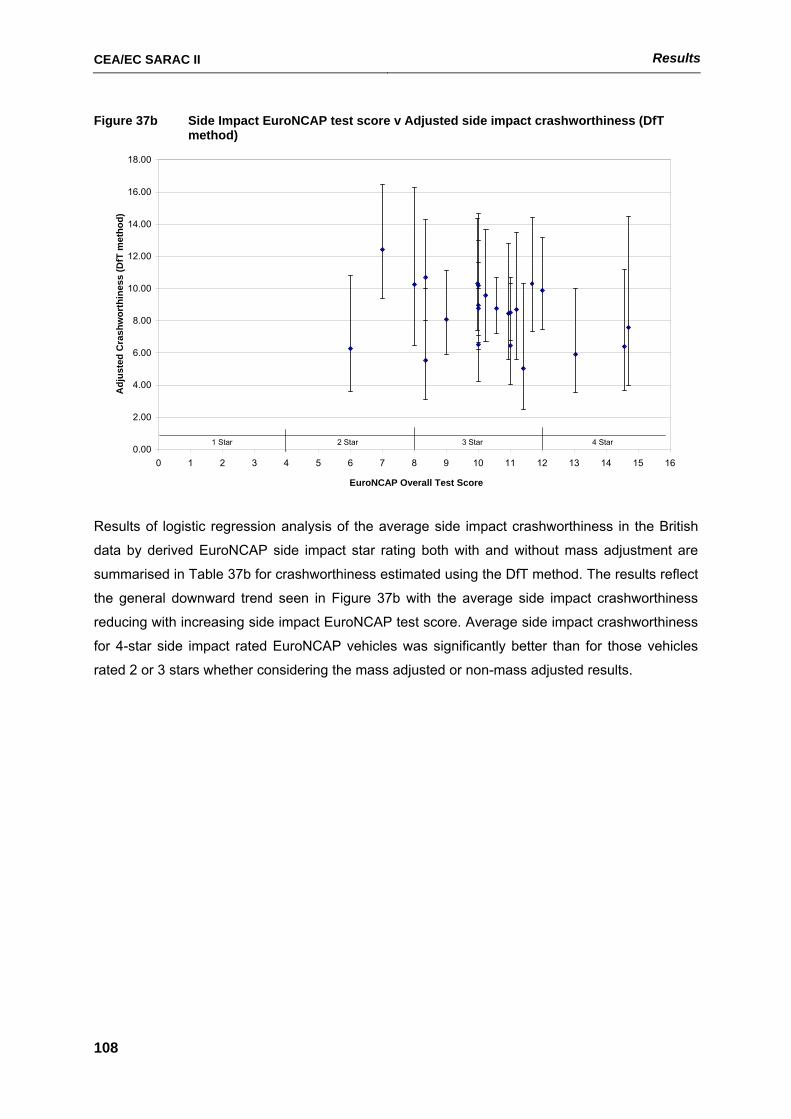
CEA/EC SARAC II Results
108
Figure 37b Side Impact EuroNCAP test score v Adjusted side impact crashworthiness (DfT method)
0.00
2.00
4.00
6.00
8.00
10.00
12.00
14.00
16.00
18.00
0 1 2 3 4 5 6 7 8 9 10 11 12 13 14 15 16
EuroNCAP Overall Test Score
Adj
uste
d C
rash
wor
thin
ess
(DfT
met
hod)
1 Star 2 Star 3 Star 4 Star
Results of logistic regression analysis of the average side impact crashworthiness in the British
data by derived EuroNCAP side impact star rating both with and without mass adjustment are
summarised in Table 37b for crashworthiness estimated using the DfT method. The results reflect
the general downward trend seen in Figure 37b with the average side impact crashworthiness
reducing with increasing side impact EuroNCAP test score. Average side impact crashworthiness
for 4-star side impact rated EuroNCAP vehicles was significantly better than for those vehicles
rated 2 or 3 stars whether considering the mass adjusted or non-mass adjusted results.
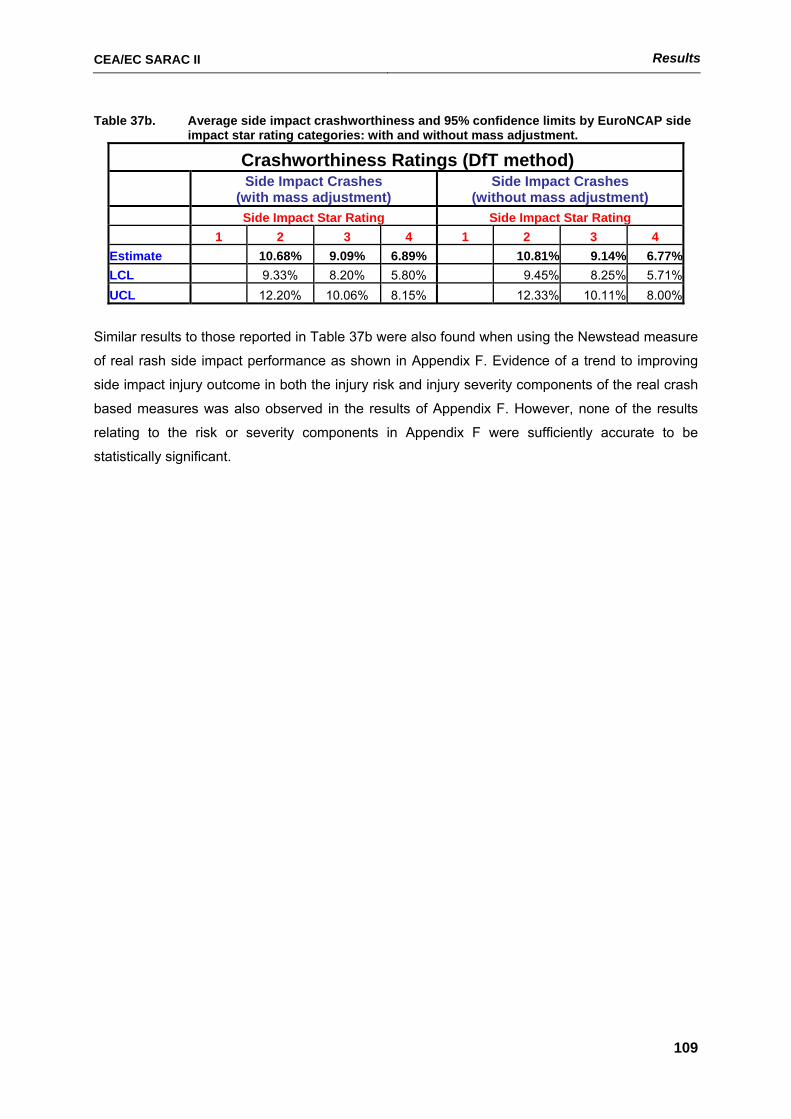
CEA/EC SARAC II Results
109
Table 37b. Average side impact crashworthiness and 95% confidence limits by EuroNCAP side impact star rating categories: with and without mass adjustment.
Crashworthiness Ratings (DfT method)
Side Impact Crashes
(with mass adjustment) Side Impact Crashes
(without mass adjustment) Side Impact Star Rating Side Impact Star Rating 1 2 3 4 1 2 3 4 Estimate 10.68% 9.09% 6.89% 10.81% 9.14% 6.77%LCL 9.33% 8.20% 5.80% 9.45% 8.25% 5.71%UCL 0.00% 12.20% 10.06% 8.15% 0.00% 12.33% 10.11% 8.00%
Similar results to those reported in Table 37b were also found when using the Newstead measure
of real rash side impact performance as shown in Appendix F. Evidence of a trend to improving
side impact injury outcome in both the injury risk and injury severity components of the real crash
based measures was also observed in the results of Appendix F. However, none of the results
relating to the risk or severity components in Appendix F were sufficiently accurate to be
statistically significant.
CEA/EC SARAC II Discussion
110
5 Discussion Analysis in this report has focused on comparing vehicle passive safety ratings computed from
analysis of driver injury outcomes in crashes reported to police with those generated from the
results of crash barrier testing under the EuroNCAP program. Reflecting the injury outcome
scales used in police reported crash data, the nominal injury outcome measure calculated from
this data has been the risk of driver death or serious injury given involvement in a reported crash.
The measure is a product of two probabilities, the first being the risk of sustaining an injury of any
level in a crash and the second being the risk of death or serious injury given some injury is
sustained. Two methods for calculating the ratings based on police crash reports have been
used. The first is a method used for many years by the British Department for Transport to rate
relative vehicle secondary safety whilst the second is a new method proposed as part of the
SARAC I research to overcome inherent biases identified in the existing methods.
Police reported crash data from five different jurisdictions has been analysed for this project,
these being Great Britain, France, Germany, Finland and Australia and New Zealand combined.
Due to fundamental differences identified between data from each of the jurisdictions, parallel
rather than combined analysis of the data has been undertaken. For each jurisdiction, a set of
vehicle safety ratings has been calculated from the available police data and compared
independently to the EuroNCAP score for vehicles rated under each system. The hope in making
parallel comparisons in this way was that consistency would be observed in the relationships
measured in each jurisdiction leading to a robust conclusion about the relationship between injury
outcomes in police reported crashes and the ratings produced under the EuroNCAP program.
Comparison of the EuroNCAP scores and police data derived rating systems has been
undertaken on a number of levels. In considering ratings based on real crashes, not only the
crashworthiness rating, measuring the risk of serious injury or death given involvement in an
injury crash, has been calculated but also the component injury risk and injury severity measures
that multiply to give the crashworthiness rating. Similarly, not only the overall EuroNCAP barrier
test rating has been considered. The results of the offset frontal and side impact tests have been
individually compared with crash types of similar configuration in the police data. The role of
vehicle mass in determining the level of association between the two ratings systems has also
been investigated.
Data from five jurisdictions, rated using two different analysis techniques each incorporating three
numerical measures both unadjusted and adjusted for the effects of vehicle mass equates to a
large number of results from the study to interpret. The diversity of results presented in this report
CEA/EC SARAC II Discussion
111
requires a level of distilling and interpretation before conclusions can be drawn. The following
section attempts to distil the most relevant and representative of the results presented.
Subsequent sections of the discussion attempt to draw common conclusions from the key results
chosen and to discuss the implications of these results in practice.
5.1 Selection of the Most Relevant and Representative Analysis Results
In order to make the task of interpreting the analysis results from this study more manageable,
consideration has been given to which of the large number of analysis results is most relevant to
the aims of the study and representative of the true relationship between EuroNCAP test scores
and injury outcomes in police crash reports. Of specific interest has been to examine the results
by country, the different analysis methods used and the role of adjustment for vehicle mass in the
comparisons.
5.1.1 Results by Country
As will be discussed later, there are some general consistencies in the measured associations
between the police crash based ratings and EuroNCAP scores across the five data sets
analysed. However, the level of consistency between results from the different data sets analysed
is not as high as hoped, leading to potentially different conclusions from the study depending on
which countries analysis results are the focus of interpretation. There are a number of reasons for
the observed inconsistencies.
The data sources used and the final data sets analysed differ in a number of practically significant
ways. One of the fundamental differences between data sets is in the injury outcome scales
defined. In general, four levels of injury outcome are defined in or can be defined from the data
from each county falling under the broad descriptors fatal injury, serious injury, minor or slight
injury and not injured. Superficially, the definitions appear roughly consistent, however
examination of the precise definitions within each country reveal some important differences. For
example, in Australia and the Britain, a fatality is recorded for death within 30 days of a crash
compared to France where fatalities only include deaths within 7 days of the crash. In Australia a
serious injury is defined by hospitalisation whereas in Britain it also includes other non-
hospitalised major injury whilst in France it includes only those hospitalised for more than 6 days.
In both the German and Finnish police crash data, the exact definitions of each injury severity
level were not well articulated so it is unclear how they relate to the other countries.
A further means of checking the comparability between injury outcome levels was to assess the
proportion of injured drivers in each category as presented in Table 4. The French data records a
much large proportion of drivers as either fatally or seriously injured than does the British or
German data which are both relatively similar. The French data also reports higher levels of slight
CEA/EC SARAC II Discussion
112
injuries and lower levels of non-injured compared to Britain or Germany whilst Germany reports a
much higher proportion of uninjured drivers. Differences in these proportions reflect both the
differences in injury severity level definitions as well as possible differences in crash reporting
biases related to injury severity. For example, Germany may report more minor crashes than
France. To a certain extent, they may also represent different driving environments between the
countries.
Differences in injury severity scales and crash reporting biases between countries were the
primary reasons for pursuing parallel rather than combined analysis of the police crash data from
each country. The differences in definition of injury outcome between countries results in a
difference in the interpretation of the meaning of the ratings measure. In France, the
crashworthiness measure is the relative risk of death within 7 days of the crash or hospitalisation
for more than 6 days given involvement in a reported crash. In contrast, the crashworthiness
measure in Britain measures the risk of death within 30 days of the crash, hospitalisation or other
serious outcomes given crash involvement.
Not being able to pool data across countries for analysis reduces the amount of total data
available for any particular analysis and most likely limits the range of vehicle models with
sufficient data for assessment. One positive, however, is that it allows relative comparison of the
level of association between the different interpretations of the crashworthiness measures
resulting from the data set differences and the EuroNCAP measures. Higher levels of association
between EuroNCAP and a particular crashworthiness measure may give some insight into the
aspect of real crash outcome reflected by EuroNCAP testing.
Sub-task 2.2 of SARAC I (Newstead et al, 2001), which laid the foundation for the work presented
in this study, reported less accurate identification of vehicle makes and models in the French
database compared to the British database. Subsequently, less weight was given to the results
based on the French data. Discrimination in this way has not been necessary in this study
because the French data supplied had much more accurate vehicle make and model information
than previously. Identification of vehicle makes and model details was equally as accurate in each
of the data sets considered.
Given there is no clear preference for analysis results from any particular country based on injury
severity definition or accuracy of vehicle model details, the next most relevant assessment factor
was database size and the range of vehicle models with sufficient data for analysis. Analysis
results based on the greatest data quantities and covering the greatest range of vehicle models
are most likely to give the most representative measured relationships with EuroNCAP scores.
On this basis, results from the three largest European databases, Britain, France and Germany,
are preferred. Quantities of data from Finland and the range of vehicles covered were too small to
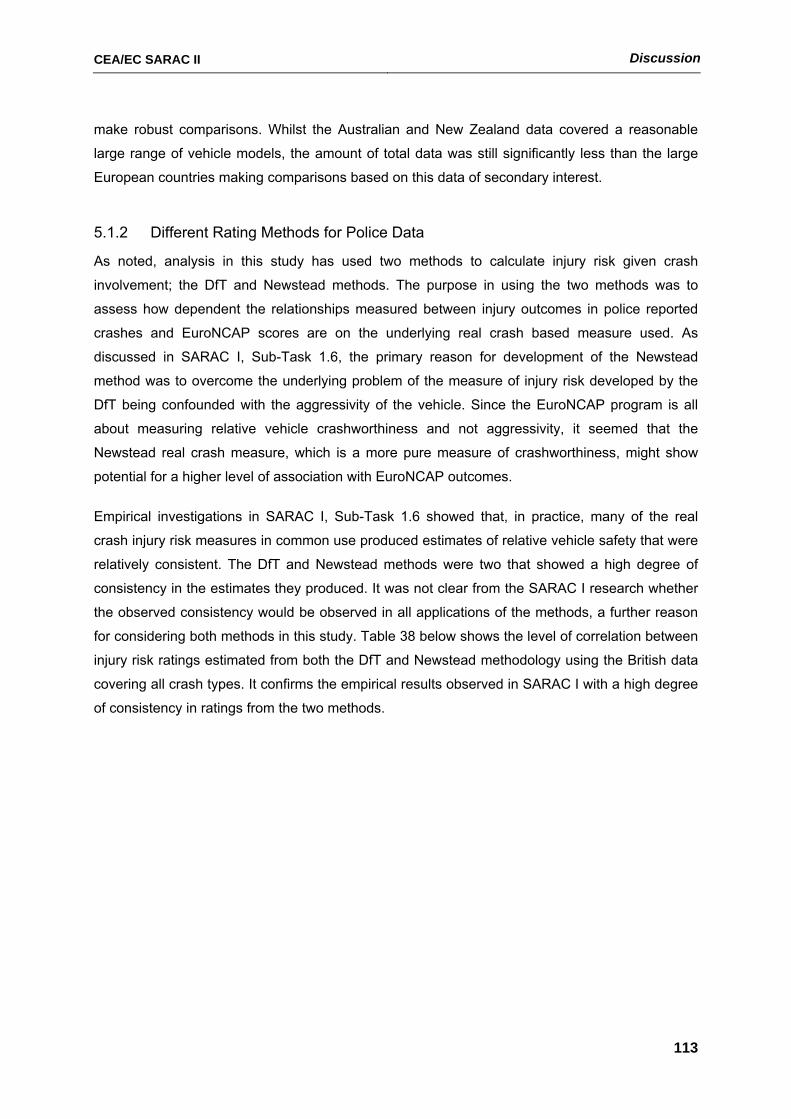
CEA/EC SARAC II Discussion
113
make robust comparisons. Whilst the Australian and New Zealand data covered a reasonable
large range of vehicle models, the amount of total data was still significantly less than the large
European countries making comparisons based on this data of secondary interest.
5.1.2 Different Rating Methods for Police Data
As noted, analysis in this study has used two methods to calculate injury risk given crash
involvement; the DfT and Newstead methods. The purpose in using the two methods was to
assess how dependent the relationships measured between injury outcomes in police reported
crashes and EuroNCAP scores are on the underlying real crash based measure used. As
discussed in SARAC I, Sub-Task 1.6, the primary reason for development of the Newstead
method was to overcome the underlying problem of the measure of injury risk developed by the
DfT being confounded with the aggressivity of the vehicle. Since the EuroNCAP program is all
about measuring relative vehicle crashworthiness and not aggressivity, it seemed that the
Newstead real crash measure, which is a more pure measure of crashworthiness, might show
potential for a higher level of association with EuroNCAP outcomes.
Empirical investigations in SARAC I, Sub-Task 1.6 showed that, in practice, many of the real
crash injury risk measures in common use produced estimates of relative vehicle safety that were
relatively consistent. The DfT and Newstead methods were two that showed a high degree of
consistency in the estimates they produced. It was not clear from the SARAC I research whether
the observed consistency would be observed in all applications of the methods, a further reason
for considering both methods in this study. Table 38 below shows the level of correlation between
injury risk ratings estimated from both the DfT and Newstead methodology using the British data
covering all crash types. It confirms the empirical results observed in SARAC I with a high degree
of consistency in ratings from the two methods.
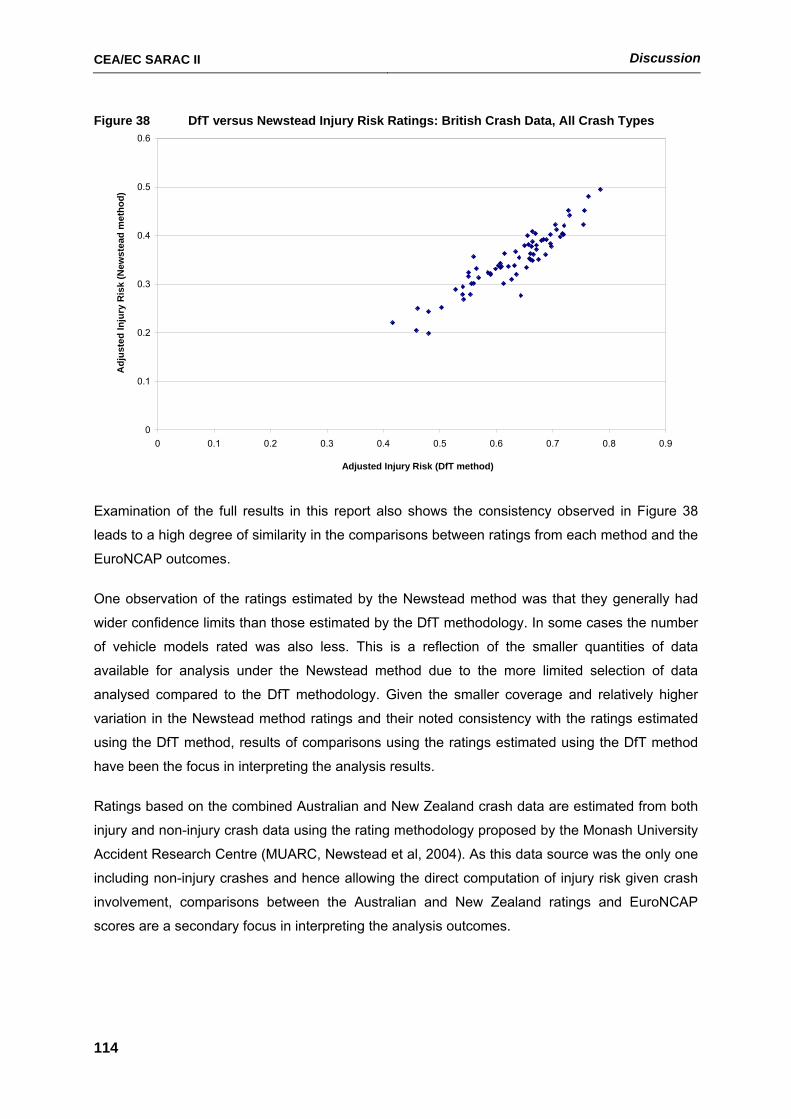
CEA/EC SARAC II Discussion
114
Figure 38 DfT versus Newstead Injury Risk Ratings: British Crash Data, All Crash Types
0
0.1
0.2
0.3
0.4
0.5
0.6
0 0.1 0.2 0.3 0.4 0.5 0.6 0.7 0.8 0.9
Adjusted Injury Risk (DfT method)
Adj
uste
d In
jury
Ris
k (N
ewst
ead
met
hod)
Examination of the full results in this report also shows the consistency observed in Figure 38
leads to a high degree of similarity in the comparisons between ratings from each method and the
EuroNCAP outcomes.
One observation of the ratings estimated by the Newstead method was that they generally had
wider confidence limits than those estimated by the DfT methodology. In some cases the number
of vehicle models rated was also less. This is a reflection of the smaller quantities of data
available for analysis under the Newstead method due to the more limited selection of data
analysed compared to the DfT methodology. Given the smaller coverage and relatively higher
variation in the Newstead method ratings and their noted consistency with the ratings estimated
using the DfT method, results of comparisons using the ratings estimated using the DfT method
have been the focus in interpreting the analysis results.
Ratings based on the combined Australian and New Zealand crash data are estimated from both
injury and non-injury crash data using the rating methodology proposed by the Monash University
Accident Research Centre (MUARC, Newstead et al, 2004). As this data source was the only one
including non-injury crashes and hence allowing the direct computation of injury risk given crash
involvement, comparisons between the Australian and New Zealand ratings and EuroNCAP
scores are a secondary focus in interpreting the analysis outcomes.
CEA/EC SARAC II Discussion
115
5.1.3 The Role of Vehicle Mass
The role of vehicle mass in influencing injury outcome in real crashes has been noted in a number
of previous studies (for example, Langwieder and Bulmer, 1994; Viano, 1994). The relationship
between vehicle mass and injury outcome in the crashworthiness measures used in this study
have also been highlighted in Section 4.4.1 for both the injury risk and, to a lesser degree, injury
severity measures as well as the resulting crashworthiness measure.
It is commonly accepted that the results of EuroNCAP style offset frontal impact tests into rigid
barriers are independent of vehicle mass. The mass independence is a reflection of the
essentially infinite mass ratio of the crash barrier compared to the mass of the vehicle being
tested. The relationship between vehicle mass and the side impact EuroNCAP test outcome is
less clear since the side impact barrier at 950kg is comparable in weight to the vehicles being
tested. Given the finite weight of the mobile side impact barrier, momentum transfer laws suggest
that heavier vehicles may have an advantage in the EuroNCAP side impact test through
absorbing a lower proportion of the total crash energy.
These considerations suggest mass adjusted real crash ratings are the most appropriate to
compare to EuroNCAP offset frontal test scores whilst ratings without mass correction are the
most appropriate to compare to the EuroNCAP side impact test results. In comparisons made
with overall EuroNCAP scores, mass adjusted ratings are the focus for interpretation reflecting
the only partial dependency of the EuroNCAP score on vehicle mass through the side impact test
component of the score.
5.1.4 Summary of Results for Interpretation
The above considerations point to the sub-set of results presented that will likely be most
representative of the relationship between driver injury outcomes in police reported crashes and
the results of EuroNCAP testing. They are:
• Results from those countries with the greatest quantities of police reported data and
hence the greatest coverage of EuroNCAP tested cars with sufficient data for meaningful
analysis will be most relevant for drawing conclusions from the study. This includes the
analysis conducted on British, German and French data with the Australian and New
Zealand data results being used as a secondary comparison.
• Results based on ratings calculated from police reported data using the DfT method of
rating estimation.
CEA/EC SARAC II Discussion
116
• Comparison of the overall and offset frontal EuroNCAP scores and real crash measures
with the effects of vehicle mass removed and side impact EuroNCAP scores and real
crash measures including the effects of vehicle mass.
5.2 Summary of Key Analysis Outcomes: Consistencies, Discrepancies and Robustness
Focusing on the key results identified above, a number of general observations about the
relationship between EuroNCAP test results and injury outcomes in police reported crashes can
be drawn. Reflecting the structure and aims of the study, interpretation of the results of
comparisons between the overall EuroNCAP test score and ratings based on police reported
crashes of all types have been considered first. Following this is an interpretation of the results of
comparing the EuroNCAP component test scores with real crash ratings based on similar crash
configurations.
5.2.1 Overall EuroNCAP and Real Crash Ratings from All Crash Types
Table 19 of the Results section shows the relationship between mass adjusted average
crashworthiness ratings estimated from the British police reported crash data by overall
EuroNCAP star rating. Tables 24 and 29 show the analogous results based on the French and
German crash data. Both the French and German results show consistent trends of improving
crashworthiness with increasing EuroNCAP star rating across the 2, 3 and 4 star rated cars
available for comparison. The statistical significance of the observed trends in these countries is
slightly different as demonstrated by comparison of the overlap in 95% confidence intervals on
the estimated average crashworthiness. In the French results, the average crashworthiness of 3
and 4 star rated cars are both statistically significantly lower than that of 2 star rated cars but are
not statistically significantly different from each other. In the German data the average
crashworthiness for the 4 star rated cars is significantly better than that for both the 2 and 3-star
rated cars which are not significantly different from each other.
The British data results cover vehicles rated in each of the four star ratings categories although
only one vehicle model in the analysis rated 1 star so this result should be treated with some
caution. The British results show the average crashworthiness of the 2, 3 and 4 star rated
vehicles is significantly better than the one star rated vehicle with four star vehicles having the
best average crashworthiness. However, no significant difference or clear trend in the average
crashworthiness of 2 and 3 star rated cars was seen in the British data.
Examination of the relationship between the average injury risk and injury severity components of
the crashworthiness rating by overall EuroNCAP star rating reveals differences in the
relationships observed for the two components. In analysis of each of the major European crash
CEA/EC SARAC II Discussion
117
data sets there was essentially no association between average injury risk and overall EuroNCAP
star rating. In contrast, the relationships observed between average injury severity and overall
star rating were very similar to the relationships observed for the overall crashworthiness rating.
This result points to the association observed between the crashworthiness ratings and overall
star ratings being driven by the relationship between EuroNCAP score and average driver injury
severity in Police reported crashes.
Results of analysis of the European data sources in total seem to generally support some
common conclusions when examining average real crash outcome by EuroNCAP star rating.
Results from each country point to improving average vehicle crashworthiness with increasing
EuroNCAP star rating. Analysis of the component measures of the crashworthiness metric shows
this result stems from an association between average injury severity and overall EuroNCAP star
rating and not the injury risk component of the crashworthiness measure.
The measured difference in average crashworthiness and injury severity between adjacent overall
EuroNCAP star rating categories is not consistent between countries. This may be partly a
reflection of the noted differences in injury outcome classification between data for each country.
Associations were strongest and most consistent in both the French and German data. The
French data in particular uses a much higher severity definition for serious injury requiring drivers
to be hospitalised for more than 6 days compared to the British data which includes a number of
less severe injury outcomes. The stronger association between the French definition and
EuroNCAP results suggests EuroNCAP may be reflecting the likelihood of these more serious
injury outcomes.
The relationship between overall EuroNCAP test score and injury severity and crashworthiness
on an individual vehicle bases are shown in Figures 3 and 4 for the British data, Figures 8 and 9
for the French data and Figures 13 and 14 for the German data. Results presented in these
figures add a further dimension to the interpretation of the relationship between EuroNCAP
scores and injury outcomes in police reported crashes. They show that whilst there is and
association between average vehicle crashworthiness and EuroNCAP score outcome, there is
significant variation in the measures of injury outcome in real crashes for specific vehicles within
each EuroNCAP score category. This is demonstrated by the large amount of dispersion in the
figures. In a number of cases the 95% confidence limits on estimates for vehicles within the same
star rating category do not overlap showing the dispersion is not just a product of the accuracy of
the estimates. It is a product of statistically significant differences between the measured real
crash safety of vehicles within the same star rating. In other words, a vehicle with a low
crashworthiness or injury severity estimate does not always perform well in EuroNCAP testing
and vice versa. This observation is consistent across the results for all countries considered in the
study.
CEA/EC SARAC II Discussion
118
Results of the vehicle by vehicle comparisons also help to explain the differences in the
associations between average crashworthiness or injury severity and overall EuroNCAP score
between countries. The range of specific makes and models of EuroNCAP tested vehicles with
sufficient representation in the police reported crash data varied from country to country,
reflecting the different purchasing preferences of consumers in different countries. Since there are
significant differences in crashworthiness and injury severity between vehicles within the same
EuroNCAP star ratings, the variation in the comparisons of average crashworthiness and injury
severity between countries can be explained to a certain degree by the different makes and
models of vehicles over which the averages were taken. Unfortunately, it was no possible to draw
a subset of the same vehicle models from the ratings from each country and undertake
meaningful analyses due to the limited number of vehicles common to ratings from each county.
Doing so would have enabled explicit measurement of the effects of differences in injury outcome
scaling between countries on the comparisons with EuroNCAP.
Trends in average crashworthiness and its component measures by EuroNCAP overall star rating
derived from the Australian and New Zealand crash data were very different from those measured
using the European data sources. No association between average crashworthiness, injury risk or
injury severity and EuroNCAP overall star ratings was observed in the Australian and New
Zealand data comparisons. This may have been a result of fewer vehicles being available for
analysis, the range of vehicle models analysed being vastly different to those represented in the
European data sources, differences in the injury outcome coding in the Australian and New
Zealand data or a combination of all these factors. Exact reasons for the differences are difficult
to isolate. Like the European data sources, crashworthiness ratings by make and model showed
statistically significant differences within EuroNCAP star rating categories.
5.2.2 EuroNCAP results by Test Configuration and Real Crash Ratings by Crash Configuration
Due to a lack of impact point on the vehicle in the German data, no ratings for specific impact
types could be calculated from this data. In both the Australasian and French data relatively few
vehicle models had sufficient data for a side impact crashworthiness rating to be calculated with
sufficient precision for further analysis. The range of frontal impact rated vehicle models in the
Australian and New Zealand data was also very limited. Subsequently, focus on interpreting
results of comparisons by specific crash configurations is on the frontal impact results for the
French and British data and the side impact results for only the British data.
Comparison of average crashworthiness ratings based on frontal impact crashes within
EuroNCAP offset frontal impact star rating categories showed no trends (Table 37a and appendix
G). This was the case when examining either the average crashworthiness rating or its injury risk
CEA/EC SARAC II Discussion
119
or injury severity components. The observed lack of association was not due to lack of statistical
power in analysis of the crash data with the point estimates of average crashworthiness also
showing no defined trend with EuroNCAP score for either the British or French data. There was
also a wide range of EuroNCAP offset frontal scores among the vehicle models analysed.
Overall, these results suggest there is little if any association between the results of the
EuroNCAP offset frontal impact test and injury outcomes to drivers in frontal crashes reported to
police as measured by crashworthiness estimated using the DfT and Newstead methods.
In contrast to the frontal impact test, a strong association between average crashworthiness in
side impact crashes and the side impact EuroNCAP score was observed in the British data (Table
37b). Vehicles with a 4 star side impact rating had an average side impact crashworthiness rating
statistically significantly better than that for 2 or 3 star rated vehicles with the 3 star rated vehicles
being marginally statistically significantly better than the 2 star vehicles. Interpreting the point
estimates of the analysis revealed an approximate 20% drop in average side impact serious injury
risk measured from the police reported data with every increase in EuroNCAP side impact star
rating category. Analysis of results in Appendix F shows the association with the side impact
crashworthiness rating again stems largely from the association between average side impact
injury severity and side impact EuroNCAP rating.
Like the comparisons based on all crash types discussed above, comparisons between side
impact crashworthiness ratings and side impact EuroNCAP scores on a vehicle by vehicle basis
in Figure 37b shows significant dispersion. In the case of the side impact crashworthiness ratings,
however, it is possible that this dispersion is largely due to estimation variance in the ratings with
a large degree of overlap observed between rating confidence limits. However, it also suggests
that a high EuroNCAP score is not associated with good side impact crashworthiness and vice
versa for all vehicle models.
5.3 Comparison with SARAC I Results and Other Studies
In many aspects, the results of this study hold many similarities to the results of the Pilot study of
Newstead et al (2001) carried out under Phase I of the SARAC research program. They are also
consistent with results of other similar studies comparing real crash outcomes and the results of
crash barrier test programs conducted world-wide.
Like the SARAC I study, this study has found an association between the average
crashworthiness of vehicles in all crash types and the overall EuroNCAP star rating category.
Both studies also identified this association as stemming largely from the injury severity
component of the crashworthiness rating. The SARAC I study also reported association between
the side impact EuroNCAP ratings and crashworthiness for both all crash types and side impact
CEA/EC SARAC II Discussion
120
crashes. Similarly, it found little relationship between EuroNCAP scores and the offset frontal test
result. Results in this report support these findings more strongly, a result of greater quantities of
police reported crash data on a wider range of vehicle models.
Another important similarity between this study and the SARAC I pilot study is the conclusions
drawn from comparing the two ratings systems on a vehicle by vehicle basis. They both identify
that, despite the associations measured from average crashworthiness across vehicles, on a
vehicle by vehicle basis there is significant variation in crashworthiness between vehicles within
the same EuroNCAP star rating category. This is the case when considering ratings from police
reported crash data based on both all cash types and for specific impact types. They both
conclude that a good EuroNCAP score is not necessarily associated with a good crashworthiness
rating based on police reported data.
Similar conclusions have also been drawn from other studies conducted internationally. Lie and
Tingvall (2000) confirm the general association between average crashworthiness and
EuroNCAP score in a study on Swedish data. Similar studies on data from the USA (Newstead et
al, 2003) and Australia (Newstead and Cameron, 1999) also concluded EuroNCAP results had a
higher level of association with injury severity measured from Police reported crash data than with
the injury risk measure. They also concluded that comparisons on a vehicle by vehicle basis
showed a high degree of dispersion away from perfect correlation.
The study of Newstead et al (2001) carried out under Phase I of the SARAC research program
was labelled a Pilot since its role was to establish the methodology for comparison and was
based on a relatively small sample of EuroNCAP tested vehicles. In comparison, this study is
based on much larger quantities of police reported crash data from a wider range of countries
with results based on the analysis of up to 70 EuroNCAP vehicle models. As such this study
provides a much more definitive assessment of the relationship between EuroNCAP test scores
and injury outcomes recorded in police reported crash data.
5.4 Consequences of the Results
Having established the key features of the analysis results, it is next of interest to consider the
broader implications of these results. Drawing conclusions from such analysis is always difficult
because there are divergent opinions on whether ratings from crash barrier test programs or real
world crash data analysis better reflect the most important underlying aspects of relative
secondary vehicle safety. Beliefs held on which is the more appropriate rating system will
dramatically alter the interpretation of the analysis results.
In arriving at a suitable interpretation, it is interesting to revisit the philosophy of the EuroNCAP
program. According to those involved in EuroNCAP, the principal purpose of the program is to
CEA/EC SARAC II Discussion
121
apply pressure to vehicle manufacturers to improve the safety design and specification of
vehicles. By publishing the results for broad consumer scrutiny, the program achieves maximum
leverage to achieve this end. Reflecting the aims of the program, the scoring system for
EuroNCAP is not designed to necessarily represent an injury risk outcome scale. Instead, the
various test measurements are weighted according to how highly it is desired to influence
manufacturers on each aspect of vehicle design. For example, frontal and side impact test results
are given equal weight in the overall score reflecting a desire to influence design performance in
these two areas equally. In real world crash circumstances, however, front and side impact
collisions do not contribute equally to average crash outcomes. Similar comments can be made
about the other EuroNCAP score components.
Recognising the nature of the EuroNCAP scoring process, a linear relationship between injury
outcomes in real world crashes and the EuroNCAP score would not necessarily be expected.
However, given the aim of EuroNCAP is to improve vehicle safety generally, a general
association between improving crashworthiness and higher EuroNCAP scores would be
expected. Considering the analysis of real crash outcomes as the most suitable way of assessing
the effectiveness of the EuroNCAP program in meeting its aims, results of this study confirm this
general association with average real crash outcomes being better in vehicles with higher
EuroNCAP scores than in ones with low scores. Results also confirm that this association is non-
linear as expected.
Interpreted in this way, results of analysis in this study confirm that the design priorities for vehicle
safety encouraged by the EuroNCAP scoring process are leading to improved real world crash
performance on average. Importantly, comparison of the French and British analysis results, in
particular suggest that improvement is greatest in the higher severity real world crashes.
However, the results of comparison on a vehicle by vehicle basis also show that achieving these
design priorities does not always lead to a safer vehicle. This result suggests that EuroNCAP is
not necessarily encapsulating all the factors required to ensure good safety performance in a
vehicle. Alternately, it is allowing vehicles to score well on a combination of factors that have
relatively low effectiveness in improving real world safety. Whether the EuroNCAP test process
can or should be modified to overcome this to some degree remains to be determined.
A lack of absolute consistency between EuroNCAP ratings and crashes based on real world data
on a vehicle by vehicle basis is only problematic if ratings from the two systems are presented
side by side for consumer information. This is, however rarely possible because of the nature of
the ratings. Ratings based on real world data typically lag those published by EuroNCAP by many
years as real world crash experience accumulates by which time the EuroNCAP test protocol has
often been modified and is not directly comparable.
CEA/EC SARAC II Discussion
122
As noted, EuroNCAP is seen as a tool for driving safety change in vehicle design and providing
information to consumers on relative safety at the time of vehicle release. In contrast, crash
ratings based on real world data are seen as a tool to evaluate the long term safety of vehicles in
the full range of real world circumstances. As shown by this study, real world ratings also provide
a means to assess whether EuroNCAP testing is achieving its stated aims in improving vehicle
safety and to help fine tune the program in future. Viewed as such, both ratings systems have a
defined and non-conflicting role in advancing vehicle safety.
5.5 Future Research Directions
The work completed in this sub-task of the SARAC 2 project and detailed in this report has
pointed to a number of areas of future research that should be considered. They are as follows.
• The EuroNCAP test program is constantly evolving to encourage manufacturers to meet more
rigorous standards of vehicle safety performance and to include the latest safety technology.
Introduction of the side impact pole test and points for seat belt reminder systems are
examples of this evolution. The evolutionary changes to EuroNCAP need to be evaluated
specifically to ensure they are effective in improving average vehicle safety in real world
crashes. This could be achieved through periodic updates of the type of analysis presented in
this report. Through the addition of more recent crash data, the updates will cover additional
vehicle models as well as providing more precise estimates of real world crash performance
for vehicle models studied in this and previous reports. Periodic evaluation of EuroNCAP in
general using the approach taken in this study is recommended and considered vital to
ensure this high profile program continues to meet its target of improving vehicle safety
performance.
• One of the limitations of the research presented in this report was the inability to combine the
data from each of the jurisdictions for combined analysis due primarily to inconsistencies in
the injury severity level coding of crash involved people. Being able to combine all the data for
analysis would have resulted in much more definitive and easily interpreted analysis
outcomes. Having a standardised European crash data recording protocol would not only
have improved the outcomes of this study but would also represent a powerful tool for use in
future European vehicle safety research based on the analysis of police reported crash
outcomes. It is recommended that research be undertaken to investigate establishing a
standardised European crash data recording protocol. Part of the research should investigate
the most suitable measure of severe injury outcome (for example hospital admission) that can
be accurately and consistently coded by police. Such a measure would be important for
studies such as this where relative injury severity was the key measure related to EuroNCAP
score.
CEA/EC SARAC II Discussion
123
• More in-depth comparisons of the relationship between real world crash outcomes and
EuroNCAP test scores would have been possible if a greater range of injury severity
measures were available than just those recorded in the police data. A greater range of injury
severity measures can be explored when more detailed injury outcome measures are
collected. An example of a detailed injury outcome measure is the ICD (International
Classification for Diseases) coding system typically used for coding hospital admission data
and often found in insurance claims data. It is recommended that research be conducted in
Europe on investigating the availability of other injury outcome data such as insurance claims
data and hospital records and the potential for linking these records with police crash data
reports on a wide scale. The resulting combined data would also be a powerful resource for a
broad range of detailed vehicle safety research in Europe.
5.6 Assumptions and Limitations
The research results presented in this report are subject to a number of assumptions and
limitations. The key assumptions and limitations are listed here.
5.6.1 Assumptions
• Details of the real world crashes analysed were accurately recorded by police particularly
with respect to driver injury outcome, age and gender and other crash related non-vehicle
variables used in the analysis.
• Information on make and model of vehicle was accurately recorded in the source from
which it was obtained (either the police crash reports or the vehicle register).
• There were no other non-vehicle factors apart from those included in the analysis that
differed between vehicle make and model dramatically affected injury outcome.
• Factors such as driver age and gender, speed limit, level of urbanisation and number of
vehicles involved that were included in the analysis were adequate proxies for crash
impact severity that was not available in the real world data.
• There was no systematic bias in crash data reporting or accuracy of recording by vehicle
model.
• The forms of the statistical models used to estimate driver injury risk and severity were
the most appropriate.
CEA/EC SARAC II Conclusions
124
5.6.2 Limitations
• Only one 1-star EuroNCAP tested vehicle had sufficient real world crash experience to be
included in the analysis of data from Great Britain. No other jurisdictions had sufficient
real world data on 1-star EuroNCAP tested vehicles.
• Due to limited data on real world crashes involving these tests, the EuroNCAP pole test
and seat belt reminder score were not explicitly considered in the analysis. No 5-star
performing EuroNCAP tested vehicles were available in the analysis.
• Selection of vehicle models for analysis was determined by the popularity of the vehicle
and the length of time it has been on sale which is reflected in the amount of cumulative
crash data. Furthermore, EuroNCAP only tests a certain number of vehicle makes and
models although the most popular vehicles are typically chosen for testing. It is difficult to
quantify how this selection bias affects the results obtained.
6 Conclusions This study has been able to quantify the relationship between injury outcomes in real world
crashes reported to police and estimates of relative vehicle safety derived from the EuroNCAP
vehicle crash barrier test program. The measure of real world injury outcome used has been the
risk of death or serious injury given crash involvement calculated as a product of the risk of injury
given crash involvement and the risk of death or serious injury given an injury was sustained. The
crashworthiness measure, as well as its component risk measures based on all crash
configurations, has been compared with the overall EuroNCAP score. Real world crash outcomes
for frontal and driver side impacts have also been compared with the EuroNCAP offset and side
impact test component scores. Police reported crash data from Great Britain, France, Germany,
Finland, Australia and New Zealand was analysed. Due to the much larger quantities of real world
data available for analysis, up to 70 EuroNCAP tested vehicle models have been considered in
the comparisons meaning results from this study are more definitive than those obtained in the
preceding SARAC 1 pilot study.
Results of analysis of the European data sources support some common conclusions when
examining average real crash outcome by EuroNCAP star rating. Results from each country point
to improving average vehicle crashworthiness with increasing EuroNCAP star rating. Analysis of
the component measures of the crashworthiness metric shows this result stems from an
association between average injury severity and overall EuroNCAP star rating and not the injury
risk component of the crashworthiness measure. Measured associations between EuroNCAP
score and real world injury severity were strongest and most consistent in both the French and
German data. The French data in particular uses a much higher severity definition for serious
CEA/EC SARAC II Conclusions
125
injury compared to the British data requiring drivers to be hospitalised for more than 6 days. The
strong association between the French definition and EuroNCAP results suggests EuroNCAP
may be reflecting the likelihood of these more serious injury outcomes.
No association between average crashworthiness, injury risk or injury severity and EuroNCAP
overall star ratings was observed in the Australian and New Zealand data comparisons. This may
have been a result of fewer vehicles being available for analysis, the range of vehicle models
analysed being vastly different to those represented in the European data sources, differences in
the injury outcome coding in the Australasian data or a combination of all these factors
Examination of the relationship between overall EuroNCAP test score and injury outcome on an
individual vehicle basis adds a further dimension to the interpretation of the relationship. They
show that whilst there is and association between average vehicle crashworthiness and
EuroNCAP score outcome, there is significant variation in the measures of injury outcome in real
crashes for specific vehicles within each EuroNCAP score category. It shows that a vehicle with
good average real world crash outcomes does not always perform well in EuroNCAP testing and
vice versa. This observation is consistent across the results for all countries considered in the
study.
Comparison of average crashworthiness ratings based on frontal impact crashes within
EuroNCAP offset frontal impact star rating categories showed no trends. The results suggest
there is little if any association between the results of the EuroNCAP offset frontal impact test and
real world injury outcomes to drivers in frontal crashes. In contrast, a strong association between
average crashworthiness in side impact crashes and the side impact EuroNCAP score was
observed. Interpreting the point estimates of the analysis revealed an approximate 20% drop in
average side impact serious injury risk measured from the police reported data with every
increase in EuroNCAP side impact star rating category. Like the comparisons based on all crash
types, comparisons between side impact crashworthiness ratings and side impact EuroNCAP
scores on a vehicle by vehicle basis showed ratings were not always consistent on a vehicle by
vehicle basis. The results of this study are consistent with the results of the Pilot study carried out
under Phase I of the SARAC research program and other similar studies comparing real crash
outcomes and the results of crash barrier test programs conducted world-wide.
EuroNCAP’s principal aim is to apply pressure to vehicle manufacturers to improve the safety
design and specification of vehicles. Leverage to achieve this end is gained by publishing the
results for broad consumer scrutiny. Reflecting the aims of the program, the scoring system for
EuroNCAP is not designed to necessarily represent an injury risk outcome scale. Results of this
study confirm this general association with average real crash outcomes being better in vehicles
with higher EuroNCAP scores than in ones with low scores. Results also confirm that this
CEA/EC SARAC II Acknowledgments
126
association is non-linear as expected. As such the study confirms that the design priorities for
vehicle safety encouraged by the EuroNCAP scoring process are leading to improved real world
crash performance on average. However, the results of comparison on a vehicle by vehicle basis
also show that achieving these design priorities does not always lead to a safer vehicle.
Finally, this study shows that comparison with real world ratings provide a means to assess
whether EuroNCAP testing is achieving its stated aims in improving vehicle safety and to help fine
tune the program in the future. Noting their respective strengths, both EuroNCAP and real world
ratings systems have defined and non-conflicting roles in advancing vehicle safety.
7 Acknowledgments A number of organisations and individuals have assisted in facilitating the research described in
this report through provision of data and advice on its use. The assistance of the following people
and organisations in this area is acknowledged.
• The British Department for Transport and in particular Valerie Davies and Matthew
Bollington for their assistance in supplying the British crash data and vehicle model
information and assisting with information on its use.
• Yves Page and Cyril Chauvel from the LAB in France for the supply of French crash data
and assistance in its interpretation for analysis.
• The German Statistical Office for the supply of the German crash data and the assistance
of Heinz Hautzinger, Karin Meyer, Claus-Henry Pastor, Bernhard Greilinger in obtaining
and processing the data and supplying valuable input into vehicle model identification and
grouping.
• Timo Ernvall and Timo Kari of Helsinki University of Technology for supply of the Finish
crash data and assistance in its analysis.
• The sponsors of the Australasian Used Car Safety Ratings research program for their
financial support of the project and assistance with vehicle model identification, and the
state road Authorities in Victoria, New South Wales, Queensland and Western Australia in
Australia and in New Zealand for supplying crash data from these jurisdictions.
8 References CAMERON, M.H., NEWSTEAD, S.V. & LE, C.M. (1998) Rating the aggressivity of Australian passenger vehicles towards other vehicle occupants and unprotected road users’ Proceedings, International IRCOBI Conference on the Biomechanics of Impact, Gothenborg, Sweden.
CEA/EC SARAC II References
127
CAMERON, M., NEWSTEAD, S. and OPPE, S. (2000) Review of studies correlating real-world accidents and crash tests in Australia and US, and review of suitable European databases. CEA/SARAC Report on sub-task 2.1.
CAMERON, M., NEWSTEAD, S., NARAYAN, S., ERNVALL, T., LAINE, V., and OPPE, S. (2001). Comparative analysis of several crashworthiness ratings systems, Report on Sub-Task 1.6, CEA/EC SARAC Quality Criteria for the Safety Assessment of Cars Based On Real World Crashes, Project No. B99-B2 7020-10-512.5661/P B 3 99 17/SUB CEA, Paris, France. DETR, (2000) STATS20 Instructions for Completion of Road Accident Report Form STATS19, Department of Environment Transport and the Regions, London, UK.
EURONCAP (2002) Pedestrian Testing Protocol Version 3.1.1 January 2002, European New Car Assessment Programme.
EURONCAP (2003), Pole Side Impact Testing Protocol, Version 4.0 January 2003, European New Car Assessment Program, www.euroncap.com, Last accessed, August 12, 2003
HAUTZINGER, H and MAYER, K. German accident data files 1998-2002 “GerDAT”: A new empirical basis for car safety rating, SARAC 2 report, September 2004.
HOBBS, C.A., GLOYNS, P.F. and RATTENBURY, S.J. (1999), European New Car Assessment Programme (EuroNCAP) Assessment protocol and biomechanical limits, Version2. Transport Research Laboratory, Crowthorne, UK.
LANGWEIDER, K., and BAULMER, H. (1994). Priorities of real car crashes and the agreement of real accidents with the results from crash testing Accident, Motor Vehicle and Legal Protection Insurers, Germany. LIE, A. AND TINGVALL, C. (2000), How does the EuroNCAP test results correlate to real life injury risks – paired comparison study of car to car crashes. Proceedings of the 2000 IRCOBI conference, Montpellier, France.
NEWSTEAD, S., CAMERON, M., and LE, C.M. (1999), Vehicle crashworthiness ratings and crashworthiness by year of manufacture: Victoria and NSW crashes during 1987-97, Queensland crashes during 1991-96. Report no. 150, Monash University Accident Research Centre, Melbourne, Australia.
NEWSTEAD, S., and CAMERON, M. (1999), Updated Correlation of Results from The Australian New Car Assesment Program with Real Crash Data from 1987 to 1996. Report no. 152, Monash University Accident Research Centre, Melbourne, Australia.
NEWSTEAD, S., CAMERON, M., and NARAYAN, S. (2001). Pilot study of correlation of data from real-world accidents and crash tests in Europe Report on Sub-Task 2.2, CEA/EC SARAC Quality Criteria for the Safety Assessment of Cars Based On Real World Crashes, Project No. B99-B2 7020-10-512.5661/P B 3 99 17/SUB CEA, Paris, France. NEWSTEAD, S. V., FARMER, C. M., NARAYAN, S., and CAMERON, M. H. (2003). "U.S. consumer crash test results and injury risk in police reported crashes." Traffic Injury Prevention, 4, pp. 113-127. NEWSTEAD, S., CAMERON, M. and WATSON, L. (2004), Vehicle crashworthiness and aggressivity ratings and crashworthiness by year of vehicle manufacture: 1987-1992 data from Australia and New Zealand Report No. 222, Monash University Accident Research Centre, Melbourne, Australia.
CEA/EC SARAC II References
128
VIANO, D. C. "Analysis of a safety advertising claim on vehicle crashworthiness." Paper No. 94-S5-W-18, 14th International Technical Conference on the Enhanced Safety of Vehicles, Munich, Germany. WhatCar? (2000), WhatCar? Used Car Price Guide May 2000. WhatCar?, England.
WILLIAMS, D.A. (1997) European New Car Assessment Programme (EuroNCAP) Testing Protocol Version 1.2 Unpublished project Report PR/SE/249/97, Transport Research Laboratory, Crowthorne, UK.

CEA/EC SARAC II References
129
CEA/EC SARAC II References
130
APPENDIX A
SELECTION PROTOCOL FOR IDENTIFYING VEHICLES IN
THE BRITISH AND FRENCH REAL CRASH DATA FOR COMPARISON WITH BARRIER TESTED VEHICLES
and
PROTOCOL FOR IDENTIFYING VEHICLES IN THE COMBINED AUSTRALIAN AND NEW ZEALAND REAL CRASH DATA FOR
COMPARISON WITH BARRIER TESTED VEHICLES
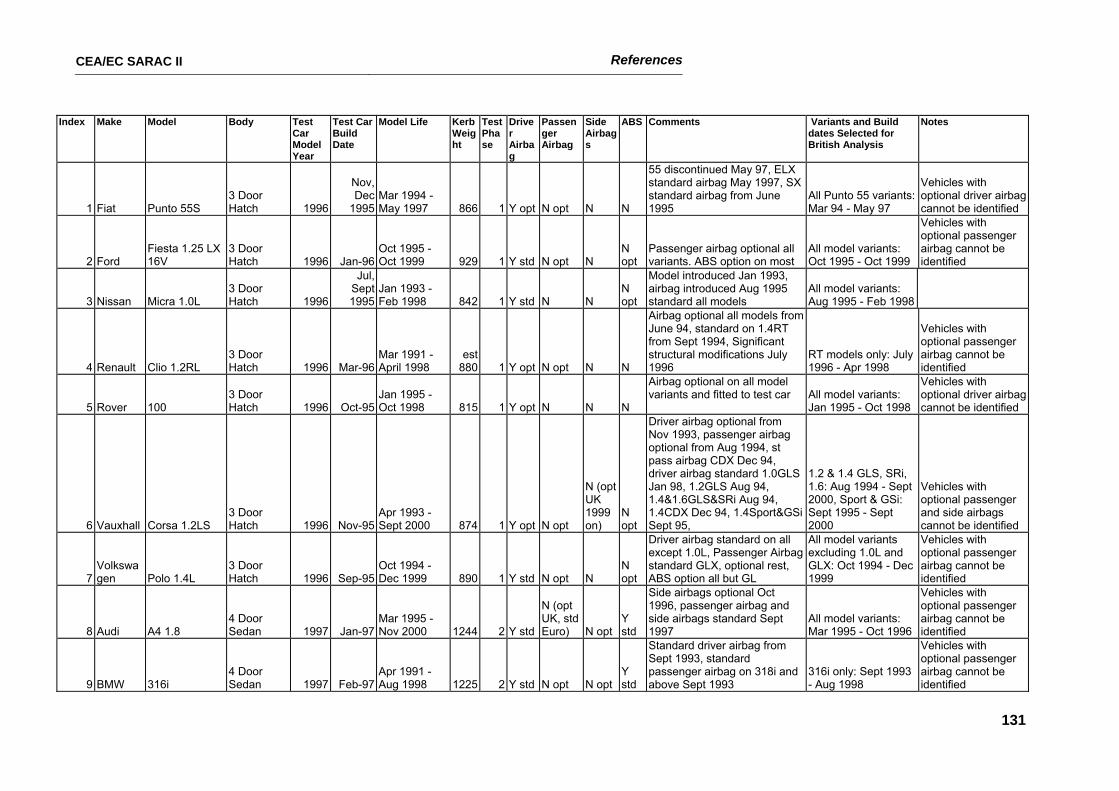
CEA/EC SARAC II References
131
Index Make Model Body Test Car Model Year
Test Car Build Date
Model Life Kerb Weight
Test Phase
Driver Airbag
Passenger Airbag
Side Airbags
ABS Comments Variants and Build dates Selected for British Analysis
Notes
1 Fiat Punto 55S 3 Door Hatch 1996
Nov, Dec
1995Mar 1994 - May 1997 866 1 Y opt N opt N N
55 discontinued May 97, ELX standard airbag May 1997, SX standard airbag from June 1995
All Punto 55 variants: Mar 94 - May 97
Vehicles with optional driver airbag cannot be identified
2 Ford Fiesta 1.25 LX 16V
3 Door Hatch 1996 Jan-96
Oct 1995 - Oct 1999 929 1 Y std N opt N
N opt
Passenger airbag optional all variants. ABS option on most
All model variants: Oct 1995 - Oct 1999
Vehicles with optional passenger airbag cannot be identified
3 Nissan Micra 1.0L 3 Door Hatch 1996
Jul, Sept 1995
Jan 1993 - Feb 1998 842 1 Y std N N
N opt
Model introduced Jan 1993, airbag introduced Aug 1995 standard all models
All model variants: Aug 1995 - Feb 1998
4 Renault Clio 1.2RL 3 Door Hatch 1996 Mar-96
Mar 1991 - April 1998
est 880 1 Y opt N opt N N
Airbag optional all models from June 94, standard on 1.4RT from Sept 1994, Significant structural modifications July 1996
RT models only: July 1996 - Apr 1998
Vehicles with optional passenger airbag cannot be identified
5 Rover 100 3 Door Hatch 1996 Oct-95
Jan 1995 - Oct 1998 815 1 Y opt N N N
Airbag optional on all model variants and fitted to test car All model variants:
Jan 1995 - Oct 1998
Vehicles with optional driver airbag cannot be identified
6 Vauxhall Corsa 1.2LS 3 Door Hatch 1996 Nov-95
Apr 1993 - Sept 2000 874 1 Y opt N opt
N (opt UK 1999 on)
N opt
Driver airbag optional from Nov 1993, passenger airbag optional from Aug 1994, st pass airbag CDX Dec 94, driver airbag standard 1.0GLS Jan 98, 1.2GLS Aug 94, 1.4&1.6GLS&SRi Aug 94, 1.4CDX Dec 94, 1.4Sport&GSi Sept 95,
1.2 & 1.4 GLS, SRi, 1.6: Aug 1994 - Sept 2000, Sport & GSi: Sept 1995 - Sept 2000
Vehicles with optional passenger and side airbags cannot be identified
7 Volkswagen Polo 1.4L
3 Door Hatch 1996 Sep-95
Oct 1994 - Dec 1999 890 1 Y std N opt N
N opt
Driver airbag standard on all except 1.0L, Passenger Airbag standard GLX, optional rest, ABS option all but GL
All model variants excluding 1.0L and GLX: Oct 1994 - Dec 1999
Vehicles with optional passenger airbag cannot be identified
8 Audi A4 1.8 4 Door Sedan 1997 Jan-97
Mar 1995 - Nov 2000 1244 2 Y std
N (opt UK, std Euro) N opt
Y std
Side airbags optional Oct 1996, passenger airbag and side airbags standard Sept 1997
All model variants: Mar 1995 - Oct 1996
Vehicles with optional passenger airbag cannot be identified
9 BMW 316i 4 Door Sedan 1997 Feb-97
Apr 1991 - Aug 1998 1225 2 Y std N opt N opt
Y std
Standard driver airbag from Sept 1993, standard passenger airbag on 318i and above Sept 1993
316i only: Sept 1993 - Aug 1998
Vehicles with optional passenger airbag cannot be identified
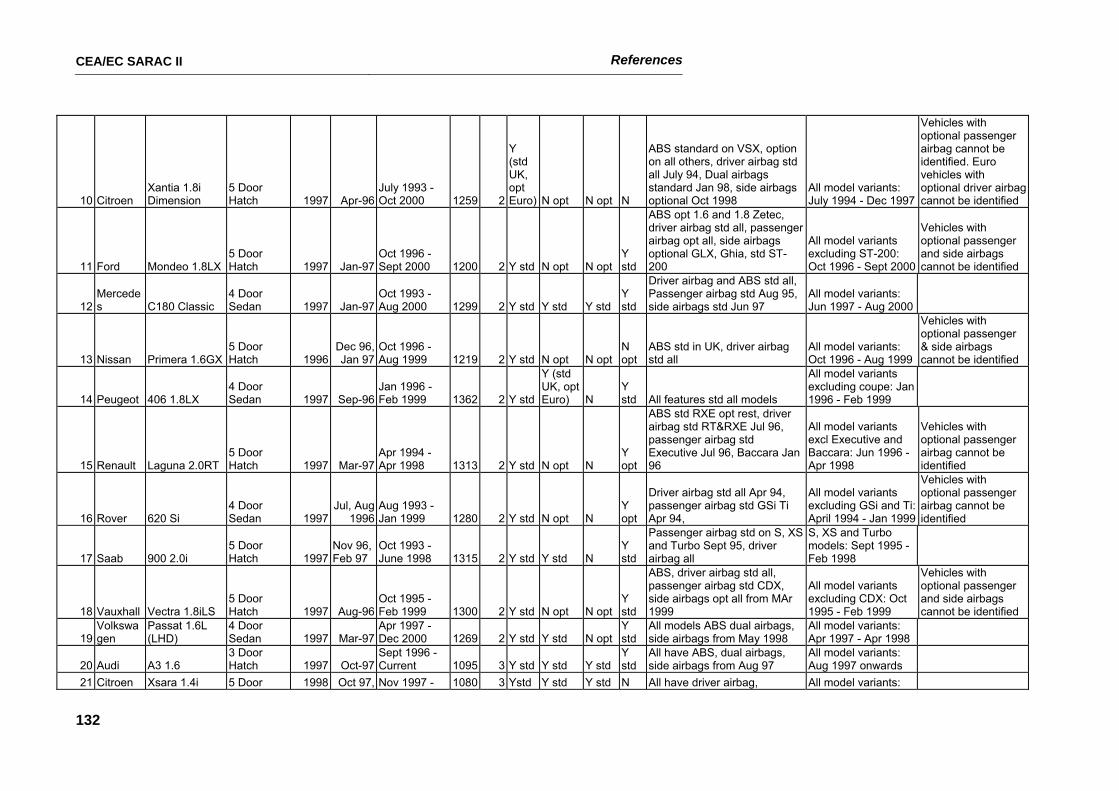
CEA/EC SARAC II References
132
10 Citroen Xantia 1.8i Dimension
5 Door Hatch 1997 Apr-96
July 1993 - Oct 2000 1259 2
Y (std UK, opt Euro) N opt N opt N
ABS standard on VSX, option on all others, driver airbag std all July 94, Dual airbags standard Jan 98, side airbags optional Oct 1998
All model variants: July 1994 - Dec 1997
Vehicles with optional passenger airbag cannot be identified. Euro vehicles with optional driver airbag cannot be identified
11 Ford Mondeo 1.8LX5 Door Hatch 1997 Jan-97
Oct 1996 - Sept 2000 1200 2 Y std N opt N opt
Y std
ABS opt 1.6 and 1.8 Zetec, driver airbag std all, passenger airbag opt all, side airbags optional GLX, Ghia, std ST-200
All model variants excluding ST-200: Oct 1996 - Sept 2000
Vehicles with optional passenger and side airbags cannot be identified
12 Mercedes C180 Classic
4 Door Sedan 1997 Jan-97
Oct 1993 - Aug 2000 1299 2 Y std Y std Y std
Y std
Driver airbag and ABS std all, Passenger airbag std Aug 95, side airbags std Jun 97
All model variants: Jun 1997 - Aug 2000
13 Nissan Primera 1.6GX5 Door Hatch 1996
Dec 96, Jan 97
Oct 1996 - Aug 1999 1219 2 Y std N opt N opt
N opt
ABS std in UK, driver airbag std all
All model variants: Oct 1996 - Aug 1999
Vehicles with optional passenger & side airbags cannot be identified
14 Peugeot 406 1.8LX 4 Door Sedan 1997 Sep-96
Jan 1996 - Feb 1999 1362 2 Y std
Y (std UK, opt Euro) N
Y std All features std all models
All model variants excluding coupe: Jan 1996 - Feb 1999
15 Renault Laguna 2.0RT 5 Door Hatch 1997 Mar-97
Apr 1994 - Apr 1998 1313 2 Y std N opt N
Y opt
ABS std RXE opt rest, driver airbag std RT&RXE Jul 96, passenger airbag std Executive Jul 96, Baccara Jan 96
All model variants excl Executive and Baccara: Jun 1996 - Apr 1998
Vehicles with optional passenger airbag cannot be identified
16 Rover 620 Si 4 Door Sedan 1997
Jul, Aug 1996
Aug 1993 - Jan 1999 1280 2 Y std N opt N
Y opt
Driver airbag std all Apr 94, passenger airbag std GSi Ti Apr 94,
All model variants excluding GSi and Ti: April 1994 - Jan 1999
Vehicles with optional passenger airbag cannot be identified
17 Saab 900 2.0i 5 Door Hatch 1997
Nov 96, Feb 97
Oct 1993 - June 1998 1315 2 Y std Y std N
Y std
Passenger airbag std on S, XS and Turbo Sept 95, driver airbag all
S, XS and Turbo models: Sept 1995 - Feb 1998
18 Vauxhall Vectra 1.8iLS 5 Door Hatch 1997 Aug-96
Oct 1995 - Feb 1999 1300 2 Y std N opt N opt
Y std
ABS, driver airbag std all, passenger airbag std CDX, side airbags opt all from MAr 1999
All model variants excluding CDX: Oct 1995 - Feb 1999
Vehicles with optional passenger and side airbags cannot be identified
19 Volkswagen
Passat 1.6L (LHD)
4 Door Sedan 1997 Mar-97
Apr 1997 - Dec 2000 1269 2 Y std Y std N opt
Y std
All models ABS dual airbags, side airbags from May 1998
All model variants: Apr 1997 - Apr 1998
20 Audi A3 1.6 3 Door Hatch 1997 Oct-97
Sept 1996 - Current 1095 3 Y std Y std Y std
Y std
All have ABS, dual airbags, side airbags from Aug 97
All model variants: Aug 1997 onwards
21 Citroen Xsara 1.4i 5 Door 1998 Oct 97, Nov 1997 - 1080 3 Ystd Y std Y std N All have driver airbag, All model variants:
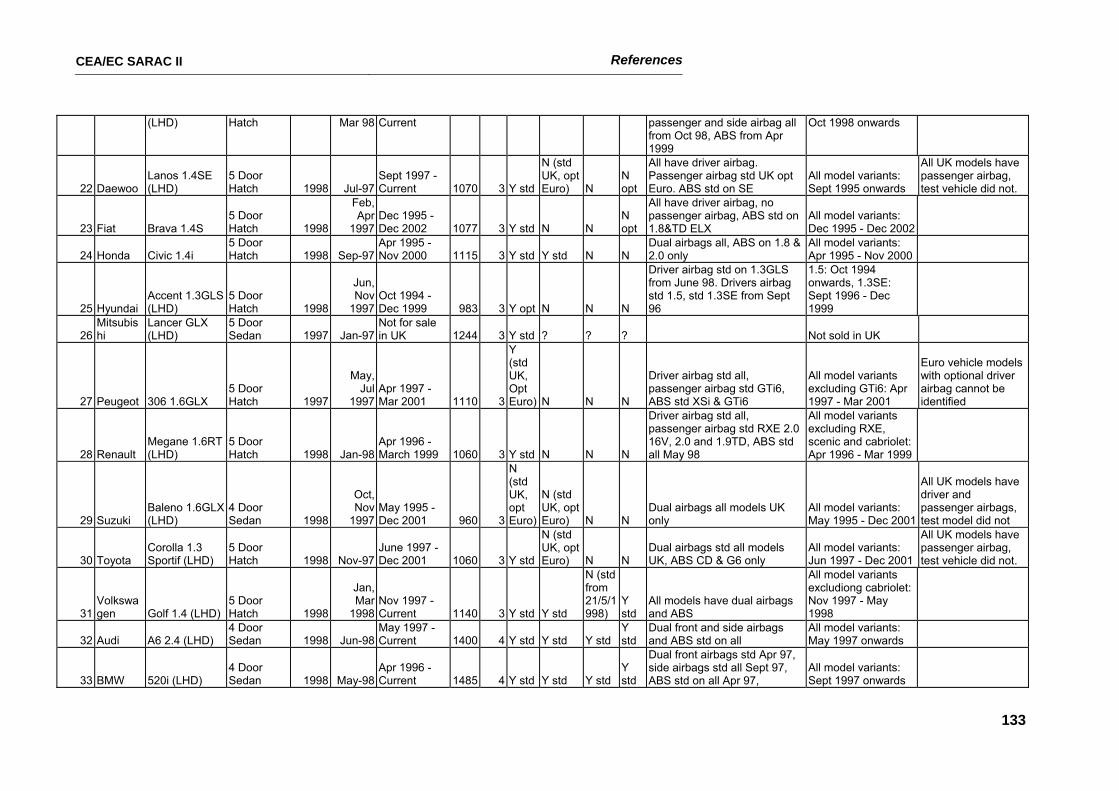
CEA/EC SARAC II References
133
(LHD) Hatch Mar 98 Current passenger and side airbag all from Oct 98, ABS from Apr 1999
Oct 1998 onwards
22 Daewoo Lanos 1.4SE (LHD)
5 Door Hatch 1998 Jul-97
Sept 1997 - Current 1070 3 Y std
N (std UK, opt Euro) N
N opt
All have driver airbag. Passenger airbag std UK opt Euro. ABS std on SE
All model variants: Sept 1995 onwards
All UK models have passenger airbag, test vehicle did not.
23 Fiat Brava 1.4S 5 Door Hatch 1998
Feb, Apr
1997Dec 1995 - Dec 2002 1077 3 Y std N N
N opt
All have driver airbag, no passenger airbag, ABS std on 1.8&TD ELX
All model variants: Dec 1995 - Dec 2002
24 Honda Civic 1.4i 5 Door Hatch 1998 Sep-97
Apr 1995 - Nov 2000 1115 3 Y std Y std N N
Dual airbags all, ABS on 1.8 & 2.0 only
All model variants: Apr 1995 - Nov 2000
25 Hyundai Accent 1.3GLS (LHD)
5 Door Hatch 1998
Jun, Nov
1997Oct 1994 - Dec 1999 983 3 Y opt N N N
Driver airbag std on 1.3GLS from June 98. Drivers airbag std 1.5, std 1.3SE from Sept 96
1.5: Oct 1994 onwards, 1.3SE: Sept 1996 - Dec 1999
26 Mitsubishi
Lancer GLX (LHD)
5 Door Sedan 1997 Jan-97
Not for sale in UK 1244 3 Y std ? ? ? Not sold in UK
27 Peugeot 306 1.6GLX 5 Door Hatch 1997
May, Jul
1997Apr 1997 - Mar 2001 1110 3
Y (std UK, Opt Euro) N N N
Driver airbag std all, passenger airbag std GTi6, ABS std XSi & GTi6
All model variants excluding GTi6: Apr 1997 - Mar 2001
Euro vehicle models with optional driver airbag cannot be identified
28 Renault Megane 1.6RT (LHD)
5 Door Hatch 1998 Jan-98
Apr 1996 - March 1999 1060 3 Y std N N N
Driver airbag std all, passenger airbag std RXE 2.0 16V, 2.0 and 1.9TD, ABS std all May 98
All model variants excluding RXE, scenic and cabriolet: Apr 1996 - Mar 1999
29 Suzuki Baleno 1.6GLX (LHD)
4 Door Sedan 1998
Oct, Nov
1997May 1995 - Dec 2001 960 3
N (std UK, opt Euro)
N (std UK, opt Euro) N N
Dual airbags all models UK only
All model variants: May 1995 - Dec 2001
All UK models have driver and passenger airbags, test model did not
30 Toyota Corolla 1.3 Sportif (LHD)
5 Door Hatch 1998 Nov-97
June 1997 - Dec 2001 1060 3 Y std
N (std UK, opt Euro) N N
Dual airbags std all models UK, ABS CD & G6 only
All model variants: Jun 1997 - Dec 2001
All UK models have passenger airbag, test vehicle did not.
31 Volkswagen Golf 1.4 (LHD)
5 Door Hatch 1998
Jan, Mar
1998Nov 1997 - Current 1140 3 Y std Y std
N (std from 21/5/1998)
Y std
All models have dual airbags and ABS
All model variants excludiong cabriolet: Nov 1997 - May 1998
32 Audi A6 2.4 (LHD) 4 Door Sedan 1998 Jun-98
May 1997 - Current 1400 4 Y std Y std Y std
Y std
Dual front and side airbags and ABS std on all
All model variants: May 1997 onwards
33 BMW 520i (LHD) 4 Door Sedan 1998 May-98
Apr 1996 - Current 1485 4 Y std Y std Y std
Y std
Dual front airbags std Apr 97, side airbags std all Sept 97, ABS std on all Apr 97,
All model variants: Sept 1997 onwards
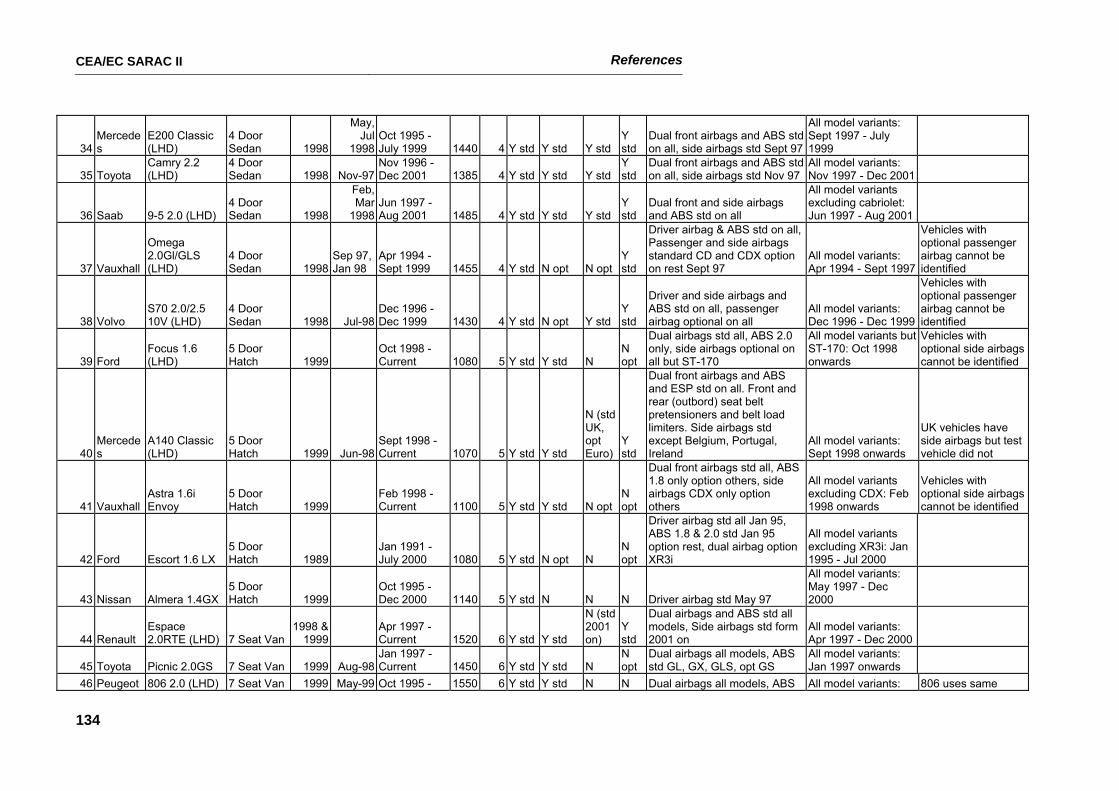
CEA/EC SARAC II References
134
34 Mercedes
E200 Classic (LHD)
4 Door Sedan 1998
May, Jul
1998Oct 1995 - July 1999 1440 4 Y std Y std Y std
Y std
Dual front airbags and ABS std on all, side airbags std Sept 97
All model variants: Sept 1997 - July 1999
35 Toyota Camry 2.2 (LHD)
4 Door Sedan 1998 Nov-97
Nov 1996 - Dec 2001 1385 4 Y std Y std Y std
Y std
Dual front airbags and ABS std on all, side airbags std Nov 97
All model variants: Nov 1997 - Dec 2001
36 Saab 9-5 2.0 (LHD) 4 Door Sedan 1998
Feb, Mar
1998Jun 1997 - Aug 2001 1485 4 Y std Y std Y std
Y std
Dual front and side airbags and ABS std on all
All model variants excluding cabriolet: Jun 1997 - Aug 2001
37 Vauxhall
Omega 2.0Gl/GLS (LHD)
4 Door Sedan 1998
Sep 97, Jan 98
Apr 1994 - Sept 1999 1455 4 Y std N opt N opt
Y std
Driver airbag & ABS std on all, Passenger and side airbags standard CD and CDX option on rest Sept 97
All model variants: Apr 1994 - Sept 1997
Vehicles with optional passenger airbag cannot be identified
38 Volvo S70 2.0/2.5 10V (LHD)
4 Door Sedan 1998 Jul-98
Dec 1996 - Dec 1999 1430 4 Y std N opt Y std
Y std
Driver and side airbags and ABS std on all, passenger airbag optional on all
All model variants: Dec 1996 - Dec 1999
Vehicles with optional passenger airbag cannot be identified
39 Ford Focus 1.6 (LHD)
5 Door Hatch 1999
Oct 1998 - Current 1080 5 Y std Y std N
N opt
Dual airbags std all, ABS 2.0 only, side airbags optional on all but ST-170
All model variants but ST-170: Oct 1998 onwards
Vehicles with optional side airbags cannot be identified
40 Mercedes
A140 Classic (LHD)
5 Door Hatch 1999 Jun-98
Sept 1998 - Current 1070 5 Y std Y std
N (std UK, opt Euro)
Y std
Dual front airbags and ABS and ESP std on all. Front and rear (outbord) seat belt pretensioners and belt load limiters. Side airbags std except Belgium, Portugal, Ireland
All model variants: Sept 1998 onwards
UK vehicles have side airbags but test vehicle did not
41 Vauxhall Astra 1.6i Envoy
5 Door Hatch 1999
Feb 1998 - Current 1100 5 Y std Y std N opt
N opt
Dual front airbags std all, ABS 1.8 only option others, side airbags CDX only option others
All model variants excluding CDX: Feb 1998 onwards
Vehicles with optional side airbags cannot be identified
42 Ford Escort 1.6 LX 5 Door Hatch 1989
Jan 1991 - July 2000 1080 5 Y std N opt N
N opt
Driver airbag std all Jan 95, ABS 1.8 & 2.0 std Jan 95 option rest, dual airbag option XR3i
All model variants excluding XR3i: Jan 1995 - Jul 2000
43 Nissan Almera 1.4GX 5 Door Hatch 1999
Oct 1995 - Dec 2000 1140 5 Y std N N N Driver airbag std May 97
All model variants: May 1997 - Dec 2000
44 Renault Espace 2.0RTE (LHD) 7 Seat Van
1998 & 1999
Apr 1997 - Current 1520 6 Y std Y std
N (std 2001 on)
Y std
Dual airbags and ABS std all models, Side airbags std form 2001 on
All model variants: Apr 1997 - Dec 2000
45 Toyota Picnic 2.0GS 7 Seat Van 1999 Aug-98Jan 1997 - Current 1450 6 Y std Y std N
N opt
Dual airbags all models, ABS std GL, GX, GLS, opt GS
All model variants: Jan 1997 onwards
46 Peugeot 806 2.0 (LHD) 7 Seat Van 1999 May-99 Oct 1995 - 1550 6 Y std Y std N N Dual airbags all models, ABS All model variants: 806 uses same
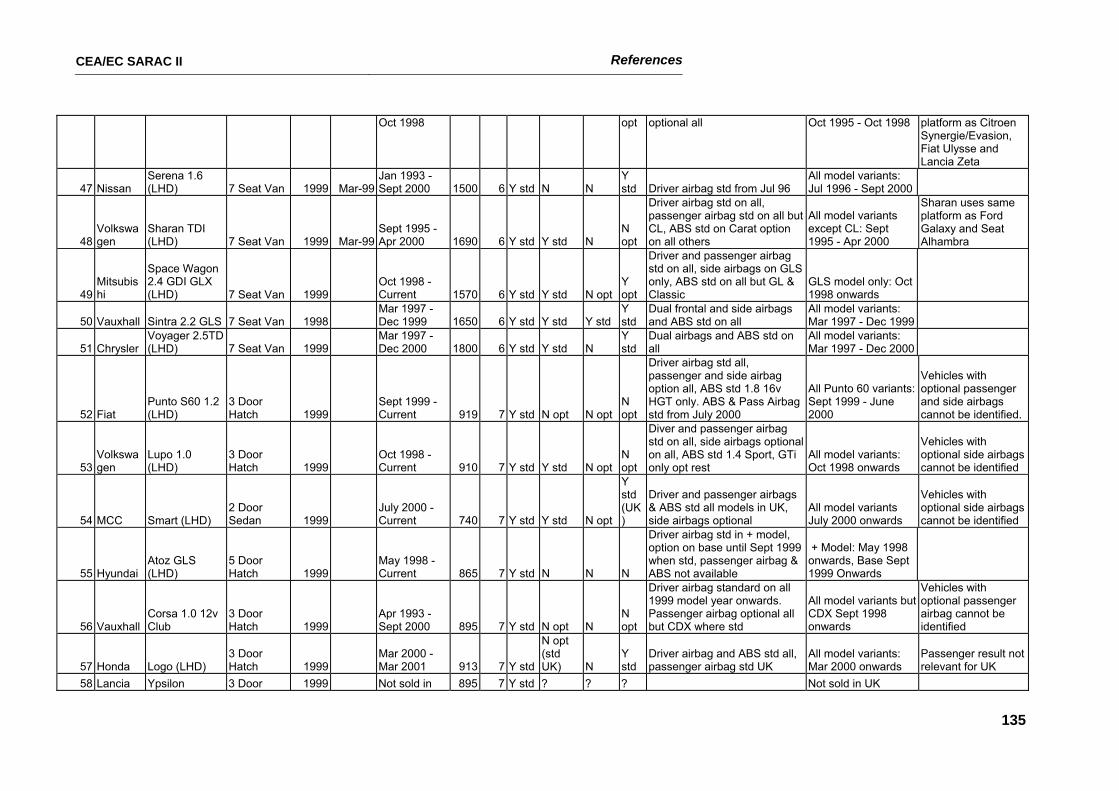
CEA/EC SARAC II References
135
Oct 1998 opt optional all Oct 1995 - Oct 1998 platform as Citroen Synergie/Evasion, Fiat Ulysse and Lancia Zeta
47 Nissan Serena 1.6 (LHD) 7 Seat Van 1999 Mar-99
Jan 1993 - Sept 2000 1500 6 Y std N N
Y std Driver airbag std from Jul 96
All model variants: Jul 1996 - Sept 2000
48 Volkswagen
Sharan TDI (LHD) 7 Seat Van 1999 Mar-99
Sept 1995 - Apr 2000 1690 6 Y std Y std N
N opt
Driver airbag std on all, passenger airbag std on all but CL, ABS std on Carat option on all others
All model variants except CL: Sept 1995 - Apr 2000
Sharan uses same platform as Ford Galaxy and Seat Alhambra
49 Mitsubishi
Space Wagon 2.4 GDI GLX (LHD) 7 Seat Van 1999
Oct 1998 - Current 1570 6 Y std Y std N opt
Y opt
Driver and passenger airbag std on all, side airbags on GLS only, ABS std on all but GL & Classic
GLS model only: Oct 1998 onwards
50 Vauxhall Sintra 2.2 GLS 7 Seat Van 1998 Mar 1997 - Dec 1999 1650 6 Y std Y std Y std
Y std
Dual frontal and side airbags and ABS std on all
All model variants: Mar 1997 - Dec 1999
51 Chrysler Voyager 2.5TD (LHD) 7 Seat Van 1999
Mar 1997 - Dec 2000 1800 6 Y std Y std N
Y std
Dual airbags and ABS std on all
All model variants: Mar 1997 - Dec 2000
52 Fiat Punto S60 1.2 (LHD)
3 Door Hatch 1999
Sept 1999 - Current 919 7 Y std N opt N opt
N opt
Driver airbag std all, passenger and side airbag option all, ABS std 1.8 16v HGT only. ABS & Pass Airbag std from July 2000
All Punto 60 variants: Sept 1999 - June 2000
Vehicles with optional passenger and side airbags cannot be identified.
53 Volkswagen
Lupo 1.0 (LHD)
3 Door Hatch 1999
Oct 1998 - Current 910 7 Y std Y std N opt
N opt
Diver and passenger airbag std on all, side airbags optional on all, ABS std 1.4 Sport, GTi only opt rest
All model variants: Oct 1998 onwards
Vehicles with optional side airbags cannot be identified
54 MCC Smart (LHD) 2 Door Sedan 1999
July 2000 - Current 740 7 Y std Y std N opt
Y std (UK)
Driver and passenger airbags & ABS std all models in UK, side airbags optional
All model variants July 2000 onwards
Vehicles with optional side airbags cannot be identified
55 Hyundai Atoz GLS (LHD)
5 Door Hatch 1999
May 1998 - Current 865 7 Y std N N N
Driver airbag std in + model, option on base until Sept 1999 when std, passenger airbag & ABS not available
+ Model: May 1998 onwards, Base Sept 1999 Onwards
56 Vauxhall Corsa 1.0 12v Club
3 Door Hatch 1999
Apr 1993 - Sept 2000 895 7 Y std N opt N
N opt
Driver airbag standard on all 1999 model year onwards. Passenger airbag optional all but CDX where std
All model variants but CDX Sept 1998 onwards
Vehicles with optional passenger airbag cannot be identified
57 Honda Logo (LHD) 3 Door Hatch 1999
Mar 2000 - Mar 2001 913 7 Y std
N opt (std UK) N
Y std
Driver airbag and ABS std all, passenger airbag std UK
All model variants: Mar 2000 onwards
Passenger result not relevant for UK
58 Lancia Ypsilon 3 Door 1999 Not sold in 895 7 Y std ? ? ? Not sold in UK
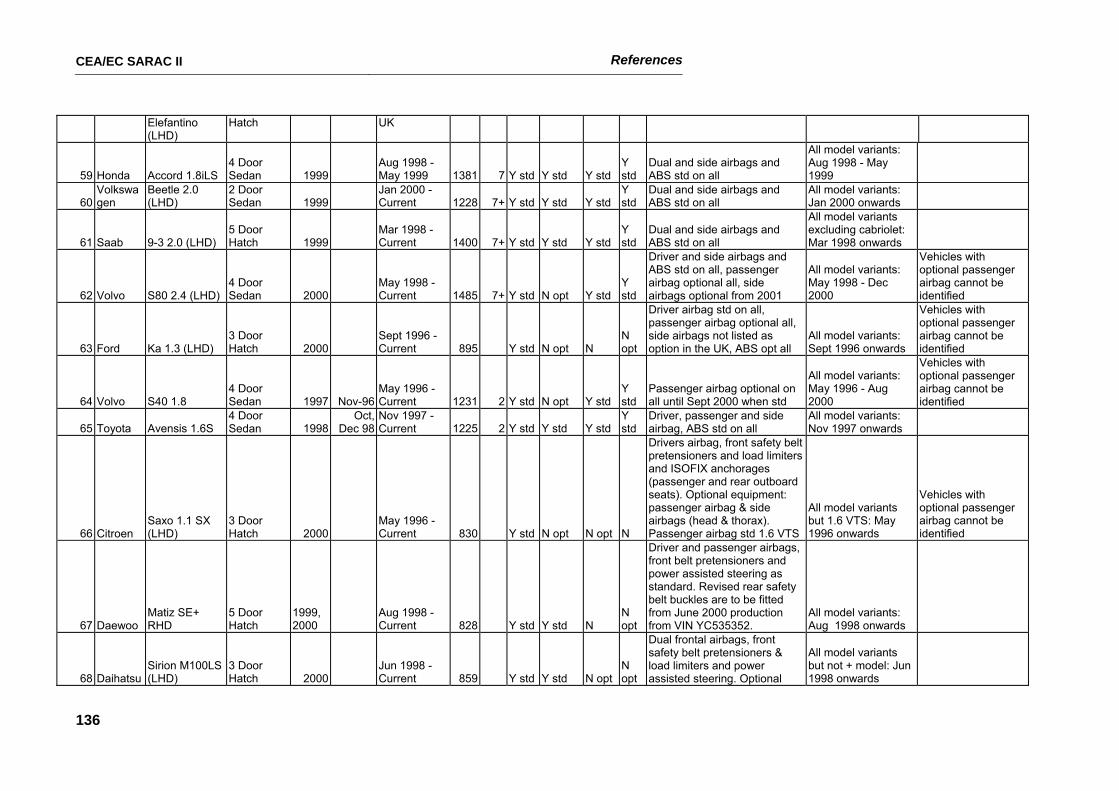
CEA/EC SARAC II References
136
Elefantino (LHD)
Hatch UK
59 Honda Accord 1.8iLS 4 Door Sedan 1999
Aug 1998 - May 1999 1381 7 Y std Y std Y std
Y std
Dual and side airbags and ABS std on all
All model variants: Aug 1998 - May 1999
60 Volkswagen
Beetle 2.0 (LHD)
2 Door Sedan 1999
Jan 2000 - Current 1228 7+ Y std Y std Y std
Y std
Dual and side airbags and ABS std on all
All model variants: Jan 2000 onwards
61 Saab 9-3 2.0 (LHD) 5 Door Hatch 1999
Mar 1998 - Current 1400 7+ Y std Y std Y std
Y std
Dual and side airbags and ABS std on all
All model variants excluding cabriolet: Mar 1998 onwards
62 Volvo S80 2.4 (LHD) 4 Door Sedan 2000
May 1998 - Current 1485 7+ Y std N opt Y std
Y std
Driver and side airbags and ABS std on all, passenger airbag optional all, side airbags optional from 2001
All model variants: May 1998 - Dec 2000
Vehicles with optional passenger airbag cannot be identified
63 Ford Ka 1.3 (LHD) 3 Door Hatch 2000
Sept 1996 - Current 895 Y std N opt N
N opt
Driver airbag std on all, passenger airbag optional all, side airbags not listed as option in the UK, ABS opt all
All model variants: Sept 1996 onwards
Vehicles with optional passenger airbag cannot be identified
64 Volvo S40 1.8 4 Door Sedan 1997 Nov-96
May 1996 - Current 1231 2 Y std N opt Y std
Y std
Passenger airbag optional on all until Sept 2000 when std
All model variants: May 1996 - Aug 2000
Vehicles with optional passenger airbag cannot be identified
65 Toyota Avensis 1.6S 4 Door Sedan 1998
Oct, Dec 98
Nov 1997 - Current 1225 2 Y std Y std Y std
Y std
Driver, passenger and side airbag, ABS std on all
All model variants: Nov 1997 onwards
66 Citroen Saxo 1.1 SX (LHD)
3 Door Hatch 2000
May 1996 - Current 830 Y std N opt N opt N
Drivers airbag, front safety belt pretensioners and load limiters and ISOFIX anchorages (passenger and rear outboard seats). Optional equipment: passenger airbag & side airbags (head & thorax). Passenger airbag std 1.6 VTS
All model variants but 1.6 VTS: May 1996 onwards
Vehicles with optional passenger airbag cannot be identified
67 Daewoo Matiz SE+ RHD
5 Door Hatch
1999, 2000
Aug 1998 - Current 828 Y std Y std N
N opt
Driver and passenger airbags, front belt pretensioners and power assisted steering as standard. Revised rear safety belt buckles are to be fitted from June 2000 production from VIN YC535352.
All model variants: Aug 1998 onwards
68 Daihatsu Sirion M100LS (LHD)
3 Door Hatch 2000
Jun 1998 - Current 859 Y std Y std N opt
N opt
Dual frontal airbags, front safety belt pretensioners & load limiters and power assisted steering. Optional
All model variants but not + model: Jun 1998 onwards
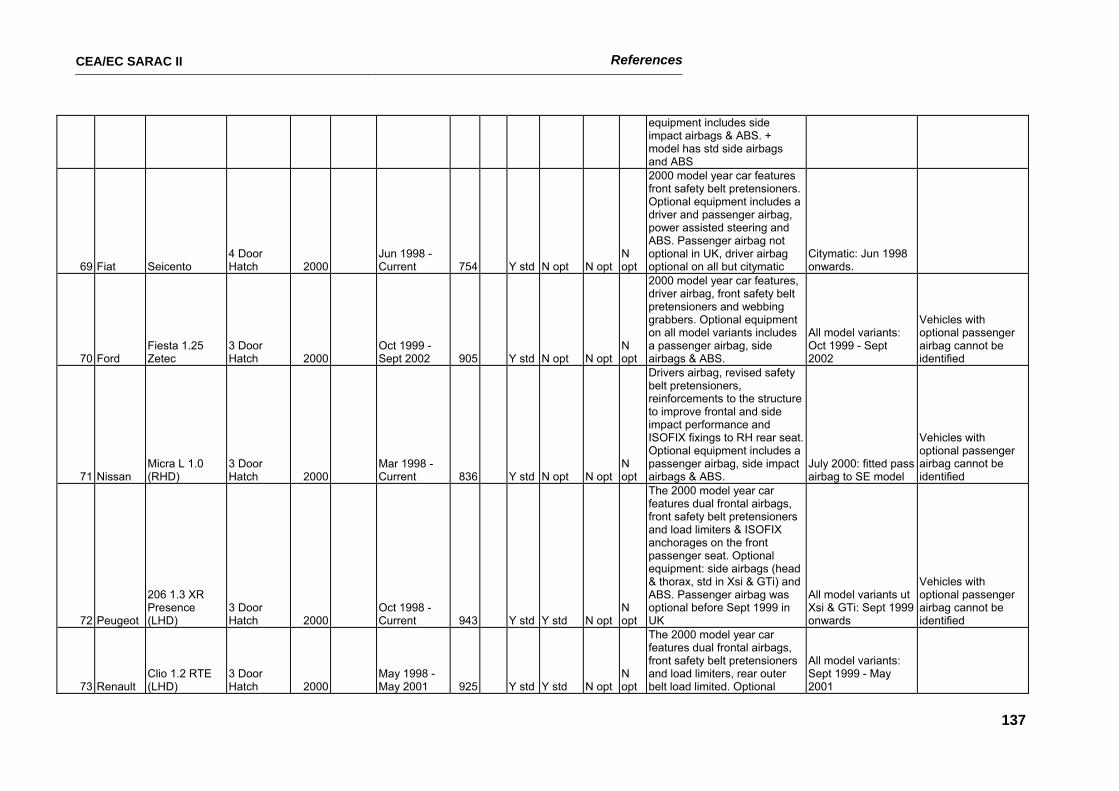
CEA/EC SARAC II References
137
equipment includes side impact airbags & ABS. + model has std side airbags and ABS
69 Fiat Seicento 4 Door Hatch 2000
Jun 1998 - Current 754 Y std N opt N opt
N opt
2000 model year car features front safety belt pretensioners. Optional equipment includes a driver and passenger airbag, power assisted steering and ABS. Passenger airbag not optional in UK, driver airbag optional on all but citymatic
Citymatic: Jun 1998 onwards.
70 Ford Fiesta 1.25 Zetec
3 Door Hatch 2000
Oct 1999 - Sept 2002 905 Y std N opt N opt
N opt
2000 model year car features, driver airbag, front safety belt pretensioners and webbing grabbers. Optional equipment on all model variants includes a passenger airbag, side airbags & ABS.
All model variants: Oct 1999 - Sept 2002
Vehicles with optional passenger airbag cannot be identified
71 Nissan Micra L 1.0 (RHD)
3 Door Hatch 2000
Mar 1998 - Current 836 Y std N opt N opt
N opt
Drivers airbag, revised safety belt pretensioners, reinforcements to the structure to improve frontal and side impact performance and ISOFIX fixings to RH rear seat. Optional equipment includes a passenger airbag, side impact airbags & ABS.
July 2000: fitted pass airbag to SE model
Vehicles with optional passenger airbag cannot be identified
72 Peugeot
206 1.3 XR Presence (LHD)
3 Door Hatch 2000
Oct 1998 - Current 943 Y std Y std N opt
N opt
The 2000 model year car features dual frontal airbags, front safety belt pretensioners and load limiters & ISOFIX anchorages on the front passenger seat. Optional equipment: side airbags (head & thorax, std in Xsi & GTi) and ABS. Passenger airbag was optional before Sept 1999 in UK
All model variants ut Xsi & GTi: Sept 1999 onwards
Vehicles with optional passenger airbag cannot be identified
73 Renault Clio 1.2 RTE (LHD)
3 Door Hatch 2000
May 1998 - May 2001 925 Y std Y std N opt
N opt
The 2000 model year car features dual frontal airbags, front safety belt pretensioners and load limiters, rear outer belt load limited. Optional
All model variants: Sept 1999 - May 2001
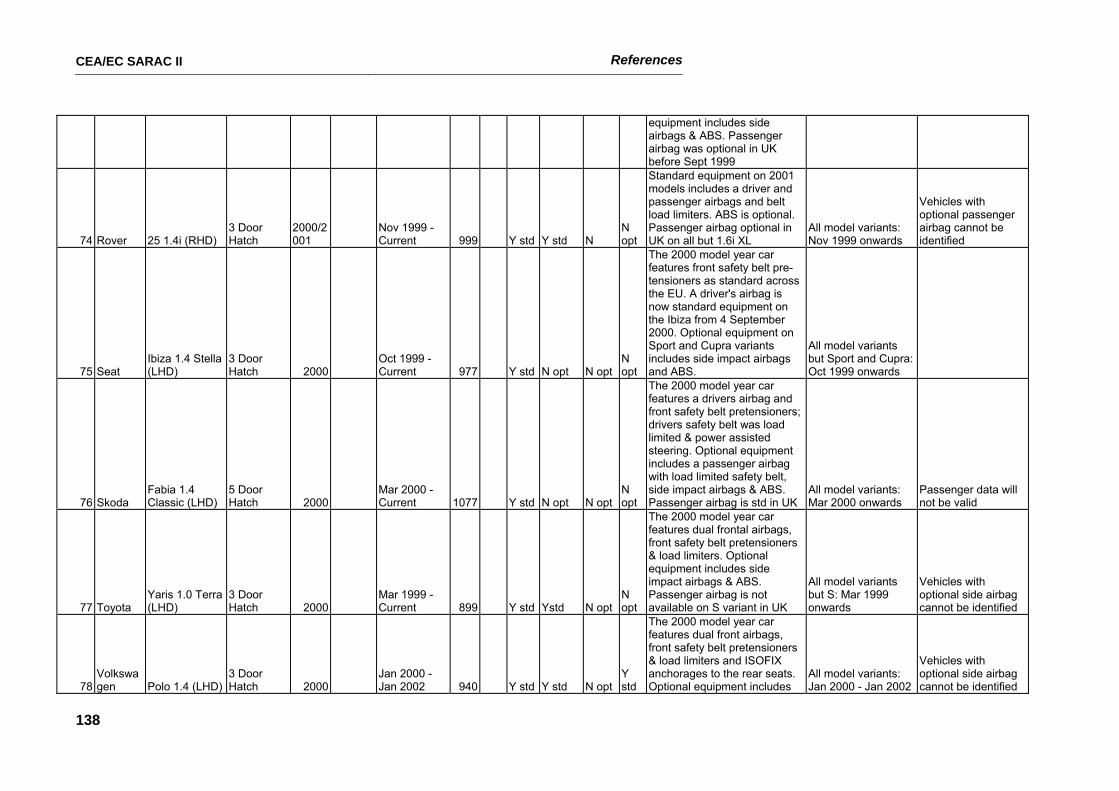
CEA/EC SARAC II References
138
equipment includes side airbags & ABS. Passenger airbag was optional in UK before Sept 1999
74 Rover 25 1.4i (RHD) 3 Door Hatch
2000/2001
Nov 1999 - Current 999 Y std Y std N
N opt
Standard equipment on 2001 models includes a driver and passenger airbags and belt load limiters. ABS is optional. Passenger airbag optional in UK on all but 1.6i XL
All model variants: Nov 1999 onwards
Vehicles with optional passenger airbag cannot be identified
75 Seat Ibiza 1.4 Stella (LHD)
3 Door Hatch 2000
Oct 1999 - Current 977 Y std N opt N opt
N opt
The 2000 model year car features front safety belt pre-tensioners as standard across the EU. A driver's airbag is now standard equipment on the Ibiza from 4 September 2000. Optional equipment on Sport and Cupra variants includes side impact airbags and ABS.
All model variants but Sport and Cupra: Oct 1999 onwards
76 Skoda Fabia 1.4 Classic (LHD)
5 Door Hatch 2000
Mar 2000 - Current 1077 Y std N opt N opt
N opt
The 2000 model year car features a drivers airbag and front safety belt pretensioners; drivers safety belt was load limited & power assisted steering. Optional equipment includes a passenger airbag with load limited safety belt, side impact airbags & ABS. Passenger airbag is std in UK
All model variants: Mar 2000 onwards
Passenger data will not be valid
77 Toyota Yaris 1.0 Terra (LHD)
3 Door Hatch 2000
Mar 1999 - Current 899 Y std Ystd N opt
N opt
The 2000 model year car features dual frontal airbags, front safety belt pretensioners & load limiters. Optional equipment includes side impact airbags & ABS. Passenger airbag is not available on S variant in UK
All model variants but S: Mar 1999 onwards
Vehicles with optional side airbag cannot be identified
78 Volkswagen Polo 1.4 (LHD)
3 Door Hatch 2000
Jan 2000 - Jan 2002 940 Y std Y std N opt
Y std
The 2000 model year car features dual front airbags, front safety belt pretensioners & load limiters and ISOFIX anchorages to the rear seats. Optional equipment includes
All model variants: Jan 2000 - Jan 2002
Vehicles with optional side airbag cannot be identified
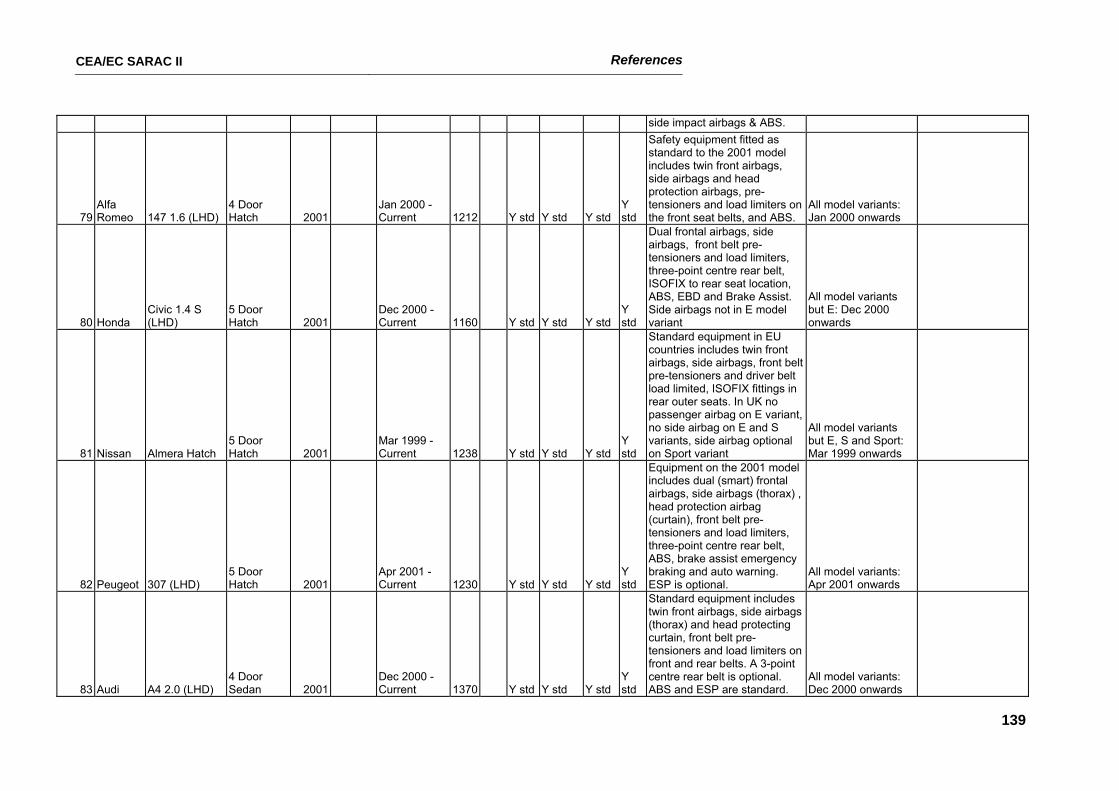
CEA/EC SARAC II References
139
side impact airbags & ABS.
79 Alfa Romeo 147 1.6 (LHD)
4 Door Hatch 2001
Jan 2000 - Current 1212 Y std Y std Y std
Y std
Safety equipment fitted as standard to the 2001 model includes twin front airbags, side airbags and head protection airbags, pre-tensioners and load limiters on the front seat belts, and ABS.
All model variants: Jan 2000 onwards
80 Honda Civic 1.4 S (LHD)
5 Door Hatch 2001
Dec 2000 - Current 1160 Y std Y std Y std
Y std
Dual frontal airbags, side airbags, front belt pre-tensioners and load limiters, three-point centre rear belt, ISOFIX to rear seat location, ABS, EBD and Brake Assist. Side airbags not in E model variant
All model variants but E: Dec 2000 onwards
81 Nissan Almera Hatch 5 Door Hatch 2001
Mar 1999 - Current 1238 Y std Y std Y std
Y std
Standard equipment in EU countries includes twin front airbags, side airbags, front belt pre-tensioners and driver belt load limited, ISOFIX fittings in rear outer seats. In UK no passenger airbag on E variant, no side airbag on E and S variants, side airbag optional on Sport variant
All model variants but E, S and Sport: Mar 1999 onwards
82 Peugeot 307 (LHD) 5 Door Hatch 2001
Apr 2001 - Current 1230 Y std Y std Y std
Y std
Equipment on the 2001 model includes dual (smart) frontal airbags, side airbags (thorax) , head protection airbag (curtain), front belt pre-tensioners and load limiters, three-point centre rear belt, ABS, brake assist emergency braking and auto warning. ESP is optional.
All model variants: Apr 2001 onwards
83 Audi A4 2.0 (LHD) 4 Door Sedan 2001
Dec 2000 - Current 1370 Y std Y std Y std
Y std
Standard equipment includes twin front airbags, side airbags (thorax) and head protecting curtain, front belt pre-tensioners and load limiters on front and rear belts. A 3-point centre rear belt is optional. ABS and ESP are standard.
All model variants: Dec 2000 onwards
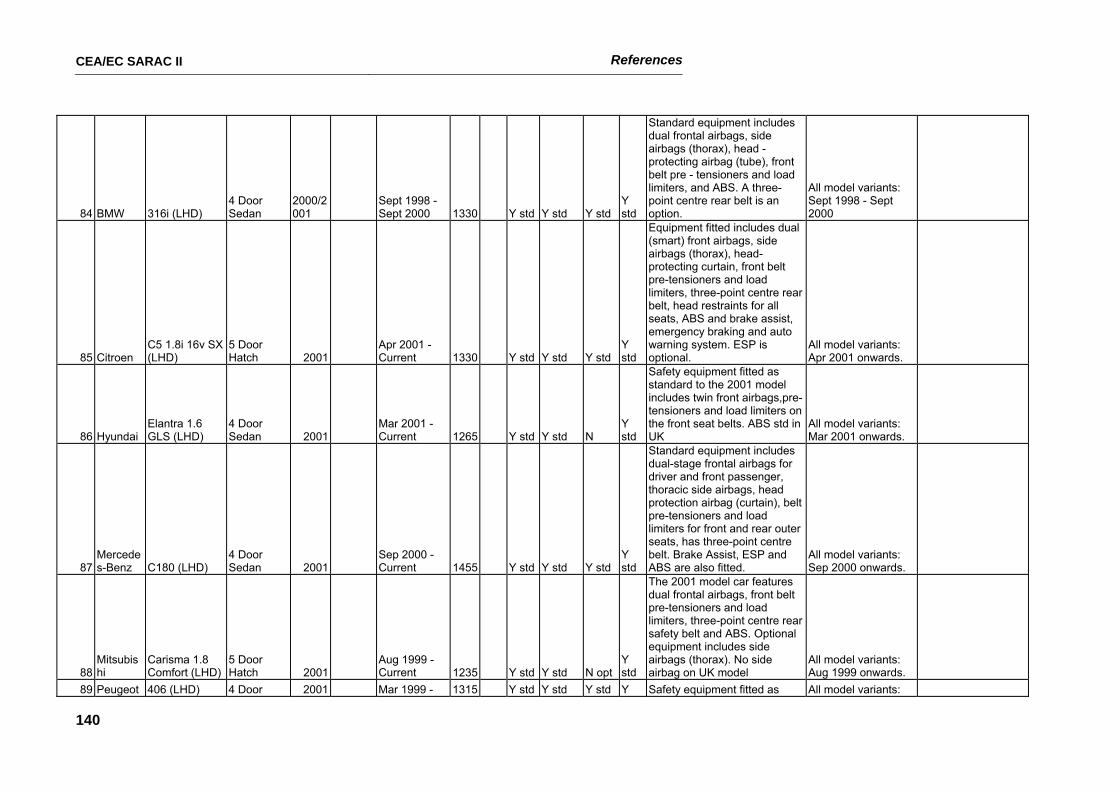
CEA/EC SARAC II References
140
84 BMW 316i (LHD) 4 Door Sedan
2000/2001
Sept 1998 - Sept 2000 1330 Y std Y std Y std
Y std
Standard equipment includes dual frontal airbags, side airbags (thorax), head - protecting airbag (tube), front belt pre - tensioners and load limiters, and ABS. A three-point centre rear belt is an option.
All model variants: Sept 1998 - Sept 2000
85 Citroen C5 1.8i 16v SX (LHD)
5 Door Hatch 2001
Apr 2001 - Current 1330 Y std Y std Y std
Y std
Equipment fitted includes dual (smart) front airbags, side airbags (thorax), head-protecting curtain, front belt pre-tensioners and load limiters, three-point centre rear belt, head restraints for all seats, ABS and brake assist, emergency braking and auto warning system. ESP is optional.
All model variants: Apr 2001 onwards.
86 Hyundai Elantra 1.6 GLS (LHD)
4 Door Sedan 2001
Mar 2001 - Current 1265 Y std Y std N
Y std
Safety equipment fitted as standard to the 2001 model includes twin front airbags,pre-tensioners and load limiters on the front seat belts. ABS std in UK
All model variants: Mar 2001 onwards.
87 Mercedes-Benz C180 (LHD)
4 Door Sedan 2001
Sep 2000 - Current 1455 Y std Y std Y std
Y std
Standard equipment includes dual-stage frontal airbags for driver and front passenger, thoracic side airbags, head protection airbag (curtain), belt pre-tensioners and load limiters for front and rear outer seats, has three-point centre belt. Brake Assist, ESP and ABS are also fitted.
All model variants: Sep 2000 onwards.
88 Mitsubishi
Carisma 1.8 Comfort (LHD)
5 Door Hatch 2001
Aug 1999 - Current 1235 Y std Y std N opt
Y std
The 2001 model car features dual frontal airbags, front belt pre-tensioners and load limiters, three-point centre rear safety belt and ABS. Optional equipment includes side airbags (thorax). No side airbag on UK model
All model variants: Aug 1999 onwards.
89 Peugeot 406 (LHD) 4 Door 2001 Mar 1999 - 1315 Y std Y std Y std Y Safety equipment fitted as All model variants:
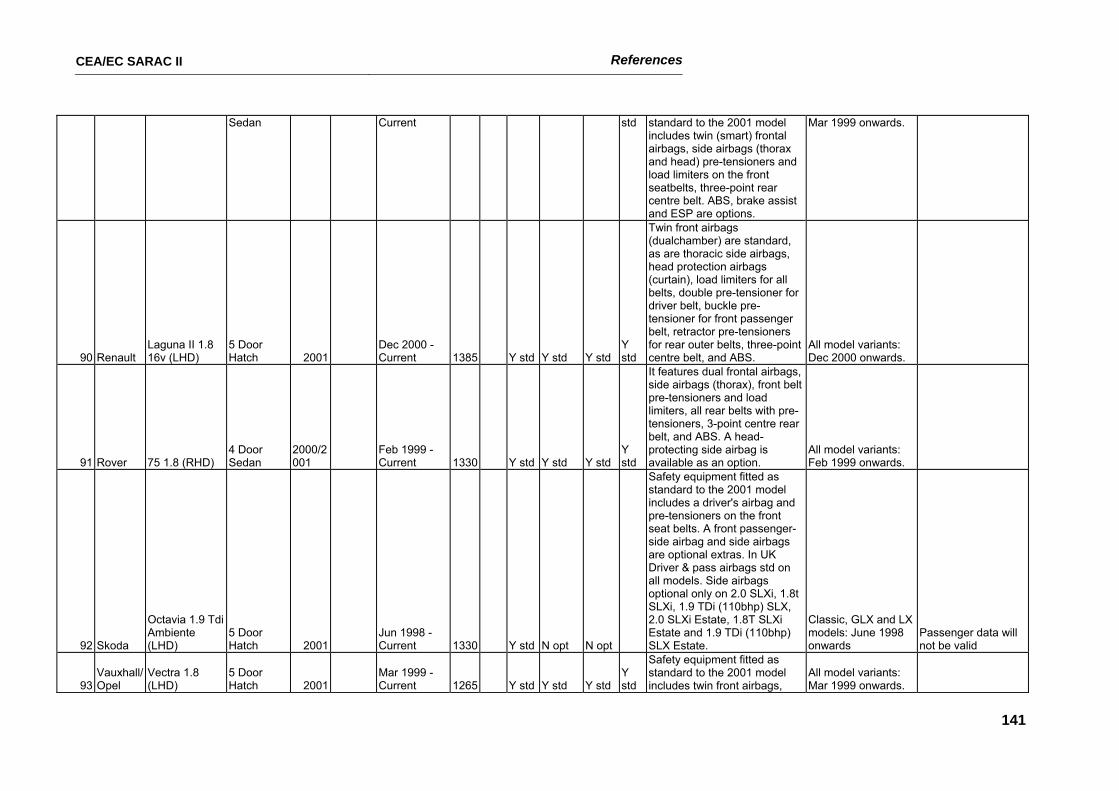
CEA/EC SARAC II References
141
Sedan Current std standard to the 2001 model includes twin (smart) frontal airbags, side airbags (thorax and head) pre-tensioners and load limiters on the front seatbelts, three-point rear centre belt. ABS, brake assist and ESP are options.
Mar 1999 onwards.
90 Renault Laguna II 1.8 16v (LHD)
5 Door Hatch 2001
Dec 2000 - Current 1385 Y std Y std Y std
Y std
Twin front airbags (dualchamber) are standard, as are thoracic side airbags, head protection airbags (curtain), load limiters for all belts, double pre-tensioner for driver belt, buckle pre-tensioner for front passenger belt, retractor pre-tensioners for rear outer belts, three-point centre belt, and ABS.
All model variants: Dec 2000 onwards.
91 Rover 75 1.8 (RHD) 4 Door Sedan
2000/2001
Feb 1999 - Current 1330 Y std Y std Y std
Y std
It features dual frontal airbags, side airbags (thorax), front belt pre-tensioners and load limiters, all rear belts with pre-tensioners, 3-point centre rear belt, and ABS. A head-protecting side airbag is available as an option.
All model variants: Feb 1999 onwards.
92 Skoda
Octavia 1.9 Tdi Ambiente (LHD)
5 Door Hatch 2001
Jun 1998 - Current 1330 Y std N opt N opt
Safety equipment fitted as standard to the 2001 model includes a driver's airbag and pre-tensioners on the front seat belts. A front passenger-side airbag and side airbags are optional extras. In UK Driver & pass airbags std on all models. Side airbags optional only on 2.0 SLXi, 1.8t SLXi, 1.9 TDi (110bhp) SLX, 2.0 SLXi Estate, 1.8T SLXi Estate and 1.9 TDi (110bhp) SLX Estate.
Classic, GLX and LX models: June 1998 onwards
Passenger data will not be valid
93 Vauxhall/Opel
Vectra 1.8 (LHD)
5 Door Hatch 2001
Mar 1999 - Current 1265 Y std Y std Y std
Y std
Safety equipment fitted as standard to the 2001 model includes twin front airbags,
All model variants: Mar 1999 onwards.
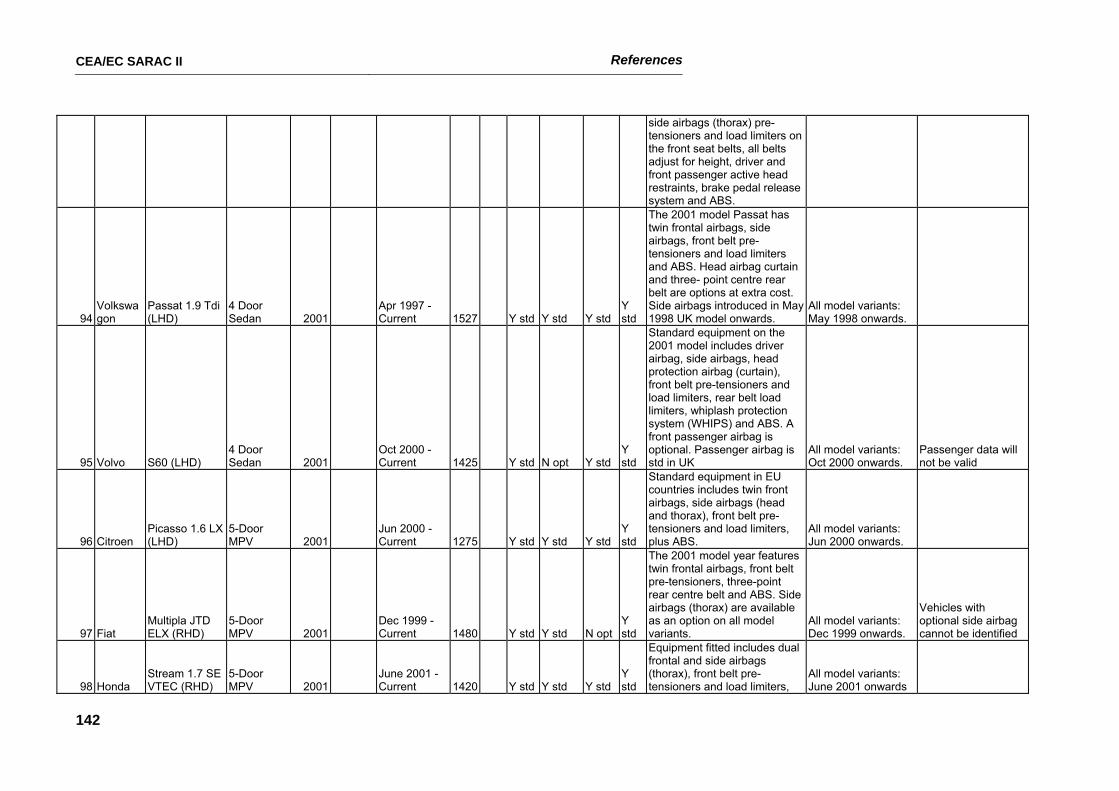
CEA/EC SARAC II References
142
side airbags (thorax) pre-tensioners and load limiters on the front seat belts, all belts adjust for height, driver and front passenger active head restraints, brake pedal release system and ABS.
94 Volkswagon
Passat 1.9 Tdi (LHD)
4 Door Sedan 2001
Apr 1997 - Current 1527 Y std Y std Y std
Y std
The 2001 model Passat has twin frontal airbags, side airbags, front belt pre-tensioners and load limiters and ABS. Head airbag curtain and three- point centre rear belt are options at extra cost. Side airbags introduced in May 1998 UK model onwards.
All model variants: May 1998 onwards.
95 Volvo S60 (LHD) 4 Door Sedan 2001
Oct 2000 - Current 1425 Y std N opt Y std
Y std
Standard equipment on the 2001 model includes driver airbag, side airbags, head protection airbag (curtain), front belt pre-tensioners and load limiters, rear belt load limiters, whiplash protection system (WHIPS) and ABS. A front passenger airbag is optional. Passenger airbag is std in UK
All model variants: Oct 2000 onwards.
Passenger data will not be valid
96 Citroen Picasso 1.6 LX (LHD)
5-Door MPV 2001
Jun 2000 - Current 1275 Y std Y std Y std
Y std
Standard equipment in EU countries includes twin front airbags, side airbags (head and thorax), front belt pre-tensioners and load limiters, plus ABS.
All model variants: Jun 2000 onwards.
97 Fiat Multipla JTD ELX (RHD)
5-Door MPV 2001
Dec 1999 - Current 1480 Y std Y std N opt
Y std
The 2001 model year features twin frontal airbags, front belt pre-tensioners, three-point rear centre belt and ABS. Side airbags (thorax) are available as an option on all model variants.
All model variants: Dec 1999 onwards.
Vehicles with optional side airbag cannot be identified
98 Honda Stream 1.7 SE VTEC (RHD)
5-Door MPV 2001
June 2001 - Current 1420 Y std Y std Y std
Y std
Equipment fitted includes dual frontal and side airbags (thorax), front belt pre-tensioners and load limiters,
All model variants: June 2001 onwards
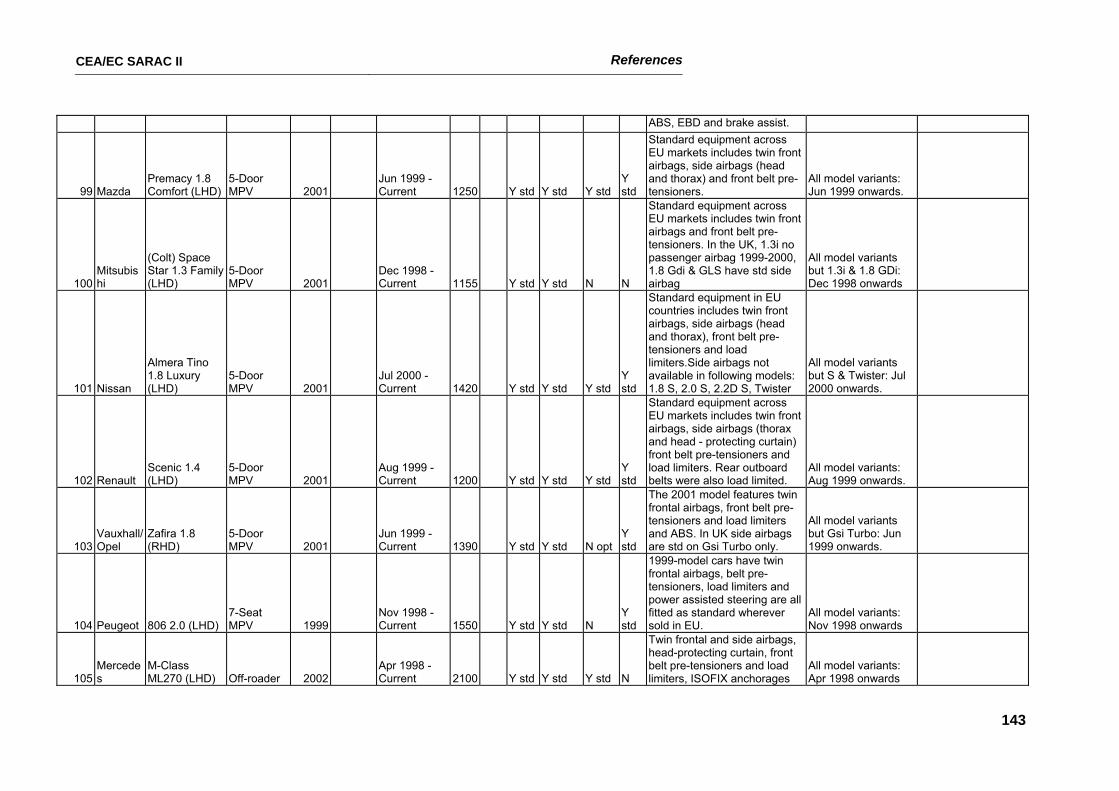
CEA/EC SARAC II References
143
ABS, EBD and brake assist.
99 Mazda Premacy 1.8 Comfort (LHD)
5-Door MPV 2001
Jun 1999 - Current 1250 Y std Y std Y std
Y std
Standard equipment across EU markets includes twin front airbags, side airbags (head and thorax) and front belt pre-tensioners.
All model variants: Jun 1999 onwards.
100 Mitsubishi
(Colt) Space Star 1.3 Family (LHD)
5-Door MPV 2001
Dec 1998 - Current 1155 Y std Y std N N
Standard equipment across EU markets includes twin front airbags and front belt pre-tensioners. In the UK, 1.3i no passenger airbag 1999-2000, 1.8 Gdi & GLS have std side airbag
All model variants but 1.3i & 1.8 GDi: Dec 1998 onwards
101 Nissan
Almera Tino 1.8 Luxury (LHD)
5-Door MPV 2001
Jul 2000 - Current 1420 Y std Y std Y std
Y std
Standard equipment in EU countries includes twin front airbags, side airbags (head and thorax), front belt pre-tensioners and load limiters.Side airbags not available in following models: 1.8 S, 2.0 S, 2.2D S, Twister
All model variants but S & Twister: Jul 2000 onwards.
102 Renault Scenic 1.4 (LHD)
5-Door MPV 2001
Aug 1999 - Current 1200 Y std Y std Y std
Y std
Standard equipment across EU markets includes twin front airbags, side airbags (thorax and head - protecting curtain) front belt pre-tensioners and load limiters. Rear outboard belts were also load limited.
All model variants: Aug 1999 onwards.
103 Vauxhall/Opel
Zafira 1.8 (RHD)
5-Door MPV 2001
Jun 1999 - Current 1390 Y std Y std N opt
Y std
The 2001 model features twin frontal airbags, front belt pre-tensioners and load limiters and ABS. In UK side airbags are std on Gsi Turbo only.
All model variants but Gsi Turbo: Jun 1999 onwards.
104 Peugeot 806 2.0 (LHD) 7-Seat MPV 1999
Nov 1998 - Current 1550 Y std Y std N
Y std
1999-model cars have twin frontal airbags, belt pre-tensioners, load limiters and power assisted steering are all fitted as standard wherever sold in EU.
All model variants: Nov 1998 onwards
105 Mercedes
M-Class ML270 (LHD) Off-roader 2002
Apr 1998 - Current 2100 Y std Y std Y std N
Twin frontal and side airbags, head-protecting curtain, front belt pre-tensioners and load limiters, ISOFIX anchorages
All model variants: Apr 1998 onwards
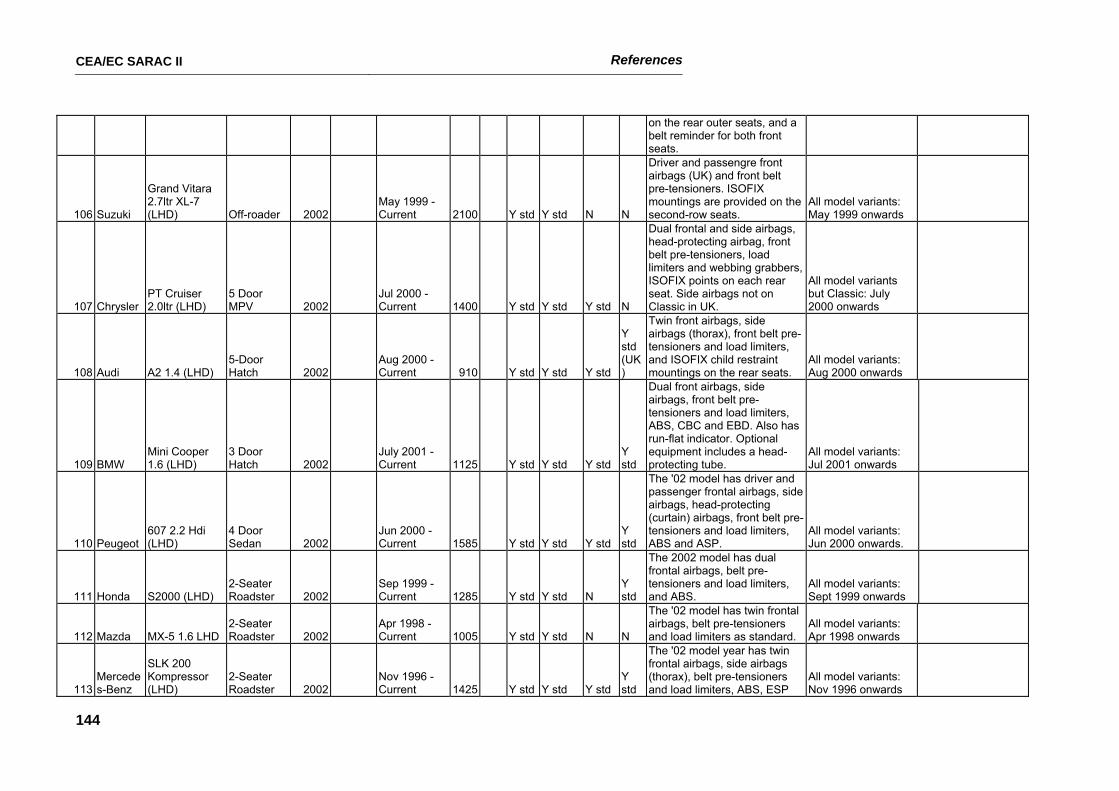
CEA/EC SARAC II References
144
on the rear outer seats, and a belt reminder for both front seats.
106 Suzuki
Grand Vitara 2.7ltr XL-7 (LHD) Off-roader 2002
May 1999 - Current 2100 Y std Y std N N
Driver and passengre front airbags (UK) and front belt pre-tensioners. ISOFIX mountings are provided on the second-row seats.
All model variants: May 1999 onwards
107 Chrysler PT Cruiser 2.0ltr (LHD)
5 Door MPV 2002
Jul 2000 - Current 1400 Y std Y std Y std N
Dual frontal and side airbags, head-protecting airbag, front belt pre-tensioners, load limiters and webbing grabbers, ISOFIX points on each rear seat. Side airbags not on Classic in UK.
All model variants but Classic: July 2000 onwards
108 Audi A2 1.4 (LHD) 5-Door Hatch 2002
Aug 2000 - Current 910 Y std Y std Y std
Y std (UK)
Twin front airbags, side airbags (thorax), front belt pre-tensioners and load limiters, and ISOFIX child restraint mountings on the rear seats.
All model variants: Aug 2000 onwards
109 BMW Mini Cooper 1.6 (LHD)
3 Door Hatch 2002
July 2001 - Current 1125 Y std Y std Y std
Y std
Dual front airbags, side airbags, front belt pre-tensioners and load limiters, ABS, CBC and EBD. Also has run-flat indicator. Optional equipment includes a head-protecting tube.
All model variants: Jul 2001 onwards
110 Peugeot 607 2.2 Hdi (LHD)
4 Door Sedan 2002
Jun 2000 - Current 1585 Y std Y std Y std
Y std
The '02 model has driver and passenger frontal airbags, side airbags, head-protecting (curtain) airbags, front belt pre-tensioners and load limiters, ABS and ASP.
All model variants: Jun 2000 onwards.
111 Honda S2000 (LHD) 2-Seater Roadster 2002
Sep 1999 - Current 1285 Y std Y std N
Y std
The 2002 model has dual frontal airbags, belt pre-tensioners and load limiters, and ABS.
All model variants: Sept 1999 onwards
112 Mazda MX-5 1.6 LHD 2-Seater Roadster 2002
Apr 1998 - Current 1005 Y std Y std N N
The '02 model has twin frontal airbags, belt pre-tensioners and load limiters as standard.
All model variants: Apr 1998 onwards
113 Mercedes-Benz
SLK 200 Kompressor (LHD)
2-Seater Roadster 2002
Nov 1996 - Current 1425 Y std Y std Y std
Y std
The '02 model year has twin frontal airbags, side airbags (thorax), belt pre-tensioners and load limiters, ABS, ESP
All model variants: Nov 1996 onwards
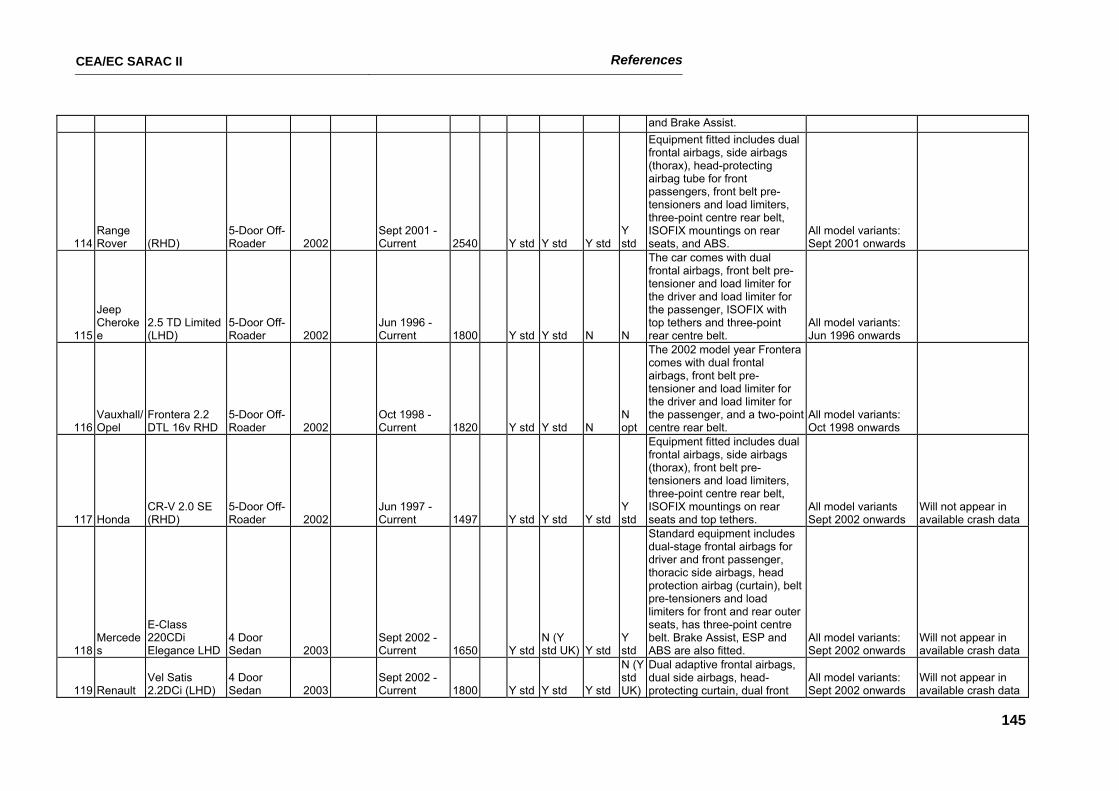
CEA/EC SARAC II References
145
and Brake Assist.
114 Range Rover (RHD)
5-Door Off-Roader 2002
Sept 2001 - Current 2540 Y std Y std Y std
Y std
Equipment fitted includes dual frontal airbags, side airbags (thorax), head-protecting airbag tube for front passengers, front belt pre-tensioners and load limiters, three-point centre rear belt, ISOFIX mountings on rear seats, and ABS.
All model variants: Sept 2001 onwards
115
Jeep Cherokee
2.5 TD Limited (LHD)
5-Door Off-Roader 2002
Jun 1996 - Current 1800 Y std Y std N N
The car comes with dual frontal airbags, front belt pre-tensioner and load limiter for the driver and load limiter for the passenger, ISOFIX with top tethers and three-point rear centre belt.
All model variants: Jun 1996 onwards
116 Vauxhall/Opel
Frontera 2.2 DTL 16v RHD
5-Door Off-Roader 2002
Oct 1998 - Current 1820 Y std Y std N
N opt
The 2002 model year Frontera comes with dual frontal airbags, front belt pre-tensioner and load limiter for the driver and load limiter for the passenger, and a two-point centre rear belt.
All model variants: Oct 1998 onwards
117 Honda CR-V 2.0 SE (RHD)
5-Door Off-Roader 2002
Jun 1997 - Current 1497 Y std Y std Y std
Y std
Equipment fitted includes dual frontal airbags, side airbags (thorax), front belt pre-tensioners and load limiters, three-point centre rear belt, ISOFIX mountings on rear seats and top tethers.
All model variants Sept 2002 onwards
Will not appear in available crash data
118 Mercedes
E-Class 220CDi Elegance LHD
4 Door Sedan 2003
Sept 2002 - Current 1650 Y std
N (Y std UK) Y std
Y std
Standard equipment includes dual-stage frontal airbags for driver and front passenger, thoracic side airbags, head protection airbag (curtain), belt pre-tensioners and load limiters for front and rear outer seats, has three-point centre belt. Brake Assist, ESP and ABS are also fitted.
All model variants: Sept 2002 onwards
Will not appear in available crash data
119 Renault Vel Satis 2.2DCi (LHD)
4 Door Sedan 2003
Sept 2002 - Current 1800 Y std Y std Y std
N (Y std UK)
Dual adaptive frontal airbags, dual side airbags, head-protecting curtain, dual front
All model variants: Sept 2002 onwards
Will not appear in available crash data
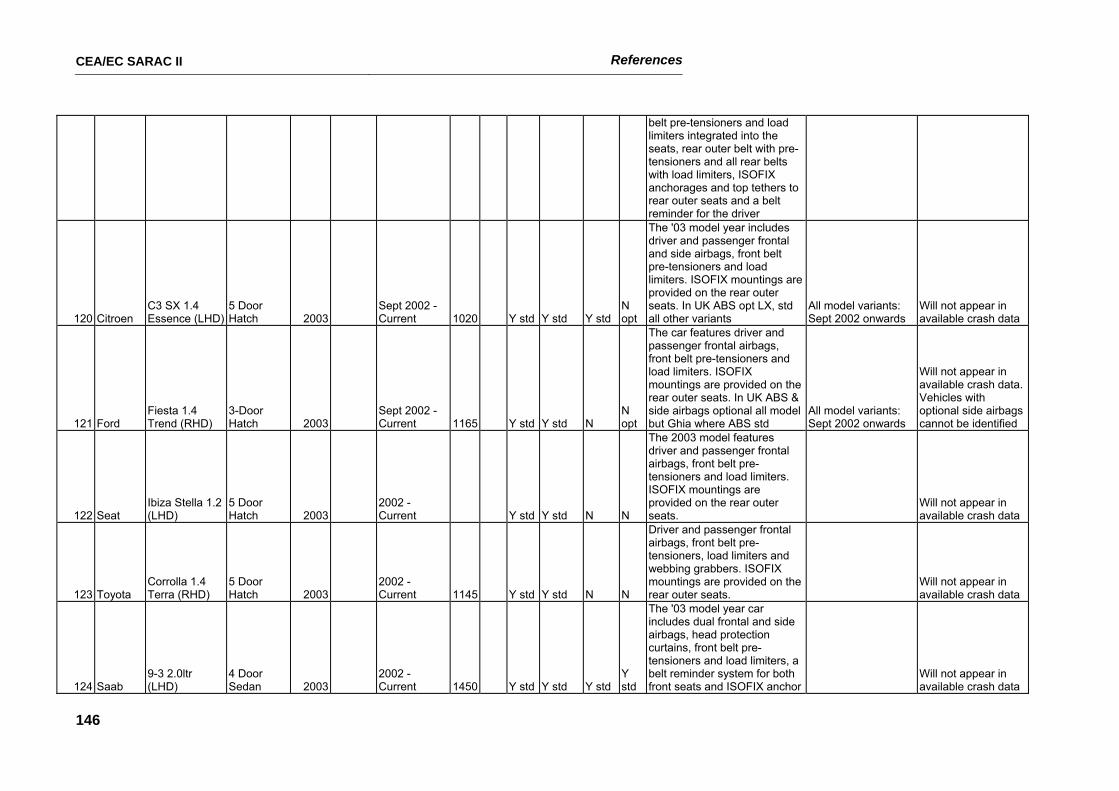
CEA/EC SARAC II References
146
belt pre-tensioners and load limiters integrated into the seats, rear outer belt with pre-tensioners and all rear belts with load limiters, ISOFIX anchorages and top tethers to rear outer seats and a belt reminder for the driver
120 Citroen C3 SX 1.4 Essence (LHD)
5 Door Hatch 2003
Sept 2002 - Current 1020 Y std Y std Y std
N opt
The '03 model year includes driver and passenger frontal and side airbags, front belt pre-tensioners and load limiters. ISOFIX mountings are provided on the rear outer seats. In UK ABS opt LX, std all other variants
All model variants: Sept 2002 onwards
Will not appear in available crash data
121 Ford Fiesta 1.4 Trend (RHD)
3-Door Hatch 2003
Sept 2002 - Current 1165 Y std Y std N
N opt
The car features driver and passenger frontal airbags, front belt pre-tensioners and load limiters. ISOFIX mountings are provided on the rear outer seats. In UK ABS & side airbags optional all model but Ghia where ABS std
All model variants: Sept 2002 onwards
Will not appear in available crash data. Vehicles with optional side airbags cannot be identified
122 Seat Ibiza Stella 1.2 (LHD)
5 Door Hatch 2003
2002 - Current Y std Y std N N
The 2003 model features driver and passenger frontal airbags, front belt pre-tensioners and load limiters. ISOFIX mountings are provided on the rear outer seats.
Will not appear in available crash data
123 Toyota Corrolla 1.4 Terra (RHD)
5 Door Hatch 2003
2002 - Current 1145 Y std Y std N N
Driver and passenger frontal airbags, front belt pre-tensioners, load limiters and webbing grabbers. ISOFIX mountings are provided on the rear outer seats.
Will not appear in available crash data
124 Saab 9-3 2.0ltr (LHD)
4 Door Sedan 2003
2002 - Current 1450 Y std Y std Y std
Y std
The '03 model year car includes dual frontal and side airbags, head protection curtains, front belt pre-tensioners and load limiters, a belt reminder system for both front seats and ISOFIX anchor
Will not appear in available crash data
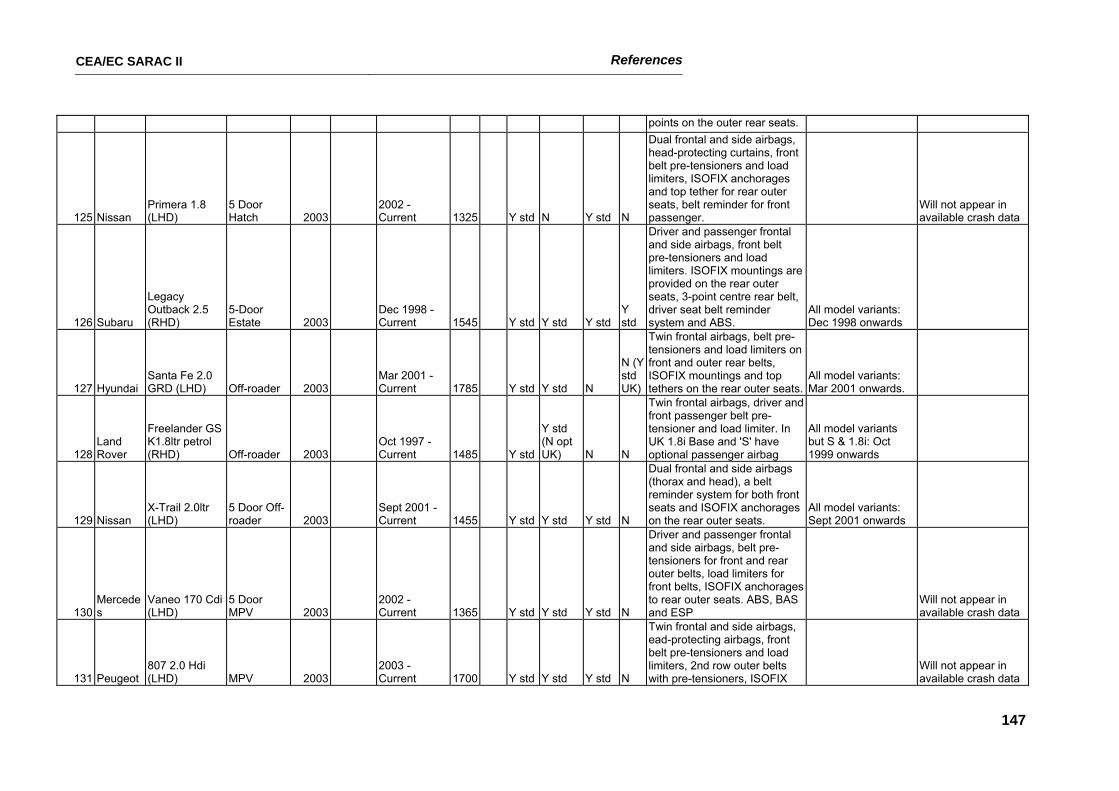
CEA/EC SARAC II References
147
points on the outer rear seats.
125 Nissan Primera 1.8 (LHD)
5 Door Hatch 2003
2002 - Current 1325 Y std N Y std N
Dual frontal and side airbags, head-protecting curtains, front belt pre-tensioners and load limiters, ISOFIX anchorages and top tether for rear outer seats, belt reminder for front passenger.
Will not appear in available crash data
126 Subaru
Legacy Outback 2.5 (RHD)
5-Door Estate 2003
Dec 1998 - Current 1545 Y std Y std Y std
Y std
Driver and passenger frontal and side airbags, front belt pre-tensioners and load limiters. ISOFIX mountings are provided on the rear outer seats, 3-point centre rear belt, driver seat belt reminder system and ABS.
All model variants: Dec 1998 onwards
127 Hyundai Santa Fe 2.0 GRD (LHD) Off-roader 2003
Mar 2001 - Current 1785 Y std Y std N
N (Y std UK)
Twin frontal airbags, belt pre-tensioners and load limiters on front and outer rear belts, ISOFIX mountings and top tethers on the rear outer seats.
All model variants: Mar 2001 onwards.
128 Land Rover
Freelander GS K1.8ltr petrol (RHD) Off-roader 2003
Oct 1997 - Current 1485 Y std
Y std (N opt UK) N N
Twin frontal airbags, driver and front passenger belt pre-tensioner and load limiter. In UK 1.8i Base and 'S' have optional passenger airbag
All model variants but S & 1.8i: Oct 1999 onwards
129 Nissan X-Trail 2.0ltr (LHD)
5 Door Off-roader 2003
Sept 2001 - Current 1455 Y std Y std Y std N
Dual frontal and side airbags (thorax and head), a belt reminder system for both front seats and ISOFIX anchorages on the rear outer seats.
All model variants: Sept 2001 onwards
130 Mercedes
Vaneo 170 Cdi (LHD)
5 Door MPV 2003
2002 - Current 1365 Y std Y std Y std N
Driver and passenger frontal and side airbags, belt pre-tensioners for front and rear outer belts, load limiters for front belts, ISOFIX anchorages to rear outer seats. ABS, BAS and ESP
Will not appear in available crash data
131 Peugeot 807 2.0 Hdi (LHD) MPV 2003
2003 - Current 1700 Y std Y std Y std N
Twin frontal and side airbags, ead-protecting airbags, front belt pre-tensioners and load limiters, 2nd row outer belts with pre-tensioners, ISOFIX
Will not appear in available crash data
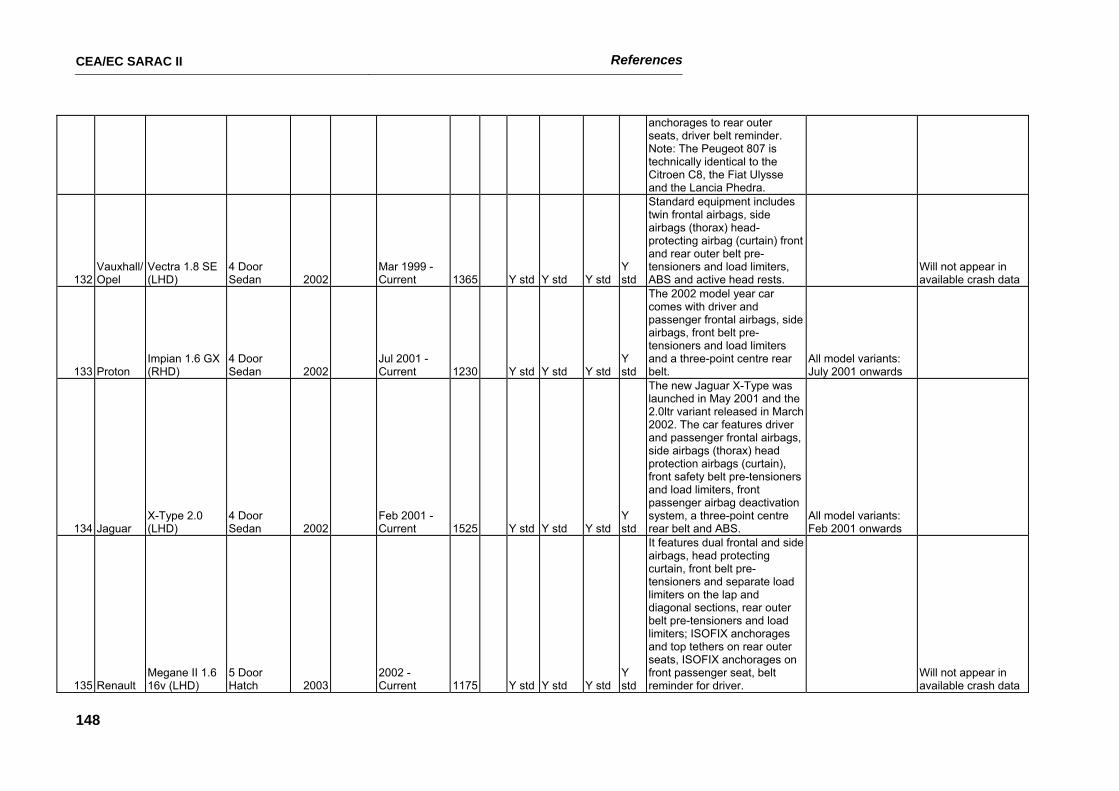
CEA/EC SARAC II References
148
anchorages to rear outer seats, driver belt reminder. Note: The Peugeot 807 is technically identical to the Citroen C8, the Fiat Ulysse and the Lancia Phedra.
132 Vauxhall/Opel
Vectra 1.8 SE (LHD)
4 Door Sedan 2002
Mar 1999 - Current 1365 Y std Y std Y std
Y std
Standard equipment includes twin frontal airbags, side airbags (thorax) head-protecting airbag (curtain) front and rear outer belt pre-tensioners and load limiters, ABS and active head rests.
Will not appear in available crash data
133 Proton Impian 1.6 GX (RHD)
4 Door Sedan 2002
Jul 2001 - Current 1230 Y std Y std Y std
Y std
The 2002 model year car comes with driver and passenger frontal airbags, side airbags, front belt pre-tensioners and load limiters and a three-point centre rear belt.
All model variants: July 2001 onwards
134 Jaguar X-Type 2.0 (LHD)
4 Door Sedan 2002
Feb 2001 - Current 1525 Y std Y std Y std
Y std
The new Jaguar X-Type was launched in May 2001 and the 2.0ltr variant released in March 2002. The car features driver and passenger frontal airbags, side airbags (thorax) head protection airbags (curtain), front safety belt pre-tensioners and load limiters, front passenger airbag deactivation system, a three-point centre rear belt and ABS.
All model variants: Feb 2001 onwards
135 Renault Megane II 1.6 16v (LHD)
5 Door Hatch 2003
2002 - Current 1175 Y std Y std Y std
Y std
It features dual frontal and side airbags, head protecting curtain, front belt pre-tensioners and separate load limiters on the lap and diagonal sections, rear outer belt pre-tensioners and load limiters; ISOFIX anchorages and top tethers on rear outer seats, ISOFIX anchorages on front passenger seat, belt reminder for driver.
Will not appear in available crash data
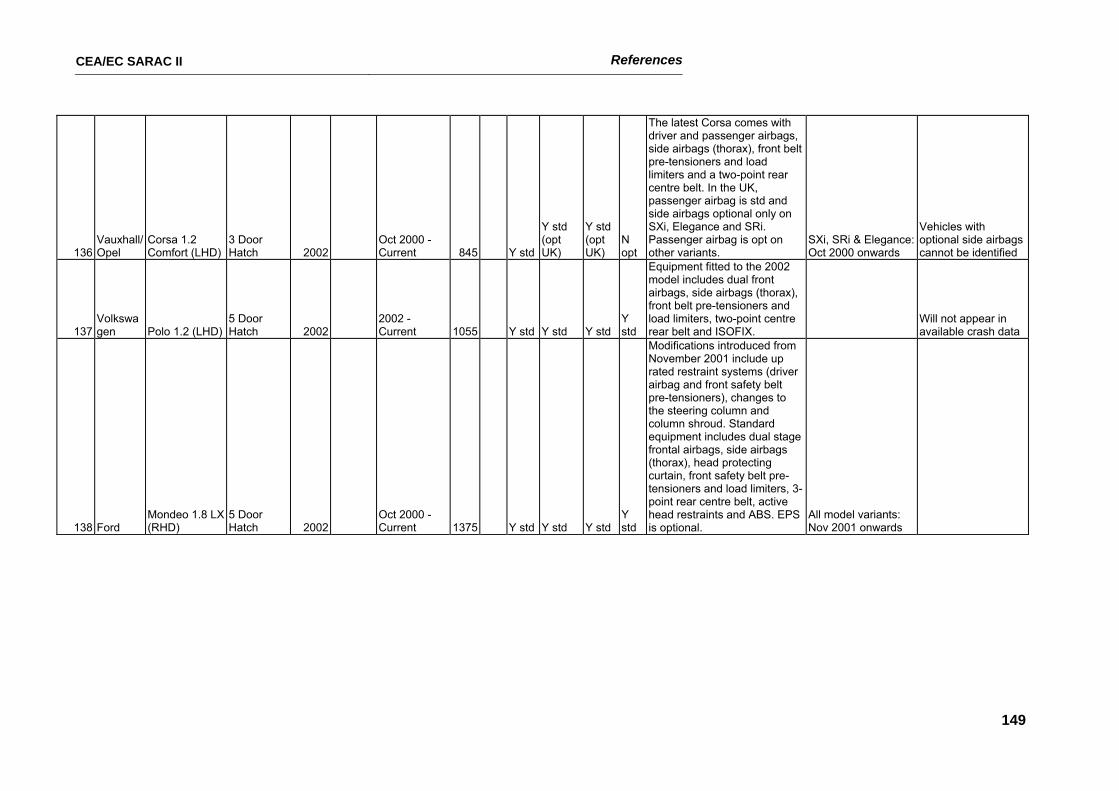
CEA/EC SARAC II References
149
136 Vauxhall/Opel
Corsa 1.2 Comfort (LHD)
3 Door Hatch 2002
Oct 2000 - Current 845 Y std
Y std (opt UK)
Y std (opt UK)
N opt
The latest Corsa comes with driver and passenger airbags, side airbags (thorax), front belt pre-tensioners and load limiters and a two-point rear centre belt. In the UK, passenger airbag is std and side airbags optional only on SXi, Elegance and SRi. Passenger airbag is opt on other variants.
SXi, SRi & Elegance: Oct 2000 onwards
Vehicles with optional side airbags cannot be identified
137 Volkswagen Polo 1.2 (LHD)
5 Door Hatch 2002
2002 - Current 1055 Y std Y std Y std
Y std
Equipment fitted to the 2002 model includes dual front airbags, side airbags (thorax), front belt pre-tensioners and load limiters, two-point centre rear belt and ISOFIX.
Will not appear in available crash data
138 Ford Mondeo 1.8 LX (RHD)
5 Door Hatch 2002
Oct 2000 - Current 1375 Y std Y std Y std
Y std
Modifications introduced from November 2001 include up rated restraint systems (driver airbag and front safety belt pre-tensioners), changes to the steering column and column shroud. Standard equipment includes dual stage frontal airbags, side airbags (thorax), head protecting curtain, front safety belt pre-tensioners and load limiters, 3-point rear centre belt, active head restraints and ABS. EPS is optional.
All model variants: Nov 2001 onwards
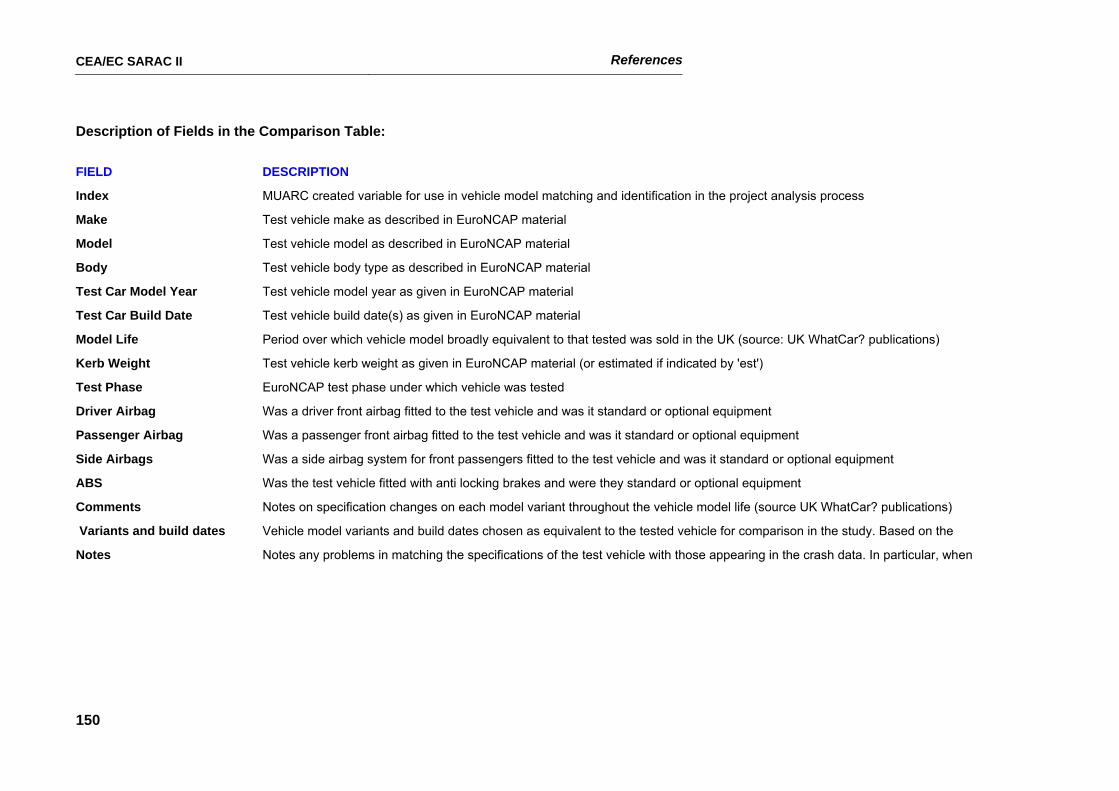
CEA/EC SARAC II References
150
Description of Fields in the Comparison Table:
FIELD DESCRIPTION
Index MUARC created variable for use in vehicle model matching and identification in the project analysis process
Make Test vehicle make as described in EuroNCAP material
Model Test vehicle model as described in EuroNCAP material
Body Test vehicle body type as described in EuroNCAP material
Test Car Model Year Test vehicle model year as given in EuroNCAP material
Test Car Build Date Test vehicle build date(s) as given in EuroNCAP material
Model Life Period over which vehicle model broadly equivalent to that tested was sold in the UK (source: UK WhatCar? publications)
Kerb Weight Test vehicle kerb weight as given in EuroNCAP material (or estimated if indicated by 'est')
Test Phase EuroNCAP test phase under which vehicle was tested
Driver Airbag Was a driver front airbag fitted to the test vehicle and was it standard or optional equipment
Passenger Airbag Was a passenger front airbag fitted to the test vehicle and was it standard or optional equipment
Side Airbags Was a side airbag system for front passengers fitted to the test vehicle and was it standard or optional equipment
ABS Was the test vehicle fitted with anti locking brakes and were they standard or optional equipment
Comments Notes on specification changes on each model variant throughout the vehicle model life (source UK WhatCar? publications)
Variants and build dates Vehicle model variants and build dates chosen as equivalent to the tested vehicle for comparison in the study. Based on the
Notes Notes any problems in matching the specifications of the test vehicle with those appearing in the crash data. In particular, when
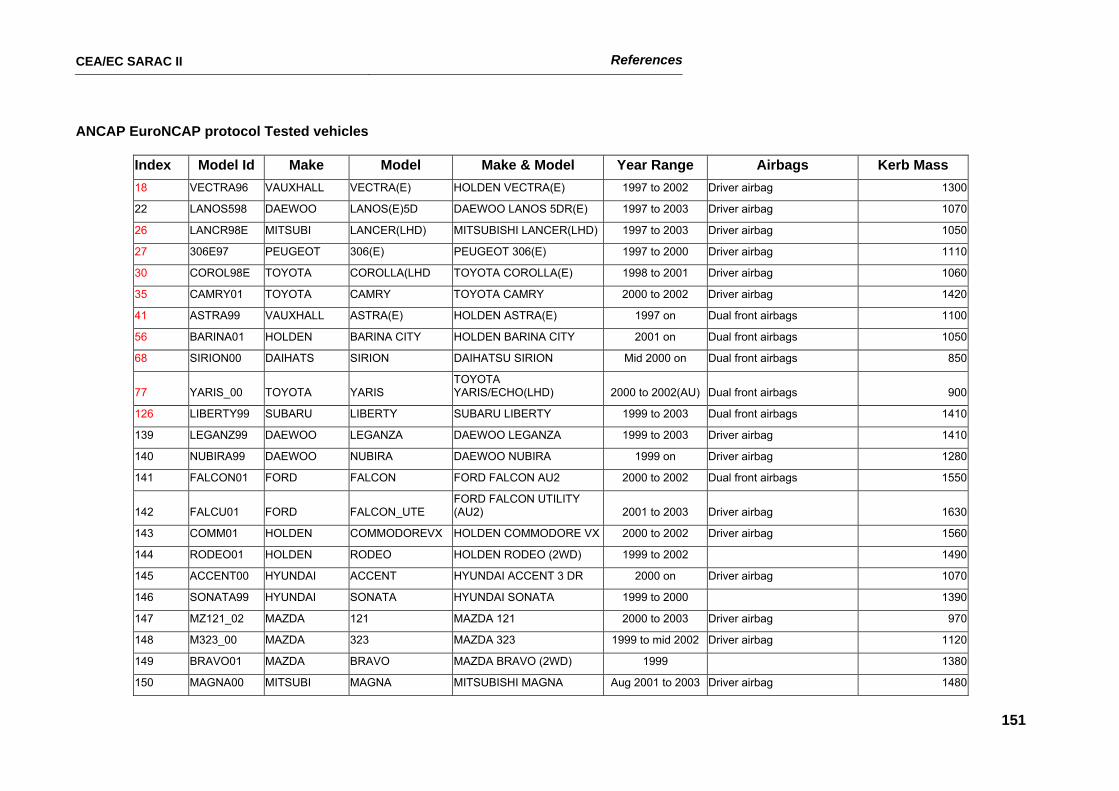
CEA/EC SARAC II References
151
ANCAP EuroNCAP protocol Tested vehicles
Index Model Id Make Model Make & Model Year Range Airbags Kerb Mass 18 VECTRA96 VAUXHALL VECTRA(E) HOLDEN VECTRA(E) 1997 to 2002 Driver airbag 1300
22 LANOS598 DAEWOO LANOS(E)5D DAEWOO LANOS 5DR(E) 1997 to 2003 Driver airbag 1070
26 LANCR98E MITSUBI LANCER(LHD) MITSUBISHI LANCER(LHD) 1997 to 2003 Driver airbag 1050
27 306E97 PEUGEOT 306(E) PEUGEOT 306(E) 1997 to 2000 Driver airbag 1110
30 COROL98E TOYOTA COROLLA(LHD TOYOTA COROLLA(E) 1998 to 2001 Driver airbag 1060
35 CAMRY01 TOYOTA CAMRY TOYOTA CAMRY 2000 to 2002 Driver airbag 1420
41 ASTRA99 VAUXHALL ASTRA(E) HOLDEN ASTRA(E) 1997 on Dual front airbags 1100
56 BARINA01 HOLDEN BARINA CITY HOLDEN BARINA CITY 2001 on Dual front airbags 1050
68 SIRION00 DAIHATS SIRION DAIHATSU SIRION Mid 2000 on Dual front airbags 850
77 YARIS_00 TOYOTA YARIS TOYOTA YARIS/ECHO(LHD) 2000 to 2002(AU) Dual front airbags 900
126 LIBERTY99 SUBARU LIBERTY SUBARU LIBERTY 1999 to 2003 Dual front airbags 1410
139 LEGANZ99 DAEWOO LEGANZA DAEWOO LEGANZA 1999 to 2003 Driver airbag 1410
140 NUBIRA99 DAEWOO NUBIRA DAEWOO NUBIRA 1999 on Driver airbag 1280
141 FALCON01 FORD FALCON FORD FALCON AU2 2000 to 2002 Dual front airbags 1550
142 FALCU01 FORD FALCON_UTE FORD FALCON UTILITY (AU2) 2001 to 2003 Driver airbag 1630
143 COMM01 HOLDEN COMMODOREVX HOLDEN COMMODORE VX 2000 to 2002 Driver airbag 1560
144 RODEO01 HOLDEN RODEO HOLDEN RODEO (2WD) 1999 to 2002 1490
145 ACCENT00 HYUNDAI ACCENT HYUNDAI ACCENT 3 DR 2000 on Driver airbag 1070
146 SONATA99 HYUNDAI SONATA HYUNDAI SONATA 1999 to 2000 1390
147 MZ121_02 MAZDA 121 MAZDA 121 2000 to 2003 Driver airbag 970
148 M323_00 MAZDA 323 MAZDA 323 1999 to mid 2002 Driver airbag 1120
149 BRAVO01 MAZDA BRAVO MAZDA BRAVO (2WD) 1999 1380
150 MAGNA00 MITSUBI MAGNA MITSUBISHI MAGNA Aug 2001 to 2003 Driver airbag 1480
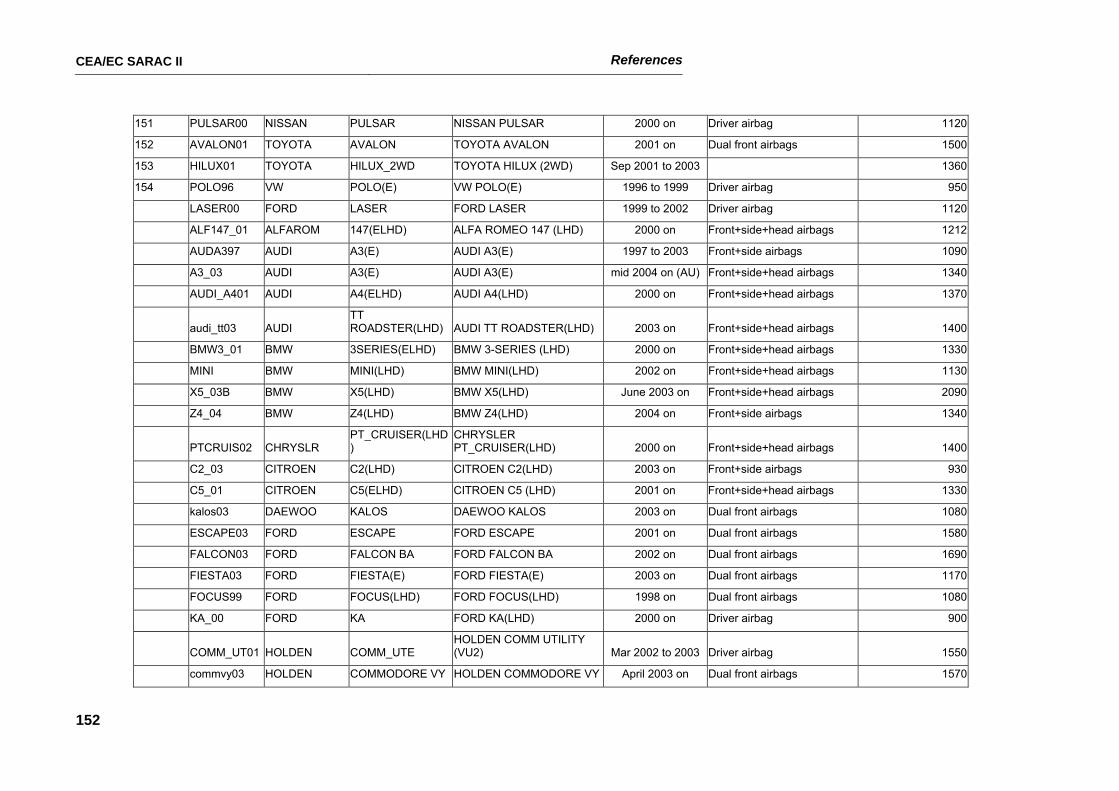
CEA/EC SARAC II References
152
151 PULSAR00 NISSAN PULSAR NISSAN PULSAR 2000 on Driver airbag 1120
152 AVALON01 TOYOTA AVALON TOYOTA AVALON 2001 on Dual front airbags 1500
153 HILUX01 TOYOTA HILUX_2WD TOYOTA HILUX (2WD) Sep 2001 to 2003 1360
154 POLO96 VW POLO(E) VW POLO(E) 1996 to 1999 Driver airbag 950
LASER00 FORD LASER FORD LASER 1999 to 2002 Driver airbag 1120
ALF147_01 ALFAROM 147(ELHD) ALFA ROMEO 147 (LHD) 2000 on Front+side+head airbags 1212
AUDA397 AUDI A3(E) AUDI A3(E) 1997 to 2003 Front+side airbags 1090
A3_03 AUDI A3(E) AUDI A3(E) mid 2004 on (AU) Front+side+head airbags 1340
AUDI_A401 AUDI A4(ELHD) AUDI A4(LHD) 2000 on Front+side+head airbags 1370
audi_tt03 AUDI TT ROADSTER(LHD) AUDI TT ROADSTER(LHD) 2003 on Front+side+head airbags 1400
BMW3_01 BMW 3SERIES(ELHD) BMW 3-SERIES (LHD) 2000 on Front+side+head airbags 1330
MINI BMW MINI(LHD) BMW MINI(LHD) 2002 on Front+side+head airbags 1130
X5_03B BMW X5(LHD) BMW X5(LHD) June 2003 on Front+side+head airbags 2090
Z4_04 BMW Z4(LHD) BMW Z4(LHD) 2004 on Front+side airbags 1340
PTCRUIS02 CHRYSLR PT_CRUISER(LHD)
CHRYSLER PT_CRUISER(LHD) 2000 on Front+side+head airbags 1400
C2_03 CITROEN C2(LHD) CITROEN C2(LHD) 2003 on Front+side airbags 930
C5_01 CITROEN C5(ELHD) CITROEN C5 (LHD) 2001 on Front+side+head airbags 1330
kalos03 DAEWOO KALOS DAEWOO KALOS 2003 on Dual front airbags 1080
ESCAPE03 FORD ESCAPE FORD ESCAPE 2001 on Dual front airbags 1580
FALCON03 FORD FALCON BA FORD FALCON BA 2002 on Dual front airbags 1690
FIESTA03 FORD FIESTA(E) FORD FIESTA(E) 2003 on Dual front airbags 1170
FOCUS99 FORD FOCUS(LHD) FORD FOCUS(LHD) 1998 on Dual front airbags 1080
KA_00 FORD KA FORD KA(LHD) 2000 on Driver airbag 900
COMM_UT01 HOLDEN COMM_UTE HOLDEN COMM UTILITY (VU2) Mar 2002 to 2003 Driver airbag 1550
commvy03 HOLDEN COMMODORE VY HOLDEN COMMODORE VY April 2003 on Dual front airbags 1570
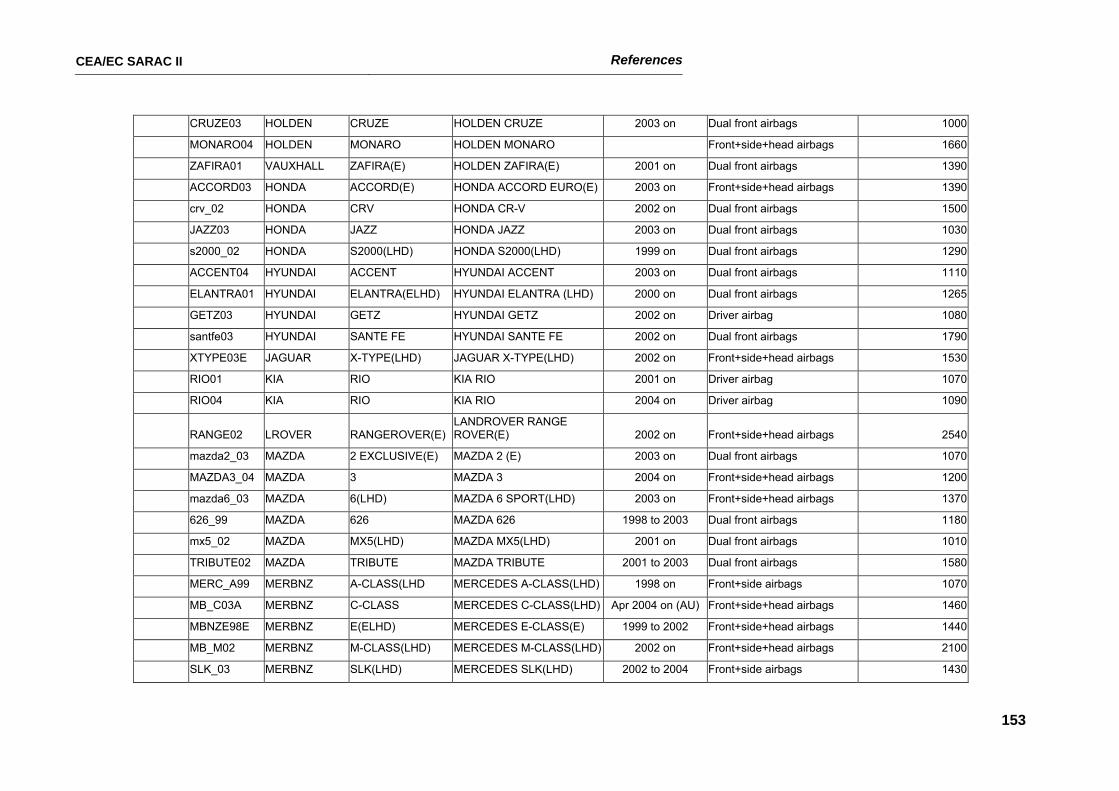
CEA/EC SARAC II References
153
CRUZE03 HOLDEN CRUZE HOLDEN CRUZE 2003 on Dual front airbags 1000
MONARO04 HOLDEN MONARO HOLDEN MONARO Front+side+head airbags 1660
ZAFIRA01 VAUXHALL ZAFIRA(E) HOLDEN ZAFIRA(E) 2001 on Dual front airbags 1390
ACCORD03 HONDA ACCORD(E) HONDA ACCORD EURO(E) 2003 on Front+side+head airbags 1390
crv_02 HONDA CRV HONDA CR-V 2002 on Dual front airbags 1500
JAZZ03 HONDA JAZZ HONDA JAZZ 2003 on Dual front airbags 1030
s2000_02 HONDA S2000(LHD) HONDA S2000(LHD) 1999 on Dual front airbags 1290
ACCENT04 HYUNDAI ACCENT HYUNDAI ACCENT 2003 on Dual front airbags 1110
ELANTRA01 HYUNDAI ELANTRA(ELHD) HYUNDAI ELANTRA (LHD) 2000 on Dual front airbags 1265
GETZ03 HYUNDAI GETZ HYUNDAI GETZ 2002 on Driver airbag 1080
santfe03 HYUNDAI SANTE FE HYUNDAI SANTE FE 2002 on Dual front airbags 1790
XTYPE03E JAGUAR X-TYPE(LHD) JAGUAR X-TYPE(LHD) 2002 on Front+side+head airbags 1530
RIO01 KIA RIO KIA RIO 2001 on Driver airbag 1070
RIO04 KIA RIO KIA RIO 2004 on Driver airbag 1090
RANGE02 LROVER RANGEROVER(E) LANDROVER RANGE ROVER(E) 2002 on Front+side+head airbags 2540
mazda2_03 MAZDA 2 EXCLUSIVE(E) MAZDA 2 (E) 2003 on Dual front airbags 1070
MAZDA3_04 MAZDA 3 MAZDA 3 2004 on Front+side+head airbags 1200
mazda6_03 MAZDA 6(LHD) MAZDA 6 SPORT(LHD) 2003 on Front+side+head airbags 1370
626_99 MAZDA 626 MAZDA 626 1998 to 2003 Dual front airbags 1180
mx5_02 MAZDA MX5(LHD) MAZDA MX5(LHD) 2001 on Dual front airbags 1010
TRIBUTE02 MAZDA TRIBUTE MAZDA TRIBUTE 2001 to 2003 Dual front airbags 1580
MERC_A99 MERBNZ A-CLASS(LHD MERCEDES A-CLASS(LHD) 1998 on Front+side airbags 1070
MB_C03A MERBNZ C-CLASS MERCEDES C-CLASS(LHD) Apr 2004 on (AU) Front+side+head airbags 1460
MBNZE98E MERBNZ E(ELHD) MERCEDES E-CLASS(E) 1999 to 2002 Front+side+head airbags 1440
MB_M02 MERBNZ M-CLASS(LHD) MERCEDES M-CLASS(LHD) 2002 on Front+side+head airbags 2100
SLK_03 MERBNZ SLK(LHD) MERCEDES SLK(LHD) 2002 to 2004 Front+side airbags 1430
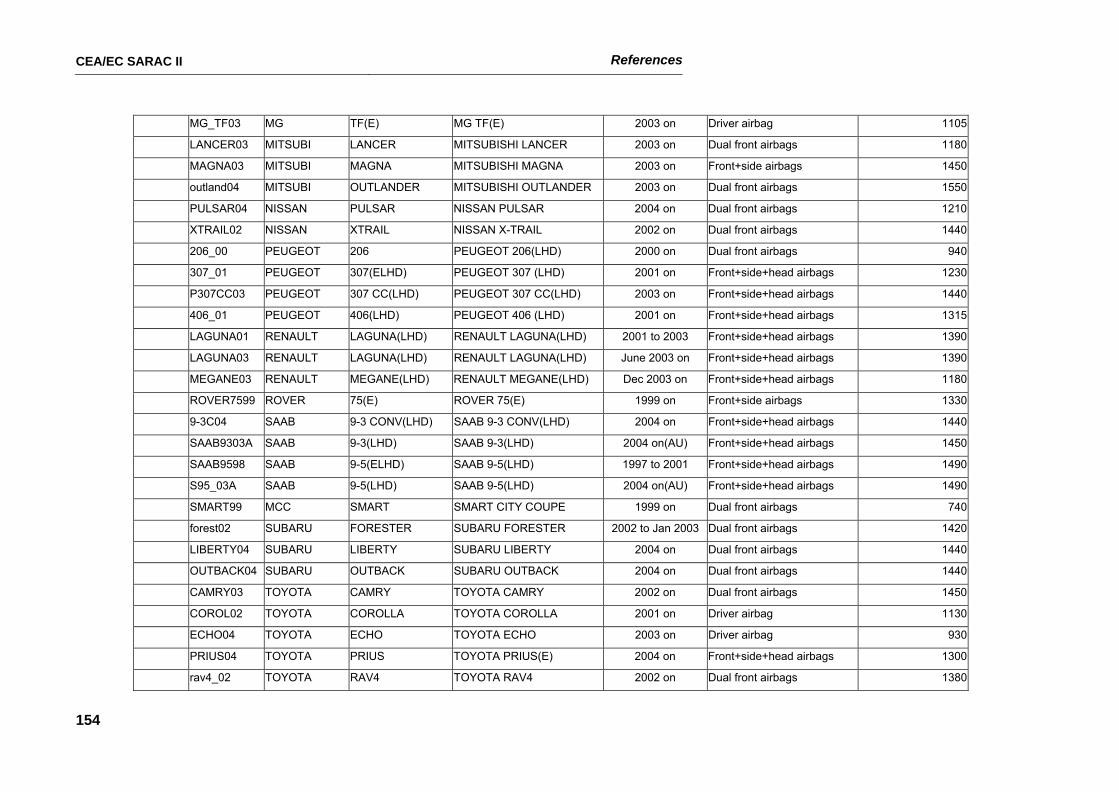
CEA/EC SARAC II References
154
MG_TF03 MG TF(E) MG TF(E) 2003 on Driver airbag 1105
LANCER03 MITSUBI LANCER MITSUBISHI LANCER 2003 on Dual front airbags 1180
MAGNA03 MITSUBI MAGNA MITSUBISHI MAGNA 2003 on Front+side airbags 1450
outland04 MITSUBI OUTLANDER MITSUBISHI OUTLANDER 2003 on Dual front airbags 1550
PULSAR04 NISSAN PULSAR NISSAN PULSAR 2004 on Dual front airbags 1210
XTRAIL02 NISSAN XTRAIL NISSAN X-TRAIL 2002 on Dual front airbags 1440
206_00 PEUGEOT 206 PEUGEOT 206(LHD) 2000 on Dual front airbags 940
307_01 PEUGEOT 307(ELHD) PEUGEOT 307 (LHD) 2001 on Front+side+head airbags 1230
P307CC03 PEUGEOT 307 CC(LHD) PEUGEOT 307 CC(LHD) 2003 on Front+side+head airbags 1440
406_01 PEUGEOT 406(LHD) PEUGEOT 406 (LHD) 2001 on Front+side+head airbags 1315
LAGUNA01 RENAULT LAGUNA(LHD) RENAULT LAGUNA(LHD) 2001 to 2003 Front+side+head airbags 1390
LAGUNA03 RENAULT LAGUNA(LHD) RENAULT LAGUNA(LHD) June 2003 on Front+side+head airbags 1390
MEGANE03 RENAULT MEGANE(LHD) RENAULT MEGANE(LHD) Dec 2003 on Front+side+head airbags 1180
ROVER7599 ROVER 75(E) ROVER 75(E) 1999 on Front+side airbags 1330
9-3C04 SAAB 9-3 CONV(LHD) SAAB 9-3 CONV(LHD) 2004 on Front+side+head airbags 1440
SAAB9303A SAAB 9-3(LHD) SAAB 9-3(LHD) 2004 on(AU) Front+side+head airbags 1450
SAAB9598 SAAB 9-5(ELHD) SAAB 9-5(LHD) 1997 to 2001 Front+side+head airbags 1490
S95_03A SAAB 9-5(LHD) SAAB 9-5(LHD) 2004 on(AU) Front+side+head airbags 1490
SMART99 MCC SMART SMART CITY COUPE 1999 on Dual front airbags 740
forest02 SUBARU FORESTER SUBARU FORESTER 2002 to Jan 2003 Dual front airbags 1420
LIBERTY04 SUBARU LIBERTY SUBARU LIBERTY 2004 on Dual front airbags 1440
OUTBACK04 SUBARU OUTBACK SUBARU OUTBACK 2004 on Dual front airbags 1440
CAMRY03 TOYOTA CAMRY TOYOTA CAMRY 2002 on Dual front airbags 1450
COROL02 TOYOTA COROLLA TOYOTA COROLLA 2001 on Driver airbag 1130
ECHO04 TOYOTA ECHO TOYOTA ECHO 2003 on Driver airbag 930
PRIUS04 TOYOTA PRIUS TOYOTA PRIUS(E) 2004 on Front+side+head airbags 1300
rav4_02 TOYOTA RAV4 TOYOTA RAV4 2002 on Dual front airbags 1380
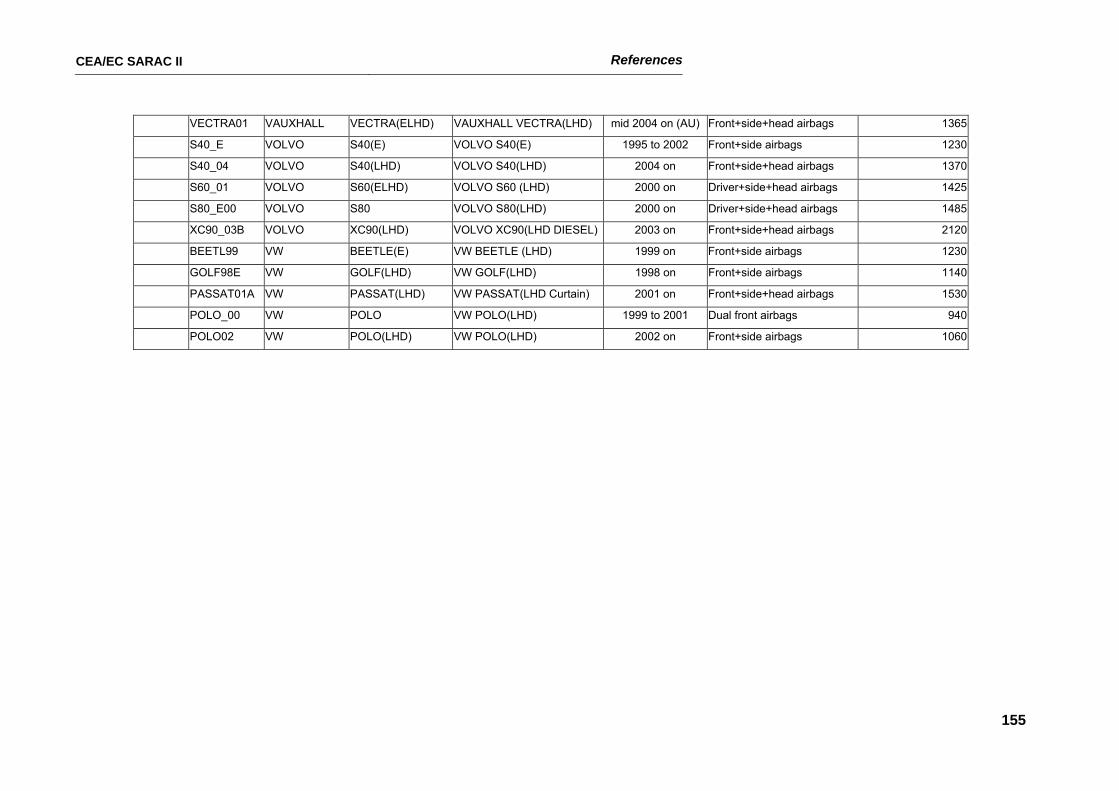
CEA/EC SARAC II References
155
VECTRA01 VAUXHALL VECTRA(ELHD) VAUXHALL VECTRA(LHD) mid 2004 on (AU) Front+side+head airbags 1365
S40_E VOLVO S40(E) VOLVO S40(E) 1995 to 2002 Front+side airbags 1230
S40_04 VOLVO S40(LHD) VOLVO S40(LHD) 2004 on Front+side+head airbags 1370
S60_01 VOLVO S60(ELHD) VOLVO S60 (LHD) 2000 on Driver+side+head airbags 1425
S80_E00 VOLVO S80 VOLVO S80(LHD) 2000 on Driver+side+head airbags 1485
XC90_03B VOLVO XC90(LHD) VOLVO XC90(LHD DIESEL) 2003 on Front+side+head airbags 2120
BEETL99 VW BEETLE(E) VW BEETLE (LHD) 1999 on Front+side airbags 1230
GOLF98E VW GOLF(LHD) VW GOLF(LHD) 1998 on Front+side airbags 1140
PASSAT01A VW PASSAT(LHD) VW PASSAT(LHD Curtain) 2001 on Front+side+head airbags 1530
POLO_00 VW POLO VW POLO(LHD) 1999 to 2001 Dual front airbags 940
POLO02 VW POLO(LHD) VW POLO(LHD) 2002 on Front+side airbags 1060
CEA/EC SARAC II References
156
APPENDIX B
SAFETY RATINGS
ESTIMATED FROM BRITISH REAL CRASH DATA
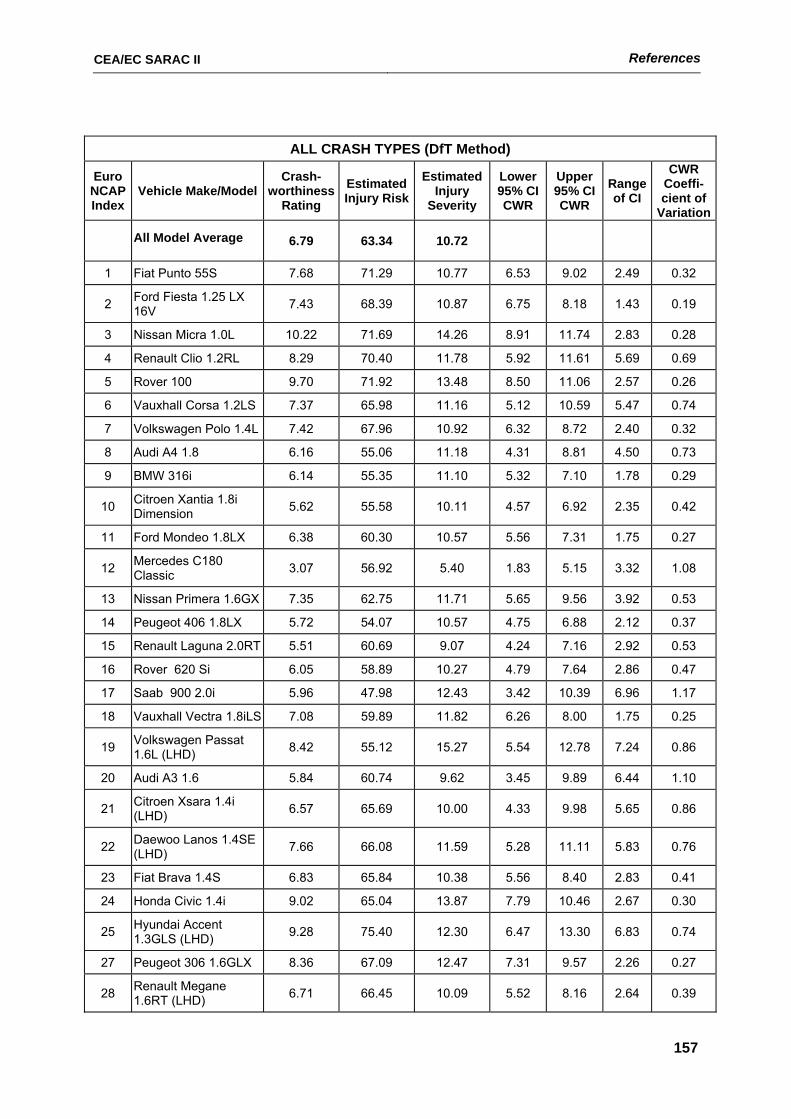
CEA/EC SARAC II References
157
ALL CRASH TYPES (DfT Method)
Euro NCAP Index
Vehicle Make/Model Crash-
worthiness Rating
Estimated Injury Risk
Estimated Injury
Severity
Lower 95% CI CWR
Upper 95% CI CWR
Range of CI
CWR Coeffi-cient of
Variation
All Model Average 6.79 63.34 10.72
1 Fiat Punto 55S 7.68 71.29 10.77 6.53 9.02 2.49 0.32
2 Ford Fiesta 1.25 LX 16V 7.43 68.39 10.87 6.75 8.18 1.43 0.19
3 Nissan Micra 1.0L 10.22 71.69 14.26 8.91 11.74 2.83 0.28
4 Renault Clio 1.2RL 8.29 70.40 11.78 5.92 11.61 5.69 0.69
5 Rover 100 9.70 71.92 13.48 8.50 11.06 2.57 0.26
6 Vauxhall Corsa 1.2LS 7.37 65.98 11.16 5.12 10.59 5.47 0.74
7 Volkswagen Polo 1.4L 7.42 67.96 10.92 6.32 8.72 2.40 0.32
8 Audi A4 1.8 6.16 55.06 11.18 4.31 8.81 4.50 0.73
9 BMW 316i 6.14 55.35 11.10 5.32 7.10 1.78 0.29
10 Citroen Xantia 1.8i Dimension 5.62 55.58 10.11 4.57 6.92 2.35 0.42
11 Ford Mondeo 1.8LX 6.38 60.30 10.57 5.56 7.31 1.75 0.27
12 Mercedes C180 Classic 3.07 56.92 5.40 1.83 5.15 3.32 1.08
13 Nissan Primera 1.6GX 7.35 62.75 11.71 5.65 9.56 3.92 0.53
14 Peugeot 406 1.8LX 5.72 54.07 10.57 4.75 6.88 2.12 0.37
15 Renault Laguna 2.0RT 5.51 60.69 9.07 4.24 7.16 2.92 0.53
16 Rover 620 Si 6.05 58.89 10.27 4.79 7.64 2.86 0.47
17 Saab 900 2.0i 5.96 47.98 12.43 3.42 10.39 6.96 1.17
18 Vauxhall Vectra 1.8iLS 7.08 59.89 11.82 6.26 8.00 1.75 0.25
19 Volkswagen Passat 1.6L (LHD) 8.42 55.12 15.27 5.54 12.78 7.24 0.86
20 Audi A3 1.6 5.84 60.74 9.62 3.45 9.89 6.44 1.10
21 Citroen Xsara 1.4i (LHD) 6.57 65.69 10.00 4.33 9.98 5.65 0.86
22 Daewoo Lanos 1.4SE (LHD) 7.66 66.08 11.59 5.28 11.11 5.83 0.76
23 Fiat Brava 1.4S 6.83 65.84 10.38 5.56 8.40 2.83 0.41
24 Honda Civic 1.4i 9.02 65.04 13.87 7.79 10.46 2.67 0.30
25 Hyundai Accent 1.3GLS (LHD) 9.28 75.40 12.30 6.47 13.30 6.83 0.74
27 Peugeot 306 1.6GLX 8.36 67.09 12.47 7.31 9.57 2.26 0.27
28 Renault Megane 1.6RT (LHD) 6.71 66.45 10.09 5.52 8.16 2.64 0.39
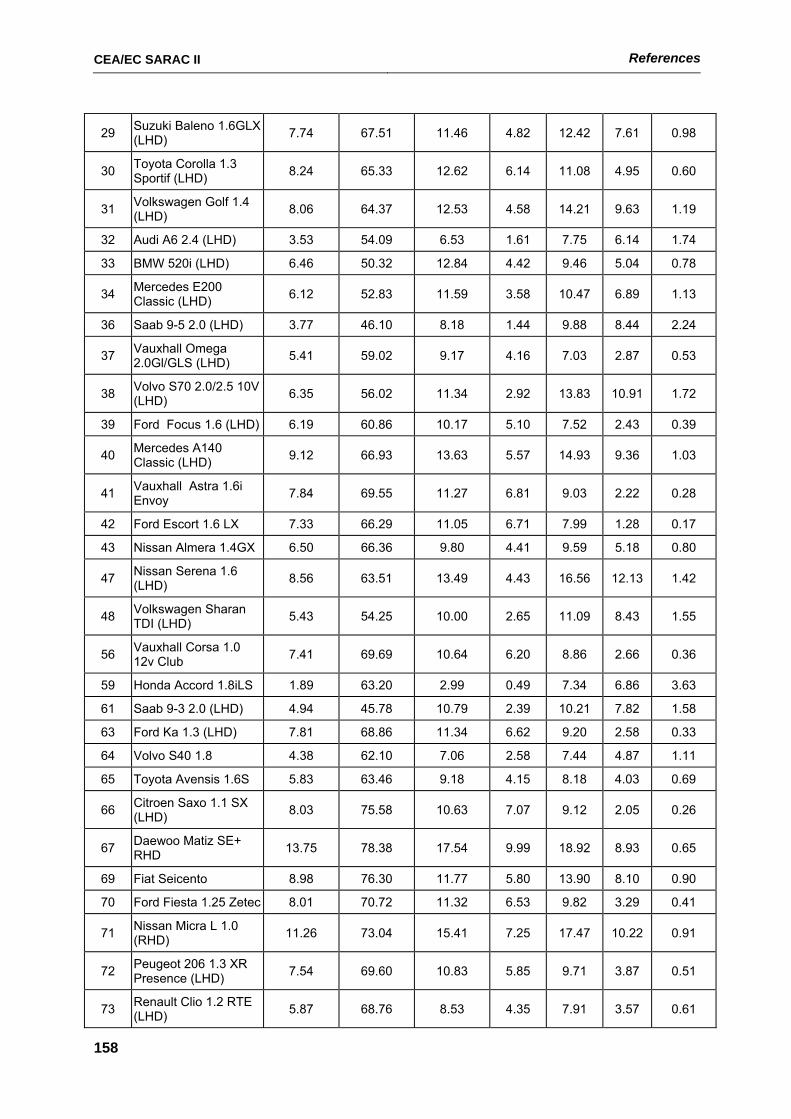
CEA/EC SARAC II References
158
29 Suzuki Baleno 1.6GLX (LHD) 7.74 67.51 11.46 4.82 12.42 7.61 0.98
30 Toyota Corolla 1.3 Sportif (LHD) 8.24 65.33 12.62 6.14 11.08 4.95 0.60
31 Volkswagen Golf 1.4 (LHD) 8.06 64.37 12.53 4.58 14.21 9.63 1.19
32 Audi A6 2.4 (LHD) 3.53 54.09 6.53 1.61 7.75 6.14 1.74
33 BMW 520i (LHD) 6.46 50.32 12.84 4.42 9.46 5.04 0.78
34 Mercedes E200 Classic (LHD) 6.12 52.83 11.59 3.58 10.47 6.89 1.13
36 Saab 9-5 2.0 (LHD) 3.77 46.10 8.18 1.44 9.88 8.44 2.24
37 Vauxhall Omega 2.0Gl/GLS (LHD) 5.41 59.02 9.17 4.16 7.03 2.87 0.53
38 Volvo S70 2.0/2.5 10V (LHD) 6.35 56.02 11.34 2.92 13.83 10.91 1.72
39 Ford Focus 1.6 (LHD) 6.19 60.86 10.17 5.10 7.52 2.43 0.39
40 Mercedes A140 Classic (LHD) 9.12 66.93 13.63 5.57 14.93 9.36 1.03
41 Vauxhall Astra 1.6i Envoy 7.84 69.55 11.27 6.81 9.03 2.22 0.28
42 Ford Escort 1.6 LX 7.33 66.29 11.05 6.71 7.99 1.28 0.17
43 Nissan Almera 1.4GX 6.50 66.36 9.80 4.41 9.59 5.18 0.80
47 Nissan Serena 1.6 (LHD) 8.56 63.51 13.49 4.43 16.56 12.13 1.42
48 Volkswagen Sharan TDI (LHD) 5.43 54.25 10.00 2.65 11.09 8.43 1.55
56 Vauxhall Corsa 1.0 12v Club 7.41 69.69 10.64 6.20 8.86 2.66 0.36
59 Honda Accord 1.8iLS 1.89 63.20 2.99 0.49 7.34 6.86 3.63
61 Saab 9-3 2.0 (LHD) 4.94 45.78 10.79 2.39 10.21 7.82 1.58
63 Ford Ka 1.3 (LHD) 7.81 68.86 11.34 6.62 9.20 2.58 0.33
64 Volvo S40 1.8 4.38 62.10 7.06 2.58 7.44 4.87 1.11
65 Toyota Avensis 1.6S 5.83 63.46 9.18 4.15 8.18 4.03 0.69
66 Citroen Saxo 1.1 SX (LHD) 8.03 75.58 10.63 7.07 9.12 2.05 0.26
67 Daewoo Matiz SE+ RHD 13.75 78.38 17.54 9.99 18.92 8.93 0.65
69 Fiat Seicento 8.98 76.30 11.77 5.80 13.90 8.10 0.90
70 Ford Fiesta 1.25 Zetec 8.01 70.72 11.32 6.53 9.82 3.29 0.41
71 Nissan Micra L 1.0 (RHD) 11.26 73.04 15.41 7.25 17.47 10.22 0.91
72 Peugeot 206 1.3 XR Presence (LHD) 7.54 69.60 10.83 5.85 9.71 3.87 0.51
73 Renault Clio 1.2 RTE (LHD) 5.87 68.76 8.53 4.35 7.91 3.57 0.61
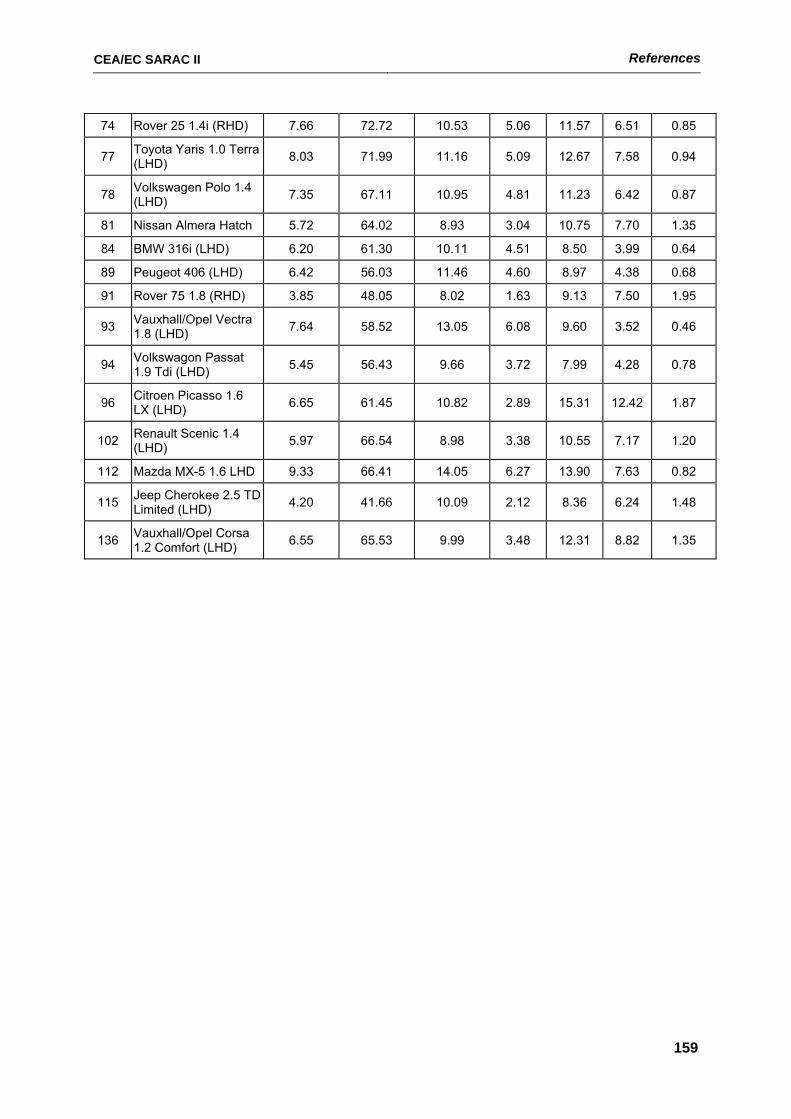
CEA/EC SARAC II References
159
74 Rover 25 1.4i (RHD) 7.66 72.72 10.53 5.06 11.57 6.51 0.85
77 Toyota Yaris 1.0 Terra (LHD) 8.03 71.99 11.16 5.09 12.67 7.58 0.94
78 Volkswagen Polo 1.4 (LHD) 7.35 67.11 10.95 4.81 11.23 6.42 0.87
81 Nissan Almera Hatch 5.72 64.02 8.93 3.04 10.75 7.70 1.35
84 BMW 316i (LHD) 6.20 61.30 10.11 4.51 8.50 3.99 0.64
89 Peugeot 406 (LHD) 6.42 56.03 11.46 4.60 8.97 4.38 0.68
91 Rover 75 1.8 (RHD) 3.85 48.05 8.02 1.63 9.13 7.50 1.95
93 Vauxhall/Opel Vectra 1.8 (LHD) 7.64 58.52 13.05 6.08 9.60 3.52 0.46
94 Volkswagon Passat 1.9 Tdi (LHD) 5.45 56.43 9.66 3.72 7.99 4.28 0.78
96 Citroen Picasso 1.6 LX (LHD) 6.65 61.45 10.82 2.89 15.31 12.42 1.87
102 Renault Scenic 1.4 (LHD) 5.97 66.54 8.98 3.38 10.55 7.17 1.20
112 Mazda MX-5 1.6 LHD 9.33 66.41 14.05 6.27 13.90 7.63 0.82
115 Jeep Cherokee 2.5 TD Limited (LHD) 4.20 41.66 10.09 2.12 8.36 6.24 1.48
136 Vauxhall/Opel Corsa 1.2 Comfort (LHD) 6.55 65.53 9.99 3.48 12.31 8.82 1.35
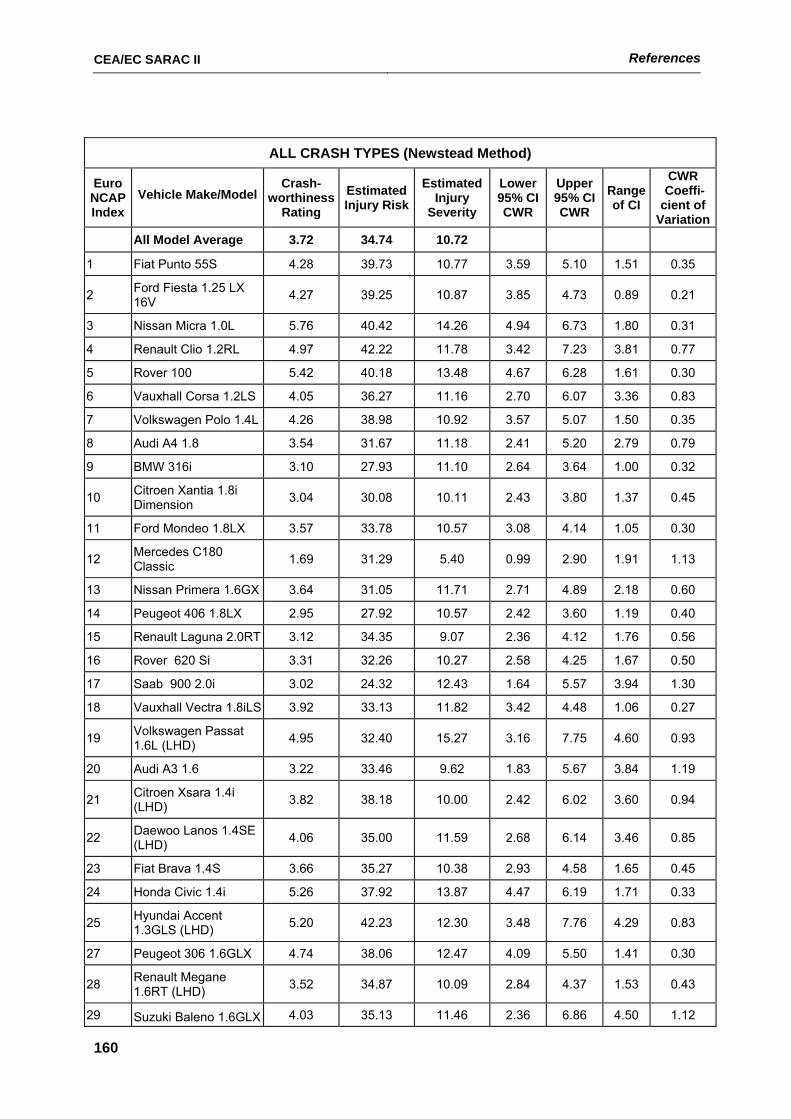
CEA/EC SARAC II References
160
ALL CRASH TYPES (Newstead Method)
Euro NCAP Index
Vehicle Make/Model Crash-
worthiness Rating
Estimated Injury Risk
Estimated Injury
Severity
Lower 95% CI CWR
Upper 95% CI CWR
Range of CI
CWR Coeffi-cient of
Variation All Model Average 3.72 34.74 10.72
1 Fiat Punto 55S 4.28 39.73 10.77 3.59 5.10 1.51 0.35
2 Ford Fiesta 1.25 LX 16V 4.27 39.25 10.87 3.85 4.73 0.89 0.21
3 Nissan Micra 1.0L 5.76 40.42 14.26 4.94 6.73 1.80 0.31
4 Renault Clio 1.2RL 4.97 42.22 11.78 3.42 7.23 3.81 0.77
5 Rover 100 5.42 40.18 13.48 4.67 6.28 1.61 0.30
6 Vauxhall Corsa 1.2LS 4.05 36.27 11.16 2.70 6.07 3.36 0.83
7 Volkswagen Polo 1.4L 4.26 38.98 10.92 3.57 5.07 1.50 0.35
8 Audi A4 1.8 3.54 31.67 11.18 2.41 5.20 2.79 0.79
9 BMW 316i 3.10 27.93 11.10 2.64 3.64 1.00 0.32
10 Citroen Xantia 1.8i Dimension 3.04 30.08 10.11 2.43 3.80 1.37 0.45
11 Ford Mondeo 1.8LX 3.57 33.78 10.57 3.08 4.14 1.05 0.30
12 Mercedes C180 Classic 1.69 31.29 5.40 0.99 2.90 1.91 1.13
13 Nissan Primera 1.6GX 3.64 31.05 11.71 2.71 4.89 2.18 0.60
14 Peugeot 406 1.8LX 2.95 27.92 10.57 2.42 3.60 1.19 0.40
15 Renault Laguna 2.0RT 3.12 34.35 9.07 2.36 4.12 1.76 0.56
16 Rover 620 Si 3.31 32.26 10.27 2.58 4.25 1.67 0.50
17 Saab 900 2.0i 3.02 24.32 12.43 1.64 5.57 3.94 1.30
18 Vauxhall Vectra 1.8iLS 3.92 33.13 11.82 3.42 4.48 1.06 0.27
19 Volkswagen Passat 1.6L (LHD) 4.95 32.40 15.27 3.16 7.75 4.60 0.93
20 Audi A3 1.6 3.22 33.46 9.62 1.83 5.67 3.84 1.19
21 Citroen Xsara 1.4i (LHD) 3.82 38.18 10.00 2.42 6.02 3.60 0.94
22 Daewoo Lanos 1.4SE (LHD) 4.06 35.00 11.59 2.68 6.14 3.46 0.85
23 Fiat Brava 1.4S 3.66 35.27 10.38 2.93 4.58 1.65 0.45
24 Honda Civic 1.4i 5.26 37.92 13.87 4.47 6.19 1.71 0.33
25 Hyundai Accent 1.3GLS (LHD) 5.20 42.23 12.30 3.48 7.76 4.29 0.83
27 Peugeot 306 1.6GLX 4.74 38.06 12.47 4.09 5.50 1.41 0.30
28 Renault Megane 1.6RT (LHD) 3.52 34.87 10.09 2.84 4.37 1.53 0.43
29 Suzuki Baleno 1.6GLX 4.03 35.13 11.46 2.36 6.86 4.50 1.12
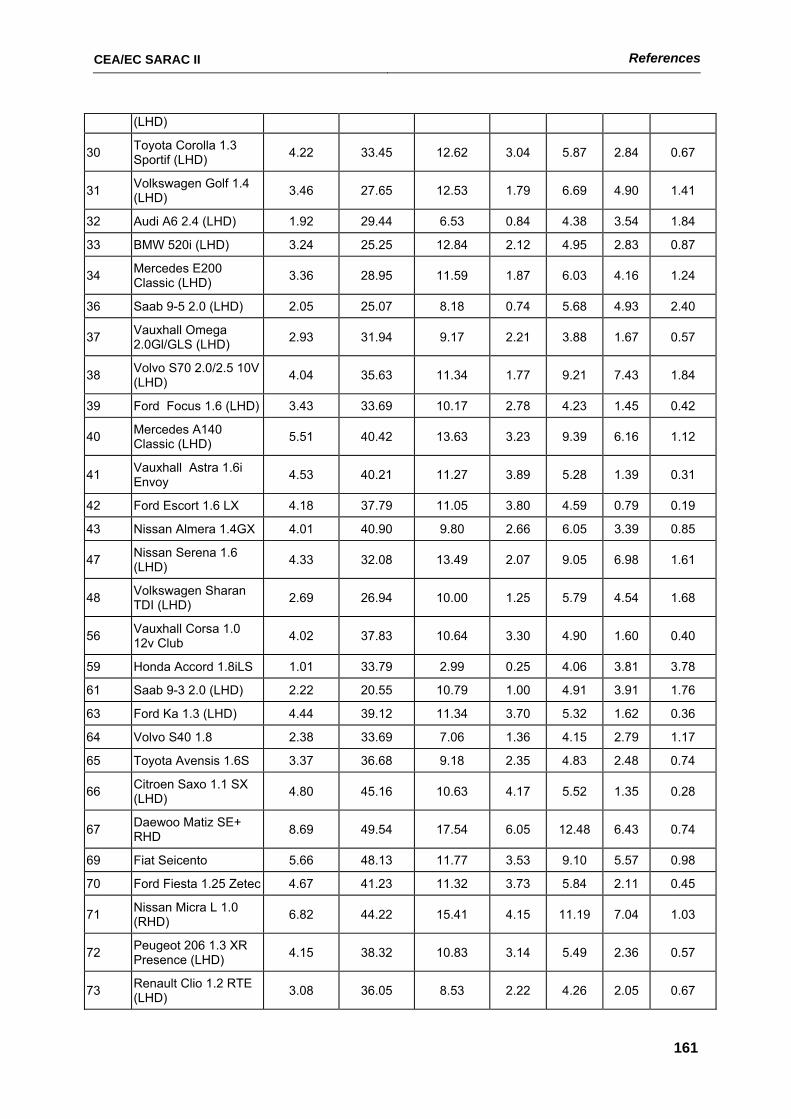
CEA/EC SARAC II References
161
(LHD)
30 Toyota Corolla 1.3 Sportif (LHD) 4.22 33.45 12.62 3.04 5.87 2.84 0.67
31 Volkswagen Golf 1.4 (LHD) 3.46 27.65 12.53 1.79 6.69 4.90 1.41
32 Audi A6 2.4 (LHD) 1.92 29.44 6.53 0.84 4.38 3.54 1.84
33 BMW 520i (LHD) 3.24 25.25 12.84 2.12 4.95 2.83 0.87
34 Mercedes E200 Classic (LHD) 3.36 28.95 11.59 1.87 6.03 4.16 1.24
36 Saab 9-5 2.0 (LHD) 2.05 25.07 8.18 0.74 5.68 4.93 2.40
37 Vauxhall Omega 2.0Gl/GLS (LHD) 2.93 31.94 9.17 2.21 3.88 1.67 0.57
38 Volvo S70 2.0/2.5 10V (LHD) 4.04 35.63 11.34 1.77 9.21 7.43 1.84
39 Ford Focus 1.6 (LHD) 3.43 33.69 10.17 2.78 4.23 1.45 0.42
40 Mercedes A140 Classic (LHD) 5.51 40.42 13.63 3.23 9.39 6.16 1.12
41 Vauxhall Astra 1.6i Envoy 4.53 40.21 11.27 3.89 5.28 1.39 0.31
42 Ford Escort 1.6 LX 4.18 37.79 11.05 3.80 4.59 0.79 0.19
43 Nissan Almera 1.4GX 4.01 40.90 9.80 2.66 6.05 3.39 0.85
47 Nissan Serena 1.6 (LHD) 4.33 32.08 13.49 2.07 9.05 6.98 1.61
48 Volkswagen Sharan TDI (LHD) 2.69 26.94 10.00 1.25 5.79 4.54 1.68
56 Vauxhall Corsa 1.0 12v Club 4.02 37.83 10.64 3.30 4.90 1.60 0.40
59 Honda Accord 1.8iLS 1.01 33.79 2.99 0.25 4.06 3.81 3.78
61 Saab 9-3 2.0 (LHD) 2.22 20.55 10.79 1.00 4.91 3.91 1.76
63 Ford Ka 1.3 (LHD) 4.44 39.12 11.34 3.70 5.32 1.62 0.36
64 Volvo S40 1.8 2.38 33.69 7.06 1.36 4.15 2.79 1.17
65 Toyota Avensis 1.6S 3.37 36.68 9.18 2.35 4.83 2.48 0.74
66 Citroen Saxo 1.1 SX (LHD) 4.80 45.16 10.63 4.17 5.52 1.35 0.28
67 Daewoo Matiz SE+ RHD 8.69 49.54 17.54 6.05 12.48 6.43 0.74
69 Fiat Seicento 5.66 48.13 11.77 3.53 9.10 5.57 0.98
70 Ford Fiesta 1.25 Zetec 4.67 41.23 11.32 3.73 5.84 2.11 0.45
71 Nissan Micra L 1.0 (RHD) 6.82 44.22 15.41 4.15 11.19 7.04 1.03
72 Peugeot 206 1.3 XR Presence (LHD) 4.15 38.32 10.83 3.14 5.49 2.36 0.57
73 Renault Clio 1.2 RTE (LHD) 3.08 36.05 8.53 2.22 4.26 2.05 0.67
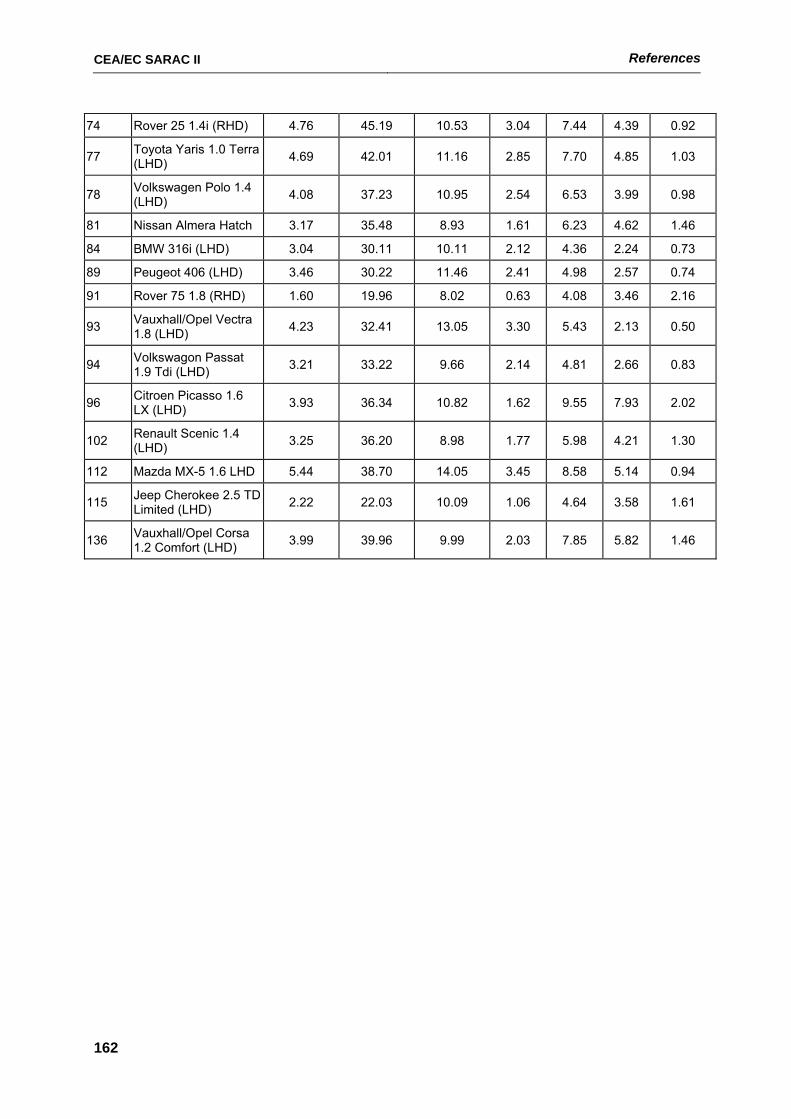
CEA/EC SARAC II References
162
74 Rover 25 1.4i (RHD) 4.76 45.19 10.53 3.04 7.44 4.39 0.92
77 Toyota Yaris 1.0 Terra (LHD) 4.69 42.01 11.16 2.85 7.70 4.85 1.03
78 Volkswagen Polo 1.4 (LHD) 4.08 37.23 10.95 2.54 6.53 3.99 0.98
81 Nissan Almera Hatch 3.17 35.48 8.93 1.61 6.23 4.62 1.46
84 BMW 316i (LHD) 3.04 30.11 10.11 2.12 4.36 2.24 0.73
89 Peugeot 406 (LHD) 3.46 30.22 11.46 2.41 4.98 2.57 0.74
91 Rover 75 1.8 (RHD) 1.60 19.96 8.02 0.63 4.08 3.46 2.16
93 Vauxhall/Opel Vectra 1.8 (LHD) 4.23 32.41 13.05 3.30 5.43 2.13 0.50
94 Volkswagon Passat 1.9 Tdi (LHD) 3.21 33.22 9.66 2.14 4.81 2.66 0.83
96 Citroen Picasso 1.6 LX (LHD) 3.93 36.34 10.82 1.62 9.55 7.93 2.02
102 Renault Scenic 1.4 (LHD) 3.25 36.20 8.98 1.77 5.98 4.21 1.30
112 Mazda MX-5 1.6 LHD 5.44 38.70 14.05 3.45 8.58 5.14 0.94
115 Jeep Cherokee 2.5 TD Limited (LHD) 2.22 22.03 10.09 1.06 4.64 3.58 1.61
136 Vauxhall/Opel Corsa 1.2 Comfort (LHD) 3.99 39.96 9.99 2.03 7.85 5.82 1.46
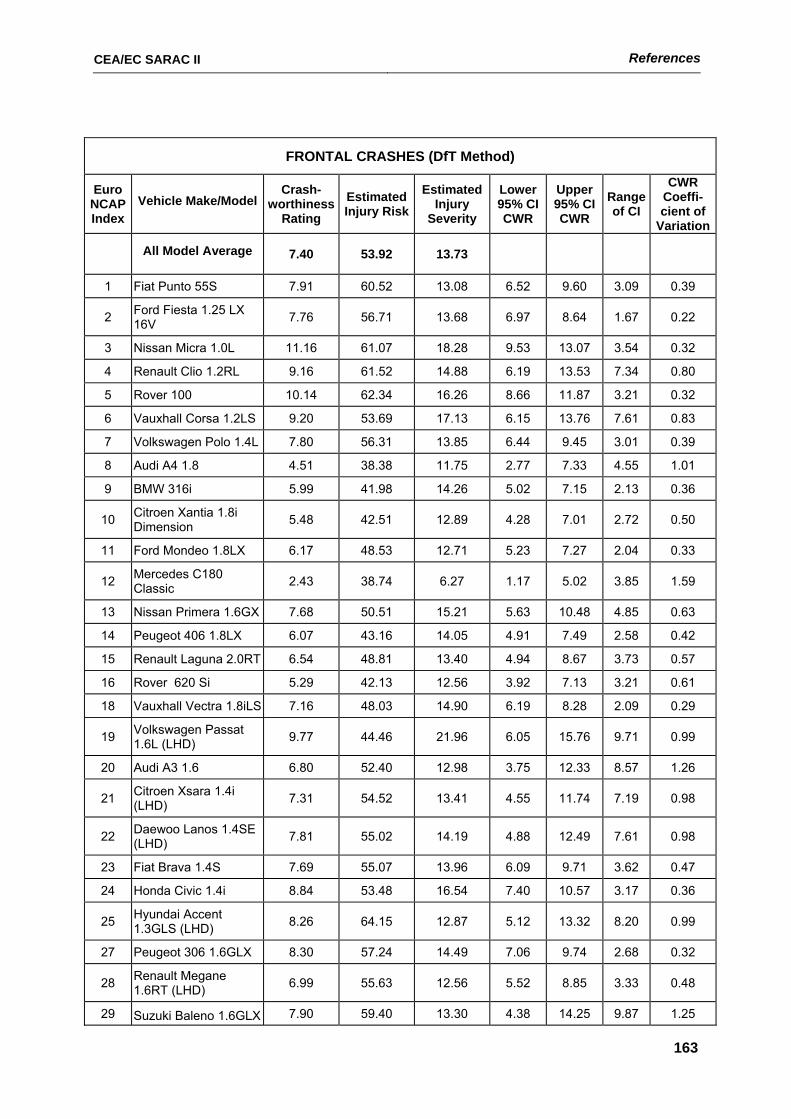
CEA/EC SARAC II References
163
FRONTAL CRASHES (DfT Method)
Euro NCAP Index
Vehicle Make/Model Crash-
worthiness Rating
Estimated Injury Risk
Estimated Injury
Severity
Lower 95% CI CWR
Upper 95% CI CWR
Range of CI
CWR Coeffi- cient of
Variation
All Model Average 7.40 53.92 13.73
1 Fiat Punto 55S 7.91 60.52 13.08 6.52 9.60 3.09 0.39
2 Ford Fiesta 1.25 LX 16V 7.76 56.71 13.68 6.97 8.64 1.67 0.22
3 Nissan Micra 1.0L 11.16 61.07 18.28 9.53 13.07 3.54 0.32
4 Renault Clio 1.2RL 9.16 61.52 14.88 6.19 13.53 7.34 0.80
5 Rover 100 10.14 62.34 16.26 8.66 11.87 3.21 0.32
6 Vauxhall Corsa 1.2LS 9.20 53.69 17.13 6.15 13.76 7.61 0.83
7 Volkswagen Polo 1.4L 7.80 56.31 13.85 6.44 9.45 3.01 0.39
8 Audi A4 1.8 4.51 38.38 11.75 2.77 7.33 4.55 1.01
9 BMW 316i 5.99 41.98 14.26 5.02 7.15 2.13 0.36
10 Citroen Xantia 1.8i Dimension 5.48 42.51 12.89 4.28 7.01 2.72 0.50
11 Ford Mondeo 1.8LX 6.17 48.53 12.71 5.23 7.27 2.04 0.33
12 Mercedes C180 Classic 2.43 38.74 6.27 1.17 5.02 3.85 1.59
13 Nissan Primera 1.6GX 7.68 50.51 15.21 5.63 10.48 4.85 0.63
14 Peugeot 406 1.8LX 6.07 43.16 14.05 4.91 7.49 2.58 0.42
15 Renault Laguna 2.0RT 6.54 48.81 13.40 4.94 8.67 3.73 0.57
16 Rover 620 Si 5.29 42.13 12.56 3.92 7.13 3.21 0.61
18 Vauxhall Vectra 1.8iLS 7.16 48.03 14.90 6.19 8.28 2.09 0.29
19 Volkswagen Passat 1.6L (LHD) 9.77 44.46 21.96 6.05 15.76 9.71 0.99
20 Audi A3 1.6 6.80 52.40 12.98 3.75 12.33 8.57 1.26
21 Citroen Xsara 1.4i (LHD) 7.31 54.52 13.41 4.55 11.74 7.19 0.98
22 Daewoo Lanos 1.4SE (LHD) 7.81 55.02 14.19 4.88 12.49 7.61 0.98
23 Fiat Brava 1.4S 7.69 55.07 13.96 6.09 9.71 3.62 0.47
24 Honda Civic 1.4i 8.84 53.48 16.54 7.40 10.57 3.17 0.36
25 Hyundai Accent 1.3GLS (LHD) 8.26 64.15 12.87 5.12 13.32 8.20 0.99
27 Peugeot 306 1.6GLX 8.30 57.24 14.49 7.06 9.74 2.68 0.32
28 Renault Megane 1.6RT (LHD) 6.99 55.63 12.56 5.52 8.85 3.33 0.48
29 Suzuki Baleno 1.6GLX 7.90 59.40 13.30 4.38 14.25 9.87 1.25
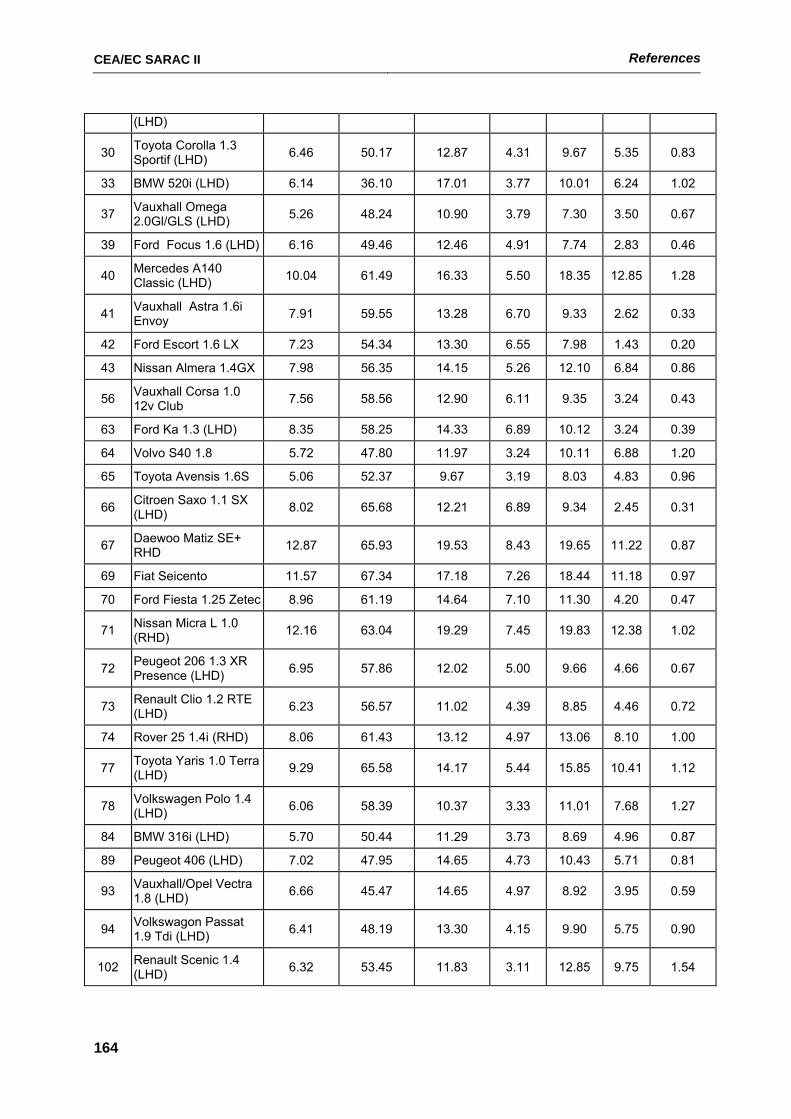
CEA/EC SARAC II References
164
(LHD)
30 Toyota Corolla 1.3 Sportif (LHD) 6.46 50.17 12.87 4.31 9.67 5.35 0.83
33 BMW 520i (LHD) 6.14 36.10 17.01 3.77 10.01 6.24 1.02
37 Vauxhall Omega 2.0Gl/GLS (LHD) 5.26 48.24 10.90 3.79 7.30 3.50 0.67
39 Ford Focus 1.6 (LHD) 6.16 49.46 12.46 4.91 7.74 2.83 0.46
40 Mercedes A140 Classic (LHD) 10.04 61.49 16.33 5.50 18.35 12.85 1.28
41 Vauxhall Astra 1.6i Envoy 7.91 59.55 13.28 6.70 9.33 2.62 0.33
42 Ford Escort 1.6 LX 7.23 54.34 13.30 6.55 7.98 1.43 0.20
43 Nissan Almera 1.4GX 7.98 56.35 14.15 5.26 12.10 6.84 0.86
56 Vauxhall Corsa 1.0 12v Club 7.56 58.56 12.90 6.11 9.35 3.24 0.43
63 Ford Ka 1.3 (LHD) 8.35 58.25 14.33 6.89 10.12 3.24 0.39
64 Volvo S40 1.8 5.72 47.80 11.97 3.24 10.11 6.88 1.20
65 Toyota Avensis 1.6S 5.06 52.37 9.67 3.19 8.03 4.83 0.96
66 Citroen Saxo 1.1 SX (LHD) 8.02 65.68 12.21 6.89 9.34 2.45 0.31
67 Daewoo Matiz SE+ RHD 12.87 65.93 19.53 8.43 19.65 11.22 0.87
69 Fiat Seicento 11.57 67.34 17.18 7.26 18.44 11.18 0.97
70 Ford Fiesta 1.25 Zetec 8.96 61.19 14.64 7.10 11.30 4.20 0.47
71 Nissan Micra L 1.0 (RHD) 12.16 63.04 19.29 7.45 19.83 12.38 1.02
72 Peugeot 206 1.3 XR Presence (LHD) 6.95 57.86 12.02 5.00 9.66 4.66 0.67
73 Renault Clio 1.2 RTE (LHD) 6.23 56.57 11.02 4.39 8.85 4.46 0.72
74 Rover 25 1.4i (RHD) 8.06 61.43 13.12 4.97 13.06 8.10 1.00
77 Toyota Yaris 1.0 Terra (LHD) 9.29 65.58 14.17 5.44 15.85 10.41 1.12
78 Volkswagen Polo 1.4 (LHD) 6.06 58.39 10.37 3.33 11.01 7.68 1.27
84 BMW 316i (LHD) 5.70 50.44 11.29 3.73 8.69 4.96 0.87
89 Peugeot 406 (LHD) 7.02 47.95 14.65 4.73 10.43 5.71 0.81
93 Vauxhall/Opel Vectra 1.8 (LHD) 6.66 45.47 14.65 4.97 8.92 3.95 0.59
94 Volkswagon Passat 1.9 Tdi (LHD) 6.41 48.19 13.30 4.15 9.90 5.75 0.90
102 Renault Scenic 1.4 (LHD) 6.32 53.45 11.83 3.11 12.85 9.75 1.54
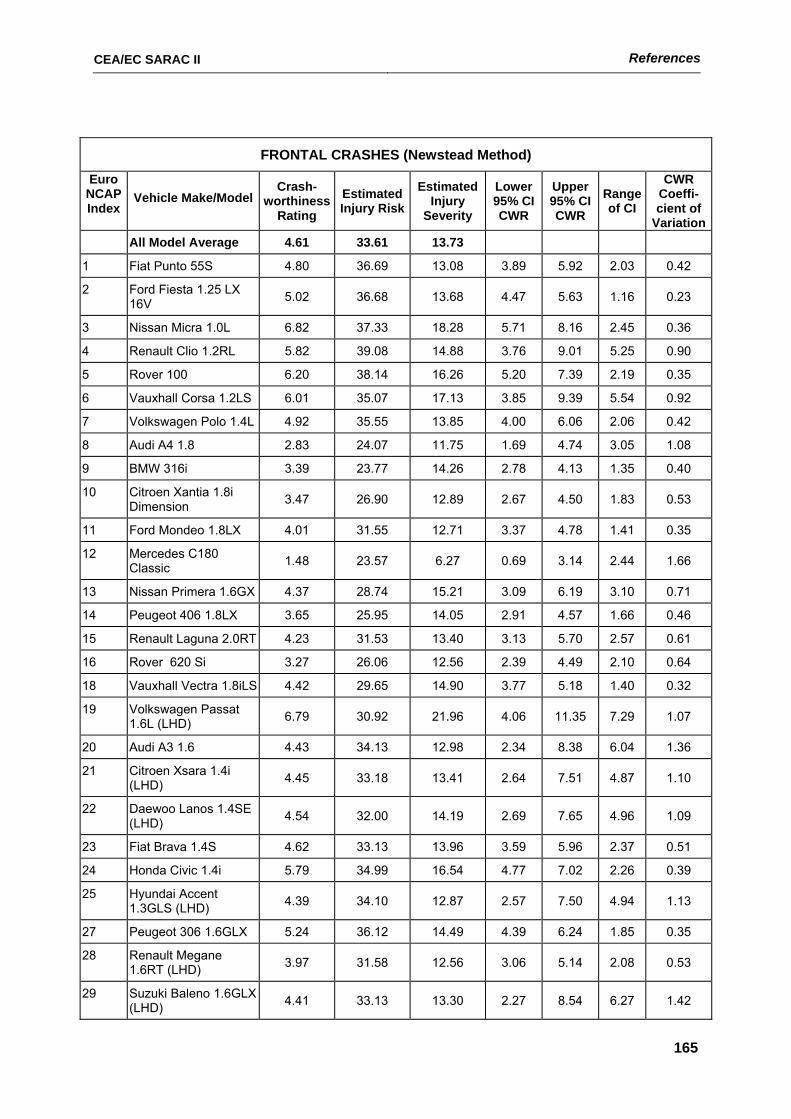
CEA/EC SARAC II References
165
FRONTAL CRASHES (Newstead Method) Euro
NCAP Index
Vehicle Make/Model Crash-
worthiness Rating
Estimated Injury Risk
Estimated Injury
Severity
Lower 95% CI CWR
Upper 95% CI CWR
Range of CI
CWR Coeffi- cient of
Variation All Model Average 4.61 33.61 13.73
1 Fiat Punto 55S 4.80 36.69 13.08 3.89 5.92 2.03 0.42
2 Ford Fiesta 1.25 LX 16V 5.02 36.68 13.68 4.47 5.63 1.16 0.23
3 Nissan Micra 1.0L 6.82 37.33 18.28 5.71 8.16 2.45 0.36
4 Renault Clio 1.2RL 5.82 39.08 14.88 3.76 9.01 5.25 0.90
5 Rover 100 6.20 38.14 16.26 5.20 7.39 2.19 0.35
6 Vauxhall Corsa 1.2LS 6.01 35.07 17.13 3.85 9.39 5.54 0.92
7 Volkswagen Polo 1.4L 4.92 35.55 13.85 4.00 6.06 2.06 0.42
8 Audi A4 1.8 2.83 24.07 11.75 1.69 4.74 3.05 1.08
9 BMW 316i 3.39 23.77 14.26 2.78 4.13 1.35 0.40
10 Citroen Xantia 1.8i Dimension 3.47 26.90 12.89 2.67 4.50 1.83 0.53
11 Ford Mondeo 1.8LX 4.01 31.55 12.71 3.37 4.78 1.41 0.35
12 Mercedes C180 Classic 1.48 23.57 6.27 0.69 3.14 2.44 1.66
13 Nissan Primera 1.6GX 4.37 28.74 15.21 3.09 6.19 3.10 0.71
14 Peugeot 406 1.8LX 3.65 25.95 14.05 2.91 4.57 1.66 0.46
15 Renault Laguna 2.0RT 4.23 31.53 13.40 3.13 5.70 2.57 0.61
16 Rover 620 Si 3.27 26.06 12.56 2.39 4.49 2.10 0.64
18 Vauxhall Vectra 1.8iLS 4.42 29.65 14.90 3.77 5.18 1.40 0.32
19 Volkswagen Passat 1.6L (LHD) 6.79 30.92 21.96 4.06 11.35 7.29 1.07
20 Audi A3 1.6 4.43 34.13 12.98 2.34 8.38 6.04 1.36
21 Citroen Xsara 1.4i (LHD) 4.45 33.18 13.41 2.64 7.51 4.87 1.10
22 Daewoo Lanos 1.4SE (LHD) 4.54 32.00 14.19 2.69 7.65 4.96 1.09
23 Fiat Brava 1.4S 4.62 33.13 13.96 3.59 5.96 2.37 0.51
24 Honda Civic 1.4i 5.79 34.99 16.54 4.77 7.02 2.26 0.39
25 Hyundai Accent 1.3GLS (LHD) 4.39 34.10 12.87 2.57 7.50 4.94 1.13
27 Peugeot 306 1.6GLX 5.24 36.12 14.49 4.39 6.24 1.85 0.35
28 Renault Megane 1.6RT (LHD) 3.97 31.58 12.56 3.06 5.14 2.08 0.53
29 Suzuki Baleno 1.6GLX (LHD) 4.41 33.13 13.30 2.27 8.54 6.27 1.42
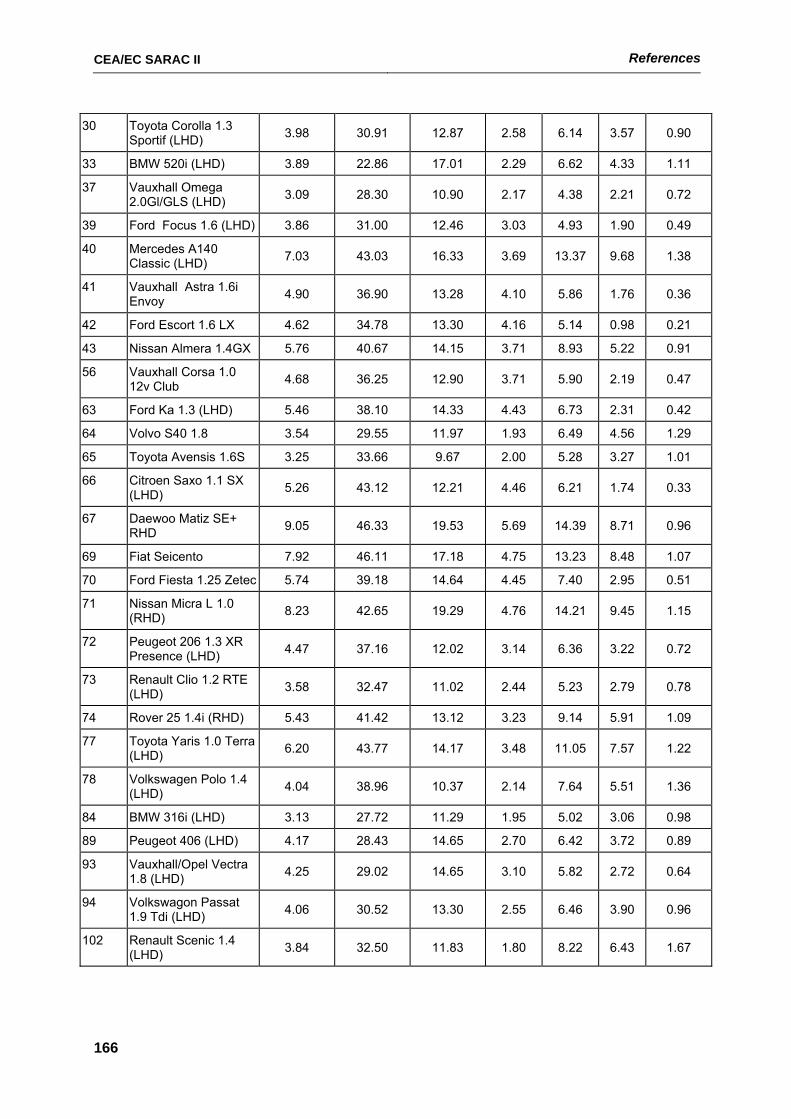
CEA/EC SARAC II References
166
30 Toyota Corolla 1.3 Sportif (LHD) 3.98 30.91 12.87 2.58 6.14 3.57 0.90
33 BMW 520i (LHD) 3.89 22.86 17.01 2.29 6.62 4.33 1.11
37 Vauxhall Omega 2.0Gl/GLS (LHD) 3.09 28.30 10.90 2.17 4.38 2.21 0.72
39 Ford Focus 1.6 (LHD) 3.86 31.00 12.46 3.03 4.93 1.90 0.49
40 Mercedes A140 Classic (LHD) 7.03 43.03 16.33 3.69 13.37 9.68 1.38
41 Vauxhall Astra 1.6i Envoy 4.90 36.90 13.28 4.10 5.86 1.76 0.36
42 Ford Escort 1.6 LX 4.62 34.78 13.30 4.16 5.14 0.98 0.21
43 Nissan Almera 1.4GX 5.76 40.67 14.15 3.71 8.93 5.22 0.91
56 Vauxhall Corsa 1.0 12v Club 4.68 36.25 12.90 3.71 5.90 2.19 0.47
63 Ford Ka 1.3 (LHD) 5.46 38.10 14.33 4.43 6.73 2.31 0.42
64 Volvo S40 1.8 3.54 29.55 11.97 1.93 6.49 4.56 1.29
65 Toyota Avensis 1.6S 3.25 33.66 9.67 2.00 5.28 3.27 1.01
66 Citroen Saxo 1.1 SX (LHD) 5.26 43.12 12.21 4.46 6.21 1.74 0.33
67 Daewoo Matiz SE+ RHD 9.05 46.33 19.53 5.69 14.39 8.71 0.96
69 Fiat Seicento 7.92 46.11 17.18 4.75 13.23 8.48 1.07
70 Ford Fiesta 1.25 Zetec 5.74 39.18 14.64 4.45 7.40 2.95 0.51
71 Nissan Micra L 1.0 (RHD) 8.23 42.65 19.29 4.76 14.21 9.45 1.15
72 Peugeot 206 1.3 XR Presence (LHD) 4.47 37.16 12.02 3.14 6.36 3.22 0.72
73 Renault Clio 1.2 RTE (LHD) 3.58 32.47 11.02 2.44 5.23 2.79 0.78
74 Rover 25 1.4i (RHD) 5.43 41.42 13.12 3.23 9.14 5.91 1.09
77 Toyota Yaris 1.0 Terra (LHD) 6.20 43.77 14.17 3.48 11.05 7.57 1.22
78 Volkswagen Polo 1.4 (LHD) 4.04 38.96 10.37 2.14 7.64 5.51 1.36
84 BMW 316i (LHD) 3.13 27.72 11.29 1.95 5.02 3.06 0.98
89 Peugeot 406 (LHD) 4.17 28.43 14.65 2.70 6.42 3.72 0.89
93 Vauxhall/Opel Vectra 1.8 (LHD) 4.25 29.02 14.65 3.10 5.82 2.72 0.64
94 Volkswagon Passat 1.9 Tdi (LHD) 4.06 30.52 13.30 2.55 6.46 3.90 0.96
102 Renault Scenic 1.4 (LHD) 3.84 32.50 11.83 1.80 8.22 6.43 1.67
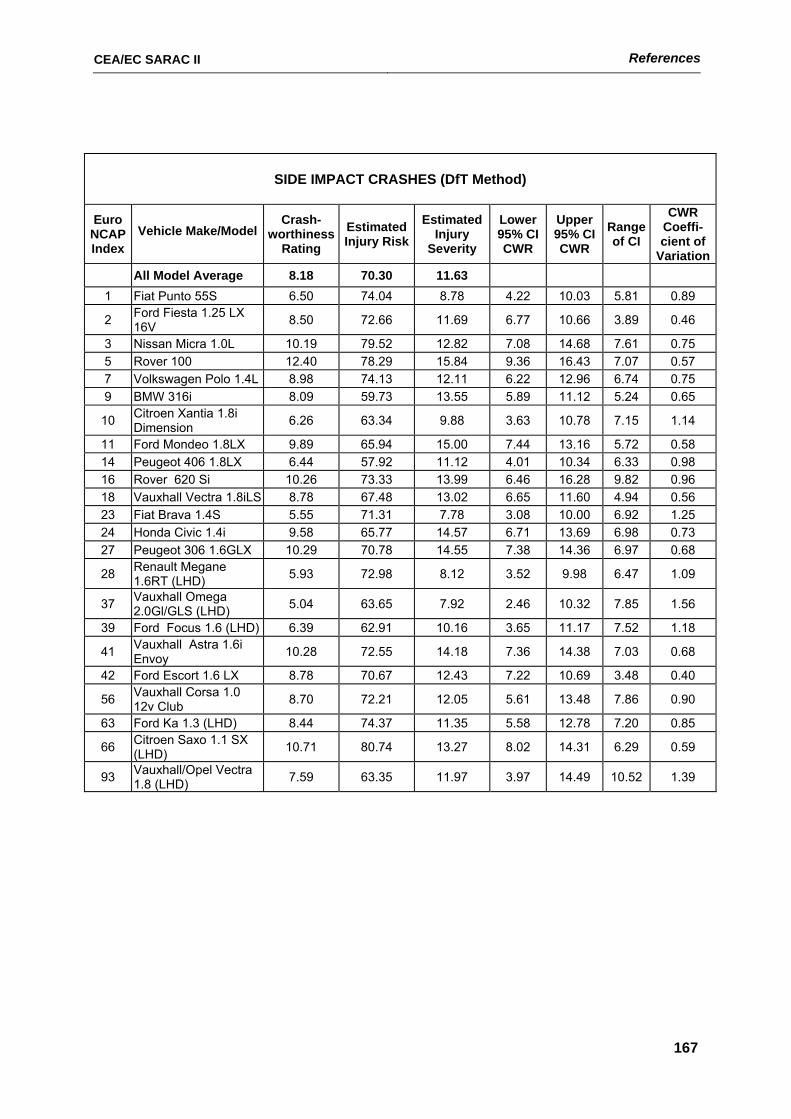
CEA/EC SARAC II References
167
SIDE IMPACT CRASHES (DfT Method)
Euro NCAP Index
Vehicle Make/Model Crash-
worthiness Rating
Estimated Injury Risk
Estimated Injury
Severity
Lower 95% CI CWR
Upper 95% CI CWR
Range of CI
CWR Coeffi- cient of
Variation All Model Average 8.18 70.30 11.63
1 Fiat Punto 55S 6.50 74.04 8.78 4.22 10.03 5.81 0.89
2 Ford Fiesta 1.25 LX 16V 8.50 72.66 11.69 6.77 10.66 3.89 0.46
3 Nissan Micra 1.0L 10.19 79.52 12.82 7.08 14.68 7.61 0.75 5 Rover 100 12.40 78.29 15.84 9.36 16.43 7.07 0.57 7 Volkswagen Polo 1.4L 8.98 74.13 12.11 6.22 12.96 6.74 0.75 9 BMW 316i 8.09 59.73 13.55 5.89 11.12 5.24 0.65
10 Citroen Xantia 1.8i Dimension 6.26 63.34 9.88 3.63 10.78 7.15 1.14
11 Ford Mondeo 1.8LX 9.89 65.94 15.00 7.44 13.16 5.72 0.58 14 Peugeot 406 1.8LX 6.44 57.92 11.12 4.01 10.34 6.33 0.98 16 Rover 620 Si 10.26 73.33 13.99 6.46 16.28 9.82 0.96 18 Vauxhall Vectra 1.8iLS 8.78 67.48 13.02 6.65 11.60 4.94 0.56 23 Fiat Brava 1.4S 5.55 71.31 7.78 3.08 10.00 6.92 1.25 24 Honda Civic 1.4i 9.58 65.77 14.57 6.71 13.69 6.98 0.73 27 Peugeot 306 1.6GLX 10.29 70.78 14.55 7.38 14.36 6.97 0.68
28 Renault Megane 1.6RT (LHD) 5.93 72.98 8.12 3.52 9.98 6.47 1.09
37 Vauxhall Omega 2.0Gl/GLS (LHD) 5.04 63.65 7.92 2.46 10.32 7.85 1.56
39 Ford Focus 1.6 (LHD) 6.39 62.91 10.16 3.65 11.17 7.52 1.18
41 Vauxhall Astra 1.6i Envoy 10.28 72.55 14.18 7.36 14.38 7.03 0.68
42 Ford Escort 1.6 LX 8.78 70.67 12.43 7.22 10.69 3.48 0.40
56 Vauxhall Corsa 1.0 12v Club 8.70 72.21 12.05 5.61 13.48 7.86 0.90
63 Ford Ka 1.3 (LHD) 8.44 74.37 11.35 5.58 12.78 7.20 0.85
66 Citroen Saxo 1.1 SX (LHD) 10.71 80.74 13.27 8.02 14.31 6.29 0.59
93 Vauxhall/Opel Vectra 1.8 (LHD) 7.59 63.35 11.97 3.97 14.49 10.52 1.39
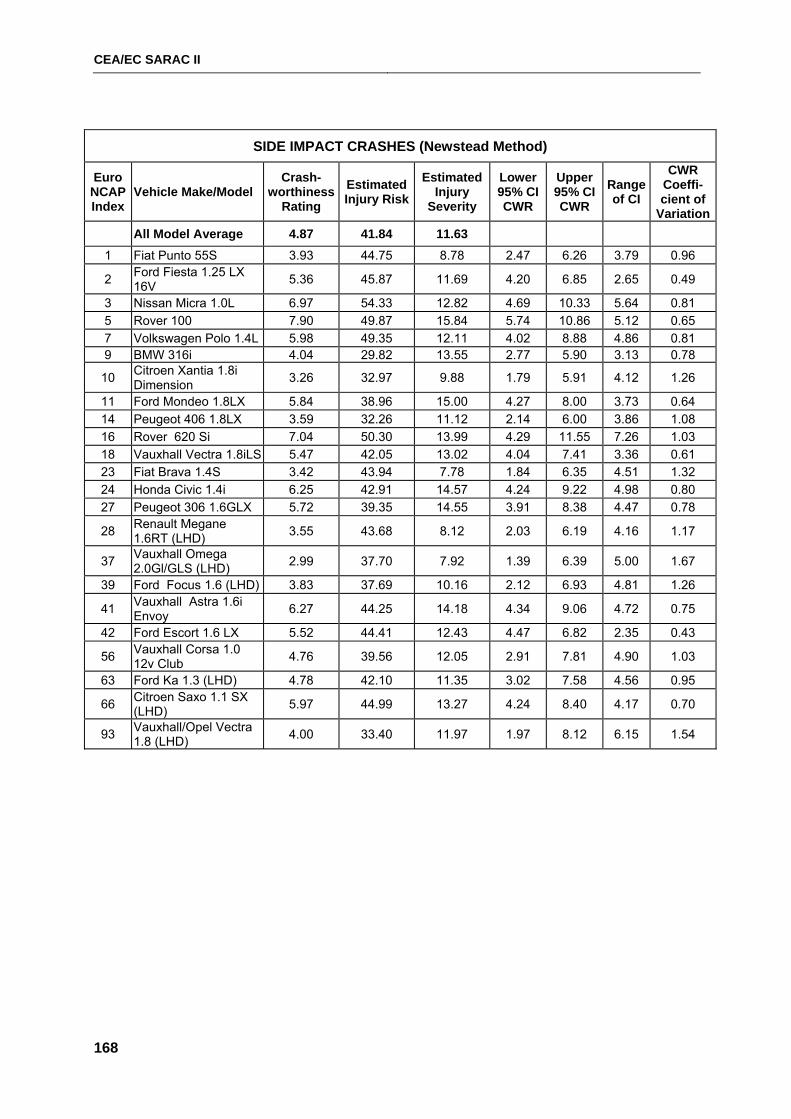
CEA/EC SARAC II
168
SIDE IMPACT CRASHES (Newstead Method)
Euro NCAP Index
Vehicle Make/Model Crash-
worthiness Rating
Estimated Injury Risk
Estimated Injury
Severity
Lower 95% CI CWR
Upper 95% CI CWR
Range of CI
CWR Coeffi- cient of
Variation All Model Average 4.87 41.84 11.63
1 Fiat Punto 55S 3.93 44.75 8.78 2.47 6.26 3.79 0.96
2 Ford Fiesta 1.25 LX 16V 5.36 45.87 11.69 4.20 6.85 2.65 0.49
3 Nissan Micra 1.0L 6.97 54.33 12.82 4.69 10.33 5.64 0.81 5 Rover 100 7.90 49.87 15.84 5.74 10.86 5.12 0.65 7 Volkswagen Polo 1.4L 5.98 49.35 12.11 4.02 8.88 4.86 0.81 9 BMW 316i 4.04 29.82 13.55 2.77 5.90 3.13 0.78
10 Citroen Xantia 1.8i Dimension 3.26 32.97 9.88 1.79 5.91 4.12 1.26
11 Ford Mondeo 1.8LX 5.84 38.96 15.00 4.27 8.00 3.73 0.64 14 Peugeot 406 1.8LX 3.59 32.26 11.12 2.14 6.00 3.86 1.08 16 Rover 620 Si 7.04 50.30 13.99 4.29 11.55 7.26 1.03 18 Vauxhall Vectra 1.8iLS 5.47 42.05 13.02 4.04 7.41 3.36 0.61 23 Fiat Brava 1.4S 3.42 43.94 7.78 1.84 6.35 4.51 1.32 24 Honda Civic 1.4i 6.25 42.91 14.57 4.24 9.22 4.98 0.80 27 Peugeot 306 1.6GLX 5.72 39.35 14.55 3.91 8.38 4.47 0.78
28 Renault Megane 1.6RT (LHD) 3.55 43.68 8.12 2.03 6.19 4.16 1.17
37 Vauxhall Omega 2.0Gl/GLS (LHD) 2.99 37.70 7.92 1.39 6.39 5.00 1.67
39 Ford Focus 1.6 (LHD) 3.83 37.69 10.16 2.12 6.93 4.81 1.26
41 Vauxhall Astra 1.6i Envoy 6.27 44.25 14.18 4.34 9.06 4.72 0.75
42 Ford Escort 1.6 LX 5.52 44.41 12.43 4.47 6.82 2.35 0.43
56 Vauxhall Corsa 1.0 12v Club 4.76 39.56 12.05 2.91 7.81 4.90 1.03
63 Ford Ka 1.3 (LHD) 4.78 42.10 11.35 3.02 7.58 4.56 0.95
66 Citroen Saxo 1.1 SX (LHD) 5.97 44.99 13.27 4.24 8.40 4.17 0.70
93 Vauxhall/Opel Vectra 1.8 (LHD) 4.00 33.40 11.97 1.97 8.12 6.15 1.54

CEA/EC SARAC II
169
CEA/EC SARAC II
170
APPENDIX C
SAFETY RATINGS ESTIMATED FROM FRENCH REAL
ACCIDENT DATA
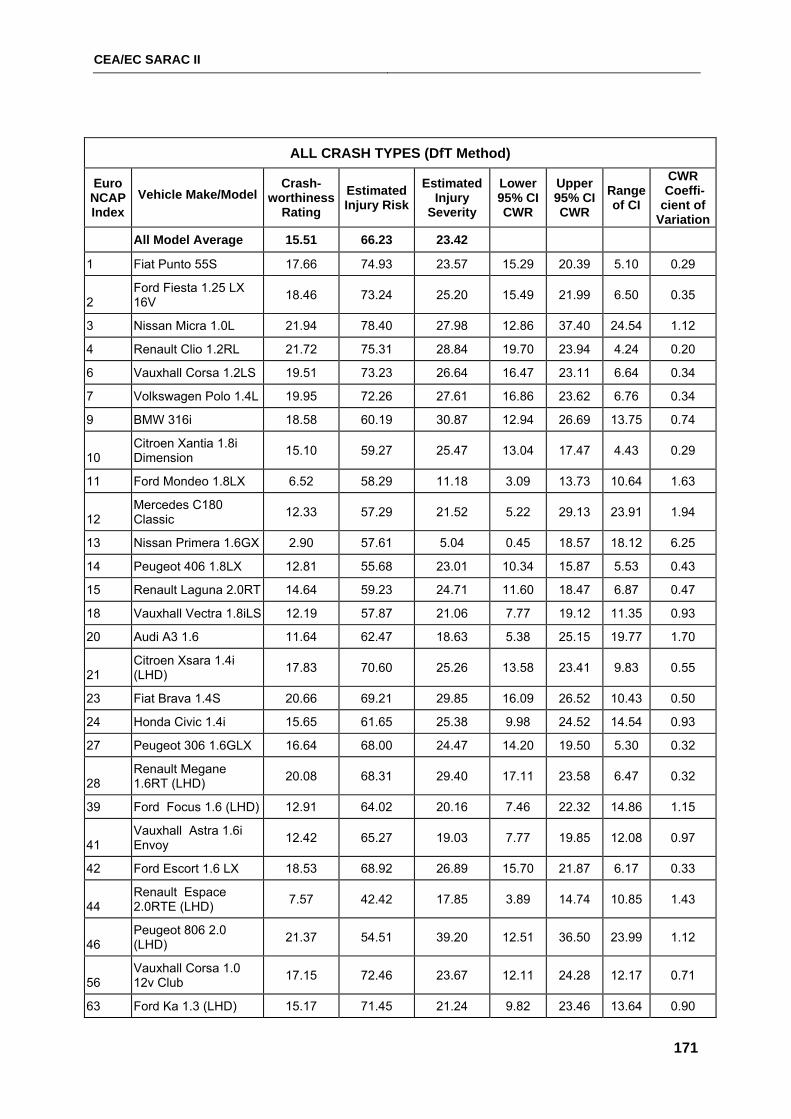
CEA/EC SARAC II
171
ALL CRASH TYPES (DfT Method)
Euro NCAP Index
Vehicle Make/Model Crash-
worthiness Rating
Estimated Injury Risk
Estimated Injury
Severity
Lower 95% CI CWR
Upper 95% CI CWR
Range of CI
CWR Coeffi-cient of
Variation All Model Average 15.51 66.23 23.42
1 Fiat Punto 55S 17.66 74.93 23.57 15.29 20.39 5.10 0.29
2 Ford Fiesta 1.25 LX 16V 18.46 73.24 25.20 15.49 21.99 6.50 0.35
3 Nissan Micra 1.0L 21.94 78.40 27.98 12.86 37.40 24.54 1.12
4 Renault Clio 1.2RL 21.72 75.31 28.84 19.70 23.94 4.24 0.20
6 Vauxhall Corsa 1.2LS 19.51 73.23 26.64 16.47 23.11 6.64 0.34
7 Volkswagen Polo 1.4L 19.95 72.26 27.61 16.86 23.62 6.76 0.34
9 BMW 316i 18.58 60.19 30.87 12.94 26.69 13.75 0.74
10 Citroen Xantia 1.8i Dimension 15.10 59.27 25.47 13.04 17.47 4.43 0.29
11 Ford Mondeo 1.8LX 6.52 58.29 11.18 3.09 13.73 10.64 1.63
12 Mercedes C180 Classic 12.33 57.29 21.52 5.22 29.13 23.91 1.94
13 Nissan Primera 1.6GX 2.90 57.61 5.04 0.45 18.57 18.12 6.25
14 Peugeot 406 1.8LX 12.81 55.68 23.01 10.34 15.87 5.53 0.43
15 Renault Laguna 2.0RT 14.64 59.23 24.71 11.60 18.47 6.87 0.47
18 Vauxhall Vectra 1.8iLS 12.19 57.87 21.06 7.77 19.12 11.35 0.93
20 Audi A3 1.6 11.64 62.47 18.63 5.38 25.15 19.77 1.70
21 Citroen Xsara 1.4i (LHD) 17.83 70.60 25.26 13.58 23.41 9.83 0.55
23 Fiat Brava 1.4S 20.66 69.21 29.85 16.09 26.52 10.43 0.50
24 Honda Civic 1.4i 15.65 61.65 25.38 9.98 24.52 14.54 0.93
27 Peugeot 306 1.6GLX 16.64 68.00 24.47 14.20 19.50 5.30 0.32
28 Renault Megane 1.6RT (LHD) 20.08 68.31 29.40 17.11 23.58 6.47 0.32
39 Ford Focus 1.6 (LHD) 12.91 64.02 20.16 7.46 22.32 14.86 1.15
41 Vauxhall Astra 1.6i Envoy 12.42 65.27 19.03 7.77 19.85 12.08 0.97
42 Ford Escort 1.6 LX 18.53 68.92 26.89 15.70 21.87 6.17 0.33
44 Renault Espace 2.0RTE (LHD) 7.57 42.42 17.85 3.89 14.74 10.85 1.43
46 Peugeot 806 2.0 (LHD) 21.37 54.51 39.20 12.51 36.50 23.99 1.12
56 Vauxhall Corsa 1.0 12v Club 17.15 72.46 23.67 12.11 24.28 12.17 0.71
63 Ford Ka 1.3 (LHD) 15.17 71.45 21.24 9.82 23.46 13.64 0.90
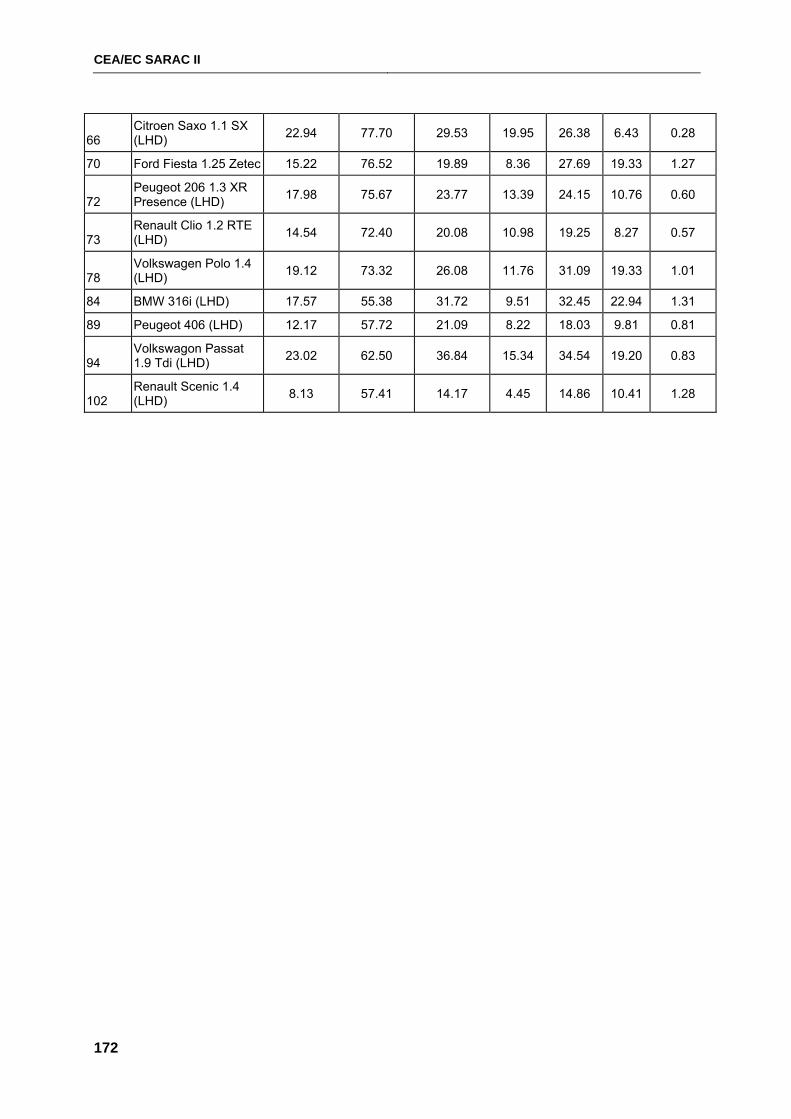
CEA/EC SARAC II
172
66 Citroen Saxo 1.1 SX (LHD) 22.94 77.70 29.53 19.95 26.38 6.43 0.28
70 Ford Fiesta 1.25 Zetec 15.22 76.52 19.89 8.36 27.69 19.33 1.27
72 Peugeot 206 1.3 XR Presence (LHD) 17.98 75.67 23.77 13.39 24.15 10.76 0.60
73 Renault Clio 1.2 RTE (LHD) 14.54 72.40 20.08 10.98 19.25 8.27 0.57
78 Volkswagen Polo 1.4 (LHD) 19.12 73.32 26.08 11.76 31.09 19.33 1.01
84 BMW 316i (LHD) 17.57 55.38 31.72 9.51 32.45 22.94 1.31
89 Peugeot 406 (LHD) 12.17 57.72 21.09 8.22 18.03 9.81 0.81
94 Volkswagon Passat 1.9 Tdi (LHD) 23.02 62.50 36.84 15.34 34.54 19.20 0.83
102 Renault Scenic 1.4 (LHD) 8.13 57.41 14.17 4.45 14.86 10.41 1.28
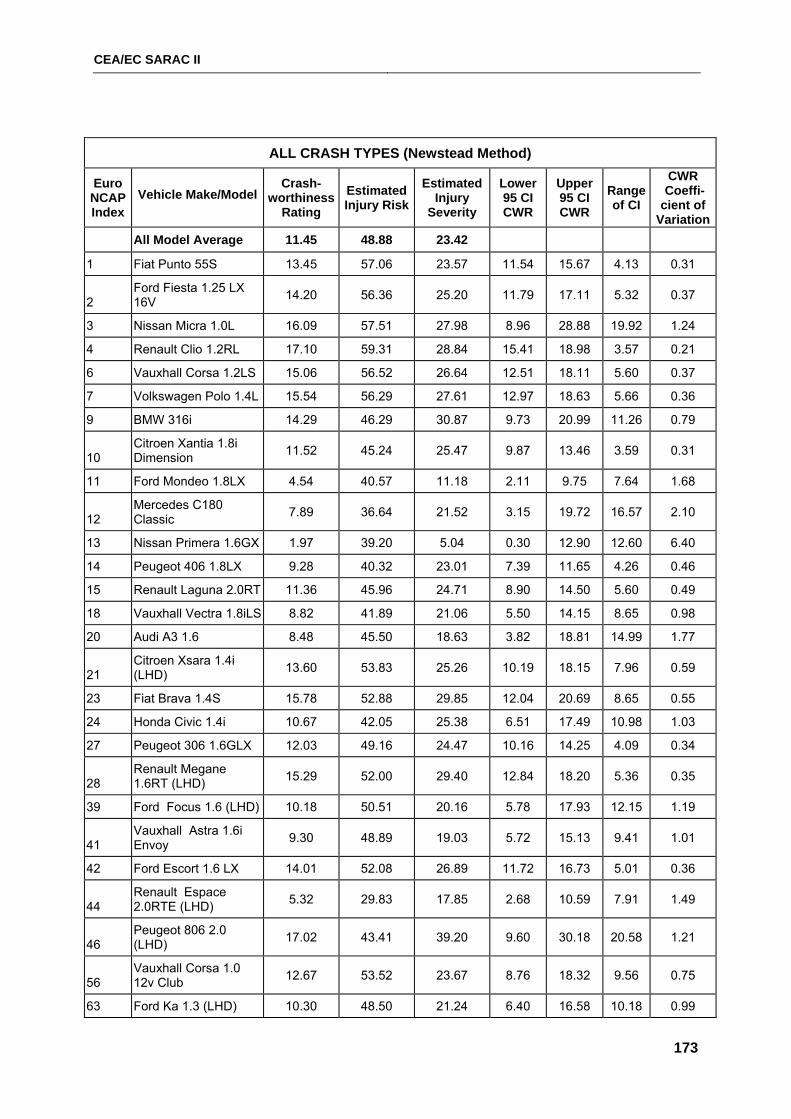
CEA/EC SARAC II
173
ALL CRASH TYPES (Newstead Method)
Euro NCAP Index
Vehicle Make/Model Crash-
worthiness Rating
Estimated Injury Risk
Estimated Injury
Severity
Lower 95 CI CWR
Upper 95 CI CWR
Range of CI
CWR Coeffi-cient of
Variation All Model Average 11.45 48.88 23.42
1 Fiat Punto 55S 13.45 57.06 23.57 11.54 15.67 4.13 0.31
2 Ford Fiesta 1.25 LX 16V 14.20 56.36 25.20 11.79 17.11 5.32 0.37
3 Nissan Micra 1.0L 16.09 57.51 27.98 8.96 28.88 19.92 1.24
4 Renault Clio 1.2RL 17.10 59.31 28.84 15.41 18.98 3.57 0.21
6 Vauxhall Corsa 1.2LS 15.06 56.52 26.64 12.51 18.11 5.60 0.37
7 Volkswagen Polo 1.4L 15.54 56.29 27.61 12.97 18.63 5.66 0.36
9 BMW 316i 14.29 46.29 30.87 9.73 20.99 11.26 0.79
10 Citroen Xantia 1.8i Dimension 11.52 45.24 25.47 9.87 13.46 3.59 0.31
11 Ford Mondeo 1.8LX 4.54 40.57 11.18 2.11 9.75 7.64 1.68
12 Mercedes C180 Classic 7.89 36.64 21.52 3.15 19.72 16.57 2.10
13 Nissan Primera 1.6GX 1.97 39.20 5.04 0.30 12.90 12.60 6.40
14 Peugeot 406 1.8LX 9.28 40.32 23.01 7.39 11.65 4.26 0.46
15 Renault Laguna 2.0RT 11.36 45.96 24.71 8.90 14.50 5.60 0.49
18 Vauxhall Vectra 1.8iLS 8.82 41.89 21.06 5.50 14.15 8.65 0.98
20 Audi A3 1.6 8.48 45.50 18.63 3.82 18.81 14.99 1.77
21 Citroen Xsara 1.4i (LHD) 13.60 53.83 25.26 10.19 18.15 7.96 0.59
23 Fiat Brava 1.4S 15.78 52.88 29.85 12.04 20.69 8.65 0.55
24 Honda Civic 1.4i 10.67 42.05 25.38 6.51 17.49 10.98 1.03
27 Peugeot 306 1.6GLX 12.03 49.16 24.47 10.16 14.25 4.09 0.34
28 Renault Megane 1.6RT (LHD) 15.29 52.00 29.40 12.84 18.20 5.36 0.35
39 Ford Focus 1.6 (LHD) 10.18 50.51 20.16 5.78 17.93 12.15 1.19
41 Vauxhall Astra 1.6i Envoy 9.30 48.89 19.03 5.72 15.13 9.41 1.01
42 Ford Escort 1.6 LX 14.01 52.08 26.89 11.72 16.73 5.01 0.36
44 Renault Espace 2.0RTE (LHD) 5.32 29.83 17.85 2.68 10.59 7.91 1.49
46 Peugeot 806 2.0 (LHD) 17.02 43.41 39.20 9.60 30.18 20.58 1.21
56 Vauxhall Corsa 1.0 12v Club 12.67 53.52 23.67 8.76 18.32 9.56 0.75
63 Ford Ka 1.3 (LHD) 10.30 48.50 21.24 6.40 16.58 10.18 0.99
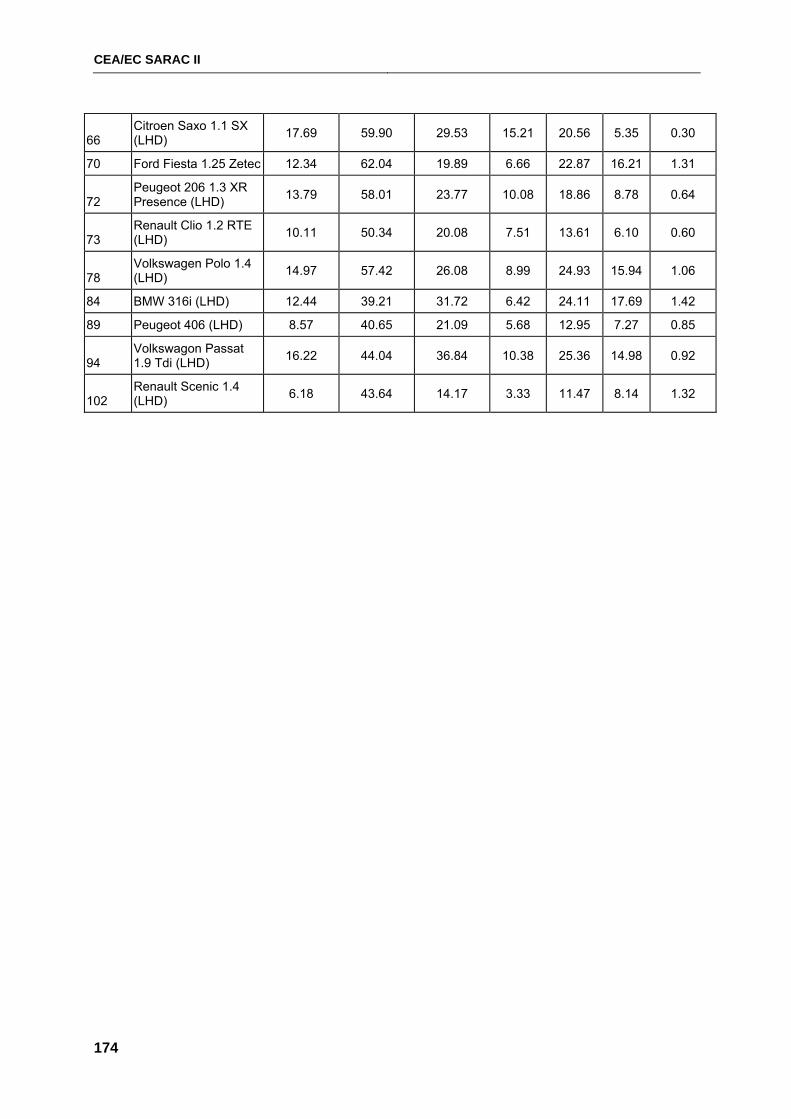
CEA/EC SARAC II
174
66 Citroen Saxo 1.1 SX (LHD) 17.69 59.90 29.53 15.21 20.56 5.35 0.30
70 Ford Fiesta 1.25 Zetec 12.34 62.04 19.89 6.66 22.87 16.21 1.31
72 Peugeot 206 1.3 XR Presence (LHD) 13.79 58.01 23.77 10.08 18.86 8.78 0.64
73 Renault Clio 1.2 RTE (LHD) 10.11 50.34 20.08 7.51 13.61 6.10 0.60
78 Volkswagen Polo 1.4 (LHD) 14.97 57.42 26.08 8.99 24.93 15.94 1.06
84 BMW 316i (LHD) 12.44 39.21 31.72 6.42 24.11 17.69 1.42
89 Peugeot 406 (LHD) 8.57 40.65 21.09 5.68 12.95 7.27 0.85
94 Volkswagon Passat 1.9 Tdi (LHD) 16.22 44.04 36.84 10.38 25.36 14.98 0.92
102 Renault Scenic 1.4 (LHD) 6.18 43.64 14.17 3.33 11.47 8.14 1.32
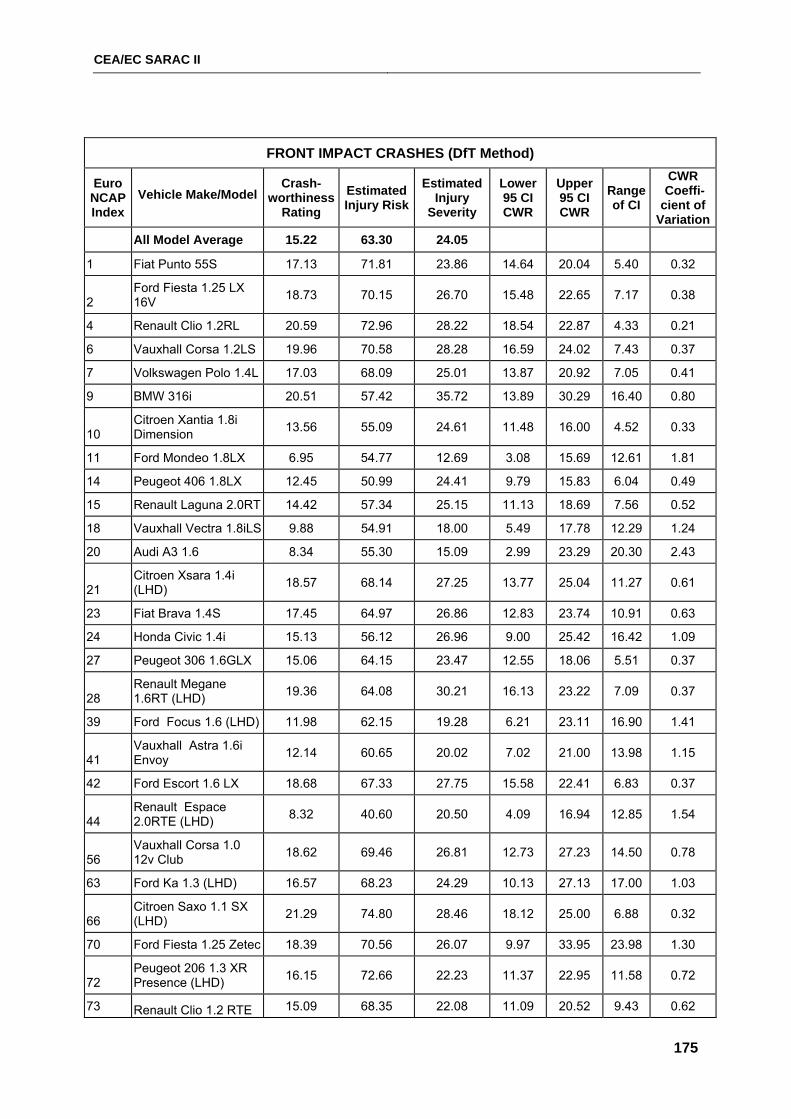
CEA/EC SARAC II
175
FRONT IMPACT CRASHES (DfT Method)
Euro NCAP Index
Vehicle Make/Model Crash-
worthiness Rating
Estimated Injury Risk
Estimated Injury
Severity
Lower 95 CI CWR
Upper 95 CI CWR
Range of CI
CWR Coeffi-cient of
Variation All Model Average 15.22 63.30 24.05
1 Fiat Punto 55S 17.13 71.81 23.86 14.64 20.04 5.40 0.32
2 Ford Fiesta 1.25 LX 16V 18.73 70.15 26.70 15.48 22.65 7.17 0.38
4 Renault Clio 1.2RL 20.59 72.96 28.22 18.54 22.87 4.33 0.21
6 Vauxhall Corsa 1.2LS 19.96 70.58 28.28 16.59 24.02 7.43 0.37
7 Volkswagen Polo 1.4L 17.03 68.09 25.01 13.87 20.92 7.05 0.41
9 BMW 316i 20.51 57.42 35.72 13.89 30.29 16.40 0.80
10 Citroen Xantia 1.8i Dimension 13.56 55.09 24.61 11.48 16.00 4.52 0.33
11 Ford Mondeo 1.8LX 6.95 54.77 12.69 3.08 15.69 12.61 1.81
14 Peugeot 406 1.8LX 12.45 50.99 24.41 9.79 15.83 6.04 0.49
15 Renault Laguna 2.0RT 14.42 57.34 25.15 11.13 18.69 7.56 0.52
18 Vauxhall Vectra 1.8iLS 9.88 54.91 18.00 5.49 17.78 12.29 1.24
20 Audi A3 1.6 8.34 55.30 15.09 2.99 23.29 20.30 2.43
21 Citroen Xsara 1.4i (LHD) 18.57 68.14 27.25 13.77 25.04 11.27 0.61
23 Fiat Brava 1.4S 17.45 64.97 26.86 12.83 23.74 10.91 0.63
24 Honda Civic 1.4i 15.13 56.12 26.96 9.00 25.42 16.42 1.09
27 Peugeot 306 1.6GLX 15.06 64.15 23.47 12.55 18.06 5.51 0.37
28 Renault Megane 1.6RT (LHD) 19.36 64.08 30.21 16.13 23.22 7.09 0.37
39 Ford Focus 1.6 (LHD) 11.98 62.15 19.28 6.21 23.11 16.90 1.41
41 Vauxhall Astra 1.6i Envoy 12.14 60.65 20.02 7.02 21.00 13.98 1.15
42 Ford Escort 1.6 LX 18.68 67.33 27.75 15.58 22.41 6.83 0.37
44 Renault Espace 2.0RTE (LHD) 8.32 40.60 20.50 4.09 16.94 12.85 1.54
56 Vauxhall Corsa 1.0 12v Club 18.62 69.46 26.81 12.73 27.23 14.50 0.78
63 Ford Ka 1.3 (LHD) 16.57 68.23 24.29 10.13 27.13 17.00 1.03
66 Citroen Saxo 1.1 SX (LHD) 21.29 74.80 28.46 18.12 25.00 6.88 0.32
70 Ford Fiesta 1.25 Zetec 18.39 70.56 26.07 9.97 33.95 23.98 1.30
72 Peugeot 206 1.3 XR Presence (LHD) 16.15 72.66 22.23 11.37 22.95 11.58 0.72
73 Renault Clio 1.2 RTE 15.09 68.35 22.08 11.09 20.52 9.43 0.62
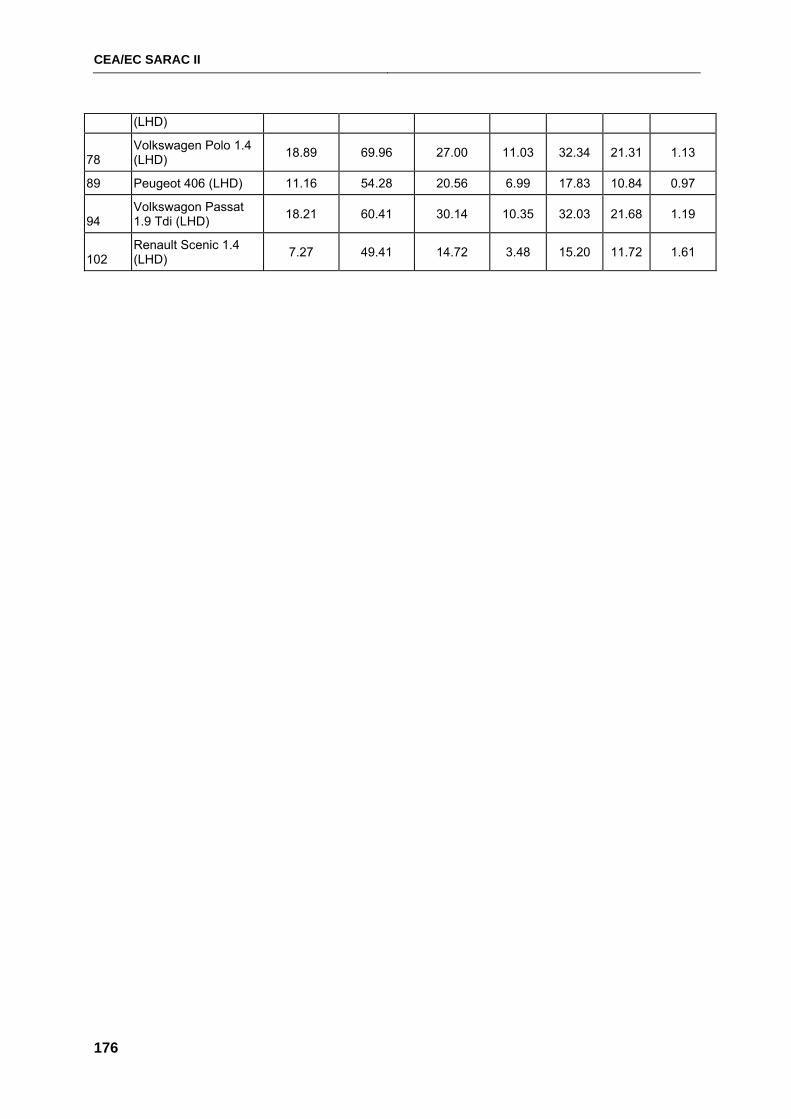
CEA/EC SARAC II
176
(LHD)
78 Volkswagen Polo 1.4 (LHD) 18.89 69.96 27.00 11.03 32.34 21.31 1.13
89 Peugeot 406 (LHD) 11.16 54.28 20.56 6.99 17.83 10.84 0.97
94 Volkswagon Passat 1.9 Tdi (LHD) 18.21 60.41 30.14 10.35 32.03 21.68 1.19
102 Renault Scenic 1.4 (LHD) 7.27 49.41 14.72 3.48 15.20 11.72 1.61
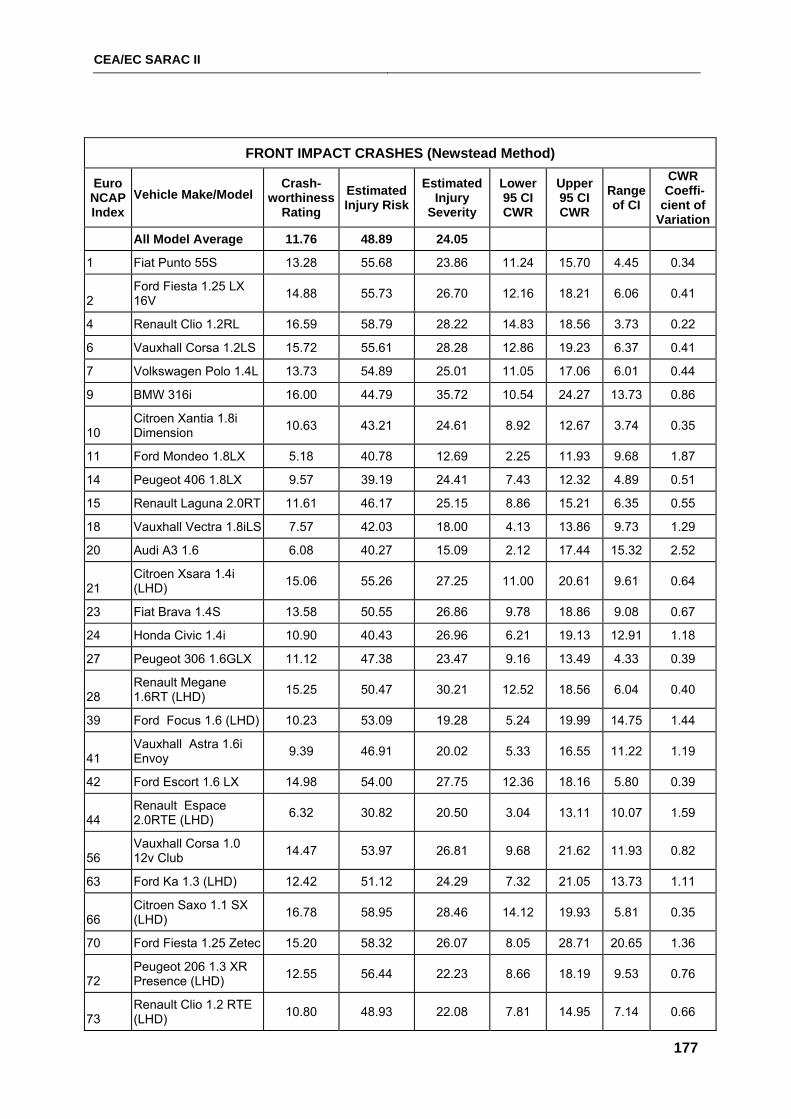
CEA/EC SARAC II
177
FRONT IMPACT CRASHES (Newstead Method)
Euro NCAP Index
Vehicle Make/Model Crash-
worthiness Rating
Estimated Injury Risk
Estimated Injury
Severity
Lower 95 CI CWR
Upper 95 CI CWR
Range of CI
CWR Coeffi-cient of
Variation All Model Average 11.76 48.89 24.05
1 Fiat Punto 55S 13.28 55.68 23.86 11.24 15.70 4.45 0.34
2 Ford Fiesta 1.25 LX 16V 14.88 55.73 26.70 12.16 18.21 6.06 0.41
4 Renault Clio 1.2RL 16.59 58.79 28.22 14.83 18.56 3.73 0.22
6 Vauxhall Corsa 1.2LS 15.72 55.61 28.28 12.86 19.23 6.37 0.41
7 Volkswagen Polo 1.4L 13.73 54.89 25.01 11.05 17.06 6.01 0.44
9 BMW 316i 16.00 44.79 35.72 10.54 24.27 13.73 0.86
10 Citroen Xantia 1.8i Dimension 10.63 43.21 24.61 8.92 12.67 3.74 0.35
11 Ford Mondeo 1.8LX 5.18 40.78 12.69 2.25 11.93 9.68 1.87
14 Peugeot 406 1.8LX 9.57 39.19 24.41 7.43 12.32 4.89 0.51
15 Renault Laguna 2.0RT 11.61 46.17 25.15 8.86 15.21 6.35 0.55
18 Vauxhall Vectra 1.8iLS 7.57 42.03 18.00 4.13 13.86 9.73 1.29
20 Audi A3 1.6 6.08 40.27 15.09 2.12 17.44 15.32 2.52
21 Citroen Xsara 1.4i (LHD) 15.06 55.26 27.25 11.00 20.61 9.61 0.64
23 Fiat Brava 1.4S 13.58 50.55 26.86 9.78 18.86 9.08 0.67
24 Honda Civic 1.4i 10.90 40.43 26.96 6.21 19.13 12.91 1.18
27 Peugeot 306 1.6GLX 11.12 47.38 23.47 9.16 13.49 4.33 0.39
28 Renault Megane 1.6RT (LHD) 15.25 50.47 30.21 12.52 18.56 6.04 0.40
39 Ford Focus 1.6 (LHD) 10.23 53.09 19.28 5.24 19.99 14.75 1.44
41 Vauxhall Astra 1.6i Envoy 9.39 46.91 20.02 5.33 16.55 11.22 1.19
42 Ford Escort 1.6 LX 14.98 54.00 27.75 12.36 18.16 5.80 0.39
44 Renault Espace 2.0RTE (LHD) 6.32 30.82 20.50 3.04 13.11 10.07 1.59
56 Vauxhall Corsa 1.0 12v Club 14.47 53.97 26.81 9.68 21.62 11.93 0.82
63 Ford Ka 1.3 (LHD) 12.42 51.12 24.29 7.32 21.05 13.73 1.11
66 Citroen Saxo 1.1 SX (LHD) 16.78 58.95 28.46 14.12 19.93 5.81 0.35
70 Ford Fiesta 1.25 Zetec 15.20 58.32 26.07 8.05 28.71 20.65 1.36
72 Peugeot 206 1.3 XR Presence (LHD) 12.55 56.44 22.23 8.66 18.19 9.53 0.76
73 Renault Clio 1.2 RTE (LHD) 10.80 48.93 22.08 7.81 14.95 7.14 0.66
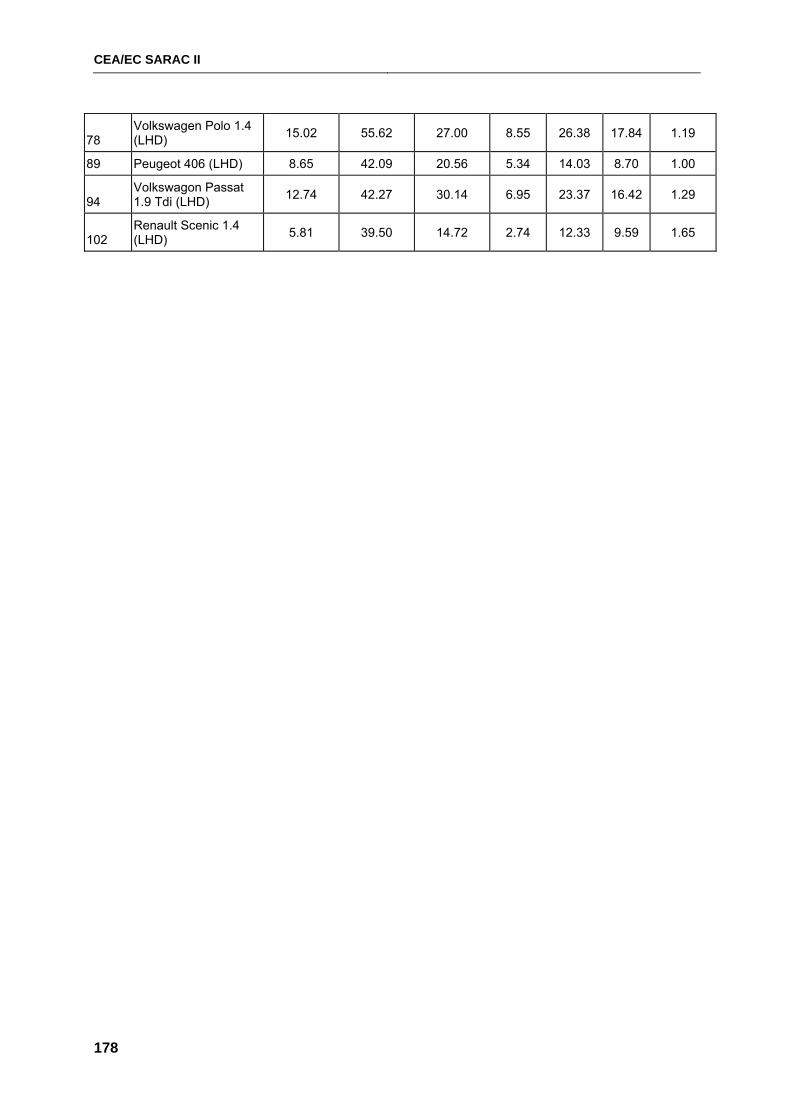
CEA/EC SARAC II
178
78 Volkswagen Polo 1.4 (LHD) 15.02 55.62 27.00 8.55 26.38 17.84 1.19
89 Peugeot 406 (LHD) 8.65 42.09 20.56 5.34 14.03 8.70 1.00
94 Volkswagon Passat 1.9 Tdi (LHD) 12.74 42.27 30.14 6.95 23.37 16.42 1.29
102 Renault Scenic 1.4 (LHD) 5.81 39.50 14.72 2.74 12.33 9.59 1.65
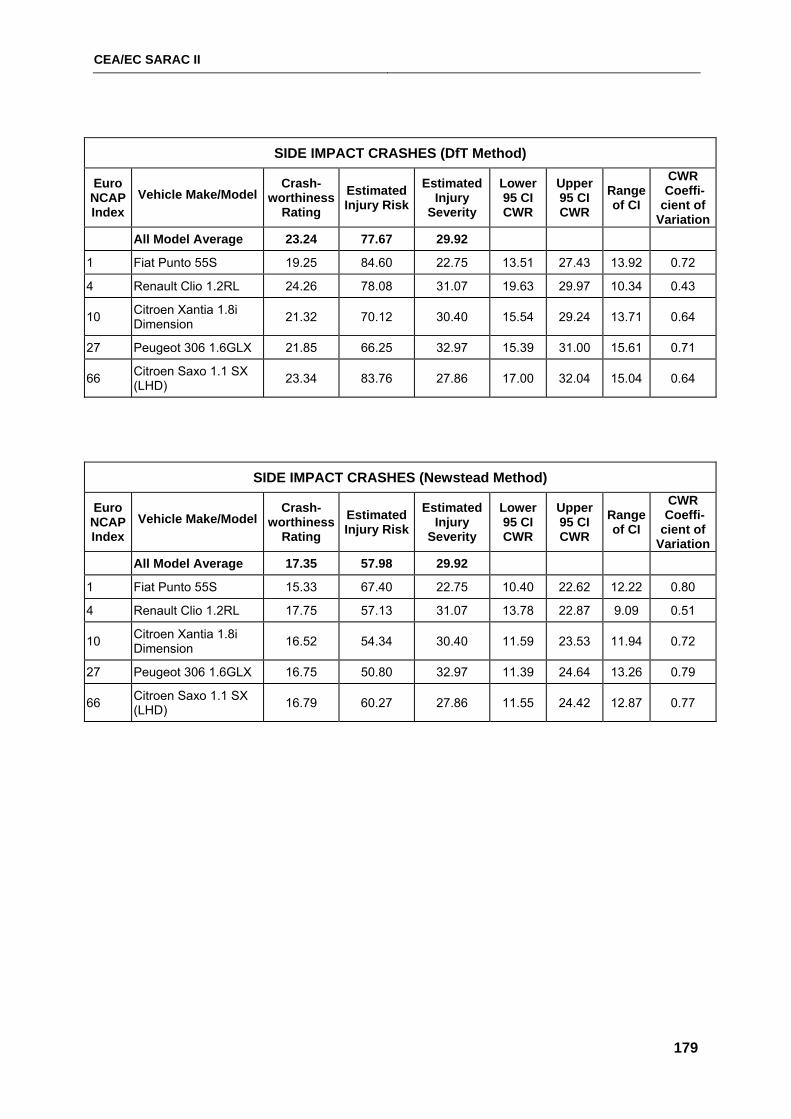
CEA/EC SARAC II
179
SIDE IMPACT CRASHES (DfT Method)
Euro NCAP Index
Vehicle Make/Model Crash-
worthiness Rating
Estimated Injury Risk
Estimated Injury
Severity
Lower 95 CI CWR
Upper 95 CI CWR
Range of CI
CWR Coeffi-cient of
Variation All Model Average 23.24 77.67 29.92
1 Fiat Punto 55S 19.25 84.60 22.75 13.51 27.43 13.92 0.72
4 Renault Clio 1.2RL 24.26 78.08 31.07 19.63 29.97 10.34 0.43
10 Citroen Xantia 1.8i Dimension 21.32 70.12 30.40 15.54 29.24 13.71 0.64
27 Peugeot 306 1.6GLX 21.85 66.25 32.97 15.39 31.00 15.61 0.71
66 Citroen Saxo 1.1 SX (LHD) 23.34 83.76 27.86 17.00 32.04 15.04 0.64
SIDE IMPACT CRASHES (Newstead Method)
Euro NCAP Index
Vehicle Make/Model Crash-
worthiness Rating
Estimated Injury Risk
Estimated Injury
Severity
Lower 95 CI CWR
Upper 95 CI CWR
Range of CI
CWR Coeffi-cient of
Variation All Model Average 17.35 57.98 29.92
1 Fiat Punto 55S 15.33 67.40 22.75 10.40 22.62 12.22 0.80
4 Renault Clio 1.2RL 17.75 57.13 31.07 13.78 22.87 9.09 0.51
10 Citroen Xantia 1.8i Dimension 16.52 54.34 30.40 11.59 23.53 11.94 0.72
27 Peugeot 306 1.6GLX 16.75 50.80 32.97 11.39 24.64 13.26 0.79
66 Citroen Saxo 1.1 SX (LHD) 16.79 60.27 27.86 11.55 24.42 12.87 0.77
CEA/EC SARAC II
180
APPENDIX D
SAFETY RATINGS
ESTIMATED FROM GERMAN REAL CRASH DATA
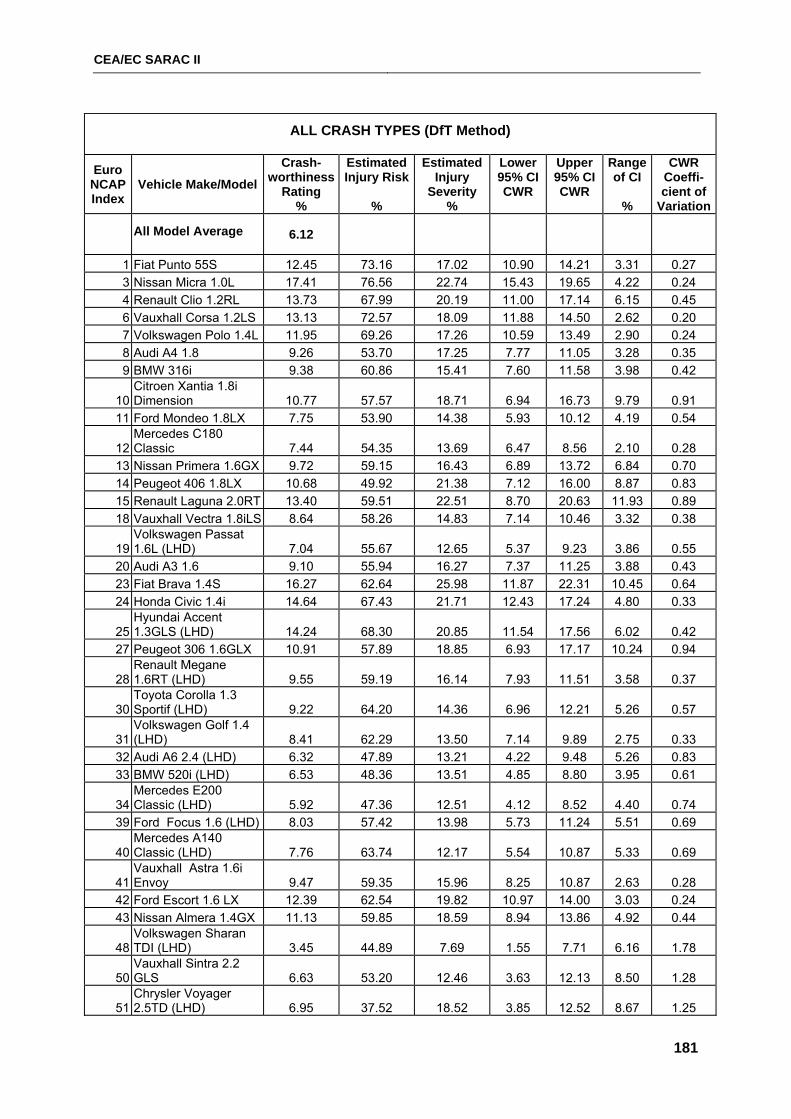
CEA/EC SARAC II
181
ALL CRASH TYPES (DfT Method)
Euro NCAP Index
Vehicle Make/Model Crash-
worthiness Rating
%
Estimated Injury Risk
%
Estimated Injury
Severity %
Lower 95% CI CWR
Upper 95% CI CWR
Range of CI
%
CWR Coeffi-cient of
Variation
All Model Average 6.12
1 Fiat Punto 55S 12.45 73.16 17.02 10.90 14.21 3.31 0.27 3 Nissan Micra 1.0L 17.41 76.56 22.74 15.43 19.65 4.22 0.24 4 Renault Clio 1.2RL 13.73 67.99 20.19 11.00 17.14 6.15 0.45 6 Vauxhall Corsa 1.2LS 13.13 72.57 18.09 11.88 14.50 2.62 0.20 7 Volkswagen Polo 1.4L 11.95 69.26 17.26 10.59 13.49 2.90 0.24 8 Audi A4 1.8 9.26 53.70 17.25 7.77 11.05 3.28 0.35 9 BMW 316i 9.38 60.86 15.41 7.60 11.58 3.98 0.42
10 Citroen Xantia 1.8i Dimension 10.77 57.57 18.71 6.94 16.73 9.79 0.91
11 Ford Mondeo 1.8LX 7.75 53.90 14.38 5.93 10.12 4.19 0.54
12 Mercedes C180 Classic 7.44 54.35 13.69 6.47 8.56 2.10 0.28
13 Nissan Primera 1.6GX 9.72 59.15 16.43 6.89 13.72 6.84 0.70 14 Peugeot 406 1.8LX 10.68 49.92 21.38 7.12 16.00 8.87 0.83 15 Renault Laguna 2.0RT 13.40 59.51 22.51 8.70 20.63 11.93 0.89 18 Vauxhall Vectra 1.8iLS 8.64 58.26 14.83 7.14 10.46 3.32 0.38
19 Volkswagen Passat 1.6L (LHD) 7.04 55.67 12.65 5.37 9.23 3.86 0.55
20 Audi A3 1.6 9.10 55.94 16.27 7.37 11.25 3.88 0.43 23 Fiat Brava 1.4S 16.27 62.64 25.98 11.87 22.31 10.45 0.64 24 Honda Civic 1.4i 14.64 67.43 21.71 12.43 17.24 4.80 0.33
25 Hyundai Accent 1.3GLS (LHD) 14.24 68.30 20.85 11.54 17.56 6.02 0.42
27 Peugeot 306 1.6GLX 10.91 57.89 18.85 6.93 17.17 10.24 0.94
28 Renault Megane 1.6RT (LHD) 9.55 59.19 16.14 7.93 11.51 3.58 0.37
30 Toyota Corolla 1.3 Sportif (LHD) 9.22 64.20 14.36 6.96 12.21 5.26 0.57
31 Volkswagen Golf 1.4 (LHD) 8.41 62.29 13.50 7.14 9.89 2.75 0.33
32 Audi A6 2.4 (LHD) 6.32 47.89 13.21 4.22 9.48 5.26 0.83 33 BMW 520i (LHD) 6.53 48.36 13.51 4.85 8.80 3.95 0.61
34 Mercedes E200 Classic (LHD) 5.92 47.36 12.51 4.12 8.52 4.40 0.74
39 Ford Focus 1.6 (LHD) 8.03 57.42 13.98 5.73 11.24 5.51 0.69
40 Mercedes A140 Classic (LHD) 7.76 63.74 12.17 5.54 10.87 5.33 0.69
41 Vauxhall Astra 1.6i Envoy 9.47 59.35 15.96 8.25 10.87 2.63 0.28
42 Ford Escort 1.6 LX 12.39 62.54 19.82 10.97 14.00 3.03 0.24 43 Nissan Almera 1.4GX 11.13 59.85 18.59 8.94 13.86 4.92 0.44
48 Volkswagen Sharan TDI (LHD) 3.45 44.89 7.69 1.55 7.71 6.16 1.78
50 Vauxhall Sintra 2.2 GLS 6.63 53.20 12.46 3.63 12.13 8.50 1.28
51 Chrysler Voyager 2.5TD (LHD) 6.95 37.52 18.52 3.85 12.52 8.67 1.25
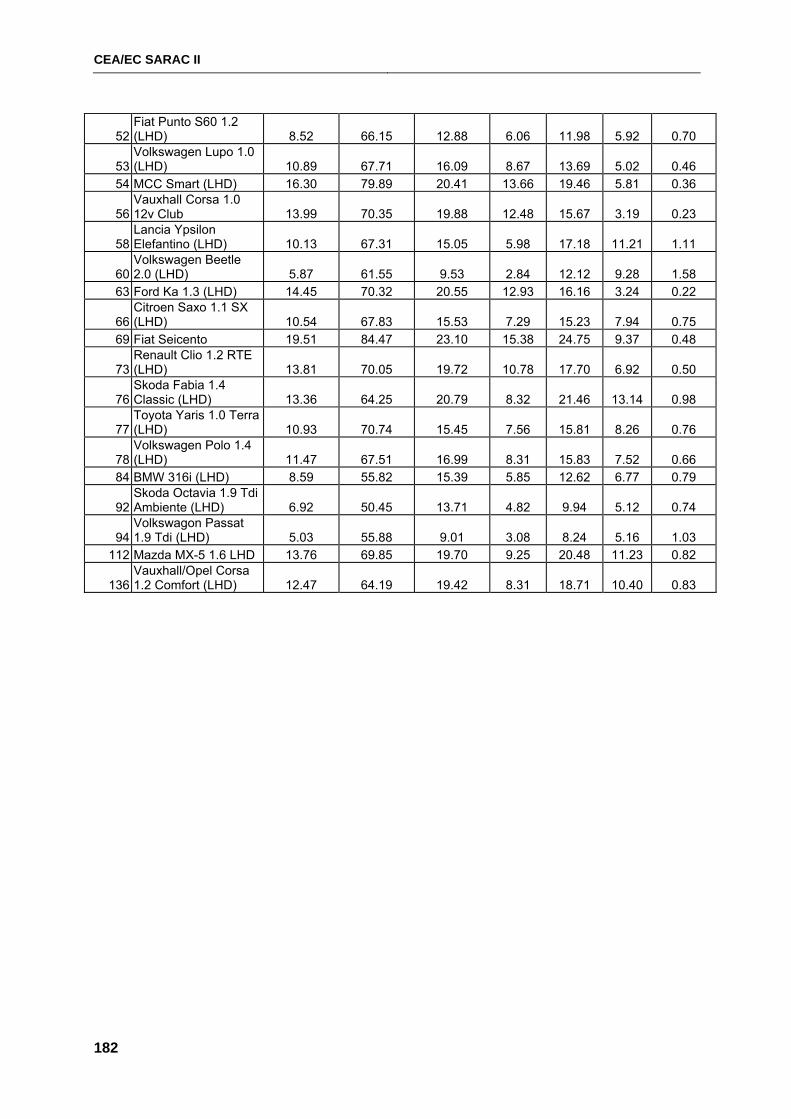
CEA/EC SARAC II
182
52 Fiat Punto S60 1.2 (LHD) 8.52 66.15 12.88 6.06 11.98 5.92 0.70
53 Volkswagen Lupo 1.0 (LHD) 10.89 67.71 16.09 8.67 13.69 5.02 0.46
54 MCC Smart (LHD) 16.30 79.89 20.41 13.66 19.46 5.81 0.36
56 Vauxhall Corsa 1.0 12v Club 13.99 70.35 19.88 12.48 15.67 3.19 0.23
58 Lancia Ypsilon Elefantino (LHD) 10.13 67.31 15.05 5.98 17.18 11.21 1.11
60 Volkswagen Beetle 2.0 (LHD) 5.87 61.55 9.53 2.84 12.12 9.28 1.58
63 Ford Ka 1.3 (LHD) 14.45 70.32 20.55 12.93 16.16 3.24 0.22
66 Citroen Saxo 1.1 SX (LHD) 10.54 67.83 15.53 7.29 15.23 7.94 0.75
69 Fiat Seicento 19.51 84.47 23.10 15.38 24.75 9.37 0.48
73 Renault Clio 1.2 RTE (LHD) 13.81 70.05 19.72 10.78 17.70 6.92 0.50
76 Skoda Fabia 1.4 Classic (LHD) 13.36 64.25 20.79 8.32 21.46 13.14 0.98
77 Toyota Yaris 1.0 Terra (LHD) 10.93 70.74 15.45 7.56 15.81 8.26 0.76
78 Volkswagen Polo 1.4 (LHD) 11.47 67.51 16.99 8.31 15.83 7.52 0.66
84 BMW 316i (LHD) 8.59 55.82 15.39 5.85 12.62 6.77 0.79
92 Skoda Octavia 1.9 Tdi Ambiente (LHD) 6.92 50.45 13.71 4.82 9.94 5.12 0.74
94 Volkswagon Passat 1.9 Tdi (LHD) 5.03 55.88 9.01 3.08 8.24 5.16 1.03
112 Mazda MX-5 1.6 LHD 13.76 69.85 19.70 9.25 20.48 11.23 0.82
136 Vauxhall/Opel Corsa 1.2 Comfort (LHD) 12.47 64.19 19.42 8.31 18.71 10.40 0.83
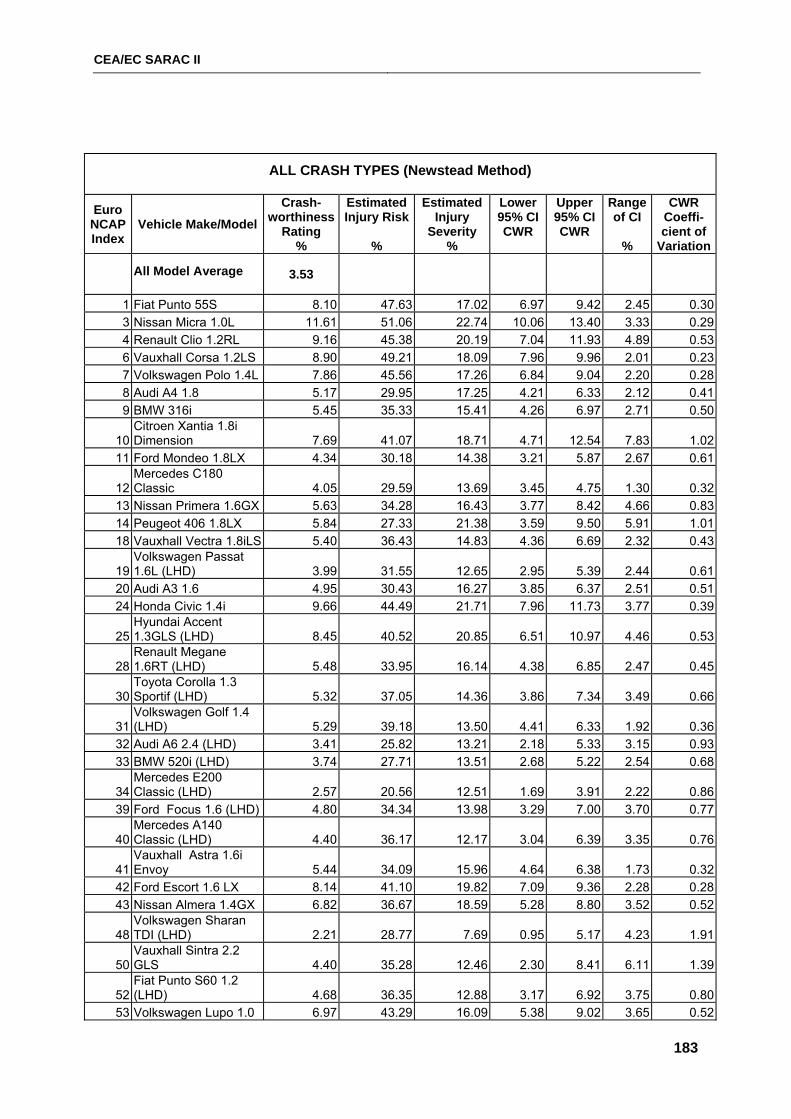
CEA/EC SARAC II
183
ALL CRASH TYPES (Newstead Method)
Euro NCAP Index
Vehicle Make/Model Crash-
worthiness Rating
%
Estimated Injury Risk
%
Estimated Injury
Severity %
Lower 95% CI CWR
Upper 95% CI CWR
Range of CI
%
CWR Coeffi-cient of
Variation
All Model Average 3.53
1 Fiat Punto 55S 8.10 47.63 17.02 6.97 9.42 2.45 0.303 Nissan Micra 1.0L 11.61 51.06 22.74 10.06 13.40 3.33 0.294 Renault Clio 1.2RL 9.16 45.38 20.19 7.04 11.93 4.89 0.536 Vauxhall Corsa 1.2LS 8.90 49.21 18.09 7.96 9.96 2.01 0.237 Volkswagen Polo 1.4L 7.86 45.56 17.26 6.84 9.04 2.20 0.288 Audi A4 1.8 5.17 29.95 17.25 4.21 6.33 2.12 0.419 BMW 316i 5.45 35.33 15.41 4.26 6.97 2.71 0.50
10 Citroen Xantia 1.8i Dimension 7.69 41.07 18.71 4.71 12.54 7.83 1.02
11 Ford Mondeo 1.8LX 4.34 30.18 14.38 3.21 5.87 2.67 0.61
12 Mercedes C180 Classic 4.05 29.59 13.69 3.45 4.75 1.30 0.32
13 Nissan Primera 1.6GX 5.63 34.28 16.43 3.77 8.42 4.66 0.8314 Peugeot 406 1.8LX 5.84 27.33 21.38 3.59 9.50 5.91 1.0118 Vauxhall Vectra 1.8iLS 5.40 36.43 14.83 4.36 6.69 2.32 0.43
19 Volkswagen Passat 1.6L (LHD) 3.99 31.55 12.65 2.95 5.39 2.44 0.61
20 Audi A3 1.6 4.95 30.43 16.27 3.85 6.37 2.51 0.5124 Honda Civic 1.4i 9.66 44.49 21.71 7.96 11.73 3.77 0.39
25 Hyundai Accent 1.3GLS (LHD) 8.45 40.52 20.85 6.51 10.97 4.46 0.53
28 Renault Megane 1.6RT (LHD) 5.48 33.95 16.14 4.38 6.85 2.47 0.45
30 Toyota Corolla 1.3 Sportif (LHD) 5.32 37.05 14.36 3.86 7.34 3.49 0.66
31 Volkswagen Golf 1.4 (LHD) 5.29 39.18 13.50 4.41 6.33 1.92 0.36
32 Audi A6 2.4 (LHD) 3.41 25.82 13.21 2.18 5.33 3.15 0.9333 BMW 520i (LHD) 3.74 27.71 13.51 2.68 5.22 2.54 0.68
34 Mercedes E200 Classic (LHD) 2.57 20.56 12.51 1.69 3.91 2.22 0.86
39 Ford Focus 1.6 (LHD) 4.80 34.34 13.98 3.29 7.00 3.70 0.77
40 Mercedes A140 Classic (LHD) 4.40 36.17 12.17 3.04 6.39 3.35 0.76
41 Vauxhall Astra 1.6i Envoy 5.44 34.09 15.96 4.64 6.38 1.73 0.32
42 Ford Escort 1.6 LX 8.14 41.10 19.82 7.09 9.36 2.28 0.2843 Nissan Almera 1.4GX 6.82 36.67 18.59 5.28 8.80 3.52 0.52
48 Volkswagen Sharan TDI (LHD) 2.21 28.77 7.69 0.95 5.17 4.23 1.91
50 Vauxhall Sintra 2.2 GLS 4.40 35.28 12.46 2.30 8.41 6.11 1.39
52 Fiat Punto S60 1.2 (LHD) 4.68 36.35 12.88 3.17 6.92 3.75 0.80
53 Volkswagen Lupo 1.0 6.97 43.29 16.09 5.38 9.02 3.65 0.52
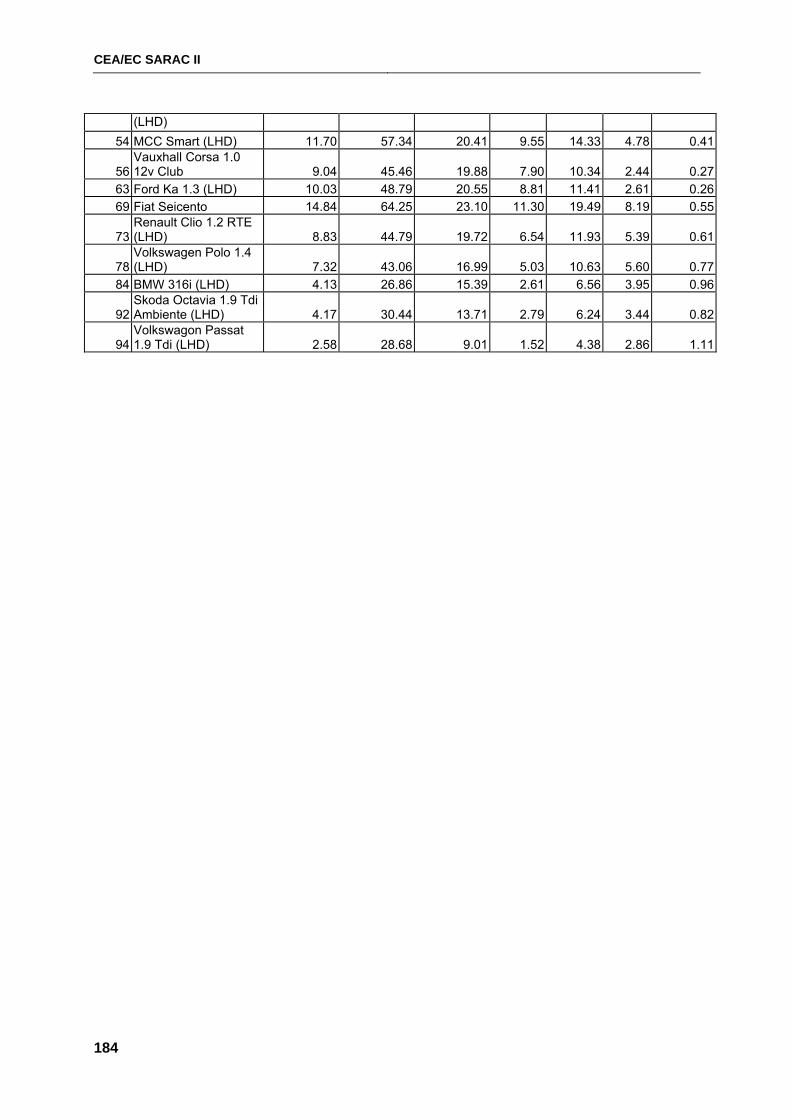
CEA/EC SARAC II
184
(LHD) 54 MCC Smart (LHD) 11.70 57.34 20.41 9.55 14.33 4.78 0.41
56 Vauxhall Corsa 1.0 12v Club 9.04 45.46 19.88 7.90 10.34 2.44 0.27
63 Ford Ka 1.3 (LHD) 10.03 48.79 20.55 8.81 11.41 2.61 0.2669 Fiat Seicento 14.84 64.25 23.10 11.30 19.49 8.19 0.55
73 Renault Clio 1.2 RTE (LHD) 8.83 44.79 19.72 6.54 11.93 5.39 0.61
78 Volkswagen Polo 1.4 (LHD) 7.32 43.06 16.99 5.03 10.63 5.60 0.77
84 BMW 316i (LHD) 4.13 26.86 15.39 2.61 6.56 3.95 0.96
92 Skoda Octavia 1.9 Tdi Ambiente (LHD) 4.17 30.44 13.71 2.79 6.24 3.44 0.82
94 Volkswagon Passat 1.9 Tdi (LHD) 2.58 28.68 9.01 1.52 4.38 2.86 1.11
CEA/EC SARAC II
185
APPENDIX E
SAFETY RATINGS ESTIMATED FROM AUSTRALIAN AND
NEW ZEALAND REAL CRASH DATA
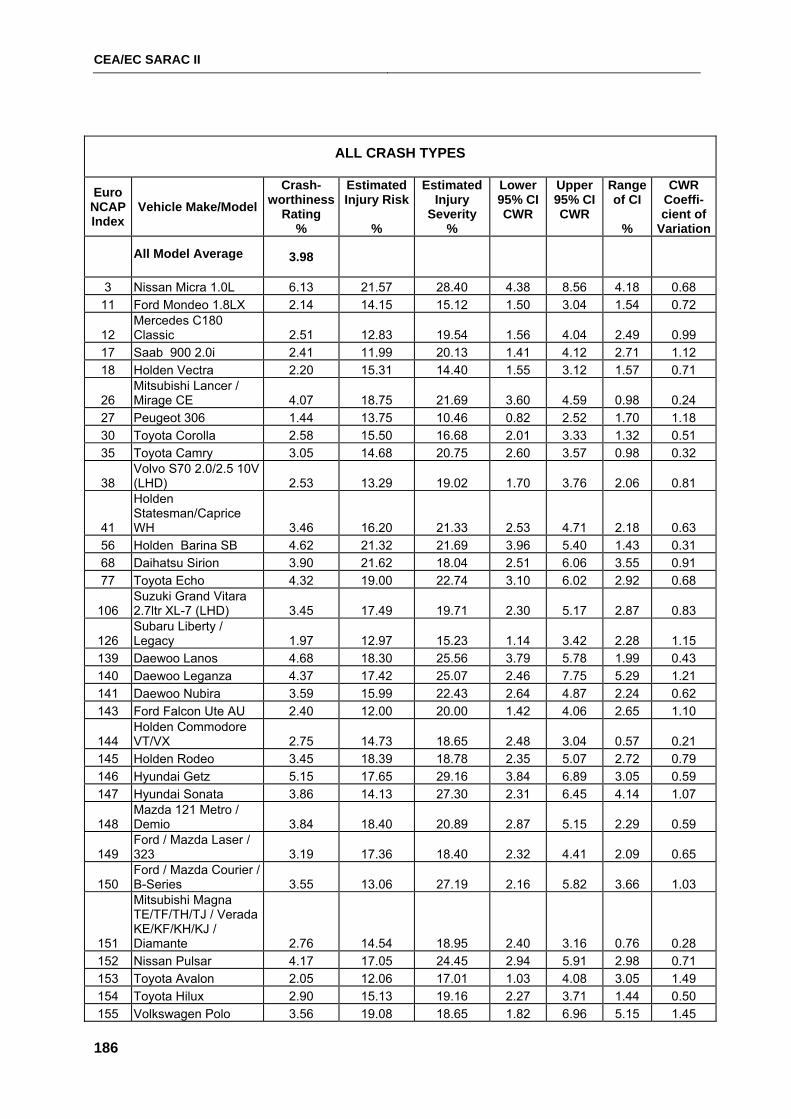
CEA/EC SARAC II
186
ALL CRASH TYPES
Euro NCAP Index
Vehicle Make/Model Crash-
worthiness Rating
%
Estimated Injury Risk
%
Estimated Injury
Severity %
Lower 95% CI CWR
Upper 95% CI CWR
Range of CI
%
CWR Coeffi-cient of
Variation
All Model Average 3.98
3 Nissan Micra 1.0L 6.13 21.57 28.40 4.38 8.56 4.18 0.68 11 Ford Mondeo 1.8LX 2.14 14.15 15.12 1.50 3.04 1.54 0.72
12 Mercedes C180 Classic 2.51 12.83 19.54 1.56 4.04 2.49 0.99
17 Saab 900 2.0i 2.41 11.99 20.13 1.41 4.12 2.71 1.12 18 Holden Vectra 2.20 15.31 14.40 1.55 3.12 1.57 0.71
26 Mitsubishi Lancer / Mirage CE 4.07 18.75 21.69 3.60 4.59 0.98 0.24
27 Peugeot 306 1.44 13.75 10.46 0.82 2.52 1.70 1.18 30 Toyota Corolla 2.58 15.50 16.68 2.01 3.33 1.32 0.51 35 Toyota Camry 3.05 14.68 20.75 2.60 3.57 0.98 0.32
38 Volvo S70 2.0/2.5 10V (LHD) 2.53 13.29 19.02 1.70 3.76 2.06 0.81
41
Holden Statesman/Caprice WH 3.46 16.20 21.33 2.53 4.71 2.18 0.63
56 Holden Barina SB 4.62 21.32 21.69 3.96 5.40 1.43 0.31 68 Daihatsu Sirion 3.90 21.62 18.04 2.51 6.06 3.55 0.91 77 Toyota Echo 4.32 19.00 22.74 3.10 6.02 2.92 0.68
106 Suzuki Grand Vitara 2.7ltr XL-7 (LHD) 3.45 17.49 19.71 2.30 5.17 2.87 0.83
126 Subaru Liberty / Legacy 1.97 12.97 15.23 1.14 3.42 2.28 1.15
139 Daewoo Lanos 4.68 18.30 25.56 3.79 5.78 1.99 0.43 140 Daewoo Leganza 4.37 17.42 25.07 2.46 7.75 5.29 1.21 141 Daewoo Nubira 3.59 15.99 22.43 2.64 4.87 2.24 0.62 143 Ford Falcon Ute AU 2.40 12.00 20.00 1.42 4.06 2.65 1.10
144 Holden Commodore VT/VX 2.75 14.73 18.65 2.48 3.04 0.57 0.21
145 Holden Rodeo 3.45 18.39 18.78 2.35 5.07 2.72 0.79 146 Hyundai Getz 5.15 17.65 29.16 3.84 6.89 3.05 0.59 147 Hyundai Sonata 3.86 14.13 27.30 2.31 6.45 4.14 1.07
148 Mazda 121 Metro / Demio 3.84 18.40 20.89 2.87 5.15 2.29 0.59
149 Ford / Mazda Laser / 323 3.19 17.36 18.40 2.32 4.41 2.09 0.65
150 Ford / Mazda Courier / B-Series 3.55 13.06 27.19 2.16 5.82 3.66 1.03
151
Mitsubishi Magna TE/TF/TH/TJ / Verada KE/KF/KH/KJ / Diamante 2.76 14.54 18.95 2.40 3.16 0.76 0.28
152 Nissan Pulsar 4.17 17.05 24.45 2.94 5.91 2.98 0.71 153 Toyota Avalon 2.05 12.06 17.01 1.03 4.08 3.05 1.49 154 Toyota Hilux 2.90 15.13 19.16 2.27 3.71 1.44 0.50 155 Volkswagen Polo 3.56 19.08 18.65 1.82 6.96 5.15 1.45

CEA/EC SARAC II
187
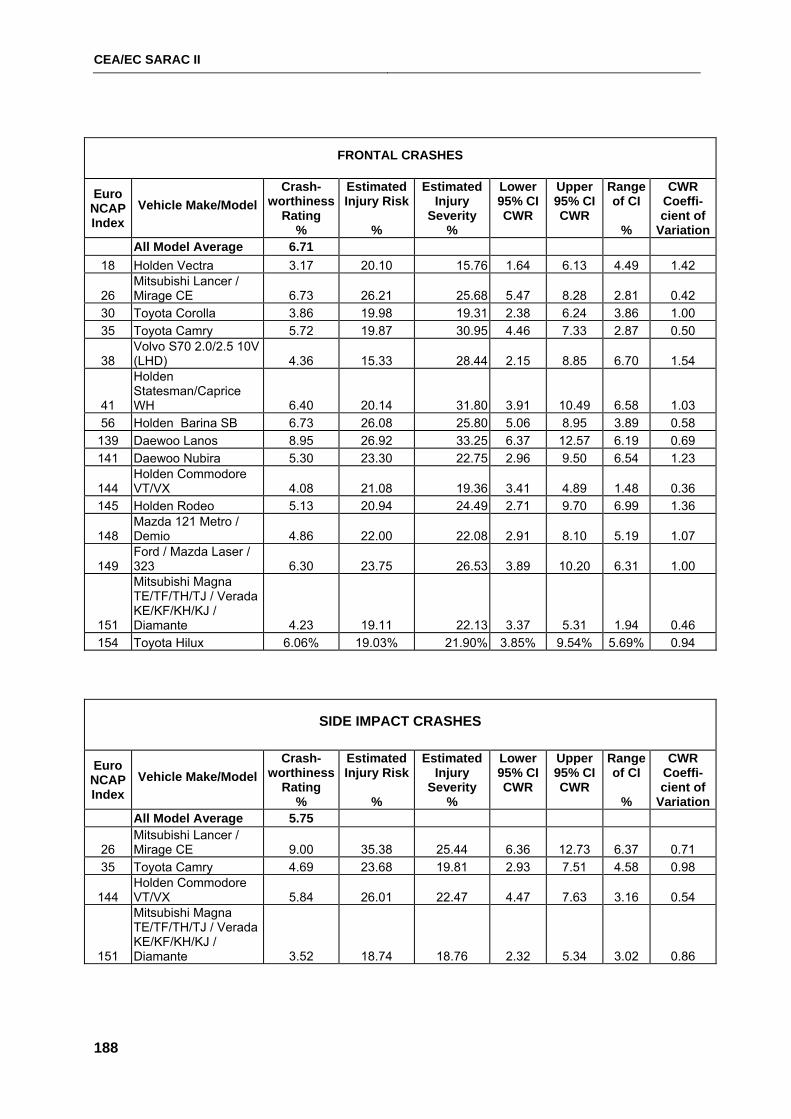
CEA/EC SARAC II
188
FRONTAL CRASHES
Euro NCAP Index
Vehicle Make/Model Crash-
worthiness Rating
%
Estimated Injury Risk
%
Estimated Injury
Severity %
Lower 95% CI CWR
Upper 95% CI CWR
Range of CI
%
CWR Coeffi- cient of
Variation All Model Average 6.71
18 Holden Vectra 3.17 20.10 15.76 1.64 6.13 4.49 1.42
26 Mitsubishi Lancer / Mirage CE 6.73 26.21 25.68 5.47 8.28 2.81 0.42
30 Toyota Corolla 3.86 19.98 19.31 2.38 6.24 3.86 1.00 35 Toyota Camry 5.72 19.87 30.95 4.46 7.33 2.87 0.50
38 Volvo S70 2.0/2.5 10V (LHD) 4.36 15.33 28.44 2.15 8.85 6.70 1.54
41
Holden Statesman/Caprice WH 6.40 20.14 31.80 3.91 10.49 6.58 1.03
56 Holden Barina SB 6.73 26.08 25.80 5.06 8.95 3.89 0.58 139 Daewoo Lanos 8.95 26.92 33.25 6.37 12.57 6.19 0.69 141 Daewoo Nubira 5.30 23.30 22.75 2.96 9.50 6.54 1.23
144 Holden Commodore VT/VX 4.08 21.08 19.36 3.41 4.89 1.48 0.36
145 Holden Rodeo 5.13 20.94 24.49 2.71 9.70 6.99 1.36
148 Mazda 121 Metro / Demio 4.86 22.00 22.08 2.91 8.10 5.19 1.07
149 Ford / Mazda Laser / 323 6.30 23.75 26.53 3.89 10.20 6.31 1.00
151
Mitsubishi Magna TE/TF/TH/TJ / Verada KE/KF/KH/KJ / Diamante 4.23 19.11 22.13 3.37 5.31 1.94 0.46
154 Toyota Hilux 6.06% 19.03% 21.90% 3.85% 9.54% 5.69% 0.94
SIDE IMPACT CRASHES
Euro NCAP Index
Vehicle Make/Model Crash-
worthiness Rating
%
Estimated Injury Risk
%
Estimated Injury
Severity %
Lower 95% CI CWR
Upper 95% CI CWR
Range of CI
%
CWR Coeffi- cient of
Variation All Model Average 5.75
26 Mitsubishi Lancer / Mirage CE 9.00 35.38 25.44 6.36 12.73 6.37 0.71
35 Toyota Camry 4.69 23.68 19.81 2.93 7.51 4.58 0.98
144 Holden Commodore VT/VX 5.84 26.01 22.47 4.47 7.63 3.16 0.54
151
Mitsubishi Magna TE/TF/TH/TJ / Verada KE/KF/KH/KJ / Diamante 3.52 18.74 18.76 2.32 5.34 3.02 0.86
CEA/EC SARAC II
189
APPENDIX F
RELATIONSHIPS BEWEEN EuroNCAP SCORES BY TEST
CONFIGURATION AND REAL CRASH MEASURES DERIVED FROM BRITISH DATA
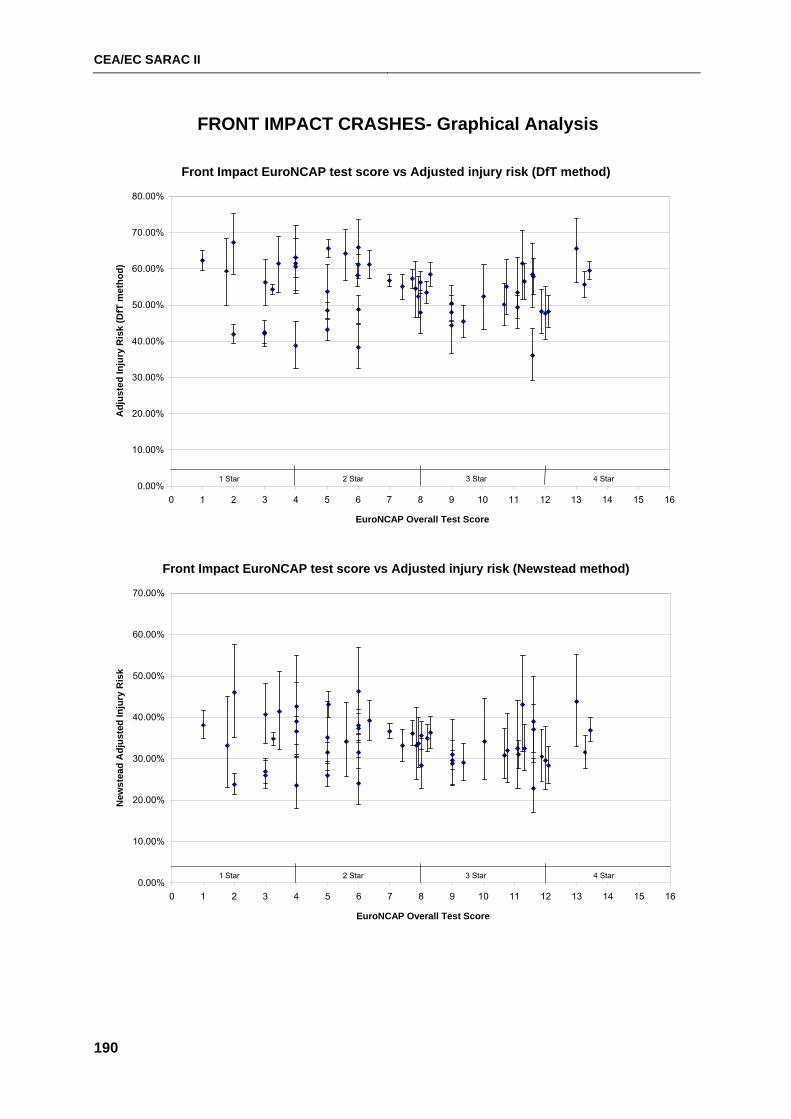
CEA/EC SARAC II
190
FRONT IMPACT CRASHES- Graphical Analysis
Front Impact EuroNCAP test score vs Adjusted injury risk (DfT method)
0.00%
10.00%
20.00%
30.00%
40.00%
50.00%
60.00%
70.00%
80.00%
0 1 2 3 4 5 6 7 8 9 10 11 12 13 14 15 16
EuroNCAP Overall Test Score
Adj
uste
d In
jury
Ris
k (D
fT m
etho
d)
1 Star 2 Star 3 Star 4 Star
Front Impact EuroNCAP test score vs Adjusted injury risk (Newstead method)
0.00%
10.00%
20.00%
30.00%
40.00%
50.00%
60.00%
70.00%
0 1 2 3 4 5 6 7 8 9 10 11 12 13 14 15 16
EuroNCAP Overall Test Score
New
stea
d A
djus
ted
Inju
ry R
isk
1 Star 2 Star 3 Star 4 Star
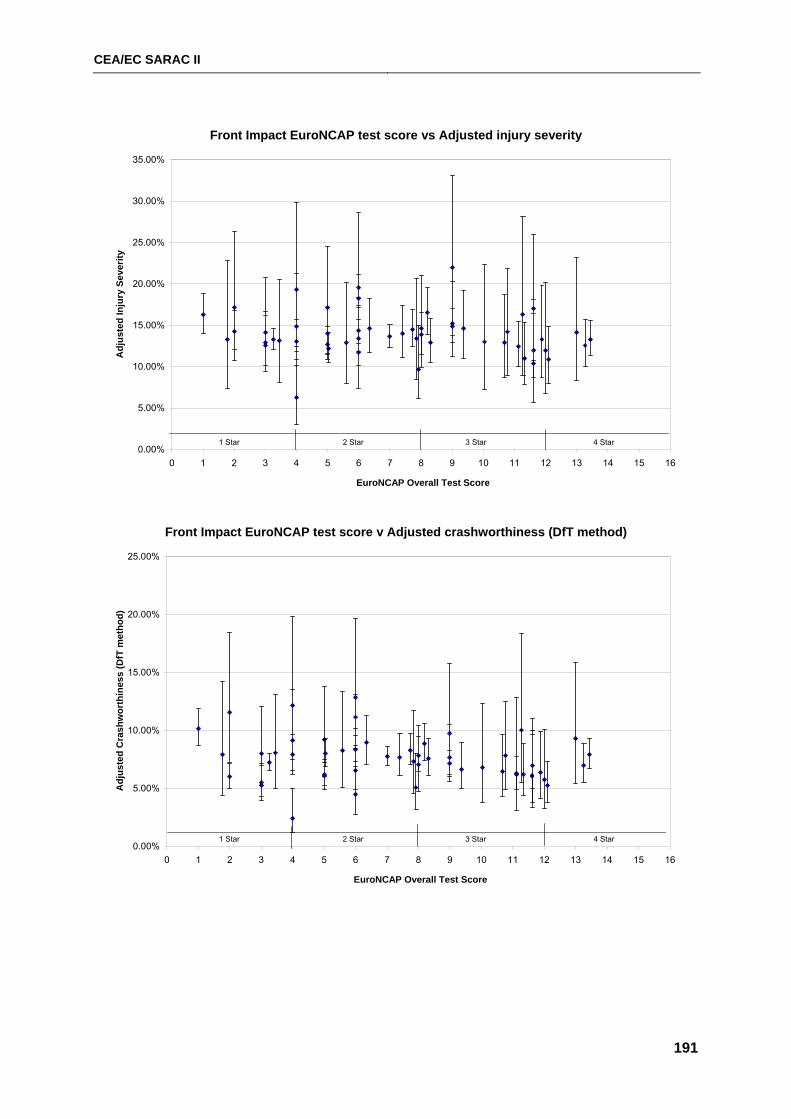
CEA/EC SARAC II
191
Front Impact EuroNCAP test score vs Adjusted injury severity
0.00%
5.00%
10.00%
15.00%
20.00%
25.00%
30.00%
35.00%
0 1 2 3 4 5 6 7 8 9 10 11 12 13 14 15 16
EuroNCAP Overall Test Score
Adj
uste
d In
jury
Sev
erity
1 Star 2 Star 3 Star 4 Star
Front Impact EuroNCAP test score v Adjusted crashworthiness (DfT method)
0.00%
5.00%
10.00%
15.00%
20.00%
25.00%
0 1 2 3 4 5 6 7 8 9 10 11 12 13 14 15 16
EuroNCAP Overall Test Score
Adj
uste
d C
rash
wor
thin
ess
(DfT
met
hod)
1 Star 2 Star 3 Star 4 Star
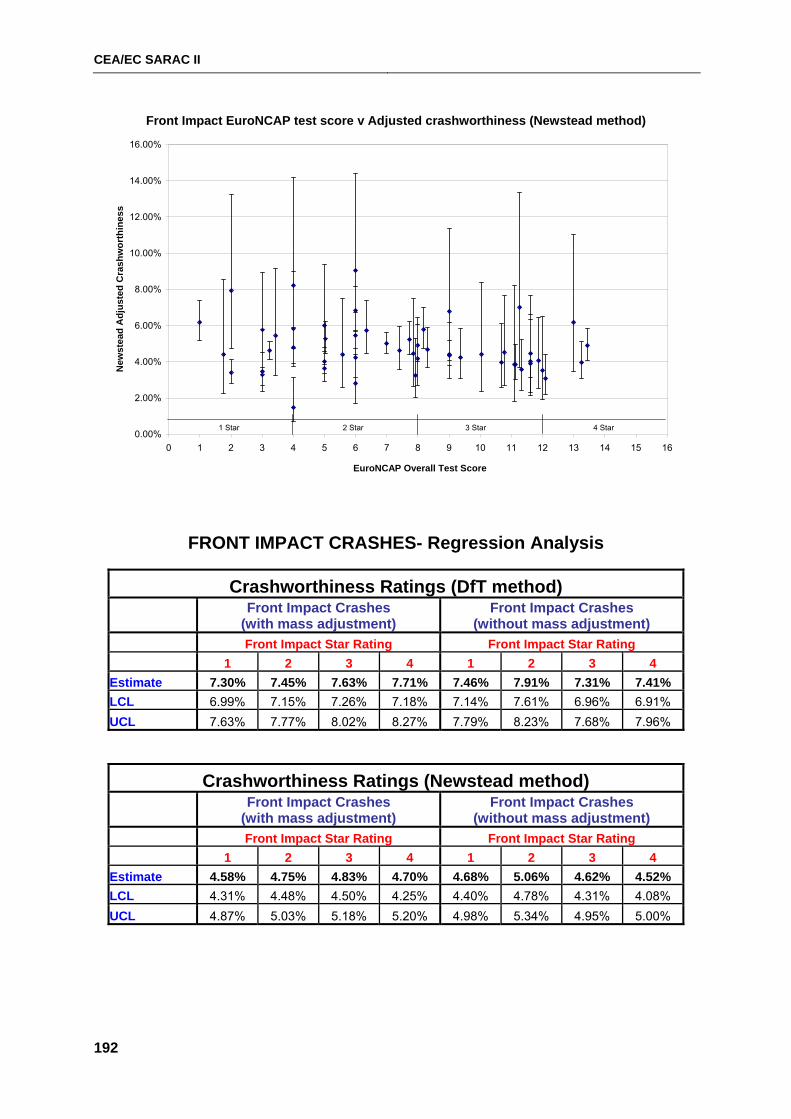
CEA/EC SARAC II
192
Front Impact EuroNCAP test score v Adjusted crashworthiness (Newstead method)
0.00%
2.00%
4.00%
6.00%
8.00%
10.00%
12.00%
14.00%
16.00%
0 1 2 3 4 5 6 7 8 9 10 11 12 13 14 15 16
EuroNCAP Overall Test Score
New
stea
d A
djus
ted
Cra
shw
orth
ines
s
1 Star 2 Star 3 Star 4 Star
FRONT IMPACT CRASHES- Regression Analysis
Crashworthiness Ratings (DfT method)
Front Impact Crashes
(with mass adjustment) Front Impact Crashes
(without mass adjustment) Front Impact Star Rating Front Impact Star Rating 1 2 3 4 1 2 3 4 Estimate 7.30% 7.45% 7.63% 7.71% 7.46% 7.91% 7.31% 7.41% LCL 6.99% 7.15% 7.26% 7.18% 7.14% 7.61% 6.96% 6.91% UCL 7.63% 7.77% 8.02% 8.27% 7.79% 8.23% 7.68% 7.96%
Crashworthiness Ratings (Newstead method)
Front Impact Crashes
(with mass adjustment) Front Impact Crashes
(without mass adjustment) Front Impact Star Rating Front Impact Star Rating 1 2 3 4 1 2 3 4 Estimate 4.58% 4.75% 4.83% 4.70% 4.68% 5.06% 4.62% 4.52% LCL 4.31% 4.48% 4.50% 4.25% 4.40% 4.78% 4.31% 4.08% UCL 4.87% 5.03% 5.18% 5.20% 4.98% 5.34% 4.95% 5.00%
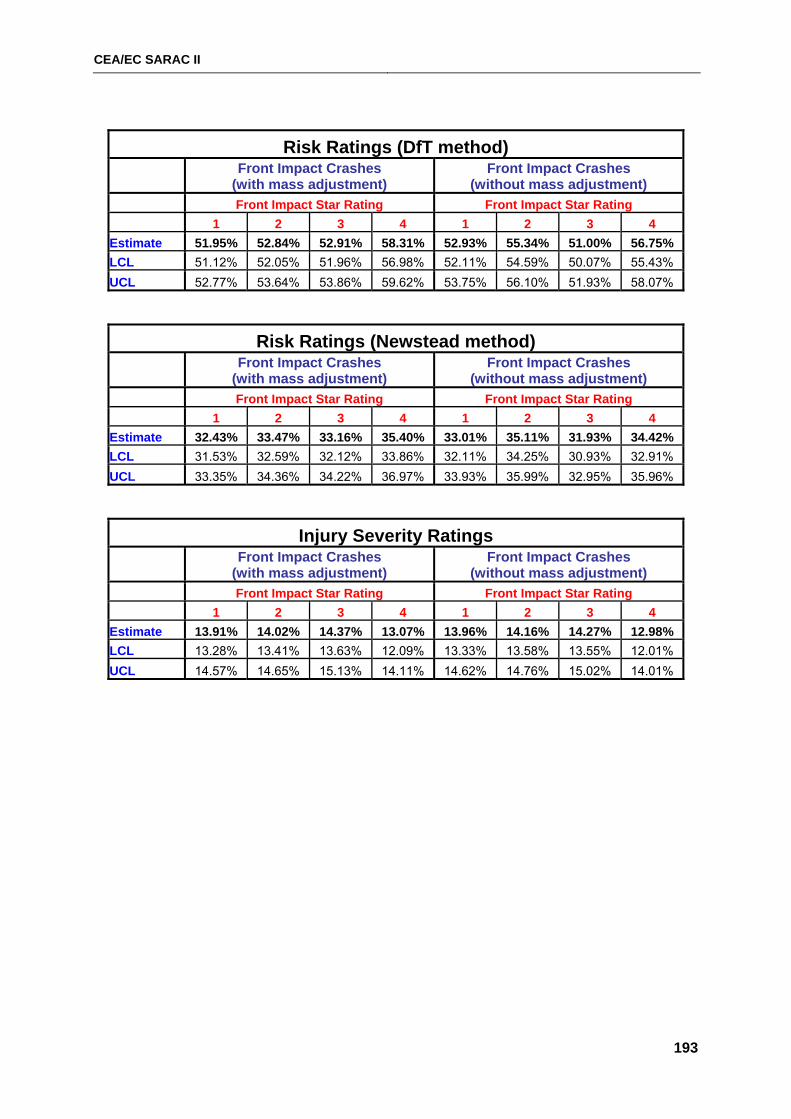
CEA/EC SARAC II
193
Risk Ratings (DfT method)
Front Impact Crashes
(with mass adjustment) Front Impact Crashes
(without mass adjustment) Front Impact Star Rating Front Impact Star Rating 1 2 3 4 1 2 3 4 Estimate 51.95% 52.84% 52.91% 58.31% 52.93% 55.34% 51.00% 56.75% LCL 51.12% 52.05% 51.96% 56.98% 52.11% 54.59% 50.07% 55.43% UCL 52.77% 53.64% 53.86% 59.62% 53.75% 56.10% 51.93% 58.07%
Risk Ratings (Newstead method)
Front Impact Crashes
(with mass adjustment) Front Impact Crashes
(without mass adjustment) Front Impact Star Rating Front Impact Star Rating 1 2 3 4 1 2 3 4 Estimate 32.43% 33.47% 33.16% 35.40% 33.01% 35.11% 31.93% 34.42% LCL 31.53% 32.59% 32.12% 33.86% 32.11% 34.25% 30.93% 32.91% UCL 33.35% 34.36% 34.22% 36.97% 33.93% 35.99% 32.95% 35.96%
Injury Severity Ratings
Front Impact Crashes
(with mass adjustment) Front Impact Crashes
(without mass adjustment) Front Impact Star Rating Front Impact Star Rating 1 2 3 4 1 2 3 4 Estimate 13.91% 14.02% 14.37% 13.07% 13.96% 14.16% 14.27% 12.98% LCL 13.28% 13.41% 13.63% 12.09% 13.33% 13.58% 13.55% 12.01% UCL 14.57% 14.65% 15.13% 14.11% 14.62% 14.76% 15.02% 14.01%
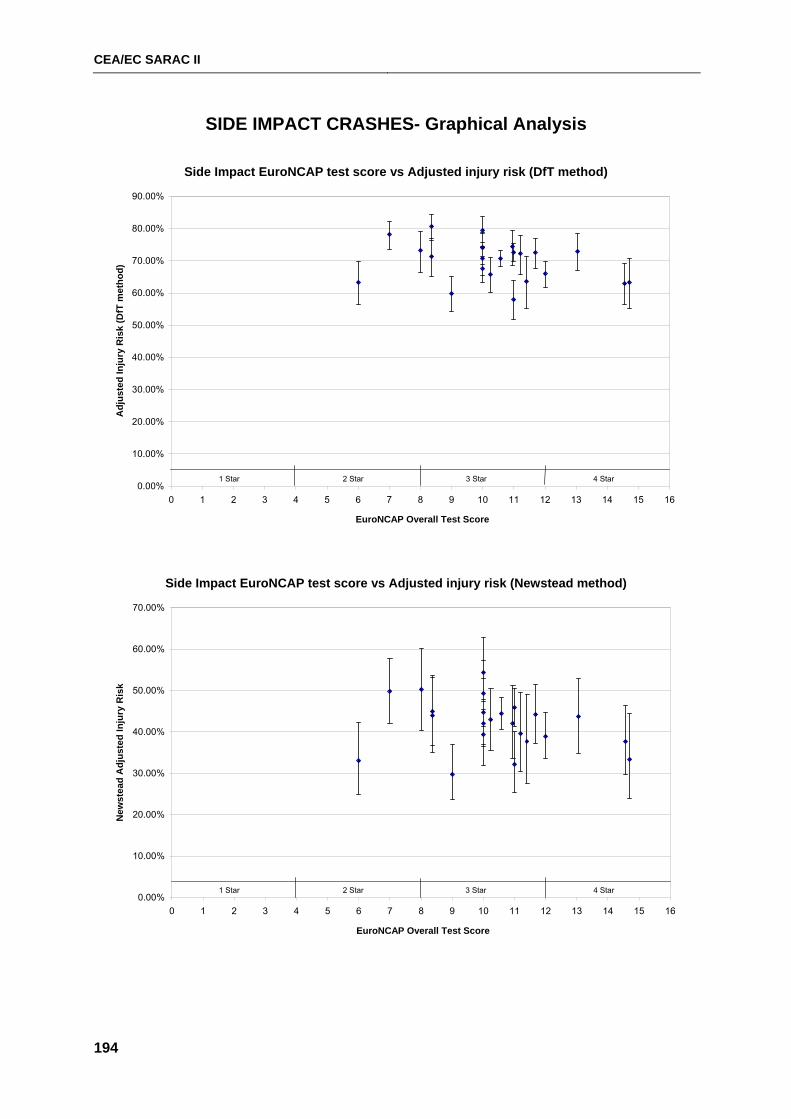
CEA/EC SARAC II
194
SIDE IMPACT CRASHES- Graphical Analysis
Side Impact EuroNCAP test score vs Adjusted injury risk (DfT method)
0.00%
10.00%
20.00%
30.00%
40.00%
50.00%
60.00%
70.00%
80.00%
90.00%
0 1 2 3 4 5 6 7 8 9 10 11 12 13 14 15 16
EuroNCAP Overall Test Score
Adj
uste
d In
jury
Ris
k (D
fT m
etho
d)
1 Star 2 Star 3 Star 4 Star
Side Impact EuroNCAP test score vs Adjusted injury risk (Newstead method)
0.00%
10.00%
20.00%
30.00%
40.00%
50.00%
60.00%
70.00%
0 1 2 3 4 5 6 7 8 9 10 11 12 13 14 15 16
EuroNCAP Overall Test Score
New
stea
d A
djus
ted
Inju
ry R
isk
1 Star 2 Star 3 Star 4 Star
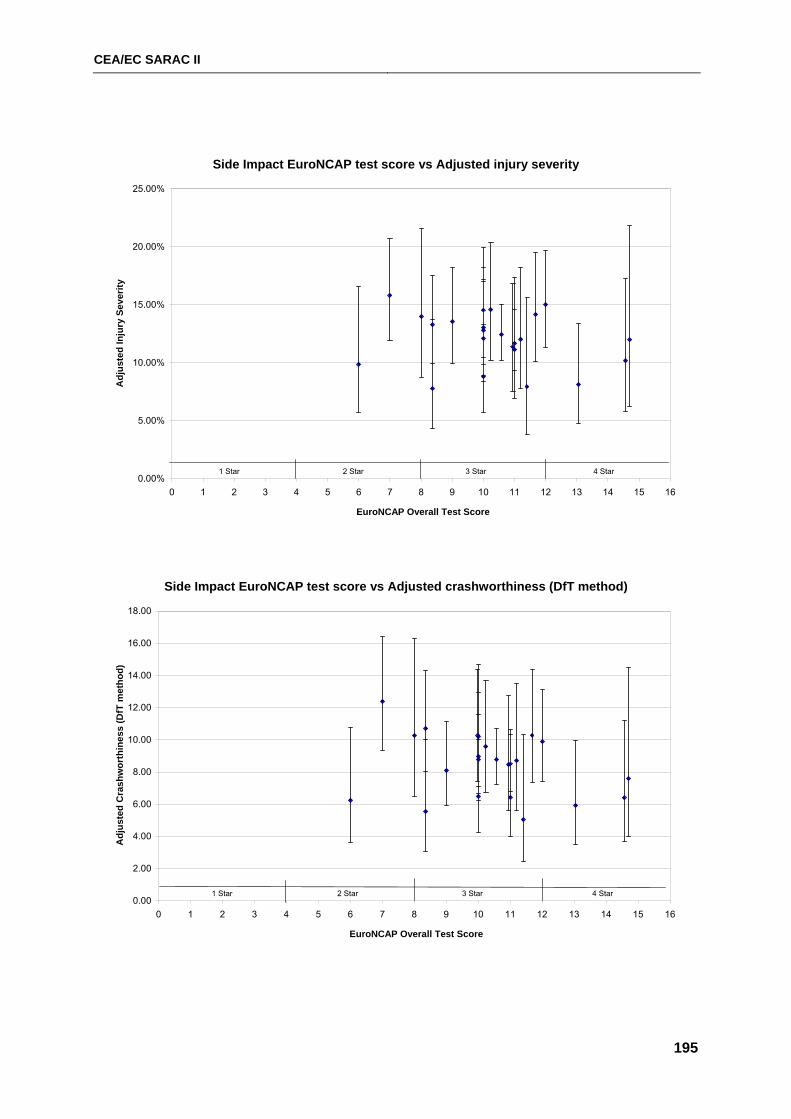
CEA/EC SARAC II
195
Side Impact EuroNCAP test score vs Adjusted injury severity
0.00%
5.00%
10.00%
15.00%
20.00%
25.00%
0 1 2 3 4 5 6 7 8 9 10 11 12 13 14 15 16
EuroNCAP Overall Test Score
Adj
uste
d In
jury
Sev
erity
1 Star 2 Star 3 Star 4 Star
Side Impact EuroNCAP test score vs Adjusted crashworthiness (DfT method)
0.00
2.00
4.00
6.00
8.00
10.00
12.00
14.00
16.00
18.00
0 1 2 3 4 5 6 7 8 9 10 11 12 13 14 15 16
EuroNCAP Overall Test Score
Adj
uste
d C
rash
wor
thin
ess
(DfT
met
hod)
1 Star 2 Star 3 Star 4 Star
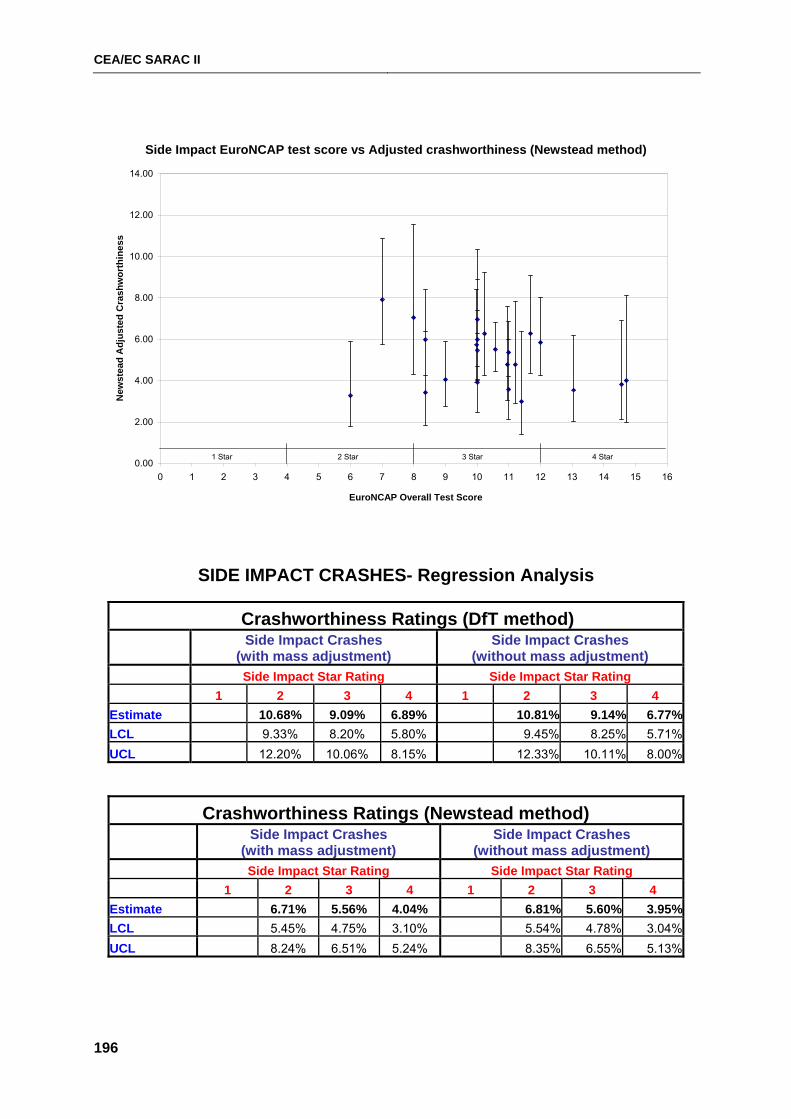
CEA/EC SARAC II
196
Side Impact EuroNCAP test score vs Adjusted crashworthiness (Newstead method)
0.00
2.00
4.00
6.00
8.00
10.00
12.00
14.00
0 1 2 3 4 5 6 7 8 9 10 11 12 13 14 15 16
EuroNCAP Overall Test Score
New
stea
d A
djus
ted
Cra
shw
orth
ines
s
1 Star 2 Star 3 Star 4 Star
SIDE IMPACT CRASHES- Regression Analysis
Crashworthiness Ratings (DfT method)
Side Impact Crashes
(with mass adjustment) Side Impact Crashes
(without mass adjustment) Side Impact Star Rating Side Impact Star Rating 1 2 3 4 1 2 3 4 Estimate 10.68% 9.09% 6.89% 10.81% 9.14% 6.77%LCL 9.33% 8.20% 5.80% 9.45% 8.25% 5.71%UCL 0.00% 12.20% 10.06% 8.15% 0.00% 12.33% 10.11% 8.00%
Crashworthiness Ratings (Newstead method)
Side Impact Crashes
(with mass adjustment) Side Impact Crashes
(without mass adjustment) Side Impact Star Rating Side Impact Star Rating 1 2 3 4 1 2 3 4 Estimate 6.71% 5.56% 4.04% 6.81% 5.60% 3.95%LCL 5.45% 4.75% 3.10% 5.54% 4.78% 3.04%UCL 0.00% 8.24% 6.51% 5.24% 0.00% 8.35% 6.55% 5.13%
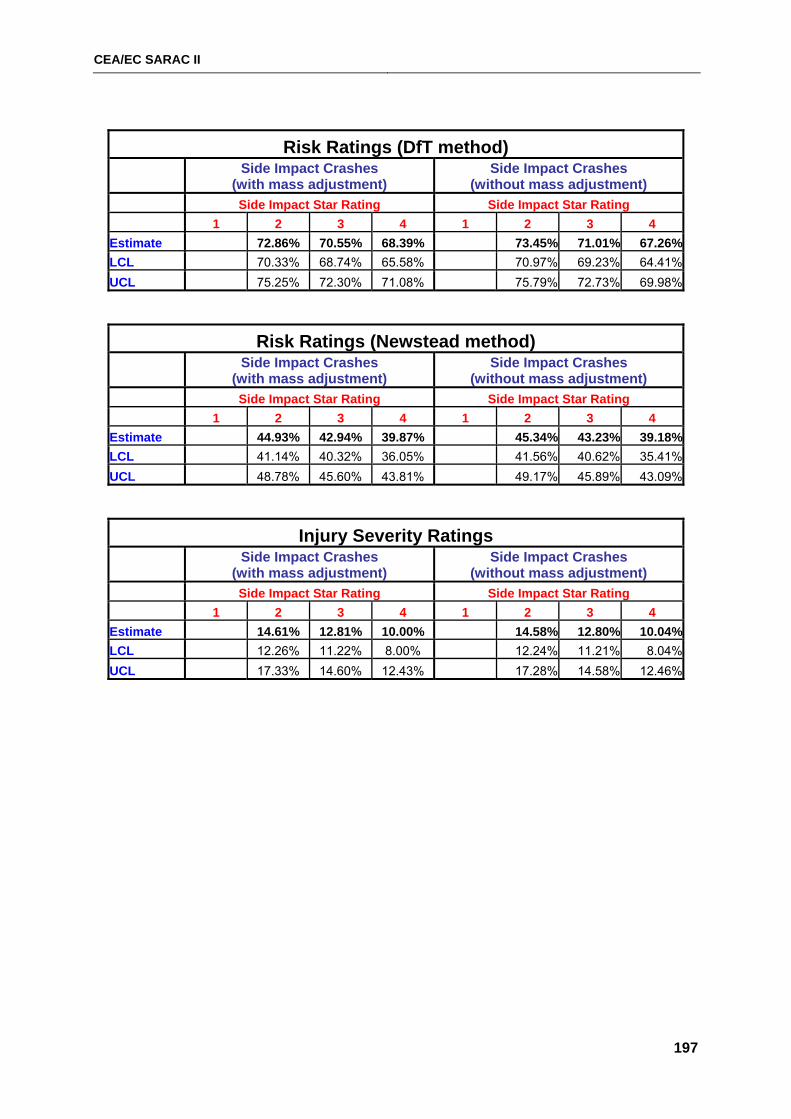
CEA/EC SARAC II
197
Risk Ratings (DfT method)
Side Impact Crashes
(with mass adjustment) Side Impact Crashes
(without mass adjustment) Side Impact Star Rating Side Impact Star Rating 1 2 3 4 1 2 3 4 Estimate 72.86% 70.55% 68.39% 73.45% 71.01% 67.26%LCL 70.33% 68.74% 65.58% 70.97% 69.23% 64.41%UCL 00.00% 75.25% 72.30% 71.08% 00.00% 75.79% 72.73% 69.98%
Risk Ratings (Newstead method)
Side Impact Crashes
(with mass adjustment) Side Impact Crashes
(without mass adjustment) Side Impact Star Rating Side Impact Star Rating 1 2 3 4 1 2 3 4 Estimate 44.93% 42.94% 39.87% 45.34% 43.23% 39.18%LCL 41.14% 40.32% 36.05% 41.56% 40.62% 35.41%UCL 00.00% 48.78% 45.60% 43.81% 00.00% 49.17% 45.89% 43.09%
Injury Severity Ratings
Side Impact Crashes
(with mass adjustment) Side Impact Crashes
(without mass adjustment) Side Impact Star Rating Side Impact Star Rating 1 2 3 4 1 2 3 4 Estimate 14.61% 12.81% 10.00% 14.58% 12.80% 10.04%LCL 12.26% 11.22% 8.00% 12.24% 11.21% 8.04%UCL 00.00% 17.33% 14.60% 12.43% 00.00% 17.28% 14.58% 12.46%

CEA/EC SARAC II
198

CEA/EC SARAC II
199
APPENDIX G
RELATIONSHIPS BEWEEN EuroNCAP SCORES BY TEST
CONFIGURATION AND REAL CRASH MEASURES DERIVED FROM FRENCH DATA
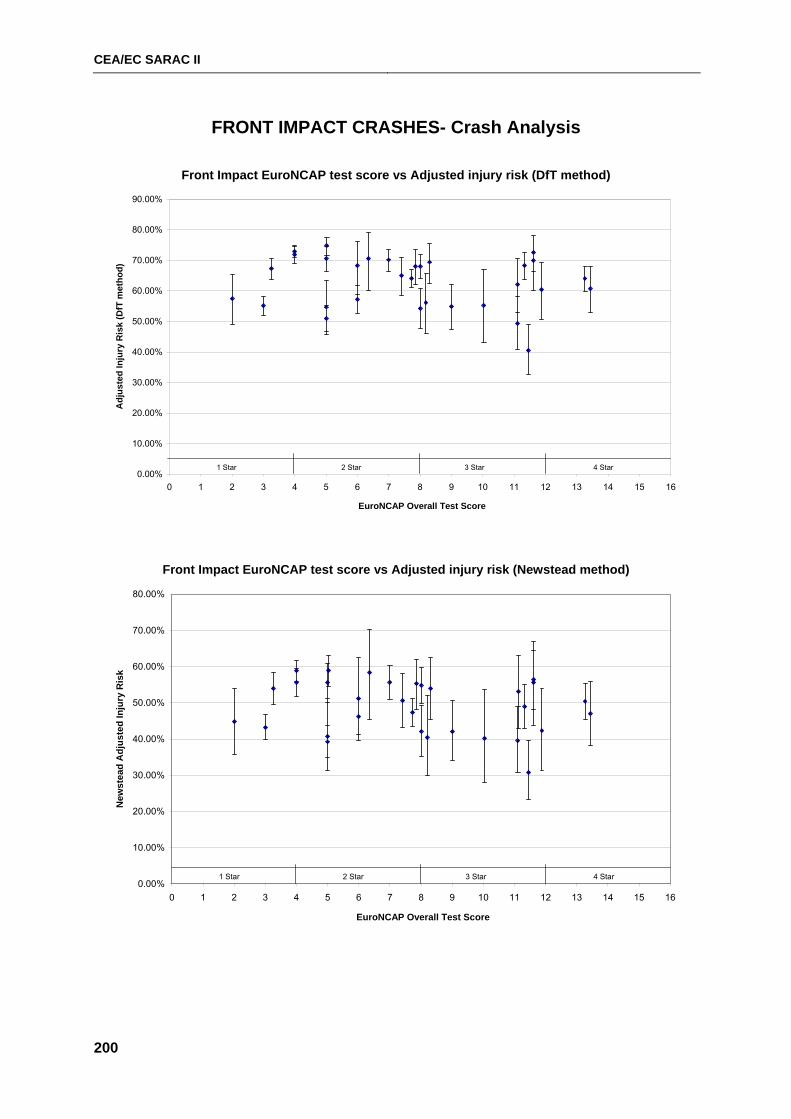
CEA/EC SARAC II
200
FRONT IMPACT CRASHES- Crash Analysis
Front Impact EuroNCAP test score vs Adjusted injury risk (DfT method)
0.00%
10.00%
20.00%
30.00%
40.00%
50.00%
60.00%
70.00%
80.00%
90.00%
0 1 2 3 4 5 6 7 8 9 10 11 12 13 14 15 16
EuroNCAP Overall Test Score
Adj
uste
d In
jury
Ris
k (D
fT m
etho
d)
1 Star 2 Star 3 Star 4 Star
Front Impact EuroNCAP test score vs Adjusted injury risk (Newstead method)
0.00%
10.00%
20.00%
30.00%
40.00%
50.00%
60.00%
70.00%
80.00%
0 1 2 3 4 5 6 7 8 9 10 11 12 13 14 15 16
EuroNCAP Overall Test Score
New
stea
d A
djus
ted
Inju
ry R
isk
1 Star 2 Star 3 Star 4 Star
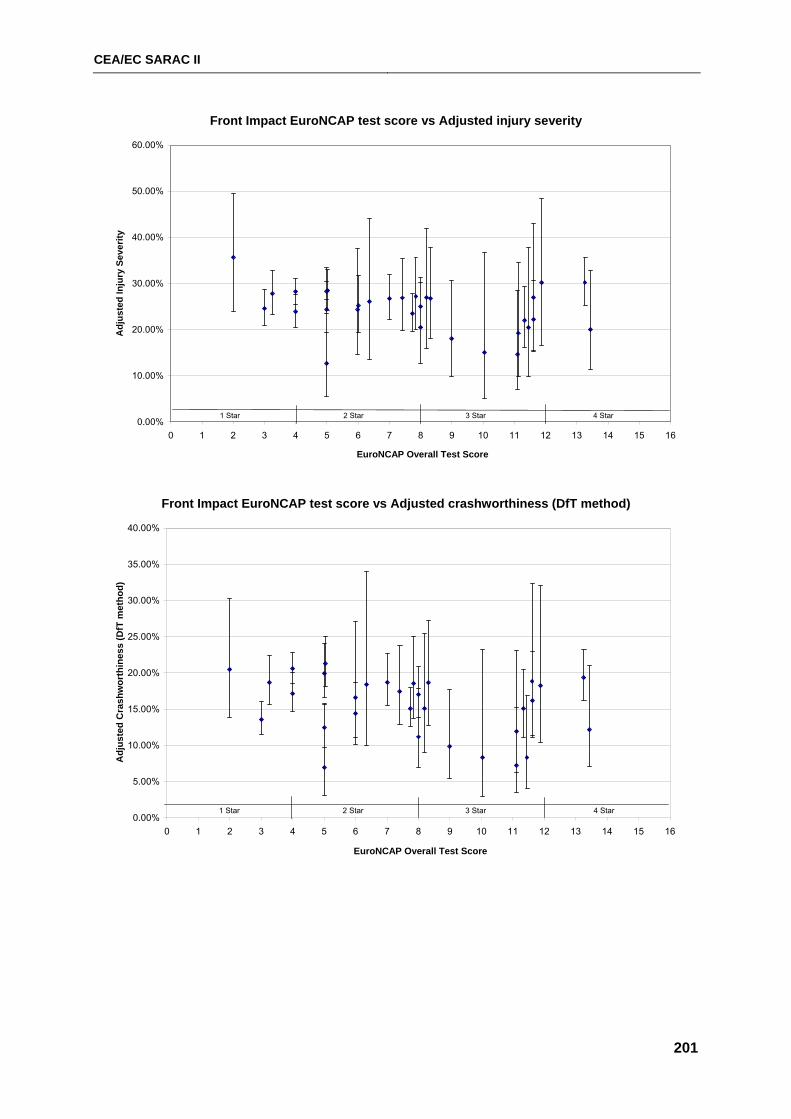
CEA/EC SARAC II
201
Front Impact EuroNCAP test score vs Adjusted injury severity
0.00%
10.00%
20.00%
30.00%
40.00%
50.00%
60.00%
0 1 2 3 4 5 6 7 8 9 10 11 12 13 14 15 16
EuroNCAP Overall Test Score
Adj
uste
d In
jury
Sev
erity
1 Star 2 Star 3 Star 4 Star
Front Impact EuroNCAP test score vs Adjusted crashworthiness (DfT method)
0.00%
5.00%
10.00%
15.00%
20.00%
25.00%
30.00%
35.00%
40.00%
0 1 2 3 4 5 6 7 8 9 10 11 12 13 14 15 16
EuroNCAP Overall Test Score
Adj
uste
d C
rash
wor
thin
ess
(DfT
met
hod)
1 Star 2 Star 3 Star 4 Star
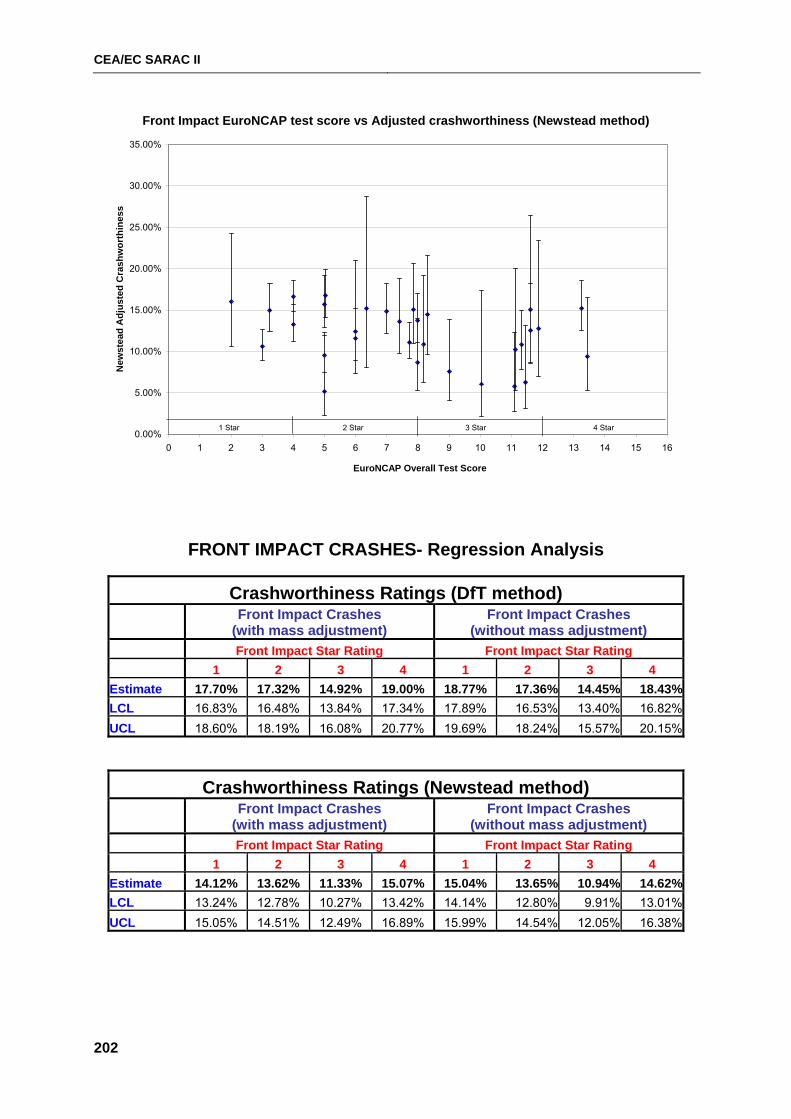
CEA/EC SARAC II
202
Front Impact EuroNCAP test score vs Adjusted crashworthiness (Newstead method)
0.00%
5.00%
10.00%
15.00%
20.00%
25.00%
30.00%
35.00%
0 1 2 3 4 5 6 7 8 9 10 11 12 13 14 15 16
EuroNCAP Overall Test Score
New
stea
d A
djus
ted
Cra
shw
orth
ines
s
1 Star 2 Star 3 Star 4 Star
FRONT IMPACT CRASHES- Regression Analysis
Crashworthiness Ratings (DfT method)
Front Impact Crashes
(with mass adjustment) Front Impact Crashes
(without mass adjustment) Front Impact Star Rating Front Impact Star Rating 1 2 3 4 1 2 3 4 Estimate 17.70% 17.32% 14.92% 19.00% 18.77% 17.36% 14.45% 18.43%LCL 16.83% 16.48% 13.84% 17.34% 17.89% 16.53% 13.40% 16.82%UCL 18.60% 18.19% 16.08% 20.77% 19.69% 18.24% 15.57% 20.15%
Crashworthiness Ratings (Newstead method)
Front Impact Crashes
(with mass adjustment) Front Impact Crashes
(without mass adjustment) Front Impact Star Rating Front Impact Star Rating 1 2 3 4 1 2 3 4 Estimate 14.12% 13.62% 11.33% 15.07% 15.04% 13.65% 10.94% 14.62%LCL 13.24% 12.78% 10.27% 13.42% 14.14% 12.80% 9.91% 13.01%UCL 15.05% 14.51% 12.49% 16.89% 15.99% 14.54% 12.05% 16.38%
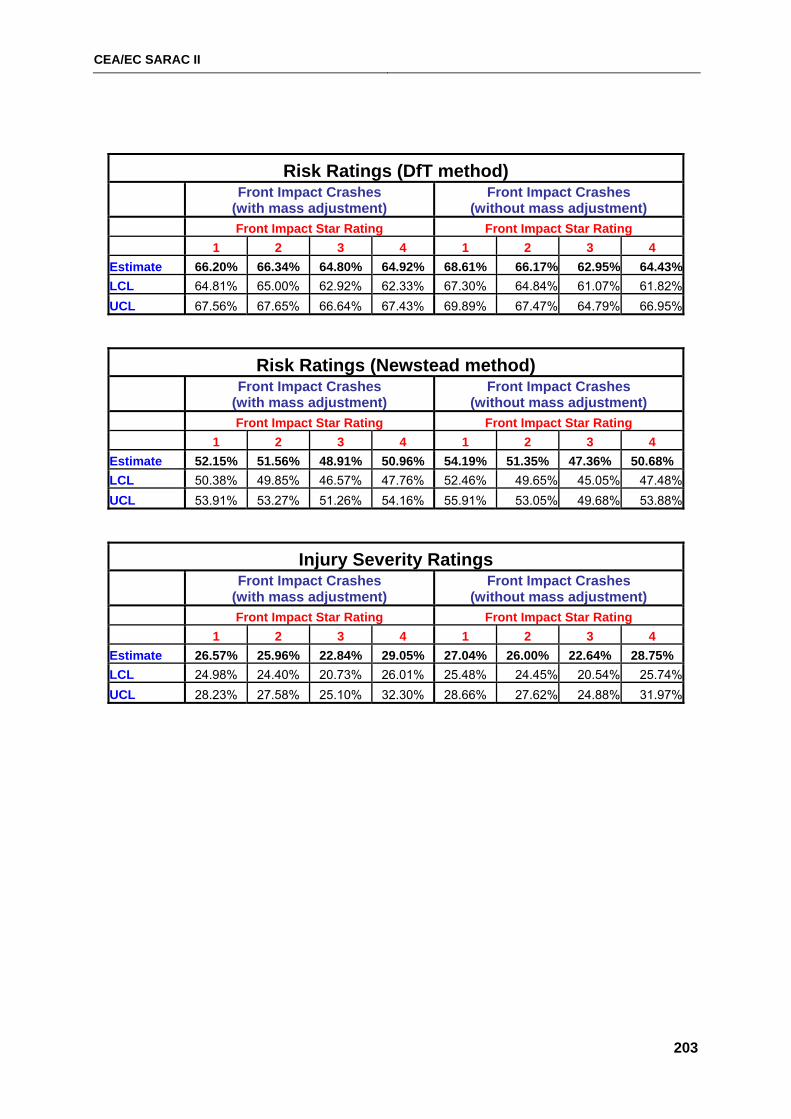
CEA/EC SARAC II
203
Risk Ratings (DfT method)
Front Impact Crashes
(with mass adjustment) Front Impact Crashes
(without mass adjustment) Front Impact Star Rating Front Impact Star Rating 1 2 3 4 1 2 3 4 Estimate 66.20% 66.34% 64.80% 64.92% 68.61% 66.17% 62.95% 64.43%LCL 64.81% 65.00% 62.92% 62.33% 67.30% 64.84% 61.07% 61.82%UCL 67.56% 67.65% 66.64% 67.43% 69.89% 67.47% 64.79% 66.95%
Risk Ratings (Newstead method)
Front Impact Crashes
(with mass adjustment) Front Impact Crashes
(without mass adjustment) Front Impact Star Rating Front Impact Star Rating 1 2 3 4 1 2 3 4 Estimate 52.15% 51.56% 48.91% 50.96% 54.19% 51.35% 47.36% 50.68% LCL 50.38% 49.85% 46.57% 47.76% 52.46% 49.65% 45.05% 47.48%UCL 53.91% 53.27% 51.26% 54.16% 55.91% 53.05% 49.68% 53.88%
Injury Severity Ratings
Front Impact Crashes
(with mass adjustment) Front Impact Crashes
(without mass adjustment) Front Impact Star Rating Front Impact Star Rating 1 2 3 4 1 2 3 4 Estimate 26.57% 25.96% 22.84% 29.05% 27.04% 26.00% 22.64% 28.75% LCL 24.98% 24.40% 20.73% 26.01% 25.48% 24.45% 20.54% 25.74%UCL 28.23% 27.58% 25.10% 32.30% 28.66% 27.62% 24.88% 31.97%
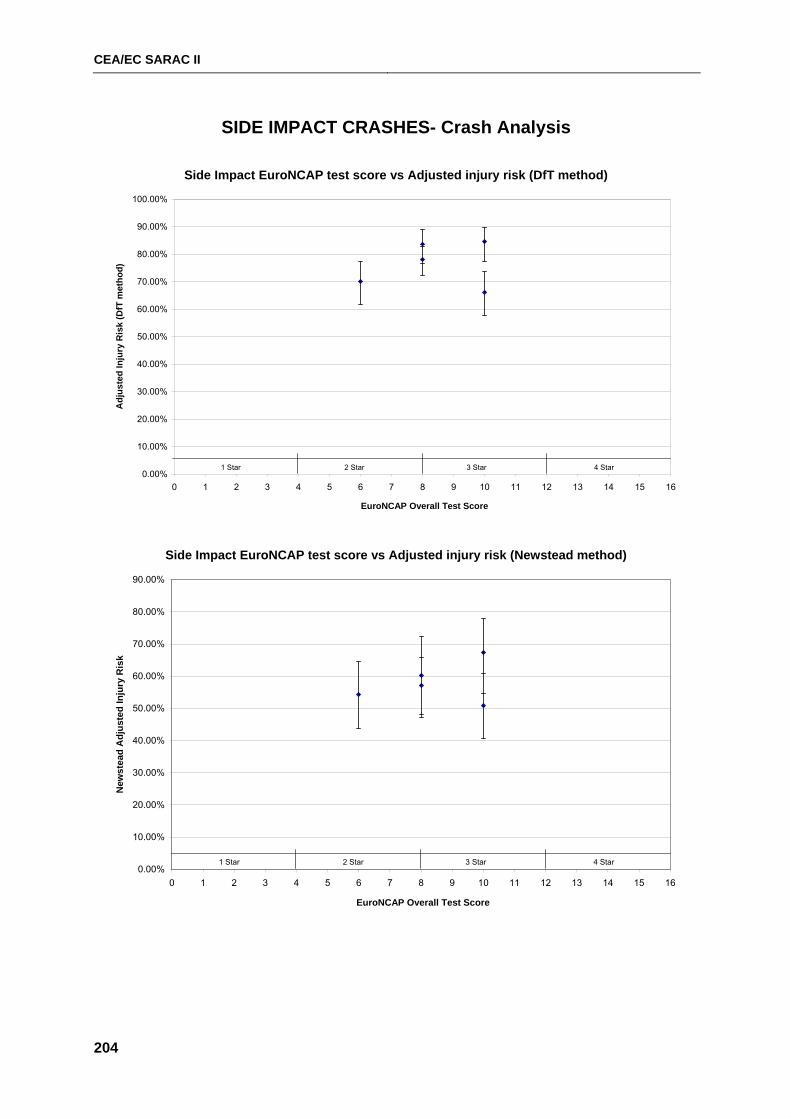
CEA/EC SARAC II
204
SIDE IMPACT CRASHES- Crash Analysis
Side Impact EuroNCAP test score vs Adjusted injury risk (DfT method)
0.00%
10.00%
20.00%
30.00%
40.00%
50.00%
60.00%
70.00%
80.00%
90.00%
100.00%
0 1 2 3 4 5 6 7 8 9 10 11 12 13 14 15 16
EuroNCAP Overall Test Score
Adj
uste
d In
jury
Ris
k (D
fT m
etho
d)
1 Star 2 Star 3 Star 4 Star
Side Impact EuroNCAP test score vs Adjusted injury risk (Newstead method)
0.00%
10.00%
20.00%
30.00%
40.00%
50.00%
60.00%
70.00%
80.00%
90.00%
0 1 2 3 4 5 6 7 8 9 10 11 12 13 14 15 16
EuroNCAP Overall Test Score
New
stea
d A
djus
ted
Inju
ry R
isk
1 Star 2 Star 3 Star 4 Star
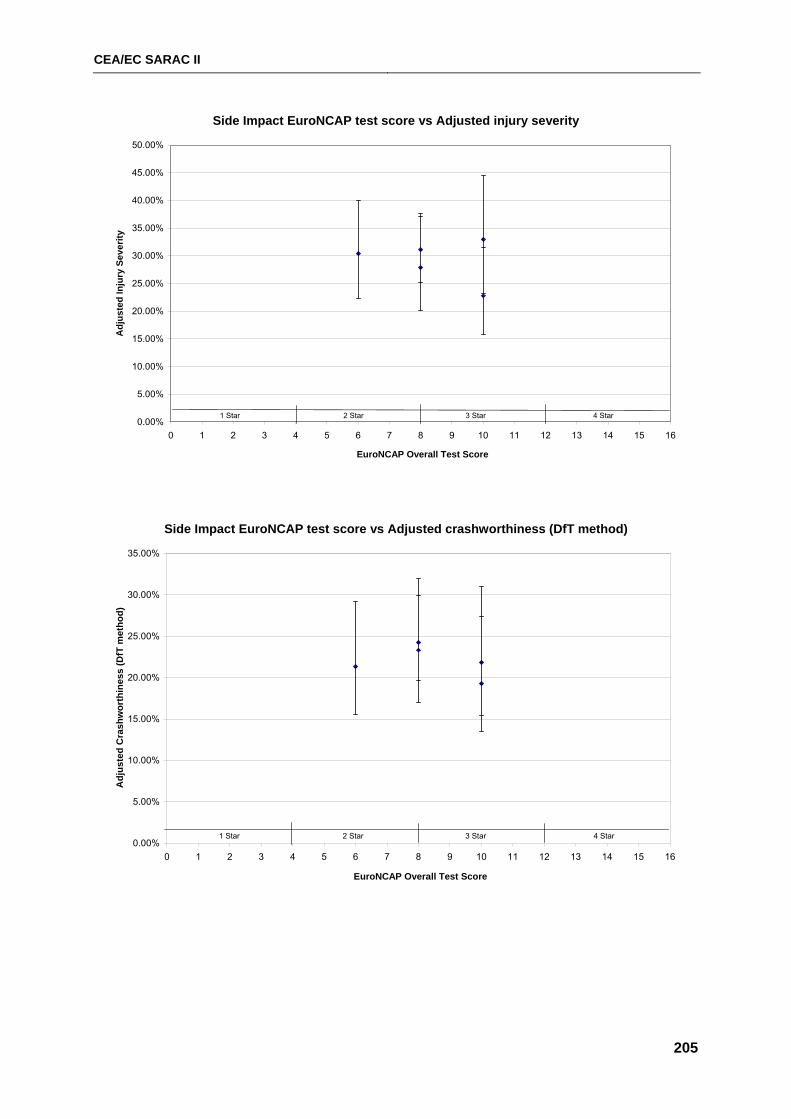
CEA/EC SARAC II
205
Side Impact EuroNCAP test score vs Adjusted injury severity
0.00%
5.00%
10.00%
15.00%
20.00%
25.00%
30.00%
35.00%
40.00%
45.00%
50.00%
0 1 2 3 4 5 6 7 8 9 10 11 12 13 14 15 16
EuroNCAP Overall Test Score
Adj
uste
d In
jury
Sev
erity
1 Star 2 Star 3 Star 4 Star
Side Impact EuroNCAP test score vs Adjusted crashworthiness (DfT method)
0.00%
5.00%
10.00%
15.00%
20.00%
25.00%
30.00%
35.00%
0 1 2 3 4 5 6 7 8 9 10 11 12 13 14 15 16
EuroNCAP Overall Test Score
Adj
uste
d C
rash
wor
thin
ess
(DfT
met
hod)
1 Star 2 Star 3 Star 4 Star
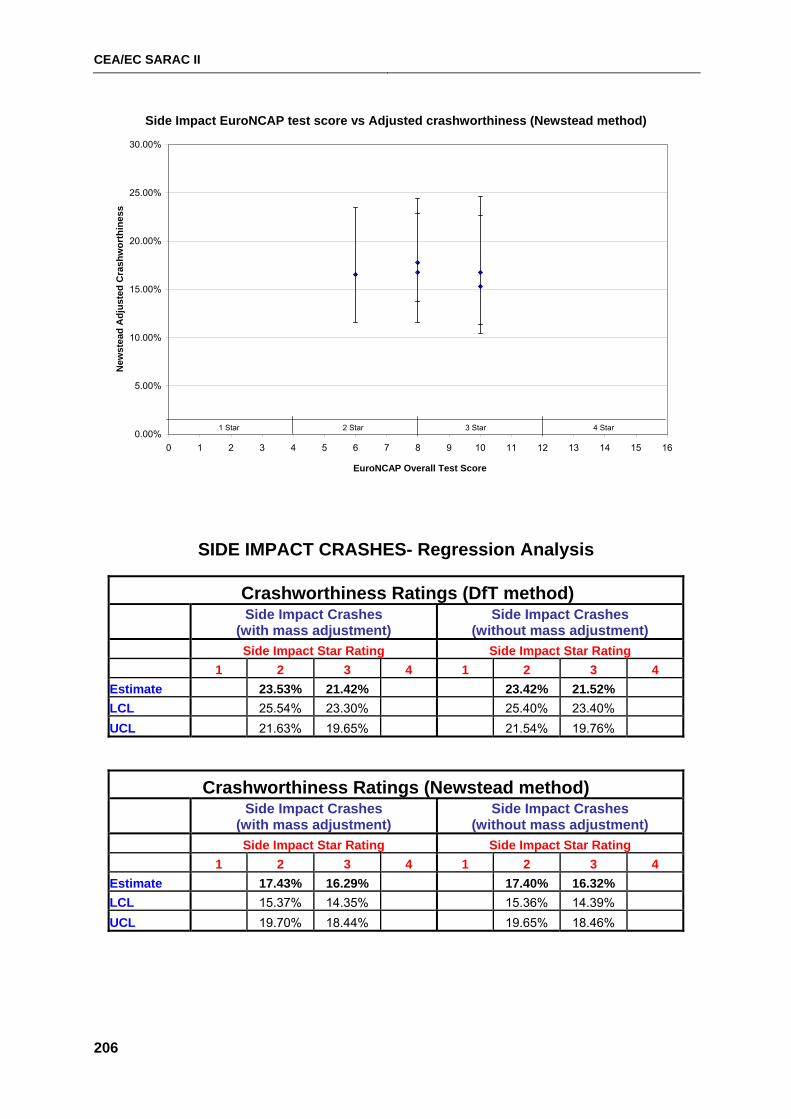
CEA/EC SARAC II
206
Side Impact EuroNCAP test score vs Adjusted crashworthiness (Newstead method)
0.00%
5.00%
10.00%
15.00%
20.00%
25.00%
30.00%
0 1 2 3 4 5 6 7 8 9 10 11 12 13 14 15 16
EuroNCAP Overall Test Score
New
stea
d A
djus
ted
Cra
shw
orth
ines
s
1 Star 2 Star 3 Star 4 Star
SIDE IMPACT CRASHES- Regression Analysis
Crashworthiness Ratings (DfT method)
Side Impact Crashes
(with mass adjustment) Side Impact Crashes
(without mass adjustment) Side Impact Star Rating Side Impact Star Rating 1 2 3 4 1 2 3 4 Estimate 23.53% 21.42% 23.42% 21.52% LCL 25.54% 23.30% 25.40% 23.40% UCL 0.00% 21.63% 19.65% 0.00% 0.00% 21.54% 19.76% 0.00%
Crashworthiness Ratings (Newstead method)
Side Impact Crashes
(with mass adjustment) Side Impact Crashes
(without mass adjustment) Side Impact Star Rating Side Impact Star Rating 1 2 3 4 1 2 3 4 Estimate 17.43% 16.29% 17.40% 16.32% LCL 15.37% 14.35% 15.36% 14.39% UCL 0.00% 19.70% 18.44% 0.00% 0.00% 19.65% 18.46% 0.00%
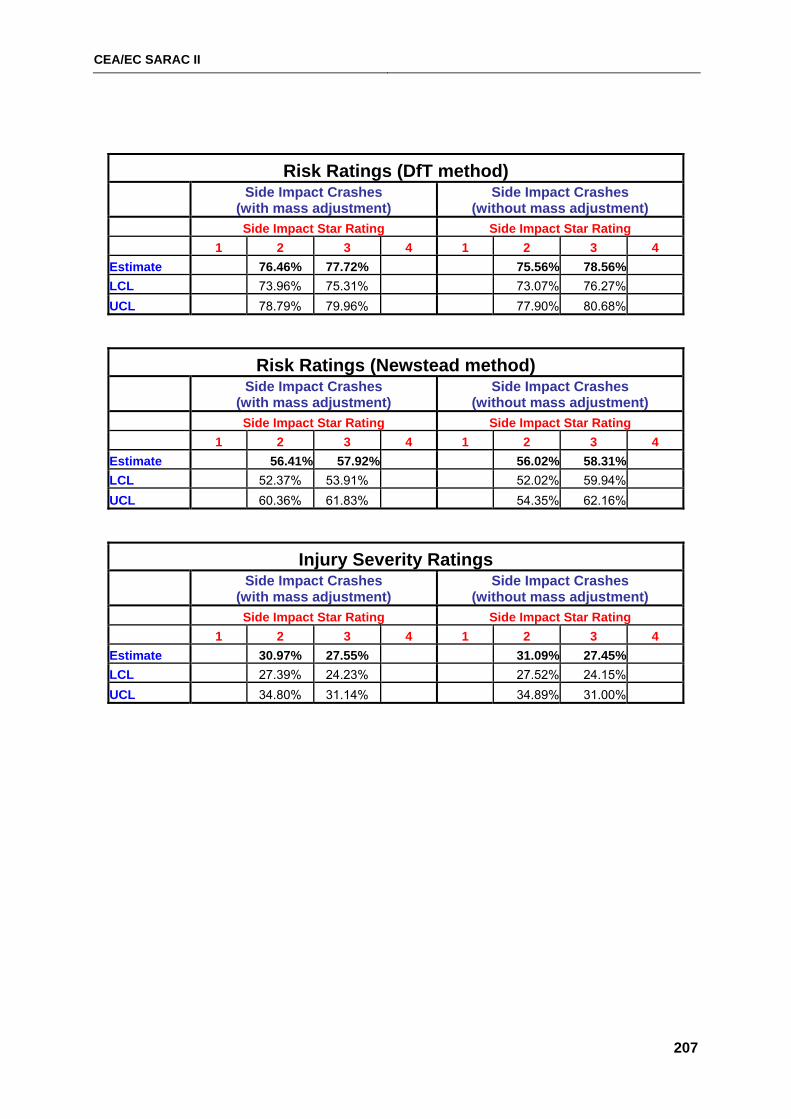
CEA/EC SARAC II
207
Risk Ratings (DfT method)
Side Impact Crashes
(with mass adjustment) Side Impact Crashes
(without mass adjustment) Side Impact Star Rating Side Impact Star Rating 1 2 3 4 1 2 3 4 Estimate 76.46% 77.72% 75.56% 78.56% LCL 73.96% 75.31% 73.07% 76.27% UCL 0.00% 78.79% 79.96% 0.00% 0.00% 77.90% 80.68% 0.00%
Risk Ratings (Newstead method)
Side Impact Crashes
(with mass adjustment) Side Impact Crashes
(without mass adjustment) Side Impact Star Rating Side Impact Star Rating 1 2 3 4 1 2 3 4 Estimate 56.41% 57.92% 56.02% 58.31% LCL 52.37% 53.91% 52.02% 59.94% UCL 0.00% 60.36% 61.83% 0.00% 0.00% 54.35% 62.16% 0.00%
Injury Severity Ratings
Side Impact Crashes
(with mass adjustment) Side Impact Crashes
(without mass adjustment) Side Impact Star Rating Side Impact Star Rating 1 2 3 4 1 2 3 4 Estimate 30.97% 27.55% 31.09% 27.45% LCL 27.39% 24.23% 27.52% 24.15% UCL 0.00% 34.80% 31.14% 0.00% 0.00% 34.89% 31.00% 0.00%

CEA/EC SARAC II
208
CEA/EC SARAC II
209
APPENDIX H
RELATIONSHIPS BEWEEN EuroNCAP SCORES BY TEST
CONFIGURATION AND REAL CRASH MEASURES DERIVED FROM AUSTRALIAN AND NEW ZEALAND DATA
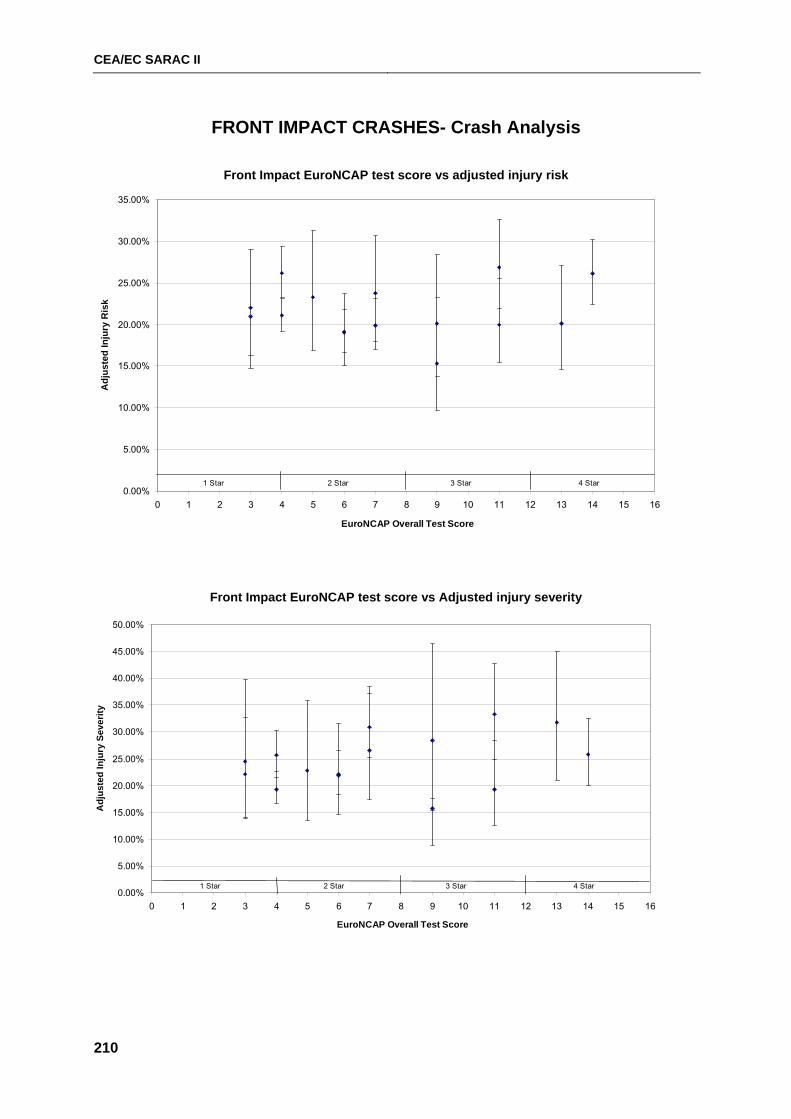
CEA/EC SARAC II
210
FRONT IMPACT CRASHES- Crash Analysis
Front Impact EuroNCAP test score vs adjusted injury risk
Front Impact EuroNCAP test score vs Adjusted injury severity
0.00%
5.00%
10.00%
15.00%
20.00%
25.00%
30.00%
35.00%
40.00%
45.00%
50.00%
0 1 2 3 4 5 6 7 8 9 10 11 12 13 14 15 16
EuroNCAP Overall Test Score
Adj
uste
d In
jury
Sev
erity
1 Star 2 Star 3 Star 4 Star
0.00%
5.00%
10.00%
15.00%
20.00%
25.00%
30.00%
35.00%
0 1 2 3 4 5 6 7 8 9 10 11 12 13 14 15 16
EuroNCAP Overall Test Score
Adj
uste
d In
jury
Ris
k
1 Star 2 Star 3 Star 4 Star
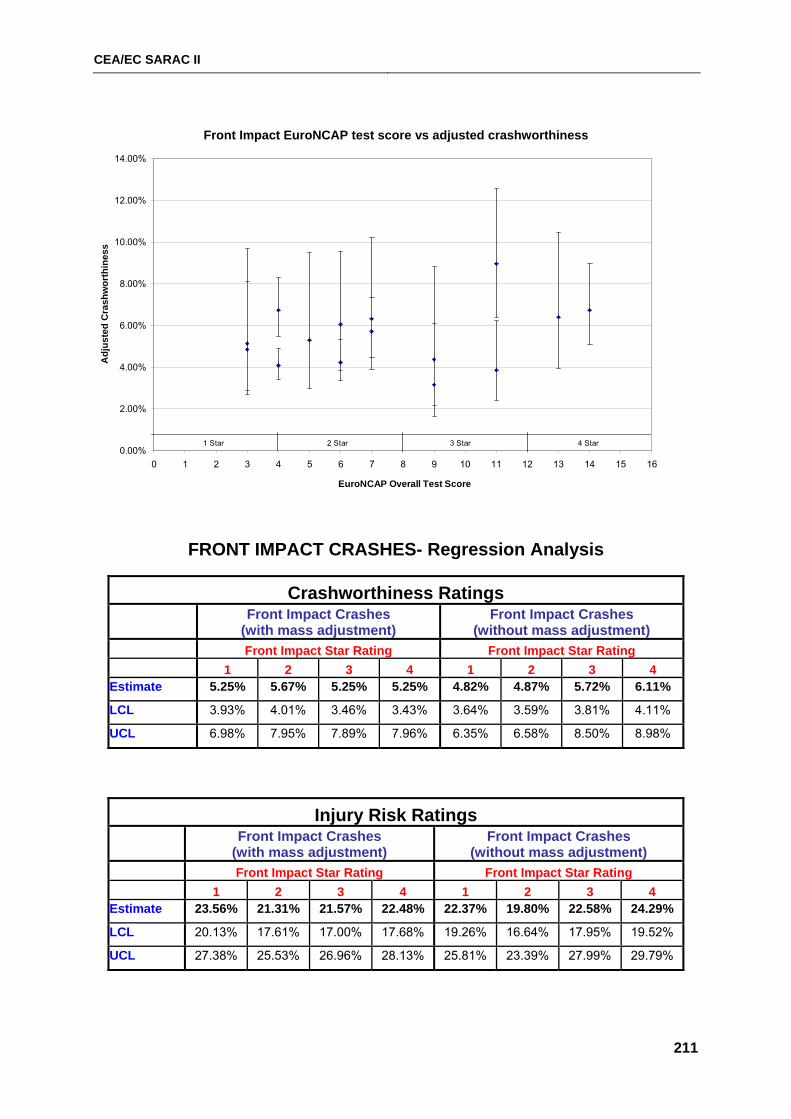
CEA/EC SARAC II
211
Front Impact EuroNCAP test score vs adjusted crashworthiness
FRONT IMPACT CRASHES- Regression Analysis
Crashworthiness Ratings
Front Impact Crashes
(with mass adjustment) Front Impact Crashes
(without mass adjustment) Front Impact Star Rating Front Impact Star Rating 1 2 3 4 1 2 3 4 Estimate 5.25% 5.67% 5.25% 5.25% 4.82% 4.87% 5.72% 6.11%
LCL 3.93% 4.01% 3.46% 3.43% 3.64% 3.59% 3.81% 4.11%
UCL 6.98% 7.95% 7.89% 7.96% 6.35% 6.58% 8.50% 8.98%
Injury Risk Ratings
Front Impact Crashes
(with mass adjustment) Front Impact Crashes
(without mass adjustment) Front Impact Star Rating Front Impact Star Rating 1 2 3 4 1 2 3 4 Estimate 23.56% 21.31% 21.57% 22.48% 22.37% 19.80% 22.58% 24.29%
LCL 20.13% 17.61% 17.00% 17.68% 19.26% 16.64% 17.95% 19.52%
UCL 27.38% 25.53% 26.96% 28.13% 25.81% 23.39% 27.99% 29.79%
0.00%
2.00%
4.00%
6.00%
8.00%
10.00%
12.00%
14.00%
0 1 2 3 4 5 6 7 8 9 10 11 12 13 14 15 16
EuroNCAP Overall Test Score
Adj
uste
d C
rash
wor
thin
ess
1 Star 2 Star 3 Star 4 Star
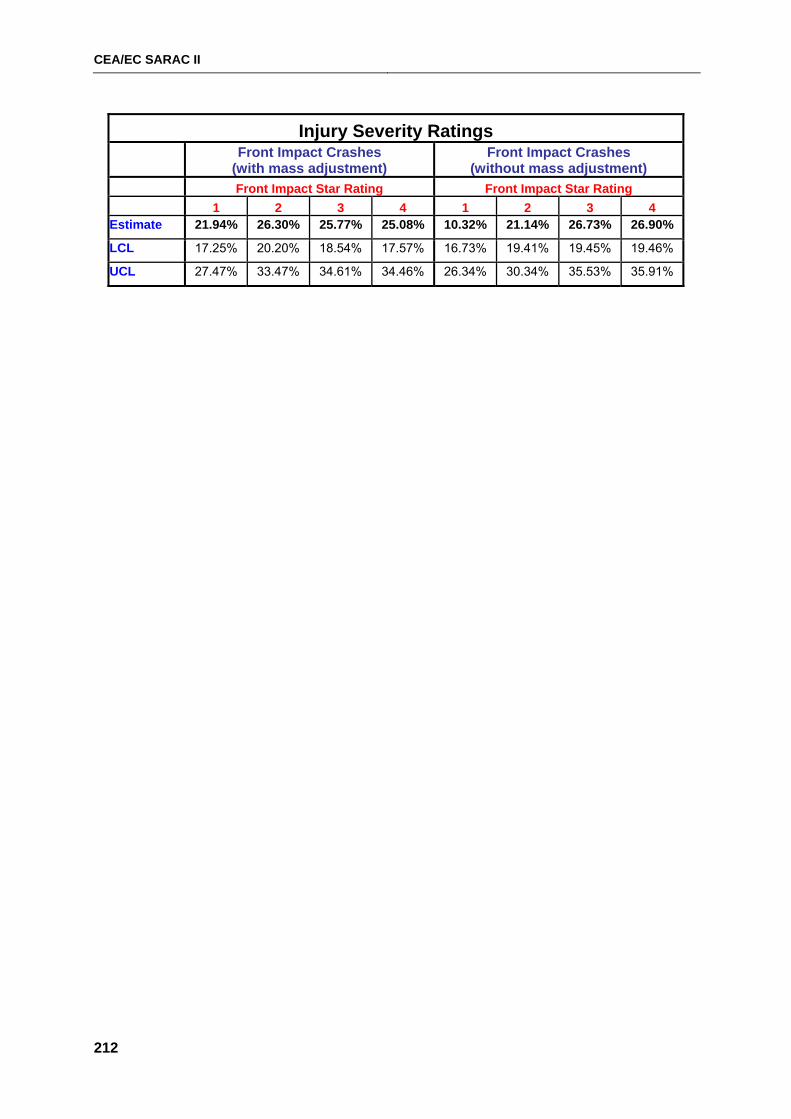
CEA/EC SARAC II
212
Injury Severity Ratings
Front Impact Crashes
(with mass adjustment) Front Impact Crashes
(without mass adjustment) Front Impact Star Rating Front Impact Star Rating 1 2 3 4 1 2 3 4 Estimate 21.94% 26.30% 25.77% 25.08% 10.32% 21.14% 26.73% 26.90%
LCL 17.25% 20.20% 18.54% 17.57% 16.73% 19.41% 19.45% 19.46%
UCL 27.47% 33.47% 34.61% 34.46% 26.34% 30.34% 35.53% 35.91%
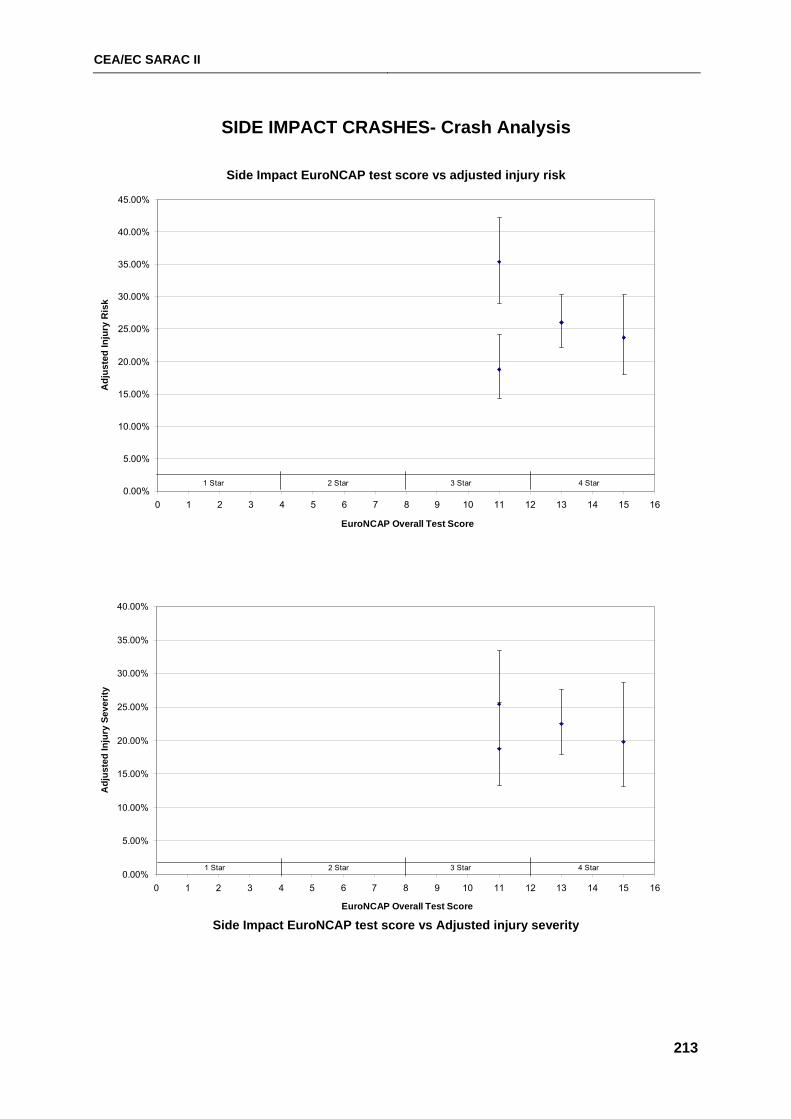
CEA/EC SARAC II
213
SIDE IMPACT CRASHES- Crash Analysis
Side Impact EuroNCAP test score vs adjusted injury risk
Side Impact EuroNCAP test score vs Adjusted injury severity
0.00%
5.00%
10.00%
15.00%
20.00%
25.00%
30.00%
35.00%
40.00%
0 1 2 3 4 5 6 7 8 9 10 11 12 13 14 15 16
EuroNCAP Overall Test Score
Adj
uste
d In
jury
Sev
erity
1 Star 2 Star 3 Star 4 Star
0.00%
5.00%
10.00%
15.00%
20.00%
25.00%
30.00%
35.00%
40.00%
45.00%
0 1 2 3 4 5 6 7 8 9 10 11 12 13 14 15 16
EuroNCAP Overall Test Score
Adj
uste
d In
jury
Ris
k
1 Star 2 Star 3 Star 4 Star
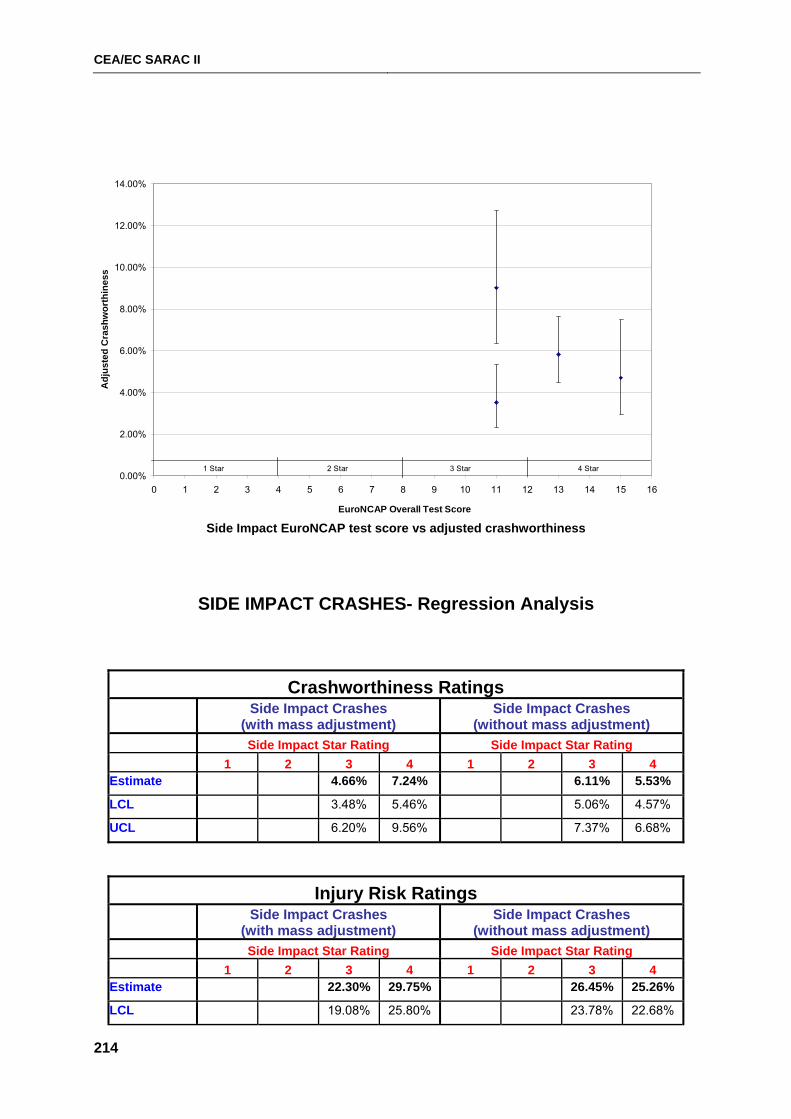
CEA/EC SARAC II
214
Side Impact EuroNCAP test score vs adjusted crashworthiness
SIDE IMPACT CRASHES- Regression Analysis
Crashworthiness Ratings
Side Impact Crashes
(with mass adjustment) Side Impact Crashes
(without mass adjustment) Side Impact Star Rating Side Impact Star Rating 1 2 3 4 1 2 3 4 Estimate 4.66% 7.24% 6.11% 5.53%
LCL 3.48% 5.46% 5.06% 4.57%
UCL 6.20% 9.56% 7.37% 6.68%
Injury Risk Ratings
Side Impact Crashes
(with mass adjustment) Side Impact Crashes
(without mass adjustment) Side Impact Star Rating Side Impact Star Rating 1 2 3 4 1 2 3 4 Estimate 22.30% 29.75% 26.45% 25.26%
LCL 19.08% 25.80% 23.78% 22.68%
0.00%
2.00%
4.00%
6.00%
8.00%
10.00%
12.00%
14.00%
0 1 2 3 4 5 6 7 8 9 10 11 12 13 14 15 16
EuroNCAP Overall Test Score
Adj
uste
d C
rash
wor
thin
ess
1 Star 2 Star 3 Star 4 Star
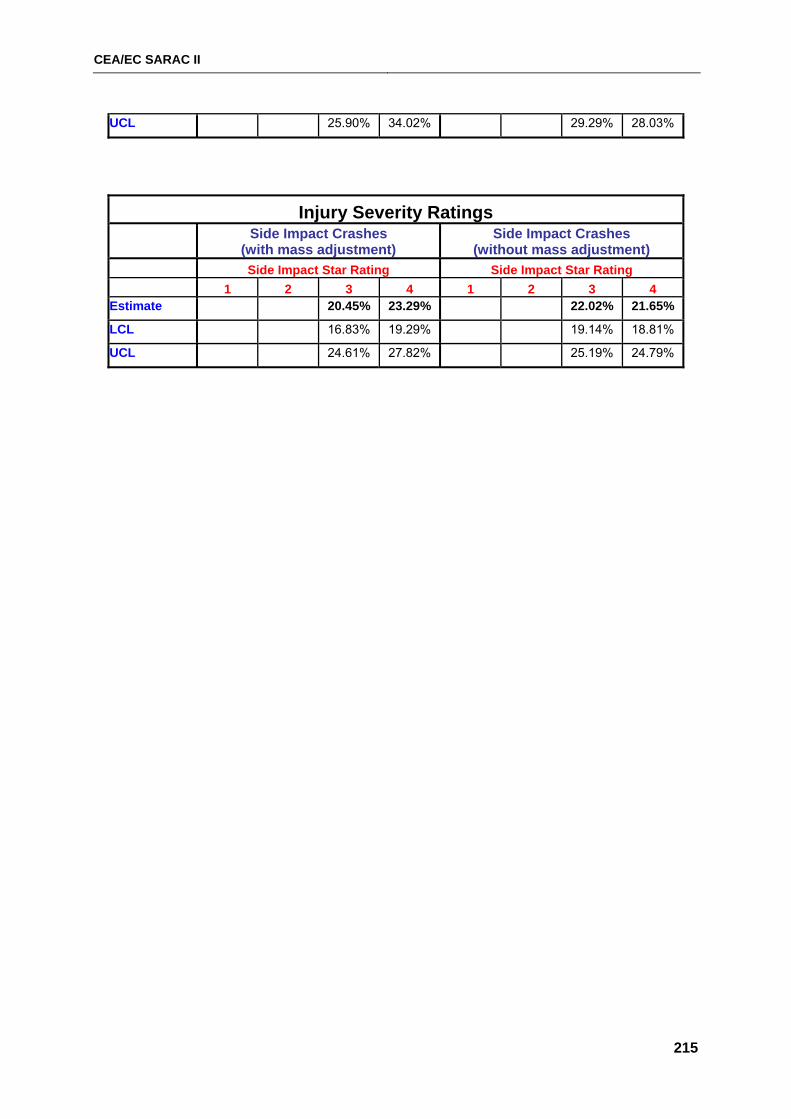
CEA/EC SARAC II
215
UCL 25.90% 34.02% 29.29% 28.03%
Injury Severity Ratings
Side Impact Crashes
(with mass adjustment) Side Impact Crashes
(without mass adjustment) Side Impact Star Rating Side Impact Star Rating 1 2 3 4 1 2 3 4 Estimate 20.45% 23.29% 22.02% 21.65%
LCL 16.83% 19.29% 19.14% 18.81%
UCL 24.61% 27.82% 25.19% 24.79%

CEA/EC SARAC II
216
CEA/EC SARAC II
217
APPENDIX I
RELATIONSHIPS BEWEEN VEHICLE MASS AND REAL
CRASH MEASURES DERIVED FROM BRITISH, FRENCH, AUSTRALIAN AND NEW ZEALAND DATA- FRONT AND SIDE
IMPACT CRASHES
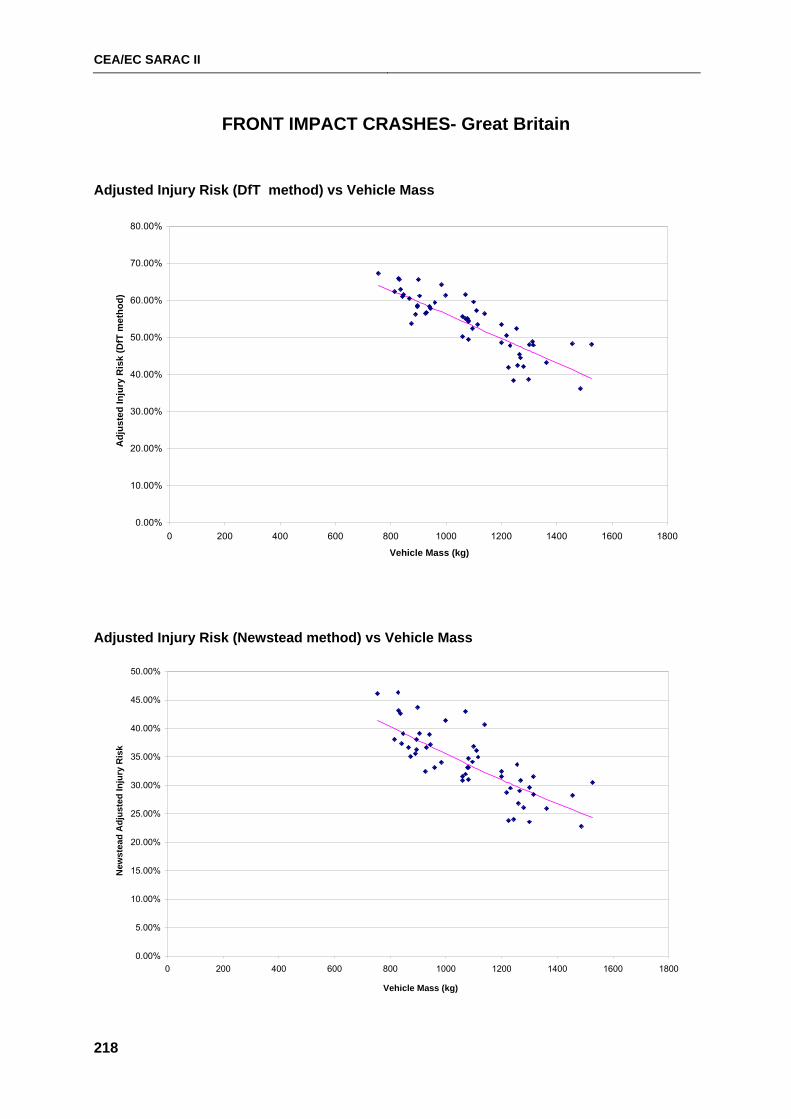
CEA/EC SARAC II
218
FRONT IMPACT CRASHES- Great Britain
Adjusted Injury Risk (DfT method) vs Vehicle Mass
0.00%
10.00%
20.00%
30.00%
40.00%
50.00%
60.00%
70.00%
80.00%
0 200 400 600 800 1000 1200 1400 1600 1800
Vehicle Mass (kg)
Adj
uste
d In
jury
Ris
k (D
fT m
etho
d)
Adjusted Injury Risk (Newstead method) vs Vehicle Mass
0.00%
5.00%
10.00%
15.00%
20.00%
25.00%
30.00%
35.00%
40.00%
45.00%
50.00%
0 200 400 600 800 1000 1200 1400 1600 1800
Vehicle Mass (kg)
New
stea
d A
djus
ted
Inju
ry R
isk

CEA/EC SARAC II
219
Adjusted Injury Severity vs Vehicle Mass

CEA/EC SARAC II
220
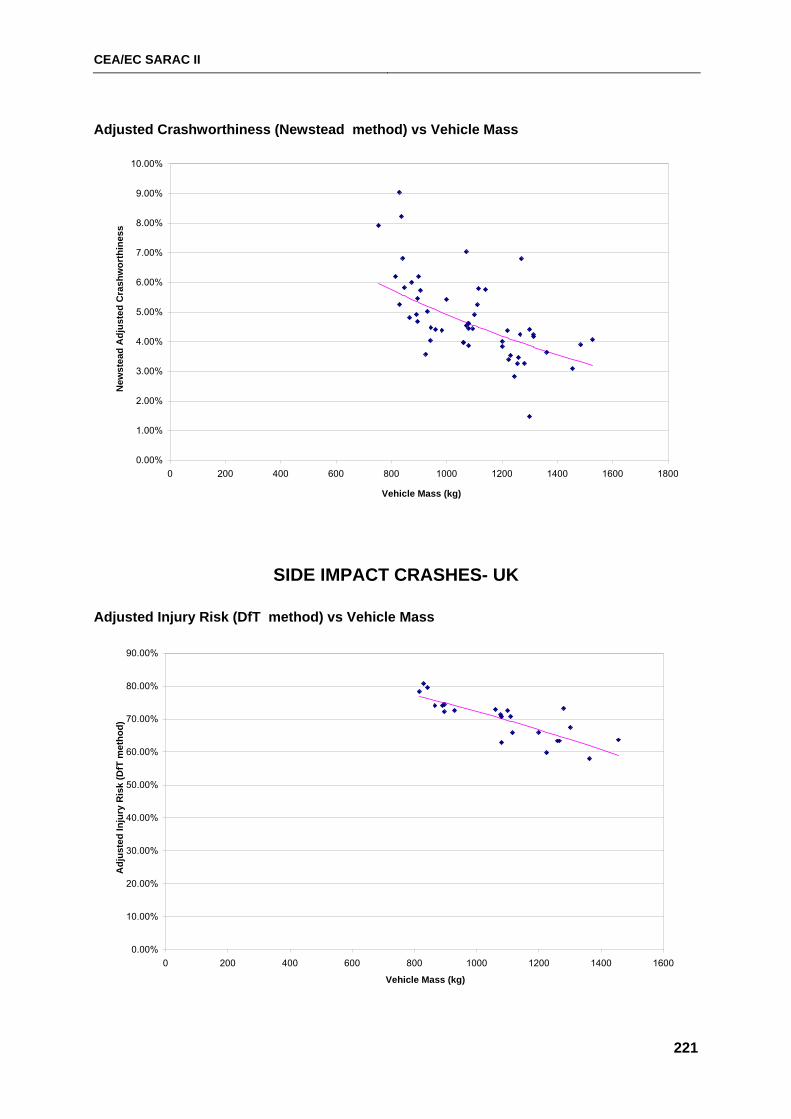
CEA/EC SARAC II
221
Adjusted Crashworthiness (Newstead method) vs Vehicle Mass
0.00%
1.00%
2.00%
3.00%
4.00%
5.00%
6.00%
7.00%
8.00%
9.00%
10.00%
0 200 400 600 800 1000 1200 1400 1600 1800
Vehicle Mass (kg)
New
stea
d A
djus
ted
Cra
shw
orth
ines
s
SIDE IMPACT CRASHES- UK
Adjusted Injury Risk (DfT method) vs Vehicle Mass
0.00%
10.00%
20.00%
30.00%
40.00%
50.00%
60.00%
70.00%
80.00%
90.00%
0 200 400 600 800 1000 1200 1400 1600
Vehicle Mass (kg)
Adj
uste
d In
jury
Ris
k (D
fT m
etho
d)
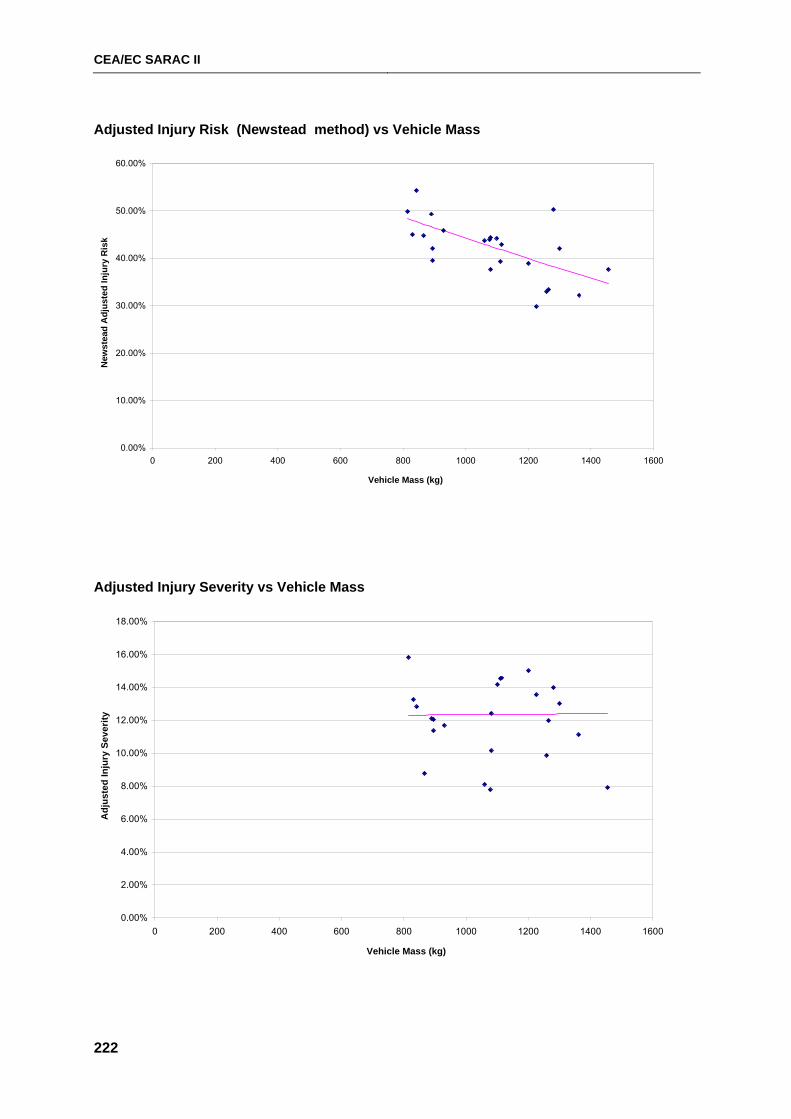
CEA/EC SARAC II
222
Adjusted Injury Risk (Newstead method) vs Vehicle Mass
Adjusted Injury Severity vs Vehicle Mass
0.00%
10.00%
20.00%
30.00%
40.00%
50.00%
60.00%
0 200 400 600 800 1000 1200 1400 1600
Vehicle Mass (kg)
New
stea
d A
djus
ted
Inju
ry R
isk
0.00%
2.00%
4.00%
6.00%
8.00%
10.00%
12.00%
14.00%
16.00%
18.00%
0 200 400 600 800 1000 1200 1400 1600
Vehicle Mass (kg)
Adj
uste
d In
jury
Sev
erity
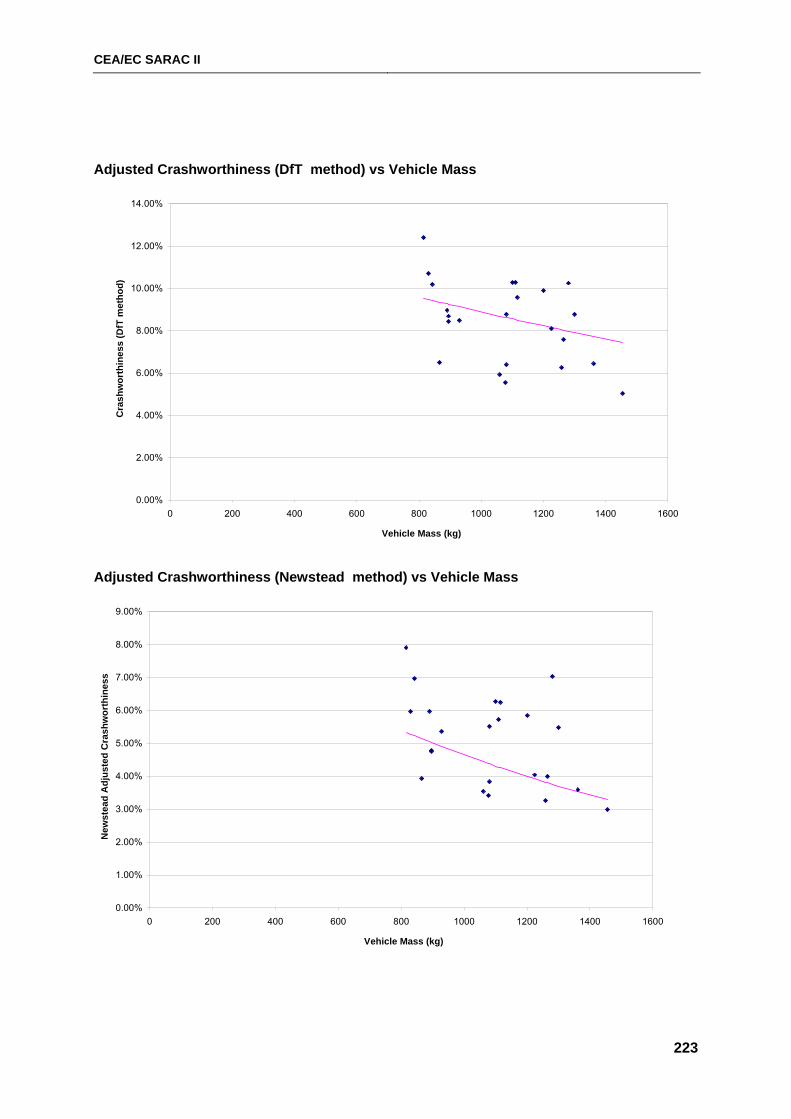
CEA/EC SARAC II
223
Adjusted Crashworthiness (DfT method) vs Vehicle Mass
0.00%
2.00%
4.00%
6.00%
8.00%
10.00%
12.00%
14.00%
0 200 400 600 800 1000 1200 1400 1600
Vehicle Mass (kg)
Cra
shw
orth
ines
s (D
fT m
etho
d)
Adjusted Crashworthiness (Newstead method) vs Vehicle Mass
0.00%
1.00%
2.00%
3.00%
4.00%
5.00%
6.00%
7.00%
8.00%
9.00%
0 200 400 600 800 1000 1200 1400 1600
Vehicle Mass (kg)
New
stea
d A
djus
ted
Cra
shw
orth
ines
s
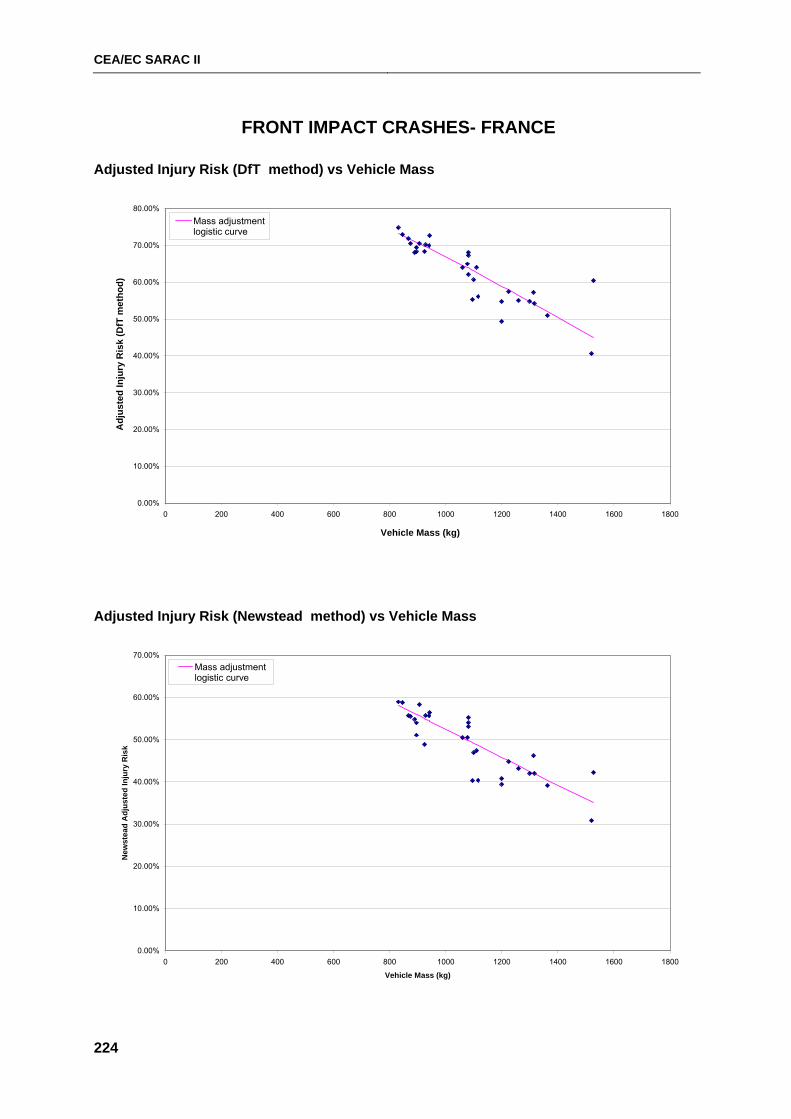
CEA/EC SARAC II
224
FRONT IMPACT CRASHES- FRANCE
Adjusted Injury Risk (DfT method) vs Vehicle Mass
0.00%
10.00%
20.00%
30.00%
40.00%
50.00%
60.00%
70.00%
80.00%
0 200 400 600 800 1000 1200 1400 1600 1800
Vehicle Mass (kg)
Adj
uste
d In
jury
Ris
k (D
fT m
etho
d)
Mass adjustmentlogistic curve
Adjusted Injury Risk (Newstead method) vs Vehicle Mass
0.00%
10.00%
20.00%
30.00%
40.00%
50.00%
60.00%
70.00%
0 200 400 600 800 1000 1200 1400 1600 1800
Vehicle Mass (kg)
New
stea
d A
djus
ted
Inju
ry R
isk
Mass adjustmentlogistic curve
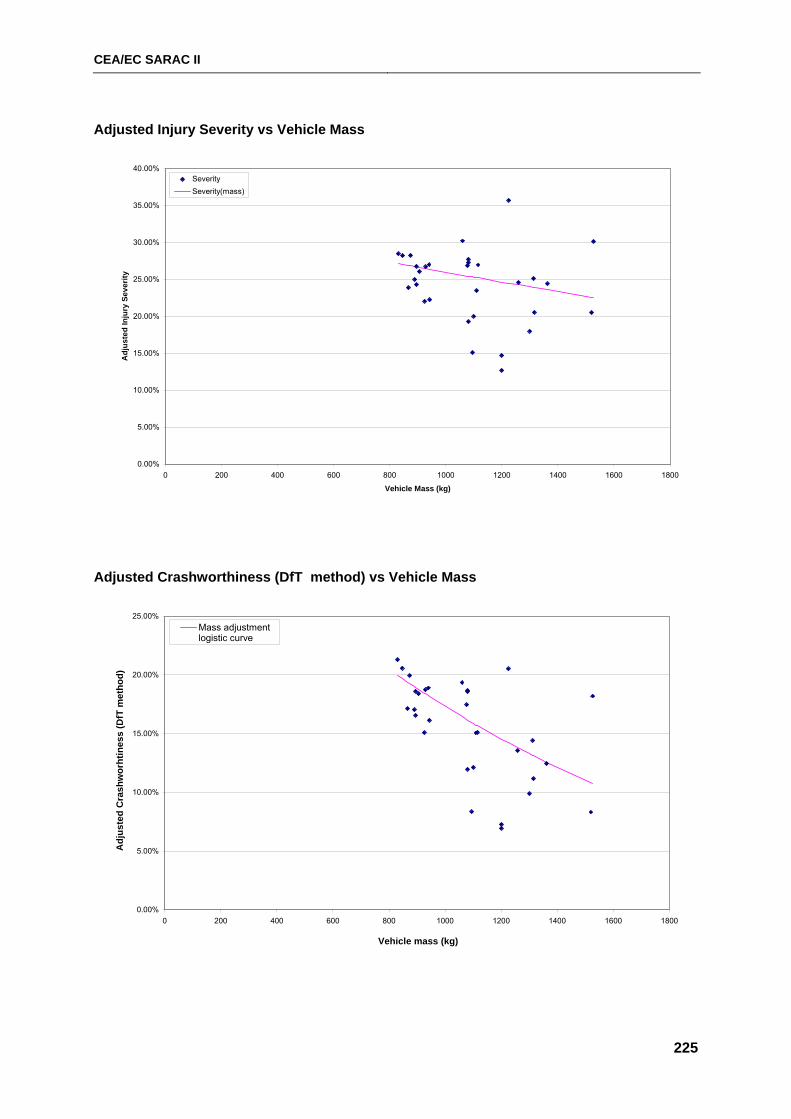
CEA/EC SARAC II
225
Adjusted Injury Severity vs Vehicle Mass
0.00%
5.00%
10.00%
15.00%
20.00%
25.00%
30.00%
35.00%
40.00%
0 200 400 600 800 1000 1200 1400 1600 1800
Vehicle Mass (kg)
Adj
uste
d In
jury
Sev
erity
SeveritySeverity(mass)
Adjusted Crashworthiness (DfT method) vs Vehicle Mass
0.00%
5.00%
10.00%
15.00%
20.00%
25.00%
0 200 400 600 800 1000 1200 1400 1600 1800
Vehicle mass (kg)
Adj
uste
d C
rash
wor
htin
ess
(DfT
met
hod)
Mass adjustmentlogistic curve
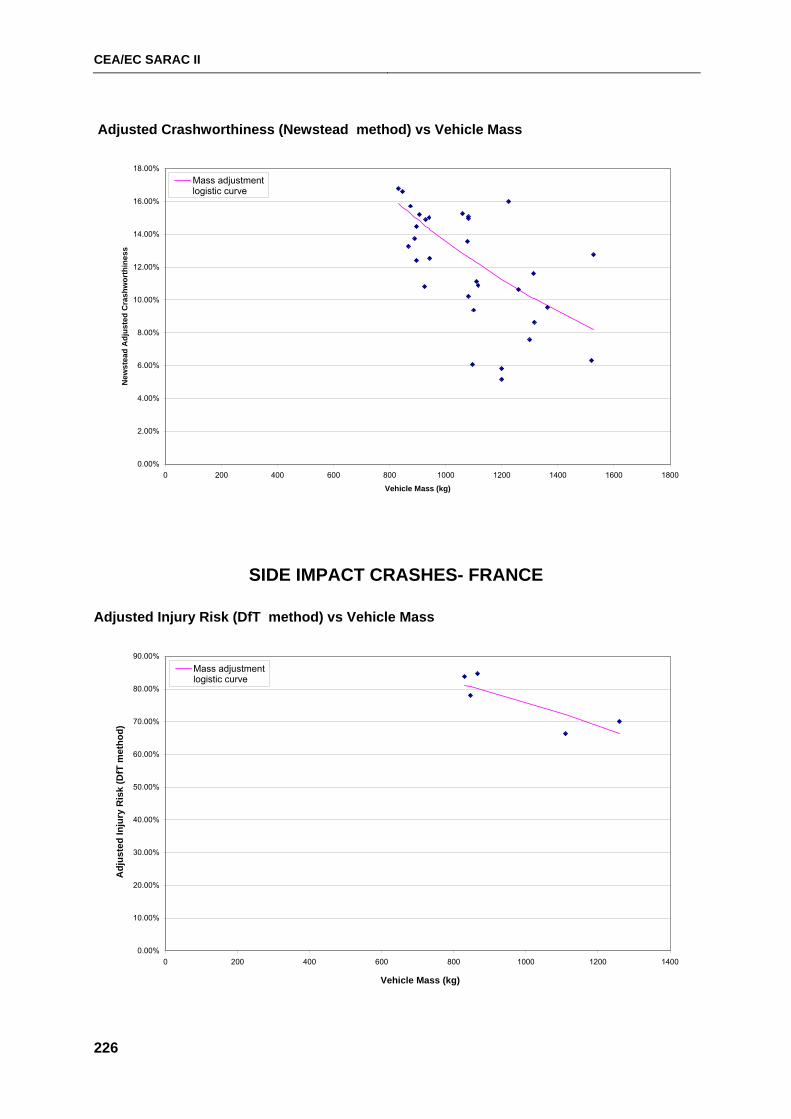
CEA/EC SARAC II
226
Adjusted Crashworthiness (Newstead method) vs Vehicle Mass
0.00%
2.00%
4.00%
6.00%
8.00%
10.00%
12.00%
14.00%
16.00%
18.00%
0 200 400 600 800 1000 1200 1400 1600 1800
Vehicle Mass (kg)
New
stea
d A
djus
ted
Cra
shw
orth
ines
s
Mass adjustmentlogistic curve
SIDE IMPACT CRASHES- FRANCE
Adjusted Injury Risk (DfT method) vs Vehicle Mass
0.00%
10.00%
20.00%
30.00%
40.00%
50.00%
60.00%
70.00%
80.00%
90.00%
0 200 400 600 800 1000 1200 1400
Vehicle Mass (kg)
Adj
uste
d In
jury
Ris
k (D
fT m
etho
d)
Mass adjustmentlogistic curve
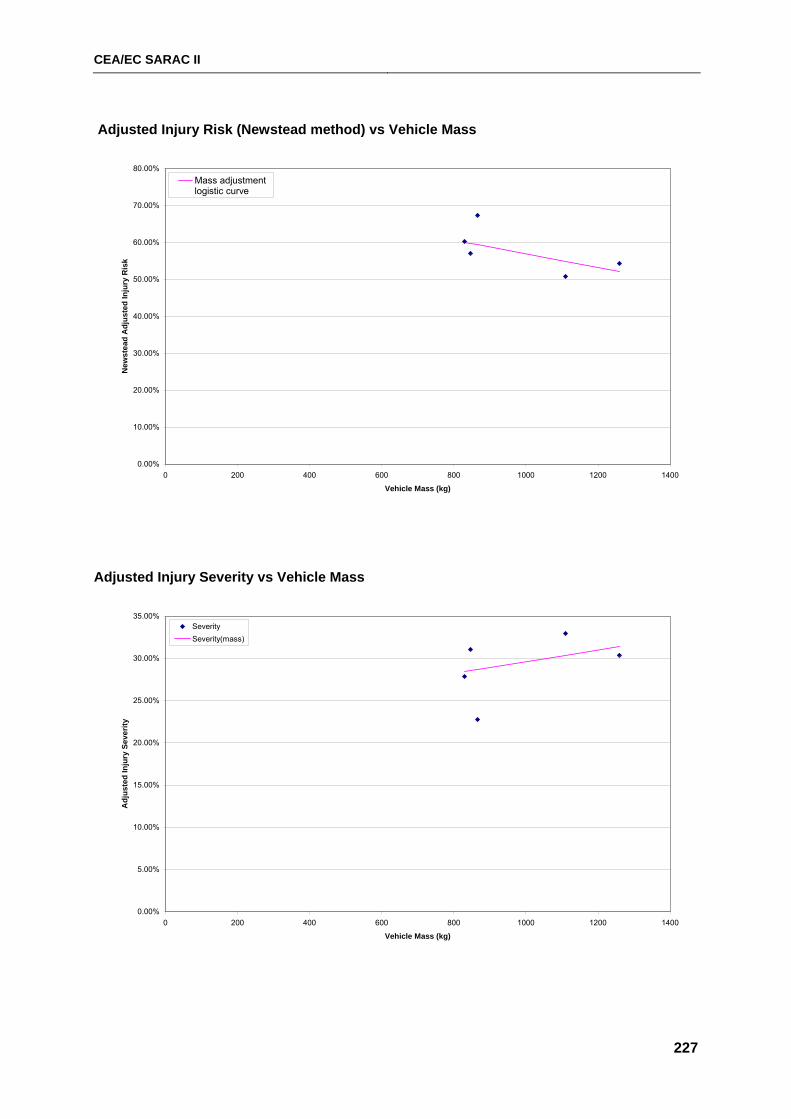
CEA/EC SARAC II
227
Adjusted Injury Risk (Newstead method) vs Vehicle Mass
0.00%
10.00%
20.00%
30.00%
40.00%
50.00%
60.00%
70.00%
80.00%
0 200 400 600 800 1000 1200 1400
Vehicle Mass (kg)
New
stea
d A
djus
ted
Inju
ry R
isk
Mass adjustmentlogistic curve
Adjusted Injury Severity vs Vehicle Mass
0.00%
5.00%
10.00%
15.00%
20.00%
25.00%
30.00%
35.00%
0 200 400 600 800 1000 1200 1400
Vehicle Mass (kg)
Adj
uste
d In
jury
Sev
erity
SeveritySeverity(mass)
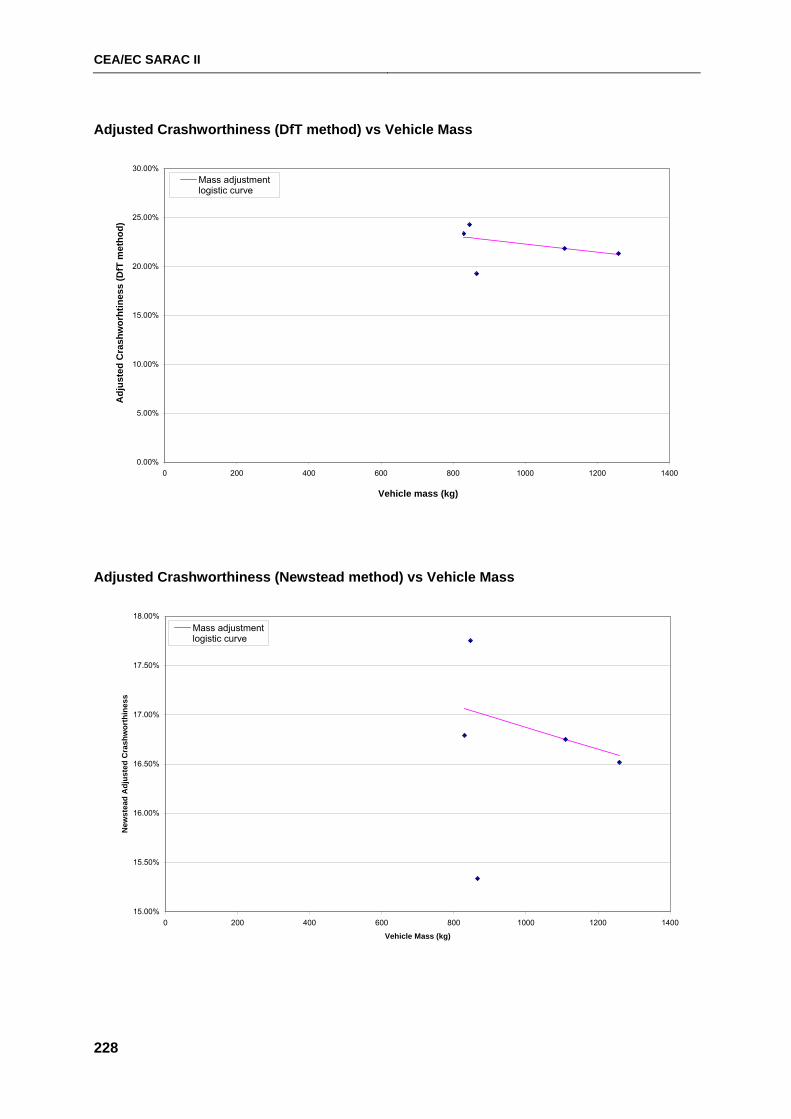
CEA/EC SARAC II
228
Adjusted Crashworthiness (DfT method) vs Vehicle Mass
0.00%
5.00%
10.00%
15.00%
20.00%
25.00%
30.00%
0 200 400 600 800 1000 1200 1400
Vehicle mass (kg)
Adj
uste
d C
rash
wor
htin
ess
(DfT
met
hod)
Mass adjustmentlogistic curve
Adjusted Crashworthiness (Newstead method) vs Vehicle Mass
15.00%
15.50%
16.00%
16.50%
17.00%
17.50%
18.00%
0 200 400 600 800 1000 1200 1400
Vehicle Mass (kg)
New
stea
d A
djus
ted
Cra
shw
orth
ines
s
Mass adjustmentlogistic curve
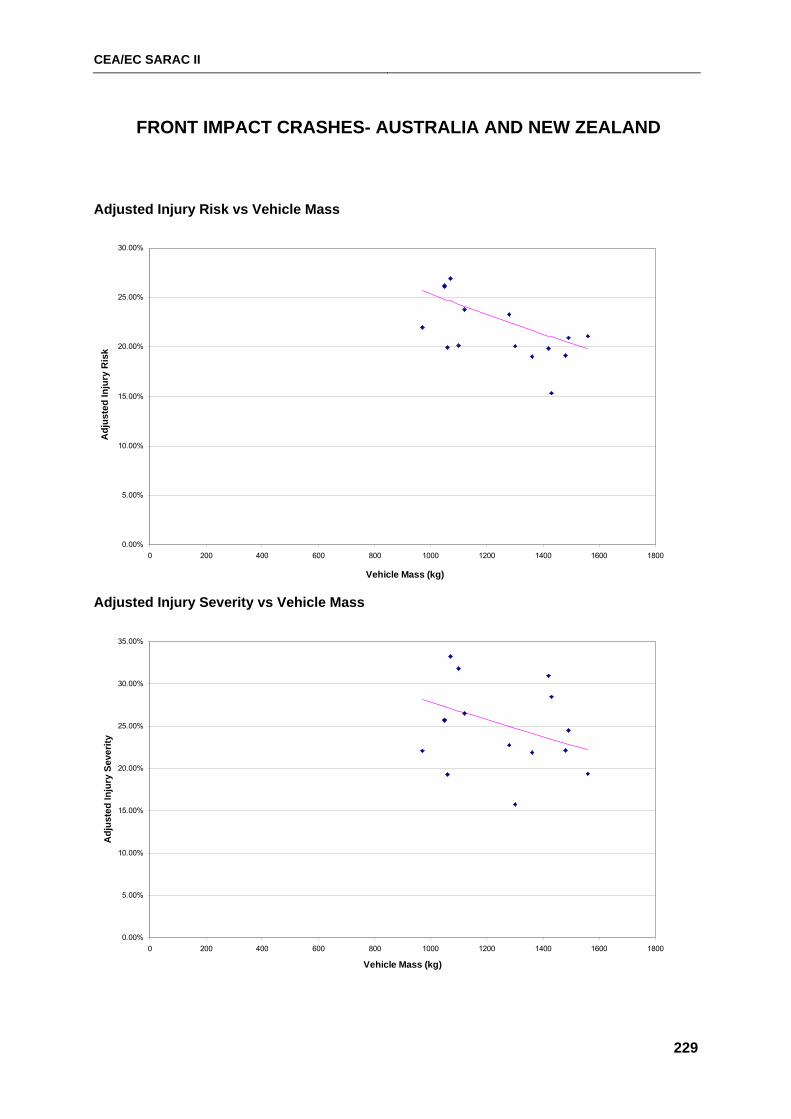
CEA/EC SARAC II
229
FRONT IMPACT CRASHES- AUSTRALIA AND NEW ZEALAND
Adjusted Injury Risk vs Vehicle Mass
Adjusted Injury Severity vs Vehicle Mass
0.00%
5.00%
10.00%
15.00%
20.00%
25.00%
30.00%
0 200 400 600 800 1000 1200 1400 1600 1800
Vehicle Mass (kg)
Adj
uste
d In
jury
Ris
k
0.00%
5.00%
10.00%
15.00%
20.00%
25.00%
30.00%
35.00%
0 200 400 600 800 1000 1200 1400 1600 1800
Vehicle Mass (kg)
Adj
uste
d In
jury
Sev
erity
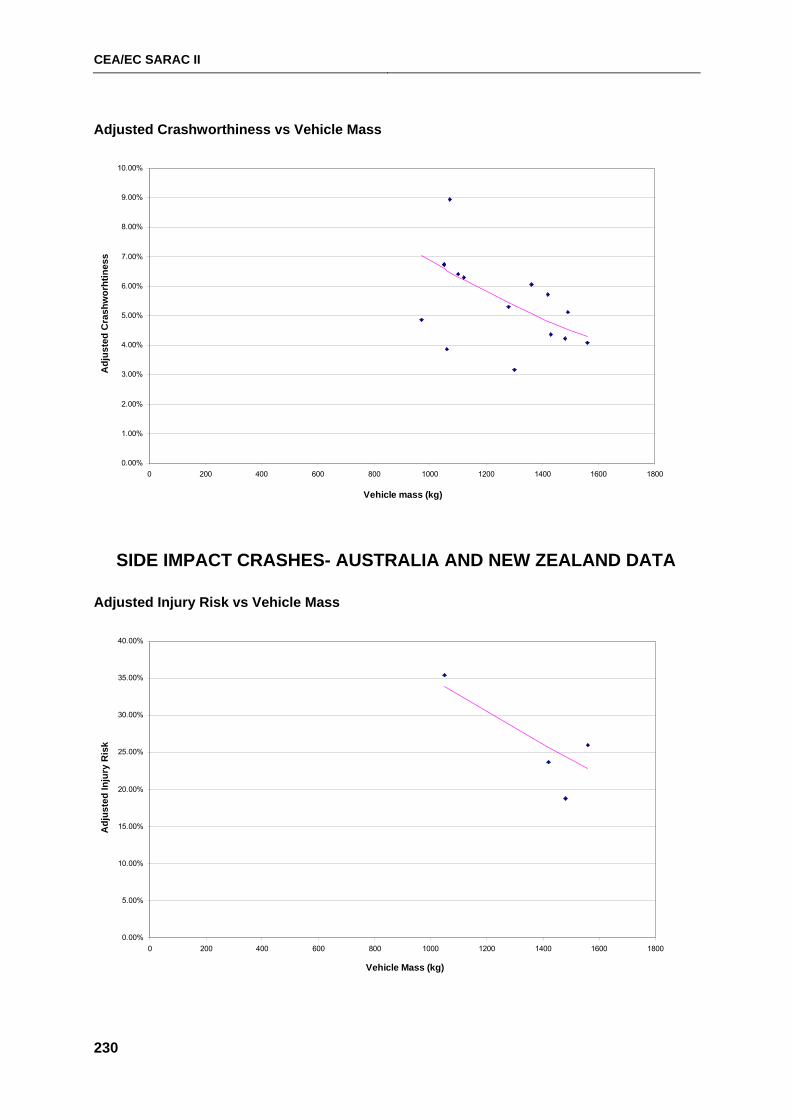
CEA/EC SARAC II
230
Adjusted Crashworthiness vs Vehicle Mass
SIDE IMPACT CRASHES- AUSTRALIA AND NEW ZEALAND DATA
Adjusted Injury Risk vs Vehicle Mass
0.00%
5.00%
10.00%
15.00%
20.00%
25.00%
30.00%
35.00%
40.00%
0 200 400 600 800 1000 1200 1400 1600 1800
Vehicle Mass (kg)
Adj
uste
d In
jury
Ris
k
0.00%
1.00%
2.00%
3.00%
4.00%
5.00%
6.00%
7.00%
8.00%
9.00%
10.00%
0 200 400 600 800 1000 1200 1400 1600 1800
Vehicle mass (kg)
Adj
uste
d C
rash
wor
htin
ess
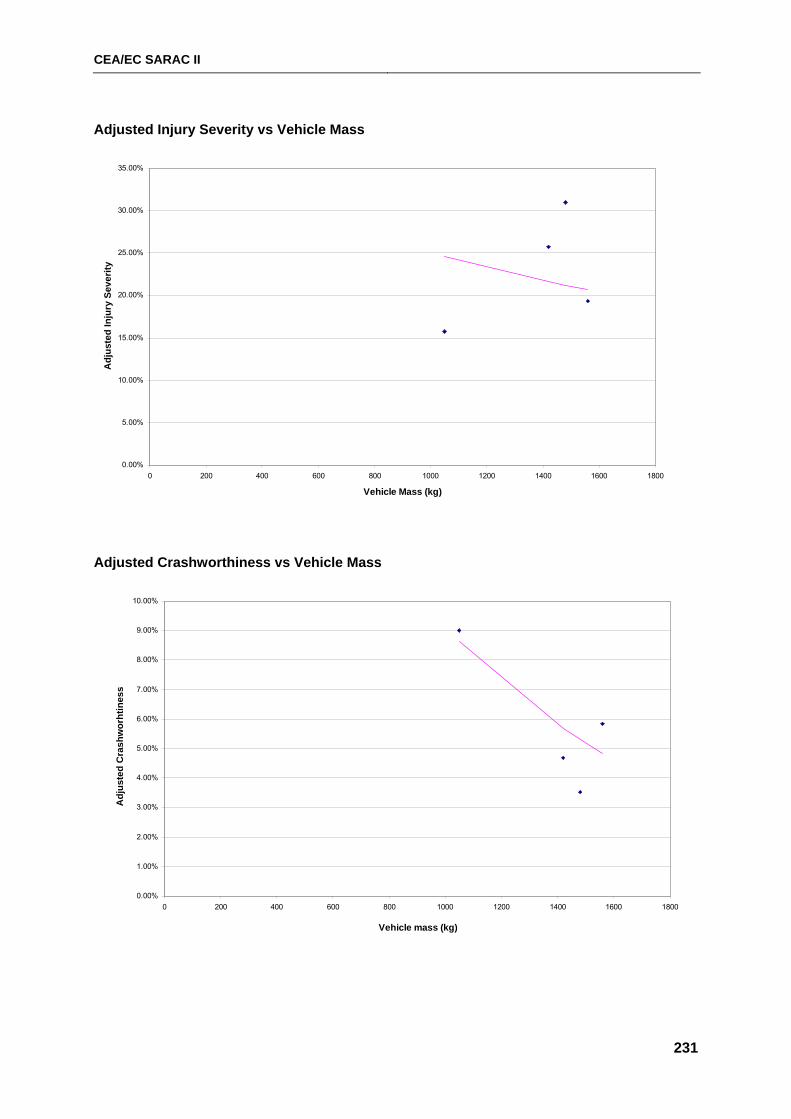
CEA/EC SARAC II
231
Adjusted Injury Severity vs Vehicle Mass
Adjusted Crashworthiness vs Vehicle Mass
0.00%
1.00%
2.00%
3.00%
4.00%
5.00%
6.00%
7.00%
8.00%
9.00%
10.00%
0 200 400 600 800 1000 1200 1400 1600 1800
Vehicle mass (kg)
Adj
uste
d C
rash
wor
htin
ess
0.00%
5.00%
10.00%
15.00%
20.00%
25.00%
30.00%
35.00%
0 200 400 600 800 1000 1200 1400 1600 1800
Vehicle Mass (kg)
Adj
uste
d In
jury
Sev
erity

CEA/EC SARAC II
232
CEA/EC SARAC II
233
APPENDIX J
FINNISH CRASH DATA AND ANALYSIS
CEA/EC SARAC II Finnish Real Crash Data
234
1 Finnish Real Crash Data
1.1 Data Description
A subset of the Finnish crash data, collected by VALT, was supplied for use in this study by
Helsinki University of Technology (HUT). The data included crash based records for all vehicles
involved in any single or two-vehicle crash reported to any Finnish insurance company during the
period 1994 to 2003. Both injury and non-injury crashes were included in the data. A total of
508,057 single and two-vehicle crash records were recorded in the data of which 348,660
occurred on public roads.
Within each crash record, information was provided on the make and model characteristics of all
vehicles involved in the crash. Information on driver characteristics, such as driver age and
driver sex, is provided in full for all ‘guilty’ drivers (i.e. those drivers determined to be at fault in
the crash) regardless of the level of injury sustained and for ‘non-guilty’ drivers where the driver
sustains some injury. Other useful variables included in the crash data were the location of the
crash (urban vs rural) and the speed zone of the crash site.
Driver injury level is coded in the Finnish data using a four level scale. These levels are: fatal
(includes cases where death occurs in less than 30 days as a result of the accident), serious
injury, slight injury and non-injury.
Considering the data set provided, and after selecting those vehicles involved in crashes on
public roads only, complete information for the required variables (driver age, driver sex, focus
driver injury outcome, opponent driver injury outcome, speed limit at the crash site and
urbanisation of the crash site) was available for 252,499 vehicles of which 29,885 were vehicles
with makes and models comparable to EuroNCAP tested vehicles.
Vehicle makes and models were selected for inclusion in the analysis where at least 80 drivers
were involved in two-car crashes and at least 20 drivers were injured in single and two-car
crashes combined. On this basis there was sufficient data to estimate injury risk ratings for 13
individual vehicle makes and models using the DfT method. There was insufficient data to
reliably estimate injury severity.
1.2 Identification of Vehicle Models in the Finnish Data
Vehicle model details are coded in the Finnish data in the ‘ TCode’ and ‘VCode’ variables (focus
and opposing vehicle model codes respectively) derived from official registration records.
Identification of vehicle models compatible with those tested by EuroNCAP was completed by
HUT. In addition to the model codes provided in the Finnish data, the first year of registration of
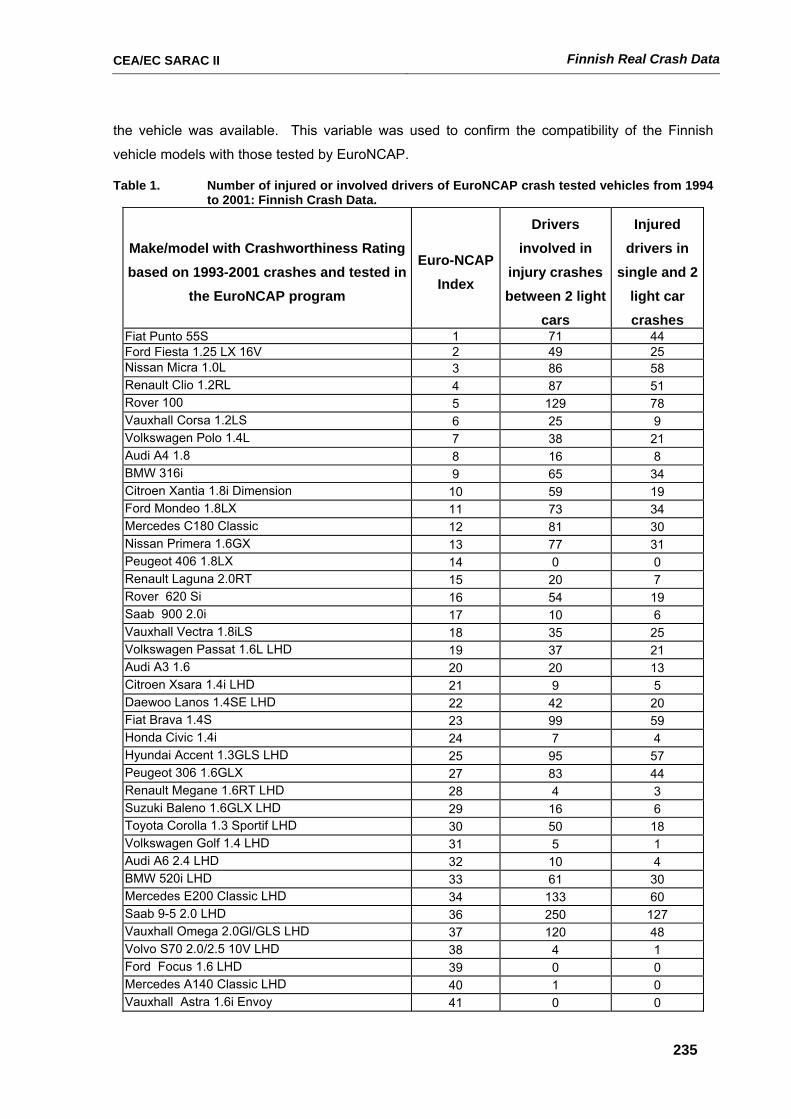
CEA/EC SARAC II Finnish Real Crash Data
235
the vehicle was available. This variable was used to confirm the compatibility of the Finnish
vehicle models with those tested by EuroNCAP.
Table 1. Number of injured or involved drivers of EuroNCAP crash tested vehicles from 1994 to 2001: Finnish Crash Data.
Make/model with Crashworthiness Rating based on 1993-2001 crashes and tested in
the EuroNCAP program
Euro-NCAP Index
Drivers involved in
injury crashes between 2 light
cars
Injured drivers in
single and 2 light car crashes
Fiat Punto 55S 1 71 44 Ford Fiesta 1.25 LX 16V 2 49 25 Nissan Micra 1.0L 3 86 58 Renault Clio 1.2RL 4 87 51 Rover 100 5 129 78 Vauxhall Corsa 1.2LS 6 25 9 Volkswagen Polo 1.4L 7 38 21 Audi A4 1.8 8 16 8 BMW 316i 9 65 34 Citroen Xantia 1.8i Dimension 10 59 19 Ford Mondeo 1.8LX 11 73 34 Mercedes C180 Classic 12 81 30 Nissan Primera 1.6GX 13 77 31 Peugeot 406 1.8LX 14 0 0 Renault Laguna 2.0RT 15 20 7 Rover 620 Si 16 54 19 Saab 900 2.0i 17 10 6 Vauxhall Vectra 1.8iLS 18 35 25 Volkswagen Passat 1.6L LHD 19 37 21 Audi A3 1.6 20 20 13 Citroen Xsara 1.4i LHD 21 9 5 Daewoo Lanos 1.4SE LHD 22 42 20 Fiat Brava 1.4S 23 99 59 Honda Civic 1.4i 24 7 4 Hyundai Accent 1.3GLS LHD 25 95 57 Peugeot 306 1.6GLX 27 83 44 Renault Megane 1.6RT LHD 28 4 3 Suzuki Baleno 1.6GLX LHD 29 16 6 Toyota Corolla 1.3 Sportif LHD 30 50 18 Volkswagen Golf 1.4 LHD 31 5 1 Audi A6 2.4 LHD 32 10 4 BMW 520i LHD 33 61 30 Mercedes E200 Classic LHD 34 133 60 Saab 9-5 2.0 LHD 36 250 127 Vauxhall Omega 2.0Gl/GLS LHD 37 120 48 Volvo S70 2.0/2.5 10V LHD 38 4 1 Ford Focus 1.6 LHD 39 0 0 Mercedes A140 Classic LHD 40 1 0 Vauxhall Astra 1.6i Envoy 41 0 0
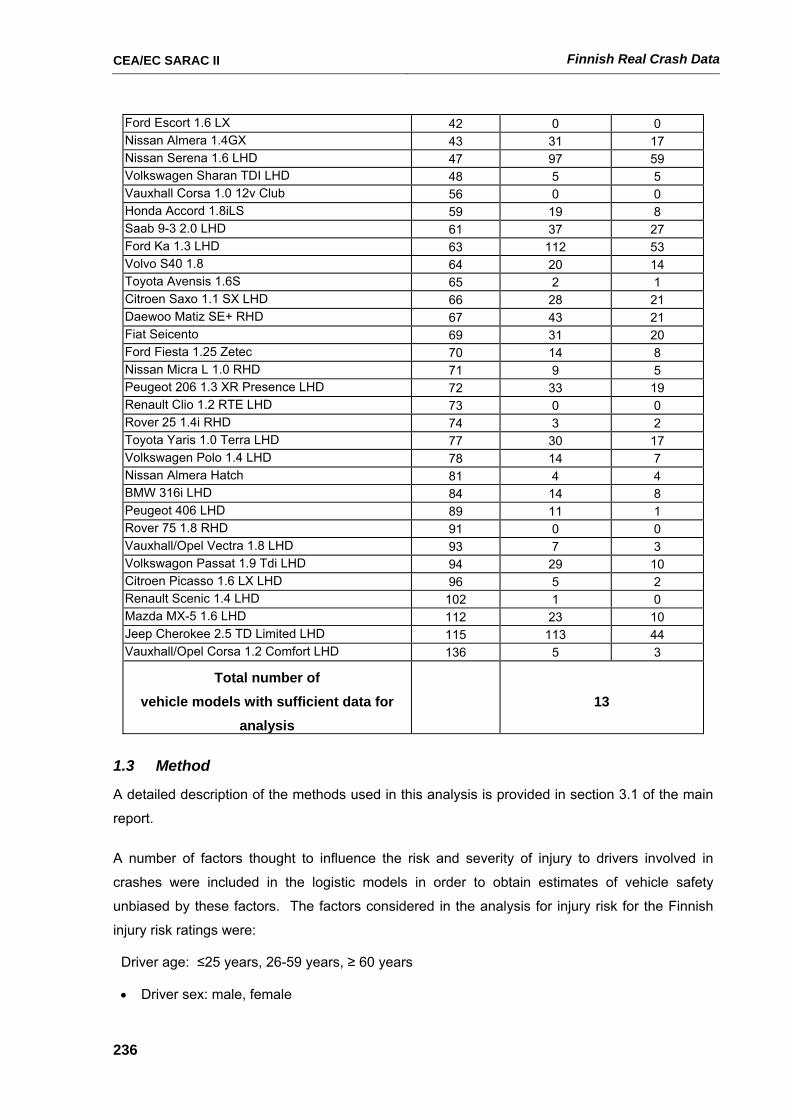
CEA/EC SARAC II Finnish Real Crash Data
236
Ford Escort 1.6 LX 42 0 0 Nissan Almera 1.4GX 43 31 17 Nissan Serena 1.6 LHD 47 97 59 Volkswagen Sharan TDI LHD 48 5 5 Vauxhall Corsa 1.0 12v Club 56 0 0 Honda Accord 1.8iLS 59 19 8 Saab 9-3 2.0 LHD 61 37 27 Ford Ka 1.3 LHD 63 112 53 Volvo S40 1.8 64 20 14 Toyota Avensis 1.6S 65 2 1 Citroen Saxo 1.1 SX LHD 66 28 21 Daewoo Matiz SE+ RHD 67 43 21 Fiat Seicento 69 31 20 Ford Fiesta 1.25 Zetec 70 14 8 Nissan Micra L 1.0 RHD 71 9 5 Peugeot 206 1.3 XR Presence LHD 72 33 19 Renault Clio 1.2 RTE LHD 73 0 0 Rover 25 1.4i RHD 74 3 2 Toyota Yaris 1.0 Terra LHD 77 30 17 Volkswagen Polo 1.4 LHD 78 14 7 Nissan Almera Hatch 81 4 4 BMW 316i LHD 84 14 8 Peugeot 406 LHD 89 11 1 Rover 75 1.8 RHD 91 0 0 Vauxhall/Opel Vectra 1.8 LHD 93 7 3 Volkswagon Passat 1.9 Tdi LHD 94 29 10 Citroen Picasso 1.6 LX LHD 96 5 2 Renault Scenic 1.4 LHD 102 1 0 Mazda MX-5 1.6 LHD 112 23 10 Jeep Cherokee 2.5 TD Limited LHD 115 113 44 Vauxhall/Opel Corsa 1.2 Comfort LHD 136 5 3
Total number of vehicle models with sufficient data for
analysis 13
1.3 Method
A detailed description of the methods used in this analysis is provided in section 3.1 of the main
report.
A number of factors thought to influence the risk and severity of injury to drivers involved in
crashes were included in the logistic models in order to obtain estimates of vehicle safety
unbiased by these factors. The factors considered in the analysis for injury risk for the Finnish
injury risk ratings were:
Driver age: ≤25 years, 26-59 years, ≥ 60 years
• Driver sex: male, female
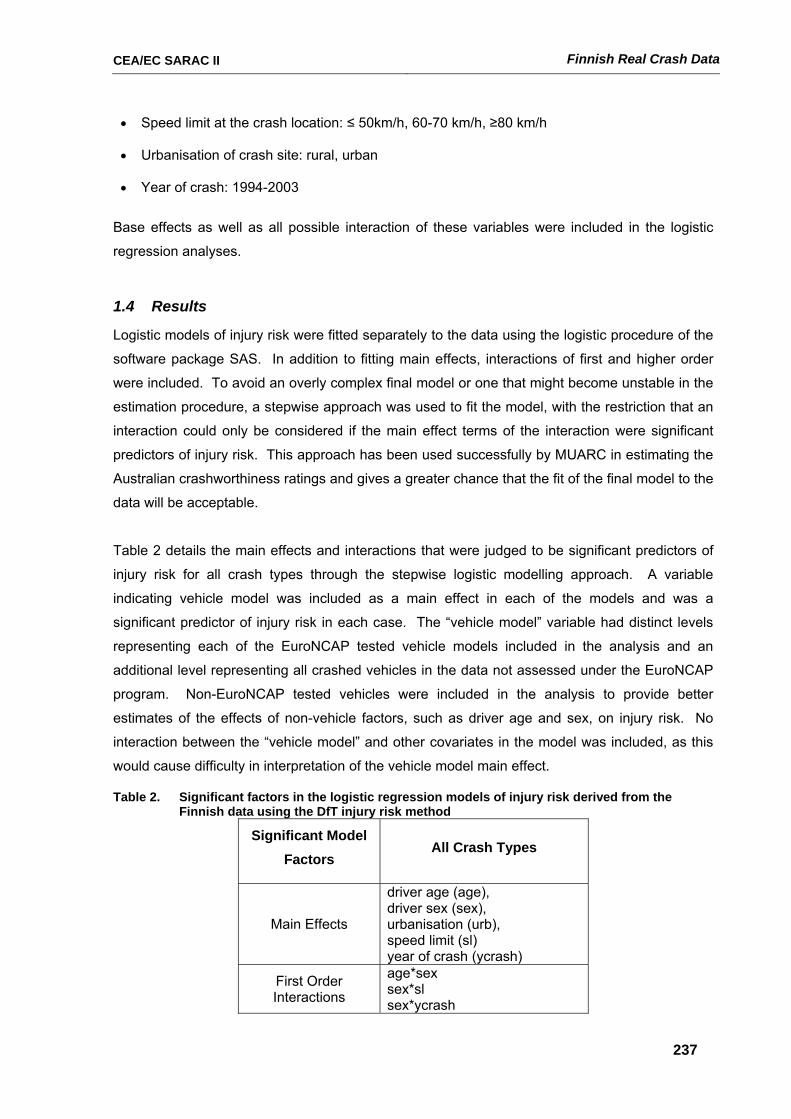
CEA/EC SARAC II Finnish Real Crash Data
237
• Speed limit at the crash location: ≤ 50km/h, 60-70 km/h, ≥80 km/h
• Urbanisation of crash site: rural, urban
• Year of crash: 1994-2003
Base effects as well as all possible interaction of these variables were included in the logistic
regression analyses.
1.4 Results
Logistic models of injury risk were fitted separately to the data using the logistic procedure of the
software package SAS. In addition to fitting main effects, interactions of first and higher order
were included. To avoid an overly complex final model or one that might become unstable in the
estimation procedure, a stepwise approach was used to fit the model, with the restriction that an
interaction could only be considered if the main effect terms of the interaction were significant
predictors of injury risk. This approach has been used successfully by MUARC in estimating the
Australian crashworthiness ratings and gives a greater chance that the fit of the final model to the
data will be acceptable.
Table 2 details the main effects and interactions that were judged to be significant predictors of
injury risk for all crash types through the stepwise logistic modelling approach. A variable
indicating vehicle model was included as a main effect in each of the models and was a
significant predictor of injury risk in each case. The “vehicle model” variable had distinct levels
representing each of the EuroNCAP tested vehicle models included in the analysis and an
additional level representing all crashed vehicles in the data not assessed under the EuroNCAP
program. Non-EuroNCAP tested vehicles were included in the analysis to provide better
estimates of the effects of non-vehicle factors, such as driver age and sex, on injury risk. No
interaction between the “vehicle model” and other covariates in the model was included, as this
would cause difficulty in interpretation of the vehicle model main effect.
Table 2. Significant factors in the logistic regression models of injury risk derived from the Finnish data using the DfT injury risk method
Significant Model Factors
All Crash Types
Main Effects
driver age (age), driver sex (sex), urbanisation (urb), speed limit (sl) year of crash (ycrash)
First Order Interactions
age*sex sex*sl sex*ycrash
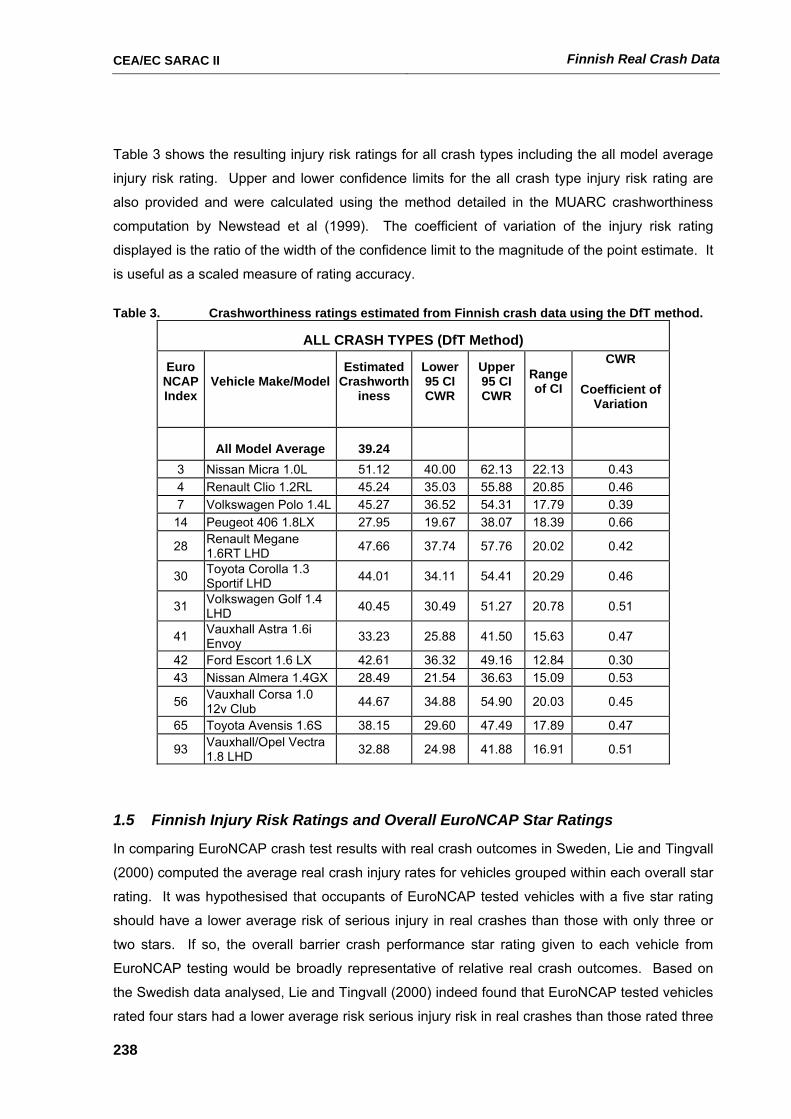
CEA/EC SARAC II Finnish Real Crash Data
238
Table 3 shows the resulting injury risk ratings for all crash types including the all model average
injury risk rating. Upper and lower confidence limits for the all crash type injury risk rating are
also provided and were calculated using the method detailed in the MUARC crashworthiness
computation by Newstead et al (1999). The coefficient of variation of the injury risk rating
displayed is the ratio of the width of the confidence limit to the magnitude of the point estimate. It
is useful as a scaled measure of rating accuracy.
Table 3. Crashworthiness ratings estimated from Finnish crash data using the DfT method.
ALL CRASH TYPES (DfT Method)
Euro NCAP Index
Vehicle Make/ModelEstimated
Crashworthiness
Lower 95 CI CWR
Upper 95 CI CWR
Range of CI
CWR
Coefficient of Variation
All Model Average 39.24 3 Nissan Micra 1.0L 51.12 40.00 62.13 22.13 0.43 4 Renault Clio 1.2RL 45.24 35.03 55.88 20.85 0.46 7 Volkswagen Polo 1.4L 45.27 36.52 54.31 17.79 0.39
14 Peugeot 406 1.8LX 27.95 19.67 38.07 18.39 0.66
28 Renault Megane 1.6RT LHD 47.66 37.74 57.76 20.02 0.42
30 Toyota Corolla 1.3 Sportif LHD 44.01 34.11 54.41 20.29 0.46
31 Volkswagen Golf 1.4 LHD 40.45 30.49 51.27 20.78 0.51
41 Vauxhall Astra 1.6i Envoy 33.23 25.88 41.50 15.63 0.47
42 Ford Escort 1.6 LX 42.61 36.32 49.16 12.84 0.30 43 Nissan Almera 1.4GX 28.49 21.54 36.63 15.09 0.53
56 Vauxhall Corsa 1.0 12v Club 44.67 34.88 54.90 20.03 0.45
65 Toyota Avensis 1.6S 38.15 29.60 47.49 17.89 0.47
93 Vauxhall/Opel Vectra 1.8 LHD 32.88 24.98 41.88 16.91 0.51
1.5 Finnish Injury Risk Ratings and Overall EuroNCAP Star Ratings
In comparing EuroNCAP crash test results with real crash outcomes in Sweden, Lie and Tingvall
(2000) computed the average real crash injury rates for vehicles grouped within each overall star
rating. It was hypothesised that occupants of EuroNCAP tested vehicles with a five star rating
should have a lower average risk of serious injury in real crashes than those with only three or
two stars. If so, the overall barrier crash performance star rating given to each vehicle from
EuroNCAP testing would be broadly representative of relative real crash outcomes. Based on
the Swedish data analysed, Lie and Tingvall (2000) indeed found that EuroNCAP tested vehicles
rated four stars had a lower average risk serious injury risk in real crashes than those rated three
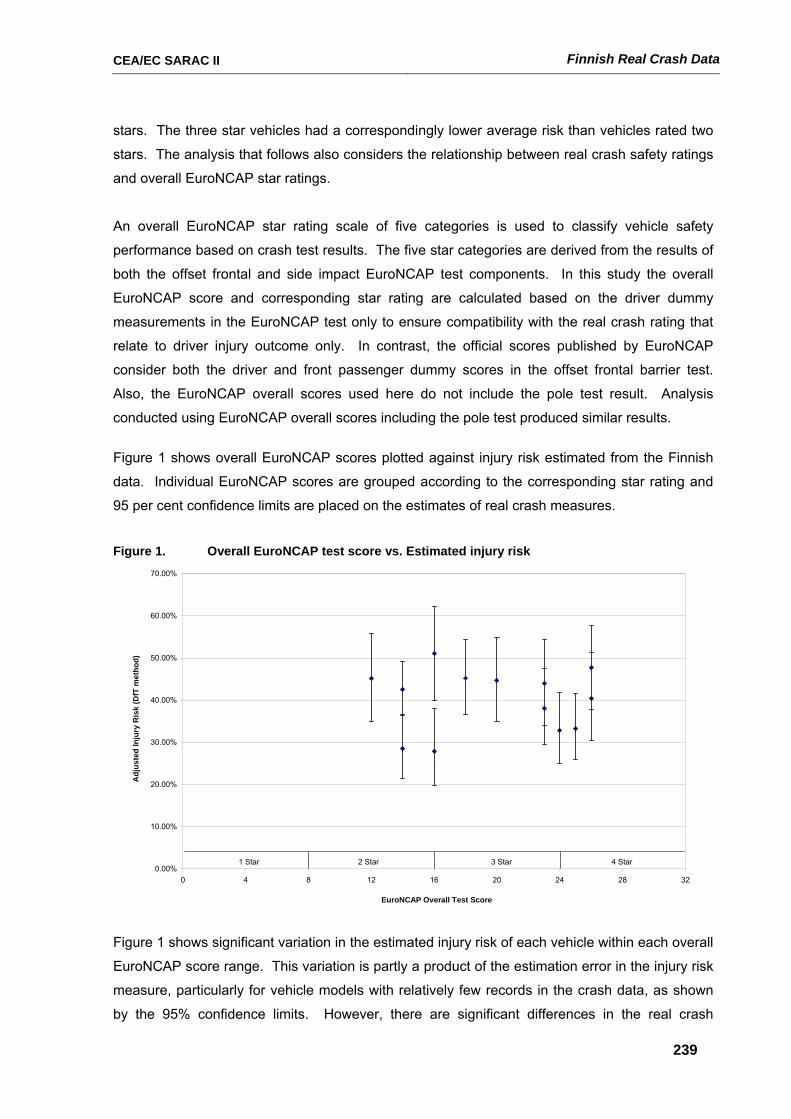
CEA/EC SARAC II Finnish Real Crash Data
239
stars. The three star vehicles had a correspondingly lower average risk than vehicles rated two
stars. The analysis that follows also considers the relationship between real crash safety ratings
and overall EuroNCAP star ratings.
An overall EuroNCAP star rating scale of five categories is used to classify vehicle safety
performance based on crash test results. The five star categories are derived from the results of
both the offset frontal and side impact EuroNCAP test components. In this study the overall
EuroNCAP score and corresponding star rating are calculated based on the driver dummy
measurements in the EuroNCAP test only to ensure compatibility with the real crash rating that
relate to driver injury outcome only. In contrast, the official scores published by EuroNCAP
consider both the driver and front passenger dummy scores in the offset frontal barrier test.
Also, the EuroNCAP overall scores used here do not include the pole test result. Analysis
conducted using EuroNCAP overall scores including the pole test produced similar results.
Figure 1 shows overall EuroNCAP scores plotted against injury risk estimated from the Finnish
data. Individual EuroNCAP scores are grouped according to the corresponding star rating and
95 per cent confidence limits are placed on the estimates of real crash measures.
Figure 1. Overall EuroNCAP test score vs. Estimated injury risk
0.00%
10.00%
20.00%
30.00%
40.00%
50.00%
60.00%
70.00%
0 4 8 12 16 20 24 28 32
EuroNCAP Overall Test Score
Adj
uste
d In
jury
Ris
k (D
fT m
etho
d)
1 Star 2 Star 3 Star 4 Star
Figure 1 shows significant variation in the estimated injury risk of each vehicle within each overall
EuroNCAP score range. This variation is partly a product of the estimation error in the injury risk
measure, particularly for vehicle models with relatively few records in the crash data, as shown
by the 95% confidence limits. However, there are significant differences in the real crash
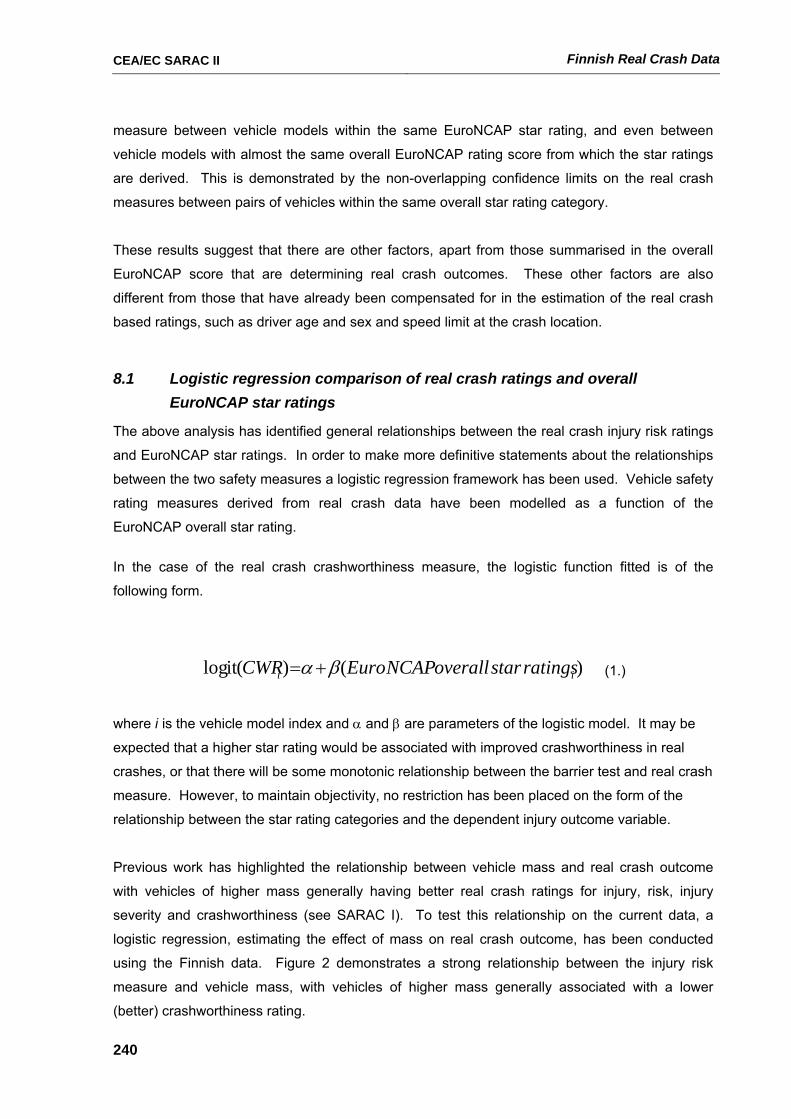
CEA/EC SARAC II Finnish Real Crash Data
240
measure between vehicle models within the same EuroNCAP star rating, and even between
vehicle models with almost the same overall EuroNCAP rating score from which the star ratings
are derived. This is demonstrated by the non-overlapping confidence limits on the real crash
measures between pairs of vehicles within the same overall star rating category.
These results suggest that there are other factors, apart from those summarised in the overall
EuroNCAP score that are determining real crash outcomes. These other factors are also
different from those that have already been compensated for in the estimation of the real crash
based ratings, such as driver age and sex and speed limit at the crash location.
8.1 Logistic regression comparison of real crash ratings and overall EuroNCAP star ratings
The above analysis has identified general relationships between the real crash injury risk ratings
and EuroNCAP star ratings. In order to make more definitive statements about the relationships
between the two safety measures a logistic regression framework has been used. Vehicle safety
rating measures derived from real crash data have been modelled as a function of the
EuroNCAP overall star rating.
In the case of the real crash crashworthiness measure, the logistic function fitted is of the
following form.
)()(itlog ii ratingsstaroverallNCAPEuroCWR βα += (1.)
where i is the vehicle model index and α and β are parameters of the logistic model. It may be
expected that a higher star rating would be associated with improved crashworthiness in real
crashes, or that there will be some monotonic relationship between the barrier test and real crash
measure. However, to maintain objectivity, no restriction has been placed on the form of the
relationship between the star rating categories and the dependent injury outcome variable.
Previous work has highlighted the relationship between vehicle mass and real crash outcome
with vehicles of higher mass generally having better real crash ratings for injury, risk, injury
severity and crashworthiness (see SARAC I). To test this relationship on the current data, a
logistic regression, estimating the effect of mass on real crash outcome, has been conducted
using the Finnish data. Figure 2 demonstrates a strong relationship between the injury risk
measure and vehicle mass, with vehicles of higher mass generally associated with a lower
(better) crashworthiness rating.
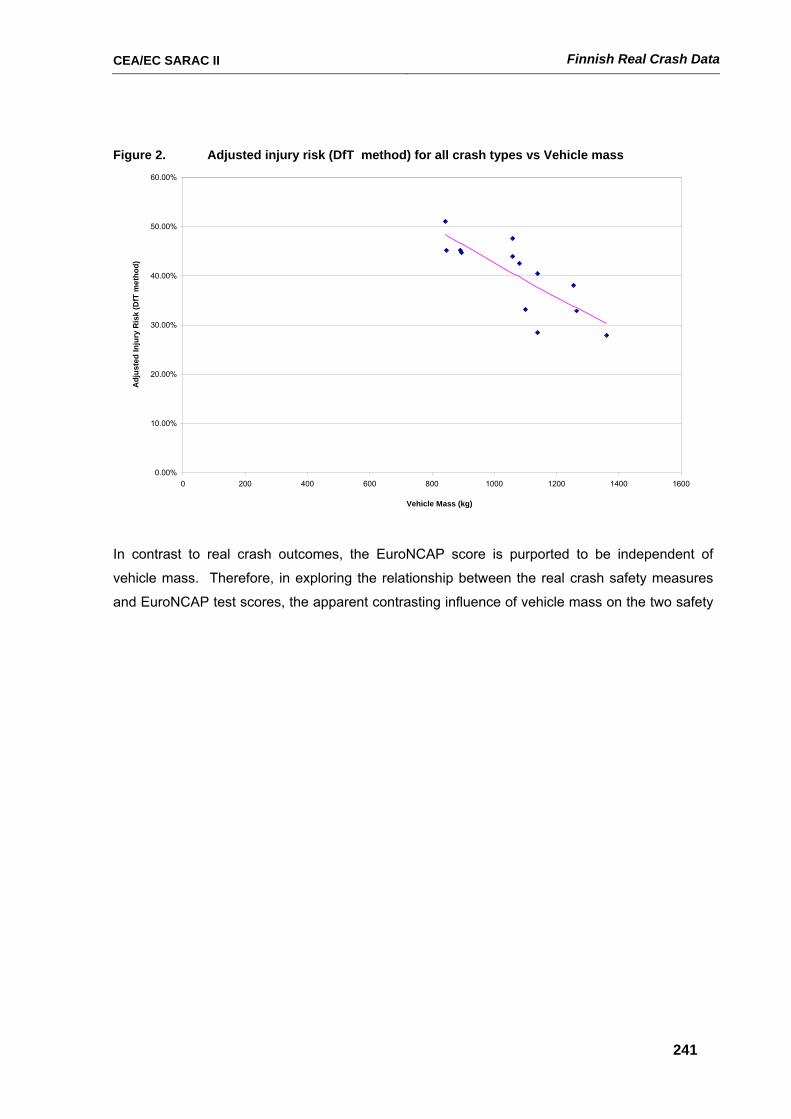
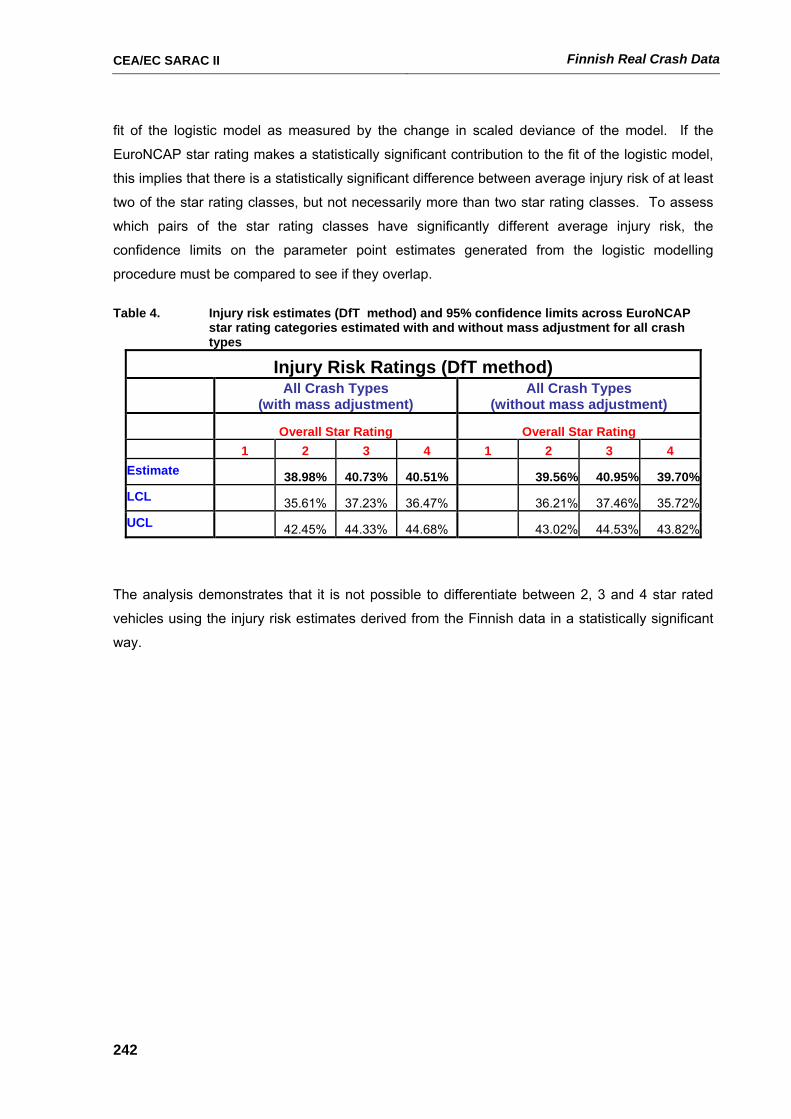
CEA/EC SARAC II Finnish Real Crash Data
242
fit of the logistic model as measured by the change in scaled deviance of the model. If the
EuroNCAP star rating makes a statistically significant contribution to the fit of the logistic model,
this implies that there is a statistically significant difference between average injury risk of at least
two of the star rating classes, but not necessarily more than two star rating classes. To assess
which pairs of the star rating classes have significantly different average injury risk, the
confidence limits on the parameter point estimates generated from the logistic modelling
procedure must be compared to see if they overlap.
Table 4. Injury risk estimates (DfT method) and 95% confidence limits across EuroNCAP
star rating categories estimated with and without mass adjustment for all crash types
Injury Risk Ratings (DfT method)
All Crash Types
(with mass adjustment) All Crash Types
(without mass adjustment)
Overall Star Rating Overall Star Rating 1 2 3 4 1 2 3 4 Estimate 38.98% 40.73% 40.51% 39.56% 40.95% 39.70%LCL 35.61% 37.23% 36.47% 36.21% 37.46% 35.72%UCL 42.45% 44.33% 44.68% 43.02% 44.53% 43.82%
The analysis demonstrates that it is not possible to differentiate between 2, 3 and 4 star rated
vehicles using the injury risk estimates derived from the Finnish data in a statistically significant
way.