quality-based price discrimination and tax incidence: evidence from gasoline and diesel cars
TRANSCRIPT
Quality-Based Price Discrimination and Tax Incidence: Evidence from Gasoline and Diesel CarsAuthor(s): Frank VerbovenSource: The RAND Journal of Economics, Vol. 33, No. 2 (Summer, 2002), pp. 275-297Published by: Wiley on behalf of RAND CorporationStable URL: http://www.jstor.org/stable/3087434 .
Accessed: 06/06/2014 03:42
Your use of the JSTOR archive indicates your acceptance of the Terms & Conditions of Use, available at .http://www.jstor.org/page/info/about/policies/terms.jsp
.JSTOR is a not-for-profit service that helps scholars, researchers, and students discover, use, and build upon a wide range ofcontent in a trusted digital archive. We use information technology and tools to increase productivity and facilitate new formsof scholarship. For more information about JSTOR, please contact [email protected].
.
Wiley and RAND Corporation are collaborating with JSTOR to digitize, preserve and extend access to TheRAND Journal of Economics.
http://www.jstor.org
This content downloaded from 195.194.14.3 on Fri, 6 Jun 2014 03:42:56 AMAll use subject to JSTOR Terms and Conditions
RAND Journal of Economics Vol. 33, No. 2, Summer 2002 pp. 275-297
Quality-based price discrimination and tax incidence: evidence from gasoline and diesel cars
Frank Verboven*
The existing tax policies toward gasoline and diesel cars in European countries provide a unique opportunity to analyze quality-based price discrimination and the implied tax incidence. In my econometric framework, consumers choose the type of engine based on their annual mileage; prices are set by the manufacturers. The relative pricing of gasoline and diesel cars appears to be consistent with monopolistic price discrimination, effectively segmenting low-mileage from high- mileage consumers. On average, about 75% to 90% of the price differentials between gasoline and diesel cars can be explained by markup differences. I draw implications for the effectiveness and the revenue effects of tax policy.
1. Introduction * Price discrimination based on willingness to pay for quality has been studied extensively in the theoretical literature. Mussa and Rosen (1978) show how a monopolist can extract higher profit margins from consumers with a higher willingness to pay for quality by offering a wide product line of price-quality combinations. When several firms compete, the feasibility and nature of quality-based price discrimination is less well understood. It depends on the precise pattern of competitive interaction, and no general results are available. 1 At the same time, efforts to quantify the empirical importance of price-discriminating practices have been limited. The problem is, of course, that the observed price differentials between high-quality and low-quality variants may stem from either cost or markup differences.
The European car market presents a unique opportunity to empirically analyze quality-based price discrimination. In most European countries, car buyers have a choice of two engine types: gasoline and diesel. The diesel engine has a higher "quality" in the sense that it consumes less fuel per mile and requires less expensive fuel due to a favorable tax treatment. Consumers differ in their willingness to pay for this quality aspect, since they are heterogeneous in their annual mileage. As a result, manufacturers may consider a price-discriminating strategy by charging
* Catholic University of Leuven and CEPR; [email protected]. I am grateful to Hans Degryse, Bertrand Melenberg, Wilfried Pauwels, and especially to two anonymous referees and
Ariel Pakes for helpful comments. Research assistance in data collection was provided by Alexey Novoseltsev and Sandy Torrekens. Financial support by the Science Foundation-Flanders (Fonds voor Wetenschappelijk Onderzoek-Vlaanderen, grant no. 774810/8/F01/6260/13 1200) is gratefully acknowledged.
1 See, for example, the specific assumptions on brand preferences used by Katz (1984) to model product differ- entiation and competitive interaction. Gilbert and Matutes (1993) use a different model of brand preferences and find, surprisingly, that competition eliminates the feasibility of quality-based price discrimination.
Copyright ? 2002, RAND. 275
This content downloaded from 195.194.14.3 on Fri, 6 Jun 2014 03:42:56 AMAll use subject to JSTOR Terms and Conditions
276 / THE RAND JOURNAL OF ECONOMICS
different profit markups on the gasoline and the diesel variants to exploit the consumer mileage heterogeneity.
I develop an econometric model of demand and pricing for gasoline and diesel cars. The demand model allows consumers to be heterogeneous in their willingness to pay for the fuel cost per mile, while it restricts consumers to be homogeneous in their valuation for other quality differences between gasoline and diesel engines. The model predicts average mileages for gaso- line and diesel consumers that are consistent with prior information. In particular, the average mileages of gasoline consumers are substantially below those of diesel consumers. The dominant engine characteristic for which consumers have heterogeneous preferences therefore appears to be the fuel cost per mile. Preferences for the other engine characteristics appear to be reasonably homogeneous as a first approximation.
The pricing model investigates whether firms exploit this preference heterogeneity for fuel costs by charging higher markups on diesel cars. I decompose the observed price differentials between gasoline and diesel cars into their cost and markup components. The estimates demon- strate that the price differentials are best explained by price discrimination of a monopolistic type. On average, about 75% to 90% of the price premium to be paid for a diesel car can be attributed to price discrimination between high- and low-mileage consumers; the remaining part follows from higher costs due to differences in engine specifications. These results empirically demon- strate the feasibility and the importance of quality-based price discrimination in the presence of competition. The results have implications for the effectiveness of fuel tax and car tax policy. For example, the estimated demand effect of an increase in the diesel fuel tax is reduced by 50% if one accounts for monopolistic price responses to tax changes. The revenue effects are also affected, but to a lesser extent.
As noted above, there is very little econometric evidence on quality-based price discrimina- tion. Shepard (1991) analyzes a market in which firms differ in their ability to price discriminate, but presumably not (much) in their cost of production. Observed differences between firms in price differentials may then be attributed to markups, i.e., price discrimination.2 Unlike Shepard's application, I have no prior information on costs. I instead infer the presence of price discrimina- tion from the structural model of conduct that is found to best fit the data. Leslie (1999) considers various types of price discrimination for a Broadway play, including price discrimination based on different seat qualities. He starts by estimating the demand system and computes the prices as predicted by the current industry circumstances. He then investigates how prices would change if the firm had more flexibility in setting the price menu.3
Research on demand and pricing in the automobile market has received considerable atten- tion in recent years. Most contributions ignore the issue of quality-based price discrimination by limiting attention to base model cars. The focus is instead on the nature of product differentiation and competition between different car models. See the contributions by Bresnahan (1981, 1987), Berry, Levinsohn, and Pakes (1995, 1999), Feenstra and Levinsohn (1995), Goldberg (1995), Petrin (forthcoming), and Sudhir (2001) for the U.S. market.4 Regarding the European car mar- ket, Verboven (1996) and Goldberg and Verboven (2001) provide evidence of international price discrimination. This is price discrimination of the third degree, and it is achieved by the manufac- turers' strategies to prevent cross-border consumer (or parallel importer) trade. The present article may be seen as reinforcing the evidence that firms in a seemingly competitive market succeed in
2 Cohen (2001) and Clerides (forthcoming) are two other studies that directly test for the presence of markup differences with some prior information on cost differences.
3 Metrick and Zeckhauser (1996) also consider the relationship between prices and quality (as well as quantity) in a theoretical and empirical analysis. In their application, different firms sell different qualities, and the question is whether prices will differ between these differentiated firms (or whether instead sales will differ). In the present article, the same firm offers different qualities (gasoline versus diesel), a central question being whether that firm can use its different qualities to price discriminate.
4 Among these product-differentiation studies, Bresnahan (1987), Feenstra and Levinsohn (1995), and Berry, Levinsohn, and Pakes (1999) consider the nature of competition. O RAND 2002.
This content downloaded from 195.194.14.3 on Fri, 6 Jun 2014 03:42:56 AMAll use subject to JSTOR Terms and Conditions
VERBOVEN / 277
price discrimination, not only of the third-degree but also of the second-degree type, by profitably segmenting consumers with a low annual mileage from those with a high annual mileage.
Detailed econometric evidence is available on price elasticities of demand for fuel. Goodwin (1992) and Oum, Waters, and Yong (1992) provide a survey of this literature. The considerable amount of empirical research can be explained by the strong interest from a public-policy taxation perspective. A distinction is usually made between short-term and long-term fuel price elasticities. Short-term elasticities measure fuel demand effects keeping the size and structure of the vehicle stock fixed. Long-term elasticities take into account that fuel price changes induce (i) consumers to substitute to other products and (ii) firms to develop new products.5 A robust finding is that the long-term fuel price elasticities are substantially higher than the short-term elasticities. The results of the present article imply that the long-term fuel price elasticities may be overestimated if one does not properly account for the observed tax incidence by the car manufacturers in response to fuel price changes.6
The outline of the article is as follows. Section 2 describes the market for gasoline and diesel cars in three European countries: Belgium, France, and Italy. Section 3 introduces the demand model, while Section 4 considers pricing. Section 5 discusses identification and estimation of the model. The empirical results are presented in Section 6. Finally, Section 7 concludes.
2. The market for gasoline and diesel cars in Europe * The vast majority of automobile engines in Europe are fuelled with either gasoline or diesel petroleum.7 Diesel-engine automobiles quickly gained popularity in Europe during the 1970s, stimulated by favorable tax treatment and subsequent technological improvements. In recent years, the choice between a gasoline or a diesel car has become one of the key elements in the European consumer's car-purchasing decision.
To introduce the questions addressed in this article, I shall first cover technology, taxation, pricing, and demand. This discussion is based on a dataset collected for three European coun- tries, summarized in Tables 1 and 2. The data consist of sales, list prices, taxes, and technical characteristics of 41 pairs of automobile models in Belgium, France, and Italy during the pe- riod 1991-1994. These data are supplemented with information on the distribution of annual car mileage. Data on list prices (including value-added taxes) and technical characteristics come from the following weekly retail catalogues (one of the August issues): De Autogids (Belgium), I'Automobile Magazine (France), and Quattroruote (Italy). Sales data come from publications on new car registrations by the Nationaal Instituut voor Statistiek (Belgium), I'Argus de I'Automobile et Locomotions (France), and A. C.L (Italy). Average annual gasoline and diesel fuel prices, for all three countries, are taken from 1 'Argus de 1 'Automobile et Locomotions. Data on the distribution of mileage, organized in categories of several principal characteristics (weight and horsepower), come from the industry associations A.C.E.A., F.E.B.I.A.C., and T.R.I., and from survey data by De Borger (1987).
The included models are the base models from the gasoline and the diesel range. In cases where the base model of a gasoline variant was equipped with a different set of options than the diesel variant (e.g., air conditioning or ABS), I appropriately upgraded or downgraded the
5Pakes, Berry, and Levinsohn (1993) show that firms in the United States developed more fuel-efficient cars in response to the rise in fuel prices in 1973. The development of reliable diesel cars in the '70s and '80s may have a similar interpretation. Our long-term elasticities nevertheless only account for the changed consumer purchasing decisions. Product characteristics are assumed to remain unchanged.
6 Issues of tax incidence are also present in Fershtman, Gandal, and Markovich (1999), an empirical study of the Israeli car market with an instructive policy simulation analysis of alternative taxes. They consider car taxes only and do not look at taxes in related complementary markets, such as fuel taxes. Furthermore, their empirical estimates do not establish that firms indeed take taxes into account in their pricing strategies; the extent of tax incidence is driven by their assumption of Bertrand pricing behavior.
7 There is a third possible fuel: liquified petroleum gas (LPG). However, the market share of automobiles with LPG engines is quite small and, in fact, negligable in the three European countries that I study in detail.
0 RAND 2002.
This content downloaded from 195.194.14.3 on Fri, 6 Jun 2014 03:42:56 AMAll use subject to JSTOR Terms and Conditions
278 / THE RAND JOURNAL OF ECONOMICS
TABLE 1 Summary Statistics (406 observations)
Gasoline Cars Diesel Cars
Mean Standard Deviation Mean Standard Deviation
Horsepower (kW) 65.88 20.94 59.08 17.29
Displacement (cc) 1605 323 1963 342
Weight (kg) 1061 203 1143 206
Speed (km/hour) 177.7 17.9 169.6 16.4
Acceleration (sec. to 100 km/h) 13.24 2.44 15.21 2.50
Fuel efficiency (liters per 100 km) 7.56 1.05 6.05 .76
French origin .160 .367
German origina .431 .496
Italian origin .305 .461
Initial purchase price (in $) 18,093 7,061 20,417 8,063
Fuel price (in $ per liter) .931 .109 .712 .086
Annual car tax (in $) 173.7 78.7 285.9 236.5
Sales (in $) 19,033 35,885 9,399 14,689
a Includes G.M. (Opel) and Ford cars produced in Germany.
TABLE 2 Summary Statistics, Diesel/Gasoline (406 observations)
Standard Deviationa
Mean Overall Between Within
A horsepower (kW) -6.80 7.36 7.29 1.84
A displacement (cc) 357 243 240 36
A weight (kg) 82 34 32 12
A speed (km/hour) -7.11 6.75 6.58 1.84
A acceleration (sec. to 100 km/h) -1.95 1.57 1.54 .32
A fuel efficiency (liters per 100 km) -1.50 .67 .65 .12
A initial purchase price (in $) 2323 1632 1466 683
A fuel price (in $ per liter) -.218 .051 .010 .050
A annual car tax (in $) 112.2 235.2 72.7 225.5
Diesel sales/total sales .419 .223 .144 .171
Note: Variables refer to absolute differences between the diesel and gasoline variables, except for sales, which refers to a percentage (conform with the model specification).
a The standard deviation is computed on the mean of the variables across time, say xjm, where j indexes the car make and m indexes the market. The standard deviation of xjm is decomposed into a between component (.j - .) and a within component (xjm -X).
? RAND 2002.
This content downloaded from 195.194.14.3 on Fri, 6 Jun 2014 03:42:56 AMAll use subject to JSTOR Terms and Conditions
VERBOVEN / 279
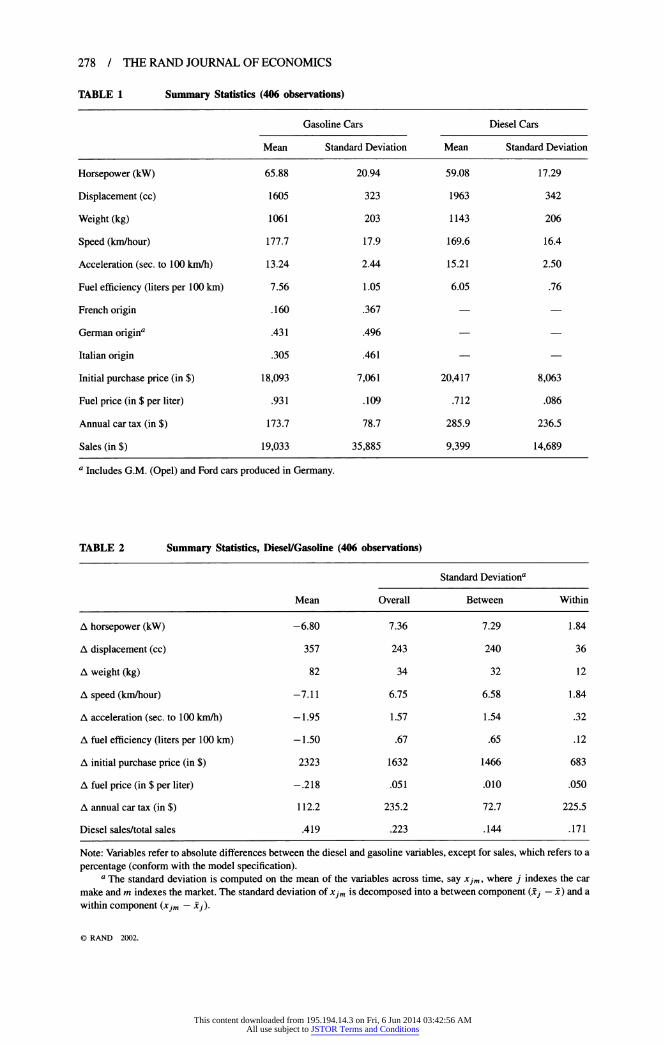
variants such that they contain the same equipment. Table 1 shows summary statistics for the separate gasoline and diesel variables. Table 2 shows more detailed summary statistics for the differences between the diesel and gasoline variables, which are the actual variables entering in the empirical model. The "between" standard deviation measures the variation across models, whereas the "within" standard deviation is a measure of the variation across the three countries. The standard deviations show that the technical characteristics especially show variation across models; the tax variables (fuel and car tax) mainly show variation across countries; and the initial purchase price and sales variables show important variation over both dimensions.
z Technology. In a gasoline engine, a mixture of air and fuel is ignited by a spark; in a diesel engine, the mixture explodes spontaneously due to the high pressure. These technical differences lie at the basis of some well-known differences in performance and comfort. The diesel engine traditionally produced lower horsepower (at equal engine size), and lower speed and acceleration than the gasoline engine. Furthermore, the diesel engine has had a reputation for making more noise and for less-reliably starting in cold temperatures. On the positive side, a diesel engine has generally had greater fuel efficiency that yields greater "autonomy" (the number of miles that can be driven with a full tank), as well as better durability.
Due to technological improvements (such as the introduction of the turbo and direct injection), these differences have diminished in recent years. Manufacturers in fact spend significant efforts to offer closely comparable "twin models": for each model, they typically offer about four to six different versions of gasoline engines and a similar number of diesel engines. The averages in Tables 1 and 2 give an idea of the current differences in technical characteristics. The lower engine power of diesel cars (horsepower, speed, acceleration time) is compensated by the higher engine capacity (displacement) and a higher weight (partly due to a stronger insulation against the diesel noise). Greater diesel fuel efficiency is reflected in the lower amount of liters consumed per 100 kilometers.
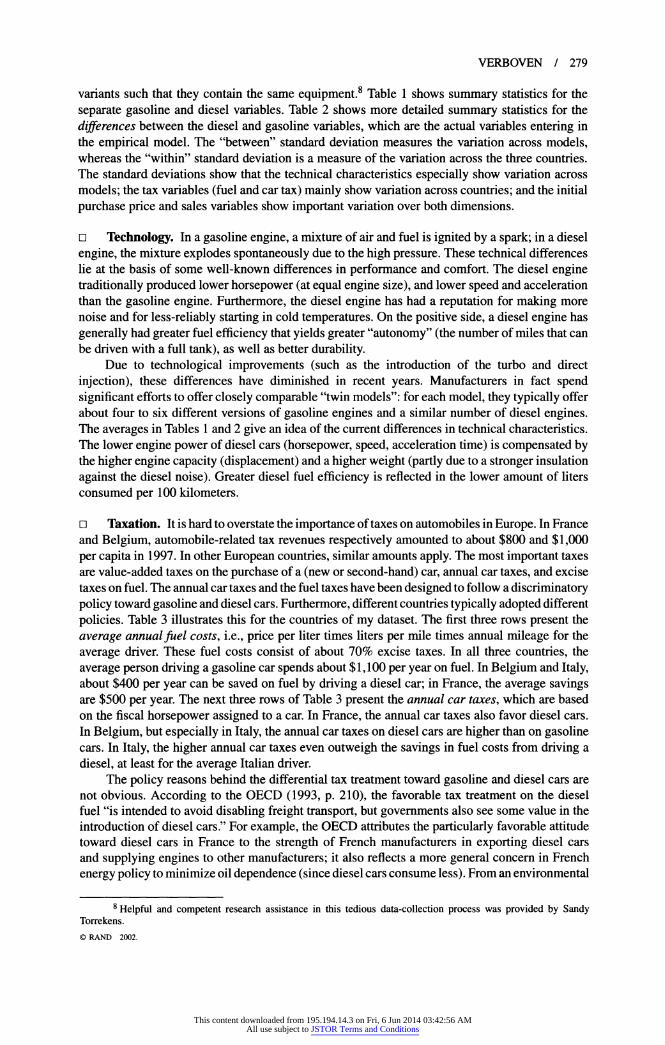
z Taxation. It is hard to overstate the importance of taxes on automobiles in Europe. In France and Belgium, automobile-related tax revenues respectively amounted to about $800 and $1,000 per capita in 1997. In other European countries, similar amounts apply. The most important taxes are value-added taxes on the purchase of a (new or second-hand) car, annual car taxes, and excise taxes on fuel. The annual car taxes and the fuel taxes have been designed to follow a discriminatory policy toward gasoline and diesel cars. Furthermore, different countries typically adopted different policies. Table 3 illustrates this for the countries of my dataset. The first three rows present the average annual fuel costs, i.e., price per liter times liters per mile times annual mileage for the average driver. These fuel costs consist of about 70% excise taxes. In all three countries, the average person driving a gasoline car spends about $1,100 per year on fuel. In Belgium and Italy, about $400 per year can be saved on fuel by driving a diesel car; in France, the average savings are $500 per year. The next three rows of Table 3 present the annual car taxes, which are based on the fiscal horsepower assigned to a car. In France, the annual car taxes also favor diesel cars. In Belgium, but especially in Italy, the annual car taxes on diesel cars are higher than on gasoline cars. In Italy, the higher annual car taxes even outweigh the savings in fuel costs from driving a diesel, at least for the average Italian driver.
The policy reasons behind the differential tax treatment toward gasoline and diesel cars are not obvious. According to the OECD (1993, p. 210), the favorable tax treatment on the diesel fuel "is intended to avoid disabling freight transport, but governments also see some value in the introduction of diesel cars." For example, the OECD attributes the particularly favorable attitude toward diesel cars in France to the strength of French manufacturers in exporting diesel cars and supplying engines to other manufacturers; it also reflects a more general concern in French energy policy to minimize oil dependence (since diesel cars consume less). From an environmental
8 Helpful and competent research assistance in this tedious data-collection process was provided by Sandy Torrekens. ? RAND 2002.
This content downloaded from 195.194.14.3 on Fri, 6 Jun 2014 03:42:56 AMAll use subject to JSTOR Terms and Conditions
280 / THE RAND JOURNAL OF ECONOMICS
TABLE 3 Prices and Taxes by Country (in U.S. dollars)
Gasoline Cars Diesel Cars Difference
Average annual fuel costs, including fuel taxes
Belgium 1,130 739 -391
France 1,188 679 -509
Italy 1,090 670 -420
Average annual car taxes
Belgium 218 284 66
France 126 86 -40
Italy 182 675 493
Average initial purchase price
Belgium 17,455 19,585 2,130
France 18,216 20,950 2,734
Italy 19,072 20,973 1,901
Diesel sales (percent)
Belgium .442
France .537
Italy .152
perspective, the favorable diesel tax treatment does not seem justified. As discussed for example in Michaelis (1995), the diesel engine emits less carbon monoxide than the (unleaded) gasoline engine, roughly the same volatile organic compounds, and more NO,. In addition, it emits airborne particulates unlike the gasoline engine. The net result of these different emissions is that diesel cars are not clearly less damaging from an environmental (e.g., global warming) point of view, whereas they do have some clear disadvantages from the point of view of urban air quality (Crawford and Smith, 1995). From an economic point of view, a favorable diesel tax treatment may be defended by Diamond and Mirrlees' (1971) rule that intermediate goods (i.e., the transportation sector) should not be subject to revenue-raising taxes. However, such reasoning no longer seems valid in current times, since the boundary between diesel and gasoline fuel no longer closely corresponds to the boundary between intermediate goods (truck) and final goods (cars) consumption.9
a Demand. Whatever the motives behind the discriminatory tax practices, a comparison across the three countries suggests that consumers have taken the taxes into account in their car-purchasing decisions. This can be seen from the "dieselization rate," i.e., the percentage of diesel cars in total car sales, as shown in Table 3. In Belgium and especially in France, where diesel cars have a very favorable tax treatment, the dieselization rate is high. In Italy, where the annual fuel cost savings must be balanced against a significantly higher annual diesel car tax, the dieselization rate only reaches 15%.
The consumer's annual mileage is a main driving factor in her gasoline/diesel car-purchasing decision. Most European car magazines carefully guide their customers by periodically publishing detailed tables to compare the cost of gasoline and diesel cars under alternative mileage scenarios. 10
More recently, Internet Web sites allow consumers to compute their costs for gasoline and diesel
9 This was different a decade ago, when most diesel usage originated from truck traffic, as is still the case in the U.S. market. Note also that one could in principle implement the Diamond and Mirrlees rule in an alternative way, by allowing tax deductions for fuel or car usage to business users. This is the case in several countries.
10 For example, for a large set of cars, consumer magazine Test-Achats (1995, no. 373) even computed the critical mileages above which the diesel variant becomes more advantageous than the gasoline variant.
? RAND 2002.
This content downloaded from 195.194.14.3 on Fri, 6 Jun 2014 03:42:56 AMAll use subject to JSTOR Terms and Conditions
VERBOVEN / 281
cars by entering their expected mileage. The importance of the consumer's annual mileage is reflected in the data. In Belgium, for example, the average annual mileage for diesel car users amounts to 25,000 kilometers, compared to an annual mileage of only 14,300 kilometers for gasoline car users.11
a Pricing. To what extent have firms taken the discriminatory tax policies into account in their pricing strategies? The average price data in Table 3 provide a preliminary answer to this question. In all three countries, diesel cars are more expensive than gasoline cars.12 The question is, of course, whether these higher prices are caused by higher (marginal) costs or by higher markups. The empirical model in the next section aims to address this question. At this point, observe that the price premium for diesel cars is much higher in France than in Belgium and Italy. Given that the most favorable tax treatment for diesel cars is in France (and assuming that diesel cars are no more costly to sell in France than elsewhere), this indicates that price differentials between gasoline and diesel cars are at least partly driven by markups.
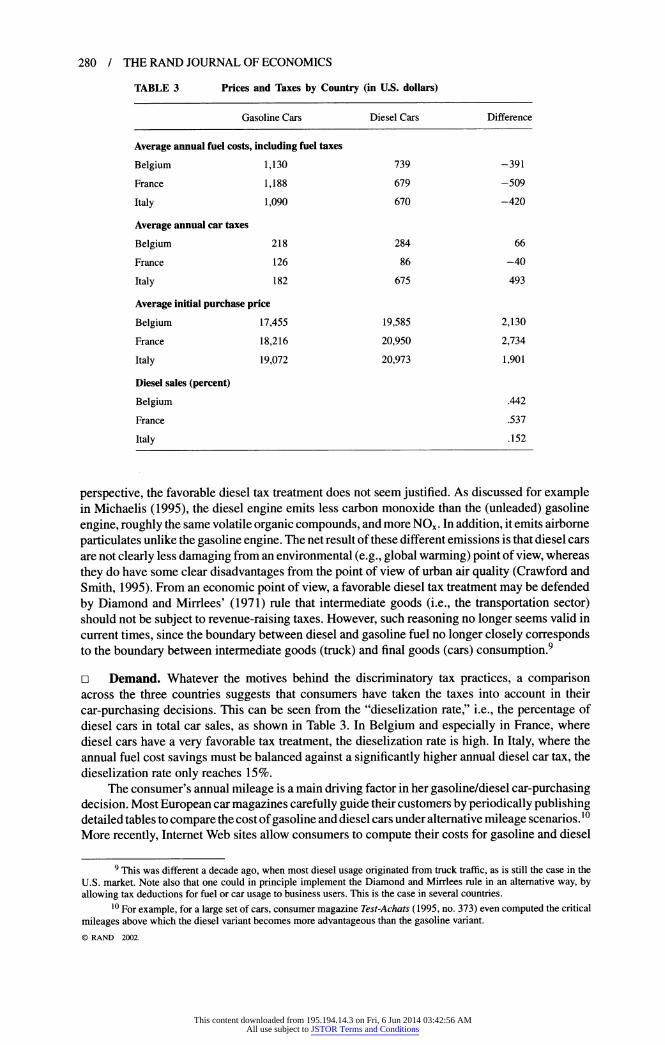
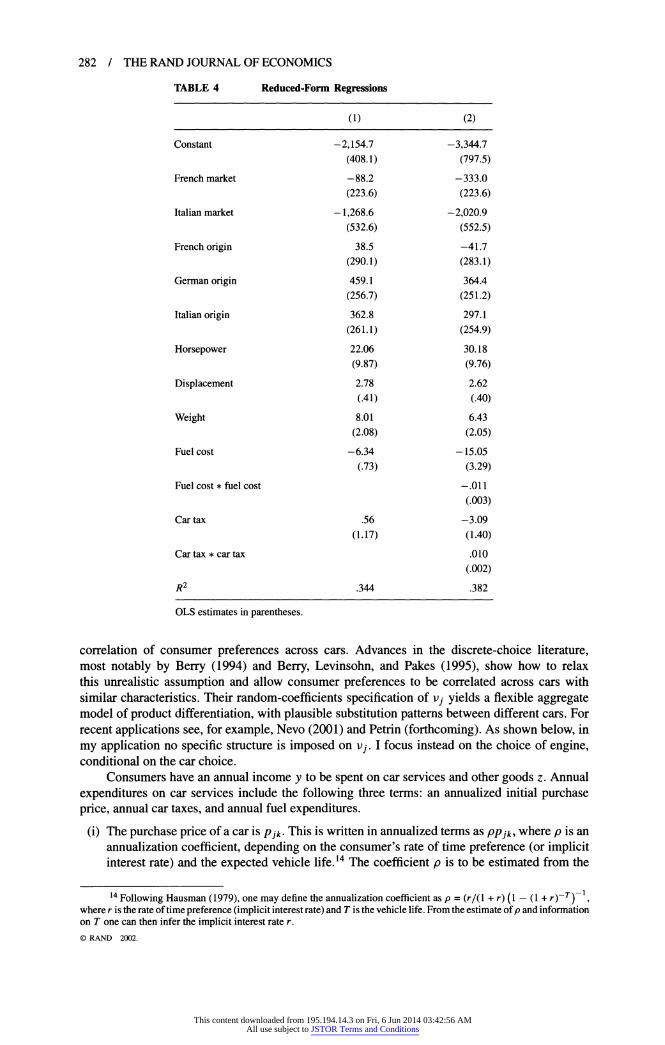
Another way to verify whether the car prices reflect the tax policies is by considering a simple reduced-form regression. Table 4 regresses the car price differential between diesel and gasoline cars on differences in observed technical characteristics and on the differences in average annual fuel cost and car tax differentials.13 In the first specification (column 1), the fuel cost and annual car tax differential enter linearly. The estimates show that a firm raises the price premium for a diesel car by $6.34 in response to an additional annual fuel cost saving of $1 from purchasing a diesel car. Firms do not appear to significantly change their diesel price premium in response to a change in the annual car tax difference. In the second specification (column 2 of Table 4), the square of fuel cost and annual car tax also enter, to allow for a nonlinear relationship. Additional annual fuel cost savings on diesel cars again lead to higher diesel price premia, though the effect is declining; at an average annual fuel cost saving of $456, a firm would raise the diesel price premium by $10.17 in response to an additional annual fuel cost saving by $1. A decrease in the annual car tax difference would lead to an increase in the diesel price premium by $3.09 at a zero tax difference, but only to an insignificant $1.92 increase evaluated at the average car tax difference of $112. Overall, these regressions suggest that firms substantially adjust the diesel price premium in response to fuel cost differentials, but less so in response to car tax differentials.
The above discussion gave some descriptive evidence on how tax policies may influence both consumer demand and manufacturer pricing behavior. I now formalize this in a model to explain price differentials, and I decompose them into marginal cost and markup differences.
3. Consumer demand * The model. Consumers choose to purchase one particular car make, j, coming with one of two engine variants, k, where k = G, D refers to the gasoline or the diesel engine. The utility derived from purchasing one particular make/engine variant takes the following simple form
Ujk = Z +ajk + Vj,
where a k is the mean intrinsic utility from purchasing make j with engine k, common to all consumers; v; is an individual-specific random component around that mean; and z is the consumption of goods other than car services. Both the mean utility term ajk and the individual- specific term v; may depend on observable characteristics such as performance, size, and safety. The term v; is often modelled as an i.i.d. random variable (as in the logit model), implying no
I I See De Borger (1987). A figure reported by Transport Research Laboratory (1995) indicates comparable mileage differences between gasoline and diesel cars for most European countries.
12 This remains true after adjusting for differences in observed quality. This was verified in a hedonic regression from which quality-adjusted price differences may be computed.
13 These regressions resemble standard "hedonic regressions," except that now prices are expressed in differences between diesel and gasoline cars, hence the lower R2. The regressions should only be interpreted as preliminary evidence, since they contain a mixture of both supply-side and demand-side considerations. ? RAND 2002.
This content downloaded from 195.194.14.3 on Fri, 6 Jun 2014 03:42:56 AMAll use subject to JSTOR Terms and Conditions
282 / THE RAND JOURNAL OF ECONOMICS
TABLE 4 Reduced-Form Regressions
(1) (2)
Constant -2,154.7 -3,344.7 (408.1) (797.5)
French market -88.2 -333.0 (223.6) (223.6)
Italian market -1,268.6 -2,020.9 (532.6) (552.5)
French origin 38.5 -41.7 (290.1) (283.1)
German origin 459.1 364.4 (256.7) (251.2)
Italian origin 362.8 297.1 (261.1) (254.9)
Horsepower 22.06 30.18 (9.87) (9.76)
Displacement 2.78 2.62 (.41) (.40)
Weight 8.01 6.43 (2.08) (2.05)
Fuel cost -6.34 -15.05 (.73) (3.29)
Fuel cost * fuel cost -.011 (.003)
Car tax .56 -3.09 (1.17) (1.40)
Car tax * car tax .010 (.002)
R2 .344 .382
OLS estimates in parentheses.
correlation of consumer preferences across cars. Advances in the discrete-choice literature, most notably by Berry (1994) and Berry, Levinsohn, and Pakes (1995), show how to relax this unrealistic assumption and allow consumer preferences to be correlated across cars with similar characteristics. Their random-coefficients specification of v; yields a flexible aggregate model of product differentiation, with plausible substitution patterns between different cars. For recent applications see, for example, Nevo (2001) and Petrin (forthcoming). As shown below, in my application no specific structure is imposed on vi. I focus instead on the choice of engine, conditional on the car choice.
Consumers have an annual income y to be spent on car services and other goods z. Annual expenditures on car services include the following three terms: an annualized initial purchase price, annual car taxes, and annual fuel expenditures.
(i) The purchase price of a car is Pjk. This is written in annualized terms as PPjk, where p is an annualization coefficient, depending on the consumer's rate of time preference (or implicit interest rate) and the expected vehicle life.14 The coefficient p is to be estimated from the
14 Following Hausman (1979), one may define the annualization coefficient as p = (r/(1 + r) (1 - (1 + r)-T) 1 where r is the rate of time preference (implicit interest rate) and T is the vehicle life. From the estimate of p and information on T one can then infer the implicit interest rate r. ? RAND 2002.
This content downloaded from 195.194.14.3 on Fri, 6 Jun 2014 03:42:56 AMAll use subject to JSTOR Terms and Conditions
VERBOVEN / 283
data, and it is expected to lie between zero and one. When consumers have a high implicit interest rate or when the expected vehicle life is low, p is close to one and the purchase price of a car is quickly discounted. Conversely, when consumers have a low implicit interest rate, p is close to zero.
(ii) In addition to the annualized purchase price PPjk, the consumers have to pay an annual car tax of Tjk. This tax may differ across makes and variants, and it is usually based on the "fiscal horsepower" of a car. The fiscal horsepower is computed from characteristics such as horsepower, displacement, and weight according to a formula defined by the government.
(iii) Finally, consumers incur annual fuel expenditures. These depend on the fuel price qk for fuel k (i.e., gasoline or diesel fuel, in dollars per liter), on the fuel efficiency Wjk (in liters per 100 kilometers), and on the annual mileage 0. Annual fuel expenditures per mile are 7rjk = qkWjk- The annual mileage 0 is a random variable that may vary from consumer to consumer. For simplicity, assume that annual mileage is not sensitive to fuel prices (inelastic demand), so that a consumer's total annual fuel expenditure equals 7FjkO.15
In sum, when purchasing a particular make j with engine k, total annual expenditures on car services are given by PPjk + Tjk + Jrjk0. The remaining income y - PPjk - rjk - JFjkO is left for the consumption on other goods z (at a price normalized to one). We can then write a consumer's indirect utility from purchasing a make j with engine k as
Ujk = Y - PPjk - rjk - JjkO + ajk + Vj- (1)
Given this indirect utility function, consumers can choose their most preferred make and engine variant. For our purposes it is sufficient to focus on the consumer's choice of engine variant k conditional on purchasing a particular make j. This choice crucially depends on the consumer's annual mileage 0. A consumer is indifferent between buying make j with a gasoline engine G and with a diesel engine D if UjG = UjD, hence if her annual mileage equals
Aaj - pApj -A-j 0 =0* -=A- 1 (2)
where the Axj denotes the difference between a diesel and a gasoline variable, i.e., Axj XjD - XjG. Consumers driving 0 < 07 prefer the gasoline engine of j; other consumers prefer the diesel engine of j. One can then compute the probability that the gasoline variant is chosen, conditional upon buying j, and equate this to the observed market share of the gasoline variant of j in the total sales of j, SGII, i.e.,
SGIj = Pr(0 < 0| j) = Fj(07), (3)
where Fj(-) is the conditional cumulative distribution function of 0, i.e., conditional on the choice of car j. This distribution may differ across car makes j. For example, it is empirically observed that consumers who decide to purchase larger cars also tend to drive more miles per year. Since the cumulative distribution function Fj(.) is a monotone increasing function, we can invert (3) such that 07 = Fj-I(SGIj). Rearrange this using (2) to obtain
FjI (SG1j)Aj + Az-j + pA pj = Aaj, (4)
where FJ1 (.) is a monotone function defined as the inverse of Fj (-). Equation (4) is the transformed conditional demand equation. Before discussing its empirical specification, several remarks are in order.
15 Previous studies have estimated quite low "short-term" elasticities of gasoline demand, varying from zero to around -.2. See, for example, Goldberg (1998) for a discussion.
( RAND 2002.
This content downloaded from 195.194.14.3 on Fri, 6 Jun 2014 03:42:56 AMAll use subject to JSTOR Terms and Conditions
284 / THE RAND JOURNAL OF ECONOMICS
First, note that the random variable v; does not appear in (4). In this sense my approach is distinct from the work of Berry, Levinsohn, and Pakes (1995) and the subsequent literature. They focus on understanding the pattern of product differentiation between different cars, by explicit- ly modelling v; in a random-coefficients framework. My approach abstracts from the product- differentiation aspects between cars and, instead, focuses on understanding the choice of the engine variant, conditional on the choice of a car make, without specifying the distribution of vj 16
Second, note that annual mileage is the only source of consumer heterogeneity affecting the conditional gasoline/diesel choice. The consumers' annual mileage matters, since this is interacted with the fuel expenditures per mile Jrjk associated with engine variant k of car j. In practice, consumers may also be heterogeneous in their valuation of other engine characteristics, such as horsepower. To account for such heterogeneity, one could specify an unconditional market share equation and obtain identification of the random coefficients as in Berry, Levinsohn, and Pakes (1995). Instead, I chose to start with the conditional market share equation and account for annual mileage as the main source of heterogeneity. To obtain an idea of the plausibility of this specification, I shall compute the predicted average mileages, distinguished by gasoline and diesel consumers, and confront these with the available prior evidence on annual gasoline and diesel mileages. If annual mileage is indeed the most important source of consumer heterogeneity affecting the gasoline/diesel choice, one can expect the predicted mileages for gasoline users to be substantially below the predicted mileages for diesel users, in line with the actually observed mileages. In contrast, if there are important other sources of heterogeneity, one may expect the actual mileages for gasoline and diesel users to be closer to each other than predicted by the demand model.
a Specification. To estimate the demand, I use product-level data on aggregate sales, prices, and characteristics, plus data on the mileage distribution. To complete the demand specification, we need to specify F71 (-) and Aaj in (4). First consider F7l (-), which is the inverse of the cumulative distribution function of mileage for consumers purchasing j. One can therefore interpret F71 (SG I j) as a threshold mileage, i.e., the mileage that is not reached during one year by a given proportion SGIi of consumers purchasing j. In principle, this information can be obtained from consumer survey tables containing, for each make, one column with annual mileage categories and a second column with the proportion of cars corresponding to each mileage category; there is thus no need to make parametric assumptions on the distribution function of 0. In practice, I do not have such detailed information on mileage distribution for the three countries. I therefore specify the cumulative distribution function of 0, and its corresponding inverse, parametrically as a parsimonious function of two parameters, the mean annual mileage ,4j and the standard deviation aj. These parameters are not observed for every make j. Instead, I have information on these parameters for several weight or horsepower categories. Specifically, I match each car j to its appropriate weight category and assign the corresponding mileage information to it. The empirical results are very similar when the horsepower categories are used.
Given my parametric approach for the distribution of mileage, it is important to examine the robustness of the results with respect to alternative functional forms. I considered three alternatives: the double exponential (which resembles the bell shape of the normal distribution), a two-parameter exponential (which is a skewed distribution function), and the uniform. The results are essentially robust with respect to these alternative specifications. I report here only the results using the double exponential distribution. Applying (3), the market share equation SGIj = Fj(0j.) is then given by
SG1j = exp( - exp( - (0* - A) -Y (5)
16 As in Bresnahan (1981, 1987), we have one quality dimension for which consumers are heterogeneous. However, Bresnahan's quality-differentiation model describes product differentiation between different cars. In contrast, my model only describes differentiation between different engine variants, given the car choice. Differentiation between cars is allowed to be more general. ? RAND 2002.
This content downloaded from 195.194.14.3 on Fri, 6 Jun 2014 03:42:56 AMAll use subject to JSTOR Terms and Conditions
VERBOVEN / 285
where r - 3.14 and y - .577 is Euler's constant. It is straightforward to rearrange this equation to obtain a solution for = FJ-I (SGII j). This solution can then be substituted into the transformed demand equation (4).
Now consider Aaj. Recall that Aaj captures the difference in the mean intrinsic utility from purchasing make j with a diesel engine (ajD) or with a gasoline engine (ajG). Note that the variables measuring size and safety are common to the gasoline and diesel variants of a make j, so that they do not enter Aaj. Hence only the performance variables, such as horsepower, displacement, speed, and acceleration, enter Aaj. More precisely, I specify Aaj as follows:
Aaj = ao + a(1 APERFj + Ej, (6)
where APERFj captures differences in observed performance variables, for example differences in horsepower. The constant ao can be interpreted as the mean extra utility from a diesel variant, possibly negative. It captures specific diesel features that are not measured by the performance variables in APERFj, such as discomfort from noise, unreliability, or longer durability. Finally, the term Ej is a mean-zero i.i.d. error term. It captures diesel features specific to make j that influence utility but that are unobserved by the econometrician. For example, it is possible that a Renault 19 has a diesel engine with above-average reliability, whereas a Volkswagen Polo has one with below-average reliability.
To summarize, substituting the expression for Aaj, (6), in equation (4) and rearranging, we obtain the following demand specification that can be taken to the data:
Fj-1(SGIj)A7rj = ao + a, APERF - A -- pApj + Ej, (7)
where F-1 (SGIj) can be computed from inverting the distribution function given by (5). The parameters to be estimated are ao, a,, and p. The required data are sales, prices, technical characteristics, and the mileage distribution across consumers.
4. Pricing * Because of our interest in the implications for price discrimination and tax incidence, I also specify two stylized models of pricing. As in the specification of the demand side, I am not interested in a complete analysis of pricing. Instead, I focus on explaining price differentials between diesel and gasoline cars. Generally speaking, the price differential Apj can be decomposed in a marginal cost difference Acj and a markup difference Amj, i.e.,
Apj = Acj + Amj.
A first model states that there are no markup differences, Amy = 0. The price differential between diesel and gasoline cars is then entirely driven by differences in the marginal cost of producing diesel and gasoline cars. A purely cost-driven explanation for price differentials would obviously obtain under perfect competition. However, price differentials will also be cost-driven under imperfect competition if firms charge the same markup for their gasoline and diesel cars. Several theoretical models of oligopoly pricing in fact yield zero markup differences between high- and low-quality products of the same firm; see, for example, Gilbert and Matutes (1993) and Armstrong and Vickers (2001).17
An alternative model states that the markup differences between diesel and gasoline cars are equal to the premium charged under monopoly market power. Since we are only interested in the markup differences, I only need to model the pricing for the diesel cars relative to the pricing
17 Gilbert and Matutes (1993) show this in an oligopoly with two price-setting firms, each firm selling a high-quality and a low-quality variant of horizontally differentiated products. Armstrong and Vickers (2001) obtain a more general result in the context of nonlinear pricing. See their Proposition 5, and also Proposition 2 in Rochet and Stole (2002) and Proposition 1 in Verboven (1999). ? RAND 2002.
This content downloaded from 195.194.14.3 on Fri, 6 Jun 2014 03:42:56 AMAll use subject to JSTOR Terms and Conditions
286 / THE RAND JOURNAL OF ECONOMICS
for the gasoline cars. Specifically, consider a monopolist for car j, setting the price of its diesel variant PjD to maximize the sum of its gasoline and diesel profits, given that consumers do not substitute to other cars:
(PjG - CjG) SGIj + (PjD - CjD) (1 -SGj)
where SG/j = F1 (0*7) is the conditional market share equation as given by (3). The optimal price PjD satisfies the first-order condition
((PjG - CjG) - (PjD -CjD)) fj(9*) 'S + 1 -Fj (oj;) = o0
where fj(*) is the density function of Fj(.). This can be rewritten as
1-Fj(&*) (-A~zj\8 Ap1 = Ac1 + f(9 ((8)
A monopoly price surcharge for a diesel car would naturally result if the firms have local monopoly power for each make j.18 Yet note that to obtain the above expression for price differentials, it is sufficient to assume that the prices of the diesel variants, PjD, are set monopolistically, relative to the prices for the gasoline variants. This thus allows for the possibility that the price levels of base gasoline variants are set quite competitively.
Analogous to the specification of the mean utility difference between a gasoline and a diesel car, aja, I specify the marginal cost difference Acj as follows:
Acj = yo + y1 APERFj + ij. (9)
The same characteristics that influence the differences in the mean utility may thus also affect differences in marginal costs.
To summarize, using (9) we have two possible pricing specifications, which I refer to below as our "competitive" and "monopolistic" pricing specifications:
Competitive: Apj = Yo + Yi APERFj + ilj
Monopolistic: Apj = yo + y, APERFj + I
(Oj;) (-A rj) + ilj. (10)
One should keep in mind that these terms only serve to label the pattern of observed price differentials between gasoline and diesel variants. They do not necessarily refer to the manufacturers' actual pricing behavior for all prices in the market.
5. Identification and estimation * In the empirical analysis, I begin by estimating the demand equation (7) separately, without imposing any structure on pricing behavior. Next, I estimate the demand equation (7) jointly with the pricing equation (10). Whether or not one estimates the equations simultaneously, it is important to account for the fact that SG1j and Apj are endogenous variables, simultaneously determined by consumer demand and manufacturer pricing. Consequently, one may expect these variables to be correlated to the error terms ej and qj , which capture the unobserved diesel features of model j, influencing utility and marginal cost. For example, a diesel variant of a car j with a
18 Specify, for example, for each make j the individual-specific taste parameter vj equal to zero for a fraction so; of consumers and equal to -oo for the remaining fraction. For each car make j there is then local monopoly power over a fraction fj consumers. ? RAND 2002.
This content downloaded from 195.194.14.3 on Fri, 6 Jun 2014 03:42:56 AMAll use subject to JSTOR Terms and Conditions
VERBOVEN / 287
particularly high unobserved diesel quality ej will have a high market share, but at the same time the manufacturers will presumably charge a high price. The result is a positive correlation between Apj and ej. A simple ordinary-least-squares estimator would therefore be inconsistent; in particular, p would be biased toward zero. Consequently, instrumental variables should be used to obtain consistent parameter estimates. More specifically, I adopt Hansen's (1982) generalized method of moments (GMM). This estimator can be used for estimating a single equation or a simultaneous system with possibly correlated error terms e, and 17j. The estimator allows one to compute heteroskedasticity-consistent standard errors that are robust with respect to serial correlation.
It remains to specify the set of instruments, which constitute the orthogonality conditions of the GMM estimator. The instruments should be exogenous variables, uncorrelated to the error term. My main identification assumption is that the nonprice characteristics of the cars, such as performance, fuel efficiency, or taxes, qualify as such variables. This is a common assumption made in the empirical literature on oligopoly models with product differentiation. The usual justification for this assumption is that these are variables that can be adjusted only slowly, so that they may be viewed as predetermined at the pricing stage. The typical difficulty in adopting this approach is that these variables may enter both the demand and supply (cost) side, so that there may not be a sufficient number of instruments for the number of parameters to be estimated. Berry (1994) and Berry, Levinsohn, and Pakes (1995) discuss this problem and propose to use (functions of) the characteristics of the competitors as additional instruments. In my application, the parameter restrictions that are implicit in specification (7) provide another answer to the suitable choice of instruments. In particular, A7rj and Atj have no parameters to be estimated, so these variables can be used as instruments for Apj. Economically, this identification follows from the fact that fuel costs and taxes are monetary variables that influence the consumers' budget constraint and indirect utility in the same manner as prices. Put differently, consumers care only about the total dollar amount they have to spend on car services, and not about whether this amount is spent on the car itself or on related taxes.19 In sum, in using APERFj, A rj, and Atj, we have one more instrument than the number of parameters to be estimated.
6. The empirical results * As described in more detail in Section 2, my dataset contains sales, list prices, and technical characteristics of 41 pairs of automobile models in three European countries-Belgium, France, and Italy-for the period 1991-1994, plus data on the distribution of mileage across consumers. In the discussion below the subscript j should now be viewed as indexing the car make, country, and year (instead of only the car make). To estimate (7) and (10), I need to specify the technical characteristics entering in APERFj. I have data on the following performance variables: horsepower, displacement, weight, speed, and acceleration. I experimented with several alternative specifications. The empirical results presented in Tables 5, 6, and 7 are based on a specification including horsepower, displacement, and weight. The parameter estimates, and the implications for the decomposition of price differentials into cost and markup differences as well as for tax incidence, were robust when other characteristics were included. For example, I considered a specification with the horsepower/weight ratio and displacement as characteristics. I also considered a specification in which speed and acceleration enter instead of horsepower and displacement, and a specification in which horsepower, displacement, weight, speed, and acceleration all enter together.
I impose some further structure on the error terms e, and rj through fixed effects. I include market dummies for France and Italy to capture possible differences in tastes and costs, relative to the reference country Belgium. One cannot a priori rule out the possibility that French and Italian consumers have different tastes for gasoline versus diesel cars than Belgian consumers. Significant cost differences across markets, in contrast, seem rather unlikely: there is no reason to
19 In most other automobile articles, the fuel cost variable also enters in the specification. But it cannot be used as an instrument for price, since there it enters more flexibly without a budget-constraint restriction. (C RAND 2002.
This content downloaded from 195.194.14.3 on Fri, 6 Jun 2014 03:42:56 AMAll use subject to JSTOR Terms and Conditions
288 / THE RAND JOURNAL OF ECONOMICS
expect a systematically higher cost of selling a diesel car in the French market than in the Belgian or Italian markets. Insignificant estimates for the market dummies on the cost side may thus be expected if the econometric model is well specified. I also include source country dummies for French, German, or Italian cars to capture taste and cost differences across source countries. The reference is "other countries," i.e., Japan, Spain, or the United Kingdom.
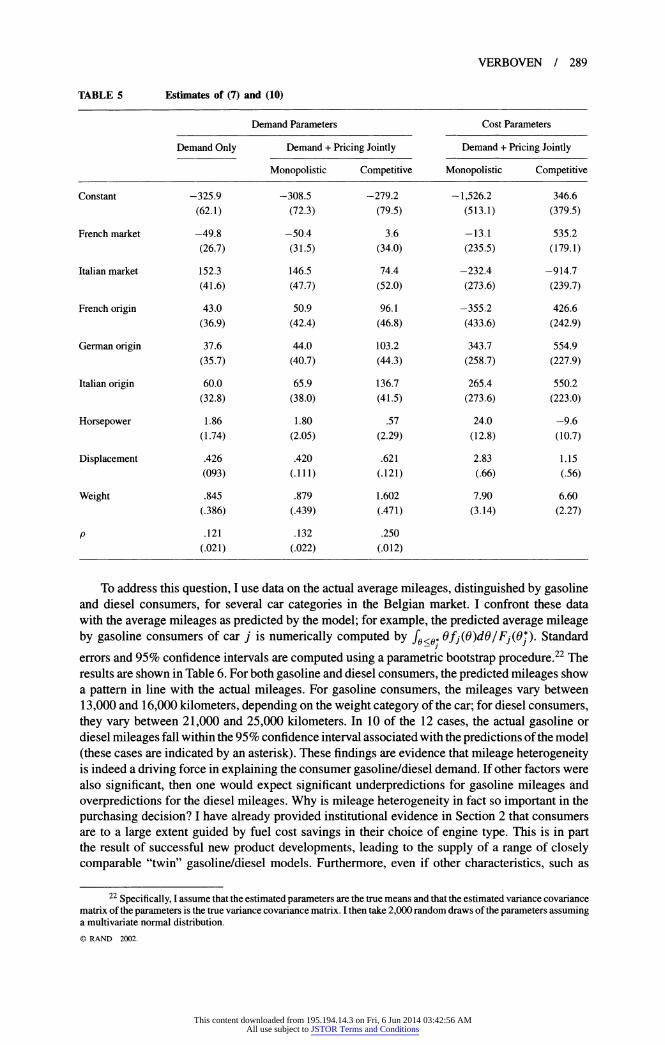
a Demand. Let us start by estimating the demand equation separately. Column 1 of Table 5 shows the results. The parameters of the technical characteristics (a,), which refer to the mean valuations, have the expected positive sign. For displacement and weight they are significant. Since diesel cars on average have a lower horsepower but a higher weight and displacement than gasoline cars, it is interesting to look at the overall mean valuation differences implied by the estimates (Aa1). It turns out that Aay is small on average, namely -$291 (written in capitalized terms), compared to an average purchase price differential of $2, 323 (Table 2). This confirms the discussion in Section 2: firms are relatively successful in offering "twin" gasoline and diesel cars, which are comparable in overall performance even if the individual characteristics differ because of technological constraints.
The price coefficient (p) is estimated very precisely at .121. Recall that p may be interpreted as an annualization coefficient, reflecting the extent to which consumers take into account the purchase price of the car in their annual budget constraint. Assuming a vehicle life of 11 years, the consumers' implicit interest rate implied by the estimate of p is about 11.5%. This is slightly above (though not significantly different from) the actual interest rates on the capital markets during the period 1991-1994. For example, the five-year government bond interest rate varied between 7.5% and 10%, whereas the interest rates on installment loans specifically for purchasing cars varied between 9% and 11.7% in Belgium.20 Consumers thus tend to solve their investment problem in a rather forward-looking way: they use interest rates close to the capital market rates when trading off the higher initial purchase price for a diesel car against the future fuel cost savings. This is consistent with economic theory, but it conflicts with some anomalies in the literature. For example, Hausman (1979) finds econometric evidence that consumers use too-high interest rates when choosing among air conditioners. Loewenstein and Thaler (1989) report experimental evidence on myopic consumer behavior. An explanation for the result that consumers use the "right" implicit interest rate is that there are good financing possibilities for cars, and that the gasoline/diesel choice is a fairly clean investment problem, since every car typically offers both engine versions.21
The demand intercept is estimated to be -325.9 and significant: this says that Belgian consumers (the reference market) value diesel cars over $300 less than a gasoline car, after controlling for the observed differences in characteristics; this may be due to, for example, discomfort from noise or lower reliability. This negative diesel valuation is somewhat stronger in France (-$50); in Italy, consumers seem to care less about diesel comfort per se (significant fixed effect of about +$150). The dummy variables for the source countries are all insignificant, implying that the French, German, and Italian diesel brands do not have a significantly higher valuation than the brands from other origins.
What does the demand specification predict about the annual mileage driven by consumers of gasoline and diesel cars? An answer to this question can provide an idea of how well the demand model is specified. As discussed above, if the sole source of heterogeneity regarding the gasoline/diesel decision is the consumers' annual mileage, then one would expect the average annual mileage of gasoline consumers to be considerably lower than the average annual mileage of diesel consumers. In contrast, if there are other important sources of consumer heterogeneity, uncorrelated with mileage, then one would expect the average annual mileage of gasoline and diesel consumers to be closer to each other than predicted by the demand specification.
20This rate concerns a value of an installment loan of BEF 400,000, or about $10,000, with fixed monthly installments during 48 months (information provided by the consumer magazine Test-Achats).
21 Note that p was estimated considerably smaller under ordinary least squares, i.e., .021 (with a standard error of .005). This confirms the typical downward bias of the price coefficient if no instruments are used. ? RAND 2002.
This content downloaded from 195.194.14.3 on Fri, 6 Jun 2014 03:42:56 AMAll use subject to JSTOR Terms and Conditions
VERBOVEN / 289
TABLE 5 Estimates of (7) and (10)
Demand Parameters Cost Parameters
Demand Only Demand + Pricing Jointly Demand + Pricing Jointly
Monopolistic Competitive Monopolistic Competitive
Constant -325.9 -308.5 -279.2 -1,526.2 346.6 (62.1) (72.3) (79.5) (513.1) (379.5)
French market -49.8 -50.4 3.6 -13.1 535.2 (26.7) (31.5) (34.0) (235.5) (179.1)
Italian market 152.3 146.5 74.4 -232.4 -914.7 (41.6) (47.7) (52.0) (273.6) (239.7)
French origin 43.0 50.9 96.1 -355.2 426.6 (36.9) (42.4) (46.8) (433.6) (242.9)
German origin 37.6 44.0 103.2 343.7 554.9 (35.7) (40.7) (44.3) (258.7) (227.9)
Italian origin 60.0 65.9 136.7 265.4 550.2 (32.8) (38.0) (41.5) (273.6) (223.0)
Horsepower 1.86 1.80 .57 24.0 -9.6 (1.74) (2.05) (2.29) (12.8) (10.7)
Displacement .426 .420 .621 2.83 1.15 (093) (.111) (.121) (.66) (.56)
Weight .845 .879 1.602 7.90 6.60 (.386) (.439) (.471) (3.14) (2.27)
p .121 .132 .250 (.021) (.022) (.012)
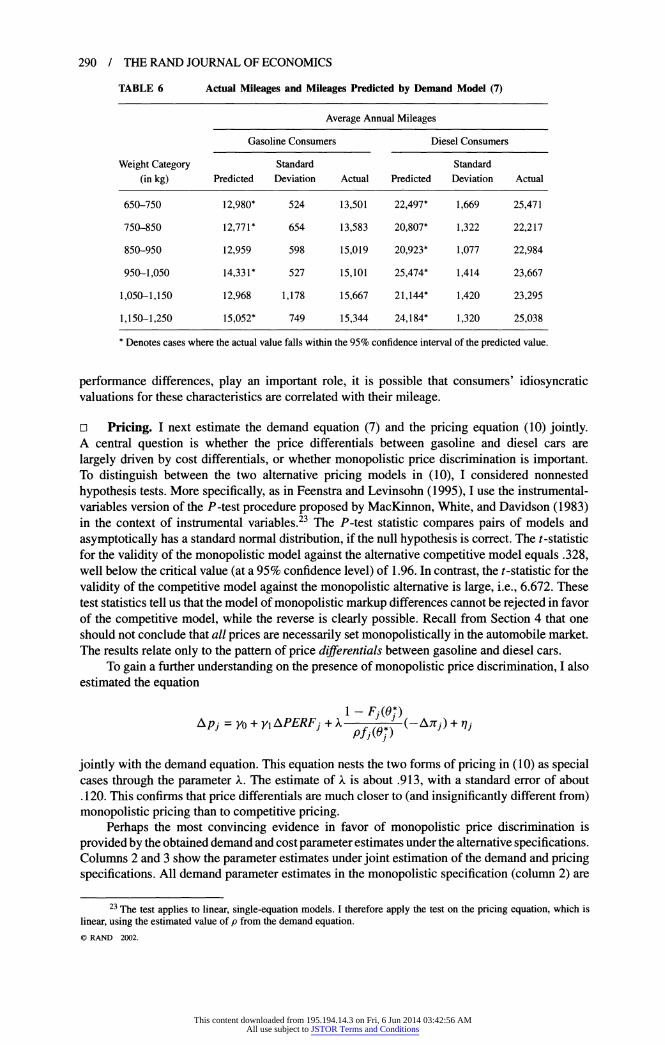
To address this question, I use data on the actual average mileages, distinguished by gasoline and diesel consumers, for several car categories in the Belgian market. I confront these data with the average mileages as predicted by the model; for example, the predicted average mileage by gasoline consumers of car j is numerically computed by f9<6. Ofj(0)d0/Fj(0O). Standard
errors and 95% confidence intervals are computed using a parametric bootstrap procedure.22 The results are shown in Table 6. For both gasoline and diesel consumers, the predicted mileages show a pattern in line with the actual mileages. For gasoline consumers, the mileages vary between 13,000 and 16,000 kilometers, depending on the weight category of the car; for diesel consumers, they vary between 21,000 and 25,000 kilometers. In 10 of the 12 cases, the actual gasoline or diesel mileages fall within the 95% confidence interval associated with the predictions of the model (these cases are indicated by an asterisk). These findings are evidence that mileage heterogeneity is indeed a driving force in explaining the consumer gasoline/diesel demand. If other factors were also significant, then one would expect significant underpredictions for gasoline mileages and overpredictions for the diesel mileages. Why is mileage heterogeneity in fact so important in the purchasing decision? I have already provided institutional evidence in Section 2 that consumers are to a large extent guided by fuel cost savings in their choice of engine type. This is in part the result of successful new product developments, leading to the supply of a range of closely comparable "twin" gasoline/diesel models. Furthermore, even if other characteristics, such as
22 Specifically, I assume that the estimated parameters are the true means and that the estimated variance covariance matrix of the parameters is the true variance covariance matrix. I then take 2,000 random draws of the parameters assuming a multivariate normal distribution. C) RAND 2002.
This content downloaded from 195.194.14.3 on Fri, 6 Jun 2014 03:42:56 AMAll use subject to JSTOR Terms and Conditions
290 / THE RAND JOURNAL OF ECONOMICS
TABLE 6 Actual Mileages and Mileages Predicted by Demand Model (7)
Average Annual Mileages
Gasoline Consumers Diesel Consumers
Weight Category Standard Standard (in kg) Predicted Deviation Actual Predicted Deviation Actual
650-750 12,980* 524 13,501 22,497* 1,669 25,471
750-850 12,771* 654 13,583 20,807* 1,322 22,217
850-950 12,959 598 15,019 20,923* 1,077 22,984
950-1,050 14,331* 527 15,101 25,474* 1,414 23,667
1,050-1,150 12,968 1,178 15,667 21,144* 1,420 23,295
1,150-1,250 15,052* 749 15,344 24,184* 1,320 25,038
* Denotes cases where the actual value falls within the 95% confidence interval of the predicted value.
performance differences, play an important role, it is possible that consumers' idiosyncratic valuations for these characteristics are correlated with their mileage.
a Pricing. I next estimate the demand equation (7) and the pricing equation (10) jointly. A central question is whether the price differentials between gasoline and diesel cars are largely driven by cost differentials, or whether monopolistic price discrimination is important. To distinguish between the two alternative pricing models in (10), I considered nonnested hypothesis tests. More specifically, as in Feenstra and Levinsohn (1995), I use the instrumental- variables version of the P-test procedure proposed by MacKinnon, White, and Davidson (1983) in the context of instrumental variables.23 The P-test statistic compares pairs of models and asymptotically has a standard normal distribution, if the null hypothesis is correct. The t-statistic for the validity of the monopolistic model against the alternative competitive model equals .328, well below the critical value (at a 95% confidence level) of 1.96. In contrast, the t-statistic for the validity of the competitive model against the monopolistic alternative is large, i.e., 6.672. These test statistics tell us that the model of monopolistic markup differences cannot be rejected in favor of the competitive model, while the reverse is clearly possible. Recall from Section 4 that one should not conclude that all prices are necessarily set monopolistically in the automobile market. The results relate only to the pattern of price differentials between gasoline and diesel cars.
To gain a further understanding on the presence of monopolistic price discrimination, I also estimated the equation
Apj = yo + y1 APERFj + X i () AX ) + pf1i (0J)
jointly with the demand equation. This equation nests the two forms of pricing in (10) as special cases through the parameter X. The estimate of X is about .913, with a standard error of about .120. This confirms that price differentials are much closer to (and insignificantly different from) monopolistic pricing than to competitive pricing.
Perhaps the most convincing evidence in favor of monopolistic price discrimination is provided by the obtained demand and cost parameter estimates under the alternative specifications. Columns 2 and 3 show the parameter estimates under joint estimation of the demand and pricing specifications. All demand parameter estimates in the monopolistic specification (column 2) are
23 The test applies to linear, single-equation models. I therefore apply the test on the pricing equation, which is linear, using the estimated value of p from the demand equation. ? RAND 2002.
This content downloaded from 195.194.14.3 on Fri, 6 Jun 2014 03:42:56 AMAll use subject to JSTOR Terms and Conditions
VERBOVEN / 291
comparable to the ones obtained from estimating the demand equation separately (column 1). This indicates that adding the monopolistic pricing specification does not seriously affect the demand-side parameters. In contrast, several demand parameters change substantially under the competitive specification. This is true, for example, for the coefficient on weight and several market and source fixed effects. The most drastic change is the estimate of the annualization coefficient p, which doubles in size and has a very small standard error.
The cost-side parameters are consistent with a priori expections in the monopolistic specification, but not always in the competitive specification. The technical characteristics positively and significantly affect marginal costs under the monopolistic specification; in the competitive specification, the sign of the horsepower parameter is negative (though insignificant). The market fixed effects show the most interesting differences. In the monopolistic specification, the fixed effects for the French and Italian markets (relative to Belgium) are insignificant, which implies that there are no significant cost differences across markets. In contrast, in the competitive specification, the market fixed effects do enter significantly, with a significantly positive and large fixed effect for France and a significantly negative fixed effect for Italy. This follows from the fact that the competitive specification imposes zero markup differences between gasoline and diesel cars; any systematic cross-country differences in the price surcharge for diesel cars must then be attributed exclusively to cost differences. In the monopolistic specification, cross-country differences in the diesel surcharge may also be the result of markup differences. If one accepts the presumption that marginal cost differences between gasoline and diesel cars should not differ significantly across markets, these findings may be viewed as further economic evidence in favor of monopolistic price differences.
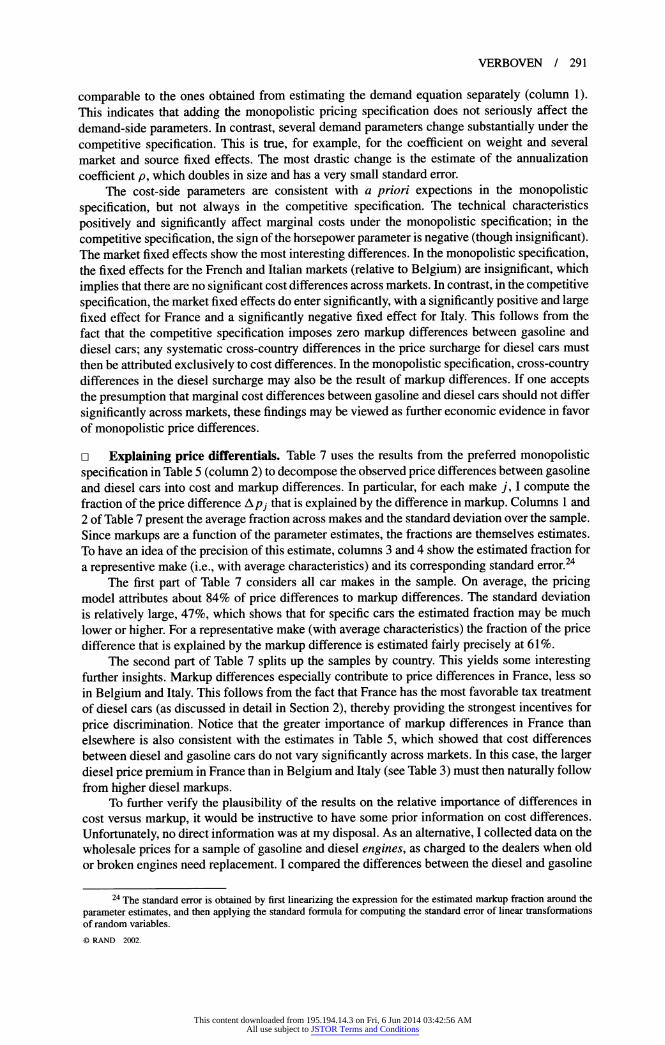
a Explaining price differentials. Table 7 uses the results from the preferred monopolistic specification in Table 5 (column 2) to decompose the observed price differences between gasoline and diesel cars into cost and markup differences. In particular, for each make j, I compute the fraction of the price difference A pj that is explained by the difference in markup. Columns 1 and 2 of Table 7 present the average fraction across makes and the standard deviation over the sample. Since markups are a function of the parameter estimates, the fractions are themselves estimates. To have an idea of the precision of this estimate, columns 3 and 4 show the estimated fraction for a representive make (i.e., with average characteristics) and its corresponding standard error.24
The first part of Table 7 considers all car makes in the sample. On average, the pricing model attributes about 84% of price differences to markup differences. The standard deviation is relatively large, 47%, which shows that for specific cars the estimated fraction may be much lower or higher. For a representative make (with average characteristics) the fraction of the price difference that is explained by the markup difference is estimated fairly precisely at 61%.
The second part of Table 7 splits up the samples by country. This yields some interesting further insights. Markup differences especially contribute to price differences in France, less so in Belgium and Italy. This follows from the fact that France has the most favorable tax treatment of diesel cars (as discussed in detail in Section 2), thereby providing the strongest incentives for price discrimination. Notice that the greater importance of markup differences in France than elsewhere is also consistent with the estimates in Table 5, which showed that cost differences between diesel and gasoline cars do not vary significantly across markets. In this case, the larger diesel price premium in France than in Belgium and Italy (see Table 3) must then naturally follow from higher diesel markups.
To further verify the plausibility of the results on the relative importance of differences in cost versus markup, it would be instructive to have some prior information on cost differences. Unfortunately, no direct information was at my disposal. As an alternative, I collected data on the wholesale prices for a sample of gasoline and diesel engines, as charged to the dealers when old or broken engines need replacement. I compared the differences between the diesel and gasoline
24 The standard error is obtained by first linearizing the expression for the estimated markup fraction around the parameter estimates, and then applying the standard formula for computing the standard error of linear transformations of random variables. ? RAND 2002.
This content downloaded from 195.194.14.3 on Fri, 6 Jun 2014 03:42:56 AMAll use subject to JSTOR Terms and Conditions
292 / THE RAND JOURNAL OF ECONOMICS
TABLE 7 Fraction of Price Differences Explained by Markups
Representative Model
Mean Standard Deviation Estimate Standard Error
All countries .840 .474 .612 .112
Belgium .807 .487 .564 .124
France .894 .372 .873 .132
Italy .784 .627 .512 .112
engine prices with the respective car price differences.25 Engine price differentials may be a reasonable proxy for differences in the cost of producing gasoline and diesel cars, provided that the manufacturers do not also use the wholesale prices to price discriminate. Interestingly, I find that the average engine price differential over the sample of car makes is $586, compared to a much larger average car price differential of $1,567, even though the cars differ in nothing other than the engine.26 This confirms the empirical results that price differentials are to a large extent driven by markup differentials.
a Implications for tax incidence. Further insights in how consumers and manufacturers behave in response to taxes is obtained from computing various elasticities of demand with respect to tax changes. I consider the effects of both changes in fuel taxes and changes in annual car taxes on the market share of gasoline cars in the total sales of a make j. I concentrate on conditional effects, i.e., conditional on the consumers' choice of a given car make. A more complete analysis of tax effects would also look at substitution toward different car makes or to other modes of transportation. Such an analysis would be very interesting from a policy perspective, yet it is beyond the scope of this article. It would require a more detailed analysis of the market, with specific assumptions on product differentiation between cars (on vj, for example, specified as in Berry, Levinsohn, and Pakes (1995)) and on competition between firms.
There are several ways to present the tax elasticities. For example, one may look at the separate demand effects of increasing the annual car tax for gasoline and for diesel cars. To summarize the information, I decided to "average" these effects: I focus on the effects of increasing the fuel and car tax differentials. More specifically, I compute the effect on the market share of gasoline cars in the total sales of make j when the gasoline fuel tax is increased by .5% and the diesel car tax is reduced by .5%, and similarly for the gasoline and diesel car taxes. The computed elasticities per make j are
F I_ dSGj _ 1 dSGIj qD i 2 dqG sGjj 2 dqD SGjj
SC _I1 dSGIj TjG 1 dSGjj TjD i- 2 drjG SG1 2 dujD SGlj
The term ? F reads as the elasticity of the demand for car j's gasoline-powered variant with respect to the fuel tax differential; sC is the elasticity of the demand for car j's gasoline-powered variant with respect to the car tax differential.
25 The engine price data were collected directly from Belgian dealers in 2001, for the models in my original dataset, or for their successors in case the models were no longer sold. For a consistent comparison, I also collected the corresponding car price data for this sample of models.
26 The 2001 car price and characteristics data are of a comparable order of magnitude as the Belgian car price data during 1991-1994. For example, compare the 2001 average gasoline car price of $18,581 and the average diesel car price of $20,148 with the numbers for Belgium in Table 2. ? RAND 2002.
This content downloaded from 195.194.14.3 on Fri, 6 Jun 2014 03:42:56 AMAll use subject to JSTOR Terms and Conditions
VERBOVEN / 293
I compute both partial and full tax elasticities. The partial tax elasticities are those one traditionally obtains from estimating demand equations, i.e., they account for the effects of taxes on demand, holding all other things constant. The full tax elasticities also take into account the additional demand effect stemming from the fact that firms may adjust their prices in response to a tax change, i.e., tax incidence. My previous estimates favored a specification in which firms adjust their prices in response to taxes according to the monopolistic pricing condition (8), so I will use this to compute the full elasticities.27 Yet I caution that this pricing condition is a stylized specification; in practice, firms may take into account substitution toward competing products when adjusting prices. To the extent that this is the case, the partial elasticities may become more relevant.
Two further caveats are in order. First, since the empirical model assumed inelastic mileage demand, the estimated elasticities do not take into account changes in driving habits. Nevertheless, the empirical literature referred to in the Introduction has obtained small elasticity estimates for mileage demand (conditional upon the car purchase), ranging between zero and .2. My results would thus essentially remain robust. Second, the model assumes that the product characteristics remain unchanged. In the long run, firms may invest in modifying their products in response to fuel price changes. Pakes, Berry, and Levinsohn (1993) show that companies started to introduce new cars in the United States after the increases in fuel prices of the 1970s; the development of reliable diesel cars in Europe during the 1970s and 1980s has a similar interpretation. Yet note that the European countries currently set the fuel and car taxes in an uncoordinated way (unlike value-added taxes); a national tax reform may thus have only a modest impact on product characteristics. Even if product characteristics were to be modified in the long run, this would alter the level of the elasticities, but my main conclusion that one should account for the mitigating effects of tax incidence (price responses) would remain.
Table 8 presents the estimates. I focus the presentation on the estimated elasticity of a representative car (with average characteristics). The standard error is computed numerically using the same procedure described in the previous subsection. First, consider the estimated partial elasticities, ignoring tax incidence. One can see that increasing the fuel tax differential has a much larger effect on demand than increasing the car tax differential (elasticity of -2.78 compared to -.597). This is because the annual car taxes are much lower in absolute value than the annual fuel costs (expenditure share of less than 25%), so a percentage increase in car taxes has a smaller effect on the consumer's budget constraint than a percentage increase in fuel costs. The high fuel tax elasticity is consistent with the high long-term fuel price elasticities obtained in the transportation and energy literature, as discussed in the Introduction. Notice that Italy has much lower fuel and car tax elasticities for its representative car, as compared to the other two countries. This follows from the high market share of the representative gasoline car in Italy, caused by the unfavorable diesel tax treatment.
Now consider the estimated full elasticities, which account for monopolistic tax incidence. Both the car tax and the fuel tax elasticity are now lower, because the manufacturers partly absorb an increase in the tax differential by lowering their price differential. Note that the fuel tax elasticities drop by more than the car tax elasticities. This illustrates that tax incidence is based mainly on the fuel taxes and less so on the car taxes, which is also consistent with the reduced-form findings in Table 4.
The estimates of the elasticities have implications for tax policy. I illustrate this using two examples.
z Effectiveness of tax policy. In designing a public policy toward cars, the United States and Europe have followed quite different approaches. The United States has put the most emphasis on direct regulation of the car-purchasing decision. This has been implemented, for example, through fuel efficiency standards (the CAFE standard), through purchasing mandates for fleet owners, and
27 For example, the full effect of the annual gasoline car tax is dSGlJ/driG = asGli/aTiG + (asGci/aApi) X
(dAp/d Ar1)(- 1), where dA p/dAr1 is found from implicitly differentiating (8). Similar formulas hold for the other full tax effects. C) RAND 2002.
This content downloaded from 195.194.14.3 on Fri, 6 Jun 2014 03:42:56 AMAll use subject to JSTOR Terms and Conditions

294 / THE RAND JOURNAL OF ECONOMICS
TABLE 8 Elasticities of Demand with Respect to Taxes
Fuel Taxes Car Taxes
Estimatea Standard Error Estimatea Standard Error
Ignoring tax incidence
All countries -2.783 (.260) -.597 (.086)
Belgium -3.103 (.305) -.736 (.111)
France -3.964 (.287) -.569 (.084)
Italy -.404 (.049) -.091 (.014)
Accounting for tax incidence
All countries -1.218 (.016) -.465 (.048)
Belgium -1.412 (.004) -.583 (.064)
France -.225 (.029) -.280 (.084)
Italy -.323 (.036) -.090 (.013)
a The elasticity estimates are for a representative model.
through mandated changes in auto and fuel availability. In Europe, car and fuel taxes have more commonly been used as instruments to direct demand toward a specific type of car. The differential gasoline and diesel tax policy is not the only example of this approach. Another example is the substantial tax discrimination between leaded and unleaded gasoline cars to promote the purchase of unleaded cars. In the near future, the introduction of electric cars may again raise the tax question. At first sight, my high estimates of the partial elasticities indicate that a tax policy can be a quite effective policy instrument. This is also suggested by the high long-term fuel price elasticities in the transportation/energy literature, as well as Borenstein's (1993) finding for U.S. data on leaded and unleaded gasoline cars. However, my results on the full elasticities demonstrate that it is important to take into account the manufacturers' pricing responses when evaluating the effect of a change in taxes on demand. While the pricing responses may not in practice be as pronounced as implied by my monopolistic specification, the results suggest that the effectiveness of a tax policy may be reduced when tax incidence is taken into account.
a Revenue implications of reducing tax discrimination. A central theme in the European policy debate is whether the current system of tax discrimination should be maintained. From an environmental point of view, there are several opponents of tax discrimination because of the adverse effects of diesel fuel (see Section 2). From a distributional point of view, specific consumer interest groups have (unsuccessfully) taken action to reduce the discrimination in car taxes, based on constitutional arguments. Whatever the policy objectives behind the recent political pressure to reduce tax discrimination, one may ask what the budgetary implications would be for the governments. If there were only one good to be taxed, this question could easily be addressed by looking at the tax elasticities: after a tax increase, revenues would increase if and only if the elasticity (in absolute value) were less than one. In my application, there are two goods, gasoline and diesel cars. In this case, one should also account for substitution effects. For example, an increase in the diesel car tax induces substitution toward gasoline cars, which has a positive effect on tax revenues, especially if the substituting consumers pay high gasoline taxes. A tax increase may thus increase revenues even if the elasticity is greater than one.
Table 9 presents the revenue effects of various tax experiments for a representative car make, expressed in elasticity form. For example, to evaluate the revenue effects of the gasoline car tax, I compute (dR1/ drjG)/(rjG/(Rj), where R1 is the total tax revenue (annual car tax plus fuel tax) ? RAND 2002.
This content downloaded from 195.194.14.3 on Fri, 6 Jun 2014 03:42:56 AMAll use subject to JSTOR Terms and Conditions
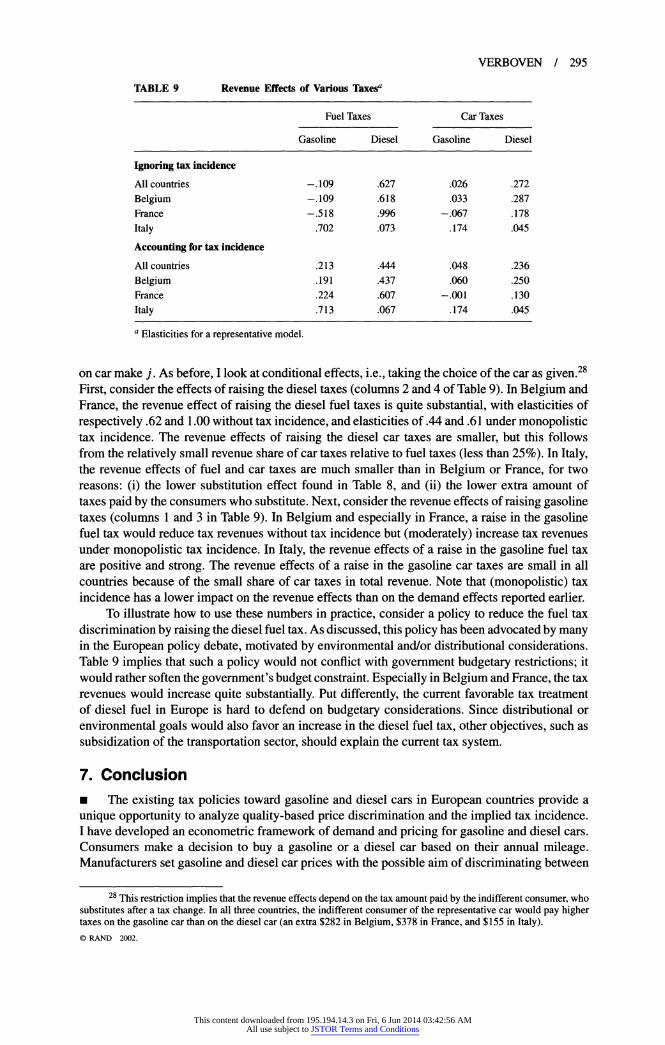
VERBOVEN / 295
TABLE 9 Revenue Effects of Various Taxesa
Fuel Taxes Car Taxes
Gasoline Diesel Gasoline Diesel
Ignoring tax incidence
All countries -.109 .627 .026 .272 Belgium -.109 .618 .033 .287 France -.518 .996 -.067 .178 Italy .702 .073 .174 .045
Accounting for tax incidence
All countries .213 .444 .048 .236 Belgium .191 .437 .060 .250 France .224 .607 -.001 .130 Italy .713 .067 .174 .045
a Elasticities for a representative model.
on car make j. As before, I look at conditional effects, i.e., taking the choice of the car as given.28 First, consider the effects of raising the diesel taxes (columns 2 and 4 of Table 9). In Belgium and France, the revenue effect of raising the diesel fuel taxes is quite substantial, with elasticities of respectively .62 and 1.00 without tax incidence, and elasticities of .44 and .61 under monopolistic tax incidence. The revenue effects of raising the diesel car taxes are smaller, but this follows from the relatively small revenue share of car taxes relative to fuel taxes (less than 25%). In Italy, the revenue effects of fuel and car taxes are much smaller than in Belgium or France, for two reasons: (i) the lower substitution effect found in Table 8, and (ii) the lower extra amount of taxes paid by the consumers who substitute. Next, consider the revenue effects of raising gasoline taxes (columns 1 and 3 in Table 9). In Belgium and especially in France, a raise in the gasoline fuel tax would reduce tax revenues without tax incidence but (moderately) increase tax revenues under monopolistic tax incidence. In Italy, the revenue effects of a raise in the gasoline fuel tax are positive and strong. The revenue effects of a raise in the gasoline car taxes are small in all countries because of the small share of car taxes in total revenue. Note that (monopolistic) tax incidence has a lower impact on the revenue effects than on the demand effects reported earlier.
To illustrate how to use these numbers in practice, consider a policy to reduce the fuel tax discrimination by raising the diesel fuel tax. As discussed, this policy has been advocated by many in the European policy debate, motivated by environmental and/or distributional considerations. Table 9 implies that such a policy would not conflict with government budgetary restrictions; it would rather soften the government's budget constraint. Especially in Belgium and France, the tax revenues would increase quite substantially. Put differently, the current favorable tax treatment of diesel fuel in Europe is hard to defend on budgetary considerations. Since distributional or environmental goals would also favor an increase in the diesel fuel tax, other objectives, such as subsidization of the transportation sector, should explain the current tax system.
7. Conclusion * The existing tax policies toward gasoline and diesel cars in European countries provide a unique opportunity to analyze quality-based price discrimination and the implied tax incidence. I have developed an econometric framework of demand and pricing for gasoline and diesel cars. Consumers make a decision to buy a gasoline or a diesel car based on their annual mileage. Manufacturers set gasoline and diesel car prices with the possible aim of discriminating between
28 This restriction implies that the revenue effects depend on the tax amount paid by the indifferent consumer, who substitutes after a tax change. In all three countries, the indifferent consumer of the representative car would pay higher taxes on the gasoline car than on the diesel car (an extra $282 in Belgium, $378 in France, and $155 in Italy). C) RAND 2002.
This content downloaded from 195.194.14.3 on Fri, 6 Jun 2014 03:42:56 AMAll use subject to JSTOR Terms and Conditions
296 / THE RAND JOURNAL OF ECONOMICS
consumers with a high willingness to pay for savings in mileage costs and those with a low willingness to pay.
My empirical results showed that the relative pricing of gasoline and diesel cars is consistent with price discrimination of a monopolistic type, and inconsistent with competitive price differentials. On average, about 75% to 90% of the price differentials between gasoline and diesel cars can be explained by markup differences. The substantial degree of quality-based, second- degree price discrimination may seem surprising in a market with many car manufacturers. It adds to the well-documented evidence of geographically oriented, third-degree price discrimination in the European car markets.
The implied tax incidence is based especially on fuel taxes and less so on annual car taxes. This result has implications for measuring the demand effects of increases in the fuel tax differentials between gasoline and diesel cars. If one accounts for the presence of monopolistic tax incidence, the estimated effectiveness of a change in fuel taxes drops. The revenue effects are also affected when tax incidence is accounted for, but to a lesser extent.
References
ARMSTRONG, M. AND VICKERS, J. "Competitive Price Discrimination." RAND Journal of Economics, Vol. 32 (2001), pp. 579-605.
BERRY, S.T. "Estimating Discrete-Choice Models of Product Differentiation." RAND Journal of Economics, Vol. 25 (1994), pp. 242-262.
,LEVINSOHN, J., AND PAKES, A. "Automobile Prices in Market Equilibrium." Econometrica, Vol. 63 (1995), pp.
841-890. ,AND . "Voluntary Export Restraints on Automobiles: Evaluating a Trade Policy." American
Economic Review, Vol. 89 (1999), pp. 400-430. BORENSTEIN, S. "Price Incentives for Fuel Switching: Did Price Differences Slow the Phase-Out of Leaded Gasoline?"
Department of Economics Working Paper no. 93-8, University of California at Davis, 1993. BRESNAHAN, T.F. "Departures from Marginal-Cost Pricing in the American Automobile Industry: Estimates for 1977-
1978." Journal of Econometrics, Vol. 17 (1981), pp. 201-227. . "Competition and Collusion in the American Auto Industry: The 1955 Price War." Journal of Industrial
Economics, Vol. 35 (1987), pp. 457-482. DE BORGER, L. Modelvorming van Personenvervoer Brussels: Ministerie van Economische Zaken, 1987. CLERIDES, S.K. "Book Value: Intertemporal Pricing and Quality Discrimination in the U.S. Markets for Books."
International Journal of Industrial Organization, forthcoming. COHEN, A. "Evidence of Price Discrimination Based on Package Size in the Paper Towel Industry." Working Paper,
University of Virginia, 2001. CRAWFORD, I. AND SMITH, S. "Fiscal Instruments for Air Pollution Abatement in Road Transport." Journal of Transport
Economics and Policy, Vol. 29 (1995), pp. 33-51. DIAMOND, P.A. AND MIRRLEES, J.A. "Optimal Taxation and Public Production, I: Production Efficiency." American
Economic Review, Vol. 61 (1971), pp. 8-27. FEENSTRA, R. AND LEVINSOHN, J. "Estimating Markups and Market Conduct with Multidimensional Attributes." Review
of Economic Studies, Vol. 62 (1995), pp. 19-52. FERSHTMAN, C., GANDAL, N., AND MARKOVICH, S. "Estimating the Effect of Tax Reform in Differentiated Product
Oligopolistic Markets." Journal of Public Economics, Vol. 74 (1999), pp. 151-170. GILBERT, R. AND MATUTES, C. "Product Line Rivalry with Brand Differentiation." Journal of Industrial Economics, Vol.
41 (1993), pp. 223-240. GOLDBERG, P.K. "Product Differentiation and Oligopoly in International Markets: The Case of the U.S. Automobile
Industry." Econometrica, Vol. 63 (1995), pp. 891-95 1. . "The Effects of the Corporate Average Fuel Efficiency Standards in the U.S." Journal of Industrial Economics,
Vol. 46 (1998), pp. 1-33. AND VERBOVEN, F. "The Evolution of Price Dispersion in the European Car Market." Review of Economic Studies,
Vol. 68 (2001), pp. 811-848. GOODWIN, P.B. "A Review of Fuel Demand Elasticities with Special Reference to Short and Long Run Effects of Price
Changes." Journal of Transport Economics and Policy, Vol. 25 (1992), pp. 155-169. HANSEN, L.-P. "Large Sample Properties of Generalized Method of Moments Estimators." Econometrica, Vol.50 (1982),
pp. 1029-1054. HAUSMAN, J. "Individual Discount Rates and the Purchase and Utilization of Energy-Using Durables." Bell Journal of
Economics, Vol. 10 (1979), pp. 33-54. KATZ, M.L. "Firm-Specific Differentiation and Competition among Multiproduct Firms." Journal of Business, Vol. 57
(1984), pp. S149-S166. C RAND 2002.
This content downloaded from 195.194.14.3 on Fri, 6 Jun 2014 03:42:56 AMAll use subject to JSTOR Terms and Conditions
VERBOVEN / 297
LESLIE, P. "Price Discrimination in Broadway Theatre." Working Paper, University of California at Los Angeles, 1999. LOEWENSTEIN, G. AND THALER, R. "Anomalies-Intertemporal Choice." Journal of Economic Perspectives, Vol.3 (1989),
pp. 181-193. MACKINNON, J.G., WHITE, H., AND DAVIDSON, R. "Tests for Model Specification in the Presence of Alternative
Hypotheses: Some Further Results." Journal of Econometrics, Vol. 21 (1983), pp. 53-70. METRICK, A. AND ZECKHAUSER, R. "Price Versus Quantity: Market Clearing Mechanisms When Sellers Differ in Quality."
NBER Working Paper no. W5728, 1996. MICHAELIS, L. "The Abatement of Air Pollution from Motor Vehicles: The Role of Alternative Fuels." Journal of Transport
Economics and Policy, Vol. 29 (1995), pp. 71-84. MUSSA, M. AND ROSEN, S. "Monopoly and Product Quality." Journal of Economic Theory, Vol. 18 (1978), pp. 301-317. NEVO, A. "Measuring Market Power in the Ready-to-Eat Cereal Industry." Econometrica, Vol. 69 (2001), pp. 307-342. ORGANISATION FOR ECONOMIC COOPERATION AND DEVELOPMENT (OECD), INTERNATIONAL ENERGY AGENCY. Cars
and Climate Change. Paris: OECD, 1993. OUM, T.H., WATERS, W.G., AND YONG, J.-S. "Concepts of Price Elasticities of Transport Demand and Recent Empirical
Estimates: An Interpretative Survey." Journal of Transport Economics and Policy, Vol. 26 (1992), pp. 139-154. PAKES, A., BERRY, S., AND LEVINSOHN, J. "Applications and Limitations of Some Recent Advances in Empirical Industrial
Organization: Price Indexes and the Analysis of Environmental Change."American EconomicReview, Vol.83 (1993), pp. 240-246.
PETRIN, A. "Quantifying the Benefits of New Products: The Case of the Minivan." Journal of Political Economy, forthcoming.
ROCHET, J.-C. AND STOLE, L.A. "Nonlinear Pricing with Random Participation." Review of Economic Studies, Vol. 69 (2002), pp. 271-311.
SHEPARD, A. "Price Discrimination and Retail Configuration." Journal of Political Economy, Vol. 99 (1991), pp. 30-53. SUDHIR, K. "Competitive Pricing in the Auto Market: A Structural Analysis." Marketing Science, Vol. 20 (2001), pp.
42-60. TRANSPORT RESEARCH LABORATY. Methodology for Calculating Transport Emissions and Energy Consumption. MEET
Project prepared for the European Commission, 1995. VERBOVEN, F. "International Price Discrimination in the European Car Market." RAND Journal of Economics, Vol. 27
(1996), pp. 240-268. "Product Line Rivalry and Market Segmentation." Journal of Industrial Economics, Vol.47 (1999), pp. 399-426.
C RAND 2002.
This content downloaded from 195.194.14.3 on Fri, 6 Jun 2014 03:42:56 AMAll use subject to JSTOR Terms and Conditions