quality assurance project plan: statewide survey of per ... · quality assurance project plan ....
TRANSCRIPT

Quality Assurance Project Plan
Statewide Survey of Per- and Poly-fluoroalkyl Substances in Washington State Rivers and Lakes
April 2016 Publication No. 16-03-110

Publication Information Each study conducted by the Washington State Department of Ecology (Ecology) must have an approved Quality Assurance Project Plan. The plan describes the objectives of the study and the procedures to be followed to achieve those objectives. After completing the study, Ecology will post the final report of the study to the Internet. This Quality Assurance Project Plan is available on Ecology’s website at https://fortress.wa.gov/ecy/publications/SummaryPages/1603110.html Data for this project will be available on Ecology’s Environmental Information Management (EIM) website at www.ecy.wa.gov/eim/index.htm. Search Study ID CAME002. Ecology’s Activity Tracker Code for this study is 15-069. Author and Contact Information Callie Mathieu P.O. Box 47600 Environmental Assessment Program Washington State Department of Ecology Olympia, WA 98504-7710 Communications Consultant: phone 360-407-6834.
Washington State Department of Ecology – www.ecy.wa.gov o Headquarters, Lacey 360-407-6000 o Northwest Regional Office, Bellevue 425-649-7000 o Southwest Regional Office, Lacey 360-407-6300 o Central Regional Office, Union Gap 509-575-2490 o Eastern Regional Office, Spokane 509-329-3400
Any use of product or firm names in this publication is for descriptive purposes only
and does not imply endorsement by the author or the Department of Ecology. Accommodation Requests: To request ADA accommodation including materials in a format for the visually impaired, call Ecology at 360-407-6834. Persons with impaired hearing may call Washington Relay Service at 711. Persons with speech disability may call TTY at 877-833-6341.

QAPP: PFAS Statewide Survey Page 1 – April 2016
Quality Assurance Project Plan
Statewide Survey of Per- and Poly-fluoroalkyl Substances
in Washington State Rivers and Lakes
April 2016 Approved by: Signature: Date: April 2016 Holly Davies, Client, HWTR Program Signature: Date: April 2016 Blake Nelson, Client, HWTR Program Signature: Date: April 2016 Callie Mathieu, Author / Project Manager and Principal Investigator, EAP Signature: Date: April 2016 Brandee Era-Miller, Author’s Acting Unit Supervisor, EAP Signature: Date: April 2016 Jessica Archer, Author’s Section Manager, EAP Signature: Date: April 2016 Joel Bird, Director, Manchester Environmental Laboratory Signature: Date: April 2016 Bill Kammin, Ecology Quality Assurance Officer
Signatures are not available on the Internet version. EAP: Environmental Assessment Program HWTR: Hazardous Waste and Toxics Reduction

QAPP: PFAS Statewide Survey Page 2 – April 2016
1.0 Table of Contents Page
1.0 Table of Contents .....................................................................................................2
2.0 Abstract ....................................................................................................................5
3.0 Background ..............................................................................................................6 3.1 Study area and surroundings ........................................................................6
3.1.1 Logistical problems .........................................................................7 3.1.2 History of study area .......................................................................7 3.1.3 Parameters of interest ......................................................................8 3.1.4 Results of previous studies ..............................................................9 3.1.5 Regulatory criteria or standards ....................................................10
4.0 Project Description.................................................................................................10 4.1 Project goals ...............................................................................................10 4.2 Project objectives .......................................................................................10 4.3 Information needed and sources ................................................................11 4.4 Target population .......................................................................................11 4.5 Study boundaries ........................................................................................11 4.6 Tasks required ............................................................................................12 4.7 Practical constraints ...................................................................................12 4.8 Systematic planning process ......................................................................13
5.0 Organization and Schedule ....................................................................................13 5.1 Key individuals and their responsibilities ..................................................13 5.2 Special training and certifications ..............................................................14 5.3 Organization chart ......................................................................................14 5.4 Project schedule .........................................................................................14 5.5 Limitations on schedule .............................................................................14 5.6 Budget and funding ....................................................................................15
6.0 Quality Objectives .................................................................................................16 6.1 Decision Quality Objectives (DQOs) ........................................................16 6.2 Measurement Quality Objectives (MQOs) ................................................16
6.2.1 Targets for precision, bias, and sensitivity ....................................16 6.2.2 Targets for comparability, representativeness, and completeness 17
7.0 Sampling Process Design (Experimental Design) .................................................18 7.1 Study Design ..............................................................................................18
7.1.1 Field measurements ........................................................................19 7.1.2 Sampling location and frequency ...................................................19 7.1.3 Parameters to be determined ..........................................................20
7.2 Maps or diagram ........................................................................................21 7.3 Assumptions underlying design .................................................................21 7.4 Relation to objectives and site characteristics ...........................................21 7.5 Characteristics of existing data ..................................................................21
8.0 Sampling Procedures .............................................................................................22 8.1 Field measurement and field sampling SOPs ............................................22

QAPP: PFAS Statewide Survey Page 3 – April 2016
8.2 Containers, preservation methods, holding times ......................................23 8.3 Invasive species evaluation ........................................................................23 8.4 Equipment decontamination ......................................................................24 8.5 Sample ID ..................................................................................................24 8.6 Chain-of-custody, if required .....................................................................24 8.7 Field log requirements ...............................................................................24 8.8 Other activities ...........................................................................................25
9.0 Measurement Methods ...........................................................................................25 9.1 Field procedures table/field analysis table .................................................25 9.2 Lab procedures table ..................................................................................25 9.3 Sample preparation method(s) ...................................................................26 9.4 Special method requirements .....................................................................26 9.5 Lab(s) accredited for method(s) .................................................................26
10.0 Quality Control Procedures....................................................................................27 10.1 Table of field and lab quality control (QC) required .................................27 10.2 Corrective action processes ........................................................................27
11.0 Data Management Procedures ...............................................................................27 11.1 Data recording/reporting requirements ......................................................27 11.2 Laboratory data package requirements ......................................................28 11.3 Electronic transfer requirements ................................................................28 11.4 Acceptance criteria for existing data ..........................................................28 11.5 EIM/STORET data upload procedures ......................................................28
12.0 Audits and Reports .................................................................................................28 12.1 Number, frequency, type, and schedule of audits ......................................28 12.2 Responsible personnel ...............................................................................28 12.3 Frequency and distribution of report..........................................................29 12.4 Responsibility for reports ...........................................................................29
13.0 Data Verification ....................................................................................................29 13.1 Field data verification, requirements, and responsibilities ........................29 13.2 Lab data verification ..................................................................................29 13.3 Validation requirements, if necessary ........................................................30
14.0 Data Quality (Usability) Assessment .....................................................................30 14.1 Process for determining whether project objectives have been met ..........30 14.2 Data analysis and presentation methods ....................................................30 14.3 Treatment of non-detects ...........................................................................30 14.4 Sampling design evaluation .......................................................................31 14.5 Documentation of assessment ....................................................................31
15.0 References ..............................................................................................................31
16.0 Appendices .............................................................................................................35 Appendix A. Names of Target Fish Species .........................................................36 Appendix B. Sampling Locations .........................................................................37 Appendix C. Acronyms, Abbreviations, and Glossary .........................................39

QAPP: PFAS Statewide Survey Page 4 – April 2016
List of Figures and Tables
Page
Figure
Figure 1. Study Locations for the 2016 PFAS Study..........................................................7
Tables
Table 1. Total PFAS (T-PFAS) Concentrations Reported in Previous Washington State Studies. ........................................................................................................9
Table 2. Target Freshwater Fish Species by Location. .....................................................11
Table 3. Water Resource Inventory Area (WRIA) and 8-digit Hydrologic Unit Code (HUC) Numbers for the Study Area. .................................................................12
Table 4. Organization of Project Staff and Responsibilities. ............................................13
Table 5. Proposed Schedule for Completing Field And Laboratory Work, Data Entry into EIM, and Reports. ......................................................................................14
Table 6. Project Budget.....................................................................................................15
Table 7. Measurement Quality Objectives. .......................................................................16
Table 8. Study Locations and Sample Types. ...................................................................18
Table 9. Target Parameter Suites and Individual Compounds. ........................................20
Table 10. Sample Containers, Preservatives, and Holding Times. ...................................23
Table 11. Lab Procedures. ................................................................................................25
Table 12. Laboratory Quality Control Procedures. ...........................................................27

QAPP: PFAS Statewide Survey Page 5 – April 2016
2.0 Abstract
Per- and poly-fluoroalkyl substances (PFASs) are a large group of chemicals used in many industrial and consumer applications, such as water-, stain-, and oil-repelling coatings and fire-fighting foams. Some of the chemicals in this group – such as perfluorooctane sulfonate (PFOS) and perfluorooctanoic acid (PFOA) – have been identified as persistent, bioaccumulative, and toxic chemicals (PBTs). PFOS, PFOA, and their known precursors were largely phased out in the United States in the mid-2000s and early 2010s, yet it is not known whether this has resulted in lower environmental levels of PFASs in Washington State freshwater systems. Washington State Departments of Ecology (Ecology) and Health (DOH) are currently in the process of developing a chemical action plan for PFASs to identify the steps the state may take to reduce the threat of PFASs in Washington’s environment. In 2008, Ecology carried out a statewide survey measuring PFASs in a variety of environmental media to evaluate their presence in the state. The study found widespread presence of PFASs in surface waters, WWTP effluent, fish tissue, and osprey eggs in Washington State at levels consistent with other non-point source waterbodies in North America. In 2016, Ecology will conduct a follow-up study to the 2008 statewide survey to characterize the current level of these contaminants and to determine whether the concentrations and/or compound make up has changed. This data will also provide an up-to-date dataset to support the PFAS chemical action plan actions and recommendations.

QAPP: PFAS Statewide Survey Page 6 – April 2016
3.0 Background Per- and poly-fluoroalkyl substances (PFASs) are a large group of chemicals used in many industrial and consumer applications, such as water-, stain-, and oil-repelling coatings and fire-fighting foams. PFASs have been manufactured since the 1950s, but manufacturers began phasing out certain compounds – perfluorooctane sulfonates (PFOS), perfluorooctanoic acid (PFOA) and their known precursors – in the 2000s due to the concern over their toxicity and persistence in humans and the environment. The primary manufacturer of PFOS phased out production in 2002, and eight major companies joined EPA’s PFOA Stewardship Program to work toward eliminating PFOA and other long-chained PFASs by 2015. The Washington State Departments of Ecology (Ecology) and Health (DOH) are currently in the process of developing a chemical action plan for PFASs to identify the steps the state may take to reduce the threat of PFASs, such as PFOS, in the environment. The PFAS chemical action plan is expected to be finalized by the end of 2016. In 2008, the Washington State Department of Ecology (Ecology) carried out a statewide survey measuring PFASs in a variety of environmental media to determine their occurrence in the state’s freshwater systems (Furl and Meredith, 2010). This study found widespread presence of PFASs in surface waters, wastewater treatment plant (WWTP) effluent, fish tissue, and osprey eggs in Washington State at levels consistent with other non-point source waterbodies in North America. The following year, Ecology and Herrera (2010) analyzed PFASs in effluent of ten Puget Sound area wastewater treatment plants (WWTPs), and reported higher loading estimates for total (T-) PFASs than loading estimates for T-polychlorinated biphenyls, T-polybrominated diphenyls, and T-polycyclic aromatic hydrocarbons. Since then, Ecology has also found PFASs in marine sediments (Dutch et al., 2014) and reported rising PFAS concentrations in freshwater sediment cores (Mathieu, 2013). In 2016, Ecology will conduct a follow-up study to the 2008 statewide survey to characterize the current level of these contaminants and to qualitatively assess whether the concentrations and/or compound makeup has changed over time. The 2016 study will analyze PFASs in surface water, WWTP effluent, freshwater fish, and osprey eggs. 3.1 Study area and surroundings Ecology will collect surface water, freshwater fish, and osprey eggs from lakes and rivers distributed throughout the state (Figure 1). The waterbodies sampled in the 2008 survey will be targeted for 2016 sampling, with the addition of three sites to include potential PFAS sources that weren’t captured in the 2008 study. Angle Lake in western Washington and Moses Lake in eastern Washington are being added to the study locations for their proximity to use of aqueous film-forming foams (AFFFs). Lake Meridian is being added for additional data on PFAS contamination in urban lakes. Four WWTPs from the 2008 study and one additional WWTP will be targeted for effluent collection. Osprey eggs will be collected from several sites along the lower Columbia River (to match the 2008 study), as well as near Lake Washington and West Medical Lake.

QAPP: PFAS Statewide Survey Page 7 – April 2016
Figure 1. Study Locations for the 2016 PFAS Study.
3.1.1 Logistical problems Ecology will work with a contracted wildlife biologist consultant to obtain osprey eggs. The consultant will help work out the logistical problems anticipated in egg collection, such as obtaining necessary wildlife collection permits, determination of nest occupancy, securing safe access to nests, and collection of the egg samples with minimal disturbance to the nesting ospreys. Other logistical problems associated with access will be alleviated by desk reconnaissance of boat launches and access points. All waterbody sites in this study have been targeted by Ecology field crews before and access has been verified. 3.1.2 History of study area Furl and Meredith (2010) were the first to report a broad survey of PFAS concentrations in Washington State freshwater systems. Out of fourteen waterbodies sampled in 2008 for PFASs in surface water, West Medical Lake – which is impacted by wastewater treatment plant effluent – contained the highest concentrations, followed by South Fork Palouse River (also impacted by WWTP effluent), and Lake Washington (urban waterbody). Surface water concentrations of PFOA and PFOS were generally lower than those reported in other parts of the United States.

QAPP: PFAS Statewide Survey Page 8 – April 2016
Effluent samples from four WWTPs were also analyzed for this study, with total PFASs in the order of Spokane (Riverside Park) > West Medical Lake > Sumner > Marine Park. Concentrations of PFOA and PFOS were within the range of values reported in other regions of the U.S., with greater median values of PFOA and lower medians of PFOS in the Washington samples. The 2008 survey also analyzed fish tissue collected from seven waterbodies throughout the state (Furl and Meredith, 2010). Fish from the lower Columbia River and Lake Washington contained the highest T-PFAS concentrations. These two sites are both within industrial or urban areas. West Medical Lake and F.D.R. Lake also had detected PFAS concentrations in fish samples. PFASs were not detected in fish samples from the two reference sites – Entiat and Quinault Rivers. A largemouth bass sample from the lower Columbia River and a peamouth sample from Lake Washington were above the Minnesota Department of Health fish consumption advisory level of 40 ng/g in fillets (MDH, 2008). No fish consumption advisory level currently exists for Washington State. Osprey eggs were collected from the lower Columbia River in 2008, upstream and downstream of the Willamette River confluence (Furl and Meredith, 2010). PFOS concentrations in the eggs were similar to values recorded at Delaware Bay and lower than those recorded from Chesapeake, Casco, and Penobscot Bays. However, the highest PFOS concentration in the eggs (downstream of the Willamette River confluence) was the second highest value of recorded osprey egg concentrations in the U.S at the time. 3.1.3 Parameters of interest This study will analyze four environmentally relevant groups of PFAS analytes, for which analytical methods have been established. Table 9 shows the analyte groups and individual chemicals in each group. Perfluoroalkyl acids (PFAAs) will be analyzed in all samples. The PFAA group includes perfluoroalkyl sulfonates (PFSAs) and perfluoroalkyl carboxylates (PFCAs) with carbon chain lengths between 4 and 12. PFOS is a perfluoroalkyl sulfonate with 8 carbons and PFOA is the 8 chain perfluoroalkyl carboxylate. Long-chain PFAAs (those with a carbon chain length of 8 or greater) are widespread in the environment, highly persistent, bioaccumulative and have shown toxicity in studies of animals (EPA, 2009). A panel of scientists identified a probable link between PFOA exposure and several health concerns in humans, including thyroid disease, testicular and kidney cancer, and pregnancy-induced hypertension, high cholesterol, and ulcerative colitis (C8 Science Panel, 2013). In addition to PFAA contamination in the environment through direct releases, other PFAS chemicals can break down through biotic and abiotic pathways into PFAAs as the terminal end product (Butt et al., 2014). These chemicals are referred to as precursors. This study will analyze known and potential PFAA precursors in surface water and WWTP effluent samples. The known precursor analyte group includes polyfluorinated sulfonamides and fluorotelomer carboxylates. Potential PFAA precursors include polyfluoroalkyl phosphates (PAPs) and fluorotelomer sulfonates (FTSs). PFAA precursors are most likely to be present in WWTP effluent and in surface water of rivers downstream of WWTP effluent discharge.

QAPP: PFAS Statewide Survey Page 9 – April 2016
Polyfluoroalkyl phosphates (PAPs) are phosphate-based acid esters possessing at least one polyfluoroalkyl group. PAPs are potentially biotransformed to PFCAs (Lee et al., 2010; D’Eon et al., 2009), and may be an important source of PFAS exposure to humans (Eriksson and Karrman, 2015). PAPs are used in products such as food packaging, paints, sealers, and personal care products and are ubiquitous in indoor dust (Eriksson and Karrman, 2015; De Silva et al., 2012). Only WWTP effluent will be analyzed for PAPs, as the compounds are unlikely to be above quantitation limits in surface water. Fluorotelomer sulfonates (FTSs) are a group of fluorotelomers used in AFFFs (Herzke et al., 2012; Schultz et al., 2004) and in metal plating applications (OECD, 2013). 3.1.4 Results of previous studies Table 1 presents summary statistics of Washington State T-PFAS concentrations previously reported for the target media of this study (surface water, WWTP effluent, freshwater fish tissue, and osprey eggs).
Table 1. Total PFAS (T-PFAS) Concentrations Reported in Previous Washington State Studies.
Sample Matrix Sample Type Collection Year Units
T-PFAS Ref.
Min Max Mean Median
Surfacewater (fresh) Spring 2008 ng/L 1.11 185 21.9 7.47 (1)
Surfacewater (fresh) Fall 2008 ng/L < 0.9 170 21.1 3.60 (1)
Surfacewater (fresh and marine)
Spring/summer/ fall/winter mean
2009-2010 ng/L 1.5 41 --- --- (2)
WWTP effluent Spring 2008 ng/L 61.0 418 97.0 218 (1)
WWTP effluent Fall 2008 ng/L 73.3 188 148 140 (1)
WWTP effluent Summer 2009 ng/L 46.3 146 100 93.4 (3)
WWTP effluent Winter 2009 ng/L 35.3 194 92.0 73.5 (3)
Freshwater fish Fillet 2008 ng/g ww < 10 76 --- < 10 (1)
Freshwater fish Liver 2008 ng/g ww < 25 527 --- 47.6 (1)
Freshwater fish Fillet 2011 ng/g ww 2.13 21.5 12.1 12.3 (4)
Freshwater fish Whole body 2011 ng/g ww 3.27 91.9 35.1 22.7 (4)
Osprey Egg 2008 ng/g ww 37.5 910 194 90.7 (1)
T-PFAS: sum of detected PFAS chemicals (13 PFAAs) ww: wet weight (1) Furl and Meredith, 2010 (2) Dinglasan-Panlilio et al., 2014 (3) Ecology and Herrera, 2010 (4) Johnson and Friese, 2012
QAPP: PFAS Statewide Survey Page 10 – April 2016
3.1.5 Regulatory criteria or standards No environmental regulatory criteria or standards exist for PFASs in Washington State. The EPA has issued a provisional health advisory for PFOS in drinking water of 200 ng/L (ppt). The Minnesota Department of Health issued PFOS screening levels for fish tissue at which fish consumption advisories are issued: 40 ppb (1 meal/week), >40 – 200 ppb (1 meal/month), and >800 ppb (do not eat) (MDH, 2008). Environment Canada drafted Federal Environmental Quality Guidelines (FEQGs) to assess PFOS levels in the environment (Environment Canada, 2013). PFOS levels above the FEQG indicate an increased likelihood that adverse effects may occur to fish at these levels: water (6,000 ng/L) and fish tissue (8,300 ng/g ww). The FEQG thresholds for fish tissue that indicate a risk to wildlife predators are much lower: 4.6 ng/g ww (mammalian) and 8.2 ng/g ww (avian). The Minnesota and Canadian values have no regulatory relevance to Washington State fish, but will be used when evaluating data to help provide context. 4.0 Project Description
4.1 Project goals This project is being carried out with the following goals:
• To characterize current levels of PFASs in selected Washington State freshwater systems.
• To qualitatively assess whether concentrations and/or compound makeup has changed since the last statewide survey in 2008.
• To provide data to support PFAS chemical action plan actions and recommendations.
4.2 Project objectives The following objectives will be carried out in 2016 to meet project goals:
• Ecology will collect surface water samples from 15 waterbodies during the spring and fall for analysis of 25 PFAS chemicals.
• Ecology will collect effluent during the spring and fall from 5 WWTPs for analysis of 35 PFAS chemicals.
• Ecology will collect osprey eggs at a subset of 3 waterbodies in the spring for analysis of 13 PFAS chemicals.
• Ecology will collect freshwater fish from 11 waterbodies in the fall for analysis of 13 PFAS chemicals in liver and fillets.

QAPP: PFAS Statewide Survey Page 11 – April 2016
4.3 Information needed and sources This project will generate new environmental data. Results from the 2008 PFAS survey will be used for comparisons with the 2016 data.
4.4 Target population The target populations include surface water, osprey (Pandion haliaetus) eggs, and freshwater fish of selected rivers and lakes in Washington State, and final effluent from selected WWTPs in the state. Fish collections will target species obtained in the 2008 survey or those that are available at added sites: cutthroat trout, largemouth bass, largescale sucker, mountain whitefish, peamouth, pumpkinseed, rainbow trout, smallmouth bass, tench, walleye, and yellow perch. A complete list of target fish species and their scientific and family names is located in Appendix A. Table 2 displays the fish species collected in 2008, as well as those targeted in 2016. Efforts will be made to obtain two species at each waterbody covering two trophic levels (bottom feeder and predator). However, the first priority is to match species collected in 2008. Table 2. Target Freshwater Fish Species by Location.
Study Location Species Collected in 2008
Species Targeted in 2016
Angle Lake --- LMB, YP F.D.R. Lake SMB, WAL SMB, WAL Lake Washington LMB, LSS, PEA, YP LMB, LSS, PEA, YP Lower Columbia River LMB, LSS LMB, LSS Meridian Lake --- LMB Mid-Columbia River (McNary) --- LMB, LSS Moses Lake --- LMB, LSS Quinault River CTT CTT Snohomish River --- MWF, PEA Spokane River LSS LSS West Medical Lake PS, RBT, TCH PS, RBT, TCH
*See Appendix A for explanation of abbreviations.
4.5 Study boundaries Figure 1 displays the study locations for this project. All samples will be collected as close to the sampling geographic coordinates of the 2008 study as possible. At individual study locations, fish will be collected from the entire lake, or within a two river mile stretch of river. Fish collections will target areas with habitat that is most likely to contain the species of interest. Osprey egg collection sites will depend on successful nesting osprey sites identified during the nesting surveys. Water resource inventory areas and hydrologic unit codes for the waterbodies are listed in Table 3.

QAPP: PFAS Statewide Survey Page 12 – April 2016
Table 3. Water Resource Inventory Area (WRIA) and 8-digit Hydrologic Unit Code (HUC) Numbers for the Study Area.
Study Location WRIA HUC
Angle Lake 9 17110013 Lake Washington 8 17110012 Lower Columbia River 28 17080003 Snohomish River 7 17110011 South Fork Palouse River 34 17060108 West Medical Lake 43 17020013 Mid-Columbia River (McNary Dam) 31 17070101 Meridian Lake 9 17110013 Moses Lake 41 17020015 Nooksack River 1 17110004 Puyallup River 10 17110014 Spokane River 54 17010307 Upper Columbia River 61 17020001 Franklin D. Roosevelt Lake 53 17020001 Quinault River 21 17100102
4.6 Tasks required The following tasks will be carried out for this project:
• Conduct desktop reconnaissance of study locations. • Work with MEL’s QA officer to secure a contract laboratory for analysis of PFASs. • Develop service contract for collection of osprey eggs by wildlife biologist. • Assist consulting wildlife biologist with nesting survey and collection of osprey eggs in the
spring on the lower Columbia River. Consultant will deliver osprey eggs from other two locations to Ecology HQ.
• Process osprey eggs samples and send to contract laboratory. • Collect spring surface water and WWTP effluent samples and send to contract laboratory. • Collect fall surface water and WWTP effluent samples and send to contract laboratory. • Collect target fish species in the fall, process fish samples, and send to contract laboratory. • Review data quality of laboratory results and work with MEL’s QA officer to resolve any
issues. • Write draft report summarizing results, route the draft following EAP review procedures, and
publish final report. • Load data into Ecology’s EIM database.
4.7 Practical constraints See Section 3.1.1.

QAPP: PFAS Statewide Survey Page 13 – April 2016
4.8 Systematic planning process This Quality Assurance Project Plan addresses the elements of the systematic planning process.
5.0 Organization and Schedule
5.1 Key individuals and their responsibilities
Table 4. Organization of Project Staff and Responsibilities.
Staff (all are EAP except client) Title Responsibilities
Holly Davies HWTR program Phone: 360-407-7398
EAP Client Clarifies scope of the project. Provides internal review of the QAPP and approves the final QAPP.
Callie Mathieu Toxics Studies Unit, SCS Phone: 360-407-6965
Project Manager and Principal Investigator
Writes the QAPP. Oversees field sampling and transportation of samples to the laboratory. Conducts QA review of data, analyzes, and interprets data. Writes the draft report and final report.
Dave Serdar/Christopher Clinton Toxics Studies Unit, SCS Phone: 360-407-6060
Field Lead Leads field collections, records field information, and enters data into EIM.
Brandee Era-Miller Toxics Studies Unit, SCS Phone: 360-407-6771
Acting Unit Supervisor for the Project Manager
Provides internal review of the QAPP, approves the budget, and approves the final QAPP.
Jessica Archer SCS Phone: 360-407-6698
Section Manager for the Project Manager
Reviews the project scope and budget, tracks progress, reviews the draft QAPP, and approves the final QAPP.
Joel Bird MEL Phone: 360-871-8801
Director Reviews and approves the final QAPP.
Karin Feddersen MEL Phone: 360-871-8829
MEL Quality Assurance Coordinator
Reviews draft QAPP, oversees laboratory contract, and coordinates with contract lab.
William R. Kammin Phone: 360-407-6964
Ecology Quality Assurance Officer
Reviews and approves the draft QAPP and the final QAPP.
James L. Kaiser Osprey Solutions, LLC Phone: 206-938-1600
Consulting Raptor Biologist
Coordinates logistics surrounding osprey egg collection, conducts nest surveys, and collects sample eggs.
EAP: Environmental Assessment Program EIM: Environmental Information Management database HWTR: Hazardous Waste and Toxics Reduction MEL: Manchester Environmental Laboratory QAPP: Quality Assurance Project Plan SCS: Statewide Coordination Section

QAPP: PFAS Statewide Survey Page 14 – April 2016
5.2 Special training and certifications Osprey eggs will be collected by the consulting wildlife biologist who has specialized experience in collecting eggs from nesting osprey in the Pacific Northwest. All Ecology field crew carrying out fish collections have specialized training in electro-shocking techniques for fish collections. Field crew conducting field measurements of temperature, pH, and conductivity must meet the personnel qualifications listed in the corresponding SOPs listed in 8.1.
5.3 Organization chart See Table 4.
5.4 Project schedule
Table 5. Proposed Schedule for Completing Field And Laboratory Work, Data Entry into EIM, and Reports.
Field and laboratory work Due date Lead staff Field work completed 12/2016 Christopher Clinton Laboratory analyses completed 03/2017
Environmental Information System (EIM) database EIM Study ID CAME002 Product Due date Lead staff
EIM data loaded 08/2016 Christopher Clinton EIM data entry review 09/2017 Melissa McCall EIM complete 10/2017 Christopher Clinton
Final report Author lead / Support staff Callie Mathieu / Christopher Clinton Schedule
Draft due to supervisor 07/2017 Draft due to client/peer reviewer 08/2017 Final (all reviews done) due to publications coordinator 09/2017
Final report due on web 10/2017
5.5 Limitations on schedule Osprey egg collection is dependent on nesting success and timing. The consulting wildlife biologist will conduct nesting surveys in mid-April 2016 to determine schedule of egg collections. The final collection date is not likely to affect the overall schedule of the project.

QAPP: PFAS Statewide Survey Page 15 – April 2016
5.6 Budget and funding The total budget for laboratory and contracting services for this project is $130,100. Table 6 presents the estimated costs of PFAS laboratory analyses, MEL contracting services, and contracting costs for osprey egg collection. The number of quality control (QC) samples includes only those tests that are not included in the cost of analysis. Field QC samples – replicates and equipment blanks – are included in the number of QC samples.
Table 6. Project Budget.
Analyte Group Matrix Number of
Samples Number of QC Samples
Cost per Sample Total Cost
PFAAs Water/Effluent 40 8 $410 $19,680
PFAAs Fish Tissue 44 --- $475 $20,900
PFAAs Osprey Eggs 12 --- $475 $5,700
FTS Water/Effluent 40 8 $425 $20,400
PAPs Water/Effluent 10 4 $500 $7,000
precursors Water/Effluent 40 8 $500 $24,000
Lab subtotal: $97,680
MEL contracting costs: $24,420
Contracting costs for osprey egg collection: $8,000
Total Lab and Contracting Costs: $130,100

QAPP: PFAS Statewide Survey Page 16 – April 2016
6.0 Quality Objectives
6.1 Decision Quality Objectives (DQOs) This study will not require decision quality objectives.
6.2 Measurement Quality Objectives (MQOs)
Table 7. Measurement Quality Objectives.
Analyte Matrix
Precision Bias Instrument performance Sensitivity
Lab Duplicates
(RPD)*
LCS (% recov.) Method Blanks
Surrogate Standards (% recov.)
Quantitation Limit
PFAAs Tissue < 40% 70 - 130% < 0.5 ng/g1 40 - 150%2 0.5 - 1.0 ng/g
PFAAs Water/ effluent < 40% PFSAs: 70 - 130%
PFCAs: 80 - 120% < 0.25 ng/
sample 40 - 150%3 1.0 - 2.0 ng/L
PAPs Water/ effluent < 40% 40 - 160% < LOQ n/a 4.0 - 80 ng/L
FTS Water/ effluent < 40% 50 - 150% < 1 ng/
sample 40 - 150% 10 ng/L
Precursors Water/ effluent < 40% 70 - 150%4 < 0.13 to <1.0 ng/
sample 50 - 150%5 1.0 - 8.0 ng/L
* RPD for concentrations > 5 times reporting limit. 1 < 1 ng/g for PFBS, PFHxS, and PFOS. 2 20 - 150% for 13C4-PFBA; 20 - 130% 13C8-PFOSA 3 20 - 150% for 13C4-PFBA 4 Method acceptance limits are not established. Interim limits range from 10-140% to 50-350%. 5 50 - 200% for FOSAA. RPD: relative percent difference. LCS: laboratory control sample. LOQ: limit of quantitation.
6.2.1 Targets for precision, bias, and sensitivity 6.2.1.1 Precision Precision is a measure of the variability in the results of replicate measurements due to random error. Laboratory analysis precision will be assessed through laboratory duplicate samples for all matrices and analyses. Table 7 shows MQOs for laboratory duplicate samples. One field replicate per batch of surface water and WWTP effluent samples will be collected and analyzed alongside the field samples. A field replicate sample will be collected immediately

QAPP: PFAS Statewide Survey Page 17 – April 2016
after the field sample using the same sampling technique. Field replicate relative percent difference (RPD) should be < 40% for concentrations greater than 5 times the reporting limit. 6.2.1.2 Bias Bias is the difference between the population mean and the true value. Laboratory analysis bias will be assessed through laboratory control samples. MQOs for laboratory control sample recoveries are included in Table 7. 6.2.1.3 Sensitivity Sensitivity is a measure of the capability of a method to detect a substance. Laboratory analysis sensitivity is defined here as the quantitation limit. See Table 7 for quantitation limits. 6.2.2 Targets for comparability, representativeness, and completeness 6.2.2.1 Comparability Section 8.1 lists the standard operating procedures (SOPs) to be followed for field sampling. Use of SOPs for field sampling will help ensure comparability between results from this study and the 2008 study. Samples collected in 2016 will be collected as close to spring and fall sampling dates as those used in 2008 as possible; however, differences in weather and/or flow may affect comparability. Comparability of laboratory analyses for PFAAs may be affected by using a different laboratory in 2016. Slight differences exist in methods, such as different solvents used for extraction. Both studies are utilizing the same instrument (high resolution LC-MS/MS) and general analytical approach. 6.2.2.2 Representativeness Surface water sampling is being conducted during May and October to capture spring run-off and summer low-flow conditions in rivers. Sampling at the WWTPs will occur concurrently with surface water sampling. The selected WWTPs discharge into surface waters being sampled for this study and represent a range of flow capacities and sources (domestic and domestic/industrial). Fish samples will be analyzed as three to five fish composites in order to integrate variability within a waterbody and provide a representative sample. Only one osprey egg will be collected per nest as per wildlife permits to reduce effects on nest productivity. The study locations were chosen to represent various levels of contamination potential and to characterize PFAS levels in different watershed types. 6.2.2.3 Completeness The project manager will consider the study to have achieved completeness if 95% of the samples are analyzed acceptably.

QAPP: PFAS Statewide Survey Page 18 – April 2016
7.0 Sampling Process Design (Experimental Design)
7.1 Study Design Ecology will collect samples of fresh surface water, WWTP effluent, freshwater fish tissue, and osprey eggs in 2016 throughout Washington State for analysis of PFASs. Table 8 displays the overall study design, including study locations and sample types. This study is a follow-up to Ecology’s 2008 PFAS survey and is based on locations that were sampled previously. However, the study is being expanded to include additional sites and a higher number of biota samples to capture potential contamination from sources that weren’t characterized in 2008 (such as AFFFs) and to characterize contaminant burdens in biota from urban sites, which was limited in 2008. This study will also be expanded to include additional PFAS chemicals in surface water and WWTP that were not analyzed in 2008.
Table 8. Study Locations and Sample Types.
*Indicates study location or sample type that was not sampled in 2008. SP: spring F: fall AFFF: aqueous film-forming foam WWTP: wastewater treatment plant Ecology will collect surface water samples from 15 waterbodies in the spring (May) and fall (September) to assess concentrations of 25 PFASs during spring runoff and early fall low-flow
Study LocationWater
Samples Fish
Samples Osprey Eggs
(# of samples)Waterbody Type
Contamination Potential
Potential Sources/ Pathways of Interest
Surface WatersAngle Lake* SP, F F Lake High Stormwater, AFFFLake Washington SP, F F SP* (8) Lake High Stormwater Lower Columbia River SP, F F SP (2) River High WWTP, StormwaterSnohomish River SP, F F* --- River High WWTP, StormwaterSouth Fork Palouse River SP, F --- --- River High WWTP West Medical Lake SP, F F SP* (2) Lake High WWTP Mid-Columbia River (McNary Dam) SP, F F* --- Impoundment Medium WWTP Meridian Lake* SP, F F --- Lake Medium StormwaterMoses Lake* SP, F F --- Lake Medium AFFFNooksack River SP, F --- --- River Medium Atmospheric Dep.Puyallup River SP, F --- --- River Medium WWTPSpokane River SP, F F --- River Medium WWTPUpper Columbia River SP, F --- --- River Medium Atmospheric Dep.Franklin D. Roosevelt Lake SP, F F --- Impoundment Low Atmospheric Dep.Quinault River SP, F F --- River Low Atmospheric Dep.
Marine Park (Lower Columbia River) SP, F --- --- --- --- Domestic/IndustrialPuyallup (Puyallup River) SP, F --- --- --- --- Domestic Spokane (Spokane River) SP, F --- --- --- --- Domestic West Medical Lake (West Medical Lake) SP, F --- --- --- --- Domestic Pullman (South Fork Palouse River)* SP, F --- --- --- --- Domestic
Wastewater Treatment Plants (Receiving Waters)

QAPP: PFAS Statewide Survey Page 19 – April 2016
conditions. Surface water sampling locations include rivers, lakes, and impoundments of varying watershed size and contamination potential (Table 8). Final effluent from 5 WWTPs will be collected concurrently with surface water samples, for analysis of 35 PFAS chemicals. The WWTPs are located upstream of surface water collection locations and represent a range of flow capacities and sources (domestic and domestic/industrial). The City of Pullman WWTP was added to the sampling plan in 2016 because PFAS concentrations in surface water samples from its receiving water – South Fork Palouse River – were the second highest of all study locations in 2008. WWTP discharges from upstream municipalities, including Pullman, potentially account for the majority of total river flow during low-flow periods (Pelletier, 1993). Ecology will collect two species of freshwater fish from 11 of the surface water sampling locations in the fall (September - November). One composite sample of liver and one composite sample of fillet tissue from each species will be analyzed for 13 PFASs. PFASs are not lipophilic and preferentially accumulate in blood, liver, and kidneys of fish (Martin et al., 2003). Ecology crew will target the same species and similar size classes as those obtained in 2008. Where possible, the species will be from different trophic levels (bottom feeder and predator). Table 2 displays target species at each location. Composite samples will consist of 3-5 individual fish. The subset of lakes targeted for freshwater fish sampling also cover a range of waterbody type, watershed size, and contamination potential. In May, Ecology and a consulting wildlife biologist will collect osprey eggs for analysis of 13 PFASs from a subset of three study locations. One viable egg will be collected from eight individual nests along the lower Columbia River, two nests near Lake Washington, and two nests near West Medical Lake. Osprey are useful biomonitoring species, as they feed almost exclusively on fish near their nests. A total of 11 osprey eggs were collected from the lower Columbia River in the 2008 study. In 2016, two additional sites have been added to gain more information on PFAS levels at the top of the trophic chain. All three osprey egg collection waterbodies have high potential of PFAS contamination. Candidate sites for egg collection at other study locations were limited. 7.1.1 Field measurements Conductivity, pH, and temperature measurements will be recorded in the field at all study locations. The latitude and longitude of sampling locations will be located by GPS and recorded. Fish total length (mm) and weight (g) will be measured and recorded in the field at time of collection. All field measurements will be recorded on project field logs. 7.1.2 Sampling location and frequency Table 8 outlines the locations and timing of sample collections. Geographic coordinates for surface water, fish tissue, and WWTP effluent sampling locations are included in Appendix B. Precise sampling locations for osprey egg collection is dependent upon nesting activity identified by nesting surveys. The sampling strategy is based on the 2008 statewide survey, with additional sites and sample types for inclusion of other potential contamination sources. One sampling

QAPP: PFAS Statewide Survey Page 20 – April 2016
event will occur per season for surface water (spring and fall), WWTP effluent (spring and fall), fish (fall), and osprey eggs (spring). All samples will be collected in 2016. 7.1.3 Parameters to be determined Table 9 lists the parameters to be analyzed during this project, for each sample type.
Table 9. Target Parameter Suites and Individual Compounds.
Sample Types to be Analyzed Compound Group Individual Compounds Acronym
Perfluorobutanoate PFBAPerfluoropentanoate PFPeAPerfluorohexanoate PFHxAPerfluoroheptanoate PFHpAPerfluorooctanoate PFOAPerfluorononanoate PFNAPerfluorodecanoate PFDA
Perfluoroundecanoate PFUnAPerfluorododecanoate PFDoA
Perfluorobutanesulfonate PFBSPerfluorohexanesulfonate PFHxSPerfluorooctanesulfonate PFOS
Perfluorooctane sulfonamide PFOSAPerfluorooctane sulfonamido acetic acid FOSAA
N-methyl perfluorooctane sulfonamido acetic acid MeFOSAAN-ethyl perfluorooctane sulfonamido acetic acid EtFOSAA
6:2 fluorotelomer carboxylic acid 6:2 FTCA8:2 fluorotelomer carboxylic acid 8:2 FTCA
10:2 fluorotelomer carboxylic acid 10:2 FTCA6:2 fluorotelomer unsaturated carboxylic acid 6:2 FTUCA8:2 fluorotelomer unsaturated carboxylic acid 8:2 FTUCA
10:2 fluorotelomer unsaturated carboxylic acid 10:2 FTUCAPerfluorohexylphosphonate PFHxPAPerfluorooctylphosphonate PFOPAPerfluorodecylphosphonate PFDPA
Bis(perfluorohexyl)phosphinate 6:6 PFPiPerfluorohexylperfluorooctylphosphinate 6:8 PFPi
Bis(perfluorooctyl)phosphinate 8:8 PFPi1H,1H,2H,2H-perfluorooctylphosphate 6:2 monoPAP1H,1H,2H,2H-perfluorodecylphosphate 8:2 monoPAP
Bis(1H,1H,2H,2H-perfluorooctyl)phosphate 6:2 diPAPBis(1H,1H,2H,2H-perfluorodecyl)phosphate 8:2 diPAP
4:2 fluorotelomer sulfonate 4:2 FTS6:2 fluorotelomer sulfonate 6:2 FTS8:2 fluorotelomer sulfonate 8:2 FTS
Surface water, WWTP effluent, fish tissue, osprey egg
Surface water, WWTP effluent
WWTP effluent
Surface water, WWTP effluent Fluorotelomer sulfonates (FTS)
Polyfluoroalkyl phosphates (PAPs)
Perfluoroalkyl acids (PFAAs)
PFAA precursors

QAPP: PFAS Statewide Survey Page 21 – April 2016
7.2 Maps or diagram Figure 1 shows the study locations for this project. 7.3 Assumptions underlying design The study makes the assumption that quantitation limits will be low enough to characterize PFAS contamination in areas of varying contamination potential, including those reflecting atmospheric deposition as the dominant pathway. 7.4 Relation to objectives and site characteristics Sites were selected to capture a range of potential PFAS pathways and sources in order to support the project goal of characterizing PFAS contamination in Washington State. Table 8 describes potential sources of PFASs for each study location. 7.5 Characteristics of existing data Limitations to the 2008 PFAS study include the relatively high quantitation limits for fish tissue analyses, a limited analyte suite, and a low number of fish tissue and osprey egg samples. This study will improve on the original 2008 study in the following ways.
• Current methods allow for lower quantitation limits for PFAAs in fish tissue and osprey eggs.
• Additional PFAS parameters will be analyzed in surface water and WWTP effluent.
• Sites and sample types were added to the study design to capture additional potential sources of PFAS contamination and help characterize fish tissue concentrations in urban areas.

QAPP: PFAS Statewide Survey Page 22 – April 2016
8.0 Sampling Procedures
8.1 Field measurement and field sampling SOPs The field lead and field assistants will follow the protocols described within the following Ecology SOPs:
• EAP007 – Resecting Finfish Whole Body, Body Parts, or Tissue Samples (Sandvik, 2014b) • EAP009 – Collection, Processing, and Preservation of Finfish Samples (Sandvik, 2014a) • EAP011 – Instantaneous Measurements of Temperature in Water (Nipp, 2006) • EAP015 – Manually Obtaining Surface Water Samples (Joy, 2006) • EAP031 – Collection and Analysis of pH Samples (Ward, 2014a) • EAP032 – Collection and Analysis of Conductivity Samples (Ward, 2014b) • EAP070 – Minimizing the Spread of Invasive Species (Parsons et al., 2012) • EAP090 – Decontaminating Field Equipment for Sampling Toxics in the Environment
(Friese, 2014) Surface water and effluent samples will be collected in laboratory-provided pre-cleaned 1 L high density polyethylene (HDPE) containers, following the SOP listed above. Samples will be collected as near-surface grabs (15-30 cm below the water surface) from as close to the thalweg as possible for rivers. Lakes will be sampled using the same near-surface grab technique from an area as far away as possible from surface water inputs and the shoreline. Samples will be retrieved with a polyethylene and stainless steel telescopic pole sampler or stainless steel Kemmerer, if deployed from bridge. The Kemmerer will be decontaminated between sampling locations with a tap water rinse and 100% methanol wash. Deionized (DI) water will not be used to clean equipment due to the possible contamination from polytetrafluoroethylene material used in the DI water purification system. This study is designed to mimic that of the 2008 sampling. All samples will be collected as close to the coordinates of the 2008 study as possible. The 2008 study considered multi-point, depth-integrated composite samples, but it found that the majority of historical studies characterizing PFASs in surface waters were sampled in the manner described above (Taniyasu et al., 2003; Nakayama et al., 2007; Sinclair et al., 2006). WWTP effluent samples will be collected from final dechlorinated effluent. Samples will consist of a morning and afternoon grab composite. Grabs will be taken with a lab-provided HDPE bottle and composited into a new clean HDPE bottle. Methods for fish collections will follow the SOP listed above, using electrofishing, netting, or angling. Fish captured by these methods will be identified to species and target species will be retained if they are in acceptable condition and target size range. Adequate numbers of fish will be collected to form one 3-5 fish composite sample for each species (fillet and liver). One bottom feeder species and one predator species will be targeted at each waterbody. Osprey eggs will be collected following U.S. Fish and Wildlife Service (USFWS) Protocol for Bird Egg Collection, Measurement, Preparation, and Shipment for Contaminant Residue

QAPP: PFAS Statewide Survey Page 23 – April 2016
Analysis (Buck, 2008). One warm, viable osprey egg per nest will be collected by the consulting wildlife biologist. Ecology field crew staff will assist with egg collection at the lower Columbia River site, providing boat access and field assistance. One egg will be randomly selected and removed from the nest, wrapped in aluminum foil (dull side in), and placed in a zip-closure plastic bag. A label will be placed in the plastic bag with date, nest identification, location, and collector. Eggs will be stored in protective material and placed inside a cooler with blue ice for transport to Ecology Headquarters. Samples will be stored in the walk-in cooler at Ecology Headquarters (not frozen) until processing. Fish will be collected under Ecology’s scientific collection permits from the Washington Department of Fish and Wildlife (WDFW), USFWS, and National Oceanographic Atmospheric Administration (NOAA). Ecology will obtain the necessary permits for osprey egg collection from WDFW, Oregon Department of Fish and Wildlife, and USFWS.
8.2 Containers, preservation methods, holding times
Table 10. Sample Containers, Preservatives, and Holding Times.
Parameter Matrix Minimum Quantity Required
Container Sample
Receipt and Preservation
Sample Storage
Holding Time
PFAAs Fish/Osprey tissue 2 g ww HDPE jar 0 - 4°C -20°C 1 year
PFAAs SW/effluent 1 L HDPE jar 0 - 4°C 0 - 4°C 60 days
PAPs Effluent 0.5 L HDPE jar 0 - 4°C 0 - 4°C 30 days
FTS SW/effluent 0.1 L HDPE jar 0 - 4°C 0 - 4°C 30 days
Precursors SW/effluent 0.5 L HDPE jar 0 - 4°C 0 - 4°C 30 days
SW: surface water. ww: wet weight.
8.3 Invasive species evaluation Field staff will follow the procedures described within SOP EAP070 – Minimizing the Spread of Invasive Species (Parsons et al., 2012). The Columbia River is considered an area of extreme concern due to the documented presence of New Zealand mudsnails (NZMS). Ecology staff will schedule these waterbodies for sampling at the end of a field run and will use the following decontamination procedure: inspection, cleaning, draining, and drying. Inspection consists of visual inspection and physical removal of invasive species and aquatic plants. This will be performed after sampling, once at the site and again at the operations center. Motors and generators will be flushed with clean water. Gill nets, the boat hull, and the boat bilge will be cleaned with hot water (60°C). Nets will be left out to dry and the bilge will be completely drained. The exposed gear will be completely dry for 2 days before the next use. In addition, field staff will make an effort to reduce contact with sediments at the areas of extreme concern, further reducing the possibility of spreading NZMS or other invasive species.

QAPP: PFAS Statewide Survey Page 24 – April 2016
8.4 Equipment decontamination Equipment used to collect water samples and utensils used to process fish and osprey samples will be decontaminated using the following procedure: hand washed with Liquinox soap and hot tap water, hot tap water rinse, and a final 100% methanol rinse. All other aspects of decontamination will follow Ecology’s SOP for Decontamination of Sampling Equipment for Use in Collecting Toxic Chemical Samples (Friese, 2014).
8.5 Sample ID Sample IDs will be assigned using MEL’s work order number followed by a consecutive number. Individual fish will be assigned unique Field IDs at the time of sample collection. After processing individual fish into composite samples in the lab, a sample ID will be given using the MEL work order number.
8.6 Chain-of-custody, if required Chain of custody will be maintained for all samples throughout the project. Samples will be stored in a cooler or freezer in Ecology’s locked HQ chain of custody room. Ecology staff will use Manchester Environmental Laboratory’s (MEL’s) chain of custody form for shipment to the laboratory.
8.7 Field log requirements Field data will be recorded in a bound, waterproof notebook on Rite-in-the-Rain paper. Corrections will be made with single line strikethroughs, initials, and date. An electrofishing log will be filled out at each sampling location with the following information:
• Name of project • Date(s) • Site name • Field personnel • Water quality data: temperature, conductivity, pH, and visibility • Date, time, location, ID, and description of each sample • Weather • Field instrument calibrations • Main engine hours (for electro-shock boat) • Generator hours (for electro-shock boat) • Electrofishing shock settings • Fish species sighted and retained per permit requirements • Fish lengths and weights of fish retained for analysis • Any changes or deviations from the QAPP • Environmental conditions • Unusual circumstances that might affect interpretation of results
QAPP: PFAS Statewide Survey Page 25 – April 2016
8.8 Other activities Not applicable. Necessary activities are detailed in other sections of this QAPP.
9.0 Measurement Methods
9.1 Field procedures table/field analysis table At the time of surface water sample collection, the following will be measured in the field: temperature, pH, and conductivity. Field measurements will be taken following guidance in Ecology’s SOPs listed in Section 8.1 using a HACH HQ40d pH meter and Orion 130A conductivity meter.
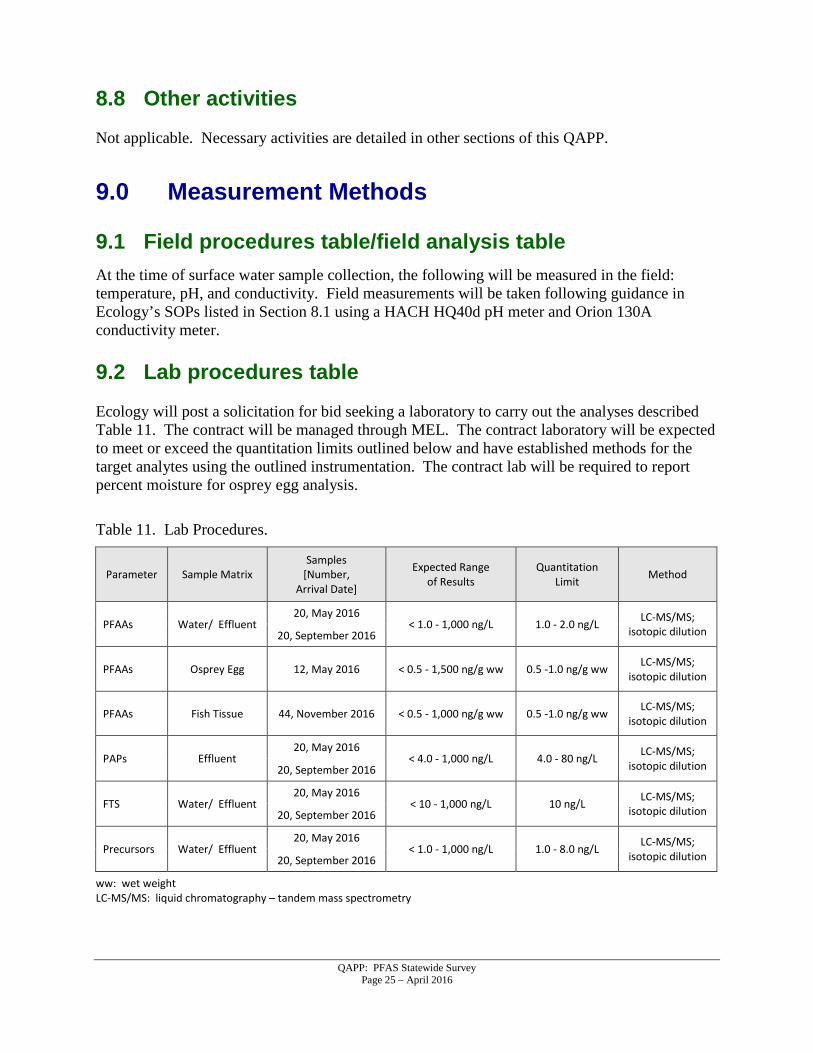
9.2 Lab procedures table Ecology will post a solicitation for bid seeking a laboratory to carry out the analyses described Table 11. The contract will be managed through MEL. The contract laboratory will be expected to meet or exceed the quantitation limits outlined below and have established methods for the target analytes using the outlined instrumentation. The contract lab will be required to report percent moisture for osprey egg analysis.
Table 11. Lab Procedures.
Parameter Sample Matrix Samples
[Number, Arrival Date]
Expected Range of Results
Quantitation Limit Method
PFAAs Water/ Effluent 20, May 2016
< 1.0 - 1,000 ng/L 1.0 - 2.0 ng/L LC-MS/MS; isotopic dilution 20, September 2016
PFAAs Osprey Egg 12, May 2016 < 0.5 - 1,500 ng/g ww 0.5 -1.0 ng/g ww LC-MS/MS; isotopic dilution
PFAAs Fish Tissue 44, November 2016 < 0.5 - 1,000 ng/g ww 0.5 -1.0 ng/g ww LC-MS/MS; isotopic dilution
PAPs Effluent 20, May 2016
< 4.0 - 1,000 ng/L 4.0 - 80 ng/L LC-MS/MS; isotopic dilution 20, September 2016
FTS Water/ Effluent 20, May 2016
< 10 - 1,000 ng/L 10 ng/L LC-MS/MS; isotopic dilution 20, September 2016
Precursors Water/ Effluent 20, May 2016
< 1.0 - 1,000 ng/L 1.0 - 8.0 ng/L LC-MS/MS; isotopic dilution 20, September 2016
ww: wet weight LC-MS/MS: liquid chromatography – tandem mass spectrometry

QAPP: PFAS Statewide Survey Page 26 – April 2016
9.3 Sample preparation method(s) Fish samples will be processed and homogenized according to Ecology’s SOP for Resecting Finfish Whole Body, Body Parts, or Tissue Samples (Sandvik, 2014b). Composite fish samples will be composed of 3-5 individual fish fillets. Fish livers will be identified and extracted with clean scalpels and forceps after fillets have been taken from the carcass. Small squares of fillet tissue and whole livers will be placed in clean stainless steel jars and homogenized with a decontaminated stainless steel sonicator until a consistent color and texture is reached. Homogenized samples will be placed in pre-cleaned HDPE jars, frozen, and sent to the laboratory with blue ice. After fillets and livers are removed, the sex of the fish will be determined (when possible) and recorded. Otoliths, scales, and other aging structures will be removed from fish and sent to WDFW for age determination. Osprey eggs will be processed and homogenized following the USFWS Protocol for Bird Egg Collection, Measurement, Preparation, and Shipment for Contaminant Residue Analysis (Buck, 2008). Eggs will be assessed for cracks, cleaned gently with a soft towel and tap water at or near the temperature of the egg, and dried. Eggs will then be weighed, measured for length at their greatest dimension, and measured for volume following the water displacement technique described by Buck (2008). Eggs will be scored around the equator of the egg until the membrane is visible. The membranes will then be cut with a scalpel and egg contents transferred to a pre-cleaned stainless steel jar for homogenizing. If possible, eggshell thickness will be measured using a dial micrometer with rounded contacts. A stainless steel sonicator will be used to homogenize the egg contents until they are of consistent color and texture. Samples will then be placed in the pre-cleaned HDPE jars, frozen, and shipped to the laboratory with blue ice.
9.4 Special method requirements The PFAS methods required for this project are newly developed and report very low concentrations. The project manager will need to work closely with the contract laboratory and MEL’s QA officer to ensure that the methods that are used meet the needs of this study.
9.5 Lab(s) accredited for method(s) Because the PFAS analytes are non-standard and no accreditation exists, a laboratory accreditation waiver will be obtained for this project.

QAPP: PFAS Statewide Survey Page 27 – April 2016
10.0 Quality Control Procedures
10.1 Table of field and lab quality control (QC) required Field QC procedures for measurements of temperature, pH, and conductivity will follow the SOPs listed in Section 8.1. Table 12 provides the laboratory QC procedures required for this study.
Table 12. Laboratory Quality Control Procedures.
Parameter Matrix Field Laboratory
Blanks Replicates LCS Method Blanks
Lab Duplicates Surrogates
PFAAs Tissue n/a n/a 1/batch 1/batch 1/batch each sample
PFAAs Water/effluent 1/batch 1/batch 1/batch 1/batch 1/batch each sample
PAPs Effluent 1/batch 1/batch 1/batch 1/batch 1/batch each sample
FTS Water/effluent 1/batch 1/batch 1/batch 1/batch 1/batch each sample
Precursors Water/effluent 1/batch 1/batch 1/batch 1/batch 1/batch each sample
Batch: 20 samples or fewer. LCS: laboratory control sample
10.2 Corrective action processes The project manager will work closely with the contract laboratory and the MEL QA Officer conducting the data review to examine data that fall outside of QC criteria. The project manager will determine whether data should be re-analyzed, rejected, or used with appropriate qualification. 11.0 Data Management Procedures
11.1 Data recording/reporting requirements All field data and observations will be recorded on waterproof paper kept in field notebooks. Staff will transfer information contained in field notebooks to Excel spreadsheets after they return from the field. Data entries will be independently verified for accuracy by another member of the project team. Field and laboratory data for the project will be entered into Ecology’s EIM system. Laboratory data will be uploaded into EIM using the EIM XML results template. All fish and osprey eggs collected under scientific collection permits will be reported to appropriate state and federal agencies following instructions in the permit.

QAPP: PFAS Statewide Survey Page 28 – April 2016
11.2 Laboratory data package requirements The contract laboratory will deliver a Tier 4 Level data package to MEL with the complete raw laboratory dataset. After reviewing the data package from the contract laboratory, MEL will provide case narratives to the project manager with the final qualified results and a description of the quality of the contract laboratory data. Case narratives should include any problems encountered with the analyses, corrective actions taken, changes to the referenced method, and an explanation of data qualifiers. Narratives will also address the condition of samples on receipt, sample preparation, methods of analysis, instrument calibration, and results of QC tests.
11.3 Electronic transfer requirements MEL will deliver case narratives in PDF format, and electronic data deliverables in an Excel spreadsheet format, to the project manager via email.
11.4 Acceptance criteria for existing data Data from the 2008 survey will be used if it met MQOs from the original QAPP and data quality was determined to be sufficient to meet the needs of the study.
11.5 EIM/STORET data upload procedures All result transmittals from laboratories must be provided in an electronic data deliverable (EDD) format that meets Ecology requirements for loading to Ecology’s Information Management (EIM) database. Data will be uploaded to Ecology EIM database following internal procedures. 12.0 Audits and Reports
12.1 Number, frequency, type, and schedule of audits MEL and contracted laboratories must participate in performance and system audits of their routine procedures. No audits are planned specifically for this project.
12.2 Responsible personnel Not applicable. No audits are planned for this study.

QAPP: PFAS Statewide Survey Page 29 – April 2016
12.3 Frequency and distribution of report A draft report of the study findings will be completed in July 2017 and a final report published on the internet in October 2017. The report will include, at a minimum, the following:
• Map showing all sampling locations and any other pertinent features of the study area. • Coordinates of each sampling site. • Description of field and laboratory methods. • Discussion of data quality and the significance of any problems encountered. • Summary tables of the chemical and physical data. • A qualitative comparison of 2016 PFAS results and the 2008 Study results. • PFAS concentrations relative to other studies in the U.S. • Recommendations for follow-up actions, based on study results.
Upon study completion, all project data will be entered into Ecology’s EIM system. Public access to electronic data and the final report for the study will be available through Ecology’s Internet homepage (www.ecy.wa.gov).
12.4 Responsibility for reports The project manager/principal investigator will be the lead responsible for the final report.
13.0 Data Verification
13.1 Field data verification, requirements, and responsibilities Field data verification will be conducted by the project manager.
13.2 Lab data verification Data verification involves examining the data for errors, omissions, and compliance with QC acceptance criteria. MEL’s SOPs for data reduction, review, and reporting will meet the needs of the project. Data packages will be assessed by MEL’s QA Officer using the EPA Functional Guidelines for Organic Data Review (EPA, 2014). MEL staff will provide a written report of their data review which will include a discussion of whether (1) MQOs were met, (2) proper analytical methods and protocols were followed, (3) calibrations and controls were within limits, and (4) data were consistent, correct, and complete, without errors or omissions. The principal investigator/project manager is responsible for the final acceptance of the project data. The complete data package, along with MEL’s written report, will be assessed for

QAPP: PFAS Statewide Survey Page 30 – April 2016
completeness and reasonableness. Based on these assessments, the data will either be accepted, accepted with qualifications, or rejected and re-analysis considered. Accuracy of data entered into EIM will be verified by someone other than the data engineer per the Environmental Assessment Program’s EIM data entry business rules.
13.3 Validation requirements, if necessary Independent data validation will not be required for this project.
14.0 Data Quality (Usability) Assessment
14.1 Process for determining whether project objectives have been met After the project data have been reviewed and verified, the principal investigator/project manager will determine if the data are of sufficient quality to make determinations and decisions for which the study was conducted. The data from the laboratory’s QC procedures will provide information to determine if MQOs have been met. Laboratory and QA staff familiar with assessment of data quality may be consulted. The project final report will discuss data quality and whether the project objectives were met. If limitations in the data are identified, they will be noted. Some analytes will be reported near the detection capability of the selected methods. MQOs may be difficult to achieve for these results. MEL’s SOP for data qualification and best professional judgment will be used in the final determination of whether to accept, reject, or accept the results with qualification. The assessment will be based on a review of laboratory QC results. This will include assessment of laboratory precision, contamination (blanks), accuracy, matrix interferences, and the success of laboratory QC samples meeting MQOs.
14.2 Data analysis and presentation methods A summary of the data will be presented in the final report. PFAS concentrations will be qualitatively compared to results from the 2008 study. The limited number of samples analyzed in 2008 prohibits a statistical analysis of differences between the years. See Section 12.3 for more information on how the data will be presented.
14.3 Treatment of non-detects Laboratory data will be reported down to the method detection limit, with an associated “U” or “UJ” qualifier for non-detects. Statistical tests requiring substitution for non-detects will not be included in the published report. Summed values will include only detected concentrations.

QAPP: PFAS Statewide Survey Page 31 – April 2016
14.4 Sampling design evaluation The number and type of samples collected will be sufficient to meet the objectives of this project.
14.5 Documentation of assessment Documentation of assessment will occur in the final report.
15.0 References
Buck, J., 2008. Protocol for Bird Egg, Collection, Measurement, Preparation, and Shipment for Contaminant Residue Analysis. U.S. Fish and Wildlife Service, Portland, OR. SOP-F003. Butt, C.M., D.C.G. Muir, and S.A. Mabury, 2014. Biotransformation pathways of fluorotelomer-based polyfluoroalkyl substances: A review. Environmental Toxicology and Chemistry, Vol. 33: 243-267. C8 Science Panel, 2013. http://www.c8sciencepanel.org/index.html. D’Eon, J.C., P.W. Crozier, V.I. Furdui, E.J. Reiner, E.L. Libelo, and S.A. Mabury, 2009. Observation of a Commercial Fluorinated Material, the Polyfluoroalkyl Phosphoric Acid Diesters, in Human Sera, Wastewater Treatment Plan Sludge, and Paper Fibers. Environmental Science and Technology, Vol. 43: 4589-4594. De Silva, A.O., C.N. Allard, C. Spencer, G.M. Webster, and M. Shoeib, 2012. Phosphorus-Containing Fluorinated Organics: Polyfluoroalkyl Phosphoric Acid Diesters (diPAPs), Perfluorophosphonates (PFPAs), and Perfluorophosphinates (PFPIAs) in Residential Indoor Dust. Environmental Science and Technology, Vol. 46: 12575-12582. Dinglasan-Panlilio, M.J., S.S. Prakash, and J.E. Baker, 2014. Perfluorinated compounds in the surface waters of Puget Sound, Washington and Clayoquot and Barkley Sounds, British Columbia. Marine Pollution Bulletin, Vol. 78: 173-180. Dutch, M., S. Weakland, V. Partridge, and K. Welch, 2014. Pharmaceuticals, Personal Care Products, and Perfluoroalkyl Substances in Elliott Bay Sediments: 2013 Data Summary. Washington State Department of Ecology, Olympia, WA. Publication No. 14-03-049. https://fortress.wa.gov/ecy/publications/SummaryPages/1403049.html Ecology and Herrera, 2010. Control of Toxic Chemicals in Puget Sound - Summary Technical Report for Phase 3: Loadings from POTW Discharge of Treated Wastewater. Washington State Department of Ecology, Olympia, WA. Publication No. 10-10-057. https://fortress.wa.gov/ecy/publications/SummaryPages/1010057.html

QAPP: PFAS Statewide Survey Page 32 – April 2016
Environment Canada, 2013. Perfluorooctane sulfonates in the Canadian Environment: Draft Federal Environmental Quality Guidelines for PFOS. Available at https://www.ec.gc.ca/toxiques-toxics/default.asp?lang=En&n=7331A46C-1&offset=3&toc=show. EPA, 2009. Long-Chain Perfluorinated Chemicals (PFCs) Action Plan. U.S. Environmental Protection Agency. https://www.epa.gov/sites/production/files/2016-01/documents/pfcs_action_plan1230_09.pdf EPA, 2014. National Functional Guidelines for Superfund Organic Methods Data Review. U.S. Environmental Protection Agency, Office of Superfund Remediation and Technology Innovation, Washington, DC. Publication Number EPA-540-R-014-002. Eriksson, U. and A. Karrman, 2015. World-Wide Indoor Exposure to Polyfluoroalkyl Phosphate Esters (PAPs) and other PFASs in Household Dust. Environmental Science and Technology, Vol. 49: 14503-14511. Friese, M., 2014. Standard Operating Procedures for Decontaminating Field Equipment for Sampling Toxics in the Environment Version 1.0. Washington State Department of Ecology, Olympia, WA. SOP EAP090. http://www.ecy.wa.gov/programs/eap/quality.html Furl, C. and C. Meredith, 2010. Perfluorinated Compounds in Washington Rivers and Lakes. Washington State Department of Ecology, Olympia, WA. Publication No. 10-03-034. https://fortress.wa.gov/ecy/publications/summarypages/1003034.html Herzke, D., E. Olsson, and S. Posner, 2012. Perfluoroalkyl substances (PFASs) in consumer products in Norway – A pilot study. Chemosphere, Vol. 88: 980-987. Johnson, A. and M. Friese, 2012. PBTs Analyzed in Bottom Fish from Four Washington Rivers and Lakes: Hexabromocyclododecane, Tetrabromobisphenol A, Chlorinated Paraffins, Polybrominated Diphenylethers, Polychlorinated Naphthalenes, Perfluorinated Organic Compounds, Lead, and Cadmium. Washington State Department of Ecology, Olympia, WA. Publication No. 12-03-042. https://fortress.wa.gov/ecy/publications/summarypages/1203042.html Joy, J., 2006. Standard Operating Procedure for Manually Obtaining Surface Water Samples. Washington State Department of Ecology, Olympia, WA. SOP Number EAP015. http://www.ecy.wa.gov/programs/eap/quality.html Lee, H., J. D’Eon, and S.A. Mabury, 2010. Biodegradation of Polyfluoroalkyl Phosphates as a Source of Perfluorinated Acids to the Environment. Environmental Science and Technology, Vol. 44: 3305-3310. Martin, J.W., S.A. Mabury, K.R. Solomon, and D.C.G. Muir, 2003. Bioconcentration and tissue distribution of perfluorinated acids in rainbow trout (Oncorhynchus mykiss). Environmental Toxicology and Chemistry, Vol. 22: 196-204.

QAPP: PFAS Statewide Survey Page 33 – April 2016
Mathieu, C., 2013. PBT Chemical Trends in Washington State Determined from Age-Dated Lake Sediment Cores, 2012 Sampling Results. Washington State Department of Ecology, Olympia, WA. Publication No. 13-03-036. https://fortress.wa.gov/ecy/publications/summarypages/1303036.html MDH, 2008. Minnesota Department of Health Fish Meal Advice Categories Based on Levels of PFOS in Fish. MDH Fish Consumption Advisory Program. Nakayama, S., M. Strynar, L. Helfant, P. Egeghy, X. Ye, and A. Lindstrom, 2007. Perfluorinated Compounds in the Cape Fear Drainage Basin in North Carolina. Environmental Science and Technology, Vol. 41: 5271-5276. Nipp, B., 2006. Standard Operating Procedures for Instantaneous Measurements of Temperature in Water. Washington State Department of Ecology, Olympia, WA. SOP EAP011. OECD, 2013. OECD/UNEP Global PFC Group, Synthesis Paper of per- and polyfluorinated chemicals (PFCs), Environment, Health and Safety, Environment Directorate, OECD. Parsons, Jenifer, Dave Hallock, Keith Seiders, Bill Ward, Chris Coffin, Evan Newell, Casey Deligeannis, and Kathy Welch, 2012. Standard Operating Procedures to Minimize the Spread of Invasive Species, Version 2.0 Washington State Department of Ecology, Olympia, WA. SOP EAP070. http://www.ecy.wa.gov/programs/eap/quality.html Pelletier, G., 1993. South Fork Palouse River Total Maximum Daily Load of Ammonia. Washington State Department of Ecology, Olympia, WA. Publication No. 93-e48. https://fortress.wa.gov/ecy/publications/summarypages/93e48.html Sandvik, P., 2014a. Standard Operating Procedure for Field Collection, Processing and Preservation of Finfish Samples at the Time of Collection in the Field, Version 1.1. Washington State Department of Ecology, Olympia, WA. SOP EAP009. http://www.ecy.wa.gov/programs/eap/quality.html Sandvik, P., 2014b. Standard Operating Procedure for Resecting Finfish Whole Body, Body Parts or Tissue Samples, Version 1.1. Washington State Department of Ecology, Olympia, WA. SOP EAP009. http://www.ecy.wa.gov/programs/eap/quality.html Schultz, M.M., D.F. Barofsky, and J.A. Field, 2004. Quantitative Determination of Fluorotelomer Sulfonates in Groundwater by LC MS/MS. Environmental Science and Technology, Vol. 38: 1828-1835. Sinclair, E., D. Mayack, K. Roblee, N. Yamashita, and K. Kannan, 2006. Occurrence of Perfluoroalkyl Surfactants in Water, Fish, and Birds from New York State. Archives of Environmental Contamination and Toxicology, Vol. 50: 398-410. Taniyasu, S., K. Kannan, Y. Horii, N. Hanari, and N. Yamashita, 2003. A Survey of Perfluorooctane Sulfonate and Related Perfluorinated Organic Compounds in Water, Fish, Birds, and Humans from Japan. Environmental Science and Technology, Vol. 37: 2634-2639.

QAPP: PFAS Statewide Survey Page 34 – April 2016
Ward, W., 2014a. Standard Operating Procedures for the Collection and Analysis of pH Samples, Version 1.4. Washington State Department of Ecology, Olympia, WA. SOP Number EAP031. http://www.ecy.wa.gov/programs/eap/quality.html Ward, W., 2014b. Standard Operating Procedures for the Collection and Analysis of Conductivity Samples, Version 2.2. Washington State Department of Ecology, Olympia, WA. SOP Number EAP032. http://www.ecy.wa.gov/programs/eap/quality.html

QAPP: PFAS Statewide Survey Page 35 – April 2016
16.0 Appendices

QAPP: PFAS Statewide Survey Page 36 – April 2016
Appendix A. Names of Target Fish Species Table A-1. Common and Scientific Names of Target Fish Species.
Abbreviation Common Name Scientific Name Family Name
CTT Cutthroat trout Oncorhynchus clarki Salmonidae
LMB Largemouth bass Micropterus salmoides Centrarchidae
LSS Largescale sucker Catostomus macrocheilus Catostomidae
MWF Mountain whitefish Prosopium williamsoni Salmonidae
PEA Peamouth Mylocheilus oregonensis Cyprinidae
PS Pumpkinseed Lepomis gibbosus Centrarchidae
RBT Rainbow trout Oncorhynchus mykiss Salmonidae
SMB Smallmouth bass Micropterus dolomieu Centrarchidae
TCH Tench Tinca tinca Cyprinidae
WAL Walleye Stizostedion vitreum Percidae
YP Yellow perch Perca flavescens Percidae

QAPP: PFAS Statewide Survey Page 37 – April 2016
Appendix B. Sampling Locations Table B-1. Surface Water and Fish Tissue Sampling Locations.
Waterbody County WRIA Surface Water Sampling
Location Location Description Latitude Longitude
Angle Lake King 9 47.428 -122.289 Centroid of lake at max depth (52').
FDR Lake Okanogan 53 47.948 -118.905 F.D.R. Lake, upstream of Grand Coulee Dam, RM 601.
Lake Meridian King 9 47.363 -122.154 Centroid of lake at max depth (90').
Lake Washington King 8 47.647 -122.302 Lake Washington, in Seattle, at Montlake Cut, East of University of Washington Marina.
Lower Columbia River Clark 28 45.695 -122.771 Lower Columbia River near Vancouver, RM 98.4.
McNary Dam (Columbia River) Benton 31 45.940 -119.297 Columbia River at McNary Dam near
Umatilla, OR, RM 292.
Moses Lake Grant 41 47.120 -119.339 Centroid of lake at max depth (36') of upper basin.
Nooksack River Whatcom 1 48.937 -122.442 Nooksack River near Lynden, RM 18.
Puyallup River Pierce 10 47.198 -122.264 Puyallup River at Sumner, RM 10.
Quinault River Jefferson 21 47.533 -123.679 Quinault River in Olympic National Park, RM 47.
Snohomish River Snohomish 7 47.911 -122.099 Snohomish River at Snohomish, behind visitor's center. RM 12.5.
South Fork Palouse River Whitman 34 46.760 -117.225 South Fork Palouse River at Armstrong Rd, 2.8 miles northwest of Pullman.
Spokane River at Nine Mile Spokane 54 47.775 -117.545 Upstream side of Spokane River's Nine Mile Dam, RM 58.1.
Upper Columbia River Stevens 61 48.922 -117.774 Upper Columbia River at Northport, WA, near Canadian border. RM 735.
West Medical Lake Spokane 43 47.579 -117.712 West Medical Lake near Medical Lake.
WRIA: Water Resource Inventory Area RM: river mile

QAPP: PFAS Statewide Survey Page 38 – April 2016
Table B-2. Wastewater Treatment Plant Effluent Sampling Locations.
Wastewater Treatment Plant Location Description Latitude Longitude
Marine Park (Vancouver)
Marine Park Wastewater Treatment Facility Effluent (Vancouver, WA); discharges to Lower Columbia River. 45.610 -122.618
Pullman City of Pullman Wastewater Treatment Plant; discharges to South Fork Palouse River. 46.739 -117.191
Spokane (Riverside Park)
City of Spokane Wastewater Treatment Plant Effluent; discharges to Spokane River. 47.694 -117.472
Sumner City of Sumner Wastewater Treatment Facility; discharges to White River upstream of confluence with Puyallup River. 47.200 -122.255
West Medical Lake City of Medical Lake Reclaimed Water Facility Effluent; discharges reclaimed water to West Medical Lake. 47.567 -117.703

QAPP: PFAS Statewide Survey Page 39 – April 2016
Appendix C. Acronyms, Abbreviations, and Glossary Acronyms and Abbreviations AFFF aqueous film forming foam DOH Department of Health Ecology Washington State Department of Ecology e.g. For example EIM Environmental Information Management database EPA U.S. Environmental Protection Agency et al. And others FTS fluorotelomer sulfonate GPS Global Positioning System HDPE high density polyethylene MEL Manchester Environmental Laboratory MQO Measurement quality objective NOAA National Oceanic and Atmospheric Administration PAP polyfluoroalkyl phosphate PBTs persistent, bioaccumulative, and toxic chemicals PFAA perfluoroalkyl acid PFAS per- and poly-fluoroalkyl substance QA Quality assurance QC Quality Control RM River mile RPD Relative percent difference SOP Standard operating procedures USFS United States Forest Service WAC Washington Administrative Code WDFW Washington Department of Fish and Wildlife WRIA Water Resource Inventory Area WWTP Wastewater treatment plant Units of Measurement °C degrees centigrade g gram mm millimeter ng/g nanograms per gram (parts per billion) ng/Kg nanograms per kilogram (parts per trillion) ng/L nanograms per liter (parts per trillion) ww wet weight

QAPP: PFAS Statewide Survey Page 40 – April 2016
Quality Assurance Glossary Accreditation: A certification process for laboratories, designed to evaluate and document a lab’s ability to perform analytical methods and produce acceptable data. For Ecology, it is “Formal recognition by (Ecology)…that an environmental laboratory is capable of producing accurate analytical data.” [WAC 173-50-040] (Kammin, 2010) Accuracy: The degree to which a measured value agrees with the true value of the measured property. USEPA recommends that this term not be used, and that the terms precision and bias be used to convey the information associated with the term accuracy. (USGS, 1998) Analyte: An element, ion, compound, or chemical moiety (pH, alkalinity) which is to be determined. The definition can be expanded to include organisms, e.g., fecal coliform, Klebsiella. (Kammin, 2010) Bias: The difference between the population mean and the true value. Bias usually describes a systematic difference reproducible over time, and is characteristic of both the measurement system, and the analyte(s) being measured. Bias is a commonly used data quality indicator (DQI). (Kammin, 2010; Ecology, 2004) Blank: A synthetic sample, free of the analyte(s) of interest. For example, in water analysis, pure water is used for the blank. In chemical analysis, a blank is used to estimate the analytical response to all factors other than the analyte in the sample. In general, blanks are used to assess possible contamination or inadvertent introduction of analyte during various stages of the sampling and analytical process. (USGS, 1998) Calibration: The process of establishing the relationship between the response of a measurement system and the concentration of the parameter being measured. (Ecology, 2004) Check standard: A substance or reference material obtained from a source independent from the source of the calibration standard; used to assess bias for an analytical method. This is an obsolete term, and its use is highly discouraged. See Calibration Verification Standards, Lab Control Samples (LCS), Certified Reference Materials (CRM), and/or spiked blanks. These are all check standards, but should be referred to by their actual designator, e.g., CRM, LCS. (Kammin, 2010; Ecology, 2004) Comparability: The degree to which different methods, data sets and/or decisions agree or can be represented as similar; a data quality indicator. (USEPA, 1997) Completeness: The amount of valid data obtained from a project compared to the planned amount. Usually expressed as a percentage. A data quality indicator. (USEPA, 1997) Continuing Calibration Verification Standard (CCV): A QC sample analyzed with samples to check for acceptable bias in the measurement system. The CCV is usually a midpoint calibration standard that is re-run at an established frequency during the course of an analytical run. (Kammin, 2010)

QAPP: PFAS Statewide Survey Page 41 – April 2016
Control chart: A graphical representation of quality control results demonstrating the performance of an aspect of a measurement system. (Kammin, 2010; Ecology 2004) Control limits: Statistical warning and action limits calculated based on control charts. Warning limits are generally set at +/- 2 standard deviations from the mean, action limits at +/- 3 standard deviations from the mean. (Kammin, 2010) Data Integrity: A qualitative DQI that evaluates the extent to which a data set contains data that is misrepresented, falsified, or deliberately misleading. (Kammin, 2010) Data Quality Indicators (DQI): Commonly used measures of acceptability for environmental data. The principal DQIs are precision, bias, representativeness, comparability, completeness, sensitivity, and integrity. (USEPA, 2006) Data Quality Objectives (DQO): Qualitative and quantitative statements derived from systematic planning processes that clarify study objectives, define the appropriate type of data, and specify tolerable levels of potential decision errors that will be used as the basis for establishing the quality and quantity of data needed to support decisions. (USEPA, 2006) Data set: A grouping of samples organized by date, time, analyte, etc. (Kammin, 2010) Data validation: An analyte-specific and sample-specific process that extends the evaluation of data beyond data verification to determine the usability of a specific data set. It involves a detailed examination of the data package, using both professional judgment, and objective criteria, to determine whether the MQOs for precision, bias, and sensitivity have been met. It may also include an assessment of completeness, representativeness, comparability and integrity, as these criteria relate to the usability of the data set. Ecology considers four key criteria to determine if data validation has actually occurred. These are: • Use of raw or instrument data for evaluation. • Use of third-party assessors. • Data set is complex. • Use of EPA Functional Guidelines or equivalent for review. Examples of data types commonly validated would be: • Gas Chromatography (GC). • Gas Chromatography-Mass Spectrometry (GC-MS). • Inductively Coupled Plasma (ICP). The end result of a formal validation process is a determination of usability that assigns qualifiers to indicate usability status for every measurement result. These qualifiers include: • No qualifier, data is usable for intended purposes. • J (or a J variant), data is estimated, may be usable, may be biased high or low. • REJ, data is rejected, cannot be used for intended purposes (Kammin, 2010; Ecology, 2004).

QAPP: PFAS Statewide Survey Page 42 – April 2016
Data verification: Examination of a data set for errors or omissions, and assessment of the Data Quality Indicators related to that data set for compliance with acceptance criteria (MQOs). Verification is a detailed quality review of a data set. (Ecology, 2004) Detection limit (limit of detection): The concentration or amount of an analyte which can be determined to a specified level of certainty to be greater than zero. (Ecology, 2004) Duplicate samples: Two samples taken from and representative of the same population, and carried through and steps of the sampling and analytical procedures in an identical manner. Duplicate samples are used to assess variability of all method activities including sampling and analysis. (USEPA, 1997) Field blank: A blank used to obtain information on contamination introduced during sample collection, storage, and transport. (Ecology, 2004) Initial Calibration Verification Standard (ICV): A QC sample prepared independently of calibration standards and analyzed along with the samples to check for acceptable bias in the measurement system. The ICV is analyzed prior to the analysis of any samples. (Kammin, 2010) Laboratory Control Sample (LCS): A sample of known composition prepared using contaminant-free water or an inert solid that is spiked with analytes of interest at the midpoint of the calibration curve or at the level of concern. It is prepared and analyzed in the same batch of regular samples using the same sample preparation method, reagents, and analytical methods employed for regular samples. (USEPA, 1997) Matrix spike: A QC sample prepared by adding a known amount of the target analyte(s) to an aliquot of a sample to check for bias due to interference or matrix effects. (Ecology, 2004) Measurement Quality Objectives (MQOs): Performance or acceptance criteria for individual data quality indicators, usually including precision, bias, sensitivity, completeness, comparability, and representativeness. (USEPA, 2006) Measurement result: A value obtained by performing the procedure described in a method. (Ecology, 2004) Method: A formalized group of procedures and techniques for performing an activity (e.g., sampling, chemical analysis, data analysis), systematically presented in the order in which they are to be executed. (EPA, 1997) Method blank: A blank prepared to represent the sample matrix, prepared and analyzed with a batch of samples. A method blank will contain all reagents used in the preparation of a sample, and the same preparation process is used for the method blank and samples. (Ecology, 2004; Kammin, 2010) Method Detection Limit (MDL): This definition for detection was first formally advanced in 40CFR 136, October 26, 1984 edition. MDL is defined there as the minimum concentration of

QAPP: PFAS Statewide Survey Page 43 – April 2016
an analyte that, in a given matrix and with a specific method, has a 99% probability of being identified, and reported to be greater than zero. (Federal Register, October 26, 1984) Percent Relative Standard Deviation (%RSD): A statistic used to evaluate precision in environmental analysis. It is determined in the following manner:
%RSD = (100 * s)/x where s is the sample standard deviation and x is the mean of results from more than two replicate samples (Kammin, 2010) Parameter: A specified characteristic of a population or sample. Also, an analyte or grouping of analytes. Benzene and nitrate + nitrite are all “parameters.” (Kammin, 2010; Ecology, 2004) Population: The hypothetical set of all possible observations of the type being investigated. (Ecology, 2004) Precision: The extent of random variability among replicate measurements of the same property; a data quality indicator. (USGS, 1998) Quality Assurance (QA): A set of activities designed to establish and document the reliability and usability of measurement data. (Kammin, 2010) Quality Assurance Project Plan (QAPP): A document that describes the objectives of a project, and the processes and activities necessary to develop data that will support those objectives. (Kammin, 2010; Ecology, 2004) Quality Control (QC): The routine application of measurement and statistical procedures to assess the accuracy of measurement data. (Ecology, 2004) Relative Percent Difference (RPD): RPD is commonly used to evaluate precision. The following formula is used:
[Abs(a-b)/((a + b)/2)] * 100 where “Abs()” is absolute value and a and b are results for the two replicate samples. RPD can be used only with 2 values. Percent Relative Standard Deviation is (%RSD) is used if there are results for more than 2 replicate samples (Ecology, 2004). Replicate samples: Two or more samples taken from the environment at the same time and place, using the same protocols. Replicates are used to estimate the random variability of the material sampled. (USGS, 1998) Representativeness: The degree to which a sample reflects the population from which it is taken; a data quality indicator. (USGS, 1998) Sample (field): A portion of a population (environmental entity) that is measured and assumed to represent the entire population. (USGS, 1998) Sample (statistical): A finite part or subset of a statistical population. (USEPA, 1997)

QAPP: PFAS Statewide Survey Page 44 – April 2016
Sensitivity: In general, denotes the rate at which the analytical response (e.g., absorbance, volume, meter reading) varies with the concentration of the parameter being determined. In a specialized sense, it has the same meaning as the detection limit. (Ecology, 2004) Spiked blank: A specified amount of reagent blank fortified with a known mass of the target analyte(s); usually used to assess the recovery efficiency of the method. (USEPA, 1997) Spiked sample: A sample prepared by adding a known mass of target analyte(s) to a specified amount of matrix sample for which an independent estimate of target analyte(s) concentration is available. Spiked samples can be used to determine the effect of the matrix on a method’s recovery efficiency. (USEPA, 1997) Split sample: A discrete sample that is further subdivided into portions, usually duplicates. (Kammin, 2010) Standard Operating Procedure (SOP): A document which describes in detail a reproducible and repeatable organized activity. (Kammin, 2010) Surrogate: For environmental chemistry, a surrogate is a substance with properties similar to those of the target analyte(s). Surrogates are unlikely to be native to environmental samples. They are added to environmental samples for quality control purposes, to track extraction efficiency and/or measure analyte recovery. Deuterated organic compounds are examples of surrogates commonly used in organic compound analysis. (Kammin, 2010) Systematic planning: A step-wise process which develops a clear description of the goals and objectives of a project, and produces decisions on the type, quantity, and quality of data that will be needed to meet those goals and objectives. The DQO process is a specialized type of systematic planning. (USEPA, 2006) References for QA Glossary Ecology, 2004. Guidance for the Preparation of Quality Assurance Project Plans for Environmental Studies. https://fortress.wa.gov/ecy/publications/SummaryPages/0403030.html Kammin, B., 2010. Definition developed or extensively edited by William Kammin, 2010. Washington State Department of Ecology, Olympia, WA. USEPA, 1997. Glossary of Quality Assurance Terms and Related Acronyms. U.S. Environmental Protection Agency. http://www.ecy.wa.gov/programs/eap/quality.html USEPA, 2006. Guidance on Systematic Planning Using the Data Quality Objectives Process EPA QA/G-4. U.S. Environmental Protection Agency. http://www.epa.gov/quality/qs-docs/g4-final.pdf USGS, 1998. Principles and Practices for Quality Assurance and Quality Control. Open-File Report 98-636. U.S. Geological Survey. http://ma.water.usgs.gov/fhwa/products/ofr98-636.pdf