qualitative comparative analysis using fuzzy sets · pdf file5 qualitative comparative...
TRANSCRIPT
5
Qualitative Comparative AnalysisUsing Fuzzy Sets (fsQCA)
Charles C. Ragin
After reading this chapter, you should be able to:
• Understand key differences between crisp set and fuzzy set logics
• Calibrate in an informed way the fuzzy-set membership scores for thedifferent conditions
• See the connection between the multidimensional vector spacedefined by fuzzy-set conditions and a conventional truth table
• Gain a deeper understanding of the fuzzy subset relationship and ofhow to calculate and evaluate its consistency
• Relate fuzzy subset relations to the concepts of causal sufficiency andnecessity
• Understand the different steps in a fuzzy-set analysis, especially theimportance of frequency thresholds and consistency thresholds whencreating a crisp truth table summarizing the results of multiple fuzzy-set analyses
Goals of This Chapter
One apparent limitation of the truth table approach is that it is designed forconditions that are simple presence/absence dichotomies (i.e., Boolean or“crisp” sets—see Chapter 3) or multichotomies (mvQCA—see Chapter 4).Many of the conditions that interest social scientists, however, vary by level ordegree. For example, while it is clear that some countries are democracies andsome are not, there is a broad range of in-between cases. These countries arenot fully in the set of democracies, nor are they fully excluded from this set.
87
05-Rihoux-45607:05-Rihoux-45607 7/18/2008 12:11 PM Page 87
Fortunately, there is a well-developedmathematical system for addressing par-tial membership in sets, fuzzy-set theory (Zadeh, 1965; Klir, Clair, & Yuan,1997). This chapter first provides a brief introduction to the fuzzy-setapproach, building on Ragin (2000). Fuzzy sets are especially powerfulbecause they allow researchers to calibrate partial membership in sets usingvalues in the interval between [0] (nonmembership) and [1] (full membership)without abandoning core set theoretic principles such as, for example, the sub-set relation. As Ragin (2000) demonstrates, the subset relation is central to theanalysis of causal complexity.
While fuzzy sets solve the problem of trying to force-fit cases into one oftwo categories (membership versus nonmembership in a set) or into one ofthree or four categories1 (mvQCA), they are not well suited for conventionaltruth table analysis. With fuzzy sets, there is no simple way to sort casesaccording to the combinations of conditions they display because each case’sarray of membership scores may be unique. Ragin (2000) circumvents thislimitation by developing an algorithm for analyzing configurations of fuzzy-set memberships that bypasses truth table analysis altogether. While this algo-rithm remains true to fuzzy-set theory through its use of the containment (orinclusion) rule, it forfeits many of the analytic strengths that follow fromanalyzing evidence in terms of truth tables. For example, truth tables are veryuseful for investigating “limited diversity” and the consequences of different“simplifying assumptions” that follow from using different subsets of “logicalremainders” to reduce complexity (see Chapters 3 and 4, and also Ragin, 1987,2008; Ragin & Sonnett, 2004). Analyses of this type are difficult when notusing truth tables as the starting point.
A further section of this chapter thus builds a bridge between fuzzy sets andtruth tables, demonstrating how to construct a conventional Boolean truth tablefrom fuzzy-set data. It is important to point out that this new technique takesfull advantage of the gradations in set membership central to the constitutionof fuzzy sets and is not predicated upon a dichotomization of fuzzy member-ship scores. To illustrate these procedures, the same data set is used as in theprevious chapters. However, the original interval-scale data are converted intofuzzy membership scores (which range from 0 to 1), thereby avoidingdichotomizing or trichotomizing the data (i.e., sorting the cases into crudecategories). Of course, the important qualitative states of full membership(fuzzy membership = 1.0) and full nonmembership (fuzzy membership = 0.0)are retained, which makes fuzzy sets simultaneously qualitative and quantita-tive. It is important to point out that the analytic approach sketched in thischapter offers a new way to conduct fuzzy-set analysis of social data. This new
88 CONFIGURATIONAL COMPARATIVE METHODS
05-Rihoux-45607:05-Rihoux-45607 7/18/2008 12:11 PM Page 88
analytic strategy is superior in several respects to the one sketched in Fuzzy-Set Social Science (Ragin, 2000). While both approaches have strengths andweaknesses, the one presented here uses the truth table as the key analyticdevice. As shall be demonstrated, a further advantage of the fuzzy-set truth-table approach is that it is more transparent. Thus, the researcher has moredirect control over the process of data analysis. This type of control is centralto the practice of case-oriented research.
FUZZY SETS: A BRIEF PRESENTATION
In many respects fuzzy sets are simultaneously qualitative and quantita-tive, for they incorporate both kinds of distinctions in the calibrationof degree of set membership. Thus, fuzzy sets have many of the virtuesof conventional interval-scale variables, especially their ability to makefine-grained distinctions, but at the same time they permit set theoreticoperations. Such operations are outside the scope of conventional variable-oriented analysis.
Fuzzy Sets Defined
As explained in Chapter 3, csQCA was developed originally for the analy-sis of configurations of crisp-set memberships (i.e., conventional Booleansets). With crisp sets, each case is assigned one of two possible membershipscores in each set included in a study: “1” (membership in the set) or “0” (non-membership in the set). In other words, an object or element (e.g., a country)within a domain (e.g., members of the United Nations) is either inor out of the various sets within this domain (e.g., membership in the UNSecurity Council). Crisp sets establish distinctions among cases that arewholly qualitative in nature (e.g., membership versus nonmembership in theUN Security Council).
Fuzzy sets extend crisp sets by permitting membership scores in the inter-val between [0] and [1]. For example, a country (e.g., the United States) mightreceive a membership score of [1] in the set of rich countries but a score ofonly 0.9 in the set of democratic countries, especially in the wake of the 2000presidential election. The basic idea behind fuzzy sets is to permit the scalingof membership scores and thus allow partial membership.
QUALITATIVE COMPARATIVE ANALYSIS USING FUZZY SETS (FSQCA) 89
05-Rihoux-45607:05-Rihoux-45607 7/18/2008 12:11 PM Page 89
90 CONFIGURATIONAL COMPARATIVE METHODS
Note that fuzzy set membership scores do not simply rank cases relative toeach other. Rather, fuzzy sets pinpoint qualitative states while at the same timeassessing varying degrees of membership between full inclusion and fullexclusion. In this sense, a fuzzy set can be seen as a continuous variable thathas been purposefully calibrated to indicate degree of membership in a well-defined set. Such calibration2 is possible only through the use of theoreticaland substantive knowledge, which is essential to the specification of the threequalitative breakpoints: full membership (1), full nonmembership (0), and thecrossover point, where there is maximum ambiguity regarding whether a caseis more “in” or more “out” of a set (0.5).
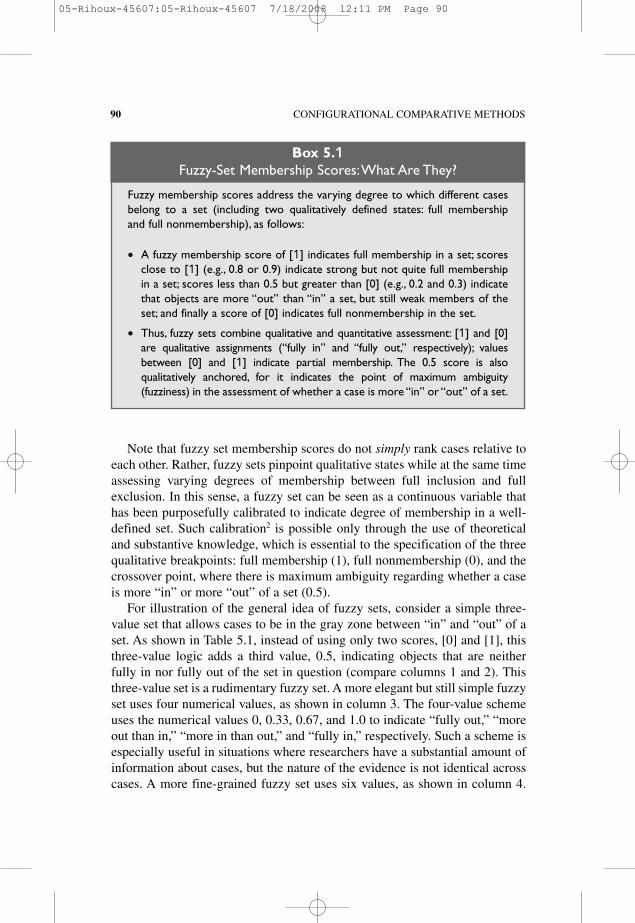
For illustration of the general idea of fuzzy sets, consider a simple three-value set that allows cases to be in the gray zone between “in” and “out” of aset. As shown in Table 5.1, instead of using only two scores, [0] and [1], thisthree-value logic adds a third value, 0.5, indicating objects that are neitherfully in nor fully out of the set in question (compare columns 1 and 2). Thisthree-value set is a rudimentary fuzzy set. A more elegant but still simple fuzzyset uses four numerical values, as shown in column 3. The four-value schemeuses the numerical values 0, 0.33, 0.67, and 1.0 to indicate “fully out,” “moreout than in,” “more in than out,” and “fully in,” respectively. Such a scheme isespecially useful in situations where researchers have a substantial amount ofinformation about cases, but the nature of the evidence is not identical acrosscases. A more fine-grained fuzzy set uses six values, as shown in column 4.
Fuzzy membership scores address the varying degree to which different casesbelong to a set (including two qualitatively defined states: full membershipand full nonmembership), as follows:
• A fuzzy membership score of [1] indicates full membership in a set; scoresclose to [1] (e.g., 0.8 or 0.9) indicate strong but not quite full membershipin a set; scores less than 0.5 but greater than [0] (e.g., 0.2 and 0.3) indicatethat objects are more “out” than “in” a set, but still weak members of theset; and finally a score of [0] indicates full nonmembership in the set.
• Thus, fuzzy sets combine qualitative and quantitative assessment: [1] and [0]are qualitative assignments (“fully in” and “fully out,” respectively); valuesbetween [0] and [1] indicate partial membership. The 0.5 score is alsoqualitatively anchored, for it indicates the point of maximum ambiguity(fuzziness) in the assessment of whether a case is more “in” or “out” of a set.
Box 5.1Fuzzy-Set Membership Scores:What Are They?
05-Rihoux-45607:05-Rihoux-45607 7/18/2008 12:11 PM Page 90
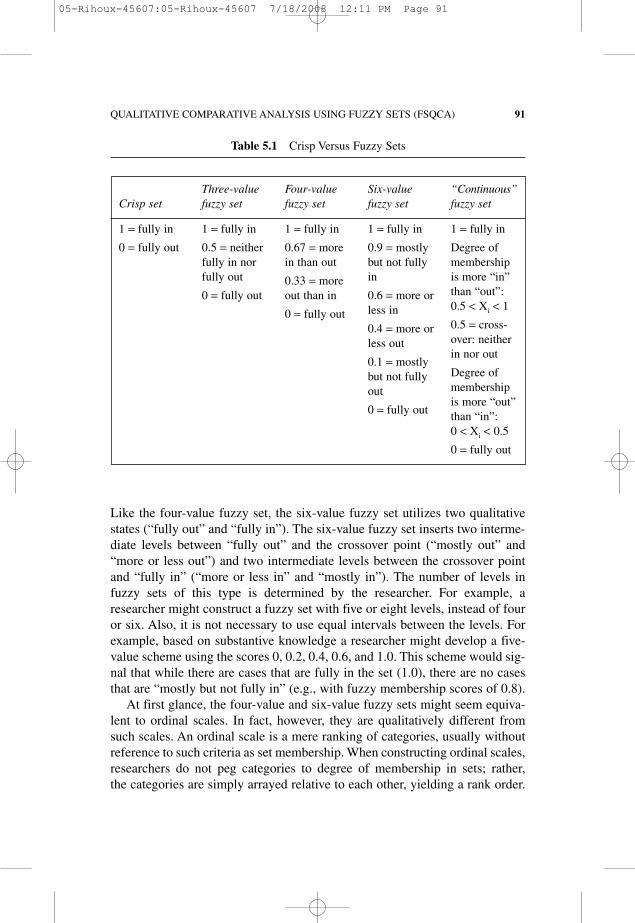
Like the four-value fuzzy set, the six-value fuzzy set utilizes two qualitativestates (“fully out” and “fully in”). The six-value fuzzy set inserts two interme-diate levels between “fully out” and the crossover point (“mostly out” and“more or less out”) and two intermediate levels between the crossover pointand “fully in” (“more or less in” and “mostly in”). The number of levels infuzzy sets of this type is determined by the researcher. For example, aresearcher might construct a fuzzy set with five or eight levels, instead of fouror six. Also, it is not necessary to use equal intervals between the levels. Forexample, based on substantive knowledge a researcher might develop a five-value scheme using the scores 0, 0.2, 0.4, 0.6, and 1.0. This scheme would sig-nal that while there are cases that are fully in the set (1.0), there are no casesthat are “mostly but not fully in” (e.g., with fuzzy membership scores of 0.8).
At first glance, the four-value and six-value fuzzy sets might seem equiva-lent to ordinal scales. In fact, however, they are qualitatively different fromsuch scales. An ordinal scale is a mere ranking of categories, usually withoutreference to such criteria as set membership.When constructing ordinal scales,researchers do not peg categories to degree of membership in sets; rather,the categories are simply arrayed relative to each other, yielding a rank order.
QUALITATIVE COMPARATIVE ANALYSIS USING FUZZY SETS (FSQCA) 91
Crisp set
1 = fully in
0 = fully out
Three-valuefuzzy set
1 = fully in
0.5 = neitherfully in norfully out
0 = fully out
Four-valuefuzzy set
1 = fully in
0.67 = morein than out
0.33 = moreout than in
0 = fully out
Six-valuefuzzy set
1 = fully in
0.9 = mostlybut not fullyin
0.6 = more orless in
0.4 = more orless out
0.1 = mostlybut not fullyout
0 = fully out
“Continuous”fuzzy set
1 = fully in
Degree ofmembershipis more “in”than “out”:0.5 < Xi < 1
0.5 = cross-over: neitherin nor out
Degree ofmembershipis more “out”than “in”:0 < Xi < 0.5
0 = fully out
Table 5.1 Crisp Versus Fuzzy Sets
05-Rihoux-45607:05-Rihoux-45607 7/18/2008 12:11 PM Page 91
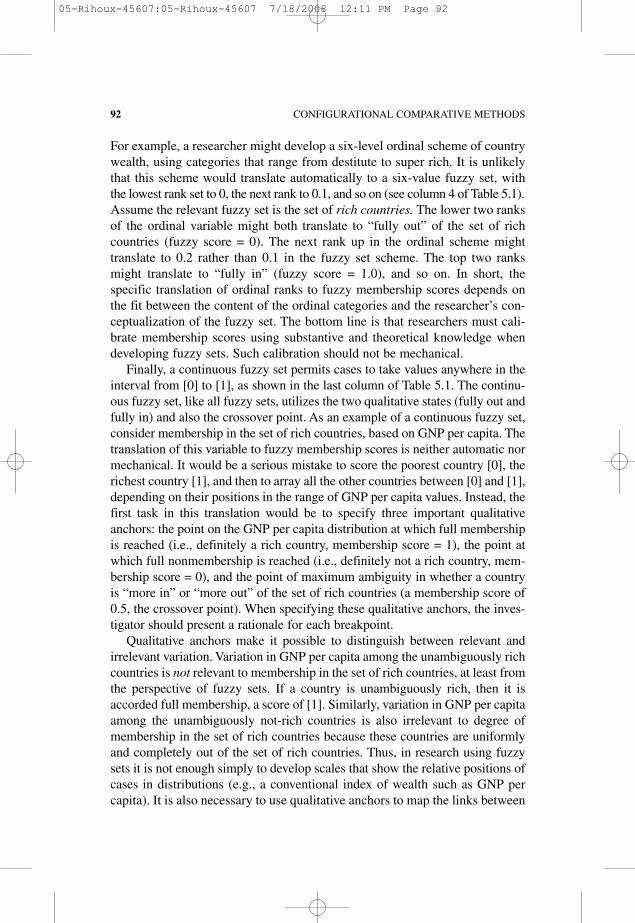
For example, a researcher might develop a six-level ordinal scheme of countrywealth, using categories that range from destitute to super rich. It is unlikelythat this scheme would translate automatically to a six-value fuzzy set, withthe lowest rank set to 0, the next rank to 0.1, and so on (see column 4 of Table 5.1).Assume the relevant fuzzy set is the set of rich countries. The lower two ranksof the ordinal variable might both translate to “fully out” of the set of richcountries (fuzzy score = 0). The next rank up in the ordinal scheme mighttranslate to 0.2 rather than 0.1 in the fuzzy set scheme. The top two ranksmight translate to “fully in” (fuzzy score = 1.0), and so on. In short, thespecific translation of ordinal ranks to fuzzy membership scores depends onthe fit between the content of the ordinal categories and the researcher’s con-ceptualization of the fuzzy set. The bottom line is that researchers must cali-brate membership scores using substantive and theoretical knowledge whendeveloping fuzzy sets. Such calibration should not be mechanical.
Finally, a continuous fuzzy set permits cases to take values anywhere in theinterval from [0] to [1], as shown in the last column of Table 5.1. The continu-ous fuzzy set, like all fuzzy sets, utilizes the two qualitative states (fully out andfully in) and also the crossover point. As an example of a continuous fuzzy set,consider membership in the set of rich countries, based on GNP per capita. Thetranslation of this variable to fuzzy membership scores is neither automatic normechanical. It would be a serious mistake to score the poorest country [0], therichest country [1], and then to array all the other countries between [0] and [1],depending on their positions in the range of GNP per capita values. Instead, thefirst task in this translation would be to specify three important qualitativeanchors: the point on the GNP per capita distribution at which full membershipis reached (i.e., definitely a rich country, membership score = 1), the point atwhich full nonmembership is reached (i.e., definitely not a rich country, mem-bership score = 0), and the point of maximum ambiguity in whether a countryis “more in” or “more out” of the set of rich countries (a membership score of0.5, the crossover point). When specifying these qualitative anchors, the inves-tigator should present a rationale for each breakpoint.
Qualitative anchors make it possible to distinguish between relevant andirrelevant variation. Variation in GNP per capita among the unambiguously richcountries is not relevant to membership in the set of rich countries, at least fromthe perspective of fuzzy sets. If a country is unambiguously rich, then it isaccorded full membership, a score of [1]. Similarly, variation in GNP per capitaamong the unambiguously not-rich countries is also irrelevant to degree ofmembership in the set of rich countries because these countries are uniformlyand completely out of the set of rich countries. Thus, in research using fuzzysets it is not enough simply to develop scales that show the relative positions ofcases in distributions (e.g., a conventional index of wealth such as GNP percapita). It is also necessary to use qualitative anchors to map the links between
92 CONFIGURATIONAL COMPARATIVE METHODS
05-Rihoux-45607:05-Rihoux-45607 7/18/2008 12:11 PM Page 92
QUALITATIVE COMPARATIVE ANALYSIS USING FUZZY SETS (FSQCA) 93
specific scores on continuous variables (e.g., an index of wealth) and fuzzy setmembership (see Ragin, 2008).
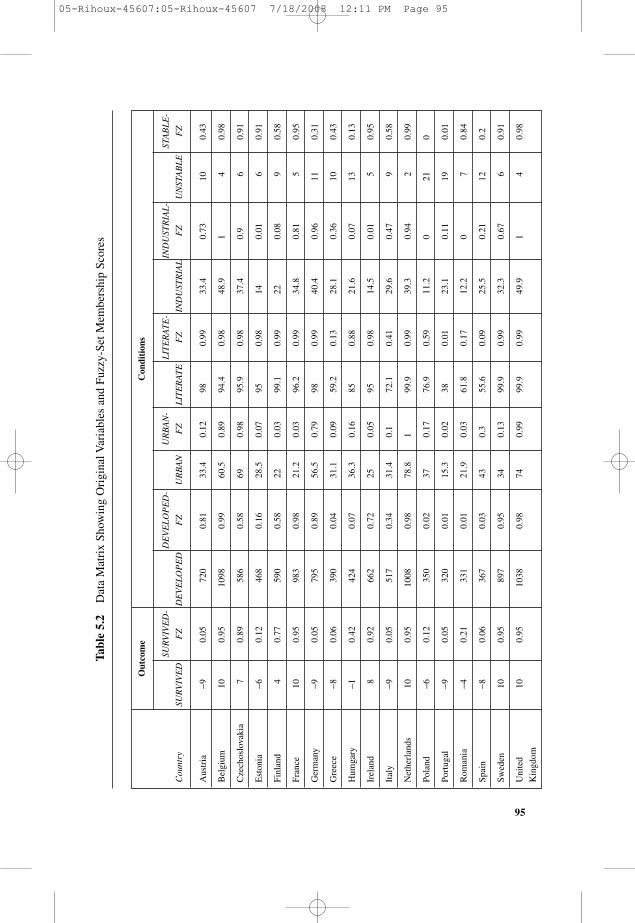
In a fuzzy-set analysis both the outcome and the conditions are representedusing fuzzy sets. Crisp sets also may be included among the causal conditions.Table 5.2 shows a simple data matrix containing fuzzy membership scores.The data are the same used in the two previous chapters and show the five con-ditions relevant to the breakdown/survival of democracy in inter-war Europe(see Table 3.5).
In this example, the outcome of interest is the degree of membership in theset of countries with democracies that survived the many economic and politi-cal upheavals of this period (SURVIVED). Degree of membership in the set ofcountries experiencing democratic breakdown (BREAKDOWN) is simply thenegation of degree of membership in SURVIVED (see discussion of negationbelow). The conditions are degrees of membership in the set of developedcountries (DEVELOPED), of urbanized countries (URBAN), of industrializedcountries (INDUSTRIAL), of literate countries (LITERATE), and of countriesthat experienced political instability during this period (UNSTABLE; the fuzzyscores for this condition have been reversed so that they indicate stability ratherthan instability). The table shows both the original data (interval-scale values orratings) and the corresponding fuzzy membership scores (denoted with “FZ”suffixes). The fuzzy membership scores were calibrated using a proceduredetailed in Ragin (2008). The original interval-scale data were rescaled to fitthe fuzzy-set metric using the FSQCA software (see Ragin, 2008). For thecrossover point (fuzzy membership = 0.50), these fuzzy sets use the same valueselected for dichotomizing these conditions in Chapter 3, including the revisedvalue for the development indicator (a GNP/capita of $550 instead of $600).
Similarly with dichotomization in csQCA (see Box 3.3) and thresholds settingin mvQCA (see Box 4.4), the calibration of fuzzy sets is a key operation, to beperformed with great care. Some good practices—for example, being trans-parent or justifying the cutoff points on substantive and/or theoreticalgrounds—are common to all three operations. Here are some specific goodpractices for the calibration of fuzzy sets:
• Carefully identify and define the target category using set theoretic language (e.g.,the set of“less developed countries” or the set of“more urbanized countries”).
Box 5.2“Good Practices” (9): Specific to the Calibration of Fuzzy Sets
(Continued)
05-Rihoux-45607:05-Rihoux-45607 7/18/2008 12:11 PM Page 93
94 CONFIGURATIONAL COMPARATIVE METHODS
Operations on Fuzzy Sets
There are three common operations on fuzzy sets: negation, logical and,and logical or. These three operations provide important background knowl-edge for understanding how to work with fuzzy sets.
Negation
Like conventional crisp sets, fuzzy sets can be negated. With crisp sets,negation switches membership scores from [1] to [0] and from [0] to [1]. Thenegation of the crisp set of democracies that survived, for example, is the crispset of democracies that collapsed. This simple mathematical principle holds infuzzy algebra as well, but the relevant numerical values are not restricted to theBoolean values [0] and [1]; instead, they extend to values between [0] and [1].
To calculate the membership of a case in the negation of fuzzy set A (i.e.,not-A), simply subtract its membership in set A from [1], as follows:
(membership in set not-A) = [1] – (membership in set A)
or
~A = [1] – A
(The tilde sign [“~”] is used to indicate negation.)
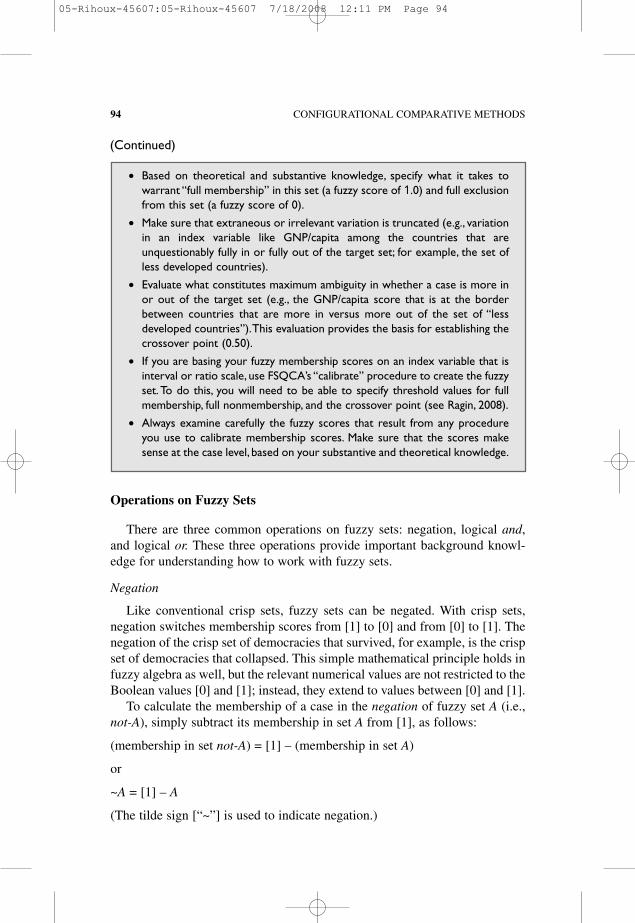
• Based on theoretical and substantive knowledge, specify what it takes towarrant “full membership” in this set (a fuzzy score of 1.0) and full exclusionfrom this set (a fuzzy score of 0).
• Make sure that extraneous or irrelevant variation is truncated (e.g., variationin an index variable like GNP/capita among the countries that areunquestionably fully in or fully out of the target set; for example, the set ofless developed countries).
• Evaluate what constitutes maximum ambiguity in whether a case is more inor out of the target set (e.g., the GNP/capita score that is at the borderbetween countries that are more in versus more out of the set of “lessdeveloped countries”).This evaluation provides the basis for establishing thecrossover point (0.50).
• If you are basing your fuzzy membership scores on an index variable that isinterval or ratio scale, use FSQCA’s “calibrate” procedure to create the fuzzyset. To do this, you will need to be able to specify threshold values for fullmembership, full nonmembership, and the crossover point (see Ragin, 2008).
• Always examine carefully the fuzzy scores that result from any procedureyou use to calibrate membership scores. Make sure that the scores makesense at the case level, based on your substantive and theoretical knowledge.
(Continued)
05-Rihoux-45607:05-Rihoux-45607 7/18/2008 12:11 PM Page 94
95
Table5.2
DataMatrixShow
ingOriginalV
ariablesandFuzzy-SetM
embershipScores
Outcome
Conditions
SURVIVED-
DEVELOPED-
URBAN-
LITERATE-
INDUSTRIAL-
STABLE-
Country
SURVIVED
FZ
DEVELOPED
FZ
URBAN
FZ
LITERATE
FZ
INDUSTRIAL
FZ
UNSTABLE
FZ
Austria
−90.05
720
0.81
33.4
0.12
980.99
33.4
0.73
100.43
Belgium
100.95
1098
0.99
60.5
0.89
94.4
0.98
48.9
14
0.98
Czechoslovakia
70.89
586
0.58
690.98
95.9
0.98
37.4
0.9
60.91
Estonia
−60.12
468
0.16
28.5
0.07
950.98
140.01
60.91
Finland
40.77
590
0.58
220.03
99.1
0.99
220.08
90.58
France
100.95
983
0.98
21.2
0.03
96.2
0.99
34.8
0.81
50.95
Germany
−90.05
795
0.89
56.5
0.79
980.99
40.4
0.96
110.31
Greece
−80.06
390
0.04
31.1
0.09
59.2
0.13
28.1
0.36
100.43
Hum
gary
−10.42
424
0.07
36.3
0.16
850.88
21.6
0.07
130.13
Ireland
80.92
662
0.72
250.05
950.98
14.5
0.01
50.95
Italy
−90.05
517
0.34
31.4
0.1
72.1
0.41
29.6
0.47
90.58
Netherlands
100.95
1008
0.98
78.8
199.9
0.99
39.3
0.94
20.99
Poland
−60.12
350
0.02
370.17
76.9
0.59
11.2
021
0
Portugal
−90.05
320
0.01
15.3
0.02
380.01
23.1
0.11
190.01
Rom
ania
−40.21
331
0.01
21.9
0.03
61.8
0.17
12.2
07
0.84
Spain
−80.06
367
0.03
430.3
55.6
0.09
25.5
0.21
120.2
Sweden
100.95
897
0.95
340.13
99.9
0.99
32.3
0.67
60.91
United
100.95
1038
0.98
740.99
99.9
0.99
49.9
14
0.98
Kingdom
05-Rihoux-45607:05-Rihoux-45607 7/18/2008 12:11 PM Page 95
Thus, for example, Finland has a membership score of 0.77 in SURVIVED;therefore, its degree of membership in BREAKDOWN is 0.23. That is,Finland is more out than in the set of democracies that collapsed.
Logical AND
Compound sets are formed when two or more sets are combined, an oper-ation commonly known as set intersection. A researcher interested in the fateof democratic institutions in relatively inhospitable settings might want todraw up a list of countries that combine being “democratic” with being “poor.”Conventionally, these countries would be identified using crisp sets by cross-tabulating the two dichotomies, poor versus not-poor and democratic versusnot-democratic, and seeing which countries are in the democratic/poor cell ofthis 2 x 2 table. This cell, in effect, shows the cases that exist in the intersec-tion of the two crisp sets.
With fuzzy sets, logical AND is accomplished by taking the minimummembership score of each case in the sets that are combined. The minimummembership score, in effect, indicates degree of membership of a case in acombination of sets. Its use follows “weakest link” reasoning. For example, ifa country’s membership in the set of poor countries is 0.7 and its membershipin the set of democratic countries is 0.9, its membership in the set of countriesthat are both poor and democratic is the smaller of these two scores, 0.7.A score of 0.7 indicates that this case is more in than out of the intersection.
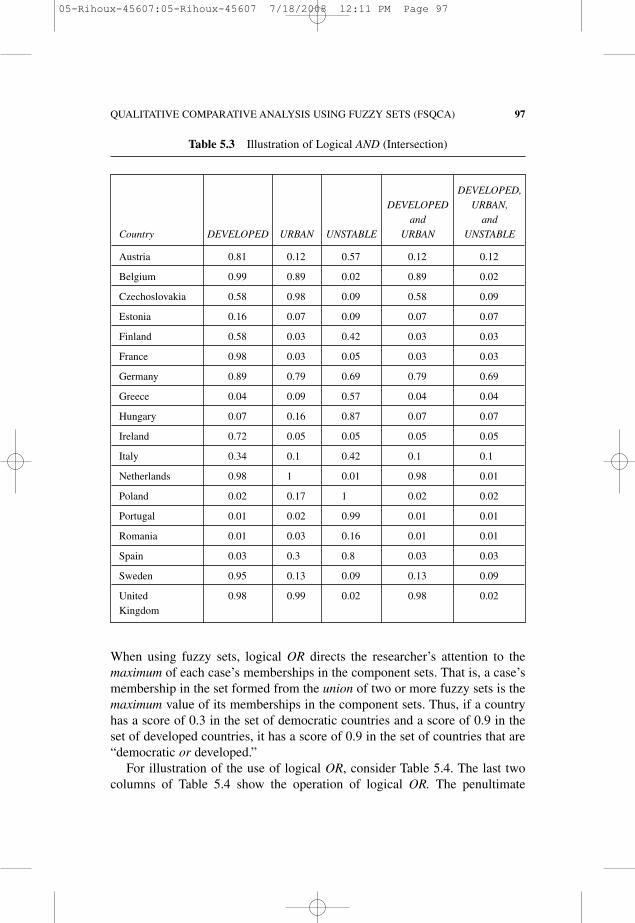
For further illustration of this principle, consider Table 5.3. The last twocolumns demonstrate the operation of logical AND. The penultimate columnshows the intersection of DEVELOPED and URBAN, yielding membership inthe set of countries that combine these two traits. Notice that some countries(e.g., France and Sweden) with high membership in DEVELOPED but lowmembership in URBAN have low scores in the intersection of these two sets.The last column shows the intersection of DEVELOPED, URBAN, andUNSTABLE (the negation of STABLE). Note that only one country in inter-war Europe, Germany, had a high score in this combination. In general, asmore sets are added to a combination of conditions, membership scores eitherstay the same or decrease. For each intersection, the lowest membership scoreprovides the degree of membership in the combination.
Logical OR
Two or more sets also can be joined through logical OR—the union of sets.For example, a researcher might be interested in countries that are “developed”or “democratic” based on the conjecture that these two conditions might offerequivalent bases for some outcome (e.g., bureaucracy-laden government).
96 CONFIGURATIONAL COMPARATIVE METHODS
05-Rihoux-45607:05-Rihoux-45607 7/18/2008 12:11 PM Page 96
When using fuzzy sets, logical OR directs the researcher’s attention to themaximum of each case’s memberships in the component sets. That is, a case’smembership in the set formed from the union of two or more fuzzy sets is themaximum value of its memberships in the component sets. Thus, if a countryhas a score of 0.3 in the set of democratic countries and a score of 0.9 in theset of developed countries, it has a score of 0.9 in the set of countries that are“democratic or developed.”
For illustration of the use of logical OR, consider Table 5.4. The last twocolumns of Table 5.4 show the operation of logical OR. The penultimate
QUALITATIVE COMPARATIVE ANALYSIS USING FUZZY SETS (FSQCA) 97
Table 5.3 Illustration of Logical AND (Intersection)
DEVELOPED,DEVELOPED URBAN,
and andCountry DEVELOPED URBAN UNSTABLE URBAN UNSTABLE
Austria 0.81 0.12 0.57 0.12 0.12
Belgium 0.99 0.89 0.02 0.89 0.02
Czechoslovakia 0.58 0.98 0.09 0.58 0.09
Estonia 0.16 0.07 0.09 0.07 0.07
Finland 0.58 0.03 0.42 0.03 0.03
France 0.98 0.03 0.05 0.03 0.03
Germany 0.89 0.79 0.69 0.79 0.69
Greece 0.04 0.09 0.57 0.04 0.04
Hungary 0.07 0.16 0.87 0.07 0.07
Ireland 0.72 0.05 0.05 0.05 0.05
Italy 0.34 0.1 0.42 0.1 0.1
Netherlands 0.98 1 0.01 0.98 0.01
Poland 0.02 0.17 1 0.02 0.02
Portugal 0.01 0.02 0.99 0.01 0.01
Romania 0.01 0.03 0.16 0.01 0.01
Spain 0.03 0.3 0.8 0.03 0.03
Sweden 0.95 0.13 0.09 0.13 0.09
United 0.98 0.99 0.02 0.98 0.02Kingdom
05-Rihoux-45607:05-Rihoux-45607 7/18/2008 12:11 PM Page 97
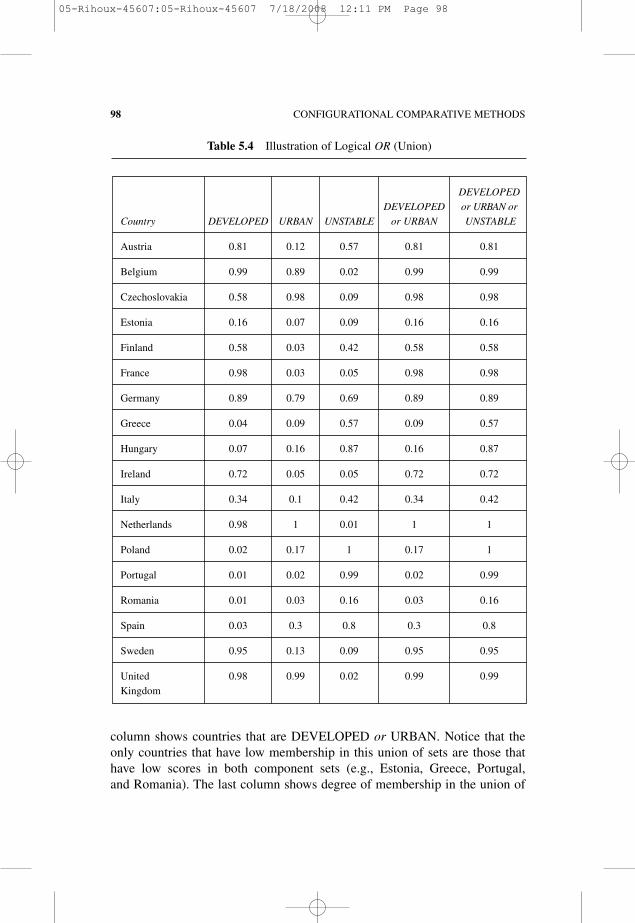
column shows countries that are DEVELOPED or URBAN. Notice that theonly countries that have low membership in this union of sets are those thathave low scores in both component sets (e.g., Estonia, Greece, Portugal,and Romania). The last column shows degree of membership in the union of
98 CONFIGURATIONAL COMPARATIVE METHODS
Table 5.4 Illustration of Logical OR (Union)
DEVELOPEDDEVELOPED or URBAN or
Country DEVELOPED URBAN UNSTABLE or URBAN UNSTABLE
Austria 0.81 0.12 0.57 0.81 0.81
Belgium 0.99 0.89 0.02 0.99 0.99
Czechoslovakia 0.58 0.98 0.09 0.98 0.98
Estonia 0.16 0.07 0.09 0.16 0.16
Finland 0.58 0.03 0.42 0.58 0.58
France 0.98 0.03 0.05 0.98 0.98
Germany 0.89 0.79 0.69 0.89 0.89
Greece 0.04 0.09 0.57 0.09 0.57
Hungary 0.07 0.16 0.87 0.16 0.87
Ireland 0.72 0.05 0.05 0.72 0.72
Italy 0.34 0.1 0.42 0.34 0.42
Netherlands 0.98 1 0.01 1 1
Poland 0.02 0.17 1 0.17 1
Portugal 0.01 0.02 0.99 0.02 0.99
Romania 0.01 0.03 0.16 0.03 0.16
Spain 0.03 0.3 0.8 0.3 0.8
Sweden 0.95 0.13 0.09 0.95 0.95
United 0.98 0.99 0.02 0.99 0.99Kingdom
05-Rihoux-45607:05-Rihoux-45607 7/18/2008 12:11 PM Page 98
three sets, DEVELOPED, URBAN, or UNSTABLE. Only Estonia andRomania have low scores in this union.
QUALITATIVE COMPARATIVE ANALYSIS USING FUZZY SETS (FSQCA) 99
• Negation: reverses scores so that scores close to [1], after negation, are closeto [0], and the reverse.The 0.5 score (maximum ambiguity) does not change.The label attached to the set is also negated or reversed (e.g., the negationof the set of “developed” countries is the set of “not-developed” countries).
• Logical AND: is the same as set intersection.The minimum score (or weakestlink) in the component sets is the degree of membership of each case in anintersection of sets.
• Logical OR: is the same as set union. The maximum score in the componentsets is the degree of membership of each case in their union.
Box 5.3Three Main Operations on Fuzzy Sets
Fuzzy Subsets
The key set theoretic relation in the study of causal complexity is thesubset relation. As discussed in Ragin (2000), if cases sharing several causallyrelevant conditions uniformly exhibit the same outcome, then these cases con-stitute a subset of instances of the outcome. Such a subset relation signals thata specific combination of causally relevant conditions may be interpreted assufficient for the outcome. If there are other sets of cases sharing othercausally relevant conditions, and if these cases also agree in displaying theoutcome in question, then these other combinations of conditions also may beinterpreted as sufficient for the outcome.
The interpretation of sufficiency, of course, must be grounded in theresearcher’s substantive and theoretical knowledge; it does not follow auto-matically from the demonstration of the subset relation. Regardless of whetherthe concept of sufficiency is invoked, the subset relation is the key device forpinpointing the different combinations of conditions linked in some way to anoutcome (e.g., the combinations of conditions linked to democratic survival orbreakdown in inter-war Europe).
With crisp sets it is a simple matter to determine whether the cases sharinga specific combination of conditions constitute a subset of the outcome. Theresearcher simply examines cases sharing each combination of conditions
05-Rihoux-45607:05-Rihoux-45607 7/18/2008 12:11 PM Page 99
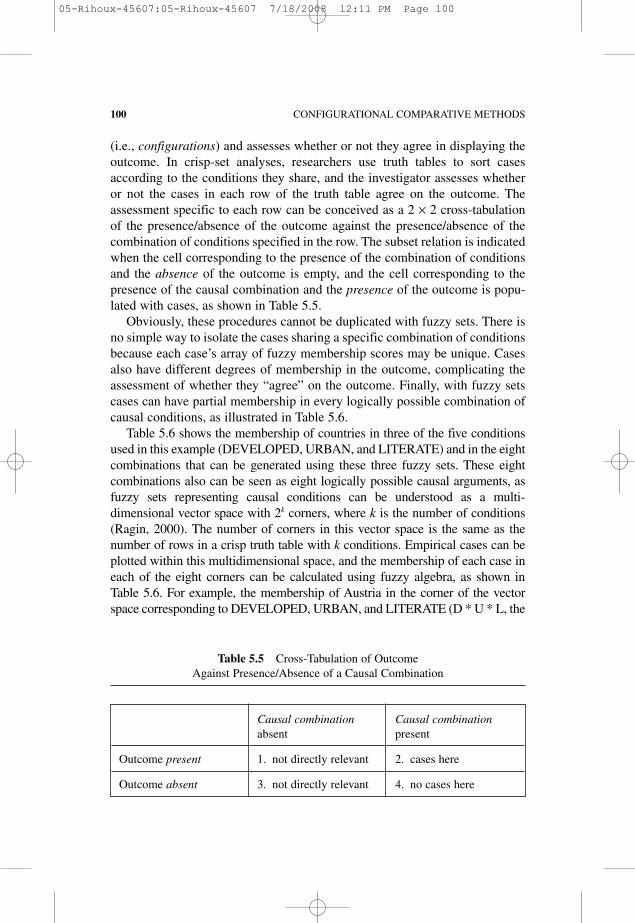
(i.e., configurations) and assesses whether or not they agree in displaying theoutcome. In crisp-set analyses, researchers use truth tables to sort casesaccording to the conditions they share, and the investigator assesses whetheror not the cases in each row of the truth table agree on the outcome. Theassessment specific to each row can be conceived as a 2 × 2 cross-tabulationof the presence/absence of the outcome against the presence/absence of thecombination of conditions specified in the row. The subset relation is indicatedwhen the cell corresponding to the presence of the combination of conditionsand the absence of the outcome is empty, and the cell corresponding to thepresence of the causal combination and the presence of the outcome is popu-lated with cases, as shown in Table 5.5.
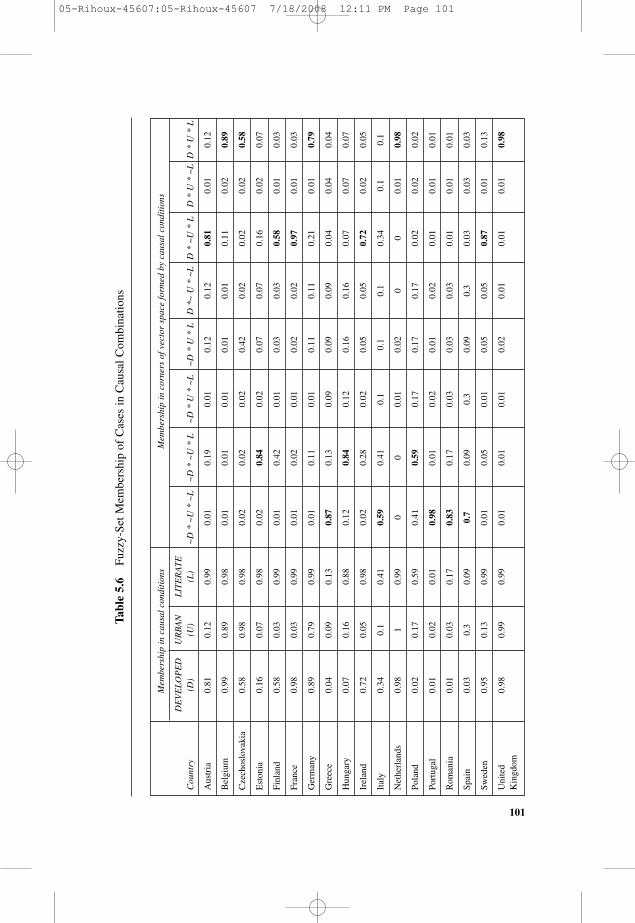
Obviously, these procedures cannot be duplicated with fuzzy sets. There isno simple way to isolate the cases sharing a specific combination of conditionsbecause each case’s array of fuzzy membership scores may be unique. Casesalso have different degrees of membership in the outcome, complicating theassessment of whether they “agree” on the outcome. Finally, with fuzzy setscases can have partial membership in every logically possible combination ofcausal conditions, as illustrated in Table 5.6.
Table 5.6 shows the membership of countries in three of the five conditionsused in this example (DEVELOPED, URBAN, and LITERATE) and in the eightcombinations that can be generated using these three fuzzy sets. These eightcombinations also can be seen as eight logically possible causal arguments, asfuzzy sets representing causal conditions can be understood as a multi-dimensional vector space with 2k corners, where k is the number of conditions(Ragin, 2000). The number of corners in this vector space is the same as thenumber of rows in a crisp truth table with k conditions. Empirical cases can beplotted within this multidimensional space, and the membership of each case ineach of the eight corners can be calculated using fuzzy algebra, as shown inTable 5.6. For example, the membership of Austria in the corner of the vectorspace corresponding to DEVELOPED, URBAN, and LITERATE (D * U * L, the
100 CONFIGURATIONAL COMPARATIVE METHODS
Table 5.5 Cross-Tabulation of OutcomeAgainst Presence/Absence of a Causal Combination
Causal combination Causal combinationabsent present
Outcome present 1. not directly relevant 2. cases here
Outcome absent 3. not directly relevant 4. no cases here
05-Rihoux-45607:05-Rihoux-45607 7/18/2008 12:11 PM Page 100
101
Table5.6
Fuzzy-SetM
embershipofCasesinCausalC
ombinations
Mem
bershipincausalconditions
Mem
bershipincornersofvector
spaceformed
bycausalconditions
DEVELOPED
URBAN
LITERATE
Country
(D)
(U)
(L)
~D*~U
*~L
~D*~U
*L
~D*U*~L
~D*U*L
D*~
U*~L
D*~U
*L
D*U*~L
D*U*L
Austria
0.81
0.12
0.99
0.01
0.19
0.01
0.12
0.12
0.81
0.01
0.12
Belgium
0.99
0.89
0.98
0.01
0.01
0.01
0.01
0.01
0.11
0.02
0.89
Czechoslovakia
0.58
0.98
0.98
0.02
0.02
0.02
0.42
0.02
0.02
0.02
0.58
Estonia
0.16
0.07
0.98
0.02
0.84
0.02
0.07
0.07
0.16
0.02
0.07
Finland
0.58
0.03
0.99
0.01
0.42
0.01
0.03
0.03
0.58
0.01
0.03
France
0.98
0.03
0.99
0.01
0.02
0.01
0.02
0.02
0.97
0.01
0.03
Germany
0.89
0.79
0.99
0.01
0.11
0.01
0.11
0.11
0.21
0.01
0.79
Greece
0.04
0.09
0.13
0.87
0.13
0.09
0.09
0.09
0.04
0.04
0.04
Hungary
0.07
0.16
0.88
0.12
0.84
0.12
0.16
0.16
0.07
0.07
0.07
Ireland
0.72
0.05
0.98
0.02
0.28
0.02
0.05
0.05
0.72
0.02
0.05
Italy
0.34
0.1
0.41
0.59
0.41
0.1
0.1
0.1
0.34
0.1
0.1
Netherlands
0.98
10.99
00
0.01
0.02
00
0.01
0.98
Poland
0.02
0.17
0.59
0.41
0.59
0.17
0.17
0.17
0.02
0.02
0.02
Portugal
0.01
0.02
0.01
0.98
0.01
0.02
0.01
0.02
0.01
0.01
0.01
Rom
ania
0.01
0.03
0.17
0.83
0.17
0.03
0.03
0.03
0.01
0.01
0.01
Spain
0.03
0.3
0.09
0.7
0.09
0.3
0.09
0.3
0.03
0.03
0.03
Sweden
0.95
0.13
0.99
0.01
0.05
0.01
0.05
0.05
0.87
0.01
0.13
United
0.98
0.99
0.99
0.01
0.01
0.01
0.02
0.01
0.01
0.01
0.98
Kingdom
05-Rihoux-45607:05-Rihoux-45607 7/18/2008 12:11 PM Page 101
last column of Table 5.6) is the minimum of its memberships in developed (0.81),urban (0.12), and literate (0.99), which is 0.12. Austria’s membership in the not-developed, not-urban, and not-literate (~D * ~ U * ~L) corner is the minimum ofits membership in not-industrial (1 – 0.81 = 0.19), not-urban (1 – 0.12 = 0.88),and not-literate (1 – 0.99 = 0.01), which is 0.01. The link between fuzzy-set vec-tor spaces and crisp truth tables is explored in greater depth below.
While these properties of fuzzy sets make it difficult to duplicate crisp-setprocedures for assessing subset relationships, the fuzzy subset relation can beassessed using fuzzy algebra. With fuzzy sets, a subset relation is indicatedwhen membership scores in one set (e.g., a condition or combination of con-ditions) are consistently less than or equal to membership scores in another set(e.g., the outcome). If, for example, memberships scores in a combination ofconditions are consistently less than or equal to their corresponding member-ship scores in the outcome (Xi ≤Yi), then a subset relation exists, which in turnsupports an argument of sufficiency. For illustration, consider Figure 5.1, theplot of degree of membership in BREAKDOWN (the negation ofSURVIVED) against degree of membership in the ~D * ~U * ~L (not devel-oped, not urban, not literate) corner of the three-dimensional vector space.(The negation of the fuzzy membership scores for SURVIVED in Table 5.2provides the BREAKDOWN membership scores.)
This plot shows that almost all countries’ membership scores in this cornerof the vector space (~D * ~ U * ~L) are less than or equal to their corre-sponding scores in BREAKDOWN. The characteristic upper-left triangularplot indicates that the set plotted on the horizontal axis is a subset of the setplotted on the vertical axis. The (almost) vacant lower triangle in this plot cor-responds to Cell 4 of Table 5.5. Just as cases in Cell 4 of Table 5.5 are incon-sistent with the crisp subset relation, cases in the lower-right triangle of Figure5.1 are inconsistent with the fuzzy subset relation. Thus, the evidence in Figure5.1 supports the argument that membership in ~D * ~U * ~L is a subset ofmembership in BREAKDOWN (Xi ≤ Yi), which in turn provides support forthe argument that this combination of conditions (not developed, not urban,and not literate) is sufficient for democratic breakdown.
Note that when membership in the causal combination is high, membershipin the outcome also must be high. However, the reverse does not have to betrue. That is, the fact that there are cases with relatively low membership in thecausal combination but substantial membership in the outcome is not prob-lematic from the viewpoint of set theory because the expectation is that theremay be several different conditions or combinations of conditions capable ofgenerating high membership in the outcome. Cases with low scores in the con-dition or combination of conditions but high scores in the outcome indicate theoperation of alternate conditions or alternate combinations of conditions.
102 CONFIGURATIONAL COMPARATIVE METHODS
05-Rihoux-45607:05-Rihoux-45607 7/18/2008 12:11 PM Page 102
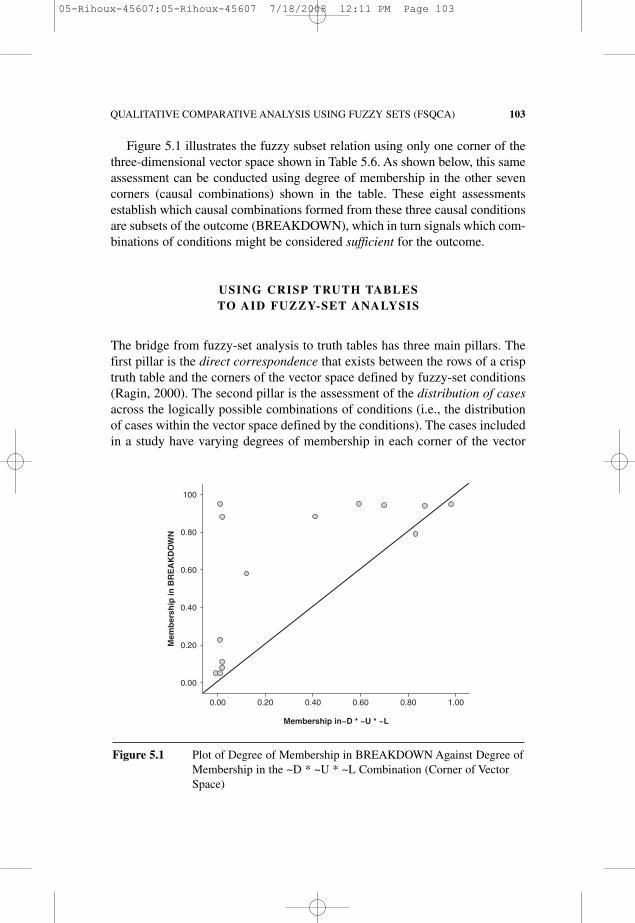
Figure 5.1 illustrates the fuzzy subset relation using only one corner of thethree-dimensional vector space shown in Table 5.6. As shown below, this sameassessment can be conducted using degree of membership in the other sevencorners (causal combinations) shown in the table. These eight assessmentsestablish which causal combinations formed from these three causal conditionsare subsets of the outcome (BREAKDOWN), which in turn signals which com-binations of conditions might be considered sufficient for the outcome.
USING CRISP TRUTH TABLESTO AID FUZZY-SET ANALYSIS
The bridge from fuzzy-set analysis to truth tables has three main pillars. Thefirst pillar is the direct correspondence that exists between the rows of a crisptruth table and the corners of the vector space defined by fuzzy-set conditions(Ragin, 2000). The second pillar is the assessment of the distribution of casesacross the logically possible combinations of conditions (i.e., the distributionof cases within the vector space defined by the conditions). The cases includedin a study have varying degrees of membership in each corner of the vector
QUALITATIVE COMPARATIVE ANALYSIS USING FUZZY SETS (FSQCA) 103
100
0.80
0.60
0.40
0.20
0.00
0.00 0.20 0.40 0.60 0.80 1.00
Membership in~D * ~U * ~L
Mem
ber
ship
inB
RE
AK
DO
WN
Figure 5.1 Plot of Degree of Membership in BREAKDOWNAgainst Degree ofMembership in the ~D * ~U * ~L Combination (Corner of VectorSpace)
05-Rihoux-45607:05-Rihoux-45607 7/18/2008 12:11 PM Page 103
space, as shown in Table 5.6 for a three-dimensional vector space. Some cor-ners of the vector space may have many cases with strong membership; othercorners may have no cases with strong membership. When using a crisp truthtable to analyze the results of multiple fuzzy-set assessments, it is important totake these differences into account. The third pillar is the fuzzy set assessmentof the consistency of the evidence for each causal combination with the argu-ment that it is a subset of the outcome. The subset relation is importantbecause it signals that there is an explicit connection between a combinationof conditions and an outcome. Once these three pillars are in place, it is pos-sible to construct a crisp truth table summarizing the results of multiple fuzzy-set assessments and then to analyze this truth table using Boolean algebra.
The Correspondence Between VectorSpace Corners and Truth Table Rows
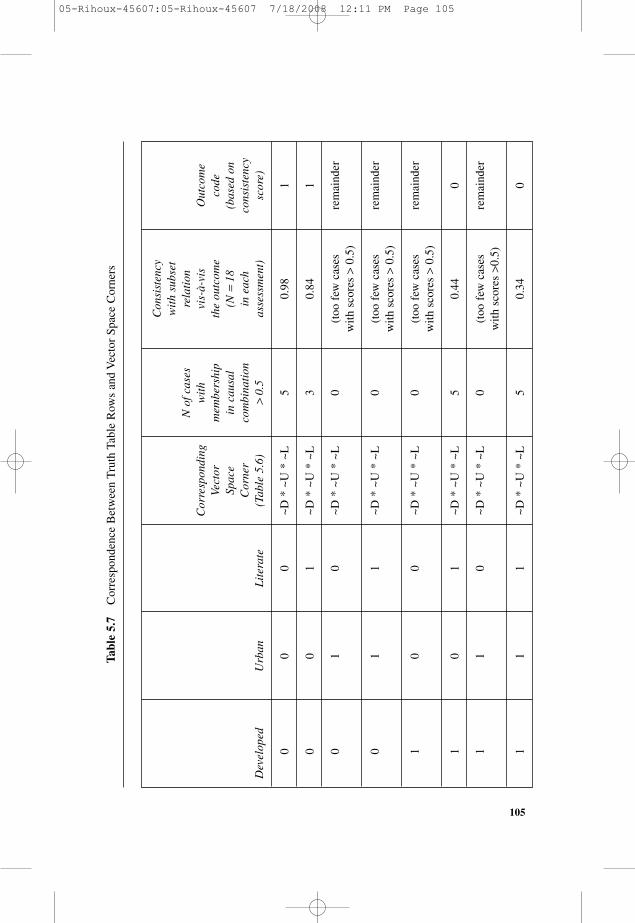
A multidimensional vector space constructed from fuzzy sets has 2k corners,just as a crisp truth table has 2k rows (where k is the number of conditions).There is a one-to-one correspondence between causal combinations, truthtable rows, and vector space corners (Ragin, 2000). The first four columns ofTable 5.7 show the correspondence between truth table rows and corners of thevector space. In crisp-set analyses, cases are sorted into truth table rowsaccording to their specific combinations of presence/absence scores on theconditions. Thus, each case is assigned to a unique row, and each rowembraces a unique subset of the cases included in the study. With fuzzy sets,however, each case has varying degrees of membership in the different cornersof the vector space and thus varying degrees of membership in each truth tablerow (as illustrated in Table 5.6).
When using a truth table to analyze the results of fuzzy-set assessments, thetruth table rows do not represent subsets of cases, as they do in crisp-set analy-ses. Rather, they represent the 2k causal arguments that can be constructedfrom a given set of causal conditions. In this light, the first row of the crisptruth table is the causal argument that ~D * ~U * ~L is a subset of the outcome(democratic BREAKDOWN in this example); the outcome for this row iswhether the argument is supported by the fuzzy-set evidence. The second rowaddresses the ~D * ~U * L causal combination, and so on. If both arguments(~D * ~U * ~L and ~D * ~U * L) are supported, then they can be logicallysimplified to ~D * ~U, using Boolean algebra. Thus, in the translation offuzzy-set analyses to crisp truth tables, the rows of the truth table specify thedifferent causal arguments based on the logically possible combinations ofconditions as represented in the corners of the vector space of conditions.As will be explained in the next two sections of this chapter, two pieces of
104 CONFIGURATIONAL COMPARATIVE METHODS
05-Rihoux-45607:05-Rihoux-45607 7/18/2008 12:11 PM Page 104
105
Consistency
withsubset
Nofcases
relation
Corresponding
with
vis-à-vis
Outcome
Vector
mem
bership
theoutcom
ecode
Space
incausal
(N=18
(based
onCorner
combination
ineach
consistency
Developed
Urban
Literate
(Table5.6)
>0.5
assessment)
score)
00
0~D
*~U
*~L
50.98
1
00
1~D
*~U
*~L
30.84
1
01
0~D
*~U
*~L
0(too
fewcases
remainder
with
scores
>0.5)
01
1~D
*~U
*~L
0(too
fewcases
remainder
with
scores
>0.5)
10
0~D
*~U
*~L
0(too
fewcases
remainder
with
scores
>0.5)
10
1~D
*~U
*~L
50.44
0
11
0~D
*~U
*~L
0(too
fewcases
remainder
with
scores
>0.5)
11
1~D
*~U
*~L
50.34
0
Table5.7
CorrespondenceBetweenTruthTableRow
sandVectorSpaceCorners
05-Rihoux-45607:05-Rihoux-45607 7/18/2008 12:11 PM Page 105
information about these corners are especially important: (1) the number ofcases with strong membership in each corner (i.e., in each combination of con-ditions) and (2) the consistency of the empirical evidence for each corner, withthe argument that degree of membership in the corner (i.e., causal combina-tion) is a subset of degree of membership in the outcome.
Specifying Frequency Thresholds for Fuzzy-Set Assessments
The distribution of cases across causal combinations is easy to assess whenconditions are represented with crisp sets, for it is a simple matter to constructa truth table from such data and to examine the number of cases crisply sortedinto each row. Rows without cases are treated as “logical remainders” (seep. 59). When causal conditions are fuzzy sets, however, this analysis is lessstraightforward because each case may have partial membership in every truthtable row (i.e., in every corner of the vector space), as Table 5.6 demonstrateswith three causal conditions. Still, it is important to assess the distribution ofcases’ membership scores across causal combinations in fuzzy-set analysesbecause some combinations may be empirically trivial. If all cases have verylow membership in a combination, then it is pointless to conduct a fuzzy-setassessment of that combination’s link to the outcome.3
Table 5.6 shows the distribution of the membership scores of the 18countries across the eight logically possible combinations of the three causalconditions. In essence, the table lists the eight corners of the three-dimensionalvector space that is formed by the three fuzzy sets and shows the degree ofmembership of each case in each corner.
This table demonstrates an important property of combinations of fuzzysets—namely, that each case can have only one membership score greater than0.5 in the logically possible combinations formed from a given set of conditions(shown in bold type).4 A membership score greater than 0.5 in a causal combi-nation signals that a case is more in than out of the causal combination in ques-tion. It also indicates which corner of the multidimensional vector space formedby conditions a given case is closest to. This property of fuzzy sets makes itpossible for investigators to sort cases according to corners of the vector space,based on their degree of membership. The fifth column of Table 5.7 shows thenumber of cases with greater than 0.5 membership in each corner, based on theevidence presented in Table 5.6. For example, Table 5.6 shows that fivecountries have greater than 0.5 membership in ~D * ~U * ~L (not developed,not urban, and not literate) and thus are good instances of this combination.These are the five cases with greater than 0.5 membership in row 1 of Table 5.7.
The key task in this phase of the analysis is to establish a number-of-casesthreshold for assessing fuzzy subset relations. That is, the investigator must
106 CONFIGURATIONAL COMPARATIVE METHODS
05-Rihoux-45607:05-Rihoux-45607 7/18/2008 12:11 PM Page 106
formulate a rule for determining which combinations of conditions are rele-vant, based on the number of cases with greater than 0.5 membership in eachcombination. If a combination has enough cases with membership scoresgreater than 0.5, then it is reasonable to assess the fuzzy subset relation, as inFigure 5.1. If a combination has too few cases with membership scores greaterthan 0.5, then there is no point in conducting this assessment.
The number-of-cases threshold chosen by the investigator must reflect thenature of the evidence and the character of the study. Important considerationsinclude the total number of cases included in the study, the number of condi-tions, the degree of familiarity of the researcher with each case, the degree ofprecision that is possible in the calibration of fuzzy sets, the extent of mea-surement and assignment error, whether the researcher is interested in coarseversus fine-grained patterns in the results, and so on. The data set used in thissimple demonstration comprises only 18 cases and 8 logically possible com-binations of conditions. In this situation, a reasonable frequency threshold isat least one case with greater than 0.5 membership in a combination. Thus, thefour combinations of conditions lacking a single case with greater than 0.5membership (see Rows 3, 4, 5, and 7 in Table 5.7) are treated as “logicalremainders” in the analysis that follows, for there are no solid empiricalinstances of any of them.
When the number of cases is large (e.g., hundreds of cases), it is importantto establish a higher frequency threshold. In such analyses, some corners mayhave several cases with greater than 0.5 membership due to measurement orcoding errors. In these situations, it is prudent to treat low-frequency causalcombinations in the same way as those lacking strong empirical instances alto-gether (number of cases with greater than 0.5 membership = 0). When the totalnumber of cases in a study is large, the issue is not which combinations haveinstances (i.e., at least one case with greater than 0.5 membership) but whichcombinations have enough instances to warrant conducting an assessment oftheir possible subset relation with the outcome. For example, a researcher’srule might be that there must be at least 5 or at least 10 cases with greater than0.5 membership in a causal combination in order to proceed with the assess-ment of the fuzzy subset relation. By contrast, when the total number of casesis small, it is possible for the researcher to gain familiarity with each case,which in turn mitigates the measurement and coding errors that motivate useof a higher threshold.
Assessing the Consistency of Fuzzy Subset Relations
Once the empirically relevant causal combinations have been identifiedusing the procedures just described, the next step is to evaluate each combination’s
QUALITATIVE COMPARATIVE ANALYSIS USING FUZZY SETS (FSQCA) 107
05-Rihoux-45607:05-Rihoux-45607 7/18/2008 12:11 PM Page 107
108 CONFIGURATIONAL COMPARATIVE METHODS
consistency with the set theoretic relation in question. Which causal combina-tions are subsets of the outcome? Social science data are rarely perfect, so it isimportant to assess the degree to which the empirical evidence is consistentwith the set theoretic relation in question. Ragin (2006b) described a measureof set theoretic consistency based on fuzzy membership scores (see alsoKosko, 1993; Smithson & Verkuilen, 2006). The formula is:
Consistency (Xi ≤Yi) = Σ(min(Xi,Yi))/Σ(Xi)
where “min” indicates the selection of the lower of the two values, Xi repre-sents membership scores in a combination of conditions, and Yi representsmembership scores in the outcome. When all of the Xi values are less than orequal to their corresponding Yi values, the consistency score is 1.00; whenthere are only a few near misses, the score is slightly less than 1.00; when thereare many inconsistent scores, with some Xi values greatly exceeding theircorresponding Yi values, consistency drops below 0.5.5 This measure ofconsistency prescribes substantial penalties for large inconsistencies but smallpenalties for near misses (e.g., an Xi score of 0.85 and a Yi score of 0.80).
The consistency of a fuzzy subset relation, in simple terms, is the degree towhich one set is contained within another (all Xi are less than or equal to theircorresponding Yi).When the values of Xi exceed the value of Yi, then not all ofXi is contained within Yi. The formula for fuzzy-set consistency takes this intoaccount by not counting the portion of Xi values that exceeds their corre-spondingYi values in the numerator of the formula, while counting these valuesin the denominator, which is simply the sum of the membership scores in X.
Box 5.4The Criterion of Consistency in Fuzzy Sets, in a Nutshell
The penultimate column of Table 5.7 reports fuzzy subset consistencyscores, using the formula just presented. The assessment is conducted for thefour combinations that meet the frequency threshold—the combination musthave at least one case with greater than 0.5 membership (see Table 5.6). All18 cases were included in each consistency assessment, following the patternshown in Figure 5.1. That is, the assessment of each row (each configuration)uses fuzzy scores for all 18 cases, not just those cases with greater than 0.5membership in that row. Thus, the evidentiary bases for consistency assess-ments are much broader in fuzzy-set analyses than in crisp and multi-valueanalyses. In essence, the consistency scores assess the degree to which theevidence for each combination conforms to the upper triangular pattern shown
05-Rihoux-45607:05-Rihoux-45607 7/18/2008 12:11 PM Page 108
in Figure 5.1. Note that the consistency of the evidence in Figure 5.1 with thesubset relation is 0.98, indicating near perfect consistency.
Constructing the Truth Table
It is a short step from tables like Table 5.7 to crisp-set truth tables appro-priate for the Quine–McCluskey minimization procedure (as conducted inChapter 3 with csQCA). The key determination that must be made is the con-sistency score to be used as a cutoff value for determining which causal com-binations pass fuzzy set theoretic consistency and which do not. Causalcombinations with consistency scores at or above the cutoff value are desig-nated fuzzy subsets of the outcome and are coded [1]; those below the cutoffvalue are not fuzzy subsets and are coded [0].6
In effect, the causal combinations that are fuzzy subsets of the outcomedelineate the kinds of cases in which the outcome is consistently found (e.g.,the kinds of countries that experienced democratic breakdown). It is importantto point out, however, that some cases displaying the outcome may be foundamong configurations with low consistency. This situation corresponds roughlyto the existence of “contradictory configurations” in crisp-set analysis, and thesame strategies for addressing contradictions discussed in Chapter 3 can beapplied in fuzzy-set analyses. Indeed, simple inspection of the consistencyvalues in Table 5.7 reveals that there is a substantial gap in consistency scoresbetween the second consistency score reported (0.84) and the third highestscore (0.44). This gap provides an easy basis for differentiating consistentcausal combinations from inconsistent combinations, as shown in the lastcolumn of Table 5.7, which shows the coding of the outcome for truth tableanalysis.7 Together, the first three columns plus the last column of Table 5.7form a simple truth table appropriate for standard (crisp set) truth table analy-sis using the Quine–McCluskey algorithm. The results of this truth table analy-sis are not presented here. Instead, an analysis of a more fully specified truthtable is presented below, using five conditions.
The Fuzzy-Set Analysis of Necessary Conditions
One issue not addressed in the preceding discussion is the fuzzy-set analy-sis of necessary conditions. A necessary condition is a condition that must bepresent for the outcome to occur, but its presence does not guarantee thatoccurrence (see also Box 1.3). For example, “state breakdown” is consideredby some to be a necessary condition for “social revolution,” but the occurrenceof state breakdown does not ensure that a social revolution will occur. Indeed,social revolutions are not nearly as common as state breakdowns.
QUALITATIVE COMPARATIVE ANALYSIS USING FUZZY SETS (FSQCA) 109
05-Rihoux-45607:05-Rihoux-45607 7/18/2008 12:11 PM Page 109
With fuzzy sets, a possible necessary condition is signaled whenever it canbe demonstrated that instances of the outcome in question constitute a subsetof instances of a condition, as would be the case, for example, with state break-downs and social revolutions. In formal terms, the consistency of the fuzzysubset relation indicating necessity can be assessed using this formula:
Consistency (Yi ≤ Xi) = Σ(min(Xi,Yi))/Σ(Yi)
which states simply that the consistency of set Y as a subset of set X is theirintersection expressed as a proportion of set Y. If all Y values are less than orequal to their corresponding X values, the formula returns a score of 1.0. IfmanyY values exceed their corresponding X values, then the score returned issubstantially less than 1.0. The formula also applies to crisp sets, where thenumerator is simply the number of cases where both X and Y are found; thedenominator is the number of cases of Y.
It is often useful to check for necessary conditions before conducting thefuzzy truth table procedure. Any condition that passes the test and that “makessense” as a necessary condition can be dropped from the truth table procedure,which, after all, is essentially an analysis of sufficiency. (This is true for allvarieties of QCA—crisp set, multi-value, and fuzzy set.) Of course, the condi-tion identified in this way would be retained for discussion as a necessary condi-tion and should be considered relevant to any sufficient combination of conditionsidentified through the truth table analysis. In general, a necessary condition canbe interpreted as a superset of the outcome, while sufficient conditions (usually,sufficient combinations of conditions) constitute subsets of the outcome.
It is important to point out as well that if a necessary condition is includedin a truth table analysis, it is often eliminated from solutions that include log-ical remainders (i.e., necessary conditions are often eliminated from parsimo-nious solutions). For example, it is clear from a simple inspection of Table 3.9that SURVIVAL is a subset of LITERACY (indeed: every time SURVIVALdisplays a [1] value (“present”), LITERACY also displays a [1] value (“pre-sent”)), which in turn might suggest that LITERACY is a necessary conditionfor SURVIVAL. However, the solution for SURVIVAL (based on Table 3.9)that includes logical remainders (see Formula 4, p. 60) eliminates LITERACYaltogether and presents instead a solution with GNPCAP and STABILITY asjoint conditions. Thus, it is important to use logical remainders consciouslyand wisely—to evaluate their appropriateness in any analysis.
Ragin and Sonnett (2004; see also Ragin, 2008) developed a procedure thatlimits the use of logical remainders, so that only those that are consistent withthe researcher’s theoretical and substantive knowledge are incorporated intosolutions. This procedure is now implemented in FSQCA and can be used for
110 CONFIGURATIONAL COMPARATIVE METHODS
05-Rihoux-45607:05-Rihoux-45607 7/18/2008 12:11 PM Page 110
both crisp-set and fuzzy-set analyses. Three solution are produced for eachanalysis: a “complex” solution (no logical remainders used), a “parsimonious”solution (all logical remainders may be used, without any evaluation of theirplausibility), and an “intermediate” solution (only the logical remainders that“make sense” given the researcher’s substantive and theoretical knowledge areincorporated into the solution). An important benefit of intermediate solutionsis that they will not allow removal of necessary conditions—any condition thatis a superset of the outcome and that makes sense as a necessary condition. Ingeneral, “intermediate” solutions are superior to both the “complex” and“parsimonious” solutions and should be a routine part of any application ofany version of QCA. It is important to point out that whenever researchersevaluate the logical remainders incorporated into a solution (one of the mostimportant “good practices” involved in using QCA) and decide that a logicalremainder is implausible and should be excluded from a solution, they are, ineffect, deriving an intermediate solution.
APPLICATION OF THE PROCEDURE
To facilitate comparison of the fuzzy-set analysis with the analyses presentedin Chapters 3 (csQCA) and 4 (mvQCA), the analysis presented in this sectionuses all five fuzzy-set conditions shown in Table 5.2: DEVELOPED, URBAN,INDUSTRIAL, LITERATE, and STABLE (they basically correspond, with afew changes in labels, to the raw data initially presented in Table 3.5, p. 51).Two separate analyses will be demonstrated: first using SURVIVED as theoutcome, and then using BREAKDOWN as the outcome. The analysis pre-sented below uses all five conditions to enhance comparison with the resultsof the csQCA analysis.
Analysis With SURVIVED as the Outcome
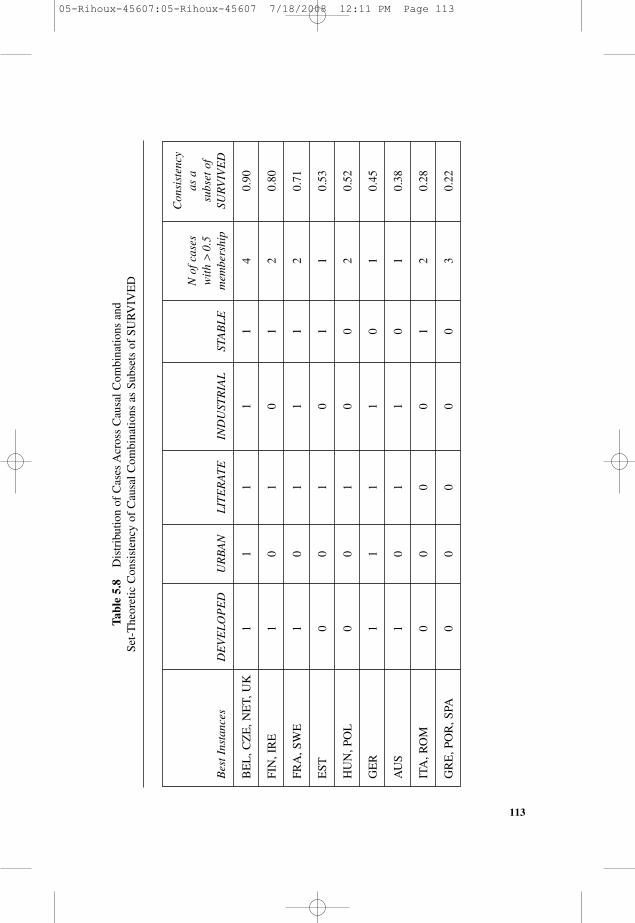
With five causal conditions, there are 32 (i.e., 25) corners to the vector spaceformed by the fuzzy set causal conditions. These 32 corners correspond to the32 rows of the crisp truth table formed from the dichotomous versions of theseconditions (see Table 3.4, p. 45) and also to the 32 logically possible argu-ments that can be constructed using five dichotomous causal conditions (seep. 27). While the 18 cases all have some degree of membership in each of the32 causal combinations, they are, of course, unevenly distributed within thefive-dimensional vector space. Table 5.8 shows the distribution of cases acrossthe causal combinations (which also constitute corners of the vector space).
QUALITATIVE COMPARATIVE ANALYSIS USING FUZZY SETS (FSQCA) 111
05-Rihoux-45607:05-Rihoux-45607 7/18/2008 12:11 PM Page 111
The penultimate column of this table shows the number of cases withgreater than 0.5 membership in each combination (causal combinations thatfail to meet this frequency threshold of at least one case are not shown).Altogether, this means that there are good instances (i.e., countries withgreater than 0.5 membership) of 9 of the 32 logically possible combinations ofconditions. The remaining 23 are logical remainders and thus are available aspotential counterfactual cases for further logical simplification of the truthtable (see Ragin & Sonnett, 2004; Ragin, 2008; and p. 59). Recall that in mostfuzzy-set analyses, all cases have some degree of membership in each row.Thus, while it is possible to report which rows have strong instances, as in thefirst column of the table, it is not possible to assign cases strictly to rows, as iscommon in csQCA and mvQCA.
The last column of Table 5.8 shows the degree of consistency of each causalcombination with the argument that it is a subset of the outcome SURVIVED.In short, this column shows the truth value of the following statement:“Membership in the combination of conditions in this row is a subset of mem-bership in the outcome.” The rows have been sorted to show the distribution ofconsistency scores, which range from 0.22 to 0.90. To prepare this evidencefor conventional truth table analysis, it is necessary simply to select a cutoffvalue for consistency and recode it as a dichotomy.
To derive a solution that is as compatible as possible with the previous analy-ses (especially the csQCA presented in Chapter 3), a very low cutoff value is firstused. If the consistency of the combination as a subset of the outcome is at least0.70, it is coded as consistent (outcome = [1]); otherwise it is coded inconsistent(outcome = [0]). As in the csQCA, this truth table is first minimized withoutincluding logical remainders, which yields the following results (Formula 1):
DEVELOPED * urban * + DEVELOPED * � SURVIVEDLITERATE * STABLE LITERATE *
INDUSTRIAL * STABLE
Cases with strong membership in the first combination: FIN, FRA, IRE, SWE
Cases with strong membership in the second combination: BEL, CZE, NET, UK
This is the same solution that was obtained in the final crisp-set analysis(without logical remainders) presented in Chapter 3 (see Formula 1, p. 57).The two paths to survival share a high level of development, high literacy, andpolitical stability. In essence, the countries with democracies that survivedwere in the advanced areas of Europe that avoided political instability.
112 CONFIGURATIONAL COMPARATIVE METHODS
05-Rihoux-45607:05-Rihoux-45607 7/18/2008 12:11 PM Page 112
113
Table5.8
DistributionofCasesAcrossCausalC
ombinations
and
Set-TheoreticConsistency
ofCausalC
ombinations
asSubsetsofSU
RVIVED
Consistency
Nofcases
asa
with
>0.5
subsetof
BestInstances
DEVELOPED
URBAN
LITERATE
INDUSTRIAL
STABLE
mem
bership
SURVIVED
BEL,C
ZE,N
ET,UK
11
11
14
0.90
FIN,IRE
10
10
12
0.80
FRA,SWE
10
11
12
0.71
EST
00
10
11
0.53
HUN,POL
00
10
02
0.52
GER
11
11
01
0.45
AUS
10
11
01
0.38
ITA,R
OM
00
00
12
0.28
GRE,POR,SPA
00
00
03
0.22
05-Rihoux-45607:05-Rihoux-45607 7/18/2008 12:11 PM Page 113
The parsimonious solution (which allows the incorporation of logicalremainders, without evaluating their plausibility, into the solution) is as fol-lows (Formula 2):
DEVELOPED * STABLE � SURVIVED
Cases with strong membership in this combination: BEL, CZE, FIN, FRA,IRE, NET, SWE, UK
Note that the formula is also the same as the results of the final crisp-setanalysis presented in Chapter 3 (with the inclusion of logical remainders; seeFormula 4, p. 60). In general, this should not be surprising because the fuzzysets have been crafted to reflect the dichotomizations used in that analysis, andthe threshold for consistency has been set at a very low level, in order todemonstrate continuity with the crisp-set analysis.
As noted previously, it is also possible to derive an intermediate solution,situated in between the complex and the parsimonious solutions, using theresearcher’s theoretical and substantive knowledge to guide the incorporationof logical remainders (see Ragin, 2008; see also discussion on p. 135). Theintermediate solution is (Formula 3):
DEVELOPED * LITERATE * STABLE � SURVIVED
Cases with strong membership in this combination: BEL, CZE, FIN, FRA,IRE, NET, SWE, UK
The intermediate solution adds a third condition, LITERACY, to the parsi-monious solution. This third condition is included because (a) it can be seenas a necessary condition (SURVIVED is a subset of LITERATE, with a fuzzyset consistency score of 0.99) and (b) the logical remainders that are neededto remove LITERACY (in order to produce the parsimonious solution) runcounter to theoretical and substantive knowledge (i.e., which indicates thathigh levels of literacy should enhance the survival of democracy).
While it is reassuring that the results of the crisp-set analysis can be repro-duced using fuzzy sets, it is important to note that that has been possible onlyby using a relatively low cutoff value (0.70) for set theoretic consistency (thelast column of Table 5.8). As explained in Ragin (2008), the fuzzy-set test ofconsistency is more exacting than its crisp-set counterpart. A case can be morein than out of both the condition and the outcome but still be substantiallyinconsistent when considered from the viewpoint of fuzzy sets. For example,assume that the score on the condition is 0.95, while the score on the outcome
114 CONFIGURATIONAL COMPARATIVE METHODS
05-Rihoux-45607:05-Rihoux-45607 7/18/2008 12:11 PM Page 114
is 0.55. In a crisp-set analysis, both scores would be recoded (via dichotomiza-tion) to [1] and thus be considered consistent with a subset relation, while froma fuzzy-set perspective, the outcome score greatly exceeds the condition scores(by a margin of 0.40), which in turn would be considered substantially incon-sistent with the subset relation.
Applying a more stringent cutoff value to Table 5.8 produces a more nar-rowly circumscribed formula. For comparison purposes, consider this sameanalysis using 0.80 as the cutoff value, which accords only the top two rowsthe 1 outcome. The “intermediate” solution using this more stringent cutoffvalue is (Formula 4):
DEVELOPED * LITERATE * STABLE * (URBAN + industrial)� SURVIVED
In short, using a more stringent cutoff value for fuzzy-set theoretic consis-tency adds a fourth condition to the intermediate solution derived previously.This fourth condition can be satisfied by having either strong membership inthe set of urbanized countries or weak membership in the set of industrialcountries.
Analysis With BREAKDOWN as the Outcome
Table 5.9 shows the results of the analysis of the same 5 causal conditionswith BREAKDOWN as the outcome. Because the 5 causal conditions are thesame, the vector space of causal conditions is unchanged, and the distribution ofcases within the vector space also is unchanged. Once again, there are 9 causalcombinations with “good instances” (i.e., at least one case with greater than 0.5membership) and 23 causal combinations lacking good empirical instances.
The key difference between tables 5.9 and 5.8 is in the last column, whichin Table 5.9 shows the degree of consistency of each causal combination withthe following statement: “Membership in the combination of conditions in thisrow is a subset of membership in the outcome (BREAKDOWN).” Again therows have been sorted to show the distribution of the consistency scores.Applying the same cutoff criterion that was applied to the second analysis ofTable 5.8 (at least 0.80 consistent; see above on this page) results in a codingof the first six rows as [1] (true) and bottom three rows as [0] (false).
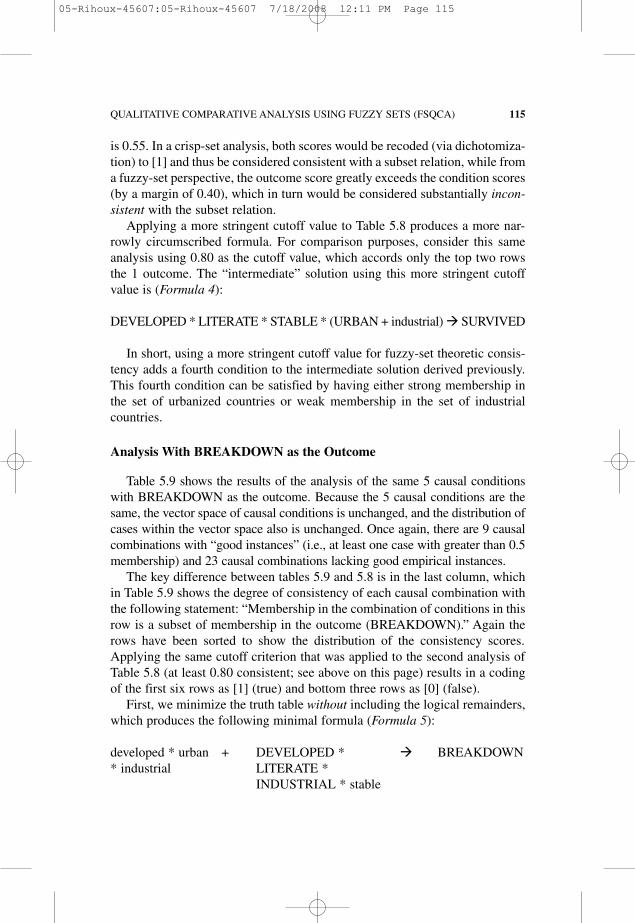
First, we minimize the truth table without including the logical remainders,which produces the following minimal formula (Formula 5):
developed * urban + DEVELOPED * � BREAKDOWN* industrial LITERATE *
INDUSTRIAL * stable
QUALITATIVE COMPARATIVE ANALYSIS USING FUZZY SETS (FSQCA) 115
05-Rihoux-45607:05-Rihoux-45607 7/18/2008 12:11 PM Page 115
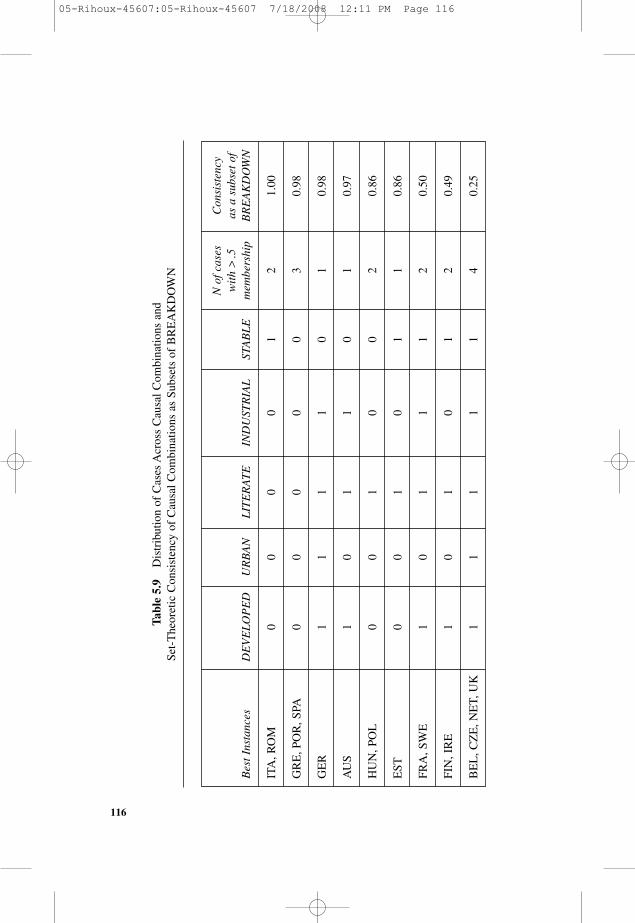
116
Table5.9
DistributionofCasesAcrossCausalC
ombinations
and
Set-TheoreticConsistency
ofCausalC
ombinations
asSubsetsofBREAKDOWN
Nofcases
Consistency
with
>.5
asasubsetof
BestInstances
DEVELOPED
URBAN
LITERATE
INDUSTRIAL
STABLE
mem
bership
BREAKDOWN
ITA,R
OM
00
00
12
1.00
GRE,POR,SPA
00
00
03
0.98
GER
11
11
01
0.98
AUS
10
11
01
0.97
HUN,POL
00
10
02
0.86
EST
00
10
11
0.86
FRA,SWE
10
11
12
0.50
FIN,IRE
10
10
12
0.49
BEL,C
ZE,N
ET,UK
11
11
14
0.25
05-Rihoux-45607:05-Rihoux-45607 7/18/2008 12:11 PM Page 116
Cases with strong membership in the first combination: EST, GRE, POR, SPA,HUN, POL, ITA, ROM
Cases with strong membership in the second combination: GER, AUS
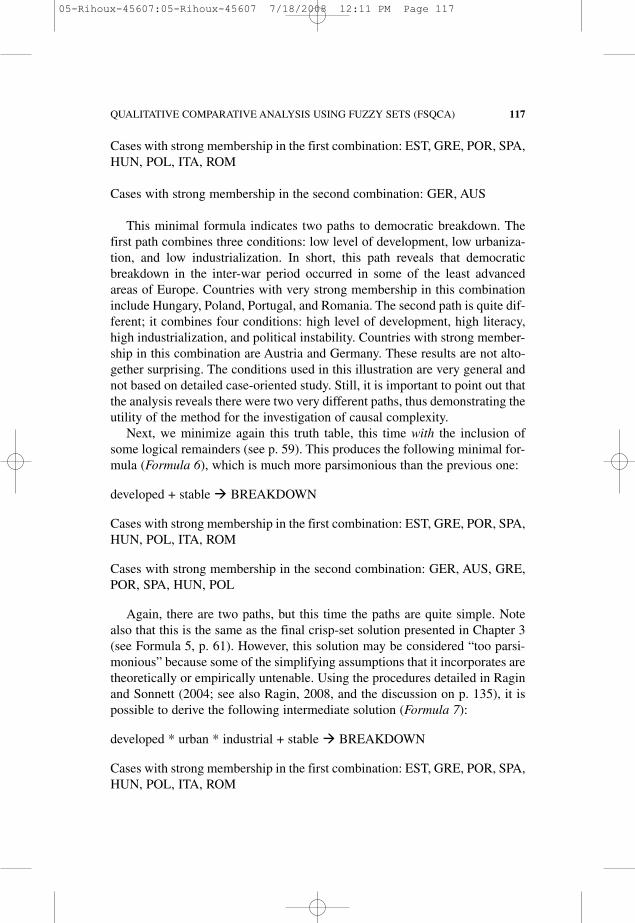
This minimal formula indicates two paths to democratic breakdown. Thefirst path combines three conditions: low level of development, low urbaniza-tion, and low industrialization. In short, this path reveals that democraticbreakdown in the inter-war period occurred in some of the least advancedareas of Europe. Countries with very strong membership in this combinationinclude Hungary, Poland, Portugal, and Romania. The second path is quite dif-ferent; it combines four conditions: high level of development, high literacy,high industrialization, and political instability. Countries with strong member-ship in this combination are Austria and Germany. These results are not alto-gether surprising. The conditions used in this illustration are very general andnot based on detailed case-oriented study. Still, it is important to point out thatthe analysis reveals there were two very different paths, thus demonstrating theutility of the method for the investigation of causal complexity.
Next, we minimize again this truth table, this time with the inclusion ofsome logical remainders (see p. 59). This produces the following minimal for-mula (Formula 6), which is much more parsimonious than the previous one:
developed + stable � BREAKDOWN
Cases with strong membership in the first combination: EST, GRE, POR, SPA,HUN, POL, ITA, ROM
Cases with strong membership in the second combination: GER, AUS, GRE,POR, SPA, HUN, POL
Again, there are two paths, but this time the paths are quite simple. Notealso that this is the same as the final crisp-set solution presented in Chapter 3(see Formula 5, p. 61). However, this solution may be considered “too parsi-monious” because some of the simplifying assumptions that it incorporates aretheoretically or empirically untenable. Using the procedures detailed in Raginand Sonnett (2004; see also Ragin, 2008, and the discussion on p. 135), it ispossible to derive the following intermediate solution (Formula 7):
developed * urban * industrial + stable � BREAKDOWN
Cases with strong membership in the first combination: EST, GRE, POR, SPA,HUN, POL, ITA, ROM
QUALITATIVE COMPARATIVE ANALYSIS USING FUZZY SETS (FSQCA) 117
05-Rihoux-45607:05-Rihoux-45607 7/18/2008 12:11 PM Page 117
118 CONFIGURATIONAL COMPARATIVE METHODS
Cases with strong membership in the second combination: GER, AUS, GRE,POR, SPA, HUN, POL
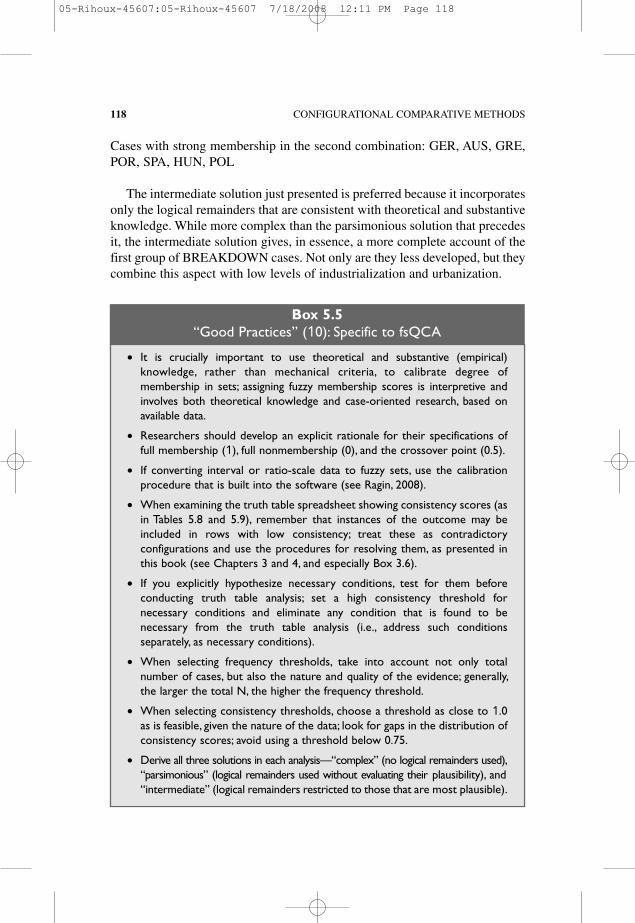
The intermediate solution just presented is preferred because it incorporatesonly the logical remainders that are consistent with theoretical and substantiveknowledge. While more complex than the parsimonious solution that precedesit, the intermediate solution gives, in essence, a more complete account of thefirst group of BREAKDOWN cases. Not only are they less developed, but theycombine this aspect with low levels of industrialization and urbanization.
• It is crucially important to use theoretical and substantive (empirical)knowledge, rather than mechanical criteria, to calibrate degree ofmembership in sets; assigning fuzzy membership scores is interpretive andinvolves both theoretical knowledge and case-oriented research, based onavailable data.
• Researchers should develop an explicit rationale for their specifications offull membership (1), full nonmembership (0), and the crossover point (0.5).
• If converting interval or ratio-scale data to fuzzy sets, use the calibrationprocedure that is built into the software (see Ragin, 2008).
• When examining the truth table spreadsheet showing consistency scores (asin Tables 5.8 and 5.9), remember that instances of the outcome may beincluded in rows with low consistency; treat these as contradictoryconfigurations and use the procedures for resolving them, as presented inthis book (see Chapters 3 and 4, and especially Box 3.6).
• If you explicitly hypothesize necessary conditions, test for them beforeconducting truth table analysis; set a high consistency threshold fornecessary conditions and eliminate any condition that is found to benecessary from the truth table analysis (i.e., address such conditionsseparately, as necessary conditions).
• When selecting frequency thresholds, take into account not only totalnumber of cases, but also the nature and quality of the evidence; generally,the larger the total N, the higher the frequency threshold.
• When selecting consistency thresholds, choose a threshold as close to 1.0as is feasible, given the nature of the data; look for gaps in the distribution ofconsistency scores; avoid using a threshold below 0.75.
• Derive all three solutions in each analysis—“complex” (no logical remainders used),“parsimonious” (logical remainders used without evaluating their plausibility), and“intermediate” (logical remainders restricted to those that are most plausible).
Box 5.5“Good Practices” (10): Specific to fsQCA
05-Rihoux-45607:05-Rihoux-45607 7/18/2008 12:11 PM Page 118
CONCLUSION
By using fuzzy sets, researchers can address a key limitation of csQCA—namely, the necessity to dichotomize conditions. Beyond solving this funda-mental limitation, the use of fuzzy sets offers a number of additional benefits.
First, with fuzzy sets researchers are able to implement a more precise anddemanding assessment of set theoretic consistency (and thus of sufficiencyand necessity) than is possible using crisp sets or multi-value sets. With fuzzysets, the calculation of consistency takes into account degree of membership,and thus many cases that would be defined as consistent using crisp sets ormulti-value sets are defined as inconsistent using fuzzy sets. For example, acase with a score of 0.95 on a condition and 0.55 on the outcome is consideredconsistent from a crisp-set point of view because dichotomization wouldrecode both scores to [1] and thus this case would satisfy Xi ≤Yi (X is a sub-set of Y). From a fuzzy-set perspective, however, the two scores are dramati-cally inconsistent with Xi ≤ Yi because 0.95 is 0.40 units greater than 0.55—a substantial gap (X is not a subset of Y). Because of this higher consistencystandard, the results of a fuzzy-set analysis will generally be more empiricallycircumscribed than the results of a crisp-set or a multi-value analysis.
Second, not only is the fuzzy-set assessment of consistency more demand-ing, but it is also more encompassing. In crisp-set and multi-value analyses, acausal combination is assessed using only those cases that exactly conform toit—the cases that reside in a specific row of the truth table. If the cases in agiven row all agree in displaying the outcome, then the sufficiency of thatcombination for the outcome is established. With fuzzy sets, by contrast, eachcase can have partial membership in every row of the truth table (because eachrow represents a different combination of conditions). Thus, the assessment ofthe consistency of each row with sufficiency involves all cases included in theanalysis and focuses on the degree to which the plot of membership in the out-come against membership in a row (again, using all cases) produces the uppertriangular pattern that is characteristic of the subset relationship. Thus, infsQCA the assessment of each combination of conditions is based on thepattern observed across all cases, not on a small subset of cases (as in csQCAand mvQCA).
Third, in contrast to mvQCA, the use of fuzzy sets does not exacerbate theproblem of limited diversity. While useful, mvQCA’s key drawback is that itgreatly expands the number of logically possible combinations of conditions aseach new category is added. For example, four conditions conceptualized asdichotomies yields 16 (= 24) logically possible combinations. These same fourconditions converted to trichotomies, a seemingly modest step, yields 81 (= 34)logically possible combinations. Converting these four dichotomies to fuzzysets, however, yields the same 16 logically possible combinations of conditions
QUALITATIVE COMPARATIVE ANALYSIS USING FUZZY SETS (FSQCA) 119
05-Rihoux-45607:05-Rihoux-45607 7/18/2008 12:11 PM Page 119
120 CONFIGURATIONAL COMPARATIVE METHODS
generated in their use as dichotomous conditions. The key difference betweenfuzzy sets and crisp sets is that these 16 combinations are the 16 corners of afour-dimensional property space. At an analytic level, however, the number ofrelevant causal combinations is the same. Each corner of the vector space con-stitutes, in effect, a different ideal-typical combination of conditions.
• fsQCA retains key aspects of the general QCA approach, whileallowing the analysis of phenomena that vary by level or degree.
• The fsQCA procedure presented in this chapter provides a bridgebetween fuzzy sets and conventional truth table analysis byconstructing a Boolean truth table summarizing the results of multiplefuzzy-set analyses; this procedure differs from the fuzzy-set proceduredescribed in Ragin (2000).
• Fuzzy membership scores (i.e., the varying degree to which casesbelong to sets) combine qualitative and quantitative assessment.
• The key set theoretic relation in the study of causal complexity is thesubset relation; cases can be precisely assessed in terms of their degree ofconsistency with the subset relation, usually with the goal of establishingthat a combination of conditions is sufficient for a given outcome.
• The assessment of sufficiency is especially stringent in fsQCA, as itinvolves a more exacting standard and a more encompassing approach,involving all cases in the assessment of each combination ofconditions.
• “Logical remainders” are important in fsQCA; they can be avoidedaltogether (“complex” solution), used without explicit evaluation oftheir plausibility (“parsimonious” solution), or used selectively, basedon the researcher’s substantive and theoretical knowledge(“intermediate” solution).
Key Complementary Readings
Klir et al. (1997), Ragin (2000, 2006b, 2008); Schneider & Wagemann(2007, forthcoming), Smithson &Verkuilen (2006).
Key Points
NOTES
1. The typical mvQCA application involves a preponderance of dichotomousconditions and one or two trichotomous conditions—see Box 4.4 and p. 78.
05-Rihoux-45607:05-Rihoux-45607 7/18/2008 12:11 PM Page 120
2. For more details on the calibration of fuzzy sets, see Ragin (2007, 2008),Schneider and Wagemann (2007, forthcoming), and Verkuilen (2005).3. If the membership scores in a causal combination are all very low, then it is very
easy for that combination to satisfy the subset relation signaling sufficiency (wherescores in the causal combination must be less than or equal to scores in the outcome).However, the consistency with the subset relation in such instances is meaningless, forthe researcher lacks good instances of the combination (i.e., cases with greater than 0.5membership in the causal combination).4. Note that if a case has 0.5 membership in any condition, then its maximum mem-
bership in a causal combination that includes that condition is only 0.5. Thus, any casecoded 0.5 will not be “closest” to any single corner of the vector space defined by theconditions.5. NB: when the formula for the calculation of fuzzy-set theoretic consistency is
applied to crisp-set data, it returns the simple proportion of consistent cases. Thus, theformula can be applied to crisp and fuzzy data alike.6. Rows not meeting the frequency threshold selected by the investigator (based on
the number of cases with greater than 0.5 membership) are treated as “logical remain-der” rows. Designating such rows as logical remainders is justified on the grounds thatthe evidence relevant to these combinations is not substantial enough to permit an eval-uation of set theoretic consistency.7. Ragin (2000) demonstrates how to incorporate probabilistic criteria into the
assessment of the consistency of subset relations, and these same criteria can be modi-fied for use here. The probabilistic test requires a benchmark value (e.g., 0.80 consis-tency) and an alpha (e.g., 0.05 significance). In the interest of staying close to theevidence, it is often useful simply to sort the consistency scores in descending order andobserve whether a substantial gap occurs in the upper ranges of consistency scores. Ingeneral, the cutoff value should not be less than 0.75; a cutoff value of 0.80 or higher isgenerally recommended.While the measure of consistency used here can range from 0.0to 1.0, scores between 0.0 and 0.75 indicate the existence of substantial inconsistency.
QUALITATIVE COMPARATIVE ANALYSIS USING FUZZY SETS (FSQCA) 121
05-Rihoux-45607:05-Rihoux-45607 7/18/2008 12:11 PM Page 121