qualitative and quantitative analysis of the new zealand ... · qualitative and quantitative...
TRANSCRIPT

Qualitative and Quantitative Analysis of the New Zealand Road Toll: Final Report
Qualitative and Quantitative
Analysis of the New Zealand Road
Toll: Final Report Ministry of Transport 14 March 2017

Qualitative and Quantitative Analysis of the New Zealand Road Toll: Final Report
Contents
Glossary i
Key findings i
Executive summary iii
1 Introduction 1
1.1 Road trauma and road safety in New Zealand 1 1.2 Motivations for this study 3 1.3 Report structure 3
2 Literature review 4
2.1 International trends 4 2.2 Factors thought to influence road trauma 4 2.3 Broader contextual factors that might be changing the
nature of these relationships over time 8
3 Modelling approach and results 10
3.1 Approach 10 3.2 Descriptive statistics 11 3.3 Results and Discussion 12
4 Findings and implications 23
4.1 Key modelling findings 23 4.2 Implications for the Ministry’s ongoing monitoring
programme 23 4.3 Considerations for future and ongoing research 26
References 29
Appendix A : Descriptive statistics 32
A.1. Stratification of models 32 A.2. Independent variables 39
Appendix B : Econometric method 48
B.2. Data cleaning 48 B.3. Model specification 50
Appendix C : Detailed results 54
C.1. Time series modelling results 54 C.2. Microeconometric severity modelling results 65
Appendix D : Other descriptive analysis 74
D.1. Overseas licence holders 74 D.2. Distractions 76
Limitation of our work 77
General use restriction 77

Qualitative and Quantitative Analysis of the New Zealand Road Toll: Final Report
Charts
Chart 1.1 New Zealand road fatalities (1980 to 2015) ............................ 1 Chart 1.2 New Zealand serious road injuries (1995 to 2015) ................... 2 Chart 3.1 Year trend estimates ......................................................... 14 Chart 3.2 Week of the year estimates ................................................ 15 Chart 3.3 Counterfactual analysis of the fatality rate ............................ 20 Chart A.1 All fatalities (LHS) and injuries (RHS), by time of day ............. 32 Chart A.2 Fatalities (LHS) and injuries (RHS) on urban and rural
roads, by time of day...................................................................... 33 Chart A.3 Fatalities (LHS) and injuries (RHS) for North and South
Island, by time of day ..................................................................... 33 Chart A.4 Fatalities (LHS) and injuries (RHS) for young drivers, by
time of day ................................................................................... 34 Chart A.5 Fatalities (LHS) and injuries (RHS) for young drivers, by
gender and time of day ................................................................... 34 Chart A.6 Fatalities (LHS) and injuries (RHS) for older drivers, by
time of day ................................................................................... 35 Chart A.7 Fatalities (LHS) and injuries (RHS) for motorcyclists, by
week of the year ............................................................................ 35 Chart A.8 Fatalities (LHS) and injuries (RHS) for cyclists, by time of
day.............................................................................................. 36 Chart A.9 Fatalities (LHS) and injuries (RHS) for pedestrians, by time
of day .......................................................................................... 36 Chart A.10 Fatalities (LHS) and injuries (RHS) where alcohol or drugs
was a contributing factor to the crash, by time of day .......................... 37 Chart A.11 All crashes where alcohol was a contributing factor,
(weekly, with 12 week moving average, 1995-2015) ........................... 37 Chart A.12 Fatalities (LHS) and injuries (RHS) where speed was a
contributing factor to the crash, by time of day ................................... 38 Chart A.13 All crashes where speed was a contributing factor,
(weekly, with 12 week moving average, 1995-2015) ........................... 38 Chart A.14 Fatalities (LHS) and injuries (RHS) where distractions
were a contributing factor to the crash, by time of day ......................... 39 Chart A.15 Average age of vehicle fleet, by type (2000-2015) ............... 40 Chart A.16 Composition of fleet by year of manufacture, over time
(2000-2016) ................................................................................. 40 Chart A.17 Notices and infringements issued, by type (weekly, 1999-
2015) .......................................................................................... 41 Chart A.18 Speed camera operating hours, by type (1999-2015) ........... 42 Chart A.19 Speed camera infringements and lowered thresholds
(monthly, 2010-2015) .................................................................... 43 Chart A.20 Average monthly observed speed, by speed zone (2004-
2016) .......................................................................................... 44 Chart A.21 Road safety infrastructure expenditure (nominal dollars) ....... 44 Chart A.22 Number of casualty crashes and fuel prices (weekly,
2004-2015) .................................................................................. 45 Chart A.23 Number of casualty crashes and unemployment rate
(weekly, 1994-2015) ...................................................................... 46 Chart A.24 Number of casualty crashes and VKT/capita (2000-2015) ...... 46 Chart C.1 : Casualty crash simulation ................................................ 56 Chart C.2 : Casualty crash model, proportion speeding specification ....... 57

Qualitative and Quantitative Analysis of the New Zealand Road Toll: Final Report
Chart C.3 : Severity model simulation ............................................... 73 Chart D.1 International visitors and use of cars (self, family, friends
and company owned and rental cars) ................................................ 74 Chart D.2 Number of overseas licence holders seriously or fatally
injured ......................................................................................... 75 Chart D.3 Casualties where failure to give way was a contributing
factor, as share of casualties ............................................................ 75 Chart D.4 Casualties where distraction by mobile phones and other
devices were a contributing factor. .................................................... 76
Tables
Table 2.1 : Summary of components of road safety influenced by
factors 5 Table 3.1 : Number of casualty crashes coefficient estimates 12 Table 3.2 Crash severity, given a casualty crash has occurred, time
series coefficient estimates 16 Table 3.3 : Crash severity model (all injured persons) marginal
effects, given that a casualty crash has occurred 18 Table 4.1 Informing the ongoing monitoring framework 24 Table B.2 : Stratified models, variable definition 49 Table B.3 : Additional data sources 49 Table C.1 : Regression results, casualty crashes 54 Table C.2 : Regression results, severity crashes 57 Table C.3 : Regression results, stratified models 59 Table C.4 : Severity model coefficient estimates 65 Table C.5 Severity model marginal effects 69
Figures
Figure B.1 : Modelling method overview............................................. 48

Qualitative and Quantitative Analysis of the New Zealand Road Toll: Final Report
Glossary
ACC Accident Compensation Corporation
CAS Crash Analysis System
DAE Deloitte Access Economics
IRTAD International Traffic Safety Data and Analysis Group
ITF International Transport Forum
MBIE Ministry of Business, Innovation and Employment
MoT Ministry of Transport
NZTA New Zealand Transport Agency
OECD Organisation for Economic Co-operation and
Development
SRSP Supplementary Road Safety Package
VKT Vehicle kilometres travelled

Qualitative and Quantitative Analysis of the New Zealand Road Toll: Final Report
i
Key findings Motivated by recent increases in fatalities in New Zealand, this project has
sought to better understand the drivers of changes in the level of road
trauma in New Zealand over time and at a high level has found that:
the long-term trend shows that road travel has become far safer
over the last 25 years, despite a growing population and increasing
numbers of vehicles on the road – fatalities have more than halved from
747 in 1985 to 319 in 2015.
Whilst there have been short-term variations around this trend, recent
increases in fatalities in 2014 and 2015 are more likely to
represent a return to the longer-term trend or some
unobserved/chance dimension of road trauma, rather than a
systematic increase from the number of fatalities in 2011 and 2013.
This finding is reached through a simulation of what the fatality rate would
have been if the conditions driving the dip in fatalities in 2013 were applied
to 2014 and 2015.
At the next level of detail, the key explanators of the fluctuations in the
New Zealand road trauma over time are found in this modelling (and
consistent with the international experience/literature) to be:
An increase in the number of vehicle kilometres travelled (VKT). – The analysis suggests a more than one-for-one increase in the
number of crashes (and the rate at which those crashes are severe)
– this could imply that additional VKT is associated with higher risk
travel. Increases in the number of motorcycle registrations.
– This aligns with the relative vulnerability of motorcycles, which are
less visible to other road users and less stable (Ministry of
Transport, 2015).
In interpreting these findings, there is a need to be cognisant of the multi-
factor approach that this analysis has taken – that is, there is no one
single factor that can fully explain changes in the level of road
trauma.
There also remains a reasonable level of unexplained variation in
short run-changes in road fatalities. This could be the result of
unobserved factors (such as broader contextual changes relating to
changing driver behaviours and attitudes – which may not be currently
observed or measured), or could equally reflect the statistical ‘chance’
dimension to road trauma
When positioned alongside New Zealand’s road safety strategy, the findings
reinforce that there is a strong need to develop:
an ongoing monitoring and evaluation programme against which
progress towards New Zealand’s road safety goals can be measured;
new/further data to allow some of the unobservables to be brought
into future analysis of this type – for instance a more detailed
breakdown of the nature of VKT.
Together, these efforts will allow for a more complete understanding of the
drivers of change in road trauma and a more holistic approach to policy
evaluation, to ultimately create a stronger policy feedback loop and enable
the impact of road safety interventions to be continually strengthened.

Qualitative and Quantitative Analysis of the New Zealand Road Toll: Final Report
ii
Giv
en t
he s
trength
of th
e t
rend a
nd u
nobserv
ed v
ariation,
more
can b
e u
nders
tood o
f w
hat
has h
appened h
isto
rically,
and
goin
g f
orw
ard
, how
changin
g c
onte
xts
and r
oad u
sers
are
lik
ely
to im
pact
his
torical tr
ends
MO
NIT
OR
IN
G
An o
ngoin
g m
onitoring p
rogra
mm
e for
the M
inis
try w
ill pro
vid
e furt
her
and t
imely
evid
ence-b
ased g
uid
ance a
s t
o w
hic
h r
oad u
ser
cohort
s a
re a
t gre
ate
st risk o
f cra
shes a
nd c
rash s
everity
, and t
here
fore
are
as w
here
policy inte
rventions a
re
warr
ante
d, and a
re h
avin
g a
n im
pact,
by e
nabling a
deeper
unders
tandin
g:
•how
inte
rventions im
pact
on f
acto
rs found t
o b
e a
ssocia
ted w
ith c
rash lik
elihood
and s
everity
; and
•th
e c
hangin
g r
ela
tionship
betw
een t
hese f
acto
rs a
nd r
oad s
afe
ty (
e.g
. th
e
str
en
gth
of
the lin
k b
etw
een
ris
k f
acto
rs a
nd
ro
ad
trau
ma).
DA
TA
To u
nders
tand t
he identified r
ela
tionship
s in g
reate
r depth
, changin
g c
onte
xts
and b
roader
trends, th
ere
is a
need t
o incre
ase t
he:
•fr
eq
uen
cy o
f m
easu
rem
en
tof key facto
rs, such a
s v
ehic
le k
ilom
etr
es
travelled (
to im
pro
ve t
he g
ranula
rity
at
whic
h d
ata
is a
vailable
–to
allow
for
a
richer
unders
tandin
g o
f VKT),
and
•co
mp
lete
ness o
f d
ata
,such a
s t
hat
rela
ting t
o d
rug-d
rivin
g a
nd d
istr
actions
in t
he c
asualty d
ata
, giv
en t
he incre
asin
g f
ocus o
n t
hese c
ontr
ibuting f
acto
rs
as p
art
of
ongoin
g c
onte
xtu
al/
socia
l changes.
A s
afe
road s
yste
m is o
ne incre
asin
gly
fre
e o
f death
and s
erious inju
ry
0
100
200
300
400
500
600
700
800
900
1980
1985
1990
1995
2000
2005
2010
2015
FA
TA
LITIES
Ro
ad
travel h
as b
eco
me f
ar
safe
r o
ver t
he last
25
years,
despite a
gro
win
g p
opula
tion a
nd
incre
asin
g n
um
bers
of
vehic
les o
n
the r
oad
•W
hilst
there
have b
een incre
ases
in r
ecent
years
, fa
talities h
ave
more
than h
alv
ed f
rom
747 in
1985 t
o 3
19 in 2
015.
•O
ther
OECD
countr
ies a
re
experiencin
g s
imilar
patt
ern
s.
CR
AS
HE
S
While t
he n
um
ber
of
cra
shes h
as
fluctu
ate
d o
ver
tim
e,
there
has b
een
a d
ow
nw
ard
tre
nd s
ince 2
007
•The e
xception t
o t
his
dow
nw
ard
tr
end w
as a
n incre
ase in 2
015,
coin
cid
ing w
ith t
he incre
ase in
fata
lities
0
2,0
00
4,0
00
6,0
00
8,0
00
10,0
00
12,0
00
14,0
00
2000
2005
2010
2015
Wh
at
facto
rs a
re r
ela
ted
to
nu
mb
er
of
crash
es t
hat
occu
r e
ach
week?
Exp
lain
ing
recen
t in
creases in
th
e r
oad
to
ll?
Fin
din
gs f
rom
this
stu
dy:
Recent
incre
ases h
ave n
ot
been
driven b
y s
yste
matic c
hanges in t
he
chara
cte
ristics o
f cra
shes (
for
exam
ple
, re
lating t
o t
he indiv
iduals
or
vehic
les involv
ed)
Rath
er,
the e
xperience o
f re
cent
years
is m
ore
lik
ely
to r
epre
sent:
•a r
evers
ion t
o t
he longer-
term
, dow
nw
ard
tre
nd;
and/o
r
•unobserv
ed /
chance
com
ponents
in t
he n
um
ber
of
fata
lities o
bserv
ed
Wh
at
facto
rs a
re r
ela
ted
to
th
e s
everit
y o
f crash
es e
ach
week?
Fin
din
gs f
rom
this
stu
dy:
Incre
ased c
rash s
everity
over
tim
e is r
ela
ted t
o:
•In
cre
ases in v
ehic
le
kilom
etr
es t
ravelled
•D
ecre
ases in s
peed c
am
era
dete
ctions (
in p
revio
us
weeks)
•D
ecre
ases in a
dvert
isin
g
expenditure
(in
pre
vio
us
weeks)
The s
afe
syste
m a
ppro
ach r
eflects
that
the c
auses o
f ro
ad t
raum
a a
re m
ulti-
facete
d
Road
infr
astr
uctu
reVehic
le s
afe
tyVehic
le k
ms
travelled
Education a
nd
enfo
rcem
ent
Weath
er,
seasonality
Litera
ture
and p
ast
researc
h s
uggests
:
Fin
din
gs f
rom
this
stu
dy:
Incre
ases in t
he n
um
ber
of cra
shes o
ver
tim
e is
rela
ted t
o:
•In
cre
ases in v
ehic
le k
ilom
etr
es t
ravelled
•In
cre
ases in m
oto
rcycle
regis
trations
There
is a
lso a
n u
nexpla
ined /
chance c
om
ponent
to
the w
eek-o
n-w
eek v
ariation
•Estim
ate
d h
ere
to b
e a
ppro
xim
ate
ly o
ne-t
hird o
f th
e w
eekly
variation in t
he n
um
ber
of
cra
shes
Road
infr
astr
uctu
reVehic
le type
Vehic
le s
afe
tyEducation a
nd
enfo
rcem
ent
Litera
ture
and p
ast
researc
h s
uggests
:
Indiv
idual risk facto
rs inclu
de:
•Bein
g a
moto
rcyclist,
pedestr
ian o
r cyclist
•Alc
ohol or
dru
gs involv
ed
•Tra
vellin
g a
t in
appro
priate
or
hig
h s
peeds
•Tra
vellin
g o
n s
tate
hig
hw
ays
and o
ther
open r
oads
(exclu
din
g m
oto
rways)
•M
ale
driver
involv
em
ent
This
in t
urn
support
s t
he long-t
erm
vis
ion o
f a s
afe
syste
m

Qualitative and Quantitative Analysis of the New Zealand Road Toll: Final Report
iii
Executive summary
Reducing road trauma is an ongoing social imperative for any community.
In that respect, while New Zealand has been successful in reducing the
level of road trauma (on average) over time, there are annual fluctuations
which can be difficult to decipher – for instance fatalities falling to 284 in
2011 and 253 in 2013, and subsequently rising to 319 in 20151.
This experience aligns with many other OECD countries – with longer-term
declines in fatalities (hypothesised to be largely the result of improved road
infrastructure and vehicle safety) being counteracted by increases in more
recent years, most notably in Israel (15.4% increase between 2014 and
2015), Finland (13.5%) and Austria (10.5%; OECD/ITF, 2016).
To investigate the drivers behind the observed trends, the Ministry of
Transport (the Ministry) has commissioned a rigorous study into the
observable short and long-term drivers of road trauma in New Zealand, to
ultimately inform an ongoing research and monitoring agenda. This in turn
supports the achievement of the Safer Journeys strategy, which articulates
the long-term vision of having ‘a safe system2 increasingly free of death
and serious injury.’
Existing New Zealand and international evidence
A review of the New Zealand and international literature was undertaken, in
order to understand and identify:
the factors to be included in the statistical analysis;
the likely nature of their relationship with road trauma; and
broader contextual factors that could be changing those relationships
over time.
This literature identified a number of factors for inclusion in the statistical
analysis. Table i summarises how they are typically understood to influence
the components of the safe system approach and crash likelihood and
severity.
1 328 in 2016 (provisional), Ministry of Transport 2 A safe system aims to reduce road risks and minimise the consequences of road trauma through policies targeting the four components of the road system: roads and
roadsides, speed, vehicles and road use, whilst acknowledging that road users are vulnerable to injury and prone to error.

Qualitative and Quantitative Analysis of the New Zealand Road Toll: Final Report
iv
Table i : Summary of components of road safety influenced by factors
Other, broader contextual factors that were identified (and their impact on
road trauma) include:
changing media consumption habits – on the effectiveness of road
safety advertising;
increasing prevalence of mobile phones – on driver distractions;
an ageing population and pedestrian incidents – on crash severity;
sharing of roads with cyclists;
impact of second-hand vehicle importation laws – on the composition of
the New Zealand vehicle fleet and its crashworthiness; and
increasing road congestion – on the types of crashes that occur.
Whilst these factors are not explicitly included in the modelling (due to the
lack of data currently available), they nonetheless point to wider, societal
changes that future road safety policy and interventions should be
cognisant of.
Analytical approach
Informed by the literature3, a structured series of statistical analyses were
undertaken to establish the factors most likely to be driving the short- and
long-term changes in the level of road trauma in New Zealand over the last
15 to 20 years4, comprising:
Component A: modelling factors hypothesised to have driven changes
in the number of crashes that occurred each week, over time;
Component B:
– identifying the proportion of crashes that involved a serious or fatal
injury each week, over time – to capture the longer-term drivers of
the severity rate; and
3 In particular, the statistical approaches employed by Kockelman and Kweon (2002),
Weiss et al (2014), and O’Donnell and Connor (1996). In comparing with previous research undertaken in the New Zealand context – the methods used in this analysis
most closely align with those employed by Keall et al. (2012) and Infometrics (2013b). Taking longer term trends as given, both sets of analyses explore the
drivers of short term fluctuations in road trauma. 4 Statistical modelling allows the association of individual factors with the road toll to
be systematically isolated and identified. The data used goes back between 15 and 20 years.
Safe SystemCrash risk
CrashseverityFactors Roads Speeds Vehicles Users
Road infrastructure
Vehicle safety
Type of vehicle
Public education and enforcement
Economic activity (proxied by VKT)
Weather, seasonality, time of day
Overseas licence holders

Qualitative and Quantitative Analysis of the New Zealand Road Toll: Final Report
v
– modelling the key risk factors for severe and fatal injury, at an
individual casualty level – to capture the crash- and individual-
specific characteristics of interest.
The separate modelling of crash risk (Component A) and crash severity
(Component B) allows for the consideration of differences in relationships
across these two components.
These results were then further analysed to understand the extent to which
observed characteristics of crashes could explain recent increases in road
trauma.
Component A: Number of crashes over time
The first component of the modelling found that over the long-term there
has been a strong and sustained decrease in the number of crashes since
2000. With particular regard to short-term variations, the analysis found
that:
A 1% increase in VKT associated with a 2.5% increase in the number of
crashes.
– This could be associated with changes in the nature of VKT (such as
more rural, rather than urban travel, or different driver behaviour) –
but further research is required to understand the risk profile of
additional VKT.
A 1% increase in the number of motorcycle registrations was associated
with a 1.6% increase in the number of casualty crashes.
– This aligns with the relative vulnerability of motorcycles – which are
less visible to other road users and less stable (Ministry of
Transport, 2015).
It is important to note that these associations (and all associations found in
this study) relate to the variation in the number of crashes over the full
time period of analysis – not any individual week or year.
Despite the strength of these findings, approximately one third of the
variation in the number of crashes each week was unable to be explained
by the statistical model, and could relate to other, unobserved or currently
unmeasured factors (such as broader contextual changes relating to
changing driver behaviours and attitudes).
The results of this analysis also found that an increased number of
enforcement notices issued in the previous week of 1% is associated with a
decrease in the number of crashes of 0.1% in the current week. While not
as material as VKT and motorcycle registration, this result provides
affirmation of the importance of this road safety intervention.5
5 It was also found that the proportion of vehicles detected above the posted limit
was negatively associated with the number of casualty crashes, with a lag length of 10 chosen based on magnitude and significance. Testing revealed that the estimated
effect was significant between lags 7 and 12, with no significant variation in its magnitude.
(A) Casualty
crash
involvement(A) Factors driving
crash risk
(B) Injury
severity, given
casualty crash(B) Factors driving
injury severity
risk, given crash
has occurred

Qualitative and Quantitative Analysis of the New Zealand Road Toll: Final Report
vi
Component B: Severity of crashes
The second component of the modelling, to understand the factors that
have driven changes in the severity of crashes since 2000, found that:
A 1% increase in VKT is associated with an increase in the rate of
serious injury crashes (by 2.9%) and fatal crashes (by 1.9%) per
casualty crash.
– This could similarly be the result of changes in the nature of VKT
(such as more travel on rural roads) – likewise suggesting the need
to further explore these differences.
A 1% increase in speed camera detections six weeks earlier is
associated with a 1.2% decrease in the number of serious crashes
(given that a casualty crash has occurred).
– Similarly pointing to the presence of a deterrent effect.
Increases in advertising expenditure four weeks earlier by 1% is
associated with a reduction in the proportion of crashes that result in
severe injury by 0.07%.
– This could be thought to relate to the time it takes for advertising to
translate into awareness and changes in attitudes and behaviours.
Beyond the analysis of the factors explaining short- and long-term road
trauma trends in New Zealand, statistical analysis was also undertaken to
identify the cross-section of key risk factors for suffering a severe
injury or fatality (rather than a minor injury) since 1995, given
involvement in a crash.
Table ii describes the impact of a selection of the most important risk
factors, the most notable being:
being a motorcyclist, cyclist or pedestrian greatly increases the risk of a
severe or fatal injury relative to an individual travelling in a car,
reflecting the relative fragility and vulnerability of these road users;
casualty crashes where alcohol or drugs, or inappropriate speeds were a
contributing factor are also more likely to result in severe or fatal injury,
reflecting the effects of impairment and high speed crashes,
respectively; and
casualty crashes on rural state highways and other open roads (which
are more likely to be single carriageway and have fewer safety barriers
installed) are more likely to result in severe or fatal injury, relative to
crashes on minor urban roads, capturing the more severe consequences
of high speed crashes.
Table ii : Severe and fatal injury likelihood associated with risk factors
Risk factor Relative to Severe injury likelihood
(relative to minor injury)
Fatal injury likelihood
(relative to minor injury)
Motorcyclists Travelling in car 20.5 percentage points 2.8 percentage points
Pedestrians Travelling in car 28.9 percentage points 11.2 percentage points
Cyclists Travelling in car 24.7 percentage points 6.5 percentage points
Travelling in truck, SUV
or bus Travelling in car -0.4 to -2.3 percentage points
-0.2 to -1.8 percentage
points
Alcohol or drugs Other crash factors 5.9 percentage points 1.9 percentage points
Inappropriate speed Other crash factors 2.7 percentage points 1.4 percentage points

Qualitative and Quantitative Analysis of the New Zealand Road Toll: Final Report
vii
Risk factor Relative to Severe injury likelihood
(relative to minor injury)
Fatal injury likelihood
(relative to minor injury)
≥ 100m/h speed zone 50km/h to 70km/h
speed zone 2.0 percentage points 0.7 percentage points
State highways (urban
and rural) and other
open roads
Minor urban roads 2.6 to 3.4 percentage points 1.0 to 2.1 percentage points
Male driver involved in
crash
No male drivers
involved in crash 1.2 percentage points 0.9 percentage points
Restricted or learner
licence driver Full licence driver -0.1 to 0.5 percentage points -0.1 percentage points
Two vehicle crashes Single vehicle crash -1.3 percentage points -0.2 percentage points
Note: For some risk factors a range is noted because the estimated effects relates to multiple
factors (for instance, trucks are considered separately from SUVs or buses – but are grouped
here for the purposes of brevity).
These findings reinforce that there are a variety of severity risk factors
relating to the characteristics of a crash, and affirmed what has been
previously found in the literature from New Zealand and other jurisdictions
– with male drivers, relative inexperience, speeding, alcohol and/or drug
presence, and light vehicle types being key risk factors for more severe
crash injury outcomes.
Understanding what this means in the broader context
The final component of the modelling sought to understand what these
identified drivers and risk factors meant in the context of recent trends in
road fatalities (both the historical lows and subsequent increases). This
analysis seeks to answer the question, “What would the fatality rate have
been if the external conditions driving the dip in fatalities in 2013 were
applied to 2014 and 2015?”
Chart i seeks to understand what the fatality rate would have been if the
conditions driving the dip in fatalities in 2013 were applied to 2014 and
2015, by comparing the:
Actual fatality rate (black line);
Predicted fatality rate (green line)
– Which removes the unexplained component of fluctuations from the
Actual fatality rate
Simulated fatality rate (blue line)
– Which applies the average 2013 fatality risk to 2014 and 2015.

Qualitative and Quantitative Analysis of the New Zealand Road Toll: Final Report
viii
Chart i : Comparison of actual, predicted and simulated fatality rates
Source: Deloitte Access Economics
Essentially, this analysis implies that the historically low number of fatalities
in 2013 was more likely a reflection of an abnormal year – driven by
broader, unobserved factors and trends, rather than the result of some
systematic change in the nature of crashes themselves, and therefore more
likely that the increases in fatalities in 2014 and 2015 is likely to represent
a reversion to the longer-term trend.
If the increases in 2014 and 2015 were instead being driven by the
characteristics of the crash – the simulated fatality rate would have
been closer to the predicted fatality rate. This is because the simulation
is based on the known characteristics of fatalities in 2013, not the
unknown factors that were present in 2014 and 2015.
Implications for ongoing monitoring and research
An ongoing monitoring programme for the Ministry will provide further and
more-timely, evidence-based guidance as to which road user cohorts are at
greatest risk of crashes and crash severity, and therefore areas where
policy interventions are warranted, and are having an impact. It will also
therefore allow for an improved understanding of progress towards the
long-term vision of the Safer Journeys strategy.
In particular, the initial monitoring framework outlined in Section 4.2 of this
study will enable a deeper understanding among policymakers and
researchers of:
how interventions impact on factors found to be associated with crash
likelihood and severity; and
the changing relationship between these factors and road safety (e.g.
the strength of the link between risk factors and road trauma).
Further, and in particular respect of the available data, the findings of this
study reinforce the continued need to enhance the:
frequency of measurement of key factors, such as vehicle kilometres
travelled (to improve the granularity at which data is available – to
allow for a richer understanding of VKT), and
2.0%
2.5%
3.0%
3.5%
4.0%
4.5%
Fata
lity
rate
, giv
en involv
em
ent
in
cra
sh
Actual fatality rate Predicted fatality rate Simulated fatality rate

Qualitative and Quantitative Analysis of the New Zealand Road Toll: Final Report
ix
completeness of data, such as that relating to drug-driving and
distractions in the casualty data, given the increasing focus on these
contributing factors as part of ongoing contextual/social changes.
A number of other areas for future and ongoing research are also identified,
including exploring the impact of contextual changes such as: (1) the
effects of driving while impaired by drugs; (2) the compounding effects of
drug and alcohol impairment; (3) high-risk locations and crash types for
cyclists and pedestrians; (4) changing mobile phone and device use in
vehicles; and (5) how increases in road congestion might affect the types of
crashes that occur. Improvements to the existing and new data collected
will allow for more complete analysis and conclusions relating to these
research questions, and would ideally precede (or be a part of) these
studies
In the end, there is a need to ensure that future Ministerial (and
supporting) effort builds the evidence-base for what road safety
interventions work (and equally, what doesn’t work) in reducing road
trauma. This will better ensure that a balanced view of investment
prioritisation is taken, and that interventions with the greatest impact,
subject to their costs, are implemented. Reductions in road trauma is of
broad interest, given its life-changing impact not just on those individuals
involved in crashes, but their families and wider community, and the
significant economic and social costs associated.
Deloitte Access Economics

1
1 Introduction
The Ministry of Transport (the Ministry) has commissioned Deloitte Access
Economics to undertake a qualitative and quantitative analysis of the New
Zealand road toll. The primary purpose of this study is to understand the
factors that have contributed to changes in fatalities and serious casualty
crashes in New Zealand over time – and the reasons for substantial
fluctuations in the road toll over recent years.
This chapter outlines the New Zealand road safety context, motivations for
the study and the structure of the remainder of the report.
1.1 Road trauma and road safety in New Zealand
Over the last few decades, strong progress has been made in reducing the
road toll in New Zealand, from 747 fatalities in 1985, to 319 in 2015,
despite increasing numbers of vehicles and a growing population. At the
same time, each year is characterised by short-term fluctuations in the road
toll, notably the fall to 284 fatalities in 2011 (from 375 in 2010), and
further falling to 253 fatalities in 2013, followed by increases in 2014 and
2015 (Chart 1.1).
Chart 1.1 New Zealand road fatalities (1980 to 2015)
Source: Ministry of Transport (2017). Note: Fatalities are shown on the left Y-axis; Population
and vehicles are shown on the right Y-axis.
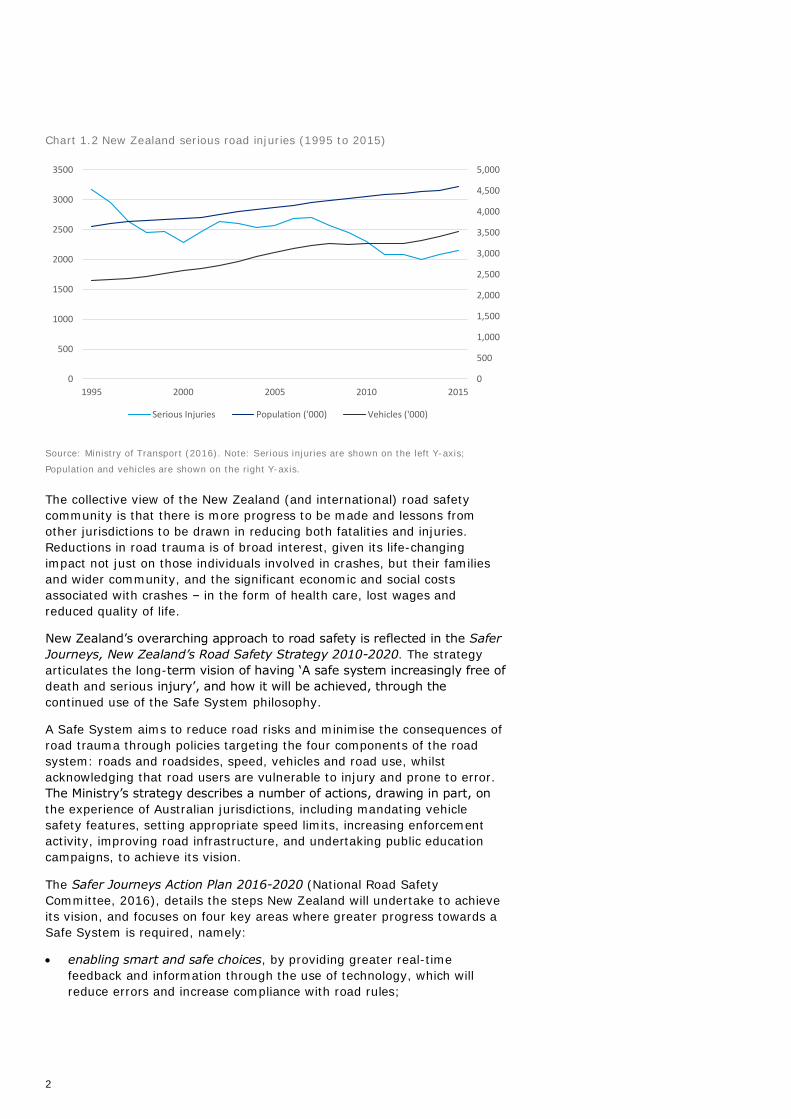
The number of serious road injuries each year has likewise reduced, from
3,168 in 1995 to 2,148 in 2015 (Chart 1.2), and again there have been
substantial fluctuations over time with the lowest number of injuries in 2013
(1,999).
0
500
1,000
1,500
2,000
2,500
3,000
3,500
4,000
4,500
5,000
0
100
200
300
400
500
600
700
800
900
1980 1985 1990 1995 2000 2005 2010 2015
Fatalities Population ('000) Vehicles ('000)
2
Chart 1.2 New Zealand serious road injuries (1995 to 2015)
Source: Ministry of Transport (2016). Note: Serious injuries are shown on the left Y-axis;
Population and vehicles are shown on the right Y-axis.
The collective view of the New Zealand (and international) road safety
community is that there is more progress to be made and lessons from
other jurisdictions to be drawn in reducing both fatalities and injuries.
Reductions in road trauma is of broad interest, given its life-changing
impact not just on those individuals involved in crashes, but their families
and wider community, and the significant economic and social costs
associated with crashes – in the form of health care, lost wages and
reduced quality of life.
New Zealand’s overarching approach to road safety is reflected in the Safer
Journeys, New Zealand’s Road Safety Strategy 2010-2020. The strategy
articulates the long-term vision of having ‘A safe system increasingly free of
death and serious injury’, and how it will be achieved, through the
continued use of the Safe System philosophy.
A Safe System aims to reduce road risks and minimise the consequences of
road trauma through policies targeting the four components of the road
system: roads and roadsides, speed, vehicles and road use, whilst
acknowledging that road users are vulnerable to injury and prone to error.
The Ministry’s strategy describes a number of actions, drawing in part, on
the experience of Australian jurisdictions, including mandating vehicle
safety features, setting appropriate speed limits, increasing enforcement
activity, improving road infrastructure, and undertaking public education
campaigns, to achieve its vision.
The Safer Journeys Action Plan 2016-2020 (National Road Safety
Committee, 2016), details the steps New Zealand will undertake to achieve
its vision, and focuses on four key areas where greater progress towards a
Safe System is required, namely:
enabling smart and safe choices, by providing greater real-time
feedback and information through the use of technology, which will
reduce errors and increase compliance with road rules;
0
500
1,000
1,500
2,000
2,500
3,000
3,500
4,000
4,500
5,000
0
500
1000
1500
2000
2500
3000
3500
1995 2000 2005 2010 2015
Serious Injuries Population ('000) Vehicles ('000)

3
making motorcycling safer, given the additional vulnerabilities that
these road users face and the minimal reductions in road trauma for
motorcycle users over the last 15 years;
ensuring roads and roadsides support safer travel, given the residual
risk posed by high risk roads (such as certain urban arterial routes and
rural roads); and
encouraging safe vehicles, by taking actions to increase the level of
vehicle safety features across the fleet, to prevent or reduce the effects
of human error.
1.2 Motivations for this study
This project aims to explore the nature of changes in the road toll in New
Zealand and provide a richer understanding of the drivers of those changes.
This will be used to:
inform Ministers and the public of the underlying factors that have
driven changes in the road toll in recent years, particularly the decline in
fatalities in 2011 and 2013, and increases in subsequent years; and
improve the Ministry’s understanding of the impacts of different factors
and road safety interventions on the road toll, thereby allowing the
Ministry to develop an ongoing monitoring programme and identify
areas to prioritise future road safety research (and ultimately
intervention).
1.3 Report structure
This report presents the findings of this analysis and is structured as
follows:
Chapter 2 describes the New Zealand and international literature around
the factors that have been shown to influence road trauma, and the
magnitude of their impact;
Chapter 3 sets out the datasets used, modelling approach and modelling
results; and
Chapter 4 presents the key findings from this study, and the
implications for the Ministry’s ongoing monitoring programme and
research agenda.
Detailed appendices that describe the data, modelling approach and results
are also included.

4
2 Literature review
This chapter briefly examines the literature relating to the key factors that
are commonly thought to influence the road toll. This allows for a strong
theoretical structure to this study’s approach to be established, and ensures
that empirical techniques that align with the best available data (and
accordingly allow for the realisation of their explanatory power) are applied.
2.1 International trends
Globally, trends in road fatalities are similar to those observed in New
Zealand. In New Zealand there has been a 37% decrease in fatalities
between 2000 and 2014, as compared to a 42% decrease in fatalities in the
32 International Traffic Safety Data and Analysis Group (ITRAD) countries
over the same period, and a recent increase in fatalities in 2015 for 19
countries, with Israel (15.4% increase from 2014), Finland (13.5%) and
Austria (10.5%) experiencing the fastest increases (OECD/ITF, 2016).
The longer term trend is thought to have been the result of improved road
infrastructure and vehicle safety, and the downturn in economic activity in
2008, which would have reduced overall travel volumes, particularly for
high risk groups (young male drivers; OECD/ITF, 2015). In light of
improving economic conditions in countries most affected by the downturn,
increases in the 2015 road toll are to be monitored carefully, to understand
whether they are part of a broader trend that requires a policy response
(OECD/ITF, 2016).
The types of road users being fatally injured has also changed over time- -
with fewer fatalities for car occupants in most countries, but more fatalities
for motorcyclists, cyclists, pedestrians and those aged 65 and over
(OECD/ITF, 2016). This suggests a need to ensure that road safety policy
targets changing cohorts of vulnerable road users, who are more
susceptible to severe injury, as well as continuing to reduce the prevalence
of risky behaviours (such as drink-driving, speeding and use of restraints
and helmets; OECD/ITF, 2016).
2.2 Factors thought to influence road trauma
This section outlines a number of factors identified in the literature as
having an impact on road trauma, whether that be through influencing the
number of crashes, or the injury severity of crashes given that a crash has
occurred. Table 2.1 summaries the impact, found in the literature, which
each factor has on the components of the Safe System approach, and crash
likelihood and severity.

5
Table 2.1 : Summary of components of road safety influenced by factors
2.2.1 Road infrastructure
Road infrastructure has numerous dimensions – including road condition,
camber, lane width and separation, lighting, roadside hazards and safety
features, and expenditure on road infrastructure needs to be greater than
the amount required to simply maintain the current condition of roads in
order to have an additional overall impact (Stroombergen, 2013).
Stroombergen (2013) found in the New Zealand context that 19% of the
change in the fatality rate between 1990 and 2012 could be attributed to
improvements in road infrastructure (measured as real net investment per
unit of travel).
This is supported by econometric findings in the Australian context (BITRE,
2012), which found that the black spot treatments reduced fatal and
casualty crashes at treatment sites by 30%. Roundabouts were the most
effective treatments, followed by new signals during the day and altering of
traffic flow direction.
Road design also has the ability to influence the speed at which road users
choose to drive – explicitly, through road signage and markings, and
implicitly, through road geometry (narrow roads, or those with rough
surfaces are likely to induce drivers to travel more slowly) and roadside
environment (number of roadside objects impacting on peripheral vision
and perceived speeds). Manipulating road design to enable greater
alignment between the actual appropriate speed of the road, and the
perceived appropriate speed of the road could have positive impacts for
road safety (Edquist et al, 2009).
2.2.2 Vehicle safety technology
Improvements in vehicle safety can lead to improved road safety outcomes
in three ways:
reducing the likelihood of a crash (e.g., through electronic stability
control, ESC or auto-emergency braking);
reducing the injury severity of occupant casualties, given a crash (e.g.,
through seatbelt reminder systems and side curtain airbags); and
reducing the likelihood that other road users are impacted in a crash
(through improved vehicle design) (Ministry of Transport, 2010).
Safe SystemCrash risk
CrashseverityFactors Roads Speeds Vehicles Users
Road infrastructure
Vehicle safety
Type of vehicle
Public education and enforcement
Economic activity (proxied by VKT)
Weather, seasonality, time of day
Overseas licence holders

6
These improvements are generally analysed through the examination of
data relating to vehicle year of manufacture – which is correlated with the
general level of vehicle safety features. This is particularly important in the
New Zealand context, where the majority of light vehicles entering the fleet
in 2015 were used (54%, with an average age of 9.4 years). These used
vehicles would, on average, have fewer safety features than a new vehicle
entering the fleet in 2015 (Ministry of Transport, 2016).
The cross-sectional crashworthiness of the New Zealand vehicle fleet
improved by 18% between 2000 and 2010 (Budd et al, 2015). In addition,
the risk of a fatality or serious injury to drivers decreased by 78% between
1983 and 2008 (Newstead et al, 2016). This is supported by findings from
Stroombergen (2013) that 44% of the decline in fatalities in New Zealand
between 1990 and 2012 could be attributed to improvements in the
vehicles, and highlights the importance of vehicle safety features in
reducing road trauma.
2.2.3 Type of vehicle
In addition to vehicle age, the type of vehicle can impact upon the severity
of road trauma, in crash situations involving heavy vehicles and light
passenger vehicles.
Collisions involving articulated trucks, rigid trucks and buses all result in
increased risk of death or injury to drivers of light vehicles, particularly for
those driving light passenger cars, small passenger cars and compact 4WDs
(Delaney et al, 2007). Given that the vehicle fleet is trending towards a
more bimodal distribution of masses, crashes involving vehicles with
significantly different mass are more likely, and more likely to lead to more
severe injury outcomes, particularly for the lighter vehicle (Newstead et al,
2016).
Motorcyclists are also more vulnerable to road trauma than other road
users, given motorcycles provide less protection to a rider than a car to its
occupants, are less visible to other road users and are less stable. This
results in an average risk of injury or death being 21 times higher for
motorcyclists than car drivers, when controlling for the distances travelled
by motorcycles and passenger cars, respectively (Ministry of Transport,
2015).
2.2.4 Public education and enforcement
New Zealand has used advertising to target road safety since the
introduction of the Supplementary Road Safety Package (SRSP) in 1995.
Since then, road safety themes targeted by the NZTA and Police include:
drink and drug driving;
speeding;
restraint (seat belt) use;
intersection safety;
fatigue; and
high risk groups (such as rural audiences and young male drivers;
Cameron and Sullivan, 2011).
Evaluations of the SRSP have found that the use of advertising and
enforcement, targeted at drink-driving, speeding and seatbelt use, was
effective in reducing fatalities (by 285, over a five year period to June
2000; Guria and Leung, 2004) and serious casualties (between 1998 and
2010; Cameron and Sullivan, 2011), consistent with findings from other
jurisdictions.

7
Young drivers (and particularly young male drivers) are disproportionately
represented in road trauma, at least in part due to their greater likelihood
of engaging in risky driving behaviours. The transition from learner to
restricted licence, and restricted to full licence is associated with increases
in the crash rate for drivers – as novice drivers are still gaining the ability to
perceive hazards and navigate complex situations (Lewis-Evans, 2010;
Weiss et al, 2014).
Graduated licensing systems, such as those in place in New Zealand, aim to
provide novice drivers with the opportunity to gain experience, whilst
limiting their exposure to higher-risk situations (such as accompanied by
peer-group passengers or driving at night) that have been found to increase
crash injury severity (Weiss et al, 2014). Other significant risk factors
include seatbelt non-use, drink-driving, inexperience, fatigue and reckless
driving behaviour – all of which can be influenced through public education
and enforcement, and have complementary effects (Tay, 2005).
New Zealand Police have undertaken enforcement campaigns over high risk
periods (such as December and January, called ‘Safer Summer’) in order to
deter risky driving behaviour through lower speed enforcement thresholds
and greater traffic enforcement intensity. An evaluation of this campaign
found that there were significant decreases in the proportion of vehicles
exceeding the speed limit during the campaign, relative to years where the
campaign did not run (van Lamoen, 2014).
However, the effectiveness of public education and enforcement is indirect –
in that it relies on these interventions to create awareness amongst road
users and a deterrent effect, which influences behaviour, and in turn,
impacts on crash risk and/or crash injury severity. These interventions need
to be well designed and coordinated to ensure that their potential impacts
are realised – and involve ongoing effort, to ensure awareness and
behaviour change is maintained over time (Cameron and Sullivan, 2011).
2.2.5 Economic activity
Vehicle kilometres travelled acts as a measure of exposure to crashes, and
is thought to be influenced by economic factors.
Conceptually, as general economic activity increases (e.g., as measured by
falling unemployment) or factors affecting vehicle economics change (e.g.,
lower fuel prices), more kilometres may be travelled, increasing the level of
exposure. However, increased economic activity may also lead to decreases
in the risk of a casualty – through a lower average age of the vehicle fleet
(and improved safety features), greater government funding for road safety
interventions, or improved driver behaviour (IRTAD, 2015; Scuffham and
Langley, 2002).
Scuffham and Langley (2002) found in their analysis of New Zealand road
fatalities that increases in unemployment and decreases in real gross
domestic product (GDP) were associated with a decrease in crashes in the
short-term. Analysis by Elvik (2009) for 14 OECD countries found that two-
thirds of the decline in fatalities during 2009 and 2010 were associated with
the increase in unemployment in those countries over that period.
2.2.6 Weather, seasonality, and time of day
Poor weather conditions are, at first glance, thought to be associated with
poorer road safety outcomes. However, Keall et al (2012) notes that the
impact of poor weather on fatalities is not conceptually clear – bad weather
could result in more difficult vehicle control, but also result in more careful

8
driving (as drivers adapt to the conditions), or fewer kilometres travelled
(as individuals delay or cancel travel).
Seasonality (or month of year) is often used in modelling to approximate
different average weather and travel patterns across a year (for instance,
there may be greater travel by motorcycles in warmer months of the year).
This approach has been used by Guria and Leung (2004), who found, with a
series of quarterly indicator variables, that the October-December quarter
was associated with a higher crash risk in New Zealand, coinciding with
warmer weather. The time of day may also be associated with the risk or
severity of a crash, as it relates to the likelihood of other risk factors (such
as fatigue or drink-driving being present).
2.2.7 Number of overseas licence holders
New Zealand has a strong tourism industry, and with this, comes driving by
overseas licence holders. An analysis of overseas driver crashes conducted
by the Ministry of Transport (2016) found that approximately 6% of crashes
involved an overseas licence holder, and of this, 77% are short-term
visitors to New Zealand, between 2011 and 2015.
The prevalence of overseas drivers involved in crashes also varied by
region, with a quarter of all crashes in tourist areas on the South Island
involving an overseas driver. Approximately one third of at-fault overseas
licence holders failed to adjust to New Zealand rules or conditions (Ministry
of Transport, 2016). The failure to adapt to local rules may have been
particularly notable in relation to the intersection “give way” rules in New
Zealand up until 25 March 2012, when the rules were changed.
However, there is no reliable measure of the extent of driving or distances
travelled by overseas licence holders, and thus the prevalence of crashes
(and casualties) amongst overseas licence holders cannot be easily
compared to those of domestic licence holders in order to determine
whether being an overseas driver in New Zealand has a statistically
significant impact on the likelihood of a crash, or the severity of a crash.
Appendix D contains some descriptive analysis of crashes involving
overseas licence holders and discussion of tourism trends in New Zealand.
Research from other jurisdictions suggests that whilst motor vehicle crashes
are the most common cause of death or injury for tourists (followed by
drowning), they remain a small proportion of the overall number of road
fatalities (Wilks and Pendergast, 2010). The available analysis from
Australia suggests that crashes involving international factors are no more
(or less) likely to be the result of alcohol or speed than other crashes, but
are more likely to be the result of problems such as:
driving an unfamiliar vehicle in unfamiliar conditions (on the other side
of the road and adapting to local rules);
failure to wear seat belts; and
driver fatigue due to underestimation of driving distances and times
(Watson et al, 2004).
2.3 Broader contextual factors that might be changing the
nature of these relationships over time
There may also be broader trends that have impacted the nature of
relationships historically observed in the data and literature, and may not
have been the subject of New Zealand-specific research.
These factors could include the impact of:

9
changing media consumption habits (that is, the increasing use of
streaming video services and social media) and the effectiveness of
advertising on those media and ability to reach high risk groups, both
overall, and relative to traditional advertising channels such as
television – with research suggesting that online advertising has to be
increasingly targeted and use obtrusive elements in order to attract
viewer attention (Goldfarb and Tucker, 2011; Dreze and Hussherr,
2003);
the increasing prevalence of mobile phones may have on driver
distractions, and their perception of the risk posed by such distractions,
Hallett et al (2011) found, through a survey of New Zealand drivers,
that more than 60% of respondents had conversed on their phone
whilst driving in the past week, and that 38% of respondents felt that
this behaviour was ‘moderately safe’, despite the academic literature
suggesting otherwise; and pedestrians using mobile phones are more
likely to walk slowly, change directions more often, and are less likely to
acknowledge other individuals or stimuli (Hyman et al, 2010). Some
descriptive analysis of distractions as a factor in crashes are included in
Appendix D;
an ageing population and pedestrian incidents may have on crash
severity – with Li et al (2003) finding that fragility (defined as risk of
death, given involvement in a crash) began increasing at age 60, and
appeared to be the key driver of increased fatality per unit of exposure
for older drivers;
increasing sharing of roads with cyclists may have on crash
likelihood and severity, with an Australian study finding that the number
of serious cyclist injuries has coincided with participation in cycling, and
that cyclist visibility and driver awareness of cyclists is a key risk factor
(Johnson et al, 2010) and New Zealand data suggesting that the injury
rate for cyclists in New Zealand is second only to motorcyclists and has
risen over time (Tin et al, 2009);
changes in second-hand vehicle importation laws and regulations
may have on the composition of the New Zealand vehicle fleet – with
analysis showing that the crashworthiness of used imports, by first year
of registration improved between 1986 and 2014, but that used imports
brought into the New Zealand fleet in a given year are less crashworthy
than new vehicles entering the fleet, and given that the average of used
imports is increasing, this will likely increase the safety features gap
over time (Newstead et al, 2016; and
increasing road congestion may have on the nature of crashes that
occur – with Marchesini and Weijermars’ 2010 review of the literature
suggesting that speed variability increases the likelihood of crashes (but
that the impact on crash severity is mixed) and that unstable traffic flow
conditions are more likely to lead to rear-end crashes and multi-vehicle
crashes.
10
3 Modelling approach and results
This chapter outlines the data used, modelling approach and results of the
econometric analysis, to understand the factors that have influenced the
New Zealand road toll over the last 15 to 20 years.
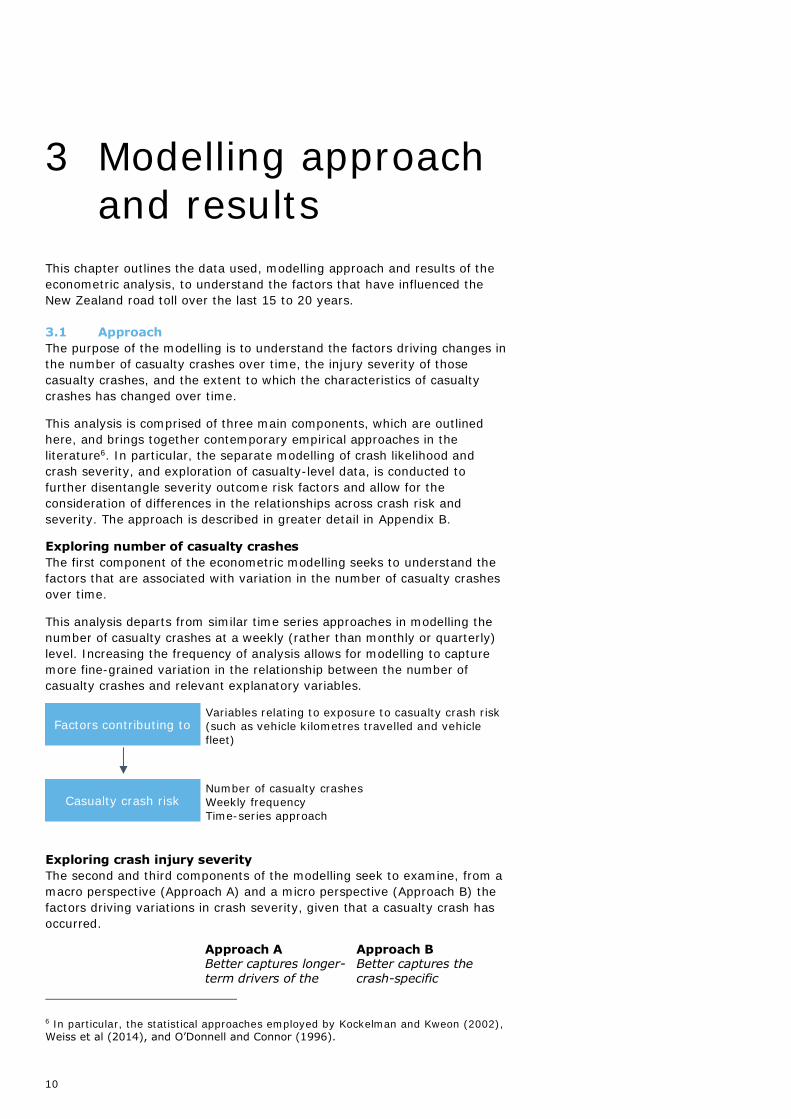
3.1 Approach
The purpose of the modelling is to understand the factors driving changes in
the number of casualty crashes over time, the injury severity of those
casualty crashes, and the extent to which the characteristics of casualty
crashes has changed over time.
This analysis is comprised of three main components, which are outlined
here, and brings together contemporary empirical approaches in the
literature6. In particular, the separate modelling of crash likelihood and
crash severity, and exploration of casualty-level data, is conducted to
further disentangle severity outcome risk factors and allow for the
consideration of differences in the relationships across crash risk and
severity. The approach is described in greater detail in Appendix B.
Exploring number of casualty crashes
The first component of the econometric modelling seeks to understand the
factors that are associated with variation in the number of casualty crashes
over time.
This analysis departs from similar time series approaches in modelling the
number of casualty crashes at a weekly (rather than monthly or quarterly)
level. Increasing the frequency of analysis allows for modelling to capture
more fine-grained variation in the relationship between the number of
casualty crashes and relevant explanatory variables.
Variables relating to exposure to casualty crash risk
(such as vehicle kilometres travelled and vehicle
fleet)
Number of casualty crashes
Weekly frequency
Time-series approach
Exploring crash injury severity
The second and third components of the modelling seek to examine, from a
macro perspective (Approach A) and a micro perspective (Approach B) the
factors driving variations in crash severity, given that a casualty crash has
occurred.
Approach A Better captures longer-term drivers of the
Approach B Better captures the crash-specific
6 In particular, the statistical approaches employed by Kockelman and Kweon (2002), Weiss et al (2014), and O’Donnell and Connor (1996).
Factors contributing to
Casualty crash risk

11
severity rate, and how those drivers may have changed over time
characteristics of interest
Variables relating to the
system (roads, road
users, vehicles, speeds)
Characteristics relating to
the crash (roads, road
users, vehicles, speeds)
Number of severe, fatal
casualty crashes
Weekly frequency
Time-series approach
Probability that an injury
is minor, severe or fatal
Unit records
Micro-econometric
approach
Extent to which the characteristics of fatal crashes have changed
since 2013 (Counterfactual analysis)
The final component of the analysis seeks to uncover the extent to which
the nature of fatalities that have occurred in 2014 and 2015 have
systematically differed from those up to 2013, and whether those changes
are related to observed or unobserved factors.
Using the results of Approach B, to understand the
extent to which the characteristics of casualty
crashes have changed, through a comparison of
actual and model-predicted fatalities
The approach to specifying each model was consistent and systematic, and
involved the following steps (which are described in detail in Appendix B):
1. Identify the form of the equation, as determined by the
statistical distribution and estimation method
2. Determine the appropriate explanatory variables to include in
the model, through significance testing and those identified to
be most likely to be important factors through the literature
review
3. Ensure the robustness of the specification through testing
Taken together, these approaches allow for a systematic identification of
the factors that drive the number of crashes occurring over time, and the
severity of those crashes (both over time, and in relation to the
characteristics of individuals involved).
3.2 Descriptive statistics
Data for this project was collected from the following sources:
Ministry of Transport,
New Zealand Transport Agency,
New Zealand Police,
Ministry of Business,
Innovation and Employment, and
Statistics New Zealand.
A key component of the analysis, prior to commencing modelling, was to
examine descriptive statistics of the data. This process serves to identify
key relationships between the variables of interest, and in particular the
relationship between casualty crashes and the available explanatory
variables. This step also provided an additional level of confidence in the
Factors contributing to
Crash severity, given
casualty crash has
occurred
Counterfactual analysis
(changes in fatal crash
characteristics)

12
modelling by ensuring that was sufficient variation in the data to provide
reliable modelling results.
Descriptive statistics of the casualty crash data revealed strong differences
across a number of crash-related characteristics (such as injury severity,
vehicle type, gender and age, and factors contributing to a crash, amongst
others), and that the patterns of crashes varied across groups.
The descriptive statistics for other explanatory variables further illustrated
that there were readily observable and intuitive trends over time in the
data, which could be analysed through econometric modelling.
Detailed descriptive statistics are presented in Appendix A.
3.3 Results and Discussion
This section presents the main results of the econometric modelling and
discusses some of the key findings. Full results are included in Appendix C.
3.3.1 Number of casualty crashes
The first set of modelling undertaken seeks to understand the drivers of the
number of casualty crashes observed in New Zealand over time.
Following the approach outlined above, the modelling estimates the impact
that a 1% increase in each of the explanatory variables has on the number
of crashes (in percentage terms) observed in a given week. For example, a
1% increase in VKT is associated with a 2.5% increase in the number of
crashes. These estimates are presented in Table 3.1 below.
Table 3.1 : Number of casualty crashes coefficient estimates
Variable Estimate
Log VKT 2.522***
Log motorbikes 1.585***
Log enforcement 0.067**
Log-lag enforcement -0.0990***
Lag proportion speeding -1.0845**
52nd lag -0.148***
N 614
R2 66.06%
Source: Deloitte Access Economics (2016). Note: Statistical significance at the 10%, 5%, and 1%
are represented by *, **, and ***, respectively. N represents the number of weeks included in
the modelling, R2 is a measure of model fit (the extent to which the included variables explain the
variation in the number of crashes each week). The final specification of the model only includes
the variables found to statistically significantly improve the model fit (and are all listed in the
table above). Other potential explanatory variables were tested, but found to have no statistically
significant explanatory power. Variables are log (logarithm) transformed in order to satisfy
statistical assumptions of the model, and for ease of interpretation of the results.
The results presented above suggest that crash risk is strongly influenced to
vehicle kilometres travelled (VKT) – as a 1% increase in VKT is associated
with a greater than 1% increase in the number of crashes. It is important to
note that these associations (and all associations found in this study) relate
to the variation in the number of crashes over the full time period of
analysis – not any individual week or year.

13
A 1% increase in number of motorcycle registrations is also associated with
a greater than proportional (1.6% increase) in the number of crashes –
which may be the result of the relative vulnerability – which are less visible
to other road users and less stable (Ministry of Transport, 2015).
Contemporaneous enforcement (total infringements issued7) is associated
with a small increase in the number of crashes (a 1% increase in
enforcement in this this period is associated with a 0.07% increase in the
number of crashes) – however, this may be related to the fact that police
activity is targeted at times of the year and locations of higher crash risk
(resulting in greater detection being associated with more crashes).
The lagged enforcement effect suggests that enforcement activity in the
previous period decreases the number of crashes in the current period
(suggesting that there is a deterrent effect occurring, with a 1% increase in
enforcement in previous time periods associated with a 0.1% decrease in
the number of crashes – and, taken together, suggesting that increases in
enforcement activity, over time, are associated with decreases in the
number of crashes).
Similarly, the proportion of vehicles recorded speeding over the posted limit
(through mobile and fixed cameras) in previous periods is associated with a
decrease in the number of crashes, again suggesting the existence of a
deterrent effect (that occurs as the result of visible operations, or the
receipt of an infringement notice).8 Risk-weighted speed detections were
also tested (following the approach of Kloeden et al, 2002), but were not
found to be significant.
Modelling revealed that general (unexplained) trends in the number of
casualty crashes over time plays a substantial role. Chart 3.1 illustrates the
estimated annual time period effect in the model. It shows that there is a
strong downward trend in the number of crashes occurring, over time. That
is, there are unobserved factors not explicitly captured by the model that
are decreasing crash risk over time.
7 Infringements relating to speeding, alcohol and drugs, restraint use and other categories were also tested as separate variables in the modelling, but were not
found to be significant. 8 A lag length of 10 was chosen based on magnitude and statistical significance.
Testing revealed that the estimated effect was significant between lags 7 and 12, with no significant variation in its magnitude.

14
Chart 3.1 Year trend estimates
Source: Deloitte Access Economics (2016). Note: the sum of coefficients has been normalised to
zero9. Each year is included in the model as a dummy variable (1 or 0) to capture any year-
specific effects.
Together these results show that despite the continued downward
trend in the number of crashes (as captured by Chart 3.2), there has been
an increase in the number of crashes in 2014 and 2015, which is
closely related to increases in VKT, and number of registered
motorcycles (as shown in Table 3.1).
Chart 3.2shows the average effect that time of the year (as measured
through week of the year dummies in the modelling) has on variation in the
number of crashes over the time period, in addition to variables already
controlled for.
The results suggest that the week-on-week variation in the number of
crashes can, in part, be attributed to the time of year which is itself related
to other factors that are unable to be sufficiently captured through some of
the independent variables here.
9 Normalisation procedure from Haisken-DeNew and Schmidt (1997).
-80%
-60%
-40%
-20%
0%
20%
40%
60%
80%
2004 2005 2006 2007 2008 2009 2010 2011 2012 2013 2014 2015Year
Effect

15
Chart 3.2 Week of the year estimates
Source: Deloitte Access Economics (2016). Note: the sum of coefficients has been normalised to
zero10. Each week of the year is included in the model as a dummy variable (1 or 0) to capture
any week-specific effects. The first week of the year includes January 1.
Overall, the model performs relatively well, explaining around two thirds of
the total variation in the weekly number of casualty crashes. Nevertheless,
the remaining one third of variation in casualty crashes over time is not
explained by the model. This likely reflects the reasonably large role that
randomness plays in determining whether a casualty crash occurs,
consistent with other findings in the literature (Nicholson 1985, 1986 and
discussed in more detail in Section 3.3.4).
This is not to say that there are no other factors (beyond those described
here) that are associated with the number of casualty crashes that occur
each week. The effect of some of these factors (such as improvements in
vehicle safety and road infrastructure, which shift slowly over time, and are
difficult to statistically isolate) are likely to be captured in the long-term
trend, whilst others may be currently unobserved (due to the limitations of
the available data). As such, the limits of the analysis that can be
undertaken and conclusions that can be drawn with the currently available
data are being reached.
3.3.2 Crash injury severity, given a casualty crash (time-series
approach)
In order to further understand whether system level factors had an
influence on the changes in the road toll over time, models were run on
weekly time series of serious and fatal casualty crashes11.
In order to account for the strong relationship between the total number of
casualty crashes and the number of serious injuries and fatalities, modelling
was performed on the rate of injury severity per casualty crash. For
example, modelling results refer to movements in the number of serious
injuries per 100 casualty crashes.
10 Normalisation procedure from Haisken-DeNew and Schmidt (1995). 11 Where the most severe injury in the crash defines whether the crash is serious or fatal.
-20%
-15%
-10%
-5%
0%
5%
10%
15%
20%
1 4 7 10 13 16 19 22 25 28 31 34 37 40 43 46 49 52Week
Effect

16
Similarly to the previous section, the results can be interpreted as the
impact of a 1% increase in an explanatory variable on the number of
serious and fatal casualty crashes in a given week, in percentage terms.
The results of this analysis is shown in Table 3.2.
Table 3.2 Crash severity, given a casualty crash has occurred, time series
coefficient estimates
Variable Serious injury Fatality
Log VKT 2.899*** 1.942***
Log motorbikes -0.613*
Lag-log advertising spend -0.0723**
Lag proportion speeding -1.182*
Log fuel price -0.422***
Week 52 0.090* 0.352***
N 618 608
Source: Deloitte Access Economics (2016). Note: Statistical significance at the 10%, 5%, and 1%
are represented by *, **, and ***, respectively. N represents the number of weeks included in
the modelling. The final specification of the model only includes the variables found to statistically
significantly improve the model fit (and are all listed in the table above). Other potential
explanatory variables were tested, but found to have no statistically significant explanatory
power. The number of observations for serious injury and fatality are not equal, as there are a
number of weeks where no fatalities occurred. Variables are log (logarithm) transformed in order
to satisfy statistical assumptions of the model, and for ease of interpretation of the results.
The results show that increases in VKT, beyond their impact on the number
of crashes, also have an impact on the severity of a crash, such that a 1%
increase in VKT is associated with a 2.9% increase in the number of serious
casualty crashes (given that a casualty crash has occurred), and a 1.9%
increase in the number of fatal crashes (given that a casualty crash has
occurred).
This could be the result of some VKT associated with higher risk conditions
(for example, travel on high speed or rural roads, different vehicle types or
higher risk drivers) – however, further research is required to understand
different types of risk associated with VKT and the nature of discretionary
travel.
Contrary to its impact on the number of crashes, a 1% increase in the
number of motorcycle registrations is associated with a 0.6% decrease in
the serious casualty crash rate and is not found to be significantly related to
fatal crashes, given that a casualty crash has occurred.
A 1% increase in advertising expenditure four weeks earlier is found to be
associated with a 0.07% decrease in the number of serious crashes, given
that a casualty crash has occurred. This lag can be thought to relate to a
delay in the time taken for advertising to translate into awareness and
changes in attitudes and behaviours.
The proportion of vehicles detected speeding (by cameras) six weeks earlier
is associated with a decrease in the number of serious crashes (a 1%
increase in detections is associated with a 1.2% decrease in the number of
serious crashes, given that a casualty crash has occurred). This lag may be
associated with delays in the receipt of speeding infringement notices (and

17
thus delays in the deterrent effect being observed), and points to the effect
of enforcement on crash outcomes.
Increases in fuel prices are found to be associated with decreases fatal
crashes, whilst a crash occurring in the last week of the year (week 52) was
positively associated with serious injury and fatal crashes.
Controlling for the total number of casualty crashes substantially reduces
the remaining systematic variation in the number of serious injury and fatal
crashes. However, the results presented above suggest that there are
consistent trends in the relationship between explanatory variables and the
rate of serious injury and fatality crashes per casualty crash.
3.3.3 Casualty injury severity, given a casualty crash (micro-
econometric approach)
Following the time-series analysis undertaken, micro-econometric analysis
was undertaken using the CAS data, in order to capitalise on the detail
contained within the unit record data files, which relate to all injured
persons involved in a casualty crash. Uninjured persons are excluded from
the analysis, as they are inconsistently recorded in the CAS data.
Results from the micro-econometric modelling are presented as marginal
effects. They refer to the average change in the likelihood of being injured
to a given level of severity resulting from an individual having that risk
factor. For example, being in a motorcycle as opposed to a car increases
the individual’s risk that the casualty crash will lead to a fatality by 2.8
percentage points.
Table 3.3 presents an abbreviated set of calculated marginal effects from
the estimates of the model, with full regression results and marginal effects
presented in Appendix C. The most notable results being:
being a motorcyclist, cyclist or pedestrian greatly increases the risk of a
severe or fatal injury relative to an individual travelling in a car,
reflecting the relative fragility and vulnerability of these road users;
casualty crashes where alcohol or drugs, or inappropriate speeds were a
contributing factor are also more likely to result in severe or fatal injury,
reflecting the effects of impairment and high speed crashes,
respectively; and
casualty crashes on rural state highways and other open roads (which
are more likely to be single carriageway and have fewer safety barriers
installed) are more likely to result in severe or fatal injury, relative to
crashes on minor urban roads, capturing the more severe consequences
of high speed crashes.

18
Table 3.3 : Crash severity model (all injured persons) marginal effects, given that a casualty crash has occurred
Variable Relative to Severe injury likelihood
(relative to minor injury)
Fatal injury likelihood
(relative to minor
injury)
Comment
Motorcyclists Travelling in car 20.5 percentage points 2.8 percentage points
Relative fragility and vulnerability of these road
users Pedestrians Travelling in car 28.9 percentage points 11.2 percentage points
Cyclists Travelling in car 24.7 percentage points 6.5 percentage points
Travelling in truck,
SUV or bus Travelling in car
-0.4 to -2.3 percentage
points
-0.2 to -1.8 percentage
points Mass differentials across the vehicle fleet
Alcohol or drugs Other crash factors 5.9 percentage points 1.9 percentage points Effects of impairment
Inappropriate speed Other crash factors 2.7 percentage points 1.4 percentage points Consequences of high speed crashes
≥ 100m/h speed
zone
50km/h to 70km/h
speed zone 2.0 percentage points 0.7 percentage points Consequences of high speed crashes
State highways
(rural) and other
open roads
Minor urban roads 2.6 to 3.4 percentage points 1.0 to 2.1 percentage
points
Capturing more severe consequences of high
speed crashes (where there may be fewer safety
features built into the road)
Male driver involved
in crash
No male drivers
involved in crash 1.2 percentage points 0.9 percentage points
Likelihood of males to engage in more-injurious
driving behaviours
Restricted or learner
licence driver Full licence driver -0.1 to 0.5 percentage points -0.1 percentage points
Inexperience of new drivers and their relative
ability to perceive high-threat hazards and adapt
to changing road conditions
Two vehicle crashes Single vehicle crash -1.3 percentage points -0.2 percentage points Nature of two vehicle crashes
Source: Deloitte Access Economics (2016). Note: these results should be interpreted as marginal change in the probability of a given level of crash severity, conditional on getting in a crash
that involves at least one injury. The marginal effects sum to zero across the three injury levels. N = 259,892. Time period = 1995-2015. Standard errors are clustered at the crash level.
There are a number of other variables included in the analysis, but are not presented here because they were either not significant (e.g. individual role in the crash), or acted as control
variables (e.g. year dummies).

19
A number of other factors were found to be statistically significant
determinants of crash injury severity, and are presented in Appendix C.
The local government region results suggest that there is a greater
likelihood of a severe injury occurring (relative to a minor injury) if the
crash occurs in a region other than Auckland – with the greatest differences
in the Otago (4.9 percentage points), Southland (4.2 percentage points)
and West Coast (3.5 percentage points) regions. Results for the likelihood
of a fatality were mixed across local government regions.
This could be the result of systematic differences across these regions in
road infrastructure, vehicles in these regions, or road user (characteristics
or behaviours) that are not explicitly captured in the variables that have
been included in the modelling – however there is incomplete information
available about how these factors might differ across regions, making it
difficult to draw meaningful conclusions about the drivers of these results.
Variables that were not found to be statistically significant (such as whether
a distraction was a contributing factor to the accident, or whether the
individual was a driver or passenger) were included in the final
specification.
Overall, these findings reinforce that there are a variety of severity risk
factors relating to the characteristics of a crash, which could be monitored
and targeted through road safety interventions (discussed in Chapter 4).
3.3.4 Counterfactual analysis (changes in fatal crash
characteristics)
Further analysis was then undertaken to understand the counterfactual
scenario for the period of interest (2014 and 2015). This seeks to answer
the question, “What would the fatality rate have been if the external
conditions driving the dip in fatalities in 2013 were applied to 2014 and
2015?” The results from this exercise decompose the fatality rate in to
three components:
Characteristics of crashes
Annual trends in the severity of crashes
Unexplained (‘random’) fluctuations in crash risk severity
This decomposition is provided in Chart 3.4, which illustrates:
Actual fatality rate (black line);
Predicted fatality rate (green line)
– Which removes the unexplained component of fluctuations from the
Actual fatality rate
Simulated fatality rate (blue line)
Which applies the average 2013 fatality risk to 2014 and 2015

20
Chart 3.3 Counterfactual analysis of the fatality rate
Source: Deloitte Access Economics (2016).
The chart shows that if the characteristics of the crash were driving the
increases in fatalities in 2014 and 2015, the simulated fatality rate line
would have more closely tracked the predicted fatality rate line – however
as it does not, the conclusion drawn is that:
the increases in fatalities observed in 2014 and 2015 are unlikely to be
the result of factors relating to observable characteristics of the crash
(such as the road type, vehicle type or licence status) – but rather to
other broader trends such as changes in vehicle kilometres travelled,
and unobserved factors.
This is because the simulation is based on the known characteristics of
fatalities in 2013, not the unknown factors that were present in 2014
and 2015.
Essentially, this implies that the historically low number of fatalities in 2013
was an abnormal year – driven by broader, unobserved factors and trends,
rather than the result of some systematic change in the nature of crashes
themselves. This result also implies that, to an extent the increases in
fatalities in 2014 and 2015 represented a reversion to the longer-term
trend.
This aligns with existing findings (Nicholson 1985, 1986), which suggest
that there is a component of ’chance’ to road trauma, given the way in
which the frequency of crashes changes each year, and the statistical
properties and distribution of road trauma12 – which may account for the
unexplainably low road toll years.
12 Broadly following a Poisson distribution, if all other factors affecting crash risk are
largely constant. More discussion of Poisson distributions are included in the appendices. Direct comparisons of the extent to which variations in road trauma are
unexplained across different studies is not possible, given the different modelling techniques and data variables used.
2.0%
2.5%
3.0%
3.5%
4.0%
4.5%
1995 1997 1999 2001 2003 2005 2007 2009 2011 2013 2015
Actual fatality rate Predicted fatality rate Simulated fatality rate
Fatality rate of casualty crashes
21
Looking to 201613, the provisional road toll stands at 328, an increase of
2.8% over the previous year, and 1,425 serious injuries between January
and July 2016, compared to 1,199 for the same months of 2015 (a 18.8%
increase) – despite there being fewer crashes in total (5,372 between
January and July 2016, compared to 5,795 for the same months in 2015).
These continued increases in road trauma highlight the need and imperative
for there to be continued research and data collection (which are described
in greater detail in the following chapter) – to further develop the
understanding of the factors driving road trauma.
3.3.5 Comparison to previous studies
Several previous studies have explored the drivers of road fatalities in New
Zealand, in particular analysing the 2011 reduction in road fatalities:
An Analysis of Potential Factors behind the 2011 Reduction in New
Zealand Road Fatalities (Keall et al., 2012)
Econometric Analysis of the Downward Trend in Road Fatalities since
1990 (Infometrics, 2013a)
Further Econometric Investigation of the 2011 Reduction in Road
Fatalities (Infometrics, 2013b)
Based on an analysis of both short and longer term drivers of the number of
road fatalities, these studies provide evidence to suggest that the reduction
in 2011 is largely the result of “good luck”. The estimated determinants of
road fatalities do not account for the substantial reduction in road fatalities
in 2011.
The econometric method used in this analysis aligns most closely with that
undertaken by Keall et al. (2012) and Infometrics (2013b)14. Taking longer
term trends as given, both sets of analyses explore the drivers of short
term fluctuations in road trauma. However, the only common estimated
variable is that of the number of motorcycle registrations, with all studies
finding a significant positive relationship between motorcycle registrations
and road trauma.15
However, there are a number of important differences between the results
presented in this analysis and those previously undertaken in New Zealand
that imply that the results are not directly comparable. Primarily, this study
takes a top-down approach, modelling the weekly number of casualty
crashes16 and the rate at which a casualty crash becomes a fatal crash. This
differs from Keall et al. (2012) and Infometrics (2013b), as both analyse
the quarterly number of fatalities.
13 Data relating to 2016 road trauma has not been included in the modelling as
complete data for all explanatory variables is not yet available. 14 The approach taken in Infometrics (2013a) models the trend in fatalities (which is
controlled for in this analysis through the use of yearly and weekly dummy variables), at an annual frequency. The Infometrics (2013a) method is less similar to
the method used here, and as such, the discussion in this section largely focuses on the other two papers. 15 Although not directly comparable, a relatively crude comparison of the relationship between motorcycle registrations in this study and Infometrics (2013b) suggests that
a 1% increase in registrations in 2012 implies an increase in fatalities of 5.6 versus 15.1, respectively. 16 Noting that the key results did not change if a monthly frequency was chosen instead.

22
This could lead to different results, as the number of fatalities will be
affected by changes in both the fatality rate, as well as the number of
individuals involved in a fatal crash. For example, holding the fatality rate
constant, an increase in the number of fatalities could be driven by an
increase in the number of vehicle occupants. In addition, there could be
important factors at a higher frequency level (such as weekly or monthly)
that are not observed at the quarterly level. This means that analysis of the
quarterly number of fatalities could wash out important fluctuations (and
drivers of those fluctuations) within the quarter.
Analysing the data at a weekly level reduces the influence of the trend on
the estimates of other factors17 and introduces relatively small counts,
which implies that a log-linear specification is more appropriate (relative to
specifying the relationship in levels). Although this changes the
interpretation of the results, it is not expected to substantially change their
magnitude or direction (a model of the number of casualty crashes in levels
closely aligned with the log model).
Finally, a strong relationship between the number of casualty crashes and
VKT was observed in this analysis. The omission of VKT as an explanatory
factor could impact the conclusions of Keall et al. (2012) and Infometrics
(2013b). However, results from this study suggest that VKT only influences
the number of fatal crashes through the number of casualty crashes (that
is, holding the fatality rate constant). As a result, the influence of the
omission of VKT in previous studies will be confounded with the choice to
model the number of fatalities, as opposed to the number of crashes
resulting in at least one fatality per casualty crash. This means that, the
effect of the omission of VKT on results presented in these two studies is
unclear.
17 That is, persistence.

23
4 Findings and implications
This chapter outlines the key findings from the econometric modelling, and
their implications for the Ministry’s ongoing monitoring of road safety and
research agenda.
4.1 Key modelling findings
The key explanators of short term fluctuations are found in this modelling
(and consistent with the literature) to be:
An increase in the number of vehicle kilometres travelled (VKT). – The analysis suggests a more than one-for-one increase in the
number of crashes (and the rate at which those crashes are severe)
–which could imply that additional VKT is associated with higher risk
travel. Increases in the number of motorcycle registrations.
– This aligns with the relative vulnerability of motorcycles – which are
less visible to other road users and less stable (Ministry of
Transport, 2015).
In interpreting these findings, there is a need to be cognisant of the multi-
variate approach that this analysis has taken – that is, there is no one
single factor that can fully explain changes in the road toll. Whilst this
analysis has helped to identify some of the key drivers and contributors –
no one factor should be taken in isolation, to the exclusion of others, and
should be tempered against the large component of the changes that
remain unexplained.
Analysis of individual-level crash data identified a number of risk factors
that were associated with increased probability of severe and fatal injury,
given involvement in a casualty crash. Broadly, these findings affirmed
what has been previously found in the literature from New Zealand and
other jurisdictions – with male drivers, relative inexperience, speeding,
alcohol and/or drug presence, and light vehicle types being key risk factors
for more severe crash injury outcomes.
Confidence can be placed in these results, given the strength of the factors
modelled in explaining the variation in the number of casualty crashes and
the injury severity, and their alignment with findings in the literature and
prior expectations. However, there is an ongoing imperative to improve the
quality of data available for analysis, in order to further ensure that the
results are robust and build the road safety evidence-base over time.
4.2 Implications for the Ministry’s ongoing monitoring
programme
The evidence-base for what road safety interventions are effective
continues to be developed across a variety of contexts, in order to inform
the ongoing design and evaluation of road safety policy, and understand
progress towards the long-term vision of the Safer Journeys strategy. In
addition, there remains a need to consider these effectiveness measures
and findings alongside the economic and social costs associated with them.

24
An ongoing monitoring programme for the Ministry will provide important,
evidence-based guidance as to which road user cohorts are at greatest risk
of crashes and crash severity, areas where policy interventions are
warranted, and are having an impact.
Table 4.1 outlines, at a high level, the factors that could be monitored, and
how changes in them could be interpreted, particularly in relation to:
how interventions could impact on factors found to be associated with
crash likelihood and injury severity; and
the changing relationship between these factors and road safety (i.e.
breaking the link between risk factors and road trauma).
Table 4.1 Informing the ongoing monitoring framework
Potential
intervention
Factor
identified for
monitoring
through the
modelling
Changes in factors
expected to be observed, if
intervention is successful
Current relationship
with crash risk or
injury severity
Safer roads
Road
infrastructure
investment (to
improve built-in
safety features of
the road)
Road type Weaker relationship between
road type and crash severity,
as treatments to improve the
safety of riskier roads take
effect
Severe injury or fatality
1.0 to 3.4 p.p. more
likely to occur on rural
state highways or other
open roads
Vehicle
kilometres
travelled
Weaker relationship between
VKT and the number of
crashes, and their severity, as
crash risk for a given unit of
exposure decreases due to
improved infrastructure
A 1% increase in VKT is
associated with a 2.5%
increase in the number of
crashes
Investment to
improve safety in
for pedestrians
Pedestrians Weaker relationship between
pedestrians and crash risk and
severity, as treatments
improve the awareness of
vehicles to pedestrians and
reduce impact speeds
Severe injury or fatality
40.1 p.p. more likely to
occur for pedestrians,
relative to car occupants
Investment in
cycling
infrastructure
(such as
dedicated bicycle
lanes)
Cyclists Weaker relationship between
cyclists and crash risk, as
treatments improve the safety
of cycling routes and increase
separation of bicycles and
motor vehicles
Severe injury or fatality
31.2 p.p. more likely to
occur for cyclists, relative
to car occupants
Safer speeds
Enforcement
activity
Lowering of
speed limits
Proportion of
vehicles
observed
speeding18
Proportion of vehicles
observed speeding decreases,
as enforcement activity and
lowered speed limits change
behaviour
A 1% increase in
proportion of vehicles
observed speeding in the
previous period is
associated with a 1.1%
decrease in the number
of crashes
18 Whilst the time-series modelling used a measure of the rate of sanctioning of speeding drivers, ongoing monitoring may prefer to rely on annual surveys
undertaken by the Ministry of Transport, which is a more reliable measure of the proportion of speeding on the road.

25
Potential
intervention
Factor
identified for
monitoring
through the
modelling
Changes in factors
expected to be observed, if
intervention is successful
Current relationship
with crash risk or
injury severity
Speed as a
contributing
factor to crashes
Prevalence of speed as a
contributing factor in crashes
decreases, as enforcement
activity and lowered speed
limits change behaviour
Severe injury or fatality
4.1 p.p. more likely to
occur where one of the
vehicles in the crash was
travelling at an
inappropriate speed
Safer vehicles
Introduction of
new vehicle
safety features
(such as auto-
emergency
braking) into the
vehicle fleet
Vehicle safety
ratings (currently
proxied by
vehicle age)
Stronger relationship between
vehicle safety and lower crash
severity, as improved safety
features penetrate the
majority of the fleet over time
Severe injury or fatality
0.2 p.p. more likely to
occur as vehicle age
increases by 1 year
Vehicle type Reduced crash severity in
instances where light and
heavy vehicles are involved in
a collision, as there are
improved safety features
Severe injury or fatality
23.3 p.p. more likely to
occur if the casualty was
riding a motorcycle
Safer road users
Road safety
advertising
Factors
contributing to
crashes (alcohol
and drugs,
speeding,
distractions)
Prevalence of these
contributing factors in crashes
decreases, as advertising
(along with enforcement)
educates drivers and creates
attitudinal and behavioural
changes
Severe injury or fatality
7.8 p.p. more likely to
occur if alcohol or drugs
was a contributing factor
to the crash
Motorcycle
registrations
Weaker relationship between
number of motorcycle
registrations and number of
crashes, as motorcyclists and
other drivers are more aware
of the risks
A 1% increase in
motorcycle registrations
is associated with a 1.6%
increase in the number of
crashes
Graduated
licencing systems
and driver
training
Licence type Weaker relationship between
licence type (restricted or
learner) and crash severity, as
these drivers gain greater
experience in lower-risk
environments
Severe injury or fatality -
0.4 to 0.2 p.p. more
likely to occur if the
casualty holds a
restricted or learner
licence
Gender Weaker relationship between
gender and crash severity, as
greater education of the
consequences of risky and
highly-injurious behaviour
lead to behavioural and
attitudinal changes
Severe injury or fatality
0.6 p.p. more likely to
occur if the casualty is
male
Young drivers Weaker relationship between
young drivers and crash
severity, as they have more
opportunities to gain skills in
lower-risk environments
Severe injury or fatality
0.2 p.p. more likely to
occur as casualty age
increases by one year
(from the average age)
Source: Deloitte Access Economics (2016)
There are also a number of factors identified in the modelling that had an
impact on crash likelihood or crash injury severity that were not strictly
26
within the influence of road safety interventions (fuel prices, the number of
vehicles involved in a crash, movement of vehicles involved in a crash,
weather and lighting at a crash), but may still be worth monitoring, to
understand whether other factors may be driving observed changes in road
trauma.
This project has also reiterated the need to continually improve the quality
of data that is being collected and evidence-base that is being developed, in
order to:
monitor trends and emerging issues;
provide even greater confidence in the reliability of empirical
relationships observed; and
inform the design and evaluation of policy – by allowing policymakers to
target interventions at the factors that matter – both as discrete
investments, and as a complementary suite of investments.
Finally, beyond the impact of interventions on the road toll, it is also
important to consider the costs associated with a policy as part of any
evaluation or monitoring programme (both as they relate to government
expenditure and costs to society more broadly, such as travel time
increases). This will better ensure that a balanced view of investment
prioritisation is taken, and that interventions with the greatest impact,
subject to their costs, are implemented, in keeping with public welfare
theory more broadly.
4.3 Considerations for future and ongoing research
This project has identified a range of opportunities for enhancements to
support future analysis of the factors driving the road toll in New Zealand,
as well as new areas of inquiry that could continue to be explored in
keeping with social and technological change.
In particular, while the analysis was able to draw on a number of large and
rich datasets, there are areas where improvements in data availability,
specificity and quality could further enhance the explanatory power of
the modelling and confidence in the results. These include:
Improving the collection of data relating to casualties over time –
greater accuracy, consistency and completeness in the variables within
the dataset will create greater confidence in the data and any findings
from it (and reduce the likelihood of spurious or biased results). In
particular:
– improving the quality and completeness of data relating to drug-
driving as a factor contributing to crashes and injury outcomes
(given concerns that it may currently be underreported, particularly
where alcohol was also involved) and the level of detection, given
the increased focus of road safety agencies on drug-driving
education and enforcement;
– improving the quality and completeness of data relating to
distractions as a factor contributing to crashes and mobile phone
use whilst driving, which is pertinent given broader contextual
changes relating to their use that are being observed (see Section
2.3 and Appendix D.2); and
– consideration to the collection of data with more granular detail
relating to injury severity (using measures such as the
Abbreviated Injury Scale) to allow for a more gradated definition of
severe injury than the present CAS allows.

27
Enhanced measures that capture the impact of advertising across all
media channels on road user attitudes and behaviours, given changing
media consumption habits. This could include greater use of existing
and enhanced surveys of road users (for example, relating to alcohol
and drug, and device use whilst driving).
More historical data on infrastructure investment (at the site level)
and type of infrastructure (maintenance versus safety features, as well
the target road user group of treatments – i.e. vehicles, motorcyclists,
cyclists and pedestrians) to allow for better integration into the model,
and disentangling of its effects on road safety.
Continuing to improve the frequency of VKT data and the level of
granularity (regions, types of roads, vehicles, drivers and the extent to
which it is discretionary) with which it is available, given the strength of
its relationship with both the number of crashes and crash severity, to
ensure that the empirical relationship is robust
Data on the distances travelled by overseas licence holders
(currently unavailable) would allow a greater understanding of the
extent to which crash risk for these individuals systematically differs
from the population as a whole, as well as the extent to which increased
tourism has increased overseas licence holder driving (see Appendix D.1
for some preliminary analysis).
Finally, improving the frequency at which data is collected and
available for a number of explanatory variables (such as VKT,
unemployment, and advertising expenditure) would reduce the need to
interpolate monthly or quarterly variables to a weekly frequency, and
thereby reduce the likelihood of bias in the results and allow a more
granular interpretation of results.
Throughout the project, a number of areas where research and inquiry
should be continued or undertaken were identified. For many of these
research questions, more complete analysis and conclusions will be enabled
by the improvement of existing and new data collections. These research
questions included:
Improving the understanding of how driving while impaired by drugs
impacts on crash risk and injury severity, and whether drugs and
alcohol have compounding impairment and injurious effects – and the
attitudes and behaviours of road users in relation to drug-driving.
Understanding high-risk locations for cyclists and pedestrians and the
types of crashes that they are involved in, in order to better target
interventions (particularly relating to improved infrastructure) that
alleviate these risks.
Understanding the manner in which mobile phones and other
devices are being used whilst driving (and how attitudes towards their
use are changing) can inform a deeper understanding of how these
devices may influence crash risk, and appropriate policy interventions to
counteract these trends.
Investigating the way in which increases in road congestion
(particularly in urban areas) may influence the types of crashes that
occur, and the implications of that for crash severity.
Improving the understanding of the crash risk associated with different
types of VKT – to help disentangle region-specific or road-type-specific
factors that may be driving the strong relationships found in this study.
Exploring the KiwiRAP star rating data, which assesses the safety
features of roads (such as horizontal alignment, shoulder width and
roadside hazards), and their ability to protect a road user under three
crash types (run-off road, head-on, and intersection)

28
– As multiple years of star rating data become available, it will
become possible to undertake more detailed analysis of whether
improvements in a star rating at a given site can be linked to
decreases in crash risk and severity (both in terms of personal risk
and collective risk), and whether there are changes in the types of
crashes occurring at those sites
Understanding the impact of location-specific road safety
interventions (such as variable speed limits at intersections or the
installation of median barriers), thereby allowing the effectiveness of
these treatments on road safety to be more comprehensively assessed
Collation of data on vehicle safety star ratings for older vehicles
would allow a more granular analysis of the crashworthiness and safety
features of older cars in the fleet to be undertaken, and in turn, provide
government with a deeper understanding of the trade-offs relating to
used vehicle importation laws (and whether there is a case for
increasing safety requirements of used vehicle imports)
– Such a dataset would also provide consumers with greater
information during the purchasing process about the relative safety
features of different vehicles
In the end, there is a need to ensure that future and ongoing research
builds the evidence-base for what road safety interventions work (and
equally, what doesn’t work) in reducing road trauma, to inform the
continued refinement of the ongoing monitoring programme and future
policy development.

29
References
Bergel-Hayat, R. and Zukowska, J. (2015). Road Safety Trends at National
Level in Europe: A Review of Time-series Analysis Performed during
the Period 2000-12. Transport Reviews: A Transnational
Transdisciplinary Journal, 2015, 1-22.
Bureau of Infrastructure, Transport and Regional Economics (BITRE).
(2012). Evaluation of the National Black Spot Program Volume 1.
BITRE Report 126, Canberra ACT.
Cameron, M. and Sullivan, C. (2011). Review of road safety advertising
programme in New Zealand. Unpublished report to the New Zealand
Transport Authority.
Delaney, A., Newstead, S. and Watson, L. (2007) The influence of trends in
heavy vehicle travel on road trauma in the light vehicle fleet, Monash
University Accident Research Centre, Report No. 259
Dreze, X., & Hussherr, F. X. (2003). Internet advertising: Is anybody
watching? Journal of interactive marketing, 17(4), 8-23.
Edquist, J., Rudin-Brown, C. M. and Lenné, M. (2010). Road design factors
and their interactions with speed and speed limits. Monash University
Accident Research Centre, Report No. 298
Elvik, R., Vaa, T., Erke, A., & Sorensen, M. (Eds.). (2009). The handbook of
road safety measures. Emerald Group Publishing.
Goldfarb, A., and Tucker, C. (2011a). Privacy Regulation and Online
Advertising. Management Science, 57(1), 57-71.
Guira, J. and Leung, J. (2004). An evaluation of a supplementary road
safety package. Accident Analysis & Prevention, 36, 893-904.
Haisken-DeNew, J. P., & Schmidt, C. M. (1997). Interindustry and
interregion differentials: mechanics and interpretation. Review of
economics and Statistics, 79(3), 516-521.
Hyman, I. E., Boss, S. M., Wise, B. M., McKenzie, K. E., & Caggiano, J. M.
(2010). Did you see the unicycling clown? Inattentional blindness
while walking and talking on a cell phone. Applied Cognitive
Psychology, 24(5), 597-607.
Infometrics (2013a). Econometric Analysis of the Downward Trend in Road
Fatalities since 1990. Report for the Ministry of Transport, Wellington.
Infometrics (2013b). Further Econometric Investigation of the 2011
Reduction in Road Fatalities. Report for the Ministry of Transport,
Wellington.
IRTAD. (2015). Why does road safety improve when economic times are
hard? Research Report. OECD Publishing, Paris.

30
Johnson, M., Charlton, J., Oxley, J., & Newstead, S. (2010, January).
Naturalistic cycling study: identifying risk factors for on-road
commuter cyclists. In Annals of Advances in Automotive
Medicine/Annual Scientific Conference (Vol. 54, p. 275). Association
for the Advancement of Automotive Medicine.
Keall, M., Stroombergen, A., Sullivan, C., Cameron, M., & Weiss, H. (2012).
An analysis of potential factors behind the 2011 reduction in New
Zealand road fatalities. Report for the Ministry of Transport,
Wellington.
Kloeden, C.N., McLean, A.J, Glonek, G. (2002). Reanalysis of travelling
speed and the risk of crash involvement in Adelaide South Australia
(CR207). Australian Transport Safety Bureau, Canberra.
Kockelman, K. M., and Kweon, Y. (2002). Driver Injury Severity: An
Application of Ordered Probit Models. Accident Analysis and
Prevention, 34, 313-321
Lewis-Evans, B. (2010). Crash involvement during the different phases of
the New Zealand Graduated Driver Licensing System (GDLS). Journal
of Safety Research, 41, 359-365
Li, G., Braver, E. R., & Chen, L. H. (2003). Fragility versus excessive crash
involvement as determinants of high death rates per vehicle-mile of
travel among older drivers. Accident Analysis & Prevention, 35(2),
227-235.
Marchesini, P., & Weijermars, W. A. M. (2010). The relationship between
road safety and congestion on motorways. SWOV Institute for Road
Safety Research.
Ministry of Transport. (2016). Overseas driver crashes 2016.
(2015). Risk on the Road: Introduction and Mode Comparison.
(2010). Safer Journeys: New Zealand’s road safety strategy, 2010-
2020.
Newstead, S., Watson, L., and Cameron, M. (2016). Trends in
crashworthiness of the New Zealand vehicle fleet by year of
manufacture: 1964 to 2014: Supplement to Report 328 Vehicle safety
ratings estimated from police reported crash data: 2016 update.
Monash University Accident Research Centre, Report No. 328 supp.
Nicholson, A. J. (1985). The variability of accident counts. Accident Analysis
and Prevention, 17(1), 47-56.
(1986). The randomness of accident counts. Accident Analysis and
Prevention, 18(3), 193-198.
O’Donnell, C. J., and Connor, D. H. (1996). Predicting the Severity of Motor
Vehicle Accident Injuries using Models of Ordered Multiple Choice.
Accident Analysis and Prevention, 28 (6), 739-753
OECD/ITF. (2016). Road Safety Annual Report 2016. OECD Publishing,
Paris.

31
(2015). Why Does Road Safety Improve When Economic Times are
Hard. IRTAD report, International Transport Forum
Scuffham, P. A. and Langley, J. D. (2002). A model of traffic crashes in New
Zealand. Accident Analysis & Prevention, 34(5), 673-687.
Stroombergen, A. (2013). Econometirc Analysis of the Downward Trend in
Road Fatalities since 1990. Report for the Ministry of Transport,
Wellington.
Tay, R. (2005). The effectiveness of enforcement and publicity campaigns
on serious crashes involving young male drivers: Are drink driving
and speeding similar? Accident Analysis & Prevention, 37(5), 922-
929.
Tin, S. T., Woodward, A., & Ameratunga, S. (2010). Injuries to pedal
cyclists on New Zealand roads, 1988-2007. BMC Public Health, 10(1),
1.
van Lamoen, N. (2014). Evaluation of the" Safer Summer" road safety
campaign: final report.
Watson, B. C., Tunnicliff, D. J., Manderson, J. L., & O'Connor, E. L. (2004).
The Safety of International Visitors on Australian Roads – A Joint
Report (Vol. 2). Centre for Accident Research and Road Safety -
Queensland.
Weiss, H. B., Kaplan, S., & Prato, C. G. (2014). Analysis of factors
associated with injury severity in crashes involving young New
Zealand drivers. Accident Analysis & Prevention, 65, 142-155.
Wilks, J., & Pendergast, D. (2010). International tourists and road safety.
Drive tourism: Trends and emerging markets, 278. Routledge.

32
Appendix A : Descriptive statistics
The econometric modelling undertaken is based on data collected from the
Ministry of Transport, New Zealand Transport Agency, New Zealand Police,
Ministry of Business, Innovation and Employment, and Statistics New
Zealand. A more detailed description of the scope of the data, the years for
which it is available, and the unit and frequency of observation is included
in Appendix B.
This section provides a summary of the descriptive statistics of the key
variables that are included in the model or have informed the modelling
approach, and allow correlations between key variables to be revealed.
A.1. Stratification of models
The model will be stratified over a number of factors, in order to test
whether different groups have different causal factors and relationships, in
addition to a central case model.
Fatalities and injuries
Factors that contribute to crash injury severity, are not necessarily the
same ones that contribute to crash likelihood. Chart A.1 shows that the
profile of fatalities and injuries, by time of day varies – with proportionately
more injuries occurring during the morning and afternoon peak hours, and
proportionately more fatalities occurring in the evening peak and at night.
Chart A.1 All fatalities (LHS) and injuries (RHS), by time of day
Source: CAS
Urban and rural roads
Travel on urban roads, which are defined as roads with a speed limit of 70
km/h or less, follow different patterns, levels of congestion and may involve
different vehicle types to rural roads (defined as roads with a speed limit of
greater than 70km/h). Chart A.2 shows that there are proportionately more
injuries on urban roads during the morning peak hour (perhaps relating to
higher traffic volumes, and hence greater exposure to crash risk, in urban

33
settings). Proportionately more fatalities happen on rural roads during the
day, which is similarly likely to reflect travel patterns and behaviour.
Chart A.2 Fatalities (LHS) and injuries (RHS) on urban and rural roads, by time
of day
Source: CAS
The differences in patterns of road trauma between urban and rural roads
may also reflect differences in the type of crash, broadly defined as whether
a vehicle stays on the road or not during a crash.
North and South Islands
In contrast, the profile of fatalities and injuries on the North and South
Island (Chart A.3), by time of day follow a similar distribution, suggesting
that there may not be significant variation by island.
Chart A.3 Fatalities (LHS) and injuries (RHS) for North and South Island, by time
of day
Source: CAS
Road user (or individual) type
The level of exposure, crash risk and injury severity may also vary by type
of road user, with the literature having identified young drivers, older
drivers, motorcyclists, cyclists and pedestrians as high risk groups.

34
Young drivers (aged under 25), are more likely to suffer a fatality or injury
at night (Chart A.4) – and this may be linked to their travel patterns (and
hence risk exposure) or the likelihood of them engaging in risky behaviour.
Chart A.4 Fatalities (LHS) and injuries (RHS) for young drivers, by time of day
Source: CAS
There are also variations when examining fatalities and injuries of young
drivers by gender – with proportionately more males suffering fatalities and
injuries at night, and the reverse during the day (Chart A.5).
Chart A.5 Fatalities (LHS) and injuries (RHS) for young drivers, by gender and
time of day
Source: CAS
Older drivers (aged 75 years and over) may be at greater risk of severe
injury in a crash, given their fragility, and have different travel patterns to
the broader population, which is reflected in the clustering of both fatalities
and injuries to daytime hours (Chart A.7).

35
Chart A.6 Fatalities (LHS) and injuries (RHS) for older drivers, by time of day
Source: CAS
Motorcyclists are more likely to suffer road trauma during the day, and
during the warmer months of the year (Chart A.6). This is again likely to be
related to their travel patterns – indeed, motorcycle registrations in New
Zealand are available on a monthly basis, and there are significantly more
motorcycles registered in summer months (ranging from 58,000 on average
in July, to 71,000 on average in January, between 2000 and 2016).
Chart A.7 Fatalities (LHS) and injuries (RHS) for motorcyclists, by week of the
year
Source: CAS
Cyclists are likewise vulnerable road users (Chart A.8), and there are two
significant peaks in the distribution of injuries by time of day – during the
morning and afternoon peak. This could reflect the increased volumes of
bicycle travel at these times of the day, for those commuting to work, and
increased levels of road congestion during these times. This can be
contrasted against the distribution of fatalities, which is also bi-modal, but
to a much lesser extent.

36
Chart A.8 Fatalities (LHS) and injuries (RHS) for cyclists, by time of day
Source: CAS
Pedestrians similarly have two peaks in the distribution of injuries by time
of day (Chart A.9), around the morning and afternoon peak – which could
reflect the volume of pedestrians commuting to work or school at those
times of days. Beyond this, the factors that contribute to pedestrian road
trauma may systematically vary from those of other road users, as they are
not travelling in a vehicle.
Chart A.9 Fatalities (LHS) and injuries (RHS) for pedestrians, by time of day
Source: CAS
Factors likely to contribute to crashes
Relationships between crashes and causes may systematically differ by
their contributing factor. This factor is recorded in CAS based on the
information provided by a police officer attending a scene.
Fatalities and injuries where alcohol or drugs was a contributing factor are
presented by time of day in Chart A.10. Alcohol and drugs are a much more
common factor at night than during the day, impairing judgement and likely
increasing crash risk.

37
Whilst it would be ideal to be able to separately model the contribution of
alcohol and drugs (and indeed there are separate codes in the system), the
recording of drugs as a contributing factor is not systematic. This is because
when alcohol is found as a contributing cause, further investigation into
driver culpability (due to impairment from drugs) is considered unnecessary
– even if an individual is indeed under the influence of multiple substances.
In addition, drugs must be shown to have caused impairment, unlike
alcohol, where only an illegal blood alcohol level must be shown.
Chart A.10 Fatalities (LHS) and injuries (RHS) where alcohol or drugs was a
contributing factor to the crash, by time of day
Source: CAS
The number of crashes where alcohol was a contributing factor has tended
to decrease over recent years (Chart A.11), although there was a peak from
2006 to 2008.
Chart A.11 All crashes where alcohol was a contributing factor, (weekly, with 12
week moving average, 1995-2015)
0
10
20
30
40
50
60
70
Dec
-94
Dec
-95
Dec
-96
Dec
-97
Dec
-98
Dec
-99
Dec
-00
Dec
-01
Dec
-02
Dec
-03
Dec
-04
Dec
-05
Dec
-06
Dec
-07
Dec
-08
Dec
-09
Dec
-10
Dec
-11
Dec
-12
Dec
-13
Dec
-14
Dec
-15
All crashes (Accident factor: Alcohol)

38
Source: CAS. Note: the dark green line represents the twelve week moving average of the
number of crashes – and is shown to smooth out weekly variability.
Speeding (defined as travelling too fast for the conditions, not necessarily
exceeding the speed limit) can lead to increased crash likelihood and injury
severity – and fatalities and injuries where speed was a contributing factor
are more likely to occur during the night (Chart A.12), with a small spike, in
injuries during the evening peak hours. This pattern of casualty could relate
to the level of congestion on the roads, particularly relevant in urban
settings, where lower speeds mean that crashes are likely to be less severe.
Chart A.12 Fatalities (LHS) and injuries (RHS) where speed was a contributing
factor to the crash, by time of day
Source: CAS
The number of crashes where inappropriate speed was a contributing factor
fluctuated somewhat over time (Chart A.13), with a peak in 2007 and 2008.
Chart A.13 All crashes where speed was a contributing factor, (weekly, with 12
week moving average, 1995-2015)
0
10
20
30
40
50
60
70
Dec
-94
Dec
-95
Dec
-96
Dec
-97
Dec
-98
Dec
-99
Dec
-00
Dec
-01
Dec
-02
Dec
-03
Dec
-04
Dec
-05
Dec
-06
Dec
-07
Dec
-08
Dec
-09
Dec
-10
Dec
-11
Dec
-12
Dec
-13
Dec
-14
Dec
-15
All crashes (Accident factor: Speed)

39
Source: CAS. Note: the dark blue line represents the twelve week moving average of the number
of crashes – and is shown to smooth out weekly variability.
Distractions (due to both factors inside and outside of the vehicle) could
lead to increased crash likelihood, particularly with the increasing use of
mobile phones in vehicles, as discussed in Section 2.3. Chart A.14 shows
that there is a spike in the number of injuries where distraction was a factor
in both the morning and afternoon peak hours – this could relate to minor
crashes where vehicles in congested roads fail to stop in time.
Chart A.14 Fatalities (LHS) and injuries (RHS) where distractions were a
contributing factor to the crash, by time of day
Source: CAS
However, as the coding of these factors within the CAS are based on police
reports – the ability to accurately identify the contributing factors,
particularly for distraction, are based on the information provided by those
involved in or who witnessed the crash. Thus, there may be degrees of
under-reporting or mis-coding of factors, particularly if the crash is a fatal
one. As such, the results of such analysis may be biased.
A.2. Independent variables
There are also a variety of independent variables, which are tested to
determine if they have a relationship with changes in the road toll over
time. These are described in this section.
Vehicle safety technology
The average age of the light passenger fleet in New Zealand has increased
over time (Chart A.15), driven by increasing proportions of vehicles
entering the fleet as used vehicles, and increasing average scrappage age.
Used vehicles entering the fleet, on average, have fewer safety features
than a new car entering in the same year. This is likely to have implications
for the speed at which new vehicle safety technologies penetrate the fleet,
and improve road safety, without government mandated rules.

40
Chart A.15 Average age of vehicle fleet, by type (2000-2015)
Source: Ministry of Transport
The composition of the fleet by year of manufacture has changed over time.
While the average vehicle age remaining fairly stable, there is a bulge of
vehicles manufactured between 1995 and 1999 still in the fleet today (Chart
A.16). This may have been the result of changes in second hand vehicle
importation laws implemented in 2002 that required all imported passenger
vehicles to comply with an overseas frontal impact standard, which
effectively restricted used imports to those from 1996 and later.
Chart A.16 Composition of fleet by year of manufacture, over time (2000-2016)
Source: Ministry of Transport
Changes to vehicle exhaust emission and vehicle emission testing rules in
2007 and 2012, may have also contributed to the changing distribution,
encouraging uptake of more recent vehicles.
Police enforcement
Enforcement activity can create a deterrent effect that influences individual
behaviour, but may decay over time, if that activity is not sustained.
10
11
12
13
14
15
16
17
18
2000 2002 2004 2006 2008 2010 2012 2014
Light passenger Light commercial Motorcycle Truck fleet Bus fleet
0%
10%
20%
30%
40%
50%
60%
70%
80%
90%
100%
Jan-00 Oct-01 Jul-03 Apr-05 Jan-07 Oct-08 Jul-10 Apr-12 Jan-14 Oct-15
Pre-1989 1990-94 1995-99 2000-04 2005-09 2010-14 2015-19

41
Chart A.17 shows the number of on-the-spot issued speed, alcohol or drug
related and restraint use (i.e. seatbelt) related infringements issued over
time.
Chart A.17 Notices and infringements issued, by type (weekly, 1999-2015)
Source: New Zealand Police
Whilst there are fluctuations in the number of offences recorded, these
figures depend, in part, on the level and targeting of enforcement activity
and the rate of detection (not necessarily changes in the underlying rate of
offending). For example, wet film fixed cameras do not operate
continuously, as they are rotated across multiple sites. As such, speed
camera operating hours fluctuate over time, whilst digital fixed cameras run
continuously, barring a fault. This could be driving some of the rapid
changes in the number of speeding detections as different camera
technologies were introduced (Chart A.18).
0
2,000
4,000
6,000
8,000
10,000
12,000
Officer Speed Alcohol or Drugs Restraints

42
Chart A.18 Speed camera operating hours, by type (1999-2015)
Source: New Zealand Police
There are also a number of temporary and permanent changes to policy
that have occurred, which have served to tighten the tolerances around
drink-driving and speeding, notably:
lowering the legal alcohol breath and blood limit for drivers under the
age of 20 to zero, from 7 August 2011;
lowering the legal alcohol breath limit for drivers aged 20 and over to
250 micrograms per litre of breath (from 400 micrograms per litre of
breath), from 1 December 2014; and over ‘high-risk’ and holiday
periods (which may coincide with high VKT periods, and with a greater
proportion of VKT on higher speed limit roads, thus increasing the injury
severity in crashes), beginning in 2010, lowering the speed camera
threshold from 10km/hr to 4km/hr.
These changes may impact on both the number and type of infringements
issued, with the potential for step changes in detection over these time
periods. This can be seen in the spikes in speed camera notices coinciding
with periods where the enforcement threshold was lowered (Chart A.19).
0
10,000
20,000
30,000
40,000
50,000
60,000
1999 2001 2003 2005 2007 2009 2011 2013 2015
Fixed Camera Rural Fixed Camera Urban
Mobile Camera Rural Mobile Camera Urban

43
Chart A.19 Speed camera infringements and lowered thresholds (monthly,
2010-2015)
Source: New Zealand Police
Public education campaigns
Advertising raises awareness amongst road users of the risks associated
with certain behaviours, which can lead to behaviour change.
Themes targeted by road safety advertising in New Zealand include: alcohol
and drugs, speeding, distractions, fatigue, restraint use, young drivers and
motorcyclists. These are risk factors for crash likelihood and crash severity,
and are incorporated into the modelling.
Observed speeds
Speed can influence crash likelihood and injury severity. Free speed data
allows changes in road user behaviour to be observed over time. Average
observed speeds have generally decreased slightly over time (Chart A.20),
as have the proportion of individuals speeding.
0
5,000
10,000
15,000
20,000
25,000
30,000
35,000
40,000
Lowered thresholds Camera Speed

44
Chart A.20 Average monthly observed speed, by speed zone (2004-2016)
Source: New Zealand Police, mobile and fixed camera. Note: there is also data for the 30km/h,
40km/h and 90km/h speed limits, however, there are relatively few observations at these speeds
and discontinuities in the series, and as such, are not presented here.
Road infrastructure
Road design can reduce crash likelihood (for example, through the use of
roundabouts and rumble strips) and injury severity (for example, through
the use of safety barriers). Infrastructure spending relating to, or targeted
at, road safety is available back to 2012 – beyond that, only aggregate
measures of spending are available (Chart A.21).
Chart A.21 Road safety infrastructure expenditure (nominal dollars)
Source: NZTA. Note: Infrastructure spending is categorised by when a location is completed, in
order to take into consideration when improved roads come online into the road system.
However, the random component of crash location means that isolating the
impact of infrastructure expenditure on an individual location can be
difficult, particularly in a time-series econometric model. It is likely that
40
50
60
70
80
90
100
km
/h
Avg Speed (50km/h) Avg Speed (60km/h) Avg Speed (70km/h)
Avg Speed (80km/h) Avg Speed (100km/h)
0
200
400
600
800
1,000
1,200
1,400
1,600
1,800
2,000
2007 2008 2009 2010 2011 2012 2013 2014 2015 2016
Mill
ion
s

45
improvements in the overall level of road infrastructure will have an impact
on road trauma in the long-term rather than being captured using our
econometric approach.
Other data sources, such as KiwiRAP, allow for the analysis of road design
and road safety features on crashes – however, this analysis is beyond the
scope of this report. How this data could be used in future and ongoing
research is described in Chapter 4.
Economic activity
The level of economic activity can impact on number of vehicle kilometres
travelled, and hence exposure to crash risk. There is some correlation
between the number of crashes and fuel prices (Chart A.22), and the
unemployment rate (Chart A.23), however changes in economic activity
may only impact on travel volumes at the margin (for discretionary travel,
reduced travel to workplaces and commercial travel). Decreases in the cost
of alternate transport modes (such as lower airfares) may also influence the
level of exposure to long distance driving (and potentially fatigue).
Chart A.22 Number of casualty crashes and fuel prices (weekly, 2004-2015)
Source: CAS; MBIE. Note: Dark grey line represents 12 week moving average of injuries.
0
50
100
150
200
250
0
50
100
150
200
250
300
Apr-04 Apr-05 Apr-06 Apr-07 Apr-08 Apr-09 Apr-10 Apr-11 Apr-12 Apr-13 Apr-14 Apr-15
Pet
rol p
rice
(cp
l)
Nu
mb
er o
f cr
ash
es
Number of crashes Retail petrol discounted price (cpl)

46
Chart A.23 Number of casualty crashes and unemployment rate (weekly, 1994-
2015)
Source: Source: CAS; Statistics NZ. Note: Dark grey line represents 12 week moving average of
crashes. Number of crashes are shown on the left Y-axis; Unemployment rate is shown on the
right Y-axis.
The number of casualty crashes and vehicle kilometres travelled (VKT) per
capita provide a measure of exposure to crash risk. Whilst there is a
correlation between the two series, the modelling shows other factors are
also important (Chart A.24).
Chart A.24 Number of casualty crashes and VKT/capita (2000-2015)
Source: CAS; MoT. Note: Dark grey line represents 12 week moving average of crashes. Number
of crashes are shown on the left Y-axis; Unemployment rate is shown on the right Y-axis.
However, increases in vehicle kilometres travelled by heavy vehicles (such
as trucks and buses, from an estimated 2.3 billion kilometres in 2001 to 3.0
0
1
2
3
4
5
6
7
8
9
0
50
100
150
200
250
300
Dec
-94
Dec
-95
Dec
-96
Dec
-97
Dec
-98
Dec
-99
Dec
-00
Dec
-01
Dec
-02
Dec
-03
Dec
-04
Dec
-05
Dec
-06
Dec
-07
Dec
-08
Dec
-09
Dec
-10
Dec
-11
Dec
-12
Dec
-13
Dec
-14
Dec
-15
% u
nem
plo
ymen
t
Nu
mb
er o
f cr
ash
es
Number of crashes Unemployment rate (%)
8,600
8,800
9,000
9,200
9,400
9,600
9,800
10,000
0
50
100
150
200
250
300
VK
T /
cap
ita
Nu
mb
er o
f cr
ash
es
Number of crashes VKT / capita

47
billion kilometres in 2015) may have an impact on the severity of road
trauma, particularly where those crashes involve smaller, lighter vehicles.
Seasonality
Time of year (including school holidays) and weather may also impact on
exposure, crash risk and severity. However, the net impact of inclement
weather on road trauma is unclear, as poor weather conditions may reduce
the amount of exposure (as individuals delay discretionary travel) and crash
risk (as individuals drive more carefully), or could increase crash risk (as
the weather conditions are harder to drive in).

48
Appendix B : Econometric method
This technical appendix is designed to detail the road toll modelling
exercise. Figure B.1 provides an overview of the process of data preparation
and outlines key decisions made in the modelling process – which are then
described in greater detail in the remainder of this appendix, whilst the
following appendix (Appendix C) describes the detailed results of the
modelling.
Figure B.1 : Modelling method overview
B.2. Data cleaning
B.2.1. CAS data The CAS data was provided in four separate CSV files spanning 1995 to
2015. These files were read into Stata (the statistical software used in this
analysis), and then appended together into one large data file.
An important step is ensuring that all key variables are of the same ‘type’
(i.e., string or numeric). Often, software will determine data type based on
a ‘first n observations’ sample. This can sometimes mislabel string as
numeric (and vice versa), leading to a large number of missing values.
As the unit of observation for time series modelling is the week, an
important step is attributing dates of the year to a week in an equal manner
(reflecting that there are not exactly four weeks to a month or 52 weeks to
a year). For the purposes of the time series modelling a week must have
seven days, commencing on the same day each week. Most software does
not contain a built in function to map dates to these weeks as, for example,
weeks constructed in this way can span over months or years.
Data cleaning
• CAS data cleaning
• CAS data preparation
• Additional data sources
• Number of casualty crashes
• Casualty injury severity
• Additional CAS data preparation
• Estimating the severity model
• Simulating the severity model
Time series
modelling
Severity
modelling

49
The CAS data includes a number of variables that are not used in the time
series modelling, as well as several casualty crashes that involved only
minor injuries. These are removed from the data set prior to analysis.
The goal of the data cleaning stage is to produce a data set that contains all
explanatory and dependent variables. In this step, indicators are created for
whether a casualty crash involved one of the stratifications as detailed
below (Table B.2).
Table B.1 : Stratified models, variable definition
Stratifying
variable
Definition
Urban Casualty crash occurred on a road with a speed limit between 5 and 70km/h.
Rural Casualty crash occurred on a road with a speed limit between 80 and 100km/h
(a small number of crashes have a recorded speed limit of 777km/h, these
were removed only for the speed limit based stratifications).
Younger driver Crash involved a driver between the ages of 16 and 24 (15 prior to 2011).
Older driver Crash involved a driver greater than 75 years of age.
Motorcycle Crash involved a motorcycle.
Pedestrian Crash involved a pedestrian.
Cyclist Crash involved a cyclist.
Impairment
contributing
Alcohol or drugs were deemed a contributing factor in the crash.
Speed contributing Speed was deemed a contributing factor in the crash.
Distraction
contributing
Distraction was deemed a contributing factor in the crash.
The original CAS data is recorded at the individual level, requiring two steps
to aggregate to the weekly level.
First, indicators for the stratifying variables are aggregated to the crash
level (as well as separate indicators for whether the casualty crash
involved a serious injury or fatality). This produces a data set consisting
of one row per crash.
Then, these indicators are summed to the weekly level. This new data
set consists of one row per week, with columns containing the number
of casualty, serious injury, and fatality crashes, as well as the number
of crashes involving at least one the of the stratifying indicators.
Finally, the first and last week observations are dropped (due to them
containing an incomplete week).
B.2.2. Additional data The CAS data did not contain any variables that could be used as
explanatory variables in the modelling. That is, additional variables were
required to explain the number of crashes in a given week.
Table B.2 : Additional data sources
Data Description Frequency
Recall Advertising recall Weekly
50
Fuel price Average petrol price Weekly
Speed observations Mobile speed camera survey data Monthly
Labour force status Unemployment rate Quarterly
Vehicle kilometres
travelled
Vehicle kilometres travelled by the NZ
fleet
Quarterly
Enforcement Total traffic enforcements Daily
Motorbikes Motorcycle license fleet size Monthly
Vehicle registrations Monthly
Engine size Light fleet engine size Monthly
Advertising expenditure Road safety advertising media spend Monthly
Since modelling was undertaken on crash data aggregated to the weekly
level, the majority of explanatory variables are interpolated to this level.
Interpolation for all monthly data sets (quarterly data sets which were
assigned to the final month of the quarter) was performed in several steps:
1. Loop ‘j’ over the numbers 1 to 4 (corresponding to weeks in the
month)
a. Assign each monthly observation to week ‘j’ of the month
b. Expand the data set to fill in missing weeks (with blanks in
the place of each non-’j’ week)
c. Interpolate (linearly) the relevant set of explanatory
variables over missing weeks
d. Extrapolate (linearly) missing weeks at the tails of the data
(for example, for ‘j’ = 1 the last 3 weeks will still be
missing)
2. Merge the 4 new data sets (corresponding to weeks 1-4 of each
month)
3. Average the interpolated variables across each commencing week
4. Data previously measured at the monthly level is now at the
weekly frequency.
B.3. Model specification
There are several key characteristics of count data, such as the number of
casualty crashes on NZ roads, which imply a linear model is not
appropriate. Namely, count data is nonnegative and typically right skewed
(observations are more likely to be further above the mean than below).
Count data is likely to be drawn from a Poisson distribution, which models
the expected number of casualty crashes in a given week as:
𝐸[𝑐𝑟𝑎𝑠ℎ𝑡] = 𝑒𝑋𝑡𝛽
Where the 𝑋𝑡 term refers to the set of explanatory variables.
For count data with a relatively large mean (typically above 10), and no
zeros, the Poisson can be well approximated with a log-normal distribution.
This amounts to log-transforming the equation above and estimating using
least squares:
ln 𝑐𝑟𝑎𝑠ℎ𝑡 = 𝑋𝑡𝛽 + 𝜖𝑡

51
This approximation is particularly useful when the error term exhibits
persistence. This could occur, for example, when unobserved factors that
affect the number of casualty crashes are correlated over time. Persistence
in the error terms can be modelled using ARMA terms. However, there was
little evidence of autocorrelation in the NZ data.
B.3.1. Variable selection There was a relatively small set of explanatory variables available to be
used in modelling the number of casualty crashes. In selecting which
variables would be used in the final estimates, modelling tended to follow a
general to specific approach.
The modelling approach involved starting with the full set of available
explanatory variables, and reducing the set using tests of statistical
significance. This method was generally fruitful due to the relatively large
number of observations (600-700), and may not have been possible
analysing the data at the monthly or quarterly level.
An important pitfall of this approach to variable selection was that it is more
likely to find statistically significant explanatory variables by ‘chance’
(increasing the Type 1 error rate). Therefore, the final specification may be
the result of data mining, and not hold true in practice.
This highlights the important role of placing theoretically sound priors on
the specification and set of explanatory variables, and raises several
questions that should be asked in determining the final set of results:
Does the set of explanatory variables make sense, a priori?
Do the estimates conform to theoretical priors (in terms of sign and
significance)?
Are the estimates equations robust to different specifications, both in
including additional explanatory variables and using different lag
specifications?
Finally, two additional sets of tests were performed after deciding on the
final specification. An F-test was used as a measure of the collective
importance of all excluded explanatory variables. A Hausman test was a
final check for whether the remaining parameter estimates change
significantly depending on the exclusion of other explanatory variables.
B.3.2. Casualty injury severity (time series) The distribution of the weekly number of serious injury and fatal casualty
crashes is such that a log-linear approximation is unlikely to be appropriate.
These series were modelled using the Poisson distribution, which closely fits
key characteristics of the data.
Instead of modelling the number of serious injury and fatal casualty crashes
in a given week, the rate of severity/fatality per casualty crash was
modelled. This was modelled in the Poisson framework using an exposure
(or offset) term, consistent with the DRAG19 approach. The expected
severity rate in a given week is given as:
19 The DRAG approach is a component modelling approach (outlined by Bergel-Hayat and Zukowska, 2015), which decomposes fatalities into these four elements:
(1) fatalities per serious casualty; (2) serious casualties per casualty (measure of severity);

52
𝐸[𝑠𝑒𝑣𝑒𝑟𝑖𝑡𝑦𝑡] = 𝑐𝑟𝑎𝑠ℎ𝑡𝑒𝑍𝑡Γ
Where 𝑍𝑡 is the relevant set of explanatory variables.
In this framework, it is less clear how persistence is accounted for. If it is
expected that the form of persistence is not multiplicative, then log-lags of
the dependent variable should be included in the set of explanatory
variables. However, since, for example, the number of fatalities in a given
week can be zero, it was not possible to directly take the log of the
dependent variable.
In order to model persistence, an additional indicator variable was added,
equal to 1 when the count is zero. This ensures that the log-dependent
variable can be used, interacted with the indicator.
In additional to robustness tests for variable inclusion, there were additional
tests that refer to assumptions made in the Poisson model. A key
assumption is that the (conditional) mean is equal to the variance. If mis-
specified, the standard errors of explanatory variables will be incorrectly
estimated.
This variance assumption is often violated in practice, leading to either
under of over dispersion, although over dispersion is more often observed
empirically.
Several methods were utilised that accommodate for over-dispersion
relative to the Poisson model. The most commonly employed is to model
the variance as an additional term, the Negative Binomial model. Estimates
from the Negative Binomial model are such that it is possible to statistically
test for the presence of over-dispersion.
However, the common practice of comparing models to check for the
consistency of implied results was adopted. These specifications included:
Robust standard errors
Estimating a variance scale factor in the Poisson model
Estimating the full Negative Binomial model
The implications of each specification did not change substantially (that is,
there was no practical difference between the estimates). As such, results
from the Poisson model are presented below.
B.3.3. Casualty injury severity (micro) Injury severity, as recorded in the CAS data, can take on several discrete
categories:
Fatal
Serious
Minor
No injury (removed from analysis)
The ‘distance’ between each of these severity outcomes is not defined, so
standard regression techniques are not applicable to data of this type.
(3) casualties per kilometre (measure of crash likelihood); and
(4) kilometres travelled. Such a structure means a model that includes all four components provides estimates
for trends in fatalities, and a model that includes components (2), (3) and (4) provides estimates for serious casualty trends.
53
Instead, the outcomes are treated as categories, and the probability that,
given a casualty crash has occurred, each injury severity level will be
realised is modelled.
Following the method outlined in Weiss et al. (2014), a multinomial logit
model was used.20 This leads to the following expression for the expected
probability of each severity level, given that a casualty crash has occurred:
𝑝𝑖𝑗 =𝑒𝑋𝑖𝛽𝑗
1 + ∑ 𝑒𝑋𝑖𝛽𝑘𝐾−1𝑘=1
Where 𝑝𝑖𝑗 is the probability that individual i will be injured to a severity level
of j, and 𝑋𝑖𝛽𝑗 is the effect of explanatory variables. Standard errors are
clustered at the crash level to account for correlation between individual
severity levels in a given crash.
Coefficients from the estimated multinomial logit of injury severity cannot
be interpreted in the same fashion as those from a linear model. Instead,
the model was calculated and interpreted in terms of marginal effects. That
is, effect of a marginal change (in the case of a continuous explanatory
variables), or discrete step (in the case of categorical variables), on the
probability of each injury severity level, given that a casualty crash has
occurred.
Since the expected probability function is nonlinear, the marginal effect
depends on the entire set of explanatory variables. Marginal effects were
calculated as the average effect across the entire sample. This implies that
a potentially large number of calculations have to be performed. Based on
the CAS data sample (approximately 270,000 observations, standard errors
of the marginal effects were not calculated for computational reasons.
20 It was not feasible to relax the IIA assumption made by multinomial logit models due to computational complexities.

54
Appendix C : Detailed results
This appendix presents the analysis results for a number of different
dependent variables, as well as additional interpretation and specification
checks.
C.1. Time series modelling results
C.1.1. Casualty crashes
Coefficients from a (log-linear) model of the number of casualty crashes are
displayed in Table A.4 below.
Table C.1 : Regression results, casualty crashes
Coefficient Estimate Standard error
Week 2 0.077 0.040
Week 3 0.125** 0.040
Week 4 0.148*** 0.041
Week 5 0.171*** 0.041
Week 6 0.194*** 0.042
Week 7 0.286*** 0.043
Week 8 0.267*** 0.043
Week 9 0.263*** 0.043
Week 10 0.227*** 0.042
Week 11 0.231*** 0.042
Week 12 0.258*** 0.042
Week 13 0.181*** 0.041
Week 14 0.200*** 0.041
Week 15 0.170*** 0.041
Week 16 0.140*** 0.041
Week 17 0.151*** 0.041
Week 18 0.196*** 0.042
Week 19 0.217*** 0.042
Week 20 0.189*** 0.041
Week 21 0.239*** 0.042
Week 22 0.220*** 0.042
Week 23 0.152*** 0.041
Week 24 0.176*** 0.042
Week 25 0.165*** 0.042
Week 26 0.148*** 0.042

55
Coefficient Estimate Standard error
Week 27 0.106* 0.042
Week 28 0.120** 0.042
Week 29 0.118** 0.042
Week 30 0.086* 0.041
Week 31 0.071 0.041
Week 32 0.099* 0.041
Week 33 -0.003 0.042
Week 34 0.063 0.041
Week 35 0.024 0.041
Week 36 0.015 0.041
Week 37 -0.016 0.041
Week 38 -0.009 0.041
Week 39 -0.052 0.041
Week 40 -0.016 0.042
Week 41 0.030 0.042
Week 42 0.007 0.043
Week 43 0.010 0.041
Week 44 0.063 0.042
Week 45 0.059 0.043
Week 46 0.086* 0.044
Week 47 0.087* 0.044
Week 48 0.083 0.045
Week 49 0.074 0.045
Week 50 0.096* 0.044
Week 51 0.070 0.044
Week 52 0.098* 0.045
2005 -0.124*** 0.035
2006 -0.263*** 0.070
2007 -0.397*** 0.107
2008 -0.577*** 0.141
2009 -0.730*** 0.164
2010 -0.802*** 0.174
2011 -0.930*** 0.179
2012 -0.987*** 0.184
2013 -1.106*** 0.193
2014 -1.301*** 0.211
2015 -1.390*** 0.233
Log VKT 2.522*** 0.630
Log Motorbikes 1.585*** 0.334
Log Enforcement 0.067* 0.030
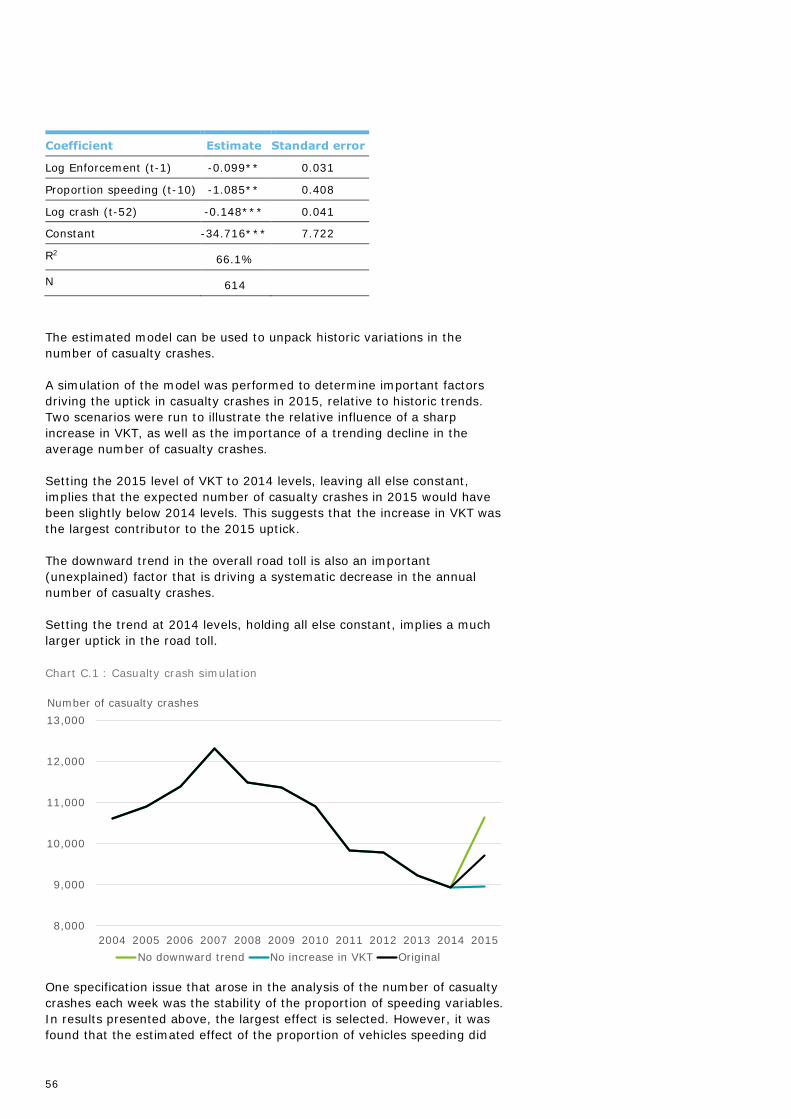
56
Coefficient Estimate Standard error
Log Enforcement (t-1) -0.099** 0.031
Proportion speeding (t-10) -1.085** 0.408
Log crash (t-52) -0.148*** 0.041
Constant -34.716*** 7.722
R2 66.1%
N 614
The estimated model can be used to unpack historic variations in the
number of casualty crashes.
A simulation of the model was performed to determine important factors
driving the uptick in casualty crashes in 2015, relative to historic trends.
Two scenarios were run to illustrate the relative influence of a sharp
increase in VKT, as well as the importance of a trending decline in the
average number of casualty crashes.
Setting the 2015 level of VKT to 2014 levels, leaving all else constant,
implies that the expected number of casualty crashes in 2015 would have
been slightly below 2014 levels. This suggests that the increase in VKT was
the largest contributor to the 2015 uptick.
The downward trend in the overall road toll is also an important
(unexplained) factor that is driving a systematic decrease in the annual
number of casualty crashes.
Setting the trend at 2014 levels, holding all else constant, implies a much
larger uptick in the road toll.
Chart C.1 : Casualty crash simulation
One specification issue that arose in the analysis of the number of casualty
crashes each week was the stability of the proportion of speeding variables.
In results presented above, the largest effect is selected. However, it was
found that the estimated effect of the proportion of vehicles speeding did
8,000
9,000
10,000
11,000
12,000
13,000
2004 2005 2006 2007 2008 2009 2010 2011 2012 2013 2014 2015
No downward trend No increase in VKT Original
Number of casualty crashes

57
not substantially change between the 7th and 12th lag (estimates presented
in Chart C.2 below).
Chart C.2 : Casualty crash model, proportion speeding specification
Note: 95% confidence interval of estimate presented.
C.1.2. Severity rate modelling Coefficient estimates of the exposure offset Poisson models of severity rate
(relative to the total number of casualty crashes) are presented in Table C.2
below.
Table C.2 : Regression results, severity crashes
Coefficient Serious injury rate Fatality rate
2005 -0.011
(0.045)
2006 0.043
(0.082)
2007 -0.014
(0.120)
2008 0.113
(0.160)
2009 0.173
(0.184)
2010 0.144
(0.195)
2011 0.170
(0.208)
2012 0.212
(0.214)
2013 0.145
(0.222)
2014 0.138
(0.237)
2015 0.010
(0.255)
-2.5
-2.0
-1.5
-1.0
-0.5
0.0
0.5
1.0
1.5
t-0 t-1 t-2 t-3 t-4 t-5 t-6 t-7 t-8 t-9 t-10 t-11 t-12 t-13 t-14 t-15
Proportion speedingeffect
Coefficient estimate

58
Coefficient Serious injury rate Fatality rate
Week 52 0.090*
(0.047)
0.352***
(0.100)
Log VKT 2.899***
(0.693)
1.942***
(0.736)
Log Motorbikes -0.613*
(0.371)
Log Ad spend (t-4) -0.0723**
(0.0290)
Proportion speeding (t-6) -1.182*
(0.644)
Log fuel price -0.422***
(0.0874)
Constant -20.23***
(6.614)
-19.28***
(6.710)
N 618 608
The estimated coefficients from the injury severity models are interpreted in
the same manner as the log-linear model of casualty crashes. However, the
estimates are conditional on the number of casualty crashes (due to the
offset term). That is, the estimated effects relate to the injury severity rate,
rather than the count.
For example, an increase in VKT of 1% is associated with a 2.9% increase
in the serious injury rate (the number of serious injury crashes per 100
casualty crashes).
This implies, together with the model for the number of casualty crashes, a
compounding effect of explanatory variables (such as VKT). A 1% increase
in VKT is associated with a 5.5% increase in the number of serious injury
crashes (approximately 2.5%+2.9%), and a 4.4% increase in the number
of fatal crashes (approximately 2.5%+1.9%)
C.1.3. Stratified models Table C.3 on the following pages presents results for models estimated
separately on stratifications of the number of casualty crashes in a given
week. The definition of each stratification, as well as the model used, is
available in Table C.2 above.
The purpose of the stratified models was to understand whether there were
significant differences in the relationships between the explanatory
variables and subsets of crash types. Broadly the results are consistent with
the main model, with a few interesting findings:
Increases in enforcement in the current period is associated with an
increase in the number of urban crashes;
Increases in unemployment are associated with a decrease in the
number of young driver crashes;
Increases in advertising spending are associated with a decrease in the
number of older driver crashes; and
Increases in unemployment is associated with a decrease in the number
of pedestrian crashes five weeks later.

59
Table C.3 : Regression results, stratified models
Coefficient Urban Rural Younger
drivers
Older
drivers
Motorcycles Pedestrians Cyclists Impaired
drivers
Speeding
drivers
Distracted
drivers
Week 2 0.112** -0.00926 0.0632 0.0394 -0.0444 0.0911 0.172 0.0589 0.0620 -0.00902
Week 3 0.201*** 0.00172 0.143** 0.0336 -0.0812 -0.0123 0.130 0.0559 0.102 0.0650
Week 4 0.226*** 0.0660 0.172*** 0.0848 -0.0152 0.143 0.455*** 0.192*** 0.102 0.0926
Week 5 0.260*** 0.0456 0.183*** 0.152 0.0857 0.363* 0.358*** 0.168** 0.0847 0.186**
Week 6 0.327*** 0.0773 0.212*** 0.110 0.100 0.344* 0.585*** 0.0827 0.132* 0.239***
Week 7 0.411*** 0.115** 0.244*** 0.0158 0.128 0.463** 0.539*** 0.208*** 0.226*** 0.248***
Week 8 0.425*** 0.0670 0.236*** 0.0314 0.125 0.498*** 0.678*** 0.259*** 0.117* 0.350***
Week 9 0.409*** 0.0674 0.130** 0.0375 0.0934 0.544*** 0.590*** 0.199*** 0.0956 0.347***
Week 10 0.360*** 0.0660 0.189*** 0.164 0.0581 0.516*** 0.459*** 0.115 0.0459 0.236***
Week 11 0.359*** 0.0919 0.221*** 0.244* -0.0338 0.262 0.652*** 0.160** 0.110 0.324***
Week 12 0.373*** 0.0848 0.255*** 0.315** 0.0301 0.507*** 0.559*** 0.172** 0.223*** 0.360***
Week 13 0.319*** 0.0231 0.230*** 0.161 -0.0597 0.325 0.455*** 0.152** 0.125* 0.219**
Week 14 0.342*** 0.0275 0.222*** 0.278** 0.00371 0.489** 0.243* 0.208*** 0.146** 0.284***
Week 15 0.290*** 0.0609 0.190*** 0.305** -0.0721 0.396** 0.211 0.0227 0.211*** 0.205**
Week 16 0.266*** 0.0107 0.186*** 0.261* -0.0534 0.264 0.0655 0.194*** 0.150** 0.232***

60
Coefficient Urban Rural Younger
drivers
Older
drivers
Motorcycles Pedestrians Cyclists Impaired
drivers
Speeding
drivers
Distracted
drivers
Week 17 0.321*** -0.0654 0.176*** 0.0894 -0.180** 0.190 0.233* 0.0747 0.0787 0.131
Week 18 0.395*** -0.0579 0.226*** -0.107 -0.0829 0.426** 0.215 0.0491 0.0874 0.328***
Week 19 0.427*** -0.0776 0.227*** 0.0301 -0.0431 0.550*** 0.340** 0.119* 0.0932 0.309***
Week 20 0.379*** -0.0680 0.162*** 0.175 -0.186** 0.373* 0.334** 0.139* 0.0702 0.228**
Week 21 0.410*** 0.00556 0.274*** 0.363*** -0.198** 0.466** 0.300** 0.175** 0.0426 0.341***
Week 22 0.368*** 0.00673 0.217*** 0.365** -0.217** 0.146 0.317** 0.162** 0.0670 0.313***
Week 23 0.325*** -0.0306 0.164*** 0.117 -0.294*** 0.203 0.216 0.184** 0.0523 0.132
Week 24 0.356*** -0.0770 0.127** -0.0453 -0.411*** 0.233 0.182 0.182** 0.0150 0.124
Week 25 0.326*** -0.0361 0.109* 0.0193 -0.295*** 0.278 0.237* 0.0984 -0.0495 0.0701
Week 26 0.290*** -0.00251 0.134** 0.0163 -0.427*** 0.0851 0.197 0.135* -0.000718 0.204**
Week 27 0.200*** 0.0177 0.0686 0.115 -0.471*** -0.110 -0.0345 0.0384 -0.0372 0.0763
Week 28 0.237*** -0.00304 0.121** 0.185 -0.479*** 0.185 -0.224* 0.159** -0.0897 0.166*
Week 29 0.313*** -0.116** 0.107* 0.0102 -0.345*** 0.0480 0.0556 0.150** -0.154** 0.0937
Week 30 0.303*** -0.194*** 0.0972* 0.00172 -0.366*** 0.267 0.0457 0.112 -0.0880 0.106
Week 31 0.264*** -0.173*** 0.00809 0.0157 -0.284*** 0.0365 0.0947 0.143** -0.130* 0.102
Week 32 0.324*** -0.216*** 0.127** -0.0709 -0.328*** 0.222 0.101 0.0798 0.0949 0.0267
Week 33 0.222*** -0.256*** 0.00129 -0.0744 -0.407*** 0.0863 -0.0540 0.0963 -0.219*** 0.195**

61
Coefficient Urban Rural Younger
drivers
Older
drivers
Motorcycles Pedestrians Cyclists Impaired
drivers
Speeding
drivers
Distracted
drivers
Week 34 0.258*** -0.134** 0.104* 0.0624 -0.298*** -0.0128 0.141 0.146** 0.0530 0.132
Week 35 0.249*** -0.278*** 0.00840 0.252* -0.238*** 0.237 0.154 0.104 -0.0205 0.0942
Week 36 0.238*** -0.283*** 0.0312 -0.00825 -0.301*** -0.0488 -0.0554 0.101 -0.143* 0.143
Week 37 0.201*** -0.324*** -0.0499 0.0727 -0.350*** 0.119 0.115 0.0920 -0.193*** 0.0706
Week 38 0.132*** -0.159*** 0.00358 -0.0332 -0.284*** 0.0467 -0.0493 0.0298 -0.0868 -0.0159
Week 39 0.0862* -0.187*** -0.0473 -0.0308 -0.345*** -0.0896 0.0818 0.0688 -0.0687 -0.108
Week 40 0.0957** -0.116* -0.00717 -0.0431 -0.353*** -0.260 -0.0226 0.200*** -0.0864 -0.0948
Week 41 0.211*** -0.183*** 0.0829 -0.0992 -0.162* -0.0499 0.200 0.263*** -0.0526 -0.0117
Week 42 0.142*** -0.147** -0.0548 0.0249 -0.202** 0.0177 0.144 0.184*** 0.0212 0.145
Week 43 0.156*** -0.164*** -0.00773 -0.221 -0.0587 -0.112 0.218* 0.143** 0.0375 0.0843
Week 44 0.219*** -0.154** -0.0158 -0.0189 -0.0604 0.169 0.368*** 0.139* -0.128* 0.144
Week 45 0.180*** -0.133** -0.0129 0.165 -0.119 0.171 0.295** 0.206*** -0.0424 0.0582
Week 46 0.199*** -0.0813 0.0316 0.220 -0.0821 0.176 0.276** 0.208*** 0.0656 0.151
Week 47 0.181*** -0.0346 0.0284 0.0833 -0.0780 0.0295 0.225* 0.200*** 0.0327 0.0752
Week 48 0.188*** -0.0491 0.0310 0.00656 -0.189** -0.0509 0.213 0.209*** 0.0696 0.0238
Week 49 0.166*** -0.0315 0.0920 -0.116 -0.108 0.171 0.0595 0.212*** -0.00316 0.0699
Week 50 0.219*** -0.0476 0.0227 0.177 -0.182** 0.0214 0.0104 0.277*** 0.138** 0.0536

62
Coefficient Urban Rural Younger
drivers
Older
drivers
Motorcycles Pedestrians Cyclists Impaired
drivers
Speeding
drivers
Distracted
drivers
Week 51 -0.00374 0.145** 0.0552 0.202 -0.0183 -0.00503 -0.373*** 0.197*** 0.0535 0.00448
Week 52 -0.0290 0.307*** 0.253*** 0.183 -0.106 -0.275 -0.187 0.439*** 0.366*** 0.0636
2002 0.0335 -0.00910 -0.275** 0.0927* 0.201 0.107*** -0.135***
2003 -0.0693 -0.107 -0.433*** 0.101 0.202 0.0715* -0.213***
2004 -0.278*** -0.345*** -0.500** -0.0193 -0.156 0.0618 -0.390***
2005 -0.411*** -0.104** -0.510*** -0.587** 0.112 -0.360 0.0202 0.149*** -0.490*** -0.233***
2006 -0.547*** -0.211** -0.672*** -0.437* 0.0736 -0.490 0.0271 0.290*** -0.440*** -0.484***
2007 -0.692*** -0.324** -0.865*** -0.453* 0.215 -0.633 0.0819 0.350*** -0.349*** -0.640***
2008 -0.860*** -0.485** -1.093*** -0.393* 0.131 -0.895 -0.0164 0.334*** -0.320*** -0.884***
2009 -1.029*** -0.585** -1.232*** -0.273 0.000253 -0.932 0.00204 0.287*** -0.385*** -1.077***
2010 -1.110*** -0.641** -1.332*** -0.366 -0.0916 -0.936 -0.0573 0.190*** -0.489*** -1.134***
2011 -1.211*** -0.780*** -1.509*** -0.382* -0.201 -1.018 -0.196 0.107** -0.518*** -1.378***
2012 -1.241*** -0.869*** -1.618*** -0.228 -0.223 -1.115 -0.187 0.0924** -0.541*** -1.518***
2013 -1.350*** -1.019*** -1.815*** -0.483** -0.240 -1.055 -0.188 -0.0158 -0.694*** -1.664***
2014 -1.551*** -1.247*** -2.044*** -0.709** -0.262 -1.305 -0.302* -0.0880** -0.846*** -1.753***
2015 -1.657*** -1.332*** -2.160*** -0.757** -0.260 -1.683 -0.225 -0.0269 -0.818*** -1.815***
Log VKT 2.908*** 3.438*** 3.970*** 5.972*** 5.570***

63
Coefficient Urban Rural Younger
drivers
Older
drivers
Motorcycles Pedestrians Cyclists Impaired
drivers
Speeding
drivers
Distracted
drivers
Log Motorbikes 1.727*** 1.094** 2.055*** 1.257* 3.902** 2.425***
Log Enforcement -0.125*** 0.0929** 0.264*** 0.308** 0.296*** 0.130***
Log Enforcement
(t-1)
-0.125*** -0.0239 -0.323*** -0.434*** -0.251**
Log Enforcement
(t-2)
-0.0586
Log Enforcement
(t-3)
-0.106**
Proportion
speeding (t-10)
Log depvar (t-1) -0.124*** 0.092**
Log depvar (t-52) -0.074*** -0.191*** -0.130*** -0.074** -0.120*** -0.067** -0.056* -0.073*
Depvar dummy
(t-1)
-0.039
Depvar dummy
(t-52)
0.090
Unemployment
rate
-0.488**
Unemployment
rate (t-5)
-17.33***

64
Coefficient Urban Rural Younger
drivers
Older
drivers
Motorcycles Pedestrians Cyclists Impaired
drivers
Speeding
drivers
Distracted
drivers
Proportion
speeding (t-4)
-2.154**
Proportion
speeding (t-7)
-2.597***
Log ad spend -0.035**
Log fuel price 0.591**
Constant -40.93*** -38.19*** -54.05*** -51.97*** -10.93 -41.47** -0.874 1.955*** -47.41*** -23.79***
R2 58.2% 60.7% 39.2%
N 771 617 771 754 778 778 608 779 771 620

65
C.2. Microeconometric severity modelling results
Coefficient estimates from the multinomial logit model of casualty crash
injury severity are presented in Table C.4 below. Standard errors are
clustered at the accident level.
Table C.4 : Severity model coefficient estimates
Variable Coefficient estimate
(Serious)
P-value
(Serious)
Coefficient
estimate
(Fatal)
P-value (Fatal)
Age 0.008*** 0.0000 -0.020*** 0.0000
Age squared 0.000 0.0714 0.001*** 0.0000
Zero years old 0.514 0.0635 2.090*** 0.0000
Male 0.029* 0.0257 0.121*** 0.0000
Road type (relative to minor urban road)
Major urban road -0.046* 0.0104 0.050 0.3536
Open other road 0.214*** 0.0000 0.511*** 0.0000
Open road state highway 0.293*** 0.0000 0.859*** 0.0000
Urban state highway 0.060* 0.0226 0.455*** 0.0000
Motorway -0.389*** 0.0000 -0.235* 0.0380
Weather (relative to fine) and lighting (relative to bright sun)
Mist -0.152** 0.0022 -0.043 0.6603
Light rain -0.112*** 0.0000 -0.171*** 0.0000
Heavy rain -0.079* 0.0101 -0.195** 0.0036
Snow -0.064 0.5919 -0.324 0.2445
Frost -0.110* 0.0480 -0.355* 0.0145
Strong wind -0.025 0.5890 0.270** 0.0017
Dark 0.043 0.1132 0.219*** 0.0005
Overcast -0.052*** 0.0010 -0.074* 0.0493
Twilight 0.014 0.6658 0.056 0.4722
Speed (relative to ≥ 50km/h and ≤ 70km/h)
Speed zone < 50km/h -0.345*** 0.0000 -0.955*** 0.0000
Speed zone > 70km/h and <
100km/h
-0.264*** 0.0000 -1.037*** 0.0000
Speed zone ≥ 100km/h -0.169*** 0.0000 -0.426*** 0.0000
Interaction terms
Two parties in a high speed
zone
0.499*** 0.0000 1.246*** 0.0000
Three or more parties in a high
speed zone
0.575*** 0.0000 1.276*** 0.0000
Two parties in a medium speed
zone
0.378*** 0.0000 1.346*** 0.0000
Three or more parties in a
medium speed zone
0.401*** 0.0002 1.414*** 0.0000
Individual role (relative to driver)
Passenger -0.073 0.5121 0.202 0.3791

66
Variable Coefficient estimate
(Serious)
P-value
(Serious)
Coefficient
estimate
(Fatal)
P-value (Fatal)
Neither driver not passenger -0.600* 0.0357 -0.747 0.0689
Crash involved a driver who was
Male 0.118*** 0.0000 0.416*** 0.0000
Young (< 25 years old) -0.022 0.3164 -0.027 0.6218
Young (< 25 years old) and Male 0.032 0.1729 -0.092 0.1141
Vehicle type (relative to car)
Van or utility 0.048* 0.0330 -0.131** 0.0093
Truck or SUV -0.046 0.0771 -0.094 0.0897
Bus -0.277 0.0943 -1.443*** 0.0001
Motorcycle 1.416*** 0.0000 1.393*** 0.0000
Pedestrian 2.110*** 0.0000 2.989*** 0.0000
Cyclist 1.738*** 0.0000 2.206*** 0.0000
Other 0.685*** 0.0000 1.049*** 0.0002
Licence status (relative to full licence)
Restricted -0.010 0.5724 -0.037 0.3888
Learner 0.034 0.1025 -0.041 0.3986
Disqualified or Forbidden 0.156*** 0.0000 0.177** 0.0092
Expired 0.276*** 0.0000 0.213 0.0736
Never licensed 0.129*** 0.0000 0.283*** 0.0000
Other (not driver) 0.705** 0.0014 1.155** 0.0011
Overseas driver -0.131*** 0.0000 -0.267*** 0.0000
Wrong license class 0.242*** 0.0009 0.582*** 0.0000
Number of parties (relative to single vehicle crash)
Two vehicles -0.363*** 0.0000 -1.138*** 0.0000
Three or more vehicles -0.308*** 0.0000 -0.922*** 0.0000
Crash factors (relative to other crash factors)
Speed 0.227*** 0.0000 0.532*** 0.0000
Distractions -0.023 0.4007 -0.029 0.6532
Failure to give way -0.123*** 0.0000 -0.538*** 0.0000
Alcohol or drugs 0.461*** 0.0000 0.756*** 0.0000
Individual factors (relative to other individual factors)
Speed 0.024 0.4019 0.419*** 0.0000
Distractions -0.020 0.5857 0.134 0.1183
Failure to give way 0.060* 0.0306 0.365*** 0.0000
Alcohol or drugs 0.168*** 0.0000 0.191*** 0.0005
Vehicle age
Vehicle age 0.014*** 0.0000 0.020*** 0.0000
Vehicle zero years -0.027 0.8127 0.058 0.8040

67
Variable Coefficient estimate
(Serious)
P-value
(Serious)
Coefficient
estimate
(Fatal)
P-value (Fatal)
Vehicle movement (relative to overtaking and lane change / pulling
out or changing lane to the right)
Head on 0.600*** 0.0000 0.598*** 0.0000
Lost control or off road (straight
roads)
-0.012 0.7876 -0.731*** 0.0000
Cornering -0.108* 0.0132 -0.939*** 0.0000
Collision with obstruction -0.113* 0.0132 -1.006*** 0.0000
Rear end -0.915*** 0.0000 -1.701*** 0.0000
Turning versus same direction -0.387*** 0.0000 -1.081*** 0.0000
Crossing (no turns) -0.035 0.4347 -0.187 0.0675
Crossing (vehicle turning) -0.115* 0.0128 -0.670*** 0.0000
Merging -0.341*** 0.0000 -1.122*** 0.0000
Right turn against -0.010 0.8360 -0.734*** 0.0000
Manoeuvring -0.215*** 0.0000 -0.872*** 0.0000
Pedestrians crossing road -0.093 0.1626 -0.309* 0.0225
Pedestrians other -0.069 0.3863 0.286* 0.0460
Miscellaneous 0.776*** 0.0000 1.464*** 0.0000
Type B -0.004 0.8127 -0.028 0.4403
Type C -0.041 0.0649 -0.091 0.0507
Type D -0.200*** 0.0000 -0.599*** 0.0000
Type E 0.007 0.8347 -0.151 0.0531
Type F -0.144*** 0.0000 -0.380*** 0.0000
Type G -0.622*** 0.0000 -1.643*** 0.0000
Type O -0.166*** 0.0003 -0.373*** 0.0000
Year (relative to 1995)
1996 0.100** 0.0045 0.005 0.9495
1997 0.068 0.0587 0.152* 0.0453
1998 0.033 0.3651 0.112 0.1516
1999 0.114** 0.0019 0.155* 0.0460
2000 0.115** 0.0024 0.194* 0.0167
2001 0.093* 0.0107 0.050 0.5291
2002 0.035 0.3308 -0.118 0.1387
2003 0.012 0.7248 -0.011 0.8826
2004 0.018 0.6204 -0.063 0.4322
2005 -0.030 0.3961 -0.128 0.1277
2006 -0.037 0.2986 -0.238** 0.0032
2007 -0.109** 0.0023 -0.230** 0.0035
2008 -0.118*** 0.0009 -0.308*** 0.0002
2009 -0.115** 0.0017 -0.221** 0.0066
2010 -0.162*** 0.0000 -0.232** 0.0043
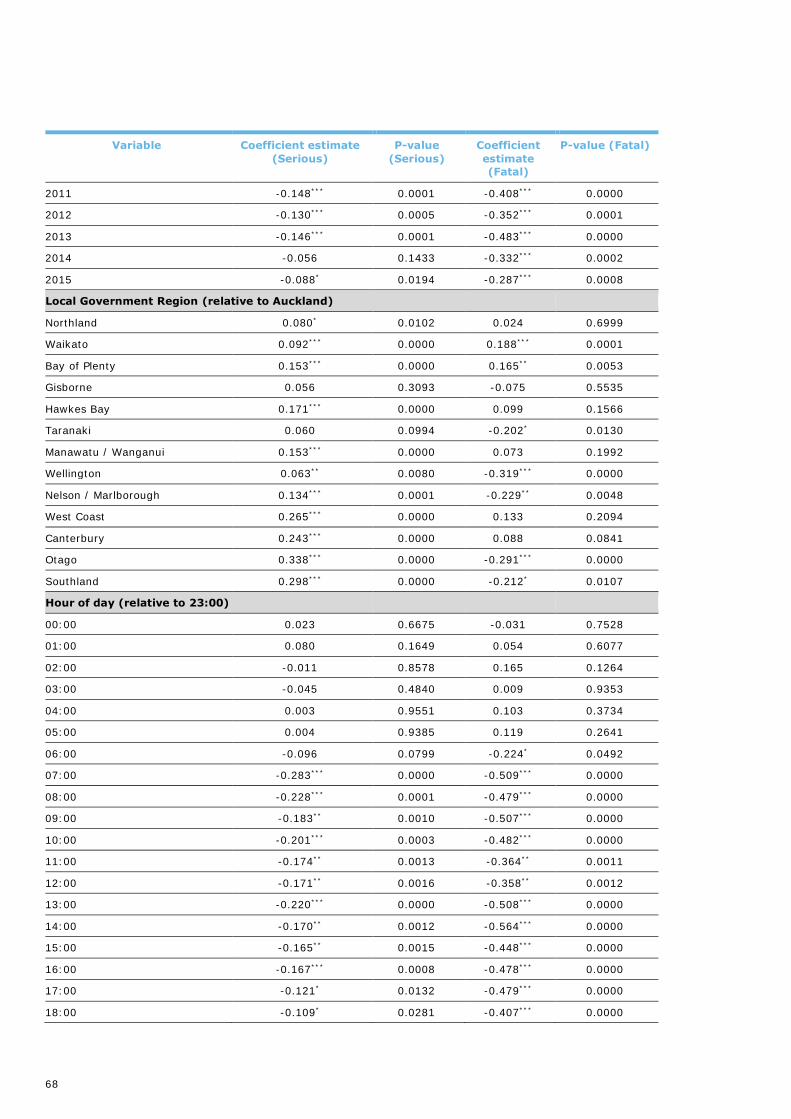
68
Variable Coefficient estimate
(Serious)
P-value
(Serious)
Coefficient
estimate
(Fatal)
P-value (Fatal)
2011 -0.148*** 0.0001 -0.408*** 0.0000
2012 -0.130*** 0.0005 -0.352*** 0.0001
2013 -0.146*** 0.0001 -0.483*** 0.0000
2014 -0.056 0.1433 -0.332*** 0.0002
2015 -0.088* 0.0194 -0.287*** 0.0008
Local Government Region (relative to Auckland)
Northland 0.080* 0.0102 0.024 0.6999
Waikato 0.092*** 0.0000 0.188*** 0.0001
Bay of Plenty 0.153*** 0.0000 0.165** 0.0053
Gisborne 0.056 0.3093 -0.075 0.5535
Hawkes Bay 0.171*** 0.0000 0.099 0.1566
Taranaki 0.060 0.0994 -0.202* 0.0130
Manawatu / Wanganui 0.153*** 0.0000 0.073 0.1992
Wellington 0.063** 0.0080 -0.319*** 0.0000
Nelson / Marlborough 0.134*** 0.0001 -0.229** 0.0048
West Coast 0.265*** 0.0000 0.133 0.2094
Canterbury 0.243*** 0.0000 0.088 0.0841
Otago 0.338*** 0.0000 -0.291*** 0.0000
Southland 0.298*** 0.0000 -0.212* 0.0107
Hour of day (relative to 23:00)
00:00 0.023 0.6675 -0.031 0.7528
01:00 0.080 0.1649 0.054 0.6077
02:00 -0.011 0.8578 0.165 0.1264
03:00 -0.045 0.4840 0.009 0.9353
04:00 0.003 0.9551 0.103 0.3734
05:00 0.004 0.9385 0.119 0.2641
06:00 -0.096 0.0799 -0.224* 0.0492
07:00 -0.283*** 0.0000 -0.509*** 0.0000
08:00 -0.228*** 0.0001 -0.479*** 0.0000
09:00 -0.183** 0.0010 -0.507*** 0.0000
10:00 -0.201*** 0.0003 -0.482*** 0.0000
11:00 -0.174** 0.0013 -0.364** 0.0011
12:00 -0.171** 0.0016 -0.358** 0.0012
13:00 -0.220*** 0.0000 -0.508*** 0.0000
14:00 -0.170** 0.0012 -0.564*** 0.0000
15:00 -0.165** 0.0015 -0.448*** 0.0000
16:00 -0.167*** 0.0008 -0.478*** 0.0000
17:00 -0.121* 0.0132 -0.479*** 0.0000
18:00 -0.109* 0.0281 -0.407*** 0.0000

69
Variable Coefficient estimate
(Serious)
P-value
(Serious)
Coefficient
estimate
(Fatal)
P-value (Fatal)
19:00 -0.097 0.0525 -0.236* 0.0164
20:00 -0.092 0.0690 -0.308** 0.0019
21:00 -0.048 0.3475 -0.297** 0.0033
22:00 -0.075 0.1540 -0.111 0.2641
Day of week (relative to
Monday)
Tuesday 0.043 0.0657 0.033 0.5226
Wednesday 0.021 0.3704 0.090 0.0751
Thursday 0.019 0.4004 0.104* 0.0410
Friday -0.010 0.6524 0.065 0.1749
Saturday 0.021 0.3303 0.040 0.3884
Sunday 0.026 0.2248 0.018 0.6787
Constant -1.998*** 0.0000 -3.170*** 0.0000
Source: Deloitte Access Economics (2016)
As mentioned above, the estimates of a multinomial logit model are not, in
themselves, meaningful. Instead, marginal effects are calculated for each of
the explanatory variables (presented in Table C.5 below).
Table C.5 Severity model marginal effects
Variable P(injury=minor) P(injury=severe) P(injury=fatal)
Age -0.002 0.001 0.000
Zero years old -0.148 0.034 0.114
Male -0.006 0.003 0.003
Road type (relative to minor urban road)
Major urban road 0.005 -0.006 0.001
Open other road -0.036 0.026 0.010
Open road state
highway
-0.054 0.034 0.021
Urban state highway -0.015 0.005 0.010
Motorway 0.046 -0.043 -0.002
Weather (relative to fine) and lighting (relative to bright sun)
Mist 0.019 -0.019 0.000
Light rain 0.017 -0.013 -0.004
Heavy rain 0.013 -0.009 -0.004
Snow 0.014 -0.006 -0.007
Frost 0.020 -0.012 -0.008
Strong wind -0.003 -0.006 0.008
Dark -0.010 0.004 0.006
Overcast 0.008 -0.006 -0.001

70
Variable P(injury=minor) P(injury=severe) P(injury=fatal)
Twilight -0.003 0.001 0.001
Speed (relative to ≥ 50km/h and ≤ 70km/h)
Speed zone < 50km/h 0.060 -0.040 -0.021
Speed zone > 70km/h
and < 100km/h
0.003 -0.001 -0.002
Speed zone ≥
100km/h
-0.027 0.020 0.007
Individual role (relative to driver)
Passenger 0.005 -0.012 0.007
Neither driver not
passenger
0.080 -0.067 -0.013
Crash involved a driver who was
Male -0.022 0.012 0.009
Young (< 25 years
old)
0.003 -0.003 -0.001
Young (< 25 years
old) and Male
-0.002 0.005 -0.003
Vehicle type (relative to car)
Van or utility -0.003 0.006 -0.003
Truck or SUV 0.006 -0.004 -0.002
Bus 0.042 -0.023 -0.018
Motorcycle -0.233 0.205 0.028
Pedestrian -0.401 0.289 0.112
Cyclist -0.311 0.247 0.065
Other -0.107 0.080 0.027
Licence status (relative to full licence)
Restricted 0.002 -0.001 -0.001
Learner -0.004 0.005 -0.001
Disqualified or
Forbidden
-0.024 0.020 0.004
Expired -0.041 0.038 0.004
Never licensed -0.022 0.015 0.007
Other (not driver) -0.130 0.094 0.036
Overseas driver 0.021 -0.015 -0.006
Wrong license class -0.045 0.028 0.017
Number of parties (relative to single vehicle crash)
Two vehicles 0.022 -0.014 -0.008
Three or more
vehicles
0.006 -0.003 -0.003
Crash factors (relative to other crash factors)
Speed -0.040 0.027 0.014
Distractions 0.003 -0.003 -0.001

71
Variable P(injury=minor) P(injury=severe) P(injury=fatal)
Failure to give way 0.024 -0.013 -0.012
Alcohol or drugs -0.078 0.059 0.019
Individual factors (relative to other individual factors)
Speed -0.012 -0.001 0.013
Distractions -0.000 -0.004 0.004
Failure to give way -0.015 0.005 0.011
Alcohol or drugs -0.025 0.022 0.004
Vehicle age
Vehicle age -0.002 0.002 0.000
Vehicle zero years 0.002 -0.004 0.002
Vehicle movement (relative to overtaking and lane change / pulling out or
changing lane to the right)
Head on -0.106 0.086 0.019
Lost control or off
road (straight roads)
0.018 0.005 -0.022
Cornering 0.033 -0.007 -0.026
Collision with
obstruction
0.035 -0.008 -0.027
Rear end 0.123 -0.088 -0.035
Turning versus same
direction
0.068 -0.040 -0.027
Crossing (no turns) 0.010 -0.003 -0.007
Crossing (vehicle
turning)
0.030 -0.010 -0.020
Merging 0.063 -0.035 -0.028
Right turn against 0.018 0.005 -0.022
Manoeuvring 0.045 -0.021 -0.024
Pedestrians crossing
road
0.020 -0.009 -0.010
Pedestrians other -0.001 -0.013 0.014
Miscellaneous -0.172 0.094 0.078
Type B 0.001 -0.000 -0.001
Type C 0.007 -0.005 -0.002
Type D 0.035 -0.022 -0.013
Type E 0.002 0.002 -0.004
Type F 0.025 -0.016 -0.009
Type G 0.089 -0.064 -0.025
Type O 0.027 -0.019 -0.008
Year (relative to 1995)
1996 -0.013 0.014 -0.001
1997 -0.012 0.008 0.004
1998 -0.007 0.003 0.003
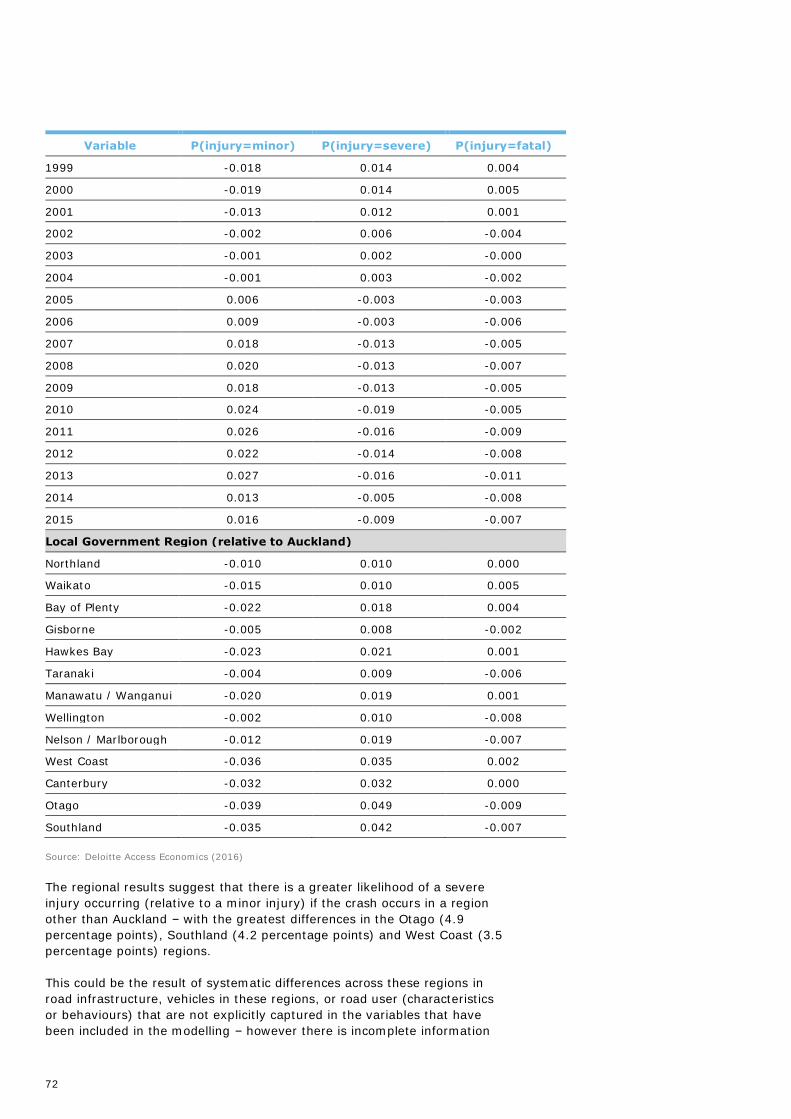
72
Variable P(injury=minor) P(injury=severe) P(injury=fatal)
1999 -0.018 0.014 0.004
2000 -0.019 0.014 0.005
2001 -0.013 0.012 0.001
2002 -0.002 0.006 -0.004
2003 -0.001 0.002 -0.000
2004 -0.001 0.003 -0.002
2005 0.006 -0.003 -0.003
2006 0.009 -0.003 -0.006
2007 0.018 -0.013 -0.005
2008 0.020 -0.013 -0.007
2009 0.018 -0.013 -0.005
2010 0.024 -0.019 -0.005
2011 0.026 -0.016 -0.009
2012 0.022 -0.014 -0.008
2013 0.027 -0.016 -0.011
2014 0.013 -0.005 -0.008
2015 0.016 -0.009 -0.007
Local Government Region (relative to Auckland)
Northland -0.010 0.010 0.000
Waikato -0.015 0.010 0.005
Bay of Plenty -0.022 0.018 0.004
Gisborne -0.005 0.008 -0.002
Hawkes Bay -0.023 0.021 0.001
Taranaki -0.004 0.009 -0.006
Manawatu / Wanganui -0.020 0.019 0.001
Wellington -0.002 0.010 -0.008
Nelson / Marlborough -0.012 0.019 -0.007
West Coast -0.036 0.035 0.002
Canterbury -0.032 0.032 0.000
Otago -0.039 0.049 -0.009
Southland -0.035 0.042 -0.007
Source: Deloitte Access Economics (2016)
The regional results suggest that there is a greater likelihood of a severe
injury occurring (relative to a minor injury) if the crash occurs in a region
other than Auckland – with the greatest differences in the Otago (4.9
percentage points), Southland (4.2 percentage points) and West Coast (3.5
percentage points) regions.
This could be the result of systematic differences across these regions in
road infrastructure, vehicles in these regions, or road user (characteristics
or behaviours) that are not explicitly captured in the variables that have
been included in the modelling – however there is incomplete information

73
available about how these factors differ across regions, making it difficult to
draw meaningful or robust conclusions and implications from them.
Whilst there are some differences in the likelihood of fatalities, results in
Table C.4 suggest there is mixed significance (noting that standard errors
were not calculated for the marginal effects in Table C.5, due to
computational limitations).
As with models of the weekly number of casualty crashes, it is possible to
simulate the injury severity model in order to better understand drivers
behind the 2014/15 uptick in the rate of injury severity per casualty crash.
The expected proportion of casualty crashes that result in a fatality are
calculated, setting the time period indicator to 2013. This is designed to
disentangle time trends from changes in the underlying factors that cause a
given severity level.
Presented below, the simulation results suggest that the uptick in 2014 and
2015 in the fatality rate was not driven by changes in the observable
characteristics of crashes (such as gender, region, speed limit, and
contributing factors). Instead, a large proportion of the increase is
attributable to the time period indicators. This suggests that the uptick was
driven by changes outside of the micro factors leading to injury severity.
Chart C.3 : Severity model simulation
2.0%
2.5%
3.0%
3.5%
4.0%
4.5%
1995 1997 1999 2001 2003 2005 2007 2009 2011 2013 2015
Actual fatality rate Predicted fatality rate Simulated fatality rate
Fatality rate of casualty crashes

74
Appendix D : Other descriptive analysis
D.1. Overseas licence holders
Since 1997, the number of international visitors to New Zealand has
increased from 1.8 million to 6.9 million in 2015 (an average annual growth
rate of 7.6%; Chart D.1). Over that same period, the use of cars by
international visitors has also increased, from 600,000 in 1997 to 2 million
in 2015, but at a slightly slower rate (7% average annual growth).
Chart D.1 International visitors and use of cars (self, family, friends and
company owned and rental cars)
Source: Ministry of Business, Innovation and Employment
The increasing use of cars by overseas licence holders, all else equal,
should translate to increased exposure to crash risk. However, it is unclear:
the distances that overseas licence holders drive, relative to total
vehicle kilometres travelled; and
whether overseas licence holders are at a higher risk of crash (for a
given unit of travel) because they are unable to adapt to New Zealand
road rules and conditions.
Together, this means that disentangling the impact of overseas licence
holders on the road toll is a complex task. Whilst the number of overseas
licence holders involved in casualty crashes has increased over time (Chart
D.2), this is within the context of increasing visitor numbers.
Notably, whilst there has been an increase in the number of overseas
licence holders seriously injured since 2012, the number of fatalities has
remained relatively stable, suggesting that increases in the number of
overseas licence holders has not necessarily driven increases in New
Zealand’s road toll.
0
1,000
2,000
3,000
4,000
5,000
6,000
7,000
8,000
Tho
usa
nd
s o
f vi
sito
rs
Total international visitors International visitors using cars

75
Chart D.2 Number of overseas licence holders seriously or fatally injured
Source: CAS
However, overseas licence holders may be more susceptible to crashes, if
they are less likely to be able to successfully adapt to New Zealand road
rules and conditions. Chart D.3 shows the share of casualties where failure
to give way was a contributing factor for overseas licence holders, and non-
overseas licence holders.
Chart D.3 Casualties where failure to give way was a contributing factor, as
share of casualties
Source: CAS
Casualties for overseas licence holders are proportionately more likely to
have involved a failure to give way, particularly since 2010. This is a
somewhat counterintuitive result, given the simplification of give way rules
in New Zealand in 2012, to align with many other countries. However, it
may be the case that the reduction in crashes from these rule changes
0
100
200
300
400
500
600
19
96
19
97
19
98
19
99
20
00
20
01
20
02
20
03
20
04
20
05
20
06
20
07
20
08
20
09
20
10
20
11
20
12
20
13
20
14
20
15
Nu
mb
er o
f o
vers
eas
licen
ce h
old
ers
Fatalities Serious injuries
0%
1%
2%
3%
4%
5%
6%
7%
8%
9%
10%
19
95
19
96
19
97
19
98
19
99
20
00
20
01
20
02
20
03
20
04
20
05
20
06
20
07
20
08
20
09
20
10
20
11
20
12
20
13
20
14
20
15
% o
f ca
sual
ties
Non-overseas licence holders Overseas licence holders

76
impacted on crashes that did not cause an injury – and hence have not had
an impact on the crashes recorded in CAS.
D.2. Distractions
The number of casualty crashes where distraction by mobile phones and
other devices has changed dramatically over time, with the rate trending
upwards from 1998 to 2008 (Chart D.4), coinciding with the penetration of
mobile phones in the population.
Chart D.4 Casualties where distraction by mobile phones and other devices were
a contributing factor.
Source: CAS. Note: Contributing factors 359 (Cell phone), 361 (Navigation device) and 362 (Non
cell communication device) are included here.
In 2009, the Land Transport (Road User) Amendment Rule 2009 came into
effect, which banned the use of hand-held mobile phones and all texting
whilst driving. This is associated with a significant drop in the number of
casualties where phones and devices were a factor (from 88 in 2008 to 58
in 2009).
However, in recent years, the number of instances where devices were a
factor has risen (to 62 in 2015), which may be driven by the increasing use
of mobile phones for navigation, the changing nature in which individuals
use their mobile phones whilst driving, and changing attitudes of drivers.
0
10
20
30
40
50
60
70
80
90
100
19
95
19
96
19
97
19
98
19
99
20
00
20
01
20
02
20
03
20
04
20
05
20
06
20
07
20
08
20
09
20
10
20
11
20
12
20
13
20
14
20
15
Nu
mb
er o
f ca
sual
ties

77
Limitation of our work
General use restriction
This report is prepared solely for the use of the Ministry of Transport. This
report is not intended to and should not be used or relied upon by anyone
else and we accept no duty of care to any other person or entity. The report
has been prepared for the purpose of undertaking a qualitative and
quantitative analysis of the New Zealand road toll. You should not refer to
or use our name or the advice for any other purpose.

78
Contact us
Deloitte Access Economics
ACN: 149 633 116
8 Brindabella Circuit
Brindabella Business Park
Canberra Airport ACT 2609
Tel: +61 2 6263 7000
Fax: +61 2 6263 7004
Deloitte Access Economics is Australia’s pre-eminent economics advisory practice and a member of Deloitte's global economics
group. For more information, please visit our website
www.deloitte.com/au/deloitte-access-economics
Deloitte refers to one or more of Deloitte Touche Tohmatsu Limited, a UK private company limited by guarantee, and its network
of member firms, each of which is a legally separate and independent entity. Please see www.deloitte.com/au/about for a
detailed description of the legal structure of Deloitte Touche Tohmatsu Limited and its member firms.
The entity named herein is a legally separate and independent entity. In providing this document, the author only acts in the
named capacity and does not act in any other capacity. Nothing in this document, nor any related attachments or
communications or services, have any capacity to bind any other entity under the ‘Deloitte’ network of member firms (including
those operating in Australia).
About Deloitte
Deloitte provides audit, tax, consulting, and financial advisory services to public and private clients spanning multiple industries.
With a globally connected network of member firms in more than 150 countries, Deloitte brings world-class capabilities and high-
quality service to clients, delivering the insights they need to address their most complex business challenges. Deloitte's
approximately 200,000 professionals are committed to becoming the standard of excellence.
About Deloitte Australia
In Australia, the member firm is the Australian partnership of Deloitte Touche Tohmatsu. As one of Australia’s leading
professional services firms. Deloitte Touche Tohmatsu and its affiliates provide audit, tax, consulting, and financial advisory
services through approximately 6000 people across the country. Focused on the creation of value and growth, and known as an
employer of choice for innovative human resources programs, we are dedicated to helping our clients and our people excel. For
more information, please visit our web site at www.deloitte.com.au.
Liability limited by a scheme approved under Professional Standards Legislation.
Member of Deloitte Touche Tohmatsu Limited
© 2017 Deloitte Touche Tohmatsu