qualitative and quantitative analysis of radical species...
TRANSCRIPT

Qualitative and Quantitative AnalysisQualitative and Quantitative Analysis
Of Radical Species in AOPOf Radical Species in AOP

Qualitative Analysis of OH radicalQualitative Analysis of OH radical
1. Analysis of 1. Analysis of diagnosticdiagnostic oxidized productoxidized product
2. 2. EElectron lectron SSpin pin RResonance (ESR)esonance (ESR)

1. Analysis of1. Analysis of diagnostic diagnostic oxidized productoxidized product
� Using the known reaction product with OH radical
OH
+ •OH →
O2 HO2e.g.
+ OH →
H3C C
OH
CH3
H
+ •OH → H3C C
O
CH3
O2 HO2
benzene phenol
2-propanol Acetone

2. Electron Spin Resonance (ESR)2. Electron Spin Resonance (ESR)
ESR (Electron Spin Resonance Spectroscopy) ?
- Detecting free radical compounds using its magnetic property
- Free radical: any atom or group that possesses one or more unpaired electrons
- Electron paramagnetic resonance spectroscopy (EPR)- Electron paramagnetic resonance spectroscopy (EPR)
- Free radical located under magnetic field: Energy levels of an electron spin
in a magnetic field is separated (Zeeman separation). As microwave irradiation is applied externally, the hyperfine structure of splitting is generated. 에너지 상태는 안전과 불안정으
로 분열. 여기에 마이크로파를 조사하면 에너지를 흡수하여 전이
- Hyroxyl radical spin trapping (for OH radical)
- Comparison with reference information

Signal output of ESRSignal output of ESR
Fig. 1 The ESR spectrum of the benzen Fig. 1 The ESR spectrum of the benzen
radical anion (C6H6-) in fluid solution
g-value : the center of the spectrum
g-value of the specific radical or complex
a: the hyperfine splitting of the spectrum
splitted lines, signal intensity

Detecting free Detecting free radiaclradiacl by ESRby ESR
� Minimal concentration of radical for ESR signal detection: 10-6M
� Several approaches
(1) 신속 혼합법: detecting radical itself without any pretreatment,
~ difficult for kinetic study
(2) Freezing method: freezing radical before the analysis to slow
down the signal reduction
~ difficult for accurate interpretation of signal
(3) Spin-trap method: Detecting the ESR signal of stable radical
adduct which is the product between the radical of interest and the
spin trapping agent

* Detecting the ESR signal of stable radical adduct which is the
product between the radical of interest and the spin trapping agent
* Suggested by Janzen & Blackburn (1969)
* Buettner, G. R., “Spin trapping ; ESR parameters of spin
adducts”, Free Rad. Biol. Med., 1987, 3, 259-303.

Representative SpinRepresentative Spin--trapping agentstrapping agents
� Spin-trapping agents
- addition of a free radical
to an unsaturated bond
- leading to a longer lived
Fig. 6 Spin-trap agents and their
radical adducts
- leading to a longer lived
new radical (nitroxyl free radical)

DMPO spinDMPO spin--trapping trapping 에에 의한의한 radical radical 분석분석 (1)(1)
� DMPO : a useful spin trapping agent for differentiating ·OH from HO2·
(3.1x109M-1s-1)
� 산소중심 라디칼 측정에 유용
Table 1 ESR parameters of DMPO spin adducts
adduct solvent lines aN aH Others
• H Water 9 16.6 22.5(2)
• OH Water 4 15.0 15.0
• OOH Water 12 14.2 11.3 0.13(H)
• CH3 Water 6 16.3 23.2
• Cl Benzene 12 14.3 11.7

DMPO spinDMPO spin--trapping trapping 에에 의한의한 radical radical 분석분석 (2)(2)
� DMPO-OH
4 peaks
1:2:2:1 intensity
Fig. 7 Typical spectra of DMPO-adducts
� DMPO-OOH
12 peaks

ESR measurement using DMPO spinESR measurement using DMPO spin--trapping trapping
� Excess scavenger (DMPO) is required
� Rapid determination for DMPO adduct (still unstable) is
recommended
ex) t (DMPO-OH) = 10~20 min ex) t1/2 (DMPO-OH) = 10~20 min
t1/2 (DMPO-H) = 1 min (25oC)

Kinetics of DMPO spin adduct (1)Kinetics of DMPO spin adduct (1)
� Kinetic information (rate constants of spin adduct formation and
decay) is essential for quantitative studies
� Decay constants of DMPO-OH
DMPO-OH + DMPO-H → k = 2.44 × 10²M-1 s-1
DMPO-OH + DMPO-OH → k = 11 M-1 s-1DMPO-OH + DMPO-OH → k = 11 M-1 s-1

Kinetics of DMPO spin adduct (2)Kinetics of DMPO spin adduct (2)
(a) (b)
Fig. 8 Linear (a) and semilogarithmic (b) kinetic plot of the spectral intensity of
the DMPO-H and the DMPO-OH

Kinetic Method for Quantitative Analysis Kinetic Method for Quantitative Analysis of of •• OH in Aqueous SolutionOH in Aqueous Solution
1.1. Measurement of steady state Measurement of steady state ••OHOH concentrationconcentration
2.2. Formation rate of Formation rate of ••OHOH2.2. Formation rate of Formation rate of OHOH

Detecting the steady state concentration of Detecting the steady state concentration of ••OH OH
•OH source [ •OH ]
Generation of •OH Consumption of •OH
•OH scavengersteady state
Trace amounts of •OH probe compound
e.g.
O3Fe(II) or (III)/ H2O2UV/TiO2...
•OH probe (P)
d[P]/dt = kp[•OH]ss[P]
e.g.
O3Fe(II)
organic substrates
steady state
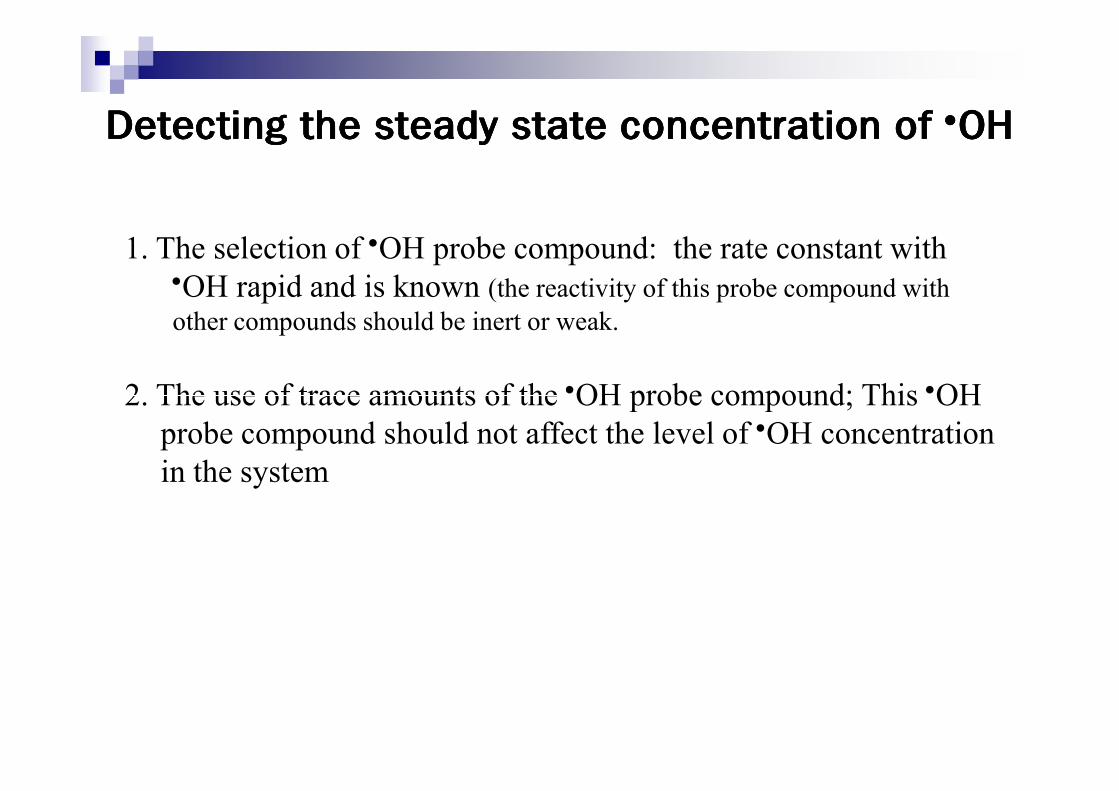
1. The selection of •OH probe compound: the rate constant with •OH rapid and is known (the reactivity of this probe compound with other compounds should be inert or weak.
2. The use of trace amounts of the •OH probe compound; This •OH
Detecting the steady state concentration of Detecting the steady state concentration of ••OH OH
2. The use of trace amounts of the •OH probe compound; This •OH
probe compound should not affect the level of •OH concentration
in the system

3. Find out the kp,obs (s-1) first and calculate [•OH]ss from it.
d[P]/dt = - kp,obs[P]
= - k [•OH] [P] = - kp[•OH]ss[P]
⇒ kobs,p/kp = [•OH]ss
kp : the reaction constant of probe compound with •OH (M-1 s-1)

Example : Measurement of [Example : Measurement of [••OH]OH]ssss
pCBA (p-chlorobenzoic acid, 2 µM) decreases in Fenton process ([Fe(III)]0 = 0.1
mM, [H2O2]0 = 10 mM, 30oC). Find out [•OH]ss.
Time (s) [pCBA] (µM)Time (s) [pCBA] (µM)
0 2
60 1.82
240 1.45
480 1.06
720 0.8
960 0.58
kp : the reaction constant of pCBA with •OH (M-1 s-1) ; 5×10⁹M-1 s-1

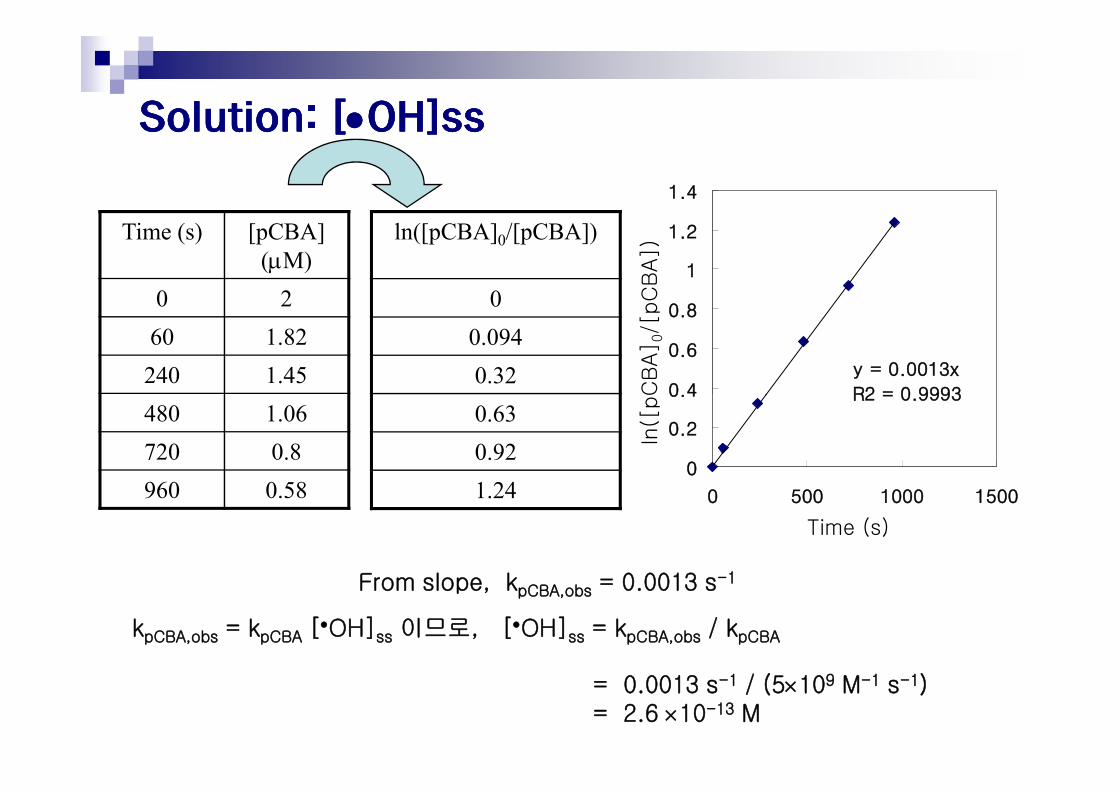
Solution: [Solution: [••OH]OH]ssss
d[pCBA]/dt = kpCBA,obs[pCBA]
⇒ d[pCBA]/[pCBA] = kpCBA,obs dt
Find out the kp,obs (s-1) first and calculate [•OH]ss from it.
⇒ ln([pCBA]0/[pCBA]) = kpCBA,obs t
Form the linear relationship between ln([pCBA]0/[pCBA]) and time, find
out kpCBA,obs.
Solution: [Solution: [••OH]OH]ssss
y = 0.0013x
R2 = 0.99930.4
0.6
0.8
1
1.2
1.4
Time (s) [pCBA]
(µM)
0 2
60 1.82
240 1.45
ln([pCBA]0/[pCBA])
0
0.094
0.32
ln([
pC
BA] 0
/[pC
BA])
R2 = 0.9993
0
0.2
0.4
0 500 1000 1500
480 1.06
720 0.8
960 0.58
0.63
0.92
1.24
Time (s)
ln([
pC
BA]
From slope, kpCBA,obs = 0.0013 s-1
kpCBA,obs = kpCBA [•OH]ss 이므로, [•OH]ss = kpCBA,obs / kpCBA
= 0.0013 s-1 / (5×10⁹ M-1 s-1)= 2.6 ×10⁻¹³ M

•OH source •OH
Generation of •OH Consumption of •OH
•OH scavenger
(1) Excess use of •OH Probe compound
Measuring the formation rate of Measuring the formation rate of ••OHOH
e.g.
O3Fe(II) or Fe(III)/ H2O2UV/TiO2...
•OH probe (P)
e.g.
organic substrates
O3
Fe(II)
P + •OH → Product
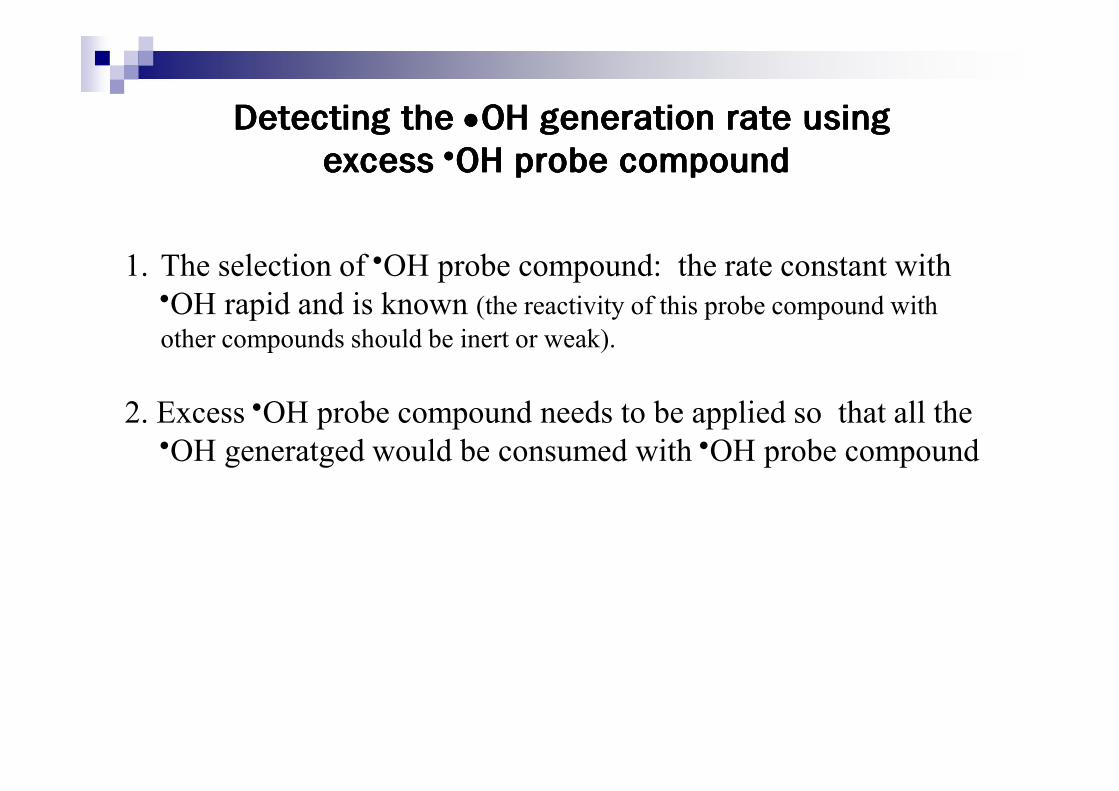
Detecting the Detecting the ••OH generation rate using OH generation rate using excess excess ••OH probe compoundOH probe compound
1. The selection of •OH probe compound: the rate constant with •OH rapid and is known (the reactivity of this probe compound with other compounds should be inert or weak).
2. Excess •OH probe compound needs to be applied so that all the 2. Excess •OH probe compound needs to be applied so that all the •OH generatged would be consumed with •OH probe compound

3. The generation rate of product A is equal to the generation rate of •OH
•OH source → •OH + excess P (probe compound) → A (product)
Let rOH= the •OH generation rate,
d[•OH]/dt = rOH – (-d[P]/dt) ≈ 0
rOH = -d[P]/dt = d[A]/dt

(2) Use of excess •OH scavenger & trace amounts of •OH probe
compound
•OH source •OH
Generation of •OH Consumption of •OH
Existing •OH scavenger
e.g.e.g.
O3Fe(II) or (III)/ H2O2UV/TiO2...
•OH probe (P)
d[P]/dt = kp[•OH]ss[P]
e.g.
organic substrates
O3Fe(II)
Employed
•OH scavenger (S)

1. •OH 과 빠른 속도로 반응하고 그 속도상수를 알고 있는 화합물 중•OH probe compound (kp)와 •OH scavenger (ks)를 하나씩 선정
Note : •OH scavenger의 경우 반응 생성물이 시스템에 영향을 주지 않는화합물로 선정
Use of excess •OH scavenger & trace amounts of •OH probe
compound
2. 시스템 내 농도를 알고 있는 과량의 •OH scavenger 와 미량의•OH probe compound를 가함.
Note : •OH probe compound와 scavenger 농도조건 :
생성된 •OH은 대부분 •OH scavenger와 반응하고 •OH probe compound와•OH의 반응은 무시할 수 있는 농도를 가한다.

3. 실험을 통해 측정한 •OH probe compound 의 일차분해 속도로부터•OH 생성속도를 구한다.
Let rOH= the •OH generation rate,
•OH + S (scavenger)
•OH source
•OH + P (probe)
<<
Let rOH= the •OH generation rate,
d[•OH]/dt = rOH – (-d[S]/dt) = rOH – (ks[•OH]ss[S]) ≈ 0
⇒ rOH = ks[•OH]ss[S]
Then, d[P]/dt = kp,obs[P] = kp[•OH]ss[P]
⇒ kobs,p/kp = [•OH]ss
결국, rOH = ks kp,obs [S] / kpProbe compound의 분해시간 동안 scavenger의농도는 변하지 않는다고 가정

Measuring Measuring rrOHOH예제 : UV/H2O2 공정에서 •OH의 생성속도를 측정하기 위해 공정 초기에 과량의 t-BuOH 10 mM (•OH scavenger)과 미량의 pCBA 2 µM (•OH probe
compound)를 첨가하여 pCBA의 감소를 살펴보았다. •OH생성속도는 ?
(pCBA와 •OH의 반응 속도상수; 5×10⁹ M-1 s-1
t-BuOH과 •OH의 반응 속도상수; 6.6×10⁸ M-1 s-1 ).
Time (sec) [pCBA] (µM)Time (sec) [pCBA] (µM)
0 2
240 1.80
480 1.61
980 1.30
1960 0.90

d[pCBA]/dt = kpCBA,obs[pCBA]
Measurement of Measurement of rrOHOH
Form the linear relationship between ln([pCBA]0/[pCBA]) and time, find
out kpCBA,obs.
⇒ d[pCBA]/[pCBA] = kpCBA,obs dt
⇒ ln([pCBA]0/[pCBA]) = kpCBA,obs t

Time (s) [pCBA]
(µM)
0 2
240 1.80
480 1.61
ln([pCBA]0/[pCBA])
0
0.11
0.22
y = 4.2E-04x
R2 = 1.0E+00
0.2
0.3
0.4
0.5
0.6
0.7
0.8
0.9
ln([
pC
BA] 0
/[pC
BA])
Measurement of Measurement of rrOHOH
480 1.61
980 1.30
1960 0.90
0.22
0.43
0.80
0
0.1
0 1000 2000 3000
Time (s)
ln([
pC
BA]
From slope, kpCBA,obs = 4.2×10⁻⁴ s-1
From rOH = ks kp,obs [S] / kp ,
rOH = (6.6×10⁸M-1 s-1) × (4.2 ×10-4 s-1) × (10-2M) / (5 ×10⁹M-1 s-1)
= 5.5 ×10⁻⁷M s-1