qualitative and quantitative analysis of...
TRANSCRIPT

QUALITATIVE AND QUANTITATIVE ANALYSIS OF
PHILIPS
Authors (Universitat de Barcelona):
Guillem Puig Comerma
Xavier Mestres Márquez
EDITOR: Jordi Marti Pidelaserra
(Dpt. Comptabilitat, Universitat Barcelona)

2
Guillem Puig
Xavier Mestres
31/05/2013
Anàlisis dels estats comptables

3
FIRM ANALYSIS
4
INDEX
1. Introduction………………………………………………………………………………………………………. 4
2. History……………………………………………………………………………………………………………….. 4
3. Mission………………………………………………………………………………………………………………. 4
4. Vision………………………………………………………………………………………………………………….4
5. Philips Activities…………………………………………………………………………………………………. 5
1. Healthcare…………………………………………………………………………………………….. 5
2. Consumer Lifestyle……………………………………………………………………………….. 6
3. Lighting…………………………………………………………………………………………………. 7
4. Innovation…………………………………………………………………………………………….. 9
6. Group Strategic focus………………………………………………………………………………………… 10
7. Company Structure……………………………………………………………………………………………. 10
8. Management…………………………………………………………………………………………………….. 11
9. Philips Evolution………………………………………………………………………………………………… 12
10. Holding………………………………………………………………………………………………………………. 13
11. Strategic Alliances……………………………………………………………………………………………… 14
12. Shareholders……………………………………………………………………………………………………… 15
13. Suppliers.................................................................................................................16
14. Clients.....................................................................................................................16
15. Competitors............................................................................................................16
16. Appendix…………………………………………………………………………………………………………… 18

5
1. Philips Introduction
Philips is a diversified technology company active in the markets of healthcare, lighting and
consumer well-being. The headquarters are in Amsterdam (Netherlands)
2. History
Philips was founded in Eindhoven (Netherlands) in 1891 by Frederik and Gerard Philips to
manufacture incandescent lamps and other electrical products.
Koninklijke Philips Electronics N.V., the company, which started as a limited partnership
with the name Philips & Co. In Eindhoven, the Netherlands, in 1891, was converted into the
company with limited liability N.V. Philips’ Gloeilambpenfabrieken on September 11, 1912. On
May 6, 1994, the name was changed to Philips Electronics N.V., and on april 1, 1998, the name
was changed to Koninklijke Philips Electronics N.V. Its shares have been listed on the
Amsterdam Stock Exchange, Euronext Ambsterdam, since 1912. The shares have been traded
in the United States since 1962 and have been listed on the New York Stock Exchange since
1987.
The foundations of Philips were laid in 1891 when Anton and Gerard Philips established Philips & Co. in Eindhoven, the Netherlands. The company begun manufacturing carbon-filament lamps and by the turn of the century, had become one of the largest producers in Europe. Stimulated by the industrial revolution in Europe, Philips’ first research laboratory started introducing its first innovations in the x-ray and radio technology. Over the years, the list of inventions has only been growing to include many breakthroughs that have continued to enrich people’s everyday lives.
3. Mission
Philips has the mission of improve people’s life through meaningful innovation. Innovation is
core to everything they do. But innovation does not only mean “new technology”. It can also
mean a new application, a new business model or a unique customer proposition brought
about by an innovative partnership. By tracking global trends and understanding the
challenges facing people in their daily lives, they ensure that people in their daily lives, we
ensure that people’s needs and aspirations remain at the heart of their innovation endeavours.
4. Vision
At Philips, we strive to make the world healthier and more sustainable through innovation.
Our goal is to improve the lives of 3 billion people a year by 2025. We will be the best place to
work for people who share our passion. Together we will deliver superior value for our
customers and shareholders.

6
5. Philips activities
5.1. Healthcare
Philips is one of the world’s leading health care companies (based on sales) along with
General Electric and Siemens. The United States, is its largest market, represented 41% of our
Healthcare business’s global sales in 2012, and it is followed by Japan, China and
Germany. Growth geographies accounted for 24% of Healthcare sales. It has to be noted that
the global economic crisis has had a negative effect on Philips Healthcare’s sales in Europe,
particularly in the southern Europe. Philips Healthcare employs approximately 37,500
employees worldwide.
On this Philips Healthcare market, sales are generally higher in the second half of the
year.
Philips Healthcare is organized around four big sub activities or strategies that are the
following ones: Imaging Systems (Integrated clinical solutions that include radiation oncology,
clinical applications and platforms, etc.), Patient Care & Clinical Informatics (Enterprise patient
monitoring solutions, from value solutions to sophisticated connected solutions), Home
Healthcare Solutions (Sleep management, respiratory care and non-invasive ventilation.) and
Customer Services (Equipment services and support, including service contracts, equipment
maintenance, etc.).
The main objective of Philips Healthcare is being the leader of the market and they
want to reach that point by innovating and creating new healthcare technology.
Philips Healthcare’s department has thought about some goals to reach in the next few
years which could give Philips the leadership of the healthcare market. These ideas are:
Implement Accelerate! Transformation, Driving to co-Leadership on Imaging Systems,
Achieving leadership with holistic innovation in Patient Care & Clinical Informatics,
International expansion of the Home Healthcare Solutions business, Invest for leadership in
growth geographies as China, India and Arabic countries specially Saudi Arabia and Abu Dhabi,
Executing operational excellence initiatives to increase margin and time-to-market and finally
Deliver on EcoVision sustainability commitments.

7
Philips has some healthcare priorities for 2013 related to innovating and developing new
activities and the existing ones:
Complete its Accelerating Healthcare transformation. Invest in its growth initiatives to deliver differentiated offerings from the hospital to the
home Create momentum behind Customer Services. Implement its end-to-end customer relationship management solution across the global
Philips Healthcare organization. Create a high-performance organization as measured by ongoing employee surveys and
business results. Institutionalize its end-to-end operating framework to optimize financial returns on our
portfolio and improve the customer experience.
5.2. Consumer Lifestyle
At consumer lifestyle Philips wants to make the world healthier and more sustainable
through innovation, make life easier and more comfortable, it is also focused on value creation
through category development and delivery through operational excellence. Something it has
to be highlight is that in difference between the other sectors where Philips works, on this
specific one (consumer lifestyle) it knows there are lots of competitors and being the leader of
this kind of market is not its main objective.
If we talk about the products make by Philips we have to know that it bases its
products on four key parameters that represent the image of the firm. These four points,
which Philips has in mind before creating a new product for use in everyday life, are:
*Consumers have a growing interest in personal health.
*Consumers are increasingly appearance-conscious.
*Consumers want healthy food that is also easy to prepare.
*In a complex market environment, consumers look for responsible brands they can trust.
We think it is also important to say in which business areas Philips focuses its consumer lifestyle production. From our point of view and agreeing with Philips, these areas are four:
1. Health & Wellness: mother and childcare, oral healthcare. 2. Personal Care: male grooming, skincare, beauty. 3. Domestic Appliances: coffee, floor care, garment care, kitchen appliances, water &
air, beverage appliances. 4. Lifestyle Entertainment: audio and video entertainment; communications,
headphones and accessories.

8
It also has some priorities for consumer lifestyle for 2013:
Drive global scale and category leadership in health and well-being categories with attractive profit pools.
Further reduce our cost base. Improve return on investment in marketing. Roll out end-to-end programs that will drive reduced time-to-market, reduced inventories
and improved gross margins.
After having discussed these first two sectors in which Philips acts, we can see the great involvement of the company in everything related to improving people’s life, making it better, easier, more comfortable and increasingly technological.
5.3. Lighting
Philips serves a large and attractive market that is driven by the need for more light,
energy-efficient lighting, and digital lighting. This industry is very important for Philips
especially because is a growing market which has a lot of possibilities and future given the fact
that over half the world’s population currently lives in urban areas: a figure that is expected to
rise to over 70% by 2050, and all that people will need light.
Philips is a global market leader with recognized expertise in the development,
manufacturing and application of innovative lighting solutions. It has pioneered many of the
key breakthroughs in lighting over the past 121 years.
Philips idea on lighting is the following one: “We believe that by focusing on what
people really need and leveraging our expertise with a broad range of leading partners, we can
create and deliver the most innovative and meaningful solutions on the market.” So we can
see again the importance of the technology on Philips.
In this industry Philips has done a big bet for LED. It thinks LED is the future of lighting.
In lighting Philips supplies both indoors and outdoors sectors. Indoors, it offers lighting
solutions for homes, shops, offices, schools, hotels, factories and hospitals. Outdoors, it offers
solutions for roads (street lighting and car lights) and for public spaces, residential areas and
sports arenas. In addition, it addresses the desire for light-inspired experiences through

9
architectural projects last but not least it also supplies specific applications of lighting in
specialized areas, such as horticulture and water purification.
The businesses where Philips lighting is acting are:
Light Sources & Electronics: LED, eco-halogen, (compact) fluorescent, high-
intensity discharge and incandescent light sources, plus electronic and
electromagnetic gear, modules and drivers
Consumer Luminaires: functional, decorative, lifestyle, scene-setting
luminaires
Professional Lighting Solutions: controls and luminaires for city beautification,
road lighting, sports lighting, office lighting, shop/hospitality lighting, industry
lighting
Automotive Lighting: car headlights, car signaling, interior
Lumileds: packaged LEDs.
Philips Lighting has manufacturing facilities in some 25 countries in all regions of the
world, and sales organizations in more than 60 countries. Commercial activities in other
countries are handled via distributors working with our International Sales organization.
Lighting has 50,200 employees worldwide.
And the priorities for lighting for 2013 are:
Lead the technological revolution in Lighting, be the thought-leader in LED, and win the ‘golden tail’ in conventional lighting.
Win in the professional market, developing and growing profitable solutions and services. Win in consumer markets and develop new ways to go to market. Use Accelerate! As its transformation and performance improvement platform throughout
the whole organization.

10
5.4. Innovation, Group & Services
Innovation, Group & Services comprises the activities of the Group headquarters,
including Philips’ global management as well as Group Innovation and New Venture
Integration and other departments and activities that are reported on this sector.
Innovation, Group & Services supports Idea to Market in five focal areas: Speeding up
time to market, Portfolio optimization, Driving breakthrough innovation, Improving innovation
competences, and Restoring the image of Philips as an innovation leader.
In total, Philips Group Innovation (PGI) employs 4,800 professionals around the globe.
PGI participates actively in working relationships with both academic and industrial partners as
The High Tech Campus in Eindhoven (Netherlands), the Philips Innovation Campus in
Bangalore (India), and Research Shanghai (China).
Philips group innovation is divided in different big and important departments, which
are the following ones:
1. Philips Research: it is the main partner of Philips’ operating sectors for technology-
enabled innovation. It creates new technologies and the related intellectual property
(IP), which enables Philips to grow in businesses and markets.
2. Philips Intellectual Property & Standards: it proactively pursues the creation of new intellectual property in close co-operation with Philips’ operating sectors and Philips Group Innovation. It has to be noted the importance of this department because of the value creation, Philips’ IP portfolio currently consists of around 59,000 patent rights, 35,000 trademarks, 81,000 design rights and 4,200 domain name registrations.
3. Philips innovation services: it is responsible for supporting third parties and internal
company. Innovation Services is playing an increasing role in the operating sectors’
digital transformation, supporting the move into internet and network
applications/services.
4. Philips innovation campus
5. New Venture Integration: it focuses on the integration of newly acquired companies
across all sectors.
6. Philips design: the Group Design team drives a global function and develops new
competences. Philips Design is widely recognized as a leader in people-centric design.
In 2012, it won over 120 key design awards in the areas of product, communication
and innovation design.
7. Philips Healthcare incubator: is a dedicated corporate venturing organization within
Philips. Its mission is to identify novel business opportunities based on the unmet
needs of patients and their care providers, and to transform these into successful
business ventures.

11
6. Group strategic focus
Philips is a technology company with a focus on people’s health and well-being. A number
of trends and challenges are influencing their business activities and portfolio choices.
Global trends and challenges-their market opportunities
Healthcare Growing and aging populations
Increase in patients managing chronic conditions
Growth geographies wealth creating demand
Lifestyle changes fueling cardiovascular illnesses and respiratory
and sleeping disorders.
Consumer lifestyle Consumer focus on health and well-being
Rising middle class in growth geographies
Back to basics: simple propositions
Trusted brands combined with locally relevant portfolio
Lighting Ongoing urbanization and globalization
Increasing need for energy-efficient solutions
Fast-growing global illumination market
Expanding renovation market
Rapid adoption of LED-based lighting solutions
7. Company structure
Koninklijke Philips Electronics N.V., a company organized under Dutch law (the ‘Company’),
is the parent company of Philips Group (‘Philips’ or the ‘Group’).
Philips’ activities in the field of health and well-being are organized on a sector basis, with
each operating sector: Healthcare, Consumer Lifestyle and Lighting; being responsible for the
management of its business worldwide.
The Innovation, Group & Services sector provides the operating sectors with support
through shared service centers. Furthermore, country management organization supports the
creation of value, connecting Philips with key stakeholders, especially our employees,
customers, government and society. The sector also includes pensions.
Also included under Innovation, Group & services are the activities through which Philips
invests in projects that are currently not part of the operating sectors, but which could lead to
additional organic growth or create value through future spin-offs.
12
8. Management
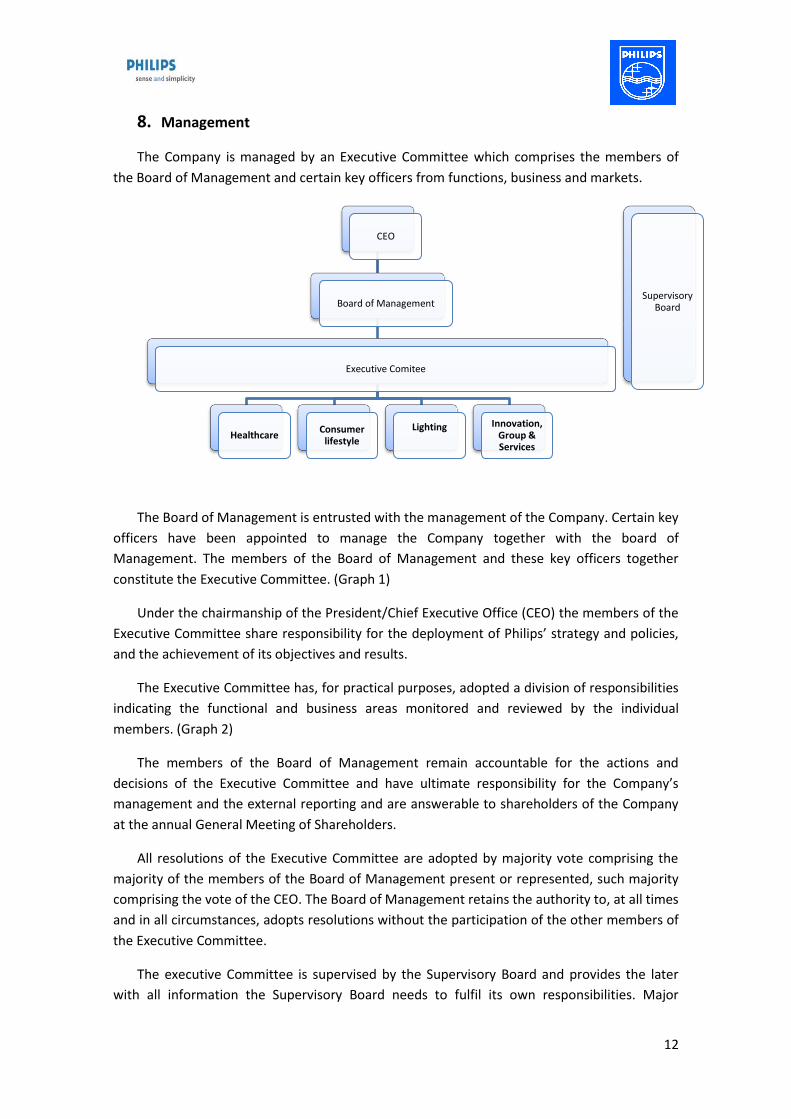
The Company is managed by an Executive Committee which comprises the members of
the Board of Management and certain key officers from functions, business and markets.
The Board of Management is entrusted with the management of the Company. Certain key
officers have been appointed to manage the Company together with the board of
Management. The members of the Board of Management and these key officers together
constitute the Executive Committee. (Graph 1)
Under the chairmanship of the President/Chief Executive Office (CEO) the members of the
Executive Committee share responsibility for the deployment of Philips’ strategy and policies,
and the achievement of its objectives and results.
The Executive Committee has, for practical purposes, adopted a division of responsibilities
indicating the functional and business areas monitored and reviewed by the individual
members. (Graph 2)
The members of the Board of Management remain accountable for the actions and
decisions of the Executive Committee and have ultimate responsibility for the Company’s
management and the external reporting and are answerable to shareholders of the Company
at the annual General Meeting of Shareholders.
All resolutions of the Executive Committee are adopted by majority vote comprising the
majority of the members of the Board of Management present or represented, such majority
comprising the vote of the CEO. The Board of Management retains the authority to, at all times
and in all circumstances, adopts resolutions without the participation of the other members of
the Executive Committee.
The executive Committee is supervised by the Supervisory Board and provides the later
with all information the Supervisory Board needs to fulfil its own responsibilities. Major
CEO
Board of Management
Executive Comitee
Healthcare Consumer
lifestyle
Lighting
Innovation, Group & Services
Supervisory Board

13
decisions of the Board of Management and Executive Committee require the approval of the
Supervisory Board.
These include decisions concerning:
a) The operational and financial objectives of the Company
b) The strategy designed to achieve the objectives
c) If necessary, the parameters to be applied in relation to the strategy
d) Corporate social responsibility issues that are relevant to the Company
Members of the Board of Management and the CEO are elected by the General
Meeting of Shareholders upon a binding recommendation drawn up by the Supervisory Board
after consultation with the CEO.
Members of the Board of Management and the CEO are appointed for a term of four
years, it being understood that this term expires at the end of the General meeting of
Shareholders.
The supervisory Board supervises the policies of the Board of Management and
Executive Committee and the general course of affairs of Philips and advises the executive
management thereon. The Supervisory Board, in the two-tier corporate structure under Dutch
law, is a separate body that is independent of the Board of Management.
We have noticed, that in the last years the compensations of the executive committee have
been increased, despite the negative trend that the company had in sales and its value on the
stock exchange. (Graph 3)
9. Philips evolution
9.1. Operating Revenue
(Graph 4)
As we can see on the graph, the operating revenue since 2003 until 2011 has a
negative trend. We thought it could be by the economical crisis that involves family
consumption and construction, both of them are very important sectors in our business.

14
9.2. Profits and losses (Net Income)
(Graph 5)
In this graph, we can see the losses of the company were important in 2002, 2008 and
2011. In 2002, the company has high losses because of its high inversion in high-tech firms.
The explosion of the dotcom bubble means high losses for the company.
In 2008, the global crisis dragged the sales of the company until its minimum. And lots
of stock of lifestyle consumer products had to be sold under price. In 2011, the high
competition with electronic firms of South-Korean made the firm lose a large market share
and divest the business of television because it did not come out profitable for the
company.
9.3. Stock exchange
(Graph 6)
The company increased its value for the duration of the dot com bubble in the fall but
the outbreak was very important. In the coming years its value substantially improved but
again the crisis of 2008 did much damage to the company. Recent years is struggling to
maintain its value in the stock market.
10. Holding
We can define a Holding as an economic organization that controls a number of companies
that guarantee control over the various market factors.
Form a Holding has great benefits in so far as it is able to control large segments of the
same market, which ensures that the companies that are part of Holding have access to raw
materials, logistics, transport, finance, etc.
We have done a Holding analyze of Philips Group. We’ve selected a sample of 22
companies which Philips has direct participation to understand easily how Philips works as
Holding. (Graph 6).
Also we have listed all the subsidiary firms. (Graph 6.2)
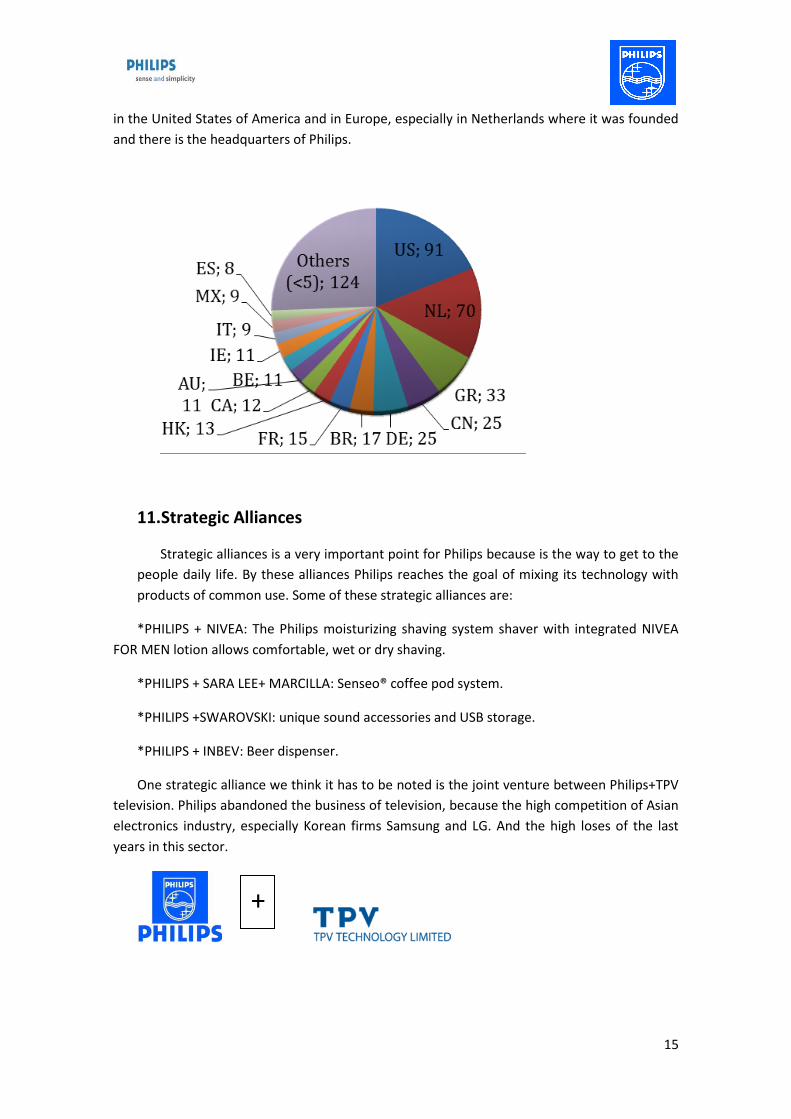
We have made a graph where we have distributed the subsidiary firms of Philips
Holding by countries. We can see very clear that the mainly business of the company is made
15
in the United States of America and in Europe, especially in Netherlands where it was founded
and there is the headquarters of Philips.
11. Strategic Alliances
Strategic alliances is a very important point for Philips because is the way to get to the
people daily life. By these alliances Philips reaches the goal of mixing its technology with
products of common use. Some of these strategic alliances are:
*PHILIPS + NIVEA: The Philips moisturizing shaving system shaver with integrated NIVEA
FOR MEN lotion allows comfortable, wet or dry shaving.
*PHILIPS + SARA LEE+ MARCILLA: Senseo® coffee pod system.
*PHILIPS +SWAROVSKI: unique sound accessories and USB storage.
*PHILIPS + INBEV: Beer dispenser.
One strategic alliance we think it has to be noted is the joint venture between Philips+TPV
television. Philips abandoned the business of television, because the high competition of Asian
electronics industry, especially Korean firms Samsung and LG. And the high loses of the last
years in this sector.
+

16
From this alliance we have to say that is a defensive strategy because Philips has
abandoned the television business but by the alliance it keeps in touch with all related with
electronics.
12. Shareholders
Shareholders are the owners of companies. A small business may have just one
shareholder, the founder, while a public company may have thousands of individual and
institutional shareholders, such as mutual fund companies, pension funds and hedge funds.
Shareholders play an important role in the financing, operations, governance and control
aspects of a business. So those are the reasons why we have analyzed Philips Shareholders.
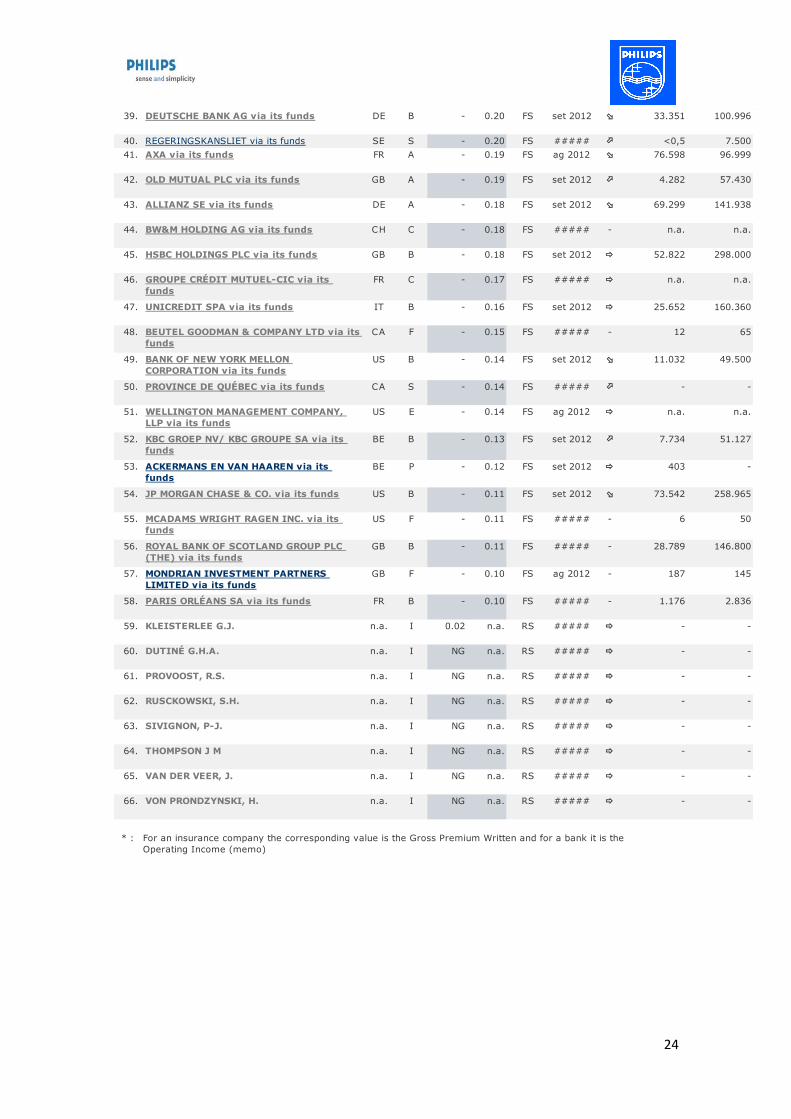
We have looked for the principal shareholders of Philips and we have realized that among the
5 most important shareholders 4 are investment funds and between the first fifteen
shareholders there are also three important banks, so we have seen that a fact that stands out
is that big and important companies are investing in Philips so we understand that Philips is a
safe company and at the same time a company with future. (Graph 7)
Principal shareholders
SOUTHEASTERN ASSET MANAGEMENT, INC via its funds
DODGE & COX via its funds
SELF OWNED
OTHERS

17
Dividends Payout: Proposed distribution
A proposal will be submitted to the 2012 Annual General Meeting of Shareholders to declare a
dividend of EUR 0.75 per common share, in cash or in shares at the option of the shareholder,
against the reserve retained earnings. Such dividend is expected to result in a distribution with
a total value of EUR 695 million.
13. Suppliers
In recent years, Philips has transformed its activities from Purchasing to Supply. Today, they
look beyond traditional ‘purchasing’ boundaries to the entire value chain. And they act as One
Philips, using standardized programs and tools that are aligned company-wide.
The ever more rapid pace of innovation means they also work closely with suppliers. T involve them early in product development to help us innovate quickly and to meet our customers’ expectations. Where possible they design in standard solutions to better capture value and reduce the lifetime costs of their products. To do this effectively, they constantly review their supply base and build strong relationships with strategic suppliers. Today’s electronics industry is characterized by an accelerating pace of innovation and greatly reduced product lead-times. This is reflected in the changing nature of Philips’ supply base and the relationships with their suppliers. A very high percentage of components and products is now purchased, rather than manufactured in-house. Overall, some 90 percent of our Bill of Materials comes from outsourcing, long-term partnerships, Original Equipment Manufacturers and Original Design Manufacturers.
14. Clients
We have to divide the clients between the different sectors we compete.
First of all, in the consumer lifestyle sector, our clients are the final consumers especially in
Europe and USA. But our company is growing in the developing countries, especially in China.
Secondly, the lighting sector, we have to divide our clients between particular consumers and
professional consumers. The last one, we have to remark the public sector where we provide
them the lighting to the streets and roads.
Finally, the healthcare sector, we provide medical machinery to public and private hospitals,
especially in Europe and USA.
15. Competitors
We have to divide the competitors between the different sectors our company have business. First of all, we have to remark in the consumer lifestyle sector: Procter and Gamble, Braun, Oral-B, Energizer, LG, Sony, Krups, Braun, Tefal, Conair, Babyliss, Delonghi and Kendwood.

18
Secondly, we can remark in the lighting sector, especially in the LED manufacturers: Nichia, Samsung LED, Osram, Opto Semiconductors, LG Innotek, Seoul Semiconductor, Cree, Sharp, TG, Everlight and also with General Electric and Siemens. Finally, in healthcare sector, we can remark: Johnson and Johnson, GE Healthcare, Medtronic, Baxter International, Cardinal Health, Tyco Healthcare, Siemens Medical Solutions, Boston Scientific, Stryker, B. Braun, Guidant Corp., 3M Healthcare, Zimmer Holdings.

19
16. Appendix
Graph 1. Executive Committee
Frans Van Houten President Chief Executive Officer (CEO) Chairman of the Board of Management since April 2011
Ron Wirahadiraksa Executive Vice President Chief Financial Officer (CFO) Member of the Board of Management since April 2011 Pieter Nota Executive Vice President Chief Executive Officer of Philips Consumer Lifestyle Member of the Board of Management since April 2011 Deborah DiSanzo Executive Vice President Chief Executive Officer of Philips Healthcare Eric Rondolat Executive Vice President Chief Executive Offcer Philips Lighting Jim Andrew Executive Vice President Chief Strategy and Innovation Officer Eric Coutinho Executive Vice President General Secretary & Chief Legal Officer Ronald de Jong Executive Vice President Chief Market Leader Patrick Kung Executive Vice President Chief Executive officer Philips Greater China Carole Wainaina Executive Vice President Chief Human Resources Officer

20
Graph 2. Organigrama
Graph 3. Key Executive Compensation
Name/Title 2008 EUR
2009 EUR
2010 EUR
2011 EUR
2012 EUR
Key Executive Compensation 1,510,686
1,672,611
1,544,354
5,375,705
7,301,335
Frans Van Van Houten President, Chief Executive Officer and Chairman of the Board of Management
- - - 1,904,771
3,374,868
Pieter Nota Member of Management Board, Executive Vice-President and Chief Executive Officer of Philips Consumer
- - - 834,099 1,906,702
Stephen H. Rusckowski Member of the Board of Management, Executive Vice President and Chief Executive Officer of Philips Healthcare
1,510,686
1,672,611
1,544,354
1,509,748
251,839
Ron H. Wirahadiraksa Member of the Board of Management, Executive Vice-President and Chief Financial Officer
- - - 1,127,087
1,767,926

21
Graph 4. Operating Revenue
Graph 5. Profits and Loses (Net Income)

22
Graph 6. Koninklijke Philips Electronics NV (PHG.AS) Stockexchange
Graph 7. Holding
FIRMS 100% 50%<x<100% 25%<X<50% x<25%
JOINT-
VENTURE
GLOBAL
INTEGRATION
EQUITY
METHOD 370 WEST TRIMBLE ROAD
CORPORATION x ADVANCE TRANSFORMER CO, S.A.
DE C.V. x ADVANCED TECHNOLOGY
LABORATORIES ARGENTINA S.A. x ALKRODE B.V. x CARDIAC EVALUATION SERVICES
INC x PHILIPS ELECTRONICS INDIA LTD. x ARGUS IMAGING B.V. x SAECO WEST LTD x PHILIPS AND NEUSOFT MEDICAL
SYSTEMS CO., LTD x RESPIRONICS, INC. x FÁBRICA AUSTRAL DE PRODUCTOS
ELÉCTRICOS S.A. x MEDIMETRICS GMBH x PHILIPS LIGHTING MASERU PTY.
LTD x PHILIPS MEDICAL CAPITAL GMBH x TP VISION HOLDING B.V. x SAPIENS STEERING BRAIN
STIMULATION GMBH x TRIXELL SAS x S H L TELEMEDICINE LTD x TENDRIS HOLDING B.V. x TP Vision x x PHILIPS BenQ DIGITAL STORAGE x x PHILIPS-OPTOGAN x x

23
Graph 7. Shareholders
SOUTHEASTERN ASSET MANAGEMENT,
INC via its funds
US - 7.79 FS n.a.
DODGE & COX via its funds US - 6.80 FS n.a.
SELF OWNED - 5.00 n.a. SE -
BLACKROCK, INC. US - 4.97 SE 10.100
FRANKLIN RESOURCES, INC. via its funds US - 3.06 FS 8.558
BPCE SA via its funds FR - 2.95 FS 117.381
GOVERNMENT OF NORWAY via its funds NO - 2.22 FS -
BLACKROCK, INC. via its funds US - 2.14 FS 10.100
SOCIÉTÉ GÉNÉRALE via its funds FR - 1.60 FS 159.000
BARCLAYS PLC GB - 1.28 SE 139.200
BNP PARIBAS via its funds FR - 1.24 FS n.a.
FMR LLC via its funds US - 1.19 FS 41.050
VANGUARD GROUP, INC. THE via its funds US - 1.01 FS n.a.
ING GROEP NV via its funds NL - 0.87 FS 84.718
SAS RUE LA BOETIE via its funds FR - 0.65 FS n.a.
ARTISAN PARTNERS HOLDINGS LP via its
funds
US - 0.54 FS 2
ONTARIO ASSOCIATION OF CHILDREN'S
AID SOCIETIES via its funds
CA - 0.50 FS - -
STICHTING PENSIOENFONDS ABP via its
funds
NL - 0.50 FS n.a.
DIMENSIONAL FUND ADVISORS LP via its
funds
US - 0.48 FS n.a.
AMERICAN CENTURY COMPANIES, INC. via
its funds
US - 0.47 FS n.a.
STATE STREET CORPORATION via its
funds
US - 0.45 FS 29.660
T. ROWE PRICE GROUP, INC via its funds US - 0.43 FS 5.372
F&C ASSET MANAGEMENT PLC via its
funds
GB - 0.39 FS 952
TEACHERS INSURANCE & ANNUITY
ASSOCIATION OF AMERICA via its funds
US - 0.36 FS n.a.
DEPRINCE, RACE AND ZOLLO INC via its
funds
US - 0.30 FS 21
UNION ASSET MANAGEMENT HOLDING AG
via its funds
DE - 0.29 FS 2.443
ASSENAGON SA via its funds LU - 0.28 FS n.a.
INVESCO LTD. via its funds BM - 0.28 FS n.a.
SGAM COVÉA (COMBINED) via its funds FR - 0.28 FS n.a.
SPARINVEST HOLDINGS SE via its funds DK - 0.28 FS 130
AMF FONDER AB via its funds SE - 0.27 FS - 14
DEKABANK DEUTSCHE GIROZENTRALE via
its funds
DE - 0.26 FS 3.957
UBS AG via its funds CH - 0.25 FS 62.628
SNS REAAL NV via its funds NL - 0.23 FS n.a.
BESSEMER GROUP, INCORPORATED, THE
via its funds
US - 0.22 FS 736
BANQUE DEGROOF SA via its funds BE - 0.21 FS 1.031
GOVERNMENT OF FRANCE via its funds FR - 0.21 FS -
CREDIT SUISSE GROUP AG via its funds CH - 0.20 FS 47.40038. B set 2012 16.850
36. B set 2012 302
37. S feb 2012 -
34. B ag 2012 1.736
35. B jul 2012 281
32. B set 2012 1.538
33. B set 2012 22.928
30. C ag 2012 83
31. E ##### 25
28. F set 2012 3.186
29. A ##### 14.353
26. B ag 2012 854
27. C ##### <0,5
24. A set 2012 9.063
25. C ##### 2
22. B set 2012 2.291
23. E set 2012 262
20. F set 2012 n.a.
21. B set 2012 7.337
18. A ##### 8.529
19. E set 2012 n.a.
16. F set 2012 <0,5
17. S ##### -
14. B set 2012 17.882
15. C set 2012 <0,5
12. F set 2012 5.995
13. E jul 2012 n.a.
10. B ##### 29.530
11. B ag 2012 48.555
8. F oct 2012 7.077
9. B set 2012 23.110
6. B set 2012 9.110
7. S ag 2012 -
4. F feb 2013 7.077
5. B set 2012 5.462
2. E ##### n.a.
3. H feb 2013 -
(mil EUR)*
1. E ##### n.a.
Total
(%)
Source
ident.
Date of
info.
Vari-
ation
Op.No of
Revenueemployees
Ownership Source Company information
Shareholder nameCoun-
tryType
Direct
(%)
24
DEUTSCHE BANK AG via its funds DE - 0.20 FS 100.996
REGERINGSKANSLIET via its funds SE - 0.20 FS 7.500
AXA via its funds FR - 0.19 FS 96.999
OLD MUTUAL PLC via its funds GB - 0.19 FS 57.430
ALLIANZ SE via its funds DE - 0.18 FS 141.938
BW&M HOLDING AG via its funds CH - 0.18 FS - n.a.
HSBC HOLDINGS PLC via its funds GB - 0.18 FS 298.000
GROUPE CRÉDIT MUTUEL-CIC via its
funds
FR - 0.17 FS n.a.
UNICREDIT SPA via its funds IT - 0.16 FS 160.360
BEUTEL GOODMAN & COMPANY LTD via its
funds
CA - 0.15 FS - 65
BANK OF NEW YORK MELLON
CORPORATION via its funds
US - 0.14 FS 49.500
PROVINCE DE QUÉBEC via its funds CA - 0.14 FS -
WELLINGTON MANAGEMENT COMPANY,
LLP via its funds
US - 0.14 FS n.a.
KBC GROEP NV/ KBC GROUPE SA via its
funds
BE - 0.13 FS 51.127
ACKERMANS EN VAN HAAREN via its
funds
BE - 0.12 FS -
JP MORGAN CHASE & CO. via its funds US - 0.11 FS 258.965
MCADAMS WRIGHT RAGEN INC. via its
funds
US - 0.11 FS - 50
ROYAL BANK OF SCOTLAND GROUP PLC
(THE) via its funds
GB - 0.11 FS - 146.800
MONDRIAN INVESTMENT PARTNERS
LIMITED via its funds
GB - 0.10 FS - 145
PARIS ORLÉANS SA via its funds FR - 0.10 FS - 2.836
KLEISTERLEE G.J. n.a. 0.02 n.a. RS -
DUTINÉ G.H.A. n.a. NG n.a. RS -
PROVOOST, R.S. n.a. NG n.a. RS -
RUSCKOWSKI, S.H. n.a. NG n.a. RS -
SIVIGNON, P-J. n.a. NG n.a. RS -
THOMPSON J M n.a. NG n.a. RS -
VAN DER VEER, J. n.a. NG n.a. RS -
VON PRONDZYNSKI, H. n.a. NG n.a. RS -
* :
66. I ##### -
For an insurance company the corresponding value is the Gross Premium Written and for a bank it is the
Operating Income (memo)
64. I ##### -
65. I ##### -
62. I ##### -
63. I ##### -
60. I ##### -
61. I ##### -
58. B ##### 1.176
59. I ##### -
56. B ##### 28.789
57. F ag 2012 187
54. B set 2012 73.542
55. F ##### 6
52. B set 2012 7.734
53. P set 2012 403
50. S ##### -
51. E ag 2012 n.a.
48. F ##### 12
49. B set 2012 11.032
46. C ##### n.a.
47. B set 2012 25.652
44. C ##### n.a.
45. B set 2012 52.822
42. A set 2012 4.282
43. A set 2012 69.299
40. S ##### <0,5
41. A ag 2012 76.598
39. B set 2012 33.351

25
RISK ANALYSIS

26
INDEX
17. Introduction………………………………………………………………………………………………………. 26
18. Analyse of Philips Stock exchange …………………………………………………………………….. 26
19. Philips Financial risk .…………………………………………………………………………………………. 29
20. Short term risk ..........………………………………………………………………………………………… 29
21. Long term risk ....... ……………………………………………………………………………………………. 31
22. Currency risk ………………………………………………….………………………………………………….. 32
23. Interest rate risk…………………………………………………………………………………….…………… 32
24. Appendix……………………………………………………………………………………………………………..34

27
17. Introduction
In this text we are going to analyse two main things, the analysis of Philips stock
exchange and its financial risk.
18. Analysis of Philips Stock Exchange
Table 1: Statistic analysis Roy.Philips and Eurostoxx50 (2008-2013)
From the table above, we think it is necessary to explain principally three points: the
first one is the Mean and Standard deviation meaning and their respective variances in %,
secondly the variation coefficient and finally the Beta. In all these points we will focus our
attention in Philips values, but at same time we will related it with some aspects of the
STOXX50E.
When we talk about the mean of Philips or the general stock exchange we are
referring to the characteristic value of a series of quantitative data under study on the
principle of the mathematical expectation or expected value. In our case the mean is 17.51 for
Philips and 2664 for STOXX50E. But in order to compare both values, we have to take into
account the var%. Because it is a measure without units, how much has changed the value
every day respect the day before. Because of that we can compare the Roy. Philips stock with
the index Eurostoxx50. We can say, that in average, on the last five years (2008-2013), we have
a var% of 0,029 in Philips stock and a var% of -0,015. It means that in average if we invest in
one day, we could have a gain of 0.029 investing in Roy.Philips stock, and a loss of 0,015 if we
invest in the index.
The standard deviation is a statistic measure of dispersion, which indicates how much
you can get away from the average values (mean), in addition desvest will show us the range
of prices between the asset can move. This is a very important factor for the investors. As we
will also see with Beta value onwards, standard deviation is a measure of volatility.
The term of the variance measures the specific risk of a title or share, depending on
the specific characteristics of the issuer: types of production activity, competition
management, expansion plans, financial solvency, etc. So we can see there is not a lot of risk in
a Philips’ share, which is going to mean that Philips could be a good investment, just 2,9% of
variance.

28
Then, the variation coefficient is the relation between the desvest and the mean, in
our case is equal to 0.22 in Philips and 0.14 in STOXX50E. The coefficient of variation is a
measure of relative dispersion very interesting, as it allows us to compare the
representativeness of two arithmetic means any frequency distributions, although expressed
in different units come, in our case comparing the importance or incidence of Philips and
STOXX50E mean. When we add the stocks in the index STOXX50, we reduce the dispersion
respect the mean.
The Beta coefficient (β) is a measure of the volatility of an asset (a stock or a value) on
the variability of the market, so that higher values denote more volatility and Beta Beta 1.0 is
equivalent to the market. The difference between Beta value and standard deviation
commented before is, that the Desvest, shows as the volatility of a Philips share regarding
itself, on the other hand Beta value shows the volatility of the asset regarding the EUROSTOXX
50.
The daily variation mean, is the gain or loss we could make in mean investing in our
studied company in a single day. We can see that we could have a gain of 0,029 in Philips and a
loss of 0,015 investing in the Eurostoxx50.
The annual variation mean is a mathematical calculus, the hypothetical gain or loss
that we can make if the 365 days of the year we make a gain, in our case of 0,029, having a
final gain of 11,1% in a year.
The semi-variance negative means that we have a proportion of 52,4% of days to have a
loss investing in our stock, and this loss would have a mean of 1,49. Our stock has a higher
semi-variance negative than the index. It means that the red days investing in Philips are
higher and the loss that we could make also is higher.
The difference between the Beta (β) of a stock or a value and 1.0 are expressed in
percentage of volatility. A Beta value '1.75 is 75% more volatile than the market. Similarly, a
0.7 Beta value would be 30% less volatile than the market. Our Beta is 0.943 or 94.3% what
means that we are 5.7% less volatile than the market. How it has to be interpreted this result?
We know that volatility is a measure of the frequency and intensity of changes in the price of
an asset, so being more or less equal to the volatility of the market is a good thing in terms of
security and stability of Philips’ stockexchange value. If this type of value is smaller than 1 can
be call as defensive or little volatile.
29
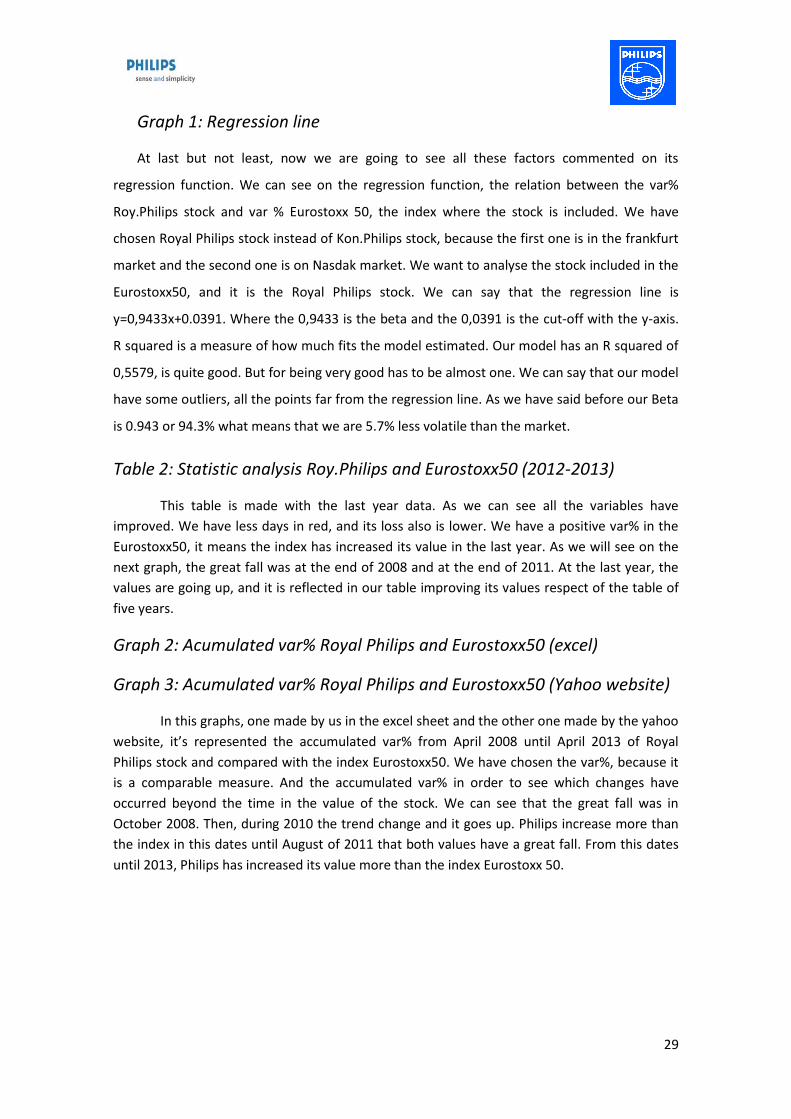
Graph 1: Regression line
At last but not least, now we are going to see all these factors commented on its
regression function. We can see on the regression function, the relation between the var%
Roy.Philips stock and var % Eurostoxx 50, the index where the stock is included. We have
chosen Royal Philips stock instead of Kon.Philips stock, because the first one is in the frankfurt
market and the second one is on Nasdak market. We want to analyse the stock included in the
Eurostoxx50, and it is the Royal Philips stock. We can say that the regression line is
y=0,9433x+0.0391. Where the 0,9433 is the beta and the 0,0391 is the cut-off with the y-axis.
R squared is a measure of how much fits the model estimated. Our model has an R squared of
0,5579, is quite good. But for being very good has to be almost one. We can say that our model
have some outliers, all the points far from the regression line. As we have said before our Beta
is 0.943 or 94.3% what means that we are 5.7% less volatile than the market.
Table 2: Statistic analysis Roy.Philips and Eurostoxx50 (2012-2013)
This table is made with the last year data. As we can see all the variables have
improved. We have less days in red, and its loss also is lower. We have a positive var% in the
Eurostoxx50, it means the index has increased its value in the last year. As we will see on the
next graph, the great fall was at the end of 2008 and at the end of 2011. At the last year, the
values are going up, and it is reflected in our table improving its values respect of the table of
five years.
Graph 2: Acumulated var% Royal Philips and Eurostoxx50 (excel)
Graph 3: Acumulated var% Royal Philips and Eurostoxx50 (Yahoo website)
In this graphs, one made by us in the excel sheet and the other one made by the yahoo
website, it’s represented the accumulated var% from April 2008 until April 2013 of Royal
Philips stock and compared with the index Eurostoxx50. We have chosen the var%, because it
is a comparable measure. And the accumulated var% in order to see which changes have
occurred beyond the time in the value of the stock. We can see that the great fall was in
October 2008. Then, during 2010 the trend change and it goes up. Philips increase more than
the index in this dates until August of 2011 that both values have a great fall. From this dates
until 2013, Philips has increased its value more than the index Eurostoxx 50.

30
Graph 4: Moving average 50,100,200 days Royal Philips (excel)
Graph 4: Moving average 50,100,200 days Royal Philips (Yahoo website)
In this graphs, one made by us in the excel sheet and the other one made by the yahoo
website. We can see the value of the Royal Philips stock in the closed value beyond time
(2008-2013) and its moving average of 50 days, 100 days and 200 days. We have made this
graph to know the tendencies in the value of the stock. When the moving average meets, it
means that the trend will change, like in our case in april of 2012. And when moving averages
are parallel the trend will continue in this value, like in January of 2010, the trend continue
positive. When the moving average separates its value means the trend has more power, like
in July of 2011, when the negative trend has more power. Nowadays, we can see a positive
trend with the three moving average parallel, then we don’t expect a change of the positive
trend in the short time.
19. Philips financial risk
As the big firm Philips is, it is everyday expose to several different financial risks which we
have to take in very account. Some of these risks are the following ones: liquidity risk, currency
risk, interest rate risk, commodity price risk, credit risk, country risk and other insurable risks.
Sometimes we think in a firm just as sales, net income, looses, earnings and assets and
liabilities, but the real fact is that a company is quite more complex, and financial risk are key
factors for the correct development specially for international firms as Philips, because for
example a currency risk or a credit risk can mean a threat for all Philips economy concretely its
self-financing. So now we are going to analyse four of these financial risks which we think are
the most relevant in Philips’ case.
20. Short term risk
Table 3: Short term ratios
Looking to the table we can see many important points or aspects to be highlighted
about Philips in its short term risk.
The first point we want to analyse is the working capital (solvency); the working capital
is an economic measure that represents the operating liquidity of a firm, in other words the
relation between current assets and current liabilities which in our case is positive so it is a
good thing because it means that we can pay all our debts in the short term and also have
some leeway for contingencies.

31
The second point that we will analyse is the solvency ratio, which we divided into three
different levels, the first is the more general concept of this ratio and relates in tan per 1 the
proportionality between current assets and current liabilities, and we can see that is bigger
than 1 which as in the working capital it means we can afford our short term debts. From our
point of view it also has to be noted that currents assets are composed by cash, inventories
and receivables that is the reason why we have done 3 different studies for solvency ratio, to
look for the incidence or importance of each account (cash, receivables and inventories). If we
take out inventories from our solvency ratio we will see how our ratio goes below 1 what is not
the best thing because it means we depend on inventories to have a positive ratio of solvency
(as it can happen in many firms) but it would be interesting to have a solvency ratio bigger
than one even after taking out the inventories. From the last study we can conclude that our
cash represent the equivalent of 45% of our current liabilities.
The second part of the table looks for the cash-cycle, which is the relation between
when we get the cash and when we make our payments. Our cash-cycle is negative, is about a
“-0,13” what means that we pay before we get the cash. This negative result could be a
problem because as it is logical is better having the cash before you have to make your
payments cause that can prevent any kind of problem or setback, nevertheless “-0.13” is a
small value that has not much incidence in the working of our firm.
The cash-cycle has a direct relation with solvency ratio as we will see in the next graph.
Graph 5: Solvency vs. Liquidity
In the graph we are able to see the representation of the results obtained on the
previous table. In 2012, we are situated on zone C which means positive solvency and negative
Cash-cycle. The ideal point for every firm would be being situated in zone A, but it is quite
difficult to reach that level, and we also have to be conscientious that Philips is a manufacturer
firm that as most companies in the same sector would be in zone C given the fact that is very
difficult on this kind of industry to have a positive cash-cycle.
We can see on the graph, that until this last year, Philips was a firm with a high
liquidity and solvency too, this means we are in the A zone from 2008 until 2011. This last year
we have reduced our liquidity. The cash cycle is negative, but almost zero. It means that we
have to pay to our suppliers at the same time our clients pay us. We have lost the advantage of
a positive cash cycle, that it involves we can finance the payments to our suppliers with the

32
cash paid by our clients. It was a very good situation, because it is a way to finance without any
kind of interest and without increase our debt with banks or bondholders.
As possible managers of Philips we would have to look for some solutions to reach a
point in zone A, but maintaining our solvency ratio in the same level or above.
So the point would be divided on two different options: reducing the cash-cycle or
getting a larger payment-cycle.
21. Long term risk
Table 4: Long term ratios
As we did with the short term risks table, now we are going to analyse the Ratios long term
table results.
The first thing is the leverage ratio, which is any ratio used to calculate the financial leverage of
a company to get an idea of the company's methods of financing or to measure its ability to
meet financial obligations. There are several different ratios, but the main factors looked at
include debt, equity, assets and interest expenses, on this case we have taken into account
assets and equities. Our result is 2,60 what means that our assets represents 2,60 of our total
equities which in a quick view would represents the capacity of the firm for getting greater
earnings. We can see in the graph of leverage ratio how has increased this ratio from 2,05 in
2008 until 2,60 of 2012. It means that in the period studied every year our liabilities have been
increasing due to equities are lower respect the total assets of the company. A higher part of
the assets have been financed by debt.
Next point is ROE (returns on equity) that indicates how much the shareholders earned on
their investment in the company. A higher percentage would be better. On our case the ROE is
2%. This result would be used by the investors to compare different companies of the same
sector.
Third step is Margin Ratio; this ratio shows us the percentage of net income related to our
sales income which is about a 1%.
And the last point I want to emphasize is the turnover ratio, which refers to the amount of
sales over total assets. A high proportion of turnover is a sign that the company is the
production and sale of its products or services very quickly.
33
22. Currency risk
Currency risk is the risk that the fair value or future cash flows of a financial instrument
will fluctuate because of changes in foreign exchange rates.
This kind of risk could impact Philips’ financial results. Given the fact that Philips exports into
lots of countries and it also import from them, is constantly in touch with the currency risk.
Exemplary the total net fair value of hedges related to transaction exposure as of December31,
2012 was an unrealized asset of EUR 25 million.
Philips’ policy generally requires committed foreign currency exposures to be fully
hedge using forwards.
So Philips’ basic tools to hedge its position against currency risk are options, forwards
or combination thereof. It has to be commented that as we all know hedging activities won’t
eliminate all currency risk; due to constant currency changes Philips average hedges of
currency risk is 18 months.
Finally, we think it is important to say that Philips does not currently hedge the foreign
exchange exposure arising from equity interests in non-functional currency investments in
associates and available for sale financial assets.
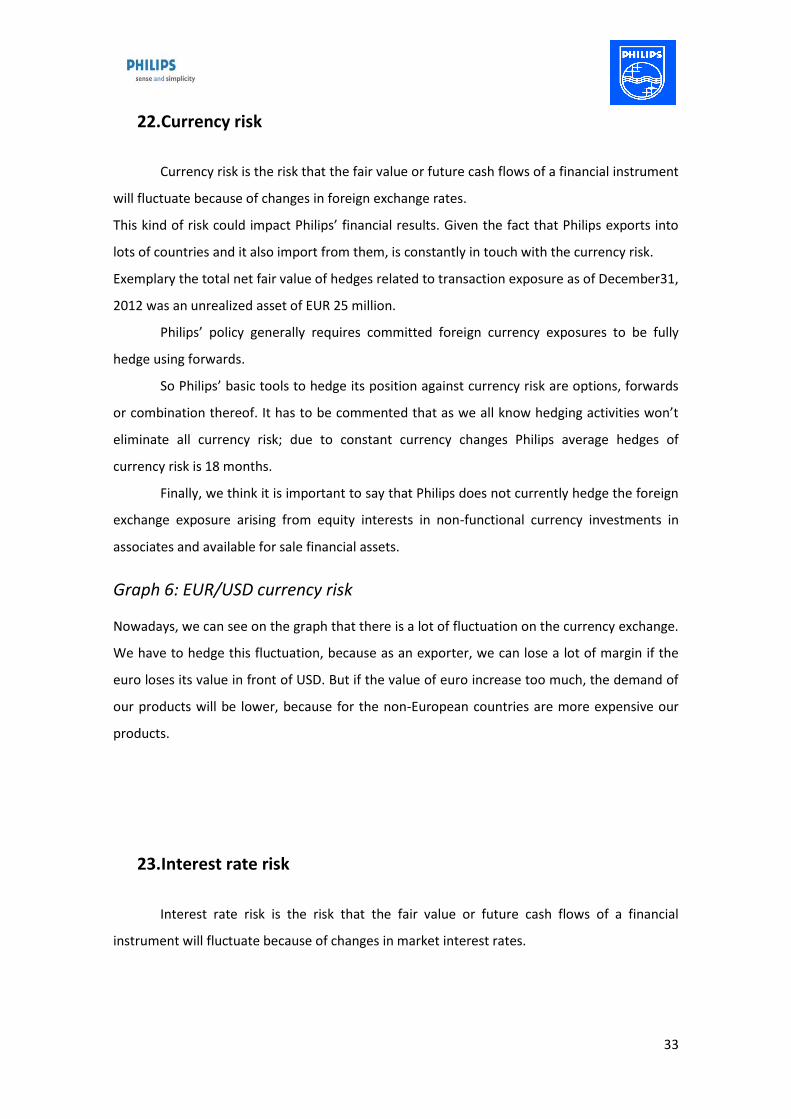
Graph 6: EUR/USD currency risk
Nowadays, we can see on the graph that there is a lot of fluctuation on the currency exchange.
We have to hedge this fluctuation, because as an exporter, we can lose a lot of margin if the
euro loses its value in front of USD. But if the value of euro increase too much, the demand of
our products will be lower, because for the non-European countries are more expensive our
products.
23. Interest rate risk
Interest rate risk is the risk that the fair value or future cash flows of a financial
instrument will fluctuate because of changes in market interest rates.

34
Philips had a big outstanding debt so interest rates are very important given the fact of interest
payments, what could have a very negatively impact in Philips financial results. So for Philips it
is very important to hedge this risk.
Graph 7: Interest rate risk
We can see a negative trend in the interest rate in the last five years. It’s good for us,
because our debt will be cheaper. But we don’t know how much time it will remain constant or
decreasing. Because there are some pressures from Germany, in order to increase the interest
rate of Europe to reduce its inflation. It could be very dangerous to our firm, because of our
exposure to debt.
Just as an example, an increase or decrease of a 1% in interest long-term rate, could
affect the fair value of long-term debt which could change positively or negatively more or less
about the huge quantity of EUR 422 million.
So, we are able to see the big importance of hedging interest rates, because they can be a
trouble in long term risk in addition in short term risk.

35
24. Appendix
Table 1: Statistic analysis Roy.Philips and Eurostoxx50 (2008-2013)
Graph 1: Regression line
ROY.PHILIPS ELECTR (PHIA.AS) STOXX50EClose var% Close var%
MEAN 17,51 0,029 MEAN 2664,00 -0,015
DESVEST 3,84 2,238 DESVEST 368,13 1,806
INTERVAL 66 % 21,36 2,267 INTERVAL 66% 3032,13 1,792
13,67 -2,209 2295,87 -1,821
INTERVAL 95% 25,20 4,505 INTERVAL 95% 3400,26 3,598
9,83 -4,447 1927,75 -3,628
MAX 25,07 12,523 MAX 3882,28 11,002
MIN 9,76 -11,506 MIN 1809,98 -7,880
RANK 15,31 24,029 RANK 2072,30 18,882
Variation Coef. 0,22 77,651 Variation Coef. 0,14 122,272
Daily Variation mean 0,029% Daily Variation mean -0,015%
Annual variation mean 0,111 Annual variation mean -0,053
Semivariance negative 0,524 Semivariance negative 0,511
Semivariance negative mean -1,498 Semivariance negative mean -1,258
Beta 0,943 y = 0,9433x + 0,0391 R² = 0,5579
DATA FROM April-2008 UNTIL April-2013

36
Table 2: Statistic analysis Roy.Philips and Eurostoxx50 (2012-2013)
Graph 2: Acumulated var% Royal Philips and Eurostoxx50 (excel)
ROY.PHILIPS ELECTR (PHIA.AS) STOXX50EClose var% Close var%
MEAN 18,99 0,192 MEAN 2442,21 0,071
DESVEST 2,86 1,452 DESVEST 200,12 1,402
INTERVAL 66 % 21,85 1,644 INTERVAL 66% 2642,33 1,473
16,13 -1,260 2242,09 -1,331
INTERVAL 95% 24,72 3,096 INTERVAL 95% 2842,45 2,875
13,26 -2,712 2041,97 -2,734
MAX 23,67 5,734 MAX 2749,27 4,964
MIN 13,73 -5,242 MIN 2068,66 -3,067
RANK 9,94 10,976 RANK 680,61 8,031
Variation Coef. 0,15 7,553 Variation Coef. 0,08 -19,798
Daily Variation mean 0,192% Daily Variation mean 0,071%
Annual variation mean 1,016 Annual variation mean 0,295
Semivariance negative 0,487 Semivariance negative 0,480
Semivariance negative mean -0,908 Semivariance negative mean -1,009
Beta 0,585 y = 0,5852x + 0,186 R² = 0,3227
DATA FROM 20-4-2012 UNTIL 19-4-2013

37
Graph 3: Acumulated var% Royal Philips and Eurostoxx50 (Yahoo website)
Graph 4: Moving average 50,100,200 days Royal Philips (excel)
Graph 4: Moving average 50,100,200 days Royal Philips (Yahoo website)
0
5
10
15
20
25
30
24/04/2008 24/04/2009 24/04/2010 24/04/2011 24/04/2012
Royal Philips stock value Moving Average 50 Moving Average 100 Moving Average 200

38
Table 3: Short term ratios
Graph 5: Solvency vs. Liquidity
Short term risk
Working Capital (solvency) Current assets-current liabilities 2573,00
Solvency Ratio Current Assets/current liabilities 1,26
(Current Assets-Inventories)/Current Liabilities 0,91
Àcid test (Current Assets-Receivables-Inventories)/Current Liabilities 0,45
Average Period of cash(APC) (Receivables/Sales)*365 67,51
Average Period of payment(APP) (Payables/Purchases)*365 67,38
Average Period of producton(APPr) (Inventories/Cost of production)*365 82,95
Cash cycle(Liquidity) Average period of payment-Average period of income -0,13

39
Table 4: Long term ratios
Ratios Long term
Leverage Ratio 2,60 Assets 29079
Equities 11174
ROE 0,02 Net Income 231
Return on equities Equities 11174
Margin ratio 0,01 Net Income 231
Sales 24788
Turnover ratio 0,85 Sales 24788
Assets 29079
1+(Liabilities/Equities) 2,60 Assets 29079
Equities 11174
0,00
0,50
1,00
1,50
2,00
2,50
3,00
2008 2009 2010 2011 2012
Leverage Ratio
Leverage Ratio

40
Graph 6: EUR/USD currency risk
Graph 7: Interest rate risk

41
PROFITABILITY ANALYSIS

42
INDEX THIR PART
25. Roe relations………………………………………………………………………………………………………42
26. Economical vs Financial profitability and cost of capital (K)……………………………….. 44
27. Debt impact …………..…………………………………………………………………………………………. 47
28. Value added …...........………………………………………………………………………………………… 49
29. Modigliani &Miller ...…………………………………………………………………………………………. 50
30. Short term risk vs profitability ……………………….………………………………………………….. 54
31. Growth and PER…………………………………………………………………………………….…………… 55
43
PHILIPS’ PROFITABILITY
25. ROE RELATIONS
When we think in investing in a firm, we have to take into account aspects like firm’s
risk, in which industry is it working, but the most important point when deciding in which firm
you will invest is profitability. It has different tools to analyze it.
In this third and last part of the work our objectives is to explain in the clearly and
most summarized way how profitability works and specifically how it works in our firm,
PHILIPS.
As we all know, Roe means Return on Equity, and it is a measure of profitability, to be
more accurate it represents firm’s financial profitability. ROE shows how the firm uses
investments funds to growth and at same time measures which is the return for each euro
invested into the firm.
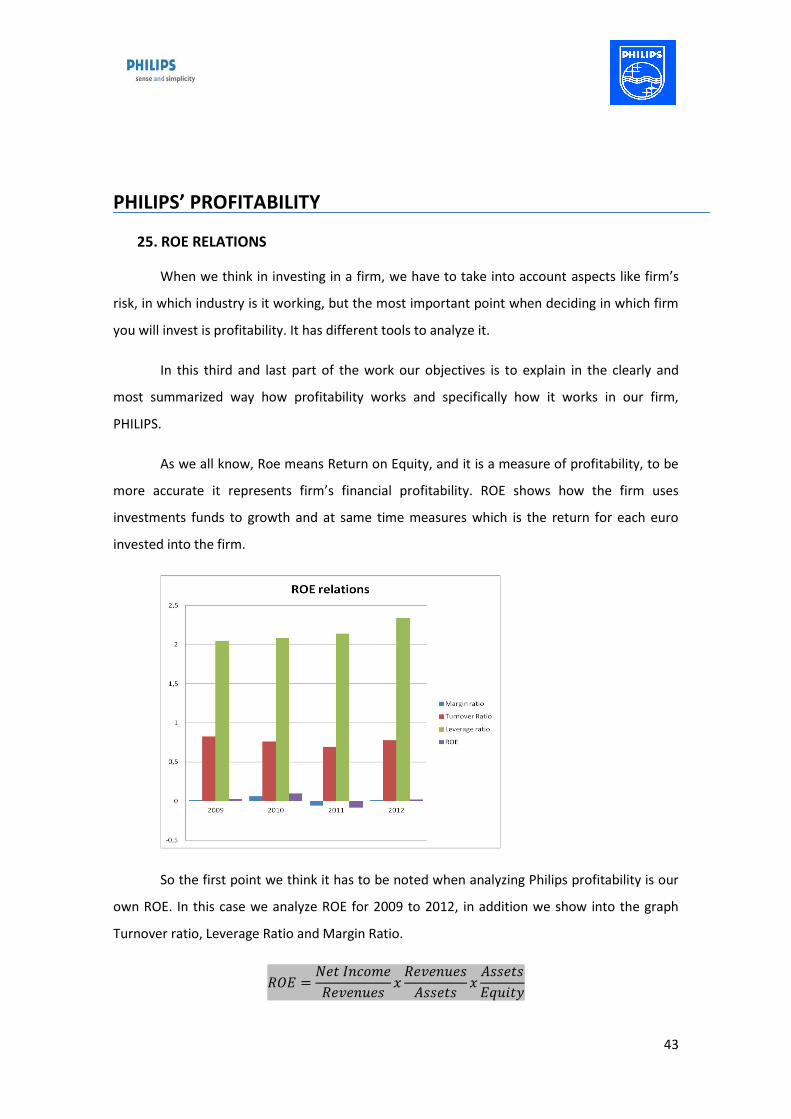
So the first point we think it has to be noted when analyzing Philips profitability is our
own ROE. In this case we analyze ROE for 2009 to 2012, in addition we show into the graph
Turnover ratio, Leverage Ratio and Margin Ratio.
44
The first relation is Margin ratio, the second one the turnover and the third one
Leverage ratio.
If we continue with the graph analysis, it has to be commented that 2011 has a
negative ROE and that is because of the negative margin ratio, which allows us to conclude
that margin ratio has a great influence in ROE final result. Many times we can think that a ROE
result is enough to take a conclusion about company’s profitability but it is not, because to get
an idea of how well is our ROE it would be very useful to compare it with other firms.
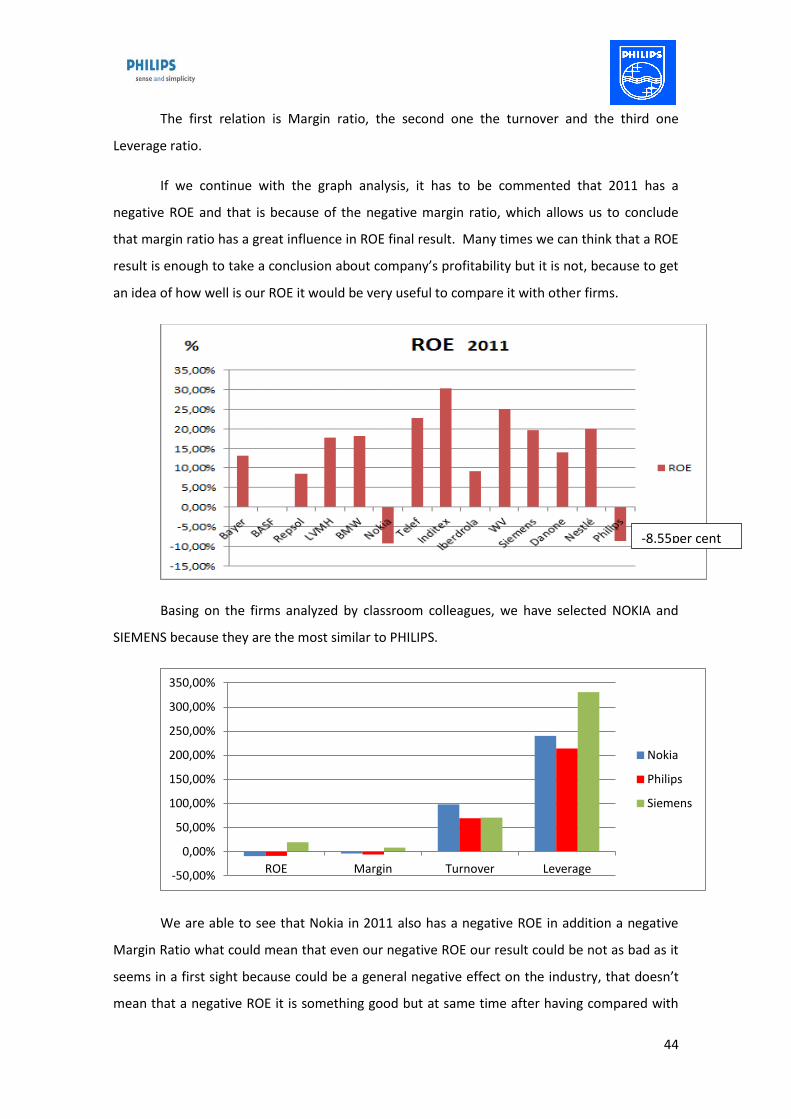
Basing on the firms analyzed by classroom colleagues, we have selected NOKIA and
SIEMENS because they are the most similar to PHILIPS.
We are able to see that Nokia in 2011 also has a negative ROE in addition a negative
Margin Ratio what could mean that even our negative ROE our result could be not as bad as it
seems in a first sight because could be a general negative effect on the industry, that doesn’t
mean that a negative ROE it is something good but at same time after having compared with
-50,00%
0,00%
50,00%
100,00%
150,00%
200,00%
250,00%
300,00%
350,00%
ROE Margin Turnover Leverage
Nokia
Philips
Siemens
-8.55per cent

45
Nokia is not as bad as we thought. But then looking to SIEMENES we see it has a positive ROE
and that means that probably is not an industry problem but it is something deeper.
By analyzing profitability in a wide range, we will be able to understand more this
negative ROE.
26. ECONOMICAL VS FINANCIAL PROFITABILITY, AND COST OF CAPITAL (K)
When analyzing profitability there are also some very important points that have to be
taken into account, these factors are ROA (Return On Assets), ROE bt (before taxes), K (cost of
capital), J (banks sensitivity to lend money to firms due to their debt ratio), among others.
ROA it is as well as ROE a very good indicator of profitability, and also has to be in
every investor’s mind. ROA is return on assets, in other words, how much profitable is a firm
related to its assets. It indicates the economical profitability of the firm. The most important
difference between ROA and ROE is that the first one doesn’t take into account the
indebtedness of the company.
We think it also has to be highlighted the concept ROE before taxes, by doing that we
will be able to see which is the incidence of taxes in our net income results.
The results obtained for Philips ROA and ROEbt are the following ones, with now we
are going to study.
2009 2010 2011 2012
ROE bt
EBTt/Equities t-1 0,028730 0,133 -0,03372 0,06328
ROA EBIT t/Assets t-1 2,63%
7,50% -0,49% 3,92%
Directly related with ROE showed at the beginning in this ROEbt and ROA table, we
also have negative values for 2011 that is because the firm had losses that year, so both EBIT t

46
and EBT t were below zero. 2011 is a very interesting year to analyze cause if we take into
account the generally positive trend of Philips it is at least surprising these negative values,
from profitability side they have lots of things to be studied in a deeper way.
In order to continue with profitability analysis, we have compared ROA and ROE bt
from 2009 to 2012, by doing that we want to understand if it is ROE more important than ROA
when talking in profitability terms or is the inverse or both have they own particularities. To
see this comparison we have made the following graph:
It has to be said we are not 100 per cent sure that this is a very useful table, but we
think that we have to complement all theory methods with some personal ideas that from our
opinion could be interesting for anyone that wants to invest in Philips.
So, we have highlighted two points we think could be quite interesting to talk about,
the first one is year 2011; from the beginning and until the end of this third part we are going
to see negative values for 2011 and also the reasons of why it is like that. The advantage of
looking in different profitability tools is that at the end we are able to compare and mix it,
what means we can have a great idea why negative numbers are negative and why the
positives ones are positive. The second point is 2010, ROE bt is higher than ROA which for our
point of view means that firm would have to lever up, but as we are going to see in a brief, it is
just not as easy as it seems. We have to introduce the “K”, cost of capital or cost of debt, why?
Because sometimes ROE bt will be telling you as a manager of a firm that you should lever up
with the aim of increasing your returns, but you mustn’t forget that ROE bt just no included
ROEbt<ROA
ROEbt > ROA

47
this K, so even it could clearly seem that we have to answer to a positive ROE bt higher than
ROA in a particular way, things go further than that. As we will see now, K concept is very
important in ROA too.
To study K parameter we have constructed the following table, or what is the same,
we have calculated this cost of debt between 2009 and 2012.
These are the results we have obtained for Philip’s cost of capital. There are different
ways to calculate this cost of capital, two options are the ones showed in the table, and
another one is:
It has to be noted that not all firms will have the same cost of debt, and this is a very
important aspect because some firms won’t be able to increase their profitability in ROA terms
even in ROE because they cost of capital would be so higher to lever up, so they growth will be
stopped. In Philips case and compared with other firms of EUROSTOXX50 we are very well
situated in terms of K given the fact it is quite low and it allows us to lever up ourselves. As we
have said before, K is very close to ROA concept, why? Because ROA is the returns on assets
that we obtain for every 1€ invested and in lots of cases a great amount of this total assets are
financed by leverage. So it would be very important to have always a ROA higher than the cost
of debt. To see Philips case, we have done this graph:
2009 2010 2011 2012
K euribor + premium risk 0,02396274 0,02109173 0,020492519 0,02123424
Interest/Liabilities t-1 0,02396274 0,02109173 0,020492519 0,02123424

48
Before, we said we were going to see more reasons of why 2011 ROE was negative, so
here we can see another cause that is a K higher than the ROA, so: Why a higher K means can
mean a negative ROE? Because ROEbt it is a function of both ROA and K, so in case of a
negative ROEbt, ROE would be negative too due to the fact that we have not taken into
account taxes that will minimize our results.
The function of “f ROEbt (ROA, K) is:
27. DEBT IMPACT
Another interesting point or comparison we think could be interesting to comment is
the difference between ROE and ROE before taxes. From our opinion by doing that we would
be able to see the debt impact that Philips suffers every year, so the importance of the
indebtedness of the firm. . In addition debt impact is also directly related with cost of capital
(K). After comparing results from 2009 to 2012 we have obtained the following results.
2009 2010 2011 2012
ROE Net Income t/Equity t-1 2,72% 9,89% -8,55% 1,86%
ROA EBIT t/Assets t-1 2,63% 7,50% -0,49% 3,92%
DEBT IMPACT ROE-ROA 0,09% 2,39% -8,07% -2,06%
• ROA > K

49
And the following graph:
Looking to the graph we can see the positive effect in 2009 and 2010, in 2011 we can
see a big negative impact (another of the reasons of the negative results and ROE for this
year). Finally in 2012 even the negative impact, we can conclude that firm is still recovering
from 2011, so Philips is coming back to good situation.
In order to understand or know a little more of Philips' profitability we have calculated
“J”, in other words, sensitivity of banks on lending money to Philips, which it is very important
because it has a big influence on debt ratio, leverage ratio and cost of capital. As we have seen
before with K formula, sensitivity of banks (J) is very related to debt ratio (liabilities/equities),
and also will determine the value of K. As J there are other factors than can change (increase
or decrease) K's value. In the next graph we see the roles that play these different factors.
Remember than K can be calculated by euribor and J or euribor and premium risk.
-10,00%
-8,00%
-6,00%
-4,00%
-2,00%
0,00%
2,00%
4,00%
2009 2010 2011 2012
debt impact ROE-ROA
debt impact ROE-ROA
50
Philips K values are really good because comparing with other firms of EUROSTOXX50
debt could be quite more expensive, but on our case, given the fact that good decisions were
taken respect debt, K can be a positive factor to play with, in addition what it is important too
is that K value is more or less always constant what means Philips' managers are really good
negotiators. The difference between K and euribor is equal to the premium risk, which on 2011
is really close to zero. It is interesting to see euribor’s evolution, how in 2009 is more or less
1.25%, in 2011 is almost 2% and just one year later in 2012 is approximately 0.5%. Why it is
interesting to see this evolution? Simply because it can be another reason of 2011 results of all
firms, what is the same that, in 2011 the economic situation had another little fall and
European Central Bank realized of this fact.
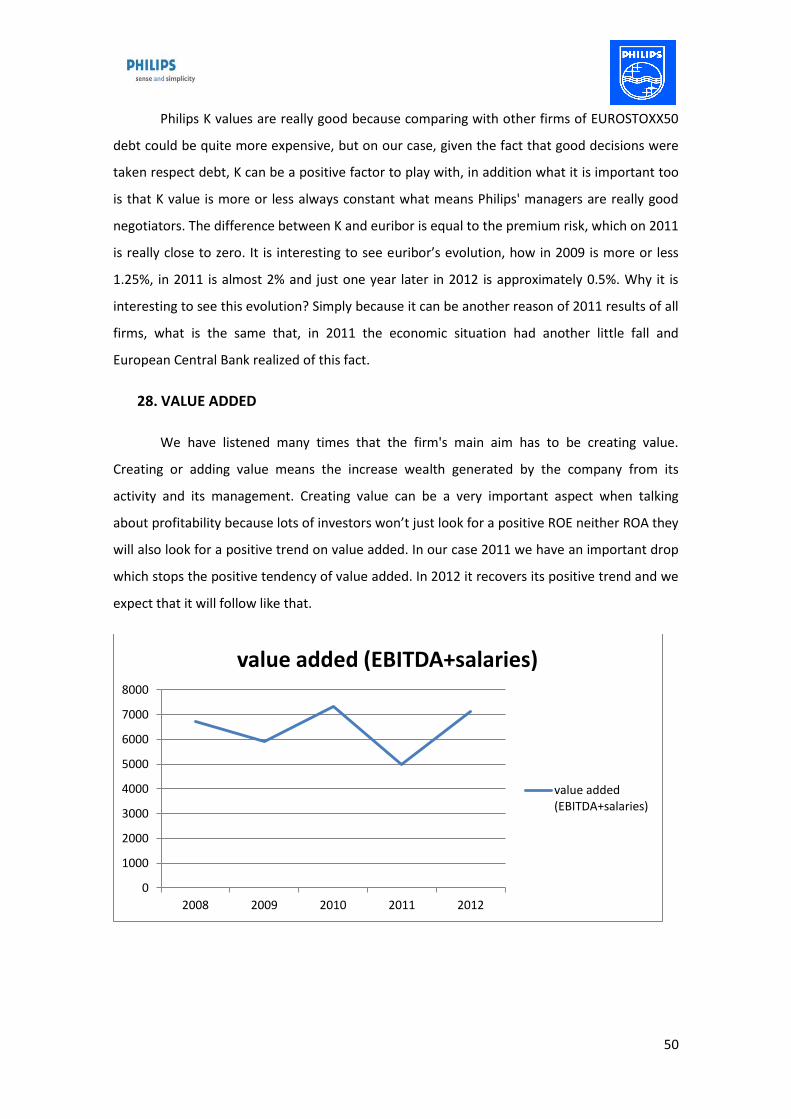
28. VALUE ADDED
We have listened many times that the firm's main aim has to be creating value.
Creating or adding value means the increase wealth generated by the company from its
activity and its management. Creating value can be a very important aspect when talking
about profitability because lots of investors won’t just look for a positive ROE neither ROA they
will also look for a positive trend on value added. In our case 2011 we have an important drop
which stops the positive tendency of value added. In 2012 it recovers its positive trend and we
expect that it will follow like that.
0
1000
2000
3000
4000
5000
6000
7000
8000
2008 2009 2010 2011 2012
value added (EBITDA+salaries)
value added (EBITDA+salaries)
51
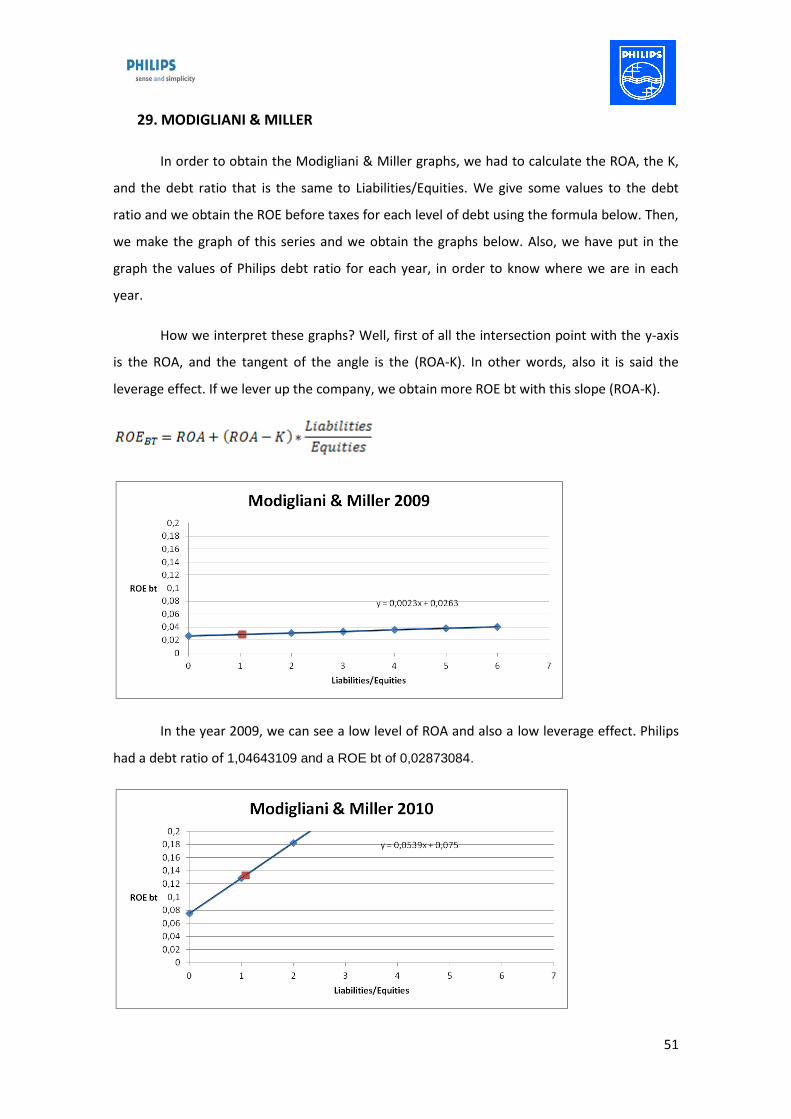
29. MODIGLIANI & MILLER
In order to obtain the Modigliani & Miller graphs, we had to calculate the ROA, the K,
and the debt ratio that is the same to Liabilities/Equities. We give some values to the debt
ratio and we obtain the ROE before taxes for each level of debt using the formula below. Then,
we make the graph of this series and we obtain the graphs below. Also, we have put in the
graph the values of Philips debt ratio for each year, in order to know where we are in each
year.
How we interpret these graphs? Well, first of all the intersection point with the y-axis
is the ROA, and the tangent of the angle is the (ROA-K). In other words, also it is said the
leverage effect. If we lever up the company, we obtain more ROE bt with this slope (ROA-K).
In the year 2009, we can see a low level of ROA and also a low leverage effect. Philips
had a debt ratio of 1,04643109 and a ROE bt of 0,02873084.

52
In year 2010, we can see how the level of ROA had increased and the leverage effect
had increased substantially. Philips had a debt ratio of 1,08460803 and a ROE bt of 0,1333652.
In the year 2011, we can see a negative slope and a negative ROA. It is because this
year Philips had a negative Net Income. Philips had a debt ratio of 1,13815266 and a ROE bt
of -0,03372648.
In the year 2012, things improve and Philips obtain a positive ROA. The leverage effect
had been moderated from 2010 and we obtain positive ROE bt. Philips had a debt ratio of
1,33804181 and a ROE bt of 0,06328194.
This type of graph is very useful to observe the leverage effect. But we assume that the
k is constant. But it is not true at all. The k is the sum of the Euribor and the premium risk
where the premium risk is the multiplication of j and the debt ratio (Liabilities/Equities). “j” is
the sensibility of the bank to the debt ratio of the company. If we develop the formula, we
obtain the formula below.

53
We give some values to the debt ratio and we obtain the ROE before taxes for each
level of debt using the formula. Then, we make the graph of this series and we obtain the
graphs below. Also, we have put in the graph the values of Philips debt ratio for each year, in
order to know where we are in each year. We obtain a second grade graphs, parabolic graphs.
We want to know which is the optimum level of leverage ratio that makes the maximum ROE
bt. In order to know it, we made the first derivative of the second grade equation obtained in
each graph and then equaled to zero. If we want to prove that this value is a maximum, we
calculate the second derivative and it is negative. Because we went from positive slope to a
negative one. In this graph we can observe that with an increasing level of debt ratio, there is a
moment that the ROE bt makes negative. It is very useful to know, we cannot lever up the
company until the infinite to get better ROE bt like the Modigliani & Miller graphs explains.
In the graphs below, we have calculated the Philips level of Liabilities/Equities and its
ROE bt marked in red. Also we have calculated the optimum debt ratio to have the maximum
ROE bt marked in green.
In the year 2009, we have lever up our company more than the optimum level. But in
fact, it is not too far away from the maximum. We were in a good position.

54
In the year 2010, as we had a high leverage effect. We can obtain the maximum level
of ROE bt with a very high level of debt ratio. Far from the Philips point. It is very risky to lever
up a company because of one year we could obtain more profitability.
Because, like in this case, in the year 2011, we obtain a negative profitability. And if we
had lever up too much our company, we would obtain a very negative ROE bt.
In the year 2012, things have improved a lot. We obtain a positive ROA, and also a
positive ROE before taxes. Philips is very close to the optimum level of debt ratio.

55
30. SHORT TERM RISK VS PROFITABILITY
In the next graph, we want to compare the short term risk with the profitability of the
company each year. We have chosen the ROA, because it is the economical profitability. With
this parameter we remove the leverage effect from the profitability of the company. Then, to
measure the short term risk, we have chosen the cash cycle and the Solvency ratio. Solvency
ratio is the proportion between current assets and current liabilities, and we can see that is
bigger than 1 which as in the working capital it means we can afford our short term debts in all
years. Then we have calculated the cash cycle, than in all years except in 2012, is positive. It
means that our customers pays us before we have to pay our suppliers, it is a way to get credit
without any interest. In the year 2012 we obtain a negative Cash cycle, but almost zero. It
means that nowadays we have to pay a little earlier to our suppliers than we are paid from our
customers. We have lost the competitive advantage of financing without interest. In the third
axis, to know the z-axis, we put the ROA. It measures the economical profitability of the
company for each year. We have to conclude that we have increased a lot the profitability
from 2009 until 2010. Then in 2011, we had a bad year and we obtain a negative profitability.
In the year 2012, we improved our results and we obtained a positive profitability again.

56
The bad results of 2011 made the managers of the company take important strategy
decisions. In September of 2011, they sold the home entertainment division to a Chinese firm,
to know TPV systems. This sector had bad results because of the high competition of the
market. Nowadays, the company had focused its efforts to the LED lighting and medical
technology.
31. GROWTH AND PER
We have calculated the growth of the company in the last years using the formula below.
Growth rate = (1-payout)*(1-tax rate)*ROA
As we can see, we take into account the pay-out policy of the company, it means how much of
the net income go as dividends. Also, we take into account the effective tax rate. And the ROA,
that is the economical profitability, without the leverage effect. We can see in the graph, that
between 2009 and 2010 we had a high growth. But in 2011 we had a high drop with negative
growth. The last year analysed Philips has improved its growth and had positive growth.
2009 2010 2011 2012
Growth 0,75% 1,67% -0,309% 0,289%
We want to analyse the how much reliable is the price of the Philips share. We have
calculated the price to earnings ratio (PER) with the formula below.
PER = Price of share/Basic earnings by common share (EPS)
-0,50%
0,00%
0,50%
1,00%
1,50%
2,00%
2009 2010 2011 2012
Growth

57
A company with a high PER may mean that expectations are more favourable value
and future benefits are based on (a predicted growth of these) or that the stock is overvalued,
and therefore, it is unlikely that his stock continues to rise.
A company with a low PER may mean that the stock is undervalued and could increase
their short-term price (upward trend).
In the case of Philips, as we can see on the graph, from 2009 until 2011 has decreased
its PER value. Even we are in a situation where stock or share value increases, on the other
hand earnings per common share decreases. It could mean, that the price of the share where
overestimated. But from 2011 to 2012 the PER value goes up, because of the price of the share
goes down and the earnings per common share were growing. We can conclude that PER value
growing collected the good expectations in Philips share.
-40
-20
0
20
40
60
80
100
2009 2010 2011 2012
PER
PER