qualitative analysis of volatile organic compounds … analysis of volatile organic compounds on...
TRANSCRIPT

Chemosphere xxx (2011) xxx–xxx
Contents lists available at ScienceDirect
Chemosphere
journal homepage: www.elsevier .com/locate /chemosphere
Qualitative analysis of volatile organic compounds on biochar
Kurt A. Spokas a,b,⇑, Jeffrey M. Novak c, Catherine E. Stewart d, Keri B. Cantrell a, Minori Uchimiya e,Martin G. DuSaire a, Kyoung S. Ro c
a United States Department of Agriculture, Agricultural Research Service, Soil and Water Management Unit, Saint Paul, MN, USAb Department of Soil, Water, and Climate, University of Minnesota, Saint Paul, MN, USAc United States Department of Agriculture, Agricultural Research Service, Coastal Plains Soil, Water, and Plant Research Center, Florence, SC, USAd United States Department of Agriculture, Agricultural Research Service, Soil Plant Nutrient Research, Fort Collins, CO, USAe United States Department of Agriculture, Agricultural Research Service, Southern Regional Research Center, New Orleans, LA, USA
a r t i c l e i n f o
Article history:Received 26 April 2011Received in revised form 27 June 2011Accepted 29 June 2011Available online xxxx
Keywords:CarbonBlack carbonSorptionGRACEnetProduction conditionsCharcoal
0045-6535/$ - see front matter Published by Elsevierdoi:10.1016/j.chemosphere.2011.06.108
⇑ Corresponding author. Address: United StatesAgricultural Research Service, Soil and Water ManBuford Circle, 439 Borlaug Hall, Saint Paul, MN 55108fax: +1 651 649 5175.
E-mail address: [email protected] (K.A. Sp
Please cite this article in press as: Spokas, K.A.,j.chemosphere.2011.06.108
a b s t r a c t
Qualitative identification of sorbed volatile organic compounds (VOCs) on biochar was conducted byheadspace thermal desorption coupled to capillary gas chromatographic-mass spectrometry. VOCs mayhave a mechanistic role influencing plant and microbial responses to biochar amendments, since VOCscan directly inhibit/stimulate microbial and plant processes. Over 70 biochars encompassing a varietyof parent feedstocks and manufacturing processes were evaluated and were observed to possess diversesorbed VOC composition. There were over 140 individual chemical compounds thermally desorbed fromsome biochars, with hydrothermal carbonization (HTC) and fast pyrolysis biochars typically possessingthe greatest number of sorbed volatiles. In contrast, gasification, thermal or chemical processed biochars,soil kiln mound, and open pit biochars possessed low to non-detectable levels of VOCs. Slow pyrolysisbiochars were highly variable in terms of their sorbed VOC content. There were no clear feedstock depen-dencies to the sorbed VOC composition, suggesting a stronger linkage with biochar production conditionscoupled to post-production handling and processing. Lower pyrolytic temperatures (6350 �C) producedbiochars with sorbed VOCs consisting of short carbon chain aldehydes, furans and ketones; elevated tem-perature biochars (>350 �C) typically were dominated by sorbed aromatic compounds and longer carbonchain hydrocarbons. The presence of oxygen during pyrolysis also reduced sorbed VOCs. These composi-tional results suggest that sorbed VOCs are highly variable and that their chemical dissimilarity couldplay a role in the wide variety of plant and soil microbial responses to biochar soil amendment notedin the literature. This variability in VOC composition may argue for VOC characterization before landapplication to predict possible agroecosystem effects.
Published by Elsevier Ltd.
1. Introduction the ability of soil micro- and macro-organisms to participate in abi-
The presence of individual volatile organic compounds (VOCs)in the soil system can have mechanistic effects by triggering vari-ous plant and microbial responses or ‘‘soil volatilomics’’ (Insam andSeewald, 2010). VOCs produced in the rhizosphere can regulateplant growth (Simms and Rausher, 1987; Ryu et al., 2003; Kloepperet al., 2004; Baldwin et al., 2006; Zhang et al., 2007) as well asmicrobial processes (Klinke et al., 2004; Almeida et al., 2009; Grab-er et al., 2010). These studies have shown that even low VOC con-centrations (lg m�3) can have a significant impact on the well-being of plants, impacting seed germination, herbivore resistance,invasive plant responses, and nutrient uptake. VOCs also control
Ltd.
Department of Agriculture,agement Unit, 1991 Upper, USA. Tel.: +1 612 626 2834;
okas).
et al. Qualitative analysis of v
otic and biotic reactions known to influence soil quality (Insam andSeewald, 2010).
During biochar production, VOCs are produced regardless of theprocess used (Olsson et al., 2003, 2004; Chouchene et al., 2010; Munand Ku, 2010; Song and Peng, 2010). These VOCs are formed duringpyrolysis by the breakdown or rearrangement of the original bio-mass chemical structures (Demirbas, 2000; Zeng et al., in press). Pyr-azines, pyridines, pyrroles and furans were the typical classes ofvolatile compounds observed during the pyrolysis of chitosan (Zenget al., in press) and glucosamine (Chen and Ho, 1998). Volatile com-pounds are typically trapped and condensed into the liquid fraction(bio-oil) product (Boateng et al., 2007; Yu et al., 2007). In bio-oil, themost frequent compounds observed include: methanol, acetic acid,acetone, methyl acetone, acetaldehyde, furan, furfural, and volatileorganic acids (Mullen et al., 2010; Tiilikkala et al., 2010). Other stud-ies have confirmed the presence of these compounds in wood vine-gar (condensates of wood smoke from pyrolysis), which historicallyis used for its herbicide and pesticide properties (Orihashi et al.,
olatile organic compounds on biochar. Chemosphere (2011), doi:10.1016/
1 Mention of trade names or commercial products in this article is solely for thepurpose of providing specific information and does not imply recommendation orendorsement by the US Department of Agriculture.
2 K.A. Spokas et al. / Chemosphere xxx (2011) xxx–xxx
2001; Yatagai et al., 2002). During the pyrolysis process, VOCs re-condensed as liquids are known to cause mixed impacts on plantgrowth as a function of production conditions and applicationamount (Mu et al., 2004, 2006). In particular, phenols present inthese liquid distillates are speculated to be responsible for notednegative plant-growth impacts (Mun and Ku, 2010).
Although VOCs from biochar have the potential to mediate pro-found changes in the soil gas atmosphere, very few studies haveexamined the chemical nature of VOCs associated with biochar.Previous chemical characterizations of biochar have primarily usedpyrolysis with generated vapors swept into a GC/MS (Py-GC/MS) tomonitor the degree of solid alteration (Galipo et al., 1998). How-ever, since high temperatures (550–800 �C) are used, this analyti-cal technique further thermally alters the sample (Kaal andRumpel, 2009). Therefore, it is difficult to distinguish whetherthe compounds observed are break-down products due to the ana-lytical pyrolysis conditions or sorbed originally to the material,which complicates the quantitative nature of this technique (Kaalet al., 2008; Kaal and Rumpel, 2009). Despite these limitations,Py-GC/MS has confirmed the presence of polyaromatic hydrocar-bons (PAHs) on biochar (Rumpel et al., 2007).
Some of the VOCs released from biochar potentially can eitherstimulate or reduce both plant productivity (Deenik et al., 2010)and microbial processes (Graber et al., 2010; Khodadad et al.,2011), due to biochar’s sorbed organic chemical composition.Clough et al. (2010) observed acetaldehyde, a-pinene, b-pinene,and trans-pinocarveol using an automated headspace solid-phasemicro-extraction (SPME) gas chromatography-mass spectrometry(GC/MS) analysis of a slow pyrolysis wood biochar. Graber et al.(2010) hypothesized that sorbed VOCs were capable of diseasesuppression in pepper and tomato plants in soilless media treatedwith biochar. Spokas (2010) quantified varying ethylene produc-tion rates originating from different biochars. The authors specu-lated that this ethylene could be involved in both the plant (fineroot hair development) and soil microbial responses observed frombiochar additions. Furthermore, both ethylene (McCarty and Brem-ner, 1991) and a-pinene (Clough et al., 2010) can act as nitrifica-tion inhibitors. Sorbed VOCs on biochar have also beenimplicated with reduced plant germination and growth (Vantsisand Bond, 1950; Turner, 1955; Kadota and Niimi, 2004; Deeniket al., 2010; Free et al., 2010). Even though these studies focusedon different VOC compounds and soil processes, the overall conclu-sions following biochar amendments suggest a mixed role of VOCsin the plant-soil system; albeit, individual compounds can serve asinhibitors or stimulants to biological systems.
It has been well established that biochar chemistry and yieldsvaries considerably with production process conditions (Novaket al., 2009; Keiluweit et al., 2010; Lee et al., 2010) and surface oxi-dation (i.e., activation, aging, weathering) (Boehm, 1994; Yao et al.,2010). The yield of biochar is particularly influenced by the feed-stock’s initial moisture content, ash content, and elemental compo-sition (Gray et al., 1985). Previously, attention to VOC contents hasbeen focused on the bio-oil because of its influence on marketabil-ity and post-collection processing (Bridgwater et al., 1999; Mohanet al., 2006; Boateng et al., 2010; Shuping et al., 2010).
The linkage between VOC associated with biochar to microbialand plant responses is agriculturally and environmentally impor-tant. Unfortunately, there is limited information on the impact ofvarious feedstocks, production conditions and different pyrolysistechnologies on the chemical characteristics of sorbed VOCs asso-ciated with these biochars. Moreover, this could be an importantconsequence when selecting biochar to improve soil quality (Leh-mann, 2007; Laird, 2008; Novak and Busscher, in press). Therefore,our objectives were to evaluate the effects of feedstock, pyrolysistechnology, and pyrolysis temperatures on the qualitative proper-ties of sorbed VOCs on biochar.
Please cite this article in press as: Spokas, K.A., et al. Qualitative analysis of vj.chemosphere.2011.06.108
2. Material and methods
2.1. Biochar production processes
Biochars were obtained from a variety of commercial and re-search sources1 because it was postulated that VOC profiles associ-ated with the biochars would correspondingly be diverse. Thebiochars were manufactured under an array of production levels,including homemade, laboratory, and pilot scale pyrolysis equip-ment. Exact production parameters were not known for all biochars,due to the fact that some of the biochars were created in pyrolysisunits lacking industrial process monitoring equipment. Neverthe-less, these biochars were included among the employed suite to cap-ture irregularity in the types of biochar currently available. Therewere a total of 77 different biochars evaluated in this study (Table 1).All biochars were evaluated as received from the various suppliers.Each supplier, or pyrolysis unit, is designated in the unit column,with similar labels designating the same pyrolysis unit. To producethe biochars, an assortment of conversion technologies were used,including; fast pyrolysis (3), slow pyrolysis (46), traditional methods(4), gasification (5), wood fired boilers (6), microwave assisted pyro-lysis (4), hydrothermal carbonization (4), and activated carbons (5),with the number in parentheses indicating the respective number ofbiochars from that technique. The two types of traditional pyrolysis(fast and slow) biochars were both created in some type of engi-neered unit, typically under anaerobic conditions by an inert gaspurge. These biochars were further divided based on the residencetime of the material in the reactor chamber, with fast designatingless than 15 min and slow greater than 15 min (Table 1). Traditionalsoil kiln methods were biochars that were created in the absence ofan engineered unit, such as a soil mound or soil pit. Gasifier biocharswere those produced under elevated temperatures with no efforts toexclude oxygen from the reaction chamber (i.e., no inert gas purge).Wood boiler biochars were considered a special sub-set of gasifierbiochars, since these were all created in wood fired boilers, whichwere common in the paper and pulp industry (Etiégni and Campbell,1991). Microwave assisted pyrolysis biochars were those createdwith microwave energy for pyrolysis heating (Wan et al., 2009).Hydrothermal carbonization (HTC) biochars were produced underlower temperatures (200–250 �C) and elevated steam/water pres-sures to carbonize the biomass material (Cao et al., 2011; Libraet al., 2011). Selected activated carbons were included as examplesof biochar that underwent further chemical and/or thermal process-ing after production (Azargohar and Dalai, 2006; Ippolito et al., inpreparation).
Biochar pH was determined in a 1:5 (1 g biochar to 5 mL dis-tilled water) slurry. Proximate (ASTM D121/D5142/D7582) andultimate analyses (ASTM D5373/D3176) were performed by HazenResearch (Golden, CO) and N2 BET surface area (Brunauer et al.,1938) analyses were performed by the USGS (D. Rutherford, Boul-der, CO) and Material Synergy (Oxnard, CA), if equivalent data wasnot available for the particular biochar. Not all biochars were fullycharacterized due to lack of material needed for these assessments.
2.2. Headspace thermal desorption–gas chromatographic–massspectrometer system
The use of headspace instrumentation is common for the anal-ysis of sorbed compounds on charcoal sample tubes (Canela andMuehleisen, 1986; Gan et al., 1994; Risholm-Sundman et al.,1998; Kusch and Knupp, 2004). Therefore, headspace instrumenta-tion would be an ideal tool for the analysis of sorbed VOCs on bio-
olatile organic compounds on biochar. Chemosphere (2011), doi:10.1016/
Table 1List of biochars examined in this study and accompanying characterization and production parameters that were known. Units with the same designations were made on thesame pyrolysis unit.
(% dry weight)
BC# Parent material Unit PT (�C) pH SA (m2 g�1) C N O H H2O VM Ash
Fast pyrolysis biochar1 Macadamia shells F1 n/a 6.2 6.9 84.3 0.6 1.5 2.3 9.5 15.2 1.72 Oak hardwood sawdust F2 500 8.0 46 61.8 0.21 2.3 0.6 80.7 5.0 15.83 Macadamia shells F3 650 6.9 0.45 71.0 0.88 1.2 2.5 5.0 19.5 20.4
Slow pyrolysis biochar4 Corn stover SP1 515 9.5 4.4 45.0 0.5 1.0 1.7 11.5 30.9 55.05 Pine wood chip SP2 465 6.8 0.1 75.0 0.3 9.0 3.4 55.0 34.9 6.06 Peanut hulls SP2 481 8.0 1.0 59.0 2.7 12.0 2.3 72.0 5.3 15.07 Corn stover SP3 500 8.9 4.2 25.0 0.6 5.0 1.1 9.1 41.3 69.08 Corn stover SP2 410 n/a 2.2 42.0 1.0 11.0 1.8 4.1 n/a 54.09 Pine wood chip SP2 465 6.8 0.2 71.0 0.2 11.0 3.3 12.0 72.3 9.0
10 Peanut hulls SP2 481 5.1 286 60.0 0.9 10 1.1 5.2 n/a 15.011 Corn stover SP4 505 10.0 17.3 46.0 1.2 4.0 1.5 28.0 13.8 54.012 Coconut shell SP1 550 8.9 15.1 80.1 0.5 2.5 n/a 12.4 8.7 n/a13 Distillers grain SP5 350 6.8 0.3 67.4 7.4 6.5 4.7 1.8 43.9 11.314 Distillers grain SP5 400 6.9 0.3 68.1 7.3 5.9 4.2 2.0 36.9 11.715 Corn cob SP5 350 8.7 <0.1 76.5 0.7 12.9 4.2 2.9 32.2 2.816 Corn cob SP5 400 9.0 <0.1 80.1 0.6 8.8 3.7 3.1 24 3.717 Wood waste SP6 400 6.9 3.5 76.9 0.8 11.5 3.6 3.7 25.8 3.518 Wood waste SP6 450 8.4 26.8 77.9 0.7 11 3.1 3.6 22.8 3.619 Wood waste + composting SP7 465 8.6 63.5 43.0 2.2 n/a n/a 11.4 32.3 n/a20 Wood chip (pellet) SP8 650 9.8 177.2 69.3 0.2 17.7 1.2 5.6 11.7 6.021 Oak hardwood SP9 538 9.8 33.7 53.4 0.4 9.8 2.6 6.3 32.5 27.122 Wood waste SP10 500 5.0 66.3 68.7 0.1 19.9 3.3 3.3 33.6 4.623 Oak hardwood SP11 540 6.6 n/a 73.3 0.3 n/a n/a 1.7 n/a 2.424 Oak hardwood SP12 n/a 8.5 106.3 90.1 0.3 4.5 2.8 1.3 15 1.025 Pine wood chip SP13 500 7.2 n/a 87.2 0.43 6.44 3.6 3.24 45.8 2.326 Sugar cane bagasse SP15 350 5.0 n/a 75.2 0.66 15.8 4.6 3.42 39.2 3.627 Pine wood chip SP15 350 4.6 n/a 74.7 0.45 18.4 5.0 2.74 45.2 1.528 Swine manure SP15 350 8.1 0.92 50.8 3.74 6.64 5.0 2.31 46.2 32.329 Switchgrass SP15 250 6.2 n/a n/a n/a n/a n/a n/a n/a n/a30 Poultry litter SP16 400 10.3 n/a 42.3 4.2 n/a n/a n/a n/a n/a31 Pine chips SP16 500 7.3 n/a 73.3 0.2 n/a n/a n/a n/a n/a32 Wood wastes SP17 n/a 8.4 n/a n/a n/a n/a n/a n/a n/a n/a33 Wood waste SP18 n/a 9.1 n/a n/a n/a n/a n/a n/a n/a n/a34 Wood pellets SP19 n/a 5.5 78.3 77.3 0.4 3.9 1.6 6.8 14.1 10.135 Wood pellets SP19 n/a 10.8 4 73.9 0.4 10.8 2.8 4.8 26.3 7.336 Wood pellets SP19 n/a 6.7 n/a 76.4 0.4 11.7 2.7 5.1 27.3 3.737 Wood pellets SP19 n/a 6.8 1.7 77.2 0.3 12.5 2.9 5.1 28.6 1.938 Wood ash + fertilizer SP20 n/a 8.3 n/a 68.0 1.53 n/a n/a 58.1 n/a 8.139 Oak hardwood SP20 n/a 10.2 n/a 59.8 0.6 n/a n/a n/a n/a n/a40 Mixed hardwood SP20 n/a 8.8 n/a 76.9 0.5 n/a n/a 2.2 n/a 11.641 Mixed wood SP21 n/a 4.7 n/a 60.8 0.44 n/a n/a 6.8 n/a n/a42 Oak hardwood SP22 550 10.2 134.8 52.0 0.2 3.9 0.6 n/a 4.3 43.443 Oak hardwood SP22 550 10.5 116.8 56.0 0.2 0.7 0.9 n/a 4.4 42.244 Cottonseed hull SP23 200 3.7 n/a 48.2 5.6 37.7 5.6 5.3 69.3 3.145 Cottonseed hull SP23 350 6.6 4.7 71.5 4.2 14.6 4.2 6.8 34.9 5.746 Cottonseed hull SP23 500 8.5 <0.1 78.7 2.5 6.9 2.5 6.5 18.6 7.947 Cottonseed hull SP23 650 8.6 34 84.4 1.2 5.5 1.2 8.2 13.3 8.348 Cottonseed hull SP23 800 7.7 322 84.3 0.6 6.6 0.6 9.9 11.4 9.249 Coal + wood pellets SP24 900 5.5 5.0 6.8 0.2 n/a 0.10 1 1.8 86.4
Traditional kiln biochar (e.g. soil mound, pits)50 Oak hardwood K1 400–600 8.9 n/a 72.4 0.4 n/a n/a n/a n/a n/a51 Oak hardwood (possible?) K2 n/a 6.5 n/a 83.8 0.3 n/a n/a 0.8 n/a 1.752 Hardwood K3 n/a 6.8 19.2 69.0 0.7 9 2.4 10.0 69.9 1453 Hardwood K4 n/a 7.4 n/a 77.4 0.3 n/a n/a n/a n/a n/a
Gasifier biochar (e.g. ashes)54 Oak Hardwood G1 n/a 11.2 33.5 31.5 0.3 n/a 0.6 0.6 20.3 66.655 Mixed waste wood G2 >600 �C 11.8 144.0 27.2 0.3 n/a 0.3 0.9 18.8 72.256 Turkey manure and wood chips G3 850 10.9 4.8 1.0 0.1 3 0.5 5.0 22.2 8957 Wood ash G4 n/a 11.8 n/a <0.1 0.01 n/a n/a 16.5 0.6 82.958 Corn stover G5 815 10.1 9.9 31.0 1 0 0.9 14.0 33.0 74
Wood fire boiler biochar (wood ash)59 Wood ash WB1 n/a 9.1 176.7 16.0 0.2 2.1 0.1 32.3 6.8 49.360 Wood ash WB2 n/a 8.4 193.5 15.9 0.2 2.5 0.1 41.9 9 39.361 Wood ash WB3 n/a 8.7 57 4.6 0.09 1.3 0.04 41.7 5.2 52.162 Wood ash WB4 n/a 8.6 335.9 20.9 0.1 1.5 0.2 67.3 4 1063 Wood ash WB5 n/a 5.8 63.1 10.1 0.1 1.7 0.4 65.6 3.1 22.1
(continued on next page)
K.A. Spokas et al. / Chemosphere xxx (2011) xxx–xxx 3
Please cite this article in press as: Spokas, K.A., et al. Qualitative analysis of volatile organic compounds on biochar. Chemosphere (2011), doi:10.1016/j.chemosphere.2011.06.108
Table 1 (continued)
(% dry weight)
BC# Parent material Unit PT (�C) pH SA (m2 g�1) C N O H H2O VM Ash
64 Wood ash WB6 n/a 10.3 n/a 89.6 1.01 <0.01 n/a 0.1 5.8 5.2
Activated charcoals65 Coconut shells (activated) AC1 500 �C steam activated 900 �C 7.6 1200 83.1 0.4 <0.01 0.06 5.5 1.7 12.366 Coconut shells (activated) AC2 900 �C activation (steam) 6.8 922 90.2 1.72 3.08 0.38 3 0.5 1567 Hardwood AC3 n/a 5.8 1661 89.4 0.4 0.6 2.1 3.4 7.8 4.168 Bituminous coal AC4 Activated at 800 �C 9.4 988 94.9 1.27 2.49 0.7 1.6 1.8 0.369 Hardwood AC5 Phosphorus acid activated 600 �C 3.8 877 95.8 0.2 1.0 0.6 5.0 0.5 0.2
Hydrothermal biochars70 Algae HT1 250 3.3 0.1 48.9 7.9 16.5 9.1 10.2 n/a 0.271 Swine manure + sugar beet HT2 200–250 4.4 2.5 50.7 2.3 25.4 5.0 4.1 63.2 12.272 Swine manure + pine bark HT3 200–250 4.0 6.5 56.0 0.7 23.7 4.4 5.6 55.2 29.773 Algae HT4 200 3.9 <0.1 66.3 7.3 18.0 7.9 9.2 n/a 0.3
Microwave assisted pyrolysis biochar74 Chicken feathers MAP1 Not measured (n/a) 9.2 n/a 33.6 3.1 n/a n/a n/a n/a n/a75 Swine manure + bedding MAP2 Not measured (n/a) 9.8 n/a n/a n/a n/a n/a n/a n/a n/a76 Distiller grain MAP3 Not measured (n/a) 10.1 n/a n/a n/a n/a n/a n/a n/a n/a77 Corn stover MAP4 600 n/a n/a n/a n/a n/a n/a n/a n/a n/a
Notes compositional values are weight percentages related to dry mass; VM = volatile matter; SA = surface area; PT = pyrolysis temperature; H2O = moisture content; and n/a = data not available.
4 K.A. Spokas et al. / Chemosphere xxx (2011) xxx–xxx
char, and has been used in one existing study (Bernardo et al.,2010).
To analyze the chemical composition of sorbed VOCs associatedwith biochars, a headspace sampler (HP-7694; Agilent, Santa Clara,CA) was modified through the use of a 10-port diaphragm valve(DV22-2110; Valco Instruments Co., Inc.; Houston, TX) to allowthe introduction of two simultaneous gas samples from a singleheadspace venting to two different analytical GC columns. Theeffluent from one of the columns [RTX-624 (60 m � 0.32 mm ID),Restek Corp.; Bellefonte, PA] was directed to a mass spectrometer(MS) detector (Clarus P600; Perkin–Elmer; Waltham, MA) andthe other column’s effluent [Porapak Q (6.4 mm � 1.8 m); RestekCorp.; Bellefonte, PA] was connected directly to a thermal conduc-tivity detector (TCD), which was in series with a flame ionizationdetector (FID). The GC and MS instruments were controlledthrough TurboMass software (Perkin–Elmer; Waltham, MA), andthe TCD and FID signals were collected via a interface box (Per-kin–Elmer 900; Perkin–Elmer, Waltham, MA) using TotalChromsoftware (ver. 2.2; Perkin–Elmer; Waltham, MA). In this fashion,the carbon dioxide (CO2) evolved during heating and the corre-sponding light weight volatiles (C1–C4 compounds) could be quan-tified that would otherwise be lost in the air/water peak on the MS.The VOCs analyzed in this study were desorbed thermally from thebiochars, we did not use any solvents on the biochars to extractVOCs. The overall settings and conditions of the system are pro-vided in Table S1 (Supplementary material).
Typically, 0.5 g biochar samples were placed into a 10 mL head-space vial (#5182-0838, Agilent, Santa Clara, CA) and sealed withTeflon-lined high-temperature silicone septa (#22831, RestekCorp.; Bellefonte, PA). For headspace methods, vial temperatureand equilibration time are the most vital for method development(Friant and Suffet, 1979; Penton, 1992). For the analysis here, bio-char samples were thermally heated to 150 �C for 10 min in asealed headspace vial prior to injection. These conditions were se-lected based on preliminary experiments across several biochars.However, there was no single optimum desorption temperaturefor all biochars. To collect data that would be universal across allbiochars (i.e., compounds that were thermally desorbed underset conditions), a fixed thermal desorption temperature of 150 �Cwas selected, which is similar to other studies using headspacemethods for charcoal desorption (e.g., Markelov and Bershevits,2001; Candole et al., 2007). Furthermore, a desorption time of10 min was used to minimize the pressure build up in the vialresulting from the variable water content of the biochars, which
Please cite this article in press as: Spokas, K.A., et al. Qualitative analysis of vj.chemosphere.2011.06.108
is a significant difficulty in headspace analyses (Novotny et al.,1974; Bicchi et al., 2008).
Qualitative peak identification was conducted by comparing thecollected ion spectra to the reference spectral library (NIST; Per-kin–Elmer; Waltham, MA). Peak retention times and library spec-tral identification was confirmed with external liquid standards(AccuStandard; New Haven, CT), which were injected as a liquid(<5 lL) into a sealed headspace vial and analyzed under the sameconditions (Table S1, Supplementary material). Only qualitativeanalyses were conducted, due to the high number of identifiedpeaks that lead to overlapping and co-eluting interferences. Inaddition, extraction efficiency of VOCs from charcoal (biochar)was known to be a function of the compound and biochar (Ragusoand Pellmyr, 1998), which leads to dissimilar extraction efficien-cies for various biochars. Therefore, further refinement in the ana-lytical technique is needed before accurate quantification can beaccomplished by headspace methodology. An 85% level of certaintyin the spectral match criteria was used as a cut-off for spectralidentification.
Samples vials were run with corresponding air blank vials toavoid cross-contamination and establish laboratory VOC baselines.If the biochar’s integrated compound area was significantly greaterthan the corresponding compound in the air blank sample, theresulting identified peak was retained in the table. On the otherhand, if the integrated area was not significantly different thanthe air blank control, these compounds were flagged as not-de-tected. In this fashion, potential VOCs present in the laboratoryair or septa contamination were accounted for.
Chemical data were averaged across biochar production styles.These means were compared utilizing a one-way analysis of vari-ance (InStat, GraphPad Software) to determine if statistical(P < 0.05) differences existed in chemical properties as a functionof pyrolysis production technique.
3. Results
3.1. Chemical and physical biochar analyses
The biochars possessed a range of 1–95% total carbon, 0.5–43.9%volatile matter content, 0.3–96% ash, 0.1–7.4% nitrogen, <0.1–1661 m2 g�1 BET surface areas, 0–63% moisture, and a range ofpyrolysis temperatures from 200 to >800 �C (Table 1). Overall, pHvalues ranged from 3.3 to 10, with significant differences amongproduction styles (P < 0.05). Gasifier biochars were typically
olatile organic compounds on biochar. Chemosphere (2011), doi:10.1016/

K.A. Spokas et al. / Chemosphere xxx (2011) xxx–xxx 5
alkaline, hydrothermal biochars were acidic, fast pyrolysis biocharswere near neutral pH values, and the slow pyrolysis biochars ran-ged from acidic to alkaline (pH 4–10) (Table 1). There were alsosignificant differences in the total residual carbon as a functionof the type of pyrolysis (P < 0.05). Biochars produced through gas-ification had low carbon contents, which would indicate oxygenpresence during the heating allowing for combustion to CO2. As ex-pected, the activated carbons consistently possessed the highesttotal carbon contents (90.7 ± 5.1%) and surface areas(1130 ± 360 m2 g�1). The most common technique used to producethe biochars in Table 1 was slow pyrolysis, which also was thetechnique with the highest variability in all assessments, resultingin no clear distinction in chemical characteristics for the slow pyro-lysis biochars.
3.2. Biochar headspace desorption VOC profiles
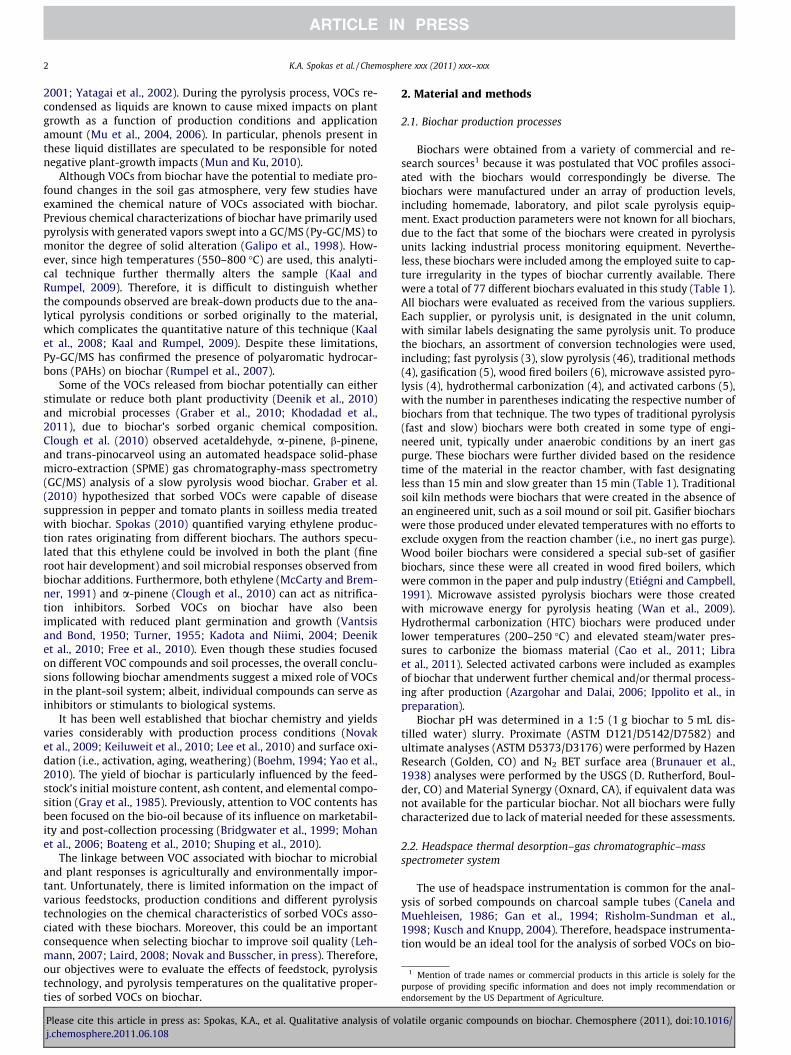
We observed differences in VOC profiles from biochars createdfrom different pyrolysis production units with equivalent feed-stock and pyrolysis temperatures. There were 77 compounds pos-itively identified in this study (Table S2, Supplementary material),with the remainder of the chromatographic peaks insufficientlycharacterized through a mass spectral match to positively identifythe target compounds. Fig. 1 illustrates the differences in the GC/MS thermal desorption total ion chromatograms (TIC) obtainedfrom a similar feedstock (oak hardwood) across five pyrolysis pro-duction platforms, ranging from slow (BC21; 538 �C; Fig. 1A), slow(BC42; 550 �C; Fig. 1B), fast (BC2; 500 �C; Fig. 1C), limited oxygensupply gasifier (BC54; unknown; Fig. 1D) and traditional soilmound (BC50; 400–600 �C; Fig. 1E). The corresponding retentiontimes (RT) of the identified compounds are listed in Table S2 (Sup-plemental material). Even though quantitative analysis was notconducted, the differences in the peak height would be propor-tional to thermally desorbed concentrations for equivalent com-pounds. Samples BC21 (Fig. 1A) and BC2 (Fig. 1C) possessed ahigh number of sorbed VOCs of differing amounts. Both of thesepyrolysis units utilized an inert gas stream purging the reactionchamber during production and equivalent final production tem-peratures (540–550 �C). For BC21, the most prevalent VOC identi-fied was acetone (9.7 min), followed by methyl ethyl ketone(14.2 min; Fig. 1A); whereas for sample BC2, methyl acetate(10.8 min) occurred in the highest abundance followed by acetone(9.7 min; Fig. 1C). On the other hand, samples BC42 (Fig. 1B), BC54(Fig. 1D), and BC50 (Fig. 1E) had significantly lower sorbed volatilesthan the fast (Fig. 1C) and other slow pyrolysis unit (Fig. 1A). Themost prevalent VOCs in samples BC54 and BC50 were acetone(9.7 min) and benzene (16.3 min). Both benzene (16.3 min) and tri-chloroethene (17.9 min) were most abundant in BC42, with allcompounds being significantly lower than BC21 and BC2 (Fig. 1).Due to the unknown production temperature (lack of process mon-itoring equipment), the differences observed in BC54 and BC50could be attributed to pyrolysis temperature differences ratherthan solely residence time. However, these results do suggest thatfeedstock is probably not the primary determining factor forsorbed VOCs profiles in this dataset.
The only regularly identified contaminant on the GC/MS scanswas 1,1,1,5,5,5-hexamethyl-3-(trimethylsilyl) trisiloxane, whichoriginated from the septa (silicone). This peak showed up in allsamples in varying amounts (retention time = 28.3 min). Atmo-spheric methane was also a contaminant in all samples due to itspresence in laboratory air. However, the value for methane in thecontrol laboratory air blanks was subtracted from the biochar areato correct for its interference. Occasional peaks for ethanol, meth-anol, and dichloromethane (solvents in use in the laboratory build-ing) were identified in the air samples. However, no correction wasrequired, since the focus was on qualitative detection, with
Please cite this article in press as: Spokas, K.A., et al. Qualitative analysis of vj.chemosphere.2011.06.108
detected biochar compounds typically exceeding these backgroundlevels by an order of magnitude.
The presence of oxygen in the pyrolysis unit appears to be acontrolling factor in the number and amount of sorbed volatiles.Increasing oxygen presence during pyrolysis (B21, B2; both withinert gas purging) to gasification (B54; greater oxygen presence)resulted in a decrease in sorbed VOCs (Fig. 1). The oxygen levelsimilarly influenced the sorbed VOCs characteristics for slow pyro-lysis biochars compared to the traditional soil kiln biochar (pro-duced for a period of time in oxygen presence, prior to burial).However, detailed data on the oxygen content during pyrolysiswas not directly collected during the production of the variousbiochars used in Fig. 1.
Despite equivalent feedstock and pyrolysis conditions, we ob-served substantially different biochar sorbed VOCs from the di-verse pyrolysis facilities. Fig. 2 illustrates the differences insorbed volatiles on corn stover biochar from four different slowpyrolysis facilities (BC 4, 7, 8, and 11), produced at nearly equiva-lent temperatures (410–515 �C). These four corn stover biocharspossessed drastically different concentration and distribution ofsorbed VOCs as a function of the pyrolysis facility, which was sim-ilar to the observations for the two slow pyrolysis biochars of oakhardwood (Fig. 1A and B). These differences exist despite the factthat pyrolysis conditions were similar for these biochars (Table 1).Sample BC4, produced at the highest temperature (515 �C), con-tained the most abundant sorbed volatiles (Fig. 2A), dominatedby furan (8.8 min), acetone (9.7 min), and methyl acetate(10.8 min). In contrast, sample BC7 was lower in total sorbed spe-cies (Fig. 2B), with benzene (16.3 min), toluene (21.1 min), andacetone (9.7 min) being the most prevalent. Likewise, sample BC8(Fig. 2C) had acetone (9.7 min) in the greatest abundance followedby 1-dodecane (36.1 min). BC11 had extremely low VOC levels,which were characterized by benzene (16.3 min) and methyl ace-tate (10.8 min) being the largest peaks (Fig. 2D). These results illus-trate the striking dissimilarity in VOC compositional chemistryamong the four biochars made from the same feedstock and slowpyrolysis technique.
There was also substantial variability in VOC profiles betweenpyrolysis temperatures using a single feedstock on the same pyro-lysis unit. Fig. 3 illustrates the TIC for waste cottonseed hull (con-taining both hull and cottonseed) pyrolyzed at 800, 650, 500, 350,and 200 �C for 4 h under a nitrogen flow (BC44–48), on the sameslow pyrolysis unit. The biochar with the highest sorbed contentof VOCs was the biochar produced at the lowest temperature(BC44; 200 �C; Fig. 3E). This biochar was characterized by high pro-portions of short-chain aldehydes and furans, with the three mostdominant compounds being 2-propanal (9.2 min), ethyl acetate(12.5 min), and 2-hexenal (26.5 min). The next temperature step(350 �C; BC45) showed overall decreases in the amount of longer(6–7 carbon) chain aldehydes to shorter chain aldehydes and ke-tones, with propanal (9.4 min), acetone (9.7 min), and methyl ethylketone (14.2 min) comprising the most dominant peaks. At 500 �C(BC46), the three most abundant compounds were dodecane(36.1 min), toluene (21.1 min), and benzylaldehyde (31.2 min). At650 �C (BC47) the overall quantities of sorbed volatiles decreaseddue to the reduced peak magnitude observed in the TIC (Fig. 3B).The largest three peaks in this temperature regime were unidenti-fiable compounds. Background spectra subtraction did not aid intheir identification, suggesting co-eluting compounds impactingthe spectral comparisons. At 800 �C (BC48), the biochar had verylow quantities of sorbed volatiles, as indicated by reduced peakmagnitudes (Fig. 3A). The three VOCs with the greatest peak areaswere toluene (21.1 min), octanal (31.6 min), and potentially 4-methyloctane (R2 = 78%; 34 min).
Although there were substantial variability between pyrolysisunits and feedstock (Figs. 1 and 2), there were some trends in
olatile organic compounds on biochar. Chemosphere (2011), doi:10.1016/
Fig. 1. Images of the total ion chromatograms from the thermal desorption GC/MS analysis of five different oak hardwood biochars: (A) Slow pyrolysis (BC21), (B) Slowpyrolysis (BC42), (C) Fast pyrolysis (BC2), (D) Gasifier (BC54), and (E) Tradition soil mound kiln (BC50) production methods. All chromatograms are scaled equally, with theinset chromatograms showing the rescaled chromatogram. All pyrolysis techniques had nearly equivalent production temperatures.
6 K.A. Spokas et al. / Chemosphere xxx (2011) xxx–xxx
sorbed VOC compounds as a function of production temperaturefrom the same feedstock with the same pyrolysis unit. Fig. 4 illus-trates the abundance trends (relative TIC peak areas) for a few se-lected compounds for cottonseed hull (containing both hull andcottonseed) pyrolyzed at 200, 350, 500, 650, and 800 �C. The abun-dance of sorbed toluene (21.1 min) (Fig. 4A) was maximum at thelowest temperature (BC44; 200 �C), and decreased with increasingtemperature to 800 �C (BC48). However, not all VOCs followed thisdecreasing trend as a function of production temperature. For in-stance, the initial detection of benzene (16.3 min) on these bioch-ars was not at 200 �C but those made at 350 �C (BC45), and then
Please cite this article in press as: Spokas, K.A., et al. Qualitative analysis of vj.chemosphere.2011.06.108
the quantity of sorbed benzene decreased with increasing produc-tion temperature, with the highest amount of sorbed benzenebeing present on the 350 �C biochar (Fig 4B). The amount of sorbedethylene/acetylene (Fig. 4C), methane (Fig. 4D), and ethanol(Fig. 4E) also peaked with the observed benzene maximum(BC45; 350 �C). All of these shorter chain hydrocarbons decreasedwith further increases in pyrolysis temperature from 350–800 �C.Ethanol, ethylene, and methane were still detectable even at thehighest temperatures (BC48; 800 �C). These trends can be seenvisually on the TIC, with the shift in the appearance of the peaksfrom earlier eluting times (Fig. 3E) (typically short carbon chain
olatile organic compounds on biochar. Chemosphere (2011), doi:10.1016/
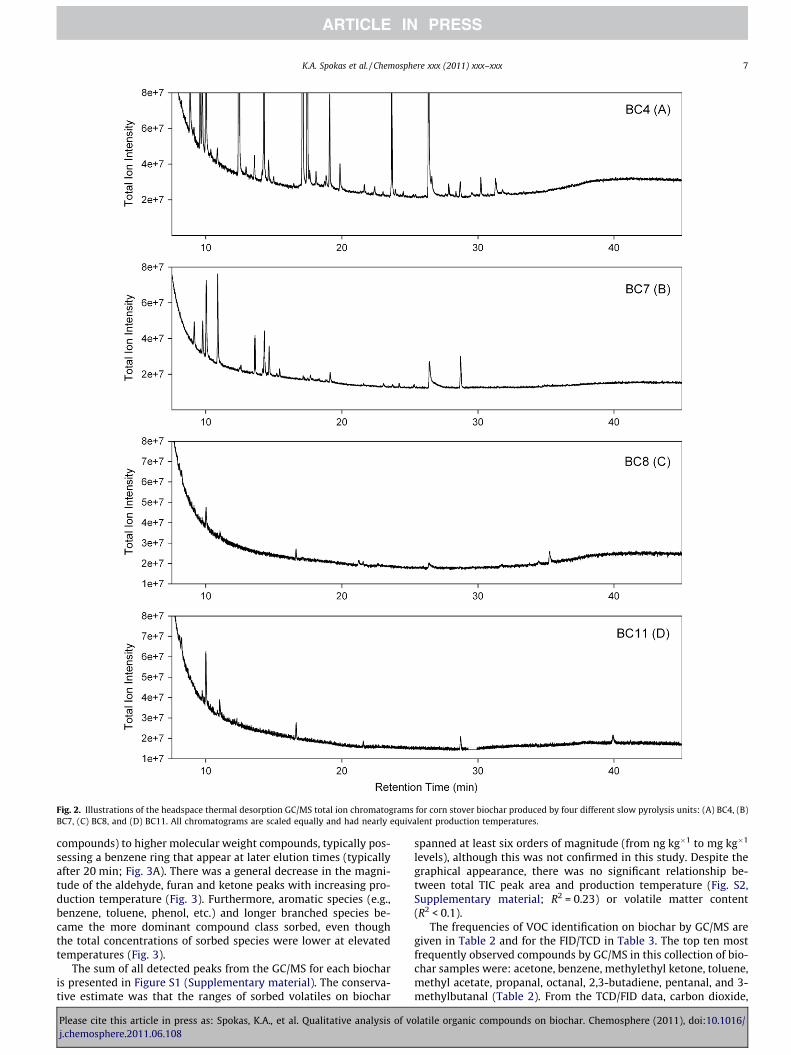
Fig. 2. Illustrations of the headspace thermal desorption GC/MS total ion chromatograms for corn stover biochar produced by four different slow pyrolysis units: (A) BC4, (B)BC7, (C) BC8, and (D) BC11. All chromatograms are scaled equally and had nearly equivalent production temperatures.
K.A. Spokas et al. / Chemosphere xxx (2011) xxx–xxx 7
compounds) to higher molecular weight compounds, typically pos-sessing a benzene ring that appear at later elution times (typicallyafter 20 min; Fig. 3A). There was a general decrease in the magni-tude of the aldehyde, furan and ketone peaks with increasing pro-duction temperature (Fig. 3). Furthermore, aromatic species (e.g.,benzene, toluene, phenol, etc.) and longer branched species be-came the more dominant compound class sorbed, even thoughthe total concentrations of sorbed species were lower at elevatedtemperatures (Fig. 3).
The sum of all detected peaks from the GC/MS for each biocharis presented in Figure S1 (Supplementary material). The conserva-tive estimate was that the ranges of sorbed volatiles on biochar
Please cite this article in press as: Spokas, K.A., et al. Qualitative analysis of vj.chemosphere.2011.06.108
spanned at least six orders of magnitude (from ng kg�1 to mg kg�1
levels), although this was not confirmed in this study. Despite thegraphical appearance, there was no significant relationship be-tween total TIC peak area and production temperature (Fig. S2,Supplementary material; R2 = 0.23) or volatile matter content(R2 < 0.1).
The frequencies of VOC identification on biochar by GC/MS aregiven in Table 2 and for the FID/TCD in Table 3. The top ten mostfrequently observed compounds by GC/MS in this collection of bio-char samples were: acetone, benzene, methylethyl ketone, toluene,methyl acetate, propanal, octanal, 2,3-butadiene, pentanal, and 3-methylbutanal (Table 2). From the TCD/FID data, carbon dioxide,
olatile organic compounds on biochar. Chemosphere (2011), doi:10.1016/

Fig. 3. Total ion chromatograms for the analysis of cottonseed hull biochar pyrolyzed at (A) 800, (B) 650, (C) 500, (D) 350, and (E) 200 �C for 4 h under 1600 mL min�1 N2 flow.All chromatograms are scaled equally.
8 K.A. Spokas et al. / Chemosphere xxx (2011) xxx–xxx
methane, ethylene/acetylene, and ethanol were detected in all ofthe sampled biochars (Table 3).
4. Discussion
4.1. Implications of feedstock, pyrolysis unit, and pyrolysis type
There were over 140 individual VOCs identified that weresorbed to biochars, not to mention the semi-volatiles and non-vol-
Please cite this article in press as: Spokas, K.A., et al. Qualitative analysis of vj.chemosphere.2011.06.108
atiles that still require investigation. Semi-volatiles (e.g., naptha-lene) and non-volatile organic compounds are not adequatelyquantified with thermal headspace desorption (Kolb and Ettre,1997). There was a visual grouping of the total sorbed VOCs on bio-char by some pyrolysis techniques (Fig. S2, Supplementary mate-rial). Biochars made using hydrothermal carbonization, fastpyrolysis and gasification clustered in the regions shown, on theother hand, slow pyrolysis biochars were highly scattered indicat-ing no clear clustering (Fig. S2, Supplementary material). However,
olatile organic compounds on biochar. Chemosphere (2011), doi:10.1016/

Fig. 4. Illustration of trends in relative peak areas for (A) toluene, (B) benzene, (C) ethylene-acetylene, (D) methane, (E) ethanol, (F) pentanal, (G) 2-pentylfuran, and (H)pyridine detected in cottonseed hull biochars as a function of pyrolysis temperature.
K.A. Spokas et al. / Chemosphere xxx (2011) xxx–xxx 9
these relationships could also be an artifact of our uneven samplesize of production techniques, with 46 biochars from slow pyroly-sis and only 3 biochars from fast pyrolysis, 4 from hydrothermal
Please cite this article in press as: Spokas, K.A., et al. Qualitative analysis of vj.chemosphere.2011.06.108
carbonization, and 11 from gasification methods (Table 1). Inaddition, since thermal desorption only analyzed those compoundsthat were volatilized and not the total sorbed organic
olatile organic compounds on biochar. Chemosphere (2011), doi:10.1016/

Table 3Frequency of detection of various compounds sorbed to biochars by TCD-FID analyses.
Compound % of biochars containing
Carbon dioxide 100Methane 100Ethylene/acetylenea 97Ethane 95Propylene 99Propane 95Butane 93Methanol 81Ethanol 100
a Ethylene and acetylene co-elute on the packed Porapak Q column.
10 K.A. Spokas et al. / Chemosphere xxx (2011) xxx–xxx
concentrations, further elucidation of chemical relationship withthe production styles needs to wait for the total sorbed concentra-tions to be known.
These results are in agreement with past literature on identifiedcompounds present in wood smoke (gases) and wood vinegars(liquids) (Asita and Campbell, 1990; Guillén and Manzanos,2002; Olsson et al., 2004; Blake et al., 2009; Estrellan and Iino,2010; Mun and Ku, 2010). Woody materials have low ash contents(<1%) and contain variable amounts of other organic compounds,e.g., terpenes, phenols, quinones, and tannins (Umezawa and Hig-uchi, 1991). The VOCs desorbed from non-charred wood samplestypically contain acetaldehyde, methanol, 2-pentylfuran, aceticacid and hexanal for deciduous trees and a-pinene, 3-carene, hex-anal, and other terpenes for confier species as the major compo-nents (Risholm-Sundman et al., 1998). Some of these compoundswere still observed in the wood biochar (Table 2).
The observed pyrolysis temperature dependence in desorbedVOCs (Figs. 3 and 4) was in agreement with the greatest changesin VM content (Table 1), BET surface area (Keiluweit et al., 2010),aromatic peaks using solid-state 13C NMR (Sharma et al., 2002),and Fourier transform infrared (FTIR) spectra (Uchimiya et al.,2011) of various plant-derived slow pyrolysis biochars producedat 300–500 �C. It should be noted that the lighter weight volatiles(C1–C4) were more frequently observed than heavier VOC com-pounds using GC/MS. For instance, acetone was the most prevalentVOC identified by GC/MS, which only had a 67% frequency com-pared to over 80% detection frequencies for the lighter weightcompounds by TCD/FID (Tables 2 and 3). The atmospheric air andwater vapor peaks from the biochar headspace gas sample
Table 2Frequency of detection of VOCs sorbed to various biochars by GC/MS.
Compound % of biochars containing
Acetone 67Benzene 65Methyl ethyl ketone 60Toluene 60Methyl acetate 52Propanal 50Octanal 482,3 butanedione 45Pentanal 453-Methyl-butanal 43Ethylbenzene 431-Dodecane 42Tetrachloroethene 40Butanal 39Cyclo pentanone 38Furan 37Heptanal 372-Pentanone 35Hexanal 35Hexane 34Benzaldehyde 341,2,3-Trimethylbenzene 34Methyl propanal 31Hexene 31Carbon disulfide 302-Hexanone 5-methyl 28Trichloroethene 27Furfural 271 Methylethyl benzene 262-Propenal 252-Heptanone 252-Methyl-2-cyclopenten-1-one 222 Methyl furan 20Naphthalene 20Styrene 18Pentane 2-methyl 171,2 Dimethylbenzene 17Siloxanes (unidentified) 17
Please cite this article in press as: Spokas, K.A., et al. Qualitative analysis of vj.chemosphere.2011.06.108
interfered with the detection of these earlier eluding VOC peakson the GC/MS.
Elemental composition of the feedstock appeared to influencesome of the VOC species identified in our biochar sample pool.The relatively high chlorine content of agricultural biomass lowersburn efficiencies by forming scales and causing other corrosion is-sues in gasifiers (Hansen et al., 1998; Spliethoff and Hein, 1998).Obernberger et al. (2006) attributed these corrosion problems tothe high concentrations of chlorine, nitrogen, and sulfur in straws,cereals, grasses, grains and fruit residues relative to other biomasssources. Furthermore, Vierle et al. (1999) observed chlorinatedVOCs from burning biomass derived pellets. The variable chlorinelevels in biomass sources could explain the presence of some chlo-rinated species sorbed to the biochars analyzed in this study (Ta-ble 2). However, there was no clear feedstock type dependence
Compound % of biochars containing
1,4 Dimethyl benzene 171,3 Dimethyl benzene 17Cyclohexane 163 Pentanone 142-Hexenal 12Ethanol 112 Methoxy 2 methyl propane 11Dichloromethane 10Carbon tetrachloride 92-Butanol 7Methylcyclohexane 71,2 Dichloroethene (z) 61,2,4 Trichlorobenzene 51,2,3-Trichlorobenzene 41,1 Dichloroethane 3Trichloromethane 31,2-Dibromo 3-chloropropane 31,1,2 Trichloro 1,2,2 –trifluoro ethane 21,1 Dichloroethene 2ethyl Acetate 2Trimethyl ester boric acid 2Trans 1,2 dichloroethene 21,1,1 Trichloroethane 21,2 Dichloroethane 21,2 Dichloropropane 2Bromodichloromethane 21,3 Dichloropropene (z) 21,3 Dichloropropene (e) 21,1,2 Trichloroethane 2Dibromochlormethane 21,2 Dibromoethane 2Chlorobenzene 2Tribromomethane 21,1,2,2-Tetrachloroethane 21,3-Dichlorobenzene 21,4-Dichlorobenzene 21,2-Dichlorobenzene 2
olatile organic compounds on biochar. Chemosphere (2011), doi:10.1016/

K.A. Spokas et al. / Chemosphere xxx (2011) xxx–xxx 11
on detectable chlorinated species, e.g., tetrachlorethylene was ob-served in a variety of feedstocks including hardwood, manure, cornstover, pine, and macadamia nut shells across a variety of pyrolysistypes and conditions (Table 2). Plants in the Cyperaceae (e.g.,switch grass) and Poaceae (e.g., sugarcane) families are known topossess relatively high amounts of silica in their plant tissues(Hodson and Evans, 1995), which correspondingly could be thesource for the unidentified siloxane compounds in the switch grassand sugar cane biochars. Sulfur contents of feedstock and pyrolysisproducts are similar, often at lower concentrations in biomassfeedstocks (Di Blasi et al., 1999). Other studies on pyrolysis oilsand gases have observed various nitrogen compounds (ammonia,aliphatic amines; pyridine; aniline; pyrroles; indoles; quinolinesand benzothiazoles), which were predominately observed fromfeedstocks with high nitrogen contents (Mirmiran et al., 1992;Hansson et al., 2004). However, the chemical complexity of theresulting isomers and possible ring substitutions from biomass re-quire improvements in the mass spectral database and up-frontanalytical separation to improve compound identification (Overtonand Manura, 1995; McLafferty et al., 1999).
The elevated sorbed volatiles on HTC biochar could potentiallybe due to contact with the liquid phase, which includes productsof hydrolysis during biochar production (Kruse and Gawlik, 2002;Funke and Ziegler, 2010). This condition could result in higher con-centrations of sorbed volatiles, unless the biochar is washed orotherwise post-processed (Hoekman et al., in press; Libra et al.,2011). For instance, if biochar was activated (i.e., steam, acid, orbase chemical activation) (Lima and Marshall, 2005; Langley andFairbrother, 2007), this process removed sorbed surface volatiles,and a corresponding increase in the effective surface area was typ-ically observed (Azargohar and Dalai, 2006, 2008). Bernardo et al.(2010) observed over a 2–3 order reduction in the concentrationof various organic compounds in leachates from chars followingdichloromethane rinsing. This was also seen in the activated car-bons possessing lowest total sorbed VOCs of the suite of biocharsanalyzed here (Figs. S1–S2, Supplementary material). This condi-tion implied that the elapsed time from production and post-pro-duction processing of the biochar would impact the distributionof sorbed volatiles. Thereby, one can conceptualize how differentconcentrations can be sorbed to the biochar as a function of thepyrolysis conditions as well as the cooling rate of the biochar,and whether it was in contact with the pyrolysis gases or liquids,water, and oxygen during cooling. Our results have shown thatpost-production processing reduced the amount of sorbed VOCson biochar (Fig. S1, Supplementary material).
Despite individual compound differences, the overall trendassociated with an increase in pyrolysis temperature within thesame unit was a net decrease in total sorbed VOCs with an increas-ing proportion of aromatic compounds (Fig. 3). These temperaturerelationships were not observed when biochar was sampled acrossdifferent pyrolysis units, despite the similarities in design and pro-duction parameters (Fig. 2). The lack of clear relationships withproduction temperature and feedstock indicated that the produc-tion method and post production handling and storage of the bio-char could be dominant factors controlling the variability in thesorbed VOC profile. In this study, not only were differences ob-served as a function of pyrolysis unit, feedstock, and temperature;but there were also differences imposed by the post-productionprocessing (activation) of the biochar (Fig. S1, Supplementarymaterial).
Lastly, biochars that possessed the lowest levels of sorbed vola-tiles were produced under partial aerobic conditions (i.e., hog fuelboilers, fire pits or soil kilns; pyrolysis processes without an inertgas purge or temperature regulation) or that underwent secondaryactivation (treatments). Incidentally, wood ash from aerobic gasifi-ers has been shown to be low in sorbed VOC content (Someshwar,
Please cite this article in press as: Spokas, K.A., et al. Qualitative analysis of vj.chemosphere.2011.06.108
1996). These data suggested that the presence of oxygen during thepyrolysis reaction reduced the amounts of sorbed volatiles, poten-tially through oxidation or allowing more complete combustion(Jenkins et al., 1998; Simoneit, 2002), which could be a desired bio-char characteristic for soil fertility improvements (Brewer et al., inpress). However, a surplus of oxygen during pyrolysis results ingasification, producing a low carbon and high ash residual (Table 1),which is not optimal for C sequestration.
4.2. Sorbed VOC implications
Historically, both positive and negative effects on plant andmicrobial systems of soil applied charcoal have been attributedto specific compounds entrained within or emitted from the char-coal (Vantsis and Bond, 1950; Nutman, 1952; Turner, 1955). Ben-zene and ethylene are the dominate products of oxidativepyrolysis during glowing combustion of charcoal (Olsson et al.,2003, 2004) and can inhibit microbial responses in soils (Smith,1976; Prosen et al., 1993; Nunes-Halldorson et al., 2004).
Methoxyphenols and phenols have been observed as a productof pyrolysis of hemicelluloses and lignin (Faix et al., 1991;McDonald et al., 2000; Lingens et al., 2005). These compounds,along with carboxylic acids, ketones, and furans are also knownmicrobial inhibitors (Klinke et al., 2004; Mu et al., 2006; Munand Ku, 2010). Moreover, these compounds even possess nemati-cidal qualities (Ali et al., 2002). The presence of these inhibitorycompounds on biochar could be optimized for pathogenic control(Graber et al., 2010).
In addition to suppressing microbial activity, polyphenols havebeen observed to shift the dominant pathway of N-cycling frommineral to organic N-forms (Palm and Sanchez, 1990; Northupet al., 1998; Tian et al., 2001). These microbial responses are al-ready known to vary as a function of ecosystem (Shneour, 1966;Spokas and Reicosky, 2009). Additionally, polyphenols are knownto be effective in repelling other soil fauna and anthropods (Botti-mer, 1929). Therefore, given the fact that some of the biochar ana-lyzed here possess these components (Table 2), these VOCsreleased from biochar could trigger an array of microbial, animal,and plant responses (Ryu et al., 2003). Incidentally, a possibleexplanation for the historical observations of biochar losing itsagronomic benefit with storage could be if these beneficial VOCswere lost with time following production (e.g., Lefroy, 1883). Moreimportantly, we corroborate that sorbed VOCs can be removedfrom biochar by further post-production treatment, such as chem-ical, thermal, or microbial (composting). The conditions and dura-tion of these post-production treatments still require investigation.
Biochars will sorb not only pyrolysis gases generated duringproduction (Olsson et al., 2003, 2004; Chouchene et al., 2010;Mun and Ku, 2010; Song and Peng, 2010), but they could also ab-sorb other volatile compounds directly from the environment(Masclet et al., 1987). These sorbed volatiles could influence sorp-tion behavior of other inorganic species (Uchimiya et al., 2011) aswell as organic contaminants such as naphthalene, nitrobenzenene(Cheng et al., 2008), and benzene (Chun et al., 2004) possessingstructural similarity to VOCs and other volatile components ofbiochars.
Since the analysis here was solely volatile headspace gases,semi-volatile compounds were not adequately assessed (Wei andJen, 2003). However, the observation of naphthalene in 20% ofthe biochars evaluated here does confirm polyaromatic hydrocar-bon presence on some biochars, as reported by others (e.g., Rey-Salgueiro et al., 2004; Rumpel et al., 2007). However, the frequencyand potential impacts of these polyaromatic compounds requireadditional studies, with particular attention devoted to the quanti-fication of all sorbed compounds.
olatile organic compounds on biochar. Chemosphere (2011), doi:10.1016/
12 K.A. Spokas et al. / Chemosphere xxx (2011) xxx–xxx
5. Conclusions
The diverse range of sorbed VOCs moieties between individualbiochars could be partially responsible for the noted variance insoil and plant responses after biochar additions. Differences inthe chemical composition of the sorbed VOCs from the same pyro-lysis type, temperature, and feedstock suggested that even bioch-ars created under similar pyrolysis conditions and equivalentfeedstocks can result in biochars with sorbed VOCs that are chem-ically diverse. Clear influences of production conditions, especiallythe presence of O2, pyrolysis temperature, post-production condi-tions and activation were observed, but with very little consistenteffect of feedstock. The post-production handling of the biocharcontrols the quantities of sorbed volatiles that remain on the bio-char, with further thermal and chemical processing virtuallyremoving all sorbed VOCs. Variability in the sorbed VOC profilescould be linked to other structural features of biochar, but thesewere not examined here. The complexity and distribution of VOCson biochar still warrants supplementary investigation, which willrequire further analytical method improvements, in order to ade-quately compare biochar impacts across various studies. However,these results indicated that the VOC composition of biochar con-tained within this study have been linked by others with bothstimulative or inhibitive effects in plant and microbial systems. Itis important that the presence of individual VOC compounds andthe combined effects of these compounds be elucidated becausetheir presence may cause diverse responses from biochar additionsto soils or other growth media.
Acknowledgments
The authors would like to acknowledge the exceptional labora-tory work conducted by Eric Nooker, Tia Phan, Amanda Bidwell,Lindsay Watson and Lianne Endo. The authors would also like toacknowledge the partial funding from the Minnesota Departmentof Agriculture Specialty Block Grant program and the MinnesotaCorn Growers Association/Minnesota Corn Research ProductionCouncil. Furthermore, the authors would like to express their grat-itude to the companies that produced the various biochars used inthis research, that included Dyanamotive, EPIRDA (Earth, People,Research, Innovation, Development, and Acknowledgment),Best Energies, Pacific Pyrolysis, University of Minnesota, AvelloBioenergy Inc., Northern Tilth, Willinger Brothers, Chip Energy,Cowboy Charcoal, Illinois Sustainability and Technology Center,Siemens, Harsco Technology Corporation, Alterna Bioenergy, Uni-versity of Georgia, the National Council of Air and Stream Improve-ment (NCASI), Justus-Liebig-University Giessen (Dr. ClaudiaKammann), and Acatech – German Academy of Science and Engi-neering (Dr. Judy Libra). This research is part of the USDA-ARS Bio-char and Pyrolysis Initiative and USDA-ARS GRACEnet (GreenhouseGas Reduction through Agricultural Carbon EnhancementNetwork) programs.
Appendix A. Supplementary material
Supplementary data associated with this article can be found, inthe online version, at doi:10.1016/j.chemosphere.2011.06.108.
References
Ali, N.I., Siddiqui, I.A., Shahid Shaukat, S., Zaki, M.J., 2002. Nematicidal activity ofsome strains of Pseudomonas spp.. Soil Biol. Biochem. 34, 1051–1058.
Almeida, J., Bertilsson, M., Gorwa-Grauslund, M., Gorsich, S., Lidén, G., 2009.Metabolic effects of furaldehydes and impacts on biotechnological processes.Appl. Microbiol. Biotechnol. 82, 625–638.
Asita, A.O., Campbell, I.A., 1990. Anti-microbial activity of smoke from differentwoods. Lett. Appl. Microbiol. 10, 93–95.
Please cite this article in press as: Spokas, K.A., et al. Qualitative analysis of vj.chemosphere.2011.06.108
Azargohar, R., Dalai, A.K., 2006. Biochar as a precursor of activated carbon. Appl.Biochem. Biotechnol. 131, 762–773.
Azargohar, R., Dalai, A.K., 2008. Steam and KOH activation of biochar: experimentaland modeling studies. Microporous Mesoporous Mater. 110, 413–421.
Baldwin, I.T., Halitschke, R., Paschold, A., von Dahl, C.C., Preston, C.A., 2006. Volatilesignaling in plant-plant interactions: ‘‘Talking trees’’ in the genomics era.Science 311, 812–815.
Bernardo, M., Lapa, N., Gonçalves, M., Barbosa, R., Mendes, B., Pinto, F., Gulyurtlu, I.,2010. Toxicity of char residues produced in the co-pyrolysis of different wastes.Waste Manage. 30, 628–635.
Bicchi, C., Cordero, C., Liberto, E., Sgorbini, B., Rubiolo, P., 2008. Headspace samplingof the volatile fraction of vegetable matrices. J. Chromatogr. 1184, 220–233.
Blake, D., Hinwood, A.L., Horwitz, P., 2009. Peat fires and air quality: volatile organiccompounds and particulates. Chemosphere 76, 419–423.
Boateng, A.A., Daugaard, D.E., Goldberg, N.M., Hicks, K.B., 2007. Bench-scalefluidized-bed pyrolysis of switchgrass for bio-oil production. Ind. Eng. Chem.Res. 46, 1891–1897.
Boateng, A.A., Mullen, C.A., Goldberg, N.M., 2010. Producing stable pyrolysis liquidsfrom the oil-seed presscakes of mustard family plants: pennycress (Thlaspiarvense L.) and Camelina (Camelina sativa). Energy Fuels 24, 6624–6632.
Boehm, H.P., 1994. Some aspects of the surface chemistry of carbon blacks andother carbons. Carbon 32, 759–769.
Bottimer, L.J., 1929. Notes on paradichlorobenzene and naphthalene as repellentsagainst clothes moth larvae. J. Econ. Entomol. 22, 570–573.
Brewer, C.E., Unger, R., Schmidt-Rohr, K., Brown, R.C., 2011. Selection of biochars fora field study based on biochar properties and selected short-term soil effects.Bioenergy Res.
Bridgwater, A.V., Meier, D., Radlein, D., 1999. An overview of fast pyrolysis ofbiomass. Org. Geochem. 30, 1479–1493.
Brunauer, S., Emmett, P.H., Teller, E., 1938. Adsorption of gases in multimolecularlayers. J. Am. Chem. Soc. 60, 309–319.
Candole, B.L., Csinos, A.S., Wang, D., 2007. Distribution and efficacy of drip-appliedmetam-sodium against the survival of Rhizoctonia solani and yellow nutsedge inplastic-mulched sandy soil beds. Pest Manage. Sci. 63, 468–475.
Canela, A.M., Muehleisen, H., 1986. Application of headspace gas chromatography tothe measurement of organic emissions. J. Chromatogr. 456, 241–249.
Cao, X., Ro, K.S., Chappell, M., Li, Y., Mao, J., 2011. Chemical structures of swine-manure chars produced under different carbonization conditions investigatedby advanced solid-state 13C nuclear magnetic resonance (NMR) spectroscopy.Energy Fuels 25, 388–397.
Chen, J.H., Ho, C.T., 1998. Volatile compounds formed from thermal degradation ofglucosamine in a dry system. J. Agric. Food Chem. 46, 1971–1974.
Cheng, C.H., Lehmann, J., Engelhard, M.H., 2008. Natural oxidation of black carbon insoils: changes in molecular form and surface charge along a climosequence.Geochim. Cosmochim. Acta 72, 1598–1610.
Chouchene, A., Jeguirim, M., Khiari, B., Trouvé, G., Zagrouba, F., 2010. Study on theemission mechanism during devolatilization/char oxidation and directoxidation of olive solid waste in a fixed bed reactor. J. Anal. Appl. Pyrolysis87, 168–174.
Chun, Y., Sheng, G.Y., Chiou, C.T., Xing, B.S., 2004. Compositions and sorptiveproperties of crop residue-derived chars. Environ. Sci. Technol. 38, 4649–4655.
Clough, T.J., Bertram, J.E., Ray, J.L., Condron, L.M., O’Callaghan, M., Sherlock, R.R.,Wells, N.S., 2010. Unweathered wood biochar impact on nitrous oxideemissions from a bovine-urine-amended pasture soil. Soil Sci. Soc. Am. J. 74,852–860.
Deenik, J.L., McClellan, T., Uehara, G., Antal, M.J., Campbell, S., 2010. Charcoalvolatile matter content influences plant growth and soil nitrogentransformations. Soil Sci. Soc. Am. J. 74, 1259–1270.
Demirbas, A., 2000. Mechanisms of liquefaction and pyrolysis reactions of biomass.Energy Convers. Manage. 41, 633–646.
Di Blasi, C., Signorelli, G., Di Russo, C., Rea, G., 1999. Product distribution frompyrolysis of wood and agricultural residues. Ind. Eng. Chem. Res. 38, 2216–2224.
Estrellan, C.R., Iino, F., 2010. Toxic emissions from open burning. Chemosphere 80,193–207.
Etiégni, L., Campbell, A.G., 1991. Physical and chemical characteristics of wood ash.Bioresour. Technol. 37, 173–178.
Faix, O., Fortmann, I., Bremer, J., Meier, D., 1991. Thermal degradation products ofwood. Eur. J. Wood Wood Prod. 49, 213–219.
Free, H.F., McGill, C.R., Rowarth, J.S., Hedley, M.J., 2010. The effect of biochars onmaize (Zea mays) germination. N. Z. J. Agric. Res. 53, 1–4.
Friant, S.L., Suffet, I.H., 1979. Interactive effects of temperature, salt concentration,and pH on headspace analysis for isolating volatile trace organics in aqueousenvironmental samples. Anal. Chem. 51, 2167–2172.
Funke, A., Ziegler, F., 2010. Hydrothermal carbonization of biomass: a summary anddiscussion of chemical mechanisms for process engineering. Biofuel. Bioprod.Bior. 4, 160–177.
Galipo, R.C., Egan, W.J., Aust, J.F., Myrick, M.L., Morgan, S.L., 1998. Pyrolysis gaschromatography/mass spectrometry investigation of a thermally curedpolymer. J. Anal. Appl. Pyrolysis 45, 23–40.
Gan, J., Yates, S.R., Spencer, W.F., Yates, M.V., 1994. Automated headspace analysisof fumigants 1,3-dichloropropene and methyl isothiocyanate on charcoalsampling tubes. J. Chromatogr. 684, 121–131.
Graber, E., Meller Harel, Y., Kolton, M., Cytryn, E., Silber, A., Rav David, D.,Tsechansky, L., Borenshtein, M., Elad, Y., 2010. Biochar impact on developmentand productivity of pepper and tomato grown in fertigated soilless media. PlantSoil 337, 481–496.
olatile organic compounds on biochar. Chemosphere (2011), doi:10.1016/

K.A. Spokas et al. / Chemosphere xxx (2011) xxx–xxx 13
Gray, M.R., Corcoran, W.H., Gavalas, G.R., 1985. Pyrolysis of a wood-derived material.Effects of moisture and ash content. Ind. Eng. Chem. Proc. D.D. 24, 646–651.
Guillén, M.D., Manzanos, M.J., 2002. Study of the volatile composition of an aqueousoak smoke preparation. Food Chem. 79, 283–292.
Hansen, P.F.B., Andersen, K.H., Wieck-Hansen, K., Overgaard, P., Rasmussen, I.,Frandsen, F.J., Hansen, L.A., Dam-Johansen, K., 1998. Co-firing straw and coal ina 150-MWe utility boiler: in situ measurements. Fuel Process. Technol. 54, 207–225.
Hansson, K.-M., Samuelsson, J., Tullin, C., Åmand, L.-E., 2004. Formation of HNCO,HCN, and NH3 from the pyrolysis of bark and nitrogen-containing modelcompounds. Combust. Flame 137, 265–277.
Hodson, M.J., Evans, D.E., 1995. Aluminium/silicon interactions in higher plants. J.Exp. Bot. 46, 161–171.
Hoekman, S.K., Broch, A., Robbins, C., 2011. Hydrothermal carbonization (HTC) oflignocellulosic biomass. Energ. Fuel 25, 802–1810.
Insam, H., Seewald, M., 2010. Volatile organic compounds (VOCs) in soils. Biol. Fert.Soils 46, 199–213.
Ippolito, J.A., Novak, J.M., Strawn, D.G., Scheckel, K.G., Ahmedna, M., Niandou, M.A.S.,2011. Immobilization of copper by KOH-steam activated pecan shell biochar. J.Environ. Qual.
Jenkins, B.M., Baxter, L.L., Miles, T.R., 1998. Combustion properties of biomass. FuelProcess. Technol. 54, 17–46.
Kaal, J., Rumpel, C., 2009. Can pyrolysis-GC/MS be used to estimate the degree ofthermal alteration of black carbon? Org. Geochem. 40, 1179–1187.
Kaal, J., Brodowski, S., Baldock, J.A., Nierop, K.G.J., Cortizas, A.M., 2008.Characterisation of aged black carbon using pyrolysis-GC/MS, thermallyassisted hydrolysis and methylation (THM), direct and cross-polarisation C-13nuclear magnetic resonance (DP/CP NMR) and the benzenepolycarboxylic acid(BPCA) method. Org. Geochem. 39, 1415–1426.
Kadota, M., Niimi, Y., 2004. Effects of charcoal with pyroligneous acid and barnyardmanure on bedding plants. Sci. Hortic.-Amsterdam 101, 327–332.
Keiluweit, M., Nico, P.S., Johnson, M.G., Kleber, M., 2010. Dynamic molecularstructure of plant biomass-derived black carbon (biochar). Environ. Sci. Technol.44, 1247–1253.
Khodadad, C.L.M., Zimmerman, A.R., Green, S.J., Uthandi, S., Foster, J.S., 2011. Taxa-specific changes in soil microbial community composition induced bypyrogenic carbon amendments. Soil Biol. Biochem. 43, 385–392.
Klinke, H.B., Thomsen, A.B., Ahring, B.K., 2004. Inhibition of ethanol-producing yeastand bacteria by degradation products produced during pre-treatment ofbiomass. Appl. Microbiol. Biotechnol. 66, 10–26.
Kloepper, J.W., Ryu, C.-M., Zhang, S., 2004. Induced systemic resistance andpromotion of plant growth by Bacillus spp.. Phytopathology 94, 1259–1266.
Kolb, B., Ettre, L.S., 1997. Static Headspace-Gas Chromatography: Theory andPractice. Wiley, New York, NY.
Kruse, A., Gawlik, A., 2002. Biomass conversion in water at 330�410 �C and30�50 MPa. Identification of key compounds for indicating different chemicalreaction pathways. Ind. Eng. Chem. Res. 42, 267–279.
Kusch, P., Knupp, G., 2004. Headspace-SPME-GC–MS identification of volatile organiccompounds released from expanded polystyrene. J. Polym. Environ. 12, 83–87.
Laird, D.A., 2008. The charcoal vision: a win–win–win scenario for simultaneouslyproducing bioenergy, permanently sequestering carbon, while improving soiland water quality. Agron. J. 100, 178–181.
Langley, L.A., Fairbrother, D.H., 2007. Effect of wet chemical treatments on thedistribution of surface oxides on carbonaceous materials. Carbon 45, 47–54.
Lee, J.W., Kidder, M., Evans, B.R., Paik, S., Buchanan III, A.C., Garten, C.T., Brown, R.C.,2010. Characterization of biochars produced from cornstovers for soilamendment. Environ. Sci. Technol. 44, 7970–7974.
Lefroy, J.H., 1883. Remarks on the chemical analyses of samples of soil fromBermuda. Foreign and Commonwealth Office Collection. Royal Gazette,Hamilton. p. 42.
Lehmann, J., 2007. Bio-energy in the black. Front. Ecol. Environ. 5, 381–387.Libra, J.A., Ro, K.S., Kammann, C., Funke, A., Berge, N.D., Neubauer, Y., Titirici, M.-M.,
Fühner, C., Bens, O., Kern, J., Emmerich, K.-H., 2011. Hydrothermal carbonizationof biomass residuals: a comparative review of the chemistry, processes andapplications of wet and dry pyrolysis. Biofuels 2, 71–106.
Lima, I.M., Marshall, W.E., 2005. Adsorption of selected environmentally importantmetals by poultry manure-based granular activated carbons. J. Chem. Technol.Biotechnol. 80, 1054–1061.
Lingens, A., Windeisen, E., Wegener, G., 2005. Investigating the combustion behaviourof various wood species via their fire gases. Wood Sci. Technol. 39, 49–60.
Markelov, M., Bershevits, O.A., 2001. Methodologies of quantitative headspaceanalysis using vapor phase sweeping. Anal. Chim. Acta 432, 213–227.
Masclet, P., Bresson, M.A., Mouvier, G., 1987. Polycyclic aromatic hydrocarbonsemitted by power stations, and influence of combustion conditions. Fuel 66,556–562.
McCarty, G.W., Bremner, J.M., 1991. Inhibition of nitrification in soil by gaseoushydrocarbons. Biol. Fert. Soils 11, 231–233.
McDonald, J.D., Zielinska, B., Fujita, E.M., Sagebiel, J.C., Chow, J.C., Watson, J.G., 2000.Fine particle and gaseous emission rates from residential wood combustion.Environ. Sci. Technol. 34, 2080–2091.
McLafferty, F.W., Stauffer, D.A., Loh, S.Y., Wesdemiotis, C., 1999. Unknownidentification using reference mass spectra. Quality evaluation of databases. J.Am. Soc. Mass Spectrom. 10, 1229–1240.
Mirmiran, S., Pakdel, H., Roy, C., 1992. Characterization of used tire vacuumpyrolysis oil: nitrogenous compounds from the naphtha fraction. J. Anal. Appl.Pyrolysis 22, 205–215.
Please cite this article in press as: Spokas, K.A., et al. Qualitative analysis of vj.chemosphere.2011.06.108
Mohan, D., Pittman, C.U., Steele, P.H., 2006. Pyrolysis of wood/biomass for bio-oil: acritical review. Energy Fuels 20, 848–889.
Mu, J., Uehara, T., Furuno, T., 2004. Effect of bamboo vinegar on regulation ofgermination and radicle growth of seed plants II: composition of moso bamboovinegar at different collection temperature and its effects. J. Wood Sci. 50, 470–476.
Mu, J., Yu, Z.-m., Wu, W.-q., Wu, Q.-l., 2006. Preliminary study of application effectof bamboo vinegar on vegetable growth. Forest. Stud. China 8, 43–47.
Mullen, C.A., Boateng, A.A., Goldberg, N.M., Lima, I.M., Laird, D.A., Hicks, K.B., 2010.Bio-oil and bio-char production from corn cobs and stover by fast pyrolysis.Biomass Bioenergy 34, 67–74.
Mun, S., Ku, C., 2010. Pyrolysis GC–MS analysis of tars formed during the aging ofwood and bamboo crude vinegars. J. Wood Sci. 56, 47–52.
Northup, R.R., Dahlgren, R.A., McColl, J.G., van Breemen, N., 1998. Polyphenols asregulators of plant-litter-soil interactions in northern California’s pygmy forest:a positive feedback. Biogeochem. 42, 189–220.
Novak, J.M., Busscher, W.J., 2011. Selection and use of designer biochars to improvecharacteristics of Southeastern USA Coastal Plain degraded soils, In: Lee, J.W.(Ed.), Advanced Biofuels & Bioproducts. Springer, New York, NY.
Novak, J.M., Lima, I., Xing, B., Gaskin, J.W., Steiner, C., Das, K.C., Ahmedna, M.,Rehrah, D., Watts, D.W., Busscher, W.J., Schomberg, H., 2009. Characterization ofdesigner biochar produced at different temperatures and their effects on aloamy sand. Ann. Environ. Sci. 3, 195–206.
Novotny, M., Lee, M., Bartle, K., 1974. Some analytical aspects of thechromatographic headspace concentration method using a porous polymer.Chromatographia 7, 333–338.
Nunes-Halldorson, V.d.S., Steiner, R.L., Smith, G.B., 2004. Residual toxicity afterbiodegradation: interactions among benzene, toluene, and chloroform.Ecotoxicol. Environ. Saf. 57, 162–167.
Nutman, P.S., 1952. Host factors influencing infection and nodule development inleguminous plants. Proc. Roy. Soc. B – Biol. Sci. 139, 176–185.
Obernberger, I., Brunner, T., Bärnthaler, G., 2006. Chemical properties of solidbiofuels – significance and impact. Biomass Bioenergy 30, 973–982.
Olsson, M., Kjällstrand, J., Petersson, G., 2003. Oxidative pyrolysis of integralsoftwood pellets. J. Anal. Appl. Pyrol. 67, 135–141.
Olsson, M., Ramnäs, O., Petersson, G., 2004. Specific volatile hydrocarbons in smokefrom oxidative pyrolysis of softwood pellets. J. Anal. Appl. Pyrol. 71, 847–854.
Orihashi, K., Kojima, Y., Terazawa, M., 2001. Deterrent effect of rosin and wood taragainst barking by the gray-sided vole (Clethrionomys rufocanus bedfordiae). J.For. Reds.-Jpn. 6, 191–196.
Overton, S.V., Manura, J.J., 1995. Analysis of volatile organics in cooking oils bythermal desorption gas chromatography-mass spectrometry. J. Agric. FoodChem. 43, 1314–1320.
Palm, C.A., Sanchez, P.A., 1990. Decomposition and nutrient release patterns of theleaves of three topical legumes. Biotropica 22, 330–338.
Penton, Z., 1992. Optimization of conditions in static headspace GC. J. High Resolut.Chromatogr. 15, 834–836.
Prosen, E.M., Radlein, D., Piskorz, J., Scott, D.S., Legge, R.L., 1993. Microbialutilization of levoglucosan in wood pyrolysate as a carbon and energy source.Biotechnol. Bioeng. 42, 538–541.
Raguso, R.A., Pellmyr, O., 1998. Dynamic headspace analysis of floral volatiles: acomparison of methods. Oikos 81, 238–254.
Rey-Salgueiro, L., García-Falcón, M.S., Soto-González, B., Simal-Gándara, J., 2004.Procedure to measure the level of polycyclic aromatic hydrocarbons in woodashes used as fertilizer in agroforestry soils and their transfer from ashes towater. J. Agric. Food Chem. 52, 3900–3904.
Risholm-Sundman, M., Lundgren, M., Vestin, E., Herder, P., 1998. Emissions of aceticacid and other volatile organic compounds from different species of solid wood.Eur. J. Wood Wood Prod. 56, 125–129.
Rumpel, C., González-Pérez, J.A., Bardoux, G., Largeau, C., Gonzalez-Vila, F.J.,Valentin, C., 2007. Composition and reactivity of morphologically distinctcharred materials left after slash-and-burn practices in agricultural tropicalsoils. Org. Geochem. 38, 911–920.
Ryu, C.-M., Farag, M.A., Hu, C.-H., Reddy, M.S., Wei, H.-X., Paré, P.W., Kloepper, J.W.,2003. Bacterial volatiles promote growth in Arabidopsis. Proc. Natl. Acad. Sci.USA 100, 4927–4932.
Sharma, R.K., Wooten, J.B., Baliga, V.L., Martoglio-Smith, P.A., Hajaligol, M.R., 2002.Characterization of char from the pyrolysis of tobacco. J. Agric. Food Chem. 50,771–783.
Shneour, E.A., 1966. Oxidation of graphitic carbon in certain soils. Science 151, 991–992.
Shuping, Z., Yulong, W., Mingde, Y., Kaleem, I., Chun, L., Tong, J., 2010. Productionand characterization of bio-oil from hydrothermal liquefaction of microalgaeDunaliella tertiolecta cake. Energy 35, 5406–5411.
Simms, E.L., Rausher, M.D., 1987. Costs and benefits of plant resistance to herbivory.Am. Nat. 130, 570–581.
Simoneit, B.R.T., 2002. Biomass burning – a review of organic tracers for smoke fromincomplete combustion. Appl. Geochem. 17, 129–162.
Smith, A.M., 1976. Ethylene in soil biology. Annu. Rev. Phytopathol. 14, 53–73.Someshwar, A.V., 1996. Wood and combination wood-fired boiler ash
characterization. J. Environ. Qual. 25, 962–972.Song, J.Z., Peng, P.A., 2010. Characterisation of black carbon materials by
pyrolysis-gas chromatography–mass spectrometry. J. Anal. Appl. Pyrol. 87,129–137.
Spliethoff, H., Hein, K.R.G., 1998. Effect of co-combustion of biomass on emissions inpulverized fuel furnaces. Fuel Process. Technol. 54, 189–205.
olatile organic compounds on biochar. Chemosphere (2011), doi:10.1016/

14 K.A. Spokas et al. / Chemosphere xxx (2011) xxx–xxx
Spokas, K.A., 2010. Review of the stability of biochar in soils: predictability of O:Cmolar ratios. Carbon Manage. 1, 289–303.
Spokas, K., Reicosky, D., 2009. Impacts of sixteen different biochars on soilgreenhouse gas production. Ann. Environ. Sci. 3, 179–193.
Tian, G., Salako, F.K., Ishida, F., 2001. Replenishment of C, N, and P in a degradedAlfisol under humid tropical conditions: effect of fallow species and litterpolyphenols. Soil Sci. 166, 614–621.
Tiilikkala, K., Fagernäs, L., Tiilikkala, J., 2010. History and use of wood pyrolysisliquids as biocide and plant protection product. Open Agric. J. 4, 111–118.
Turner, E.R., 1955. The effect of certain adsorbents on the nodulation of cloverplants. Ann. Bot. 19, 149–160.
Uchimiya, M., Wartelle, L.H., Klasson, K.T., Fortier, C.A., Lima, I.M., 2011. Influence ofpyrolysis temperature on biochar property and function as a heavy metalsorbent in soil. J. Agric. Food Chem. 59, 2501–2510.
Umezawa, T., Higuchi, T., 1991. Chemistry of lignin degradation by ligninperoxidases. In: Leatham, G.F., Himmel, M.E. (Eds.), Enzymes in BiomassConversion. American Chemical Society, New York, pp. 236–246.
Vantsis, J.T., Bond, G., 1950. The effect of charcoal on the growth of leguminousplants in sand culture. Ann. Appl. Biol. 37, 159–168.
Vierle, O., Launhardt, T., Strehler, A., Dumler-Gradl, R., Thoma, H., Schreiner, M.,1999. Investigation of organic pollutants from house heating systems usingbiogenic fuels and correlations with other exhaust gas components. Anal. Chem.Acta 393, 131–140.
Please cite this article in press as: Spokas, K.A., et al. Qualitative analysis of vj.chemosphere.2011.06.108
Wan, Y., Chen, P., Zhang, B., Yang, C., Liu, Y., Lin, X., Ruan, R., 2009. Microwave-assisted pyrolysis of biomass: catalysts to improve product selectivity. J. Anal.Appl. Pyrol. 86, 161–167.
Wei, M.-C., Jen, J.-F., 2003. Determination of chlorophenols in soil samples bymicrowave-assisted extraction coupled to headspace solid-phasemicroextraction and gas chromatography-electron-capture detection. J.Chromatogr. 1012, 111–118.
Yao, F.X., Arbestain, M.C., Virgel, S., Blanco, F., Arostegui, J., Maciá-Agulló, J.A.,Macías, F., 2010. Simulated geochemical weathering of a mineral ash-richbiochar in a modified Soxhlet reactor. Chemosphere 80, 724–732.
Yatagai, M., Nishimoto, M., Hori, K., Ohira, T., Shibata, A., 2002. Termiticidal activityof wood vinegar, its components and their homologues. J. Wood Sci. 48, 338–342.
Yu, F., Deng, S., Chen, P., Liu, Y., Wan, Y., Olson, A., Kittelson, D., Ruan, R., 2007.Physical and chemical properties of bio-oils from microwave pyrolysis of cornstover. In: Mielenz, J.R., Klasson, K.T., Adney, W.S., McMillan, J.D. (Eds.), AppliedBiochemistry and Biotechnology. Humana Press, New York, NY, pp. 957–970.
Zeng, L., Qin, C., Wang, L., Li, W., 2011. Volatile compounds formed from thepyrolysis of chitosan. Carbohydr. Polym. 83, 1553–1557.
Zhang, H., Kim, M.-S., Krishnamachari, V., Payton, P., Sun, Y., Grimson, M., Farag, M.,Ryu, C.-M., Allen, R., Melo, I., Paré, P., 2007. Rhizobacterial volatile emissionsregulate auxin homeostasis and cell expansion in Arabidopsis. Planta 226, 839–851.
olatile organic compounds on biochar. Chemosphere (2011), doi:10.1016/