qualit y. service. v alue. - california water service · qualit y. service. v alue. ... sln 9 tabl...
TRANSCRIPT
™
Quality. Service. Value.®
Este informe contiene información muy importante sobre su agua potable. Tradúzcalo o hable con alguien que lo entienda bien.
2016 Water Quality Report
Salinas District Salinas

Welcome From the Manager
Your Water System Your Water System
Inside the Water Quality Laboratory
DWSAPP
2016 Test Results Fluoride
Water Hardness
Possible Contaminants
About Lead
Key Definitions
Water Quality Table
More Information Resources
Table of Contents
SL
N
WELCOMETABLE OF CONTENTS YOUR WATER 2016 RESULTS MORE INFO

™
At California Water Service (Cal Water), we are committed to providing our customers with a reliable supply of high-quality water, 24 hours per day, 7 days per week, 365 days per year. With that in mind, we strive to deliver quality, service, and value in everything we do. This rings especially true when it comes to your water quality, because protecting our customers’ health and safety is our highest priority.
Quality: We have rigorous safeguards in place to ensure the water we provide to you meets or surpasses increasingly stringent water quality standards. In California, we conducted 408,168 tests on 61,528 water samples for 326 constituents last year. We are pleased to confirm that, in 2016, we met every primary and secondary state and federal water quality standard.
Service: We work hard to make sure that this high-quality water supply is there any time customers turn on the tap. That means maintaining and upgrading the infrastructure to ensure it reliably moves water from the source to your tap. It also means having dedicated and skilled professionals here to assist you both with routine service needs and if there is ever an after-hours emergency. And, it means having robust conservation program with tools and rebates to help you use water efficiently – especially important since we live in a traditionally drier climate.
Value: While the costs to provide water service continues to increase across the country, we are working to ensure that our water stays affordable. We do this in part by investing in infrastructure that is built to last, maintaining it, and replacing equipment when it is nearing the end of its useful life. We also work to find cost-effective solutions to secure, test, treat, store, and deliver the water to you, all so that we can continue to serve you for less than a penny per gallon in nearly all of our service areas.
This annual water quality report shows any constituents that were detected in your water in 2016, and how your water compares to state and federal water quality standards. This report also provides information about the steps we take to protect your health and safety and answers questions you may have about your water quality.
If you have any questions or concerns, you can contact us by phone or email, online at www.calwater.com, or in person at our local Customer Center. For important water service announcements, please visit our web site or watch for information in your monthly bill, and be sure your contact information is up to date by visiting ccu.calwater.com.
Sincerely, Brenda Granillo, District Manager, Salinas DistrictSALINAS DISTRICT 254 COMMISSION STREET SALINAS, CA 93901-3737 (831) 757-3644
Welcome
SL
N
3
WELCOMETABLE OF CONTENTS YOUR WATER 2016 RESULTS MORE INFO
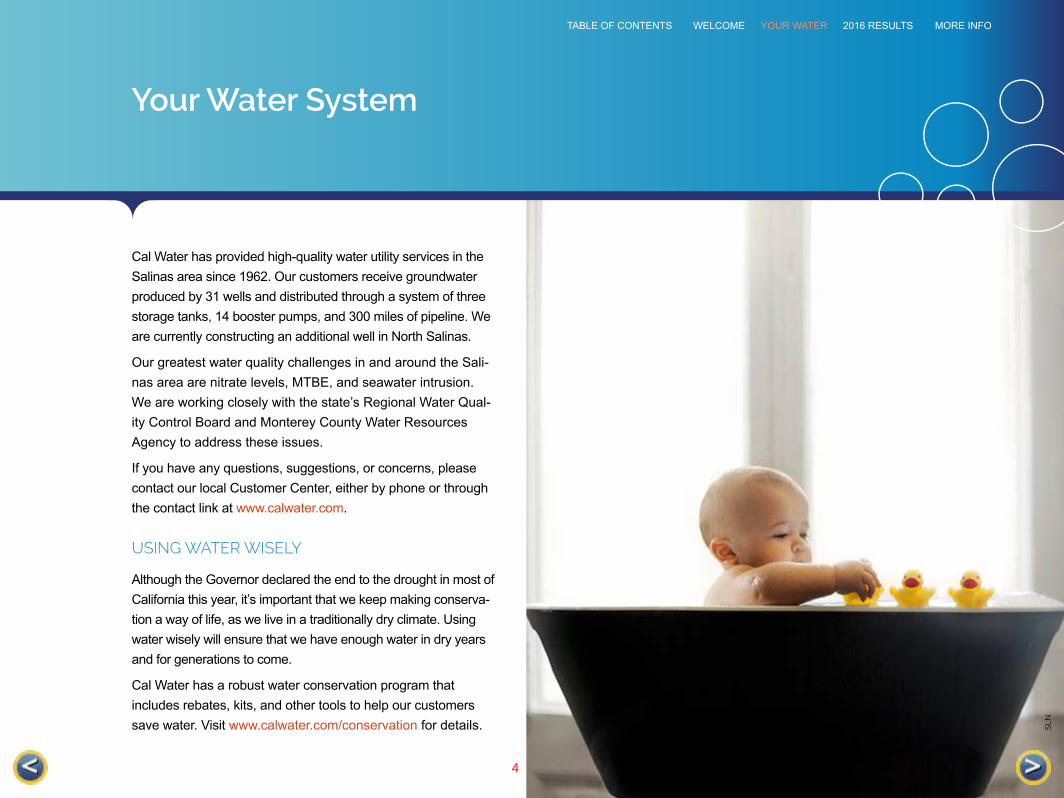
Cal Water has provided high-quality water utility services in the Salinas area since 1962. Our customers receive groundwater produced by 31 wells and distributed through a system of three storage tanks, 14 booster pumps, and 300 miles of pipeline. We are currently constructing an additional well in North Salinas.
Our greatest water quality challenges in and around the Sali-nas area are nitrate levels, MTBE, and seawater intrusion. We are working closely with the state’s Regional Water Qual-ity Control Board and Monterey County Water Resources Agency to address these issues.
If you have any questions, suggestions, or concerns, please contact our local Customer Center, either by phone or through the contact link at www.calwater.com.
USING WATER WISELY
Although the Governor declared the end to the drought in most of California this year, it’s important that we keep making conserva-tion a way of life, as we live in a traditionally dry climate. Using water wisely will ensure that we have enough water in dry years and for generations to come.
Cal Water has a robust water conservation program that includes rebates, kits, and other tools to help our customers save water. Visit www.calwater.com/conservation for details.
Your Water System
SL
N
4
WELCOMETABLE OF CONTENTS YOUR WATER 2016 RESULTS MORE INFO

Number of samples
collected
SAMPLED YEAR
2005 2006 2007 2008 2009 2010 2011 2012 2013 2014 2015 2016
53,795 57,312 63,267 66,809 64,618 61,081 62,219 62,325 64,870 66,408 62,271 61,528Sample ID count
Water professionals collect samples from throughout the water system for testing at our state-of-the-art water quality laboratory, which is certified through the strin-gent Environmental Laboratory Accreditation Program (ELAP). Scientists, chemists, and microbiologists test the water for more than 140 constituents with equipment so sensitive it can detect levels as low as one part per trillion. In order to maintain the ELAP certification, all of our scientists must pass blind-study proficiency tests each year for every water quality test performed. Water quality test results are entered into our Laboratory Information Management System (LIMS), a sophisticated software program that enables us to react quickly to changes in water quality and analyze water quality trends in order to plan effectively for future needs.
CROSS-CONNECTION CONTROL
To ensure that the high-quality water we deliver is not compromised in the dis-tribution system, Cal Water has a robust cross-connection control program in place. Cross-connection control is critical to ensuring that activities on custom-ers’ properties do not affect the public water supply. Our cross-connection con-trol specialists ensure that all of the existing backflow prevention assemblies are tested annually, assess all non-residential connections, and enforce and manage the installation of new commercial and residential assemblies. Last year, our specialists oversaw installation of 2,795 new assemblies and testing of 36,293 backflow prevention assemblies company-wide.
Our customers are our first line of defense in preventing water system con-tamination through backflow. A minor home improvement project can create a potentially hazardous situation, so careful adherence to plumbing codes and
standards will ensure the community’s water supply remains safe. Please be sure to utilize the advice or services of a qualified plumbing professional.
Many water use activities involve substances that, if allowed to enter the distribution system, would be aesthetically displeasing or could present health concerns. Some of the most common cross-connections are:
• Garden hoses connected to a hose bib without a simple hose-type vacuum breaker (available at a home improvement store)
• Improperly installed toilet tank fill valves that do not have the required air gap between the valve or refill tube
• Landscape irrigation systems that do not have the proper backflow prevention assembly installed on the supply line
WATER QUALITY LABORATORY
SL
N
5
WELCOMETABLE OF CONTENTS YOUR WATER 2016 RESULTS MORE INFO

By the end of 2002, Cal Water had submitted to the Division of Drinking Water (DDW) a Drinking Water Source Assessment and Protection Program (DWSAPP) report for each water source in the water system. The DWSAPP report identifies possible sources of contamination to aid in prioritizing cleanup and pollution prevention efforts. All reports are available for viewing or copying at our Customer Center.
The water sources in the Salinas system are considered most vulnerable to:
• Wastewater• Agricultural wells/drainage• Animal feeding operations• Grazing• Farm machinery repair• Farm chemical distributor/
application service• Pesticide/fertilizer/petroleum
storage and transfer areas• Chemical/petroleum
processing or storage• Confirmed leaking
underground storage tanks
• Gas stations• Dry cleaners• Utility stations (maintenance
areas)• Automobile repair shops• Furniture repair/
manufacturing• Machine shops• Maintenance/fueling areas
(railroads, airports)• Research laboratories• Military installations• Photo processing
We encourage customers to join us in our efforts to prevent water pollution and protect our most precious natural resource.
DWSAPP
SL
N
6
WELCOMETABLE OF CONTENTS YOUR WATER 2016 RESULTS MORE INFO

Number of constituents tested annually since 2005
SAMPLED YEAR PARAMETER
COUNT
2005
253
2006
261
2007
258
2011
260
2009
264
2012
278
2010
264
2013
280
2008
270 2014
271
2015
269
2016
326
State law requires Cal Water to add fluoride to drinking water if public funding is available to pay for it, and it is a practice endorsed by the American Medical Association and the American Dental Association to prevent tooth decay.
In this area, low levels of fluoride occur naturally, so Cal Water doesn’t add any to the water supply. Show the table in this report to your dentist to see if he or she recommends giving your children fluoride supplements.
More information about fluoridation, oral health, and related issues can be found on the DDW web site at www.waterboards.ca.gov/drinking_water/certlic/drinkingwater/Fluoridation.shtml. For general information on water fluorida-tion, visit us online at www.calwater.com.
FLUORIDE
SL
N
7
WELCOMETABLE OF CONTENTS YOUR WATER 2016 RESULTS MORE INFO
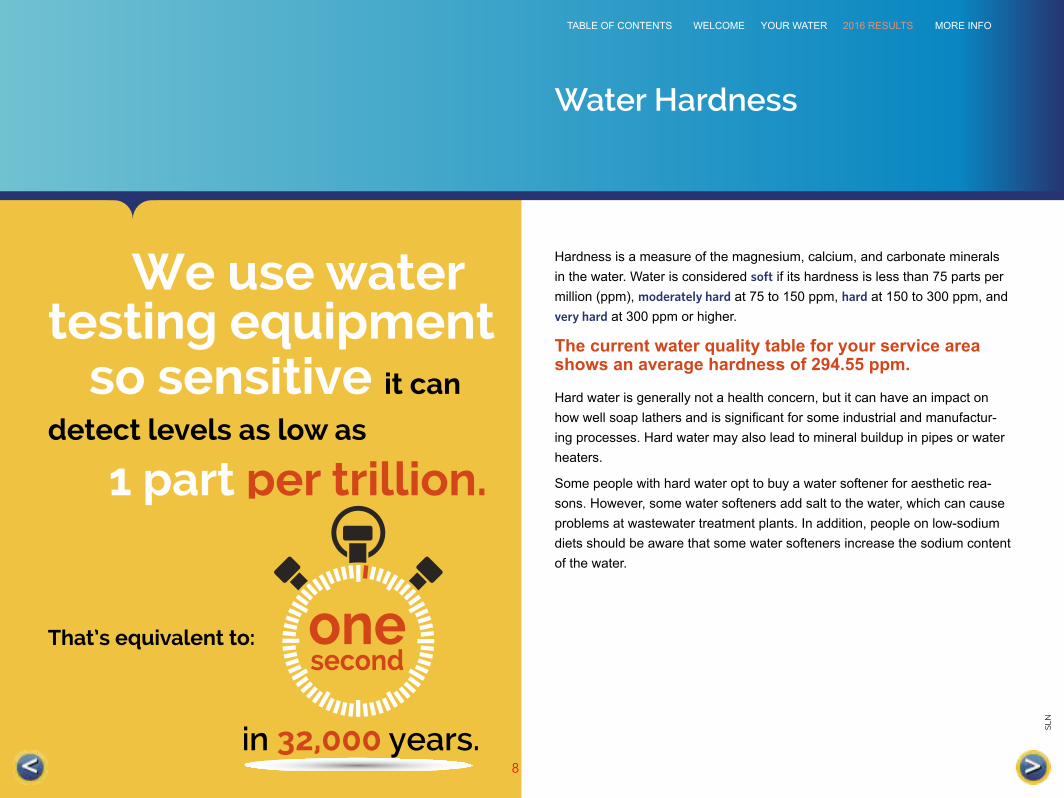
We use water testing equipment
so sensitive it can
detect levels as low as
1 part per trillion.
onesecond
in 32,000 years.
That’s equivalent to:
Hardness is a measure of the magnesium, calcium, and carbonate minerals in the water. Water is considered soft if its hardness is less than 75 parts per million (ppm), moderately hard at 75 to 150 ppm, hard at 150 to 300 ppm, and very hard at 300 ppm or higher.
The current water quality table for your service area shows an average hardness of 294.55 ppm.
Hard water is generally not a health concern, but it can have an impact on how well soap lathers and is significant for some industrial and manufactur-ing processes. Hard water may also lead to mineral buildup in pipes or water heaters.
Some people with hard water opt to buy a water softener for aesthetic rea-sons. However, some water softeners add salt to the water, which can cause problems at wastewater treatment plants. In addition, people on low-sodium diets should be aware that some water softeners increase the sodium content of the water.
Water Hardness
SL
N
8
WELCOMETABLE OF CONTENTS YOUR WATER 2016 RESULTS MORE INFO

All drinking water, including bottled water, may reasonably be expected to contain at least small amounts of some contami-nants. The presence of contaminants does not necessarily indicate that water poses a health risk.
More information about contaminants and potential health effects can be obtained by calling the United States Environmental Protection Agency (EPA) Safe Drinking Water Hotline at (800) 426-4791.
The sources of drinking water (both tap and bottled) include rivers, lakes, streams, ponds, reservoirs, springs, and wells. As water travels over the surface of the land or through the ground, it dissolves naturally occurring minerals and, in some cases, radioactive material, and can pick up substances resulting from the presence of animals or human activity.
CONTAMINANTS THAT MAY BE PRESENT IN SOURCE WATER INCLUDE:
Microbial contaminants, such as viruses and bacteria, which may come from sewage treatment plants, septic systems, agricultural livestock opera-tions, and wildlife.
Inorganic contaminants, such as salts and metals, which can be naturally occurring or result from urban stormwater runoff, industrial or domestic wastewater discharges, oil and gas production, mining, or farming.
Pesticides and herbicides, which may come from a variety of sources such as agriculture, urban stormwater runoff, and residential uses.
Organic chemical contaminants, including synthetic and volatile organic chemicals, which are byproducts of industrial processes and petroleum production, and can also come from gas stations, urban stormwater runoff, agricultural application, and septic systems.
Radioactive contaminants, which can be naturally occurring or the result of oil and gas production and mining activities.
In order to ensure that tap water is safe to drink, the EPA and DDW pre-scribe regulations that limit the amount of certain contaminants in water provided by public water systems. DDW regulations also establish limits for contaminants in bottled water, which must provide the same protection for public health.
Some people may be more vulnerable to contaminants in drinking water than the general population. Immunocompromised people, such as those with cancer undergoing chemotherapy, those who have undergone organ transplants, and those with HIV/AIDS or other immune system disorders; some elderly people; and infants can be particularly at risk from infections. These people should seek advice from their health care providers about drinking water. EPA/Centers for Disease Control and Prevention (CDC) guidelines on appropriate means to lessen the risk of infection by cryptospo-ridium and other microbial contaminants are available from the Safe Drinking Water Hotline at (800) 426-4791.
Possible Contaminants
SL
N
9
WELCOMETABLE OF CONTENTS YOUR WATER 2016 RESULTS MORE INFO
As the water quality crisis in Flint, Michigan, continues to be top of mind for many Americans, Cal Water wants to assure you about the quality of your water.
We are compliant with health and safety codes mandating use of lead-free materials in water system replacements, repairs, and new installa-tions. We have no known lead service lines in our systems. We test and treat (if necessary) water sources to ensure that the water delivered to customer meters meets all water quality standards and is not corrosive toward plumbing materials.
The water we deliver to your home meets lead standards, but what about your home’s plumbing? In California, lead in drinking water comes primarily from materials and components used for in-home plumbing (for example, lead solder used to join copper plumbing, and brass and other lead-containing fixtures). Therefore, the Lead and Copper Rule is a criti-cal part of our water quality monitoring program. This rule requires us to test water inside a representative number of homes that have plumbing most likely to contain lead and/or lead solder. This test, along with other water quality testing, tells us if the water is corrosive enough to cause lead from home plumbing to leach into the water. If the Action Level (the concentration of a contaminant which, when exceeded, triggers action which a water system must follow before it becomes a health concern) is exceeded, either at a customer’s home or system-wide, we work with the customer to investigate the issue. If the problem is system-wide, we will implement corrosion control treatment at the source before the lead levels create a health issue.
If your home’s plumbing contains lead piping or pipe fittings, lead solder, or brass fixtures that may contain lead, you can minimize the potential for lead exposure by flushing your tap for 30 seconds to two minutes before using water for drinking or cooking.
If you are concerned about lead in your water, you may wish to have your water tested by a lab. Information on lead in drinking water, testing methods, and steps you can take to minimize exposure is available from the Safe Drinking Water Hotline or at www.epa.gov/safewater/lead.
Additionally, in January 2017, the State of California issued new guide-lines on lead testing in schools. We are committed to supporting our school districts’ efforts to protect students and ensure that the drinking water at their school sites meet lead limits. We have already begun working with school districts serving kindergarten through 12th grade to develop sampling plans unique to each school site, test samples, and conduct follow-up monitoring if any school needs to take corrective action on its plumbing fixtures. Beginning in next year’s water quality report, we will publish a summary of local school lead testing in the prior year. For more information, please see our Testing for Lead in Schools web page.
In your system, results from our lead monitoring program, con-ducted in accordance with the Lead and Copper Rule, were non-detectable for the presence of lead.
About Lead
SL
N
10
WELCOMETABLE OF CONTENTS YOUR WATER 2016 RESULTS MORE INFO

Maximum Contaminant Level (MCL)
The highest level of a contaminant that is allowed in drinking water. Primary MCLs protect public health and are set as close to the PHGs (or MCLGs) as are economically and technologically feasible. Secondary MCLs relate to the odor, taste, and appearance of drinking water.
In Compliance
Does not exceed any applicable primary MCL, secondary MCL, or action level, as determined by DDW. For some compounds, compliance is determined by averaging the results for one source over a one-year period.
Regulatory Action Level (AL)
The concentration of a contaminant which, if exceeded, triggers treat-ment or other required action by the water provider.
Maximum Contaminant Level Goal (MCLG)
The level of a contaminant in drinking water below which there is no known or expected risk to health. MCLGs are set by the EPA.
Maximum Residual Disinfectant Level (MRDL)
The highest level of a disinfectant allowed in drinking water. There is convincing evidence that addition of a disinfectant is necessary for con-trol of microbial contaminants.
Maximum Residual Disinfectant Level Goal (MRDLG)
The level of a drinking water disinfectant below which there is no known or expected risk to health. MRDLGs do not reflect the benefits of the use of disinfectants to control microbial contaminants.
Notification Level (NL)
A health-based advisory level for an unregulated contaminant in drinking water. It is used by DDW to provide guidance to drinking water systems.
Primary Drinking Water Standard (PDWS)
MCLs and MRDLs for contaminants that affect health, along with their monitoring, reporting, and water treatment requirements.
Public Health Goal (PHG)
The level of a contaminant in drinking water below which there is no known or expected risk to health. PHGs are set by the California Envi-ronmental Protection Agency’s Office of Environmental Health Hazard Assessment without regard to cost or available detection and treatment technologies.
Treatment Technique (TT)
A required process intended to reduce the level of a contaminant in drinking water.
Key Definitions
SL
N
11
WELCOMETABLE OF CONTENTS YOUR WATER 2016 RESULTS MORE INFO
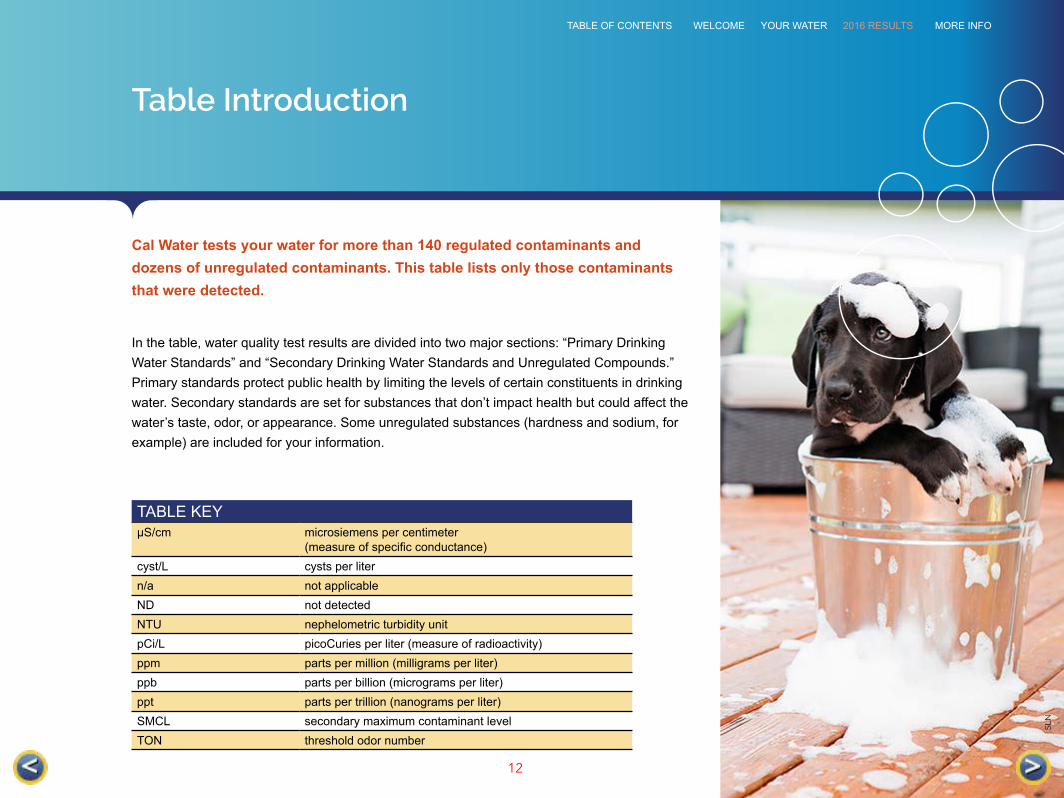
Cal Water tests your water for more than 140 regulated contaminants and dozens of unregulated contaminants. This table lists only those contaminants that were detected.
In the table, water quality test results are divided into two major sections: “Primary Drinking Water Standards” and “Secondary Drinking Water Standards and Unregulated Compounds.” Primary standards protect public health by limiting the levels of certain constituents in drinking water. Secondary standards are set for substances that don’t impact health but could affect the water’s taste, odor, or appearance. Some unregulated substances (hardness and sodium, for example) are included for your information.
TABLE KEYµS/cm microsiemens per centimeter
(measure of specific conductance)cyst/L cysts per litern/a not applicableND not detectedNTU nephelometric turbidity unitpCi/L picoCuries per liter (measure of radioactivity)ppm parts per million (milligrams per liter)ppb parts per billion (micrograms per liter)ppt parts per trillion (nanograms per liter)SMCL secondary maximum contaminant levelTON threshold odor number
Table Introduction
SL
N
12
WELCOMETABLE OF CONTENTS YOUR WATER 2016 RESULTS MORE INFO
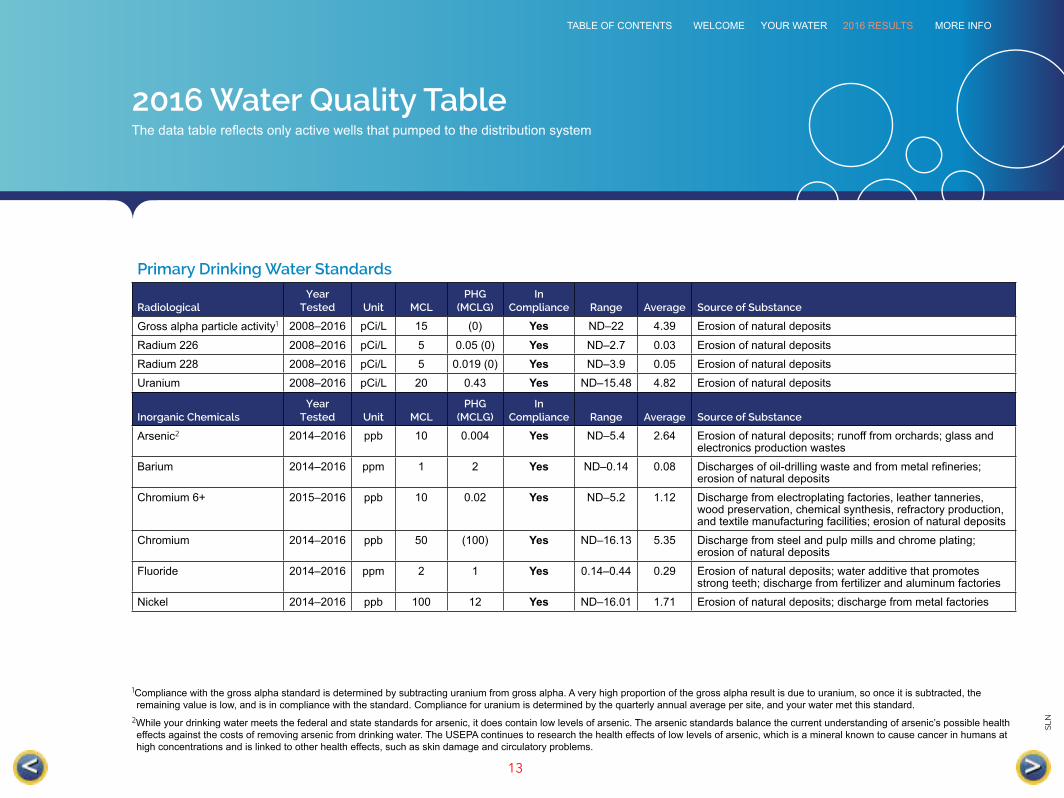
2016 Water Quality Table
Primary Drinking Water Standards
RadiologicalYear
Tested Unit MCL PHG
(MCLG)In
Compliance Range Average Source of Substance
Gross alpha particle activity1 2008–2016 pCi/L 15 (0) Yes ND–22 4.39 Erosion of natural deposits
Radium 226 2008–2016 pCi/L 5 0.05 (0) Yes ND–2.7 0.03 Erosion of natural deposits
Radium 228 2008–2016 pCi/L 5 0.019 (0) Yes ND–3.9 0.05 Erosion of natural deposits
Uranium 2008–2016 pCi/L 20 0.43 Yes ND–15.48 4.82 Erosion of natural deposits
Inorganic ChemicalsYear
Tested Unit MCL PHG
(MCLG)In
Compliance Range Average Source of Substance
Arsenic2 2014–2016 ppb 10 0.004 Yes ND–5.4 2.64 Erosion of natural deposits; runoff from orchards; glass and electronics production wastes
Barium 2014–2016 ppm 1 2 Yes ND–0.14 0.08 Discharges of oil-drilling waste and from metal refineries; erosion of natural deposits
Chromium 6+ 2015–2016 ppb 10 0.02 Yes ND–5.2 1.12 Discharge from electroplating factories, leather tanneries, wood preservation, chemical synthesis, refractory production, and textile manufacturing facilities; erosion of natural deposits
Chromium 2014–2016 ppb 50 (100) Yes ND–16.13 5.35 Discharge from steel and pulp mills and chrome plating; erosion of natural deposits
Fluoride 2014–2016 ppm 2 1 Yes 0.14–0.44 0.29 Erosion of natural deposits; water additive that promotes strong teeth; discharge from fertilizer and aluminum factories
Nickel 2014–2016 ppb 100 12 Yes ND–16.01 1.71 Erosion of natural deposits; discharge from metal factories
1Compliance with the gross alpha standard is determined by subtracting uranium from gross alpha. A very high proportion of the gross alpha result is due to uranium, so once it is subtracted, the remaining value is low, and is in compliance with the standard. Compliance for uranium is determined by the quarterly annual average per site, and your water met this standard.
2While your drinking water meets the federal and state standards for arsenic, it does contain low levels of arsenic. The arsenic standards balance the current understanding of arsenic’s possible health effects against the costs of removing arsenic from drinking water. The USEPA continues to research the health effects of low levels of arsenic, which is a mineral known to cause cancer in humans at high concentrations and is linked to other health effects, such as skin damage and circulatory problems.
The data table reflects only active wells that pumped to the distribution system
SL
N
13
WELCOMETABLE OF CONTENTS YOUR WATER 2016 RESULTS MORE INFO

2016 Water Quality Table(Continued)
Inorganic ChemicalsYear
Tested Unit MCL PHG
(MCLG)In
Compliance Range Average Source of Substance
Nitrate (as nitrogen)3 2016 ppm 10 10 Yes 0.75–8.8 5.22 Runoff and leaching from fertilizer use; leaching from septic tanks and sewage; erosion of natural deposits
Selenium 2014–2016 ppb 50 (50) Yes ND–11 2.81 Discharge from petroleum, glass, and metal refineries; erosion of natural deposits; discharge from mines and chemical manufacturers; runoff from livestock lots (feed additive)
Organic ChemicalsYear
Tested Unit MCL PHG
(MCLG)In
Compliance Range Average Source of Substance
1,1-Dichloroethylene 2014–2016 ppb 6 10 (7) Yes ND–0.66 0.03 Discharge from industrial chemical factories
Tetrachloroethylene (PCE) 2014–2016 ppb 5 0.06 Yes ND–2.16 ND Discharge from factories, dry cleaners, and auto shops (metal degreaser)
Disinfection ByproductsYear
Tested Unit MCL PHG
(MCLG)In
Compliance Range
Highest Annual
Average Source of Substance
Total trihalomethanes 2016 ppb 80 n/a Yes ND–4.5 1.23 Byproduct of drinking water chlorination
Disinfectant and DBP Precursor
Year Tested Unit MRDL MRDLG
In Compliance Range Average Source of Substance
Chlorine 2016 ppm 4 4 Yes ND–1.8 0.83 Drinking water disinfectant added for treatment
3The average nitrate level was 5.19 ppm, with a maximum level of 8.8 ppm. We are closely monitoring the nitrate levels. Nitrate in drinking water at levels above 10 ppm is a health risk for infants of less than six months of age. Such nitrate levels in drinking water can interfere with the capacity of the infant’s blood to carry oxygen, resulting in a serious illness; symptoms include shortness of breath and blueness of the skin. Nitrate levels above 10 ppm may also affect the ability of the blood to carry oxygen in other individuals, such as pregnant women and those with certain specific enzyme deficiencies. If you are caring for an infant or you are pregnant, you should seek advice from your health care provider.
SL
N
14
WELCOMETABLE OF CONTENTS YOUR WATER 2016 RESULTS MORE INFO

2016 Water Quality Table(Continued)
Other Regulated Substances
MetalsYear
Tested Unit AL PHG
(MCLG)In
Compliance90th
PercentileSamples
> AL Source of Substance
Copper 2016 ppm 1.3 0.3 Yes 0.82 1 of 50 Internal corrosion of household plumbing systems; erosion of natural deposits; leaching from wood preservatives
Lead 2016 ppb 15 0.2 Yes ND 0 of 50 Internal corrosion of household plumbing systems; discharge from industrial manufacturers; erosion of natural deposits
Secondary Drinking Water Standards
Inorganic ChemicalsYear
Tested Unit SMCLPHG
(MCLG)In
Compliance Range Average Source of Substance
Chloride 2014–2016 ppm 500 n/a Yes 41–120 75.71 Erosion of natural deposits; seawater influence
Color4 2014–2016 Units 15 n/a Yes ND–20 ND Naturally occurring organic matter
Iron 2014–2016 ppb 300 n/a Yes ND–220 19.57 Leaching from natural deposits; industrial wastes
Odor 2014–2016 TON 3 n/a Yes ND–2 0.50 Naturally occurring organic matter
pH 2016 Units n/a n/a Yes 6.5–8 7.35 Inherent characteristic of water
Specific conductance 2014–2016 µS/cm 1600 n/a Yes 590–1500 860 Erosion of natural deposits; seawater influence
Sulfate 2014–2016 ppm 500 n/a Yes 16–330 113.18 Runoff/leaching from natural deposits; industrial wastes
Total dissolved solids 2014–2016 ppm 1000 n/a Yes 360–1000 562.27 Runoff/leaching from natural deposits
Turbidity (groundwater)4 2014–2016 NTU 5 n/a Yes ND–8.6 0.46 Soil runoff
Zinc 2014–2016 ppm 5.0 n/a Yes ND–0.1 0.0048 Runoff/leaching from natural deposits; industrial wastes
4In 2016, a single sample contained high levels of color and turbidity. Color and turbidity have associated aesthetic impacts, and the source of the issue has been identified and addressed.
SL
N
15
WELCOMETABLE OF CONTENTS YOUR WATER 2016 RESULTS MORE INFO
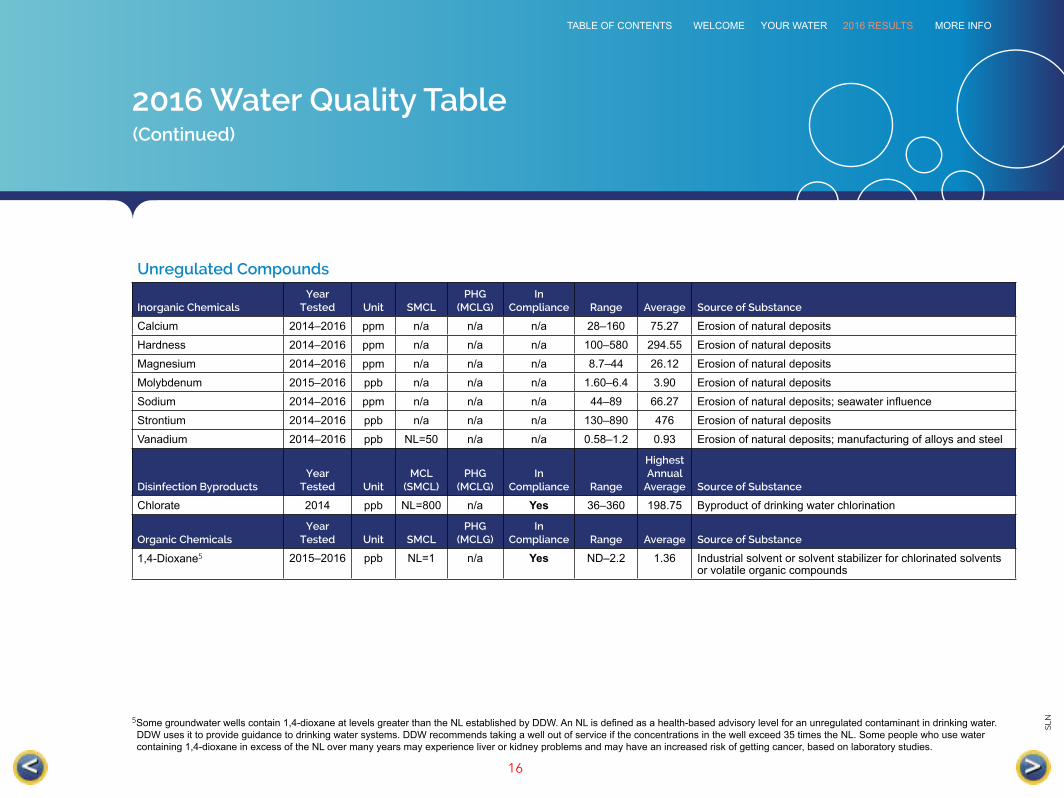
2016 Water Quality Table(Continued)
Unregulated Compounds
Inorganic ChemicalsYear
Tested Unit SMCLPHG
(MCLG)In
Compliance Range Average Source of Substance
Calcium 2014–2016 ppm n/a n/a n/a 28–160 75.27 Erosion of natural deposits
Hardness 2014–2016 ppm n/a n/a n/a 100–580 294.55 Erosion of natural deposits
Magnesium 2014–2016 ppm n/a n/a n/a 8.7–44 26.12 Erosion of natural deposits
Molybdenum 2015–2016 ppb n/a n/a n/a 1.60–6.4 3.90 Erosion of natural deposits
Sodium 2014–2016 ppm n/a n/a n/a 44–89 66.27 Erosion of natural deposits; seawater influence
Strontium 2014–2016 ppb n/a n/a n/a 130–890 476 Erosion of natural deposits
Vanadium 2014–2016 ppb NL=50 n/a n/a 0.58–1.2 0.93 Erosion of natural deposits; manufacturing of alloys and steel
Disinfection ByproductsYear
Tested UnitMCL
(SMCL) PHG
(MCLG)In
Compliance Range
Highest Annual
Average Source of Substance
Chlorate 2014 ppb NL=800 n/a Yes 36–360 198.75 Byproduct of drinking water chlorination
Organic ChemicalsYear
Tested Unit SMCLPHG
(MCLG)In
Compliance Range Average Source of Substance
1,4-Dioxane5 2015–2016 ppb NL=1 n/a Yes ND–2.2 1.36 Industrial solvent or solvent stabilizer for chlorinated solvents or volatile organic compounds
5Some groundwater wells contain 1,4-dioxane at levels greater than the NL established by DDW. An NL is defined as a health-based advisory level for an unregulated contaminant in drinking water. DDW uses it to provide guidance to drinking water systems. DDW recommends taking a well out of service if the concentrations in the well exceed 35 times the NL. Some people who use water containing 1,4-dioxane in excess of the NL over many years may experience liver or kidney problems and may have an increased risk of getting cancer, based on laboratory studies.
SL
N
16
WELCOMETABLE OF CONTENTS YOUR WATER 2016 RESULTS MORE INFO

Thanks for taking the time to learn more about your water quality! Even more information awaits you at www.calwater.com. Visit our web site to get information about your account, water use history, water rates, and water system.
You will also find water-saving tips and news about water conservation programs and rebates available in your area.
Conservation Resources
Lead in water
Water treatment and disinfection
Protecting the water supply
Thank you.
SL
N
17
WELCOMETABLE OF CONTENTS YOUR WATER 2016 RESULTS MORE INFO