quad analytix automotive insights
TRANSCRIPT

Quad Analytix Automotive InsightsOctober 15, 2015
Overview Companies We Track
2
• Quad extracts data from the web on the world’s leading automotive companies to generate investment insights through a cutting edge analytics platform
• We enable you to develop a holistic view of the automotive landscape with access to our primary data insights
• Our proprietary data is curated from the web and is not available in public disclosure filings
• These granular insights enable you to gauge the health of companies with surprising speed & accuracy
Quad Provides Primary Data On The World’s Leading Automotive Companies
Overview Key Features
3
• Monitor the impact of new store openings on overall revenue growth
• Monitor daily sales and inventory turnover ratios at new and existing dealerships nationwide
• Forecast quarterly revenues & inventories weeks into every quarter
• Spot underperforming dealerships in seconds
• See which markets are over or under-performing and by how much
• Analyze promotional frequency to gauge quarterly performance
• Go beyond line items on quarterly financial statements and leverage real-time analytics with our weekly sales snapshots
• Our analytics platform extracts revenue and inventory data at the dealership level giving you unprecedented access into the inner workings of automotive companies
• These granular insights enable you to gauge the health of companies at rapid velocity
Unparalleled Insight Into Key Revenue Drivers
Overview Key Features
4
• The inventory line item on automotive companies’ balance sheets is often a black box in terms of information
• We believe significant insights can be generated by analyzing the makeup of inventory for the leading automotive companies through proprietary data collection methods that go far beyond traditional disclosures in company reports.
• Our platform gives you unmatched visibility in terms of both inventory and product assortment
Gain Visibility Into Automotive Assortment & Inventories
• Identify the weekly makeup of inventory (new vs. used) taking you far beyond the once quarterly update from shareholder reports
• Understand the nationwide assortment of vehicles at the local dealership level for select companies
• Monitor inventory turnover on a weekly basis to gauge company performance
• Locate high margin vehicles for both new and existing vehicles
• Analyze assortments to determine competitive positioning
Information We Gather Analytics Capabilities
Automotive Snapshot
5
• Daily extraction of attributes across thousands of dealerships and multiple companies nationwide
• Enrichment of primary data with an intuitive analytics platform designed to help you forecast and monitor performance in the following key areas:
• Revenue growth (both organic & inorganic)
• Cost Structure
• Margin Profiles
• Inventory Turnover
• Assortment
• Promotional Frequency
• Geographic Profiles
• Raw data collected for each car of -fered (daily):
• What we can infer (for any time period)
• Stock number• VIN• Make/Model• Price• Mileage• Location
• Cars added• Cars sold• Selling prices• Discounts• Same store sales• Brand or location trends• And more….
6
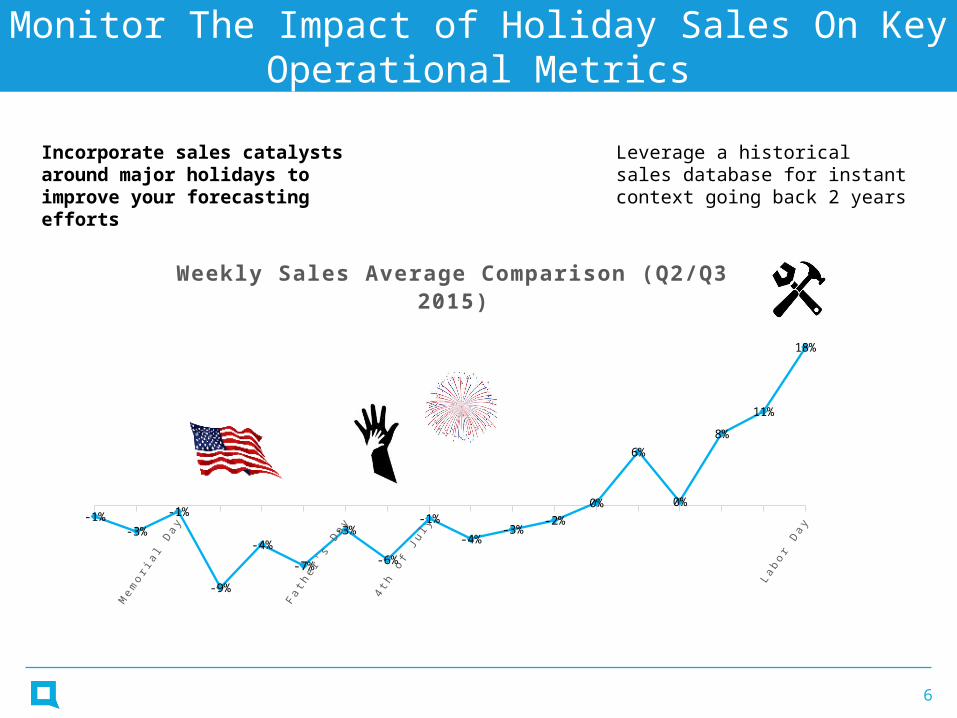
Monitor The Impact of Holiday Sales On Key Operational Metrics
Mem
o r ia l D
a y
F a t he r '
s D
ay
4 t h o
f Ju l y
L ab o r D
a y-1%-3%
-1%
-9%
-4%
-7%
-3%
-6%
-1%
-4%-3%
-2%0%
6%
0%
8%
11%
18%
Weekly Sales Average Comparison (Q2/Q3 2015)
Incorporate sales catalysts around major holidays to improve your forecasting efforts
Leverage a historical sales database for instant context going back 2 years
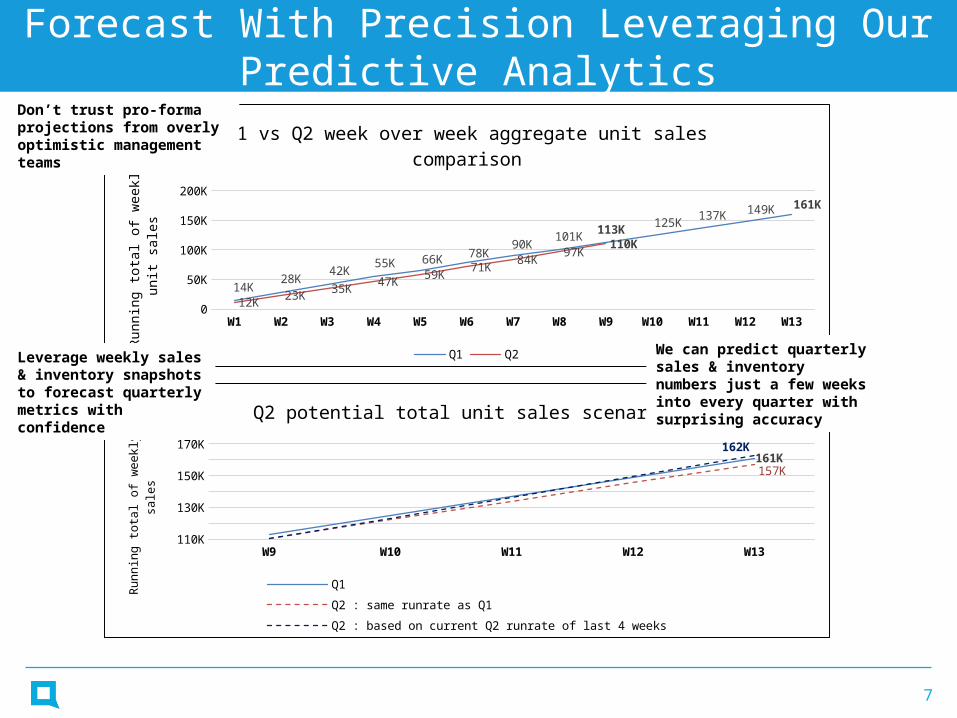
Forecast With Precision Leveraging Our Predictive Analytics
W1 W2 W3 W4 W5 W6 W7 W8 W9 W10 W11 W12 W130
20K40K60K80K
100K120K140K160K180K
14K28K
42K55K 66K
78K90K
101K113K
125K137K
149K161K
12K23K
35K47K
59K71K
84K97K
110K
Q1 vs Q2 week over week aggregate unit sales comparison
Q1 Q2
Runn
ing
tota
l of w
eekl
y un
it sa
les
W9 W10 W11 W12 W13110K
120K
130K
140K
150K
160K
170K
161K157K
162K
Q2 potential total unit sales scenarios
Q1 Q2 : same runrate as Q1Q2 : based on current Q2 runrate of last 4 weeks
Runn
ing
tota
l of w
eekl
y un
it sa
les
Don’t trust pro-forma projections from overly optimistic management teams
Leverage weekly sales & inventory snapshots to forecast quarterly metrics with confidence
We can predict quarterly sales & inventory numbers just a few weeks into every quarter with surprising accuracy
7

Understand the Impact of Macro Factors On Automotive Unit Level Sales
W1 W2 W3 W4 W5 W6 W7 W8 W9 W10
-20%-15%-10%
-5%0%5%
10%15%20%
$2.70
$2.75
$2.80
$2.85
$2.90
$2.95
QoQ Unit Sales Growth % vs National Avg Gas Prices
QoQ Sales Growth % (National) Gas Prices (National)
W1 W2 W3 W4 W5 W6 W7 W8 W9 W10
-2%
-1%
0%
1%
2%
$2.40$2.45$2.50$2.55$2.60$2.65$2.70$2.75
QoQ Unit Sales Growth % vs Avg Gas Prices (TX)
QoQ Sales Growth % (TX) Gas Prices (TX)
W1 W2 W3 W4 W5 W6 W7 W8 W9 W10
-4%
-3%
-2%
-1%
0%
1%
2%
$3.20$3.30$3.40$3.50$3.60$3.70$3.80$3.90$4.00
QoQ Unit Sales Growth % vs Avg Gas Prices (CA)
QoQ Sales Growth % (CA) Gas Prices (CA)
Discover the impact of weekly gas price trends on quarterly sales volume & inventory turnover
See which geographic regions exhibit volatile swings in sales volume with gas price fluctuations
Spot potential sales catalysts with gas price movements leveraging real-time analytics
8
9
Additional Insights…
• We work with with investment firms to generate insights across a wide variety of industries and companies, such as:
• Cable • Monitor address availability and uptake of Google Fiber and AT&T Uverse data
nationwide
• Retail • Perform basket analysis to analyze pricing across multiple item categories to
monitor quarterly performance, new product introductions, and promotional frequency
• Hospitality• Create proprietary data targeted at the Las Vegas hotel market, monitoring
daily room pricing and occupancy rates
Other project examples

Retail focusMonth 9, 2015
Schedule a demo today and see how our automotive insights can transform your
investment research. Chelsea Albright
Senior Account Director650-389-5106
Angela WhiteSenior Account
Director650-242-4442